GROUND-WATER HYDROLOGY AND THE EFFECTS OF VERTICAL LEAKAGE AND LEACHATE MIGRATION ON GROUND-WATER QUALITY NEAR THE SHELBY COUNTY LANDFILL, MEMPHIS, TENNESSEE By Michael W. Bradley U.S. GEOLOGICAL SURVEY Water-Resources Investigations Report 90-4075 Prepared in cooperation with the SHELBY COUNTY DEPARTMENT OF PUBLIC WORK!3 and the TENNESSEE DEPARTMENT OF HEALTH AND ENVIRONMENT, DIVISION OF SOLID WASTE MANAGEMENT Nashville, Tennessee 1991
Transcript
GROUND-WATER HYDROLOGY AND THE EFFECTS OF VERTICAL LEAKAGE AND LEACHATE MIGRATION ON GROUND-WATER QUALITY NEAR THE SHELBY COUNTY LANDFILL, MEMPHIS, TENNESSEE
By Michael W. Bradley
U.S. GEOLOGICAL SURVEY Water-Resources Investigations Report 90-4075
Prepared in cooperation with the SHELBY COUNTY DEPARTMENT OF PUBLIC WORK!3 and the TENNESSEE DEPARTMENT OF HEALTH AND ENVIRONMENT,
U.S. DEPARTMENT OF THE INTERIOR MANUEL LUJAN, JR., Secretary
U.S. GEOLOGICAL SURVEY Dallas L. Peck, Director
For aaWtionai infomation write to: Copies of this report can purchased from:
District Chief U.S. Geological Survey, WRD 810 Broadway, Suite 500 Nashville, Tennessee 37203
U.S. Geological Survey Books and Open-File Reports Section Federal Center, Bldg. 810 Box 25425 Denver, Colorado 80225
CONTENTS Abstract 1 Introduction 2
Purpose and scope 2 Approach 4
Acknowledgments 4 Site description 4
Geology 6 Streamflow 6
Well construction 9 Ground-water hydrology 11
Alluvial aquifer 11 Memphis aquifer 15
Aquifer tests and results 15 Water quality 19
Sampling and analyses 19 Alluvial aquifer 22 Memphis aquifer 29
Potential effects of vertical leakage 30 Leachate migration 34 Summary and conclusions 36 Selected references 42
ILLUSTRATIONS
Figure 1.
2. 3.
4. 5.
6.
7. 8.
9.
10.
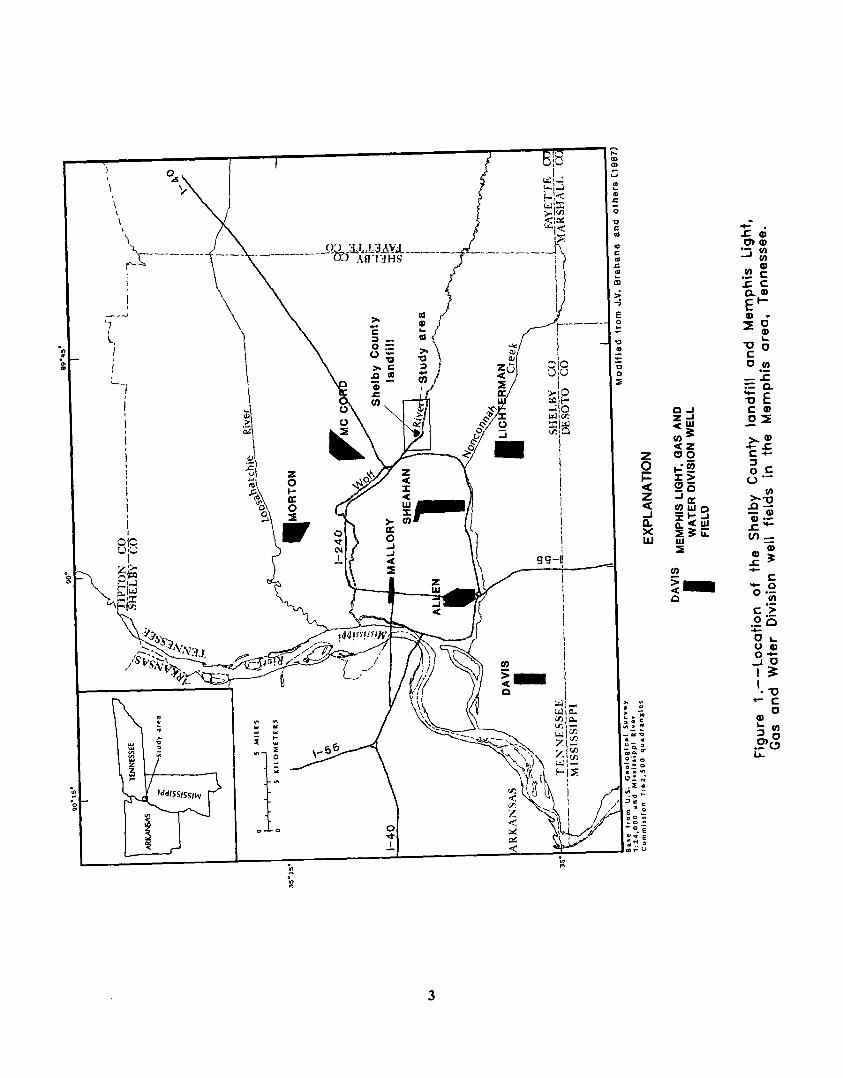
Map showing the location of the Shelby County landfill and Memphis Light, Gas and Water Division well fields in the Memphis area, Tennessee 3
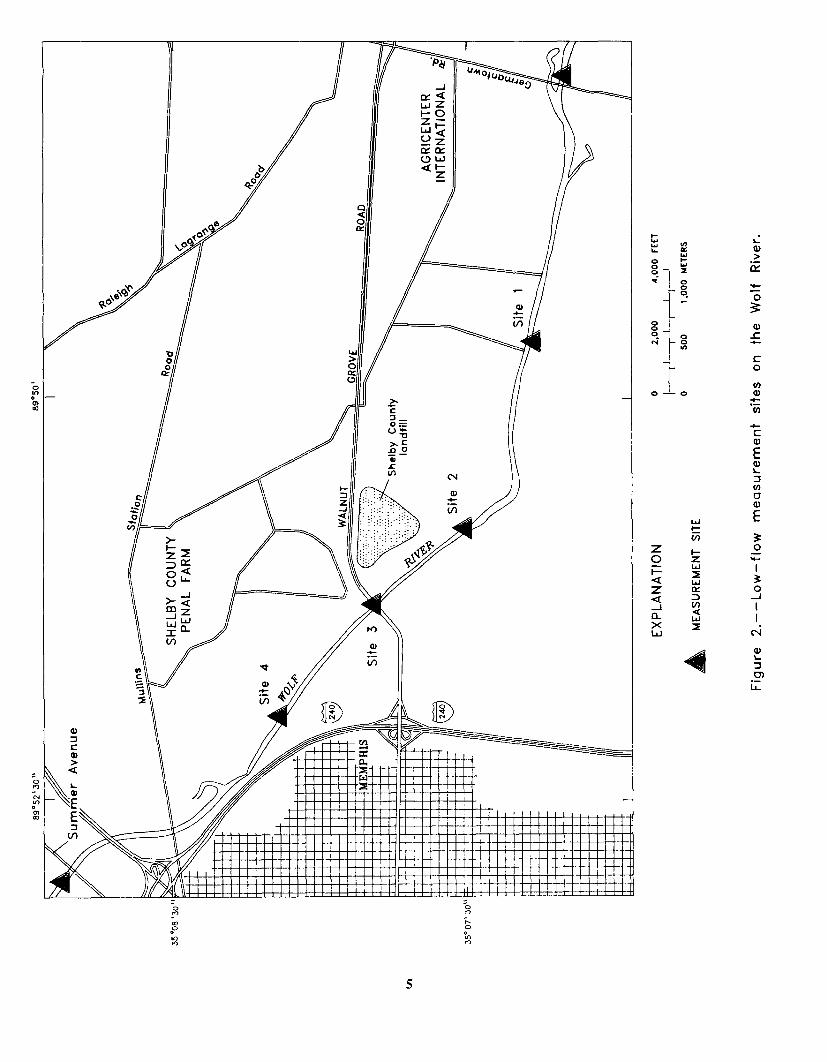
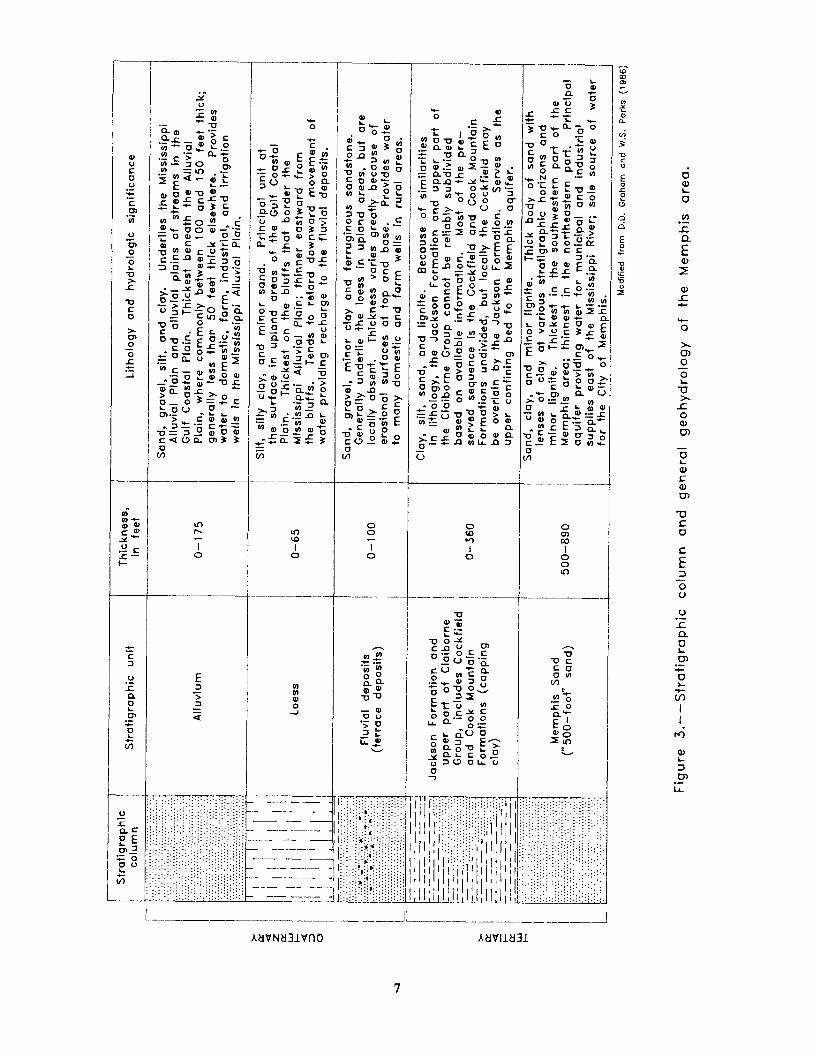
Map showing low-flow measurement sites on the Wolf River 5 Cross section showing the stratigraphic column and general
geohydrology of the Memphis area 7 Generalized lithology and gamma logs from well MS-2 to well MS-l 8 Map showing the location of observation wells and stratigraphic
test holes at the Shelby County landfill 10 Hydrographs showing water-levels in the alluvial aquifer,
October 1986 through November 1987 13 Map showing the water table in the alluvial aquifer, July 1987 14 Conceptual diagrams showing ground-water flow in a typical West
Tennessee flood plain and at the Shelby County landfill 16 Hydrograph showing water levels in the Memphis aquifer,
October 1986 through November 1987 17 Map showing the potentiometric surface of the Memphis
aquifer at the Shelby County landfill, July 1987 18
. . . 111
11. Hydrograph showing water-level change during an aquifer test at well MS-2, July 7-10, 1987 20
12. Hydrograph showing water-level change during an aquifer test at well MS-3, July 14-15, 1987 21
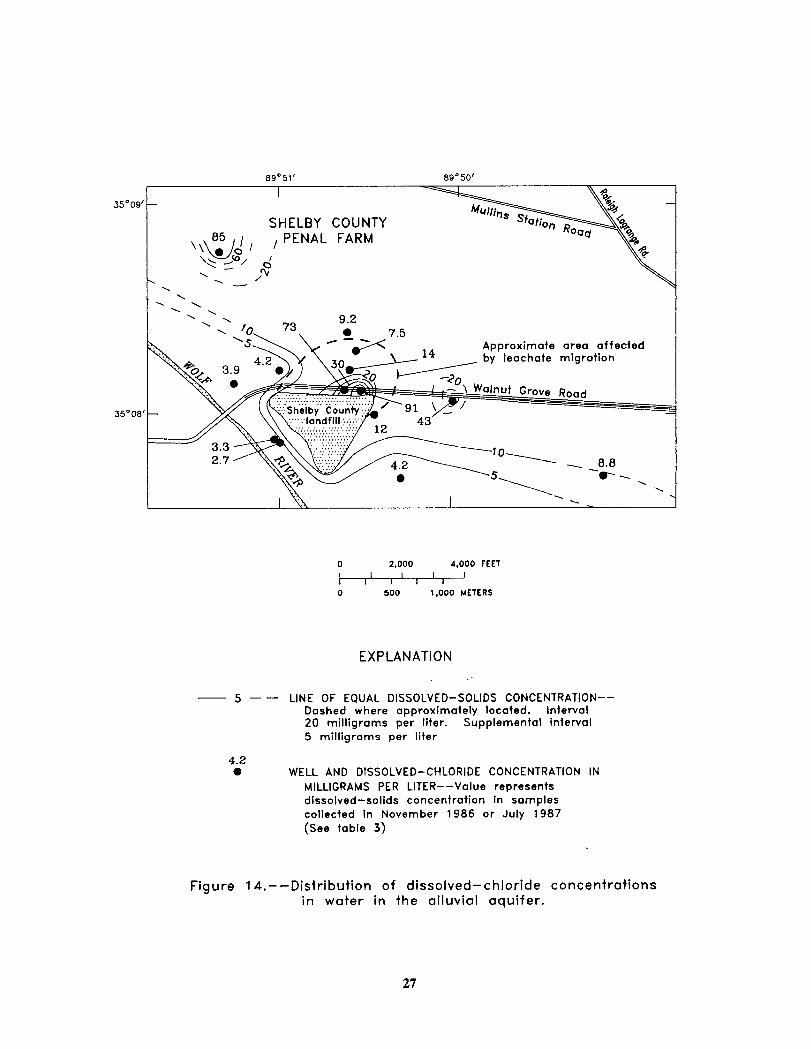
13-17. Maps showing the distribution of: 13. Dissolved-solids concentrations in water in the alluvial aquifer 23 14. Dissolved-chloride concentrations in water in the alluvial aquifer 27 15. Dissolved-barium concentrations in water in the alluvial aquifer 28 16. Dissolved-solids concentrations in water in the Memphis aquifer 31 17. Dissolved-chloride concentrations in water in the Memphis aquifer 32
18. Conceptual diagram showing tritium activities in water in the aquifers near the Shelby County landfill 35
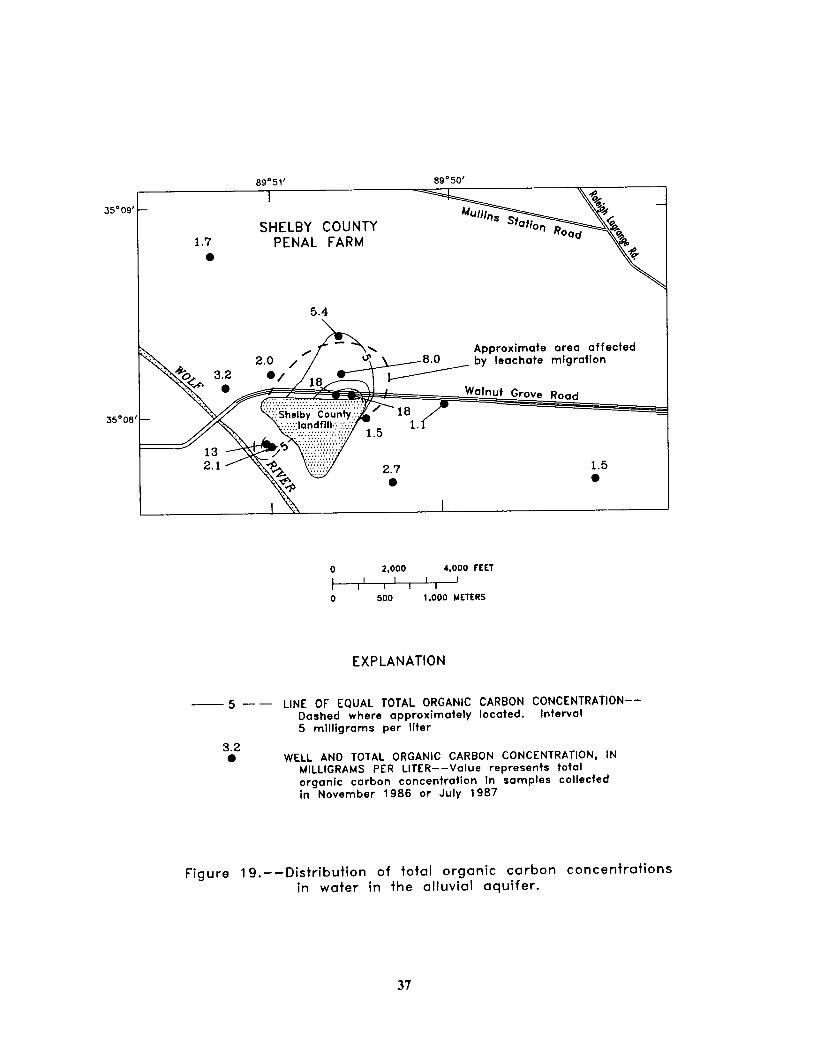
19. Map showing the distribution of total organic carbon concentrations in water in the alluvial aquifer 37
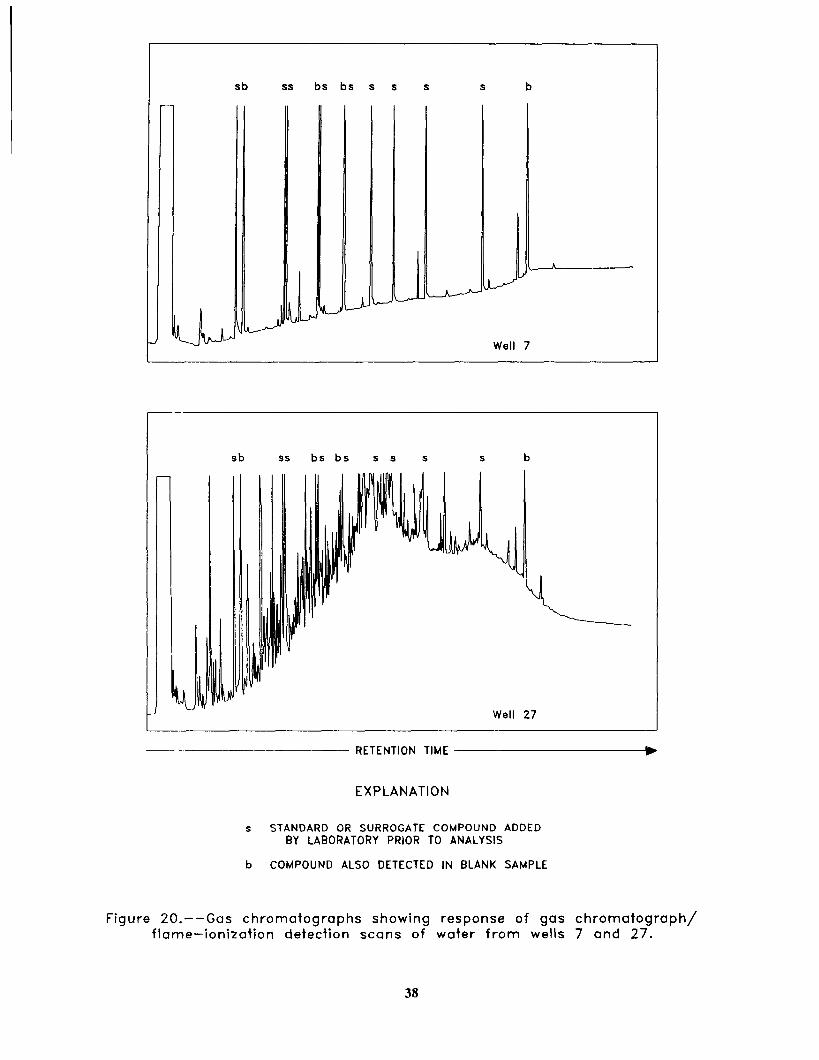
20. Gas chromatographs showing response of gas chromatographklame- ionization detection scans of water from wells 7 and 27 38
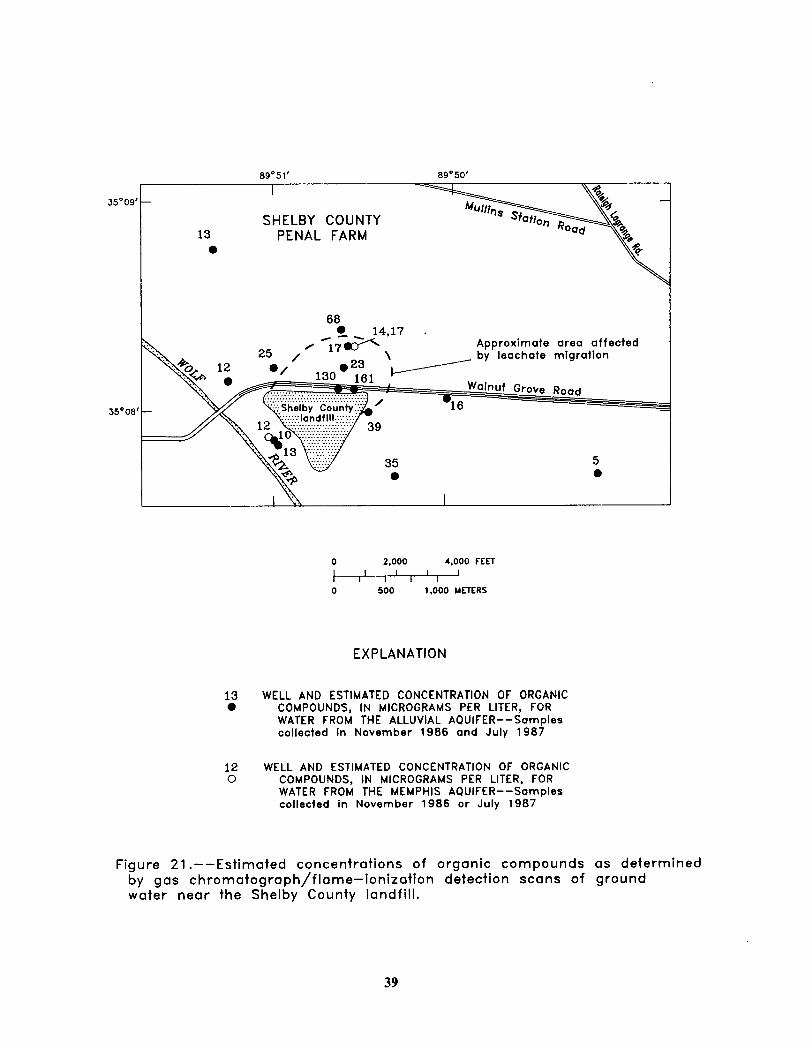
21. Map showing estimated concentrations of organic compounds as determined by gas chromatograph/flame-ionization detection scans of ground water near the Shelby County landfill 39
TABLES
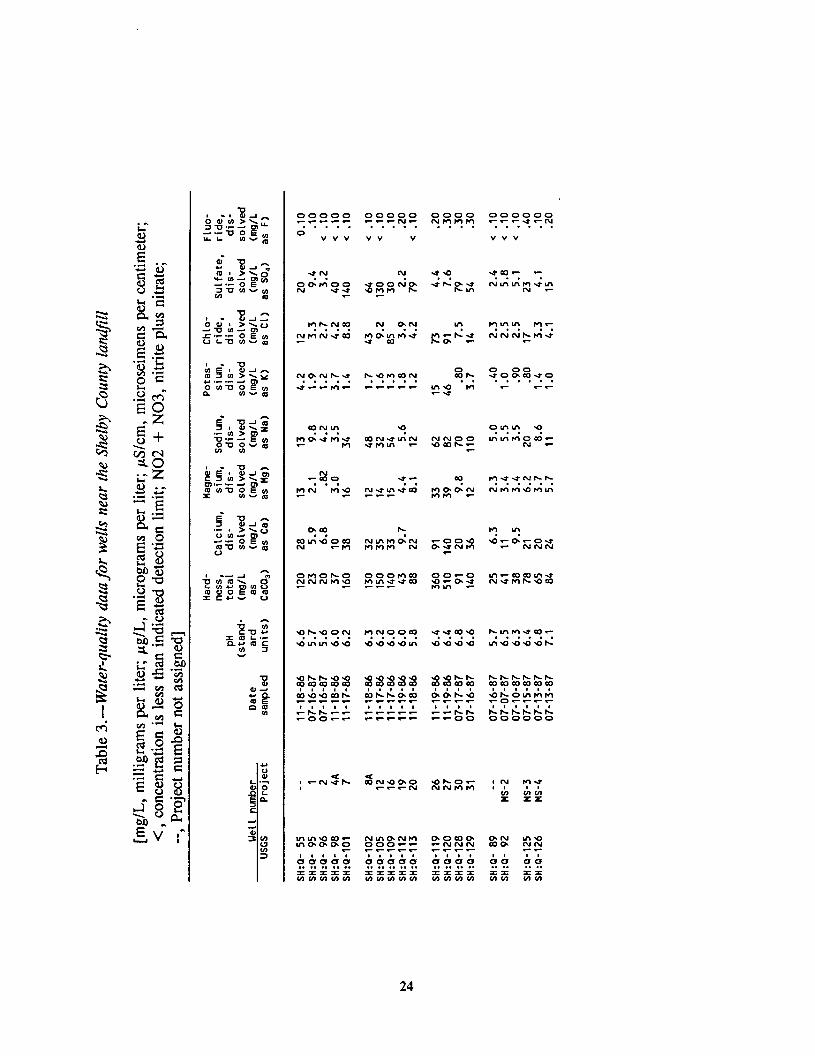
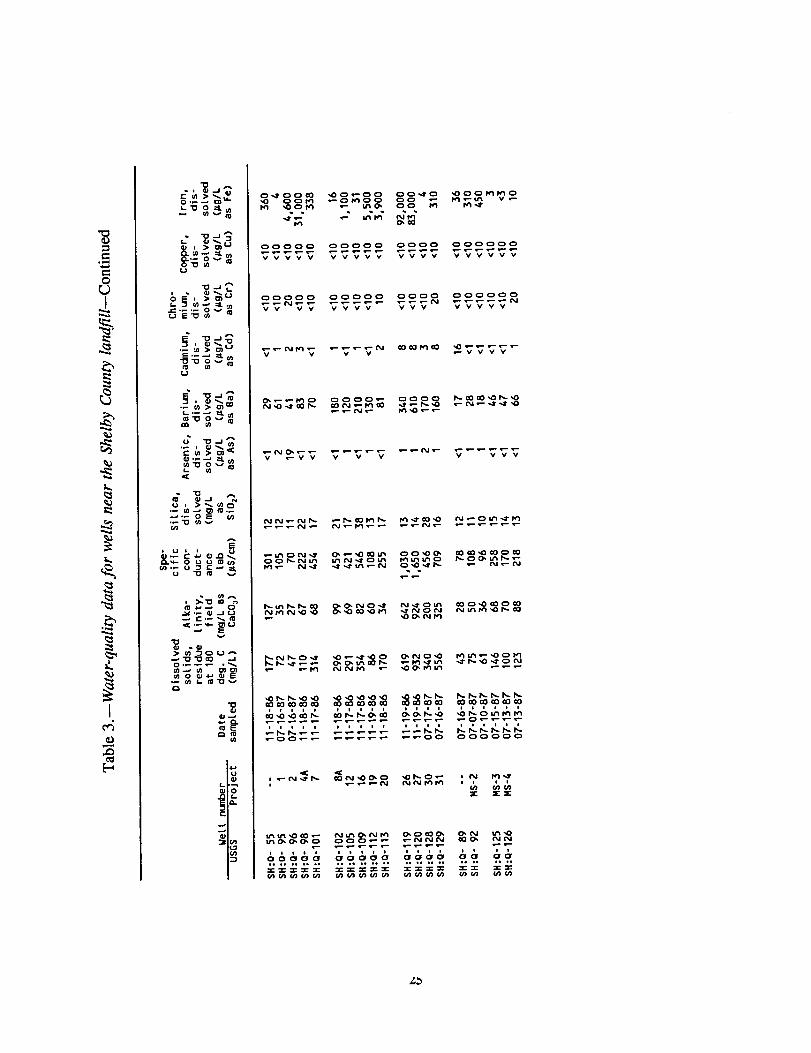
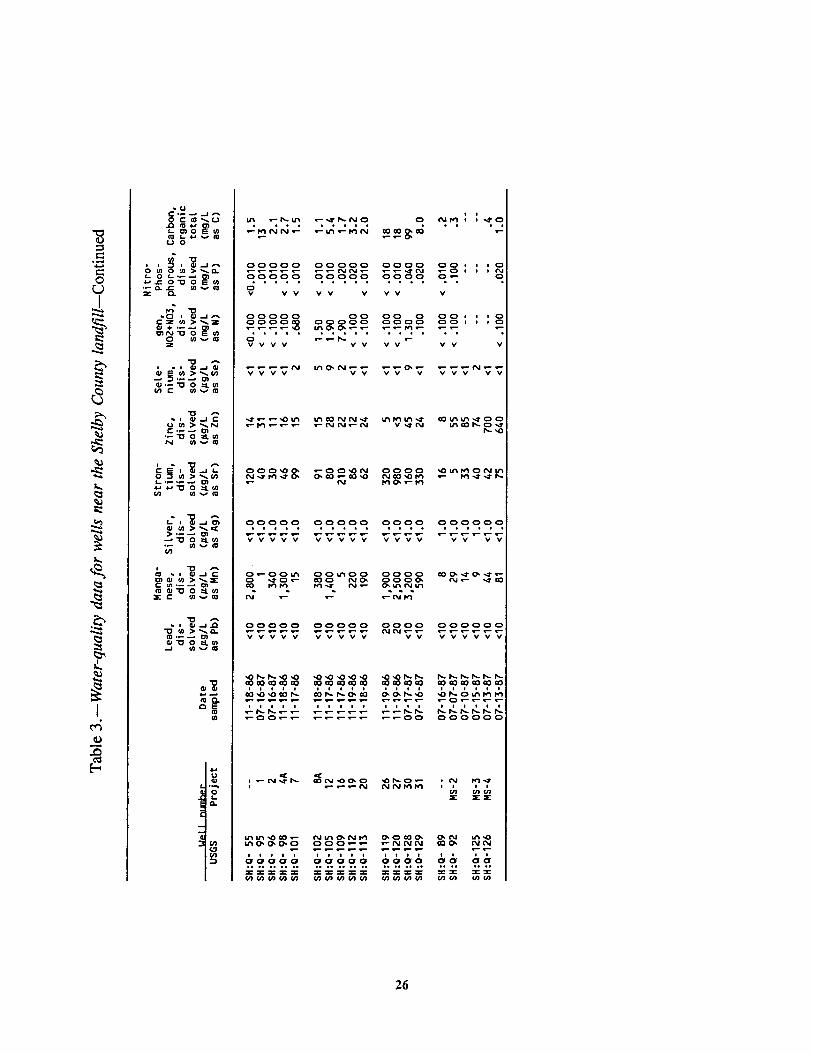
Table 1. Streamflow measurements for the Wolf River near the Shelby County landfill 9 2. Construction data for wells near the Shelby County landfill 12 3. Water-quality data for wells near the Shelby County landfill 24 4. Dissolved-solids and dissolved-chloride concentrations in water
from wells completed in the Memphis aquifer 29 5. Tritium activity of water from wells completed in the alluvial and
Memphis aquifers near the Shelby County landfill 34 6. Concentrations of organic compounds as estimated from gas chromatograph/
flame-ionization detection scans for the presence of semivolatile organic compounds in ground water near the Shelby County landfill 40
7. Concentrations of volatile organic compounds in ground water near the Shelby County landfill 41
iv
Multiply BY
CONVERSION FACTORS, VERTICAL DATUM, AND WELL-NUMBERING SYSTEM
inch (in.) foot (ft) mile (mi) square mile (mi”) gallons per minute
(gal/min) cubic foot per second
(ft3/s) million gallons per day
wwd)
To obtain
2.54 centimeter 0.3048 meter 1.609 kilometer 2.590 square kilometer 0.06309 liters per second
0.02832 cubic meter per second
0.04381 cubic meter per second
Sea Level: In this report, “sea level” refers to the National Geodetic Vertical Datum of 1929 (NVGD of 1929)--a geodetic datum derived from general adjustment of the first-order level nets of both the United States and Canada, formerly called Sea Level Datum of 1929.
Well-Numbering System: Wells are identified according to the numbering system used by the U.S. Geological Survey throughout Tennessee. The well number consists of three parts: (1) an abbrevi- ation of the name of the county in which the well is located; (2) a letter designating the 7 ‘/,-minute quadrangle or 7 ‘/,-minute quadrant of the B-minute quadrangle, on which the well is plotted; and (3) a number generally indicating the numerical order in which the well was inventoried. The num- ber SH:P-99, for example, indicates the well is located in Shelby County on the “P” quadrangle and is identified as well 99 in the numerical sequence. Quadrangles are lettered from left to right, beginning in the southwest corner of the county.
GROUND-WATER HYDROLOGY AND THE EFFECTS OF VERTICAL
LEAKAGE AND LEACHATE MIGRATION ON GROUND-WATER
QUALITY NEAR THE SHELBY COUNTY LANDFILL,
MEMPHIS, TENNESSEE
By Michael W. Bradley
ABSTRACT
An investigation of potential leakage of leachate from the Shelby County landfill near Memphis, West Tennessee, was conducted dur- ing 1986-87. The migration of leachate from the landfill to the shallow alluvial aquifer system and the potential leakage to the deeper con.ned Memphis aquifer of Tertiary age were investigated. A network of observation wells was drilled to determine water levels and aqutfer properties in the shallow and deep aquifers as well as in the confining layer. Water samples were collected to deJne poten- tial leachate occurrence.
A depression in the water table within the shallow alluvial aqutfer was defined from the water-level data. Drawdowns within the cone of depression are as much as 14 feet lower than the adjoining Wolf River. Recharge from the river and leachate from the landfill moves toward the depression. The presence of leachate within the shallow aquifer was con- firmed from determinations of dissolved solids and dissolved chloride concentrations and com- parisons with areas away from the aflected
zone. Leakage from the water-table aquifer to the Memphis aquifer was confirmed from chemical analyses and hydraulic-head data. Dissolved-solids concentrations in water samples from the upper Memphis aquifer near the landfill are higher than in samples from the Memphis aquifer in unaflected areas. Tritium activities in water samples from the upper Memphis aquifer were as high as 34pico- Curies per liter indicating recent recharge to the Memphis aquifer.
The presence of synthetic organic com- pounds and elevated concentrations of dis- solved solids, chloride, and trace metals indicate the leachate has aflected water quality in the alluvial aqutfer. Vertical migration of ground water could transmit leachate down to the Memphis aquifer. Although water-quality data indicate that water is leaking from the alluvial aquifer to the Memphis aquifer, most of the data do not indicate the occurrence of leachate in the Memphis aquifer. Chemical data from one well in the Memphis aquifer near the landfill indicates a slightly elevated dissolved-chloride concentration, but the data are limited.
1
INTRODUCTION
The Memphis aquifer is the major source of water for municipal, industrial, and commercial uses in West Tennessee. ,The City of Memphis uses the Memphis aquifer as its only source of water and pumped about 190 million gallons per day from the Memphis aquifer in 1988 (S. Hutson, U.S. Geological Survey, written commun., 1989). The poten- tial for this resource to be endangered by the possible downward migration of contaminants is a major concern to the City of Memphis, Shelby County, and the State of Tennessee.
In the Memphis area, the Memphis aquifer is overlain and confined by the Jackson-upper Claibome confining layer. The confining layer separates the Memphis aquifer from the shallow water-table aquifer occurring at land surface. Movement of water down to the Memphis aquifer was thought to be prevented by clay layers in the Jackson-upper Claibome confining layer. However, an investigation by Graham and Parks (1986) identified general areas in Shelby County where water could possibly migrate down from the water-table aquifer to the Memphis aquifer. Investigations by the Division of Solid Waste Management of the Tennessee Department of Health and Environment (P.M. Garman, writ- ten commun., 1978; J.L. Ashner, written commun., 1986) for the proposed expansion of the Shelby County Landfill indicated the occurrence of possible downward leakage to the Memphis aquifer at a specific site. If leakage were occurring, leachate from the landfill could possibly move toward and into the Memphis aquifer.
The U.S. Geological Survey (USGS), in cooperation with the Shelby County Depart- ment of Public Works and the Tennessee Department of Health and Environment, Divi- sion of Solid Waste Management, conducted a
hydrologic investigation in the vicinity of the landfill during 1986 to 1987. The investiga- tion was designed to determine if leakage down the Memphis aquifer is occurring and whether leachate from the landfill is reaching or affecting water quality in the Memphis aqui- fer. If a relatively small, specific area of vertical leakage could be identified, the hydrologic and geochemical methods could be applied to other areas in Shelby County and West Tennessee to identify areas where the water-table aquifer is recharging the Memphis aquifer and areas where the Memphis aquifer may be susceptible to contamination.
PURPOSE AND SCOPE
This report summarizes the findings of the hydrologic investigation at the Shelby County landfill. The objectives of that investi- gation were to determine:
(1) If vertical leakage from the alluvial aquifer to the Memphis aquifer is occurring near the landfill.
(2) The extent of any leachate migration from the landfill to the alluvial aquifer.
(3) If leachate has migrated to the Memphis aquifer.
The study area included the landfill and its immediate vicinity (fig. 1). The landfill proper occupies an area of about 60 acres south of the Shelby County Penal Farm east of Memphis (fig. 1). Existing and new wells in the alluvial aquifer and Memphis aquifer were used in the study. The segment of the Wolf River adjacent to the landfill was included in the study area to determine whether the stream recharges the aquifer or receives water from the aquifer.
2
-.-J
\
3
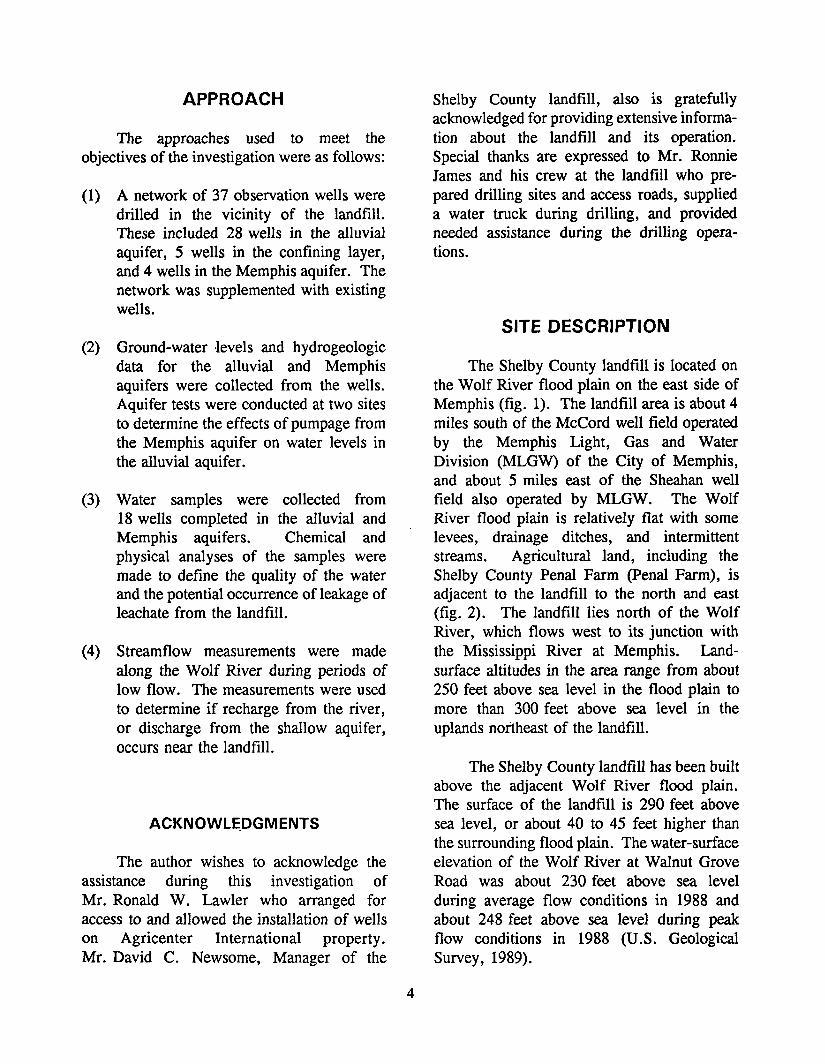
APPROACH
The approaches used to meet the objectives of the investigation were as follows:
(1) A network of 37 observation wells were drilled in the vicinity of the landfill. These included 28 wells in the alluvial aquifer, 5 wells in the confining layer, and 4 wells in the Memphis aquifer. The network was supplemented with existing wells.
(2) Ground-water ,levels and hydrogeologic data for the alluvial and Memphis aquifers were collected from the wells. Aquifer tests were conducted at two sites to determine the effects of pumpage from the Memphis aquifer on water levels in the alluvial aquifer.
(3) Water samples were collected from 18 wells completed in the alluvial and Memphis aquifers. Chemical and physical analyses of the samples were made to define the quality of the water and the potential occurrence of leakage of leachate from the landfill.
(4) Streamflow measurements were made along the Wolf River during periods of low flow. The measurements were used to determine if recharge from the river, or discharge from the shallow aquifer, occurs near the landfill.
ACKNOWLE,DGMENTS
The author wishes to acknowledge the assistance during this investigation of Mr. Ronald W. Lawler who arranged for access to and allowed the installation of wells on Agricen ter International property. Mr. David C. Newsome, Manager of the
Shelby County landfill, also is gratefully acknowledged for providing extensive informa- tion about the landfill and its operation. Special thanks are expressed to Mr. Ronnie James and his crew at the landfill who pre- pared drilling sites and access roads, supplied a water truck during drilling, and provided needed assistance during the drilling opera- tions.
SITE DESCRIPTION
The Shelby County landfill is located on the Wolf River flood plain on the east side of Memphis (fig. 1). The landfill area is about 4 miles south of the McCord well field operated by the Memphis Light, Gas and Water Division (MLGW) of the City of Memphis, and about 5 miles east of the Sheahan well field also operated by MLGW. The Wolf River flood plain is relatively flat with some levees, drainage ditches, and intermittent streams. Agricultural land, including the Shelby County Penal Farm (Penal Farm), is adjacent to the landfill to the north and east (fig. 2). The landfill lies north of the Wolf River, which flows west to its junction with the Mississippi River at Memphis. Land- surface altitudes in the area range from about 250 feet above sea level in the flood plain to more than 300 feet above sea level in the uplands northeast of the landfill.
The Shelby County landfill has been built above the adjacent Wolf River flood plain. The surface of the landfill is 290 feet above sea level, or about 40 to 45 feet higher than the surrounding flood plain. The water-surface elevation of the Wolf River at Walnut Grove Road was about 230 feet above sea level during average flow conditions in 1988 and about 248 feet above sea level during peak flow conditions in 1988 (U.S. Geological Survey, 1989).
4
. f > .-
CL
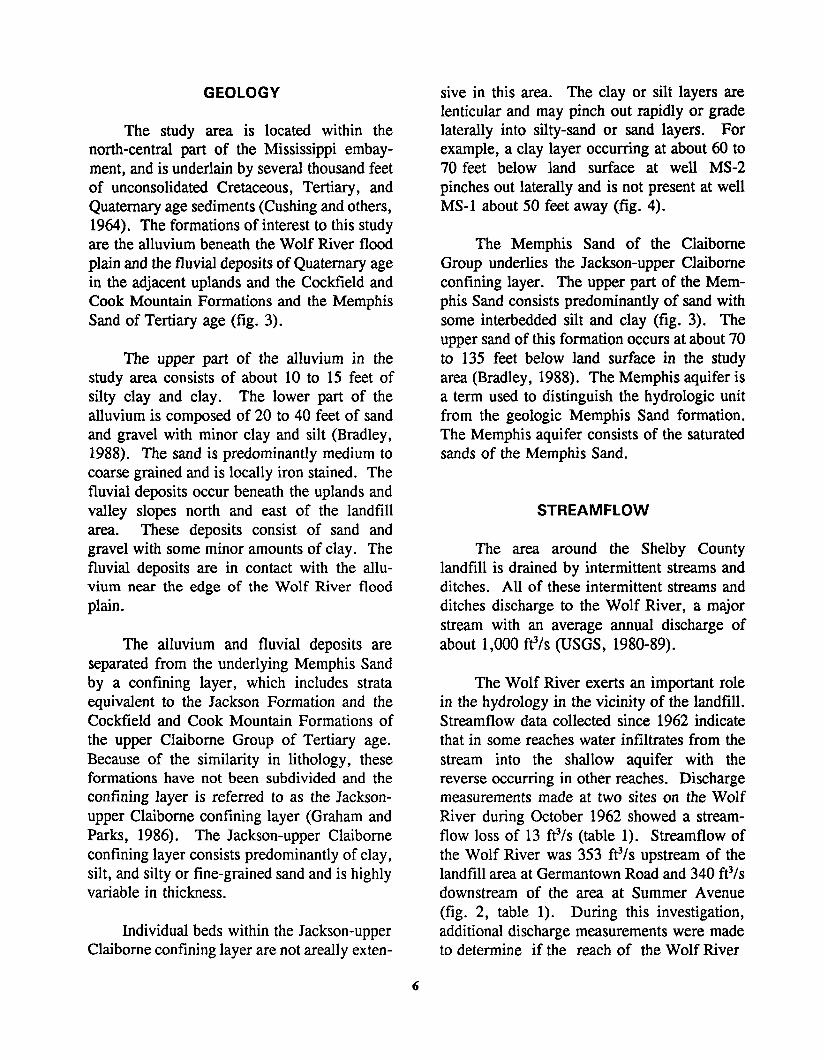
GEOLOGY
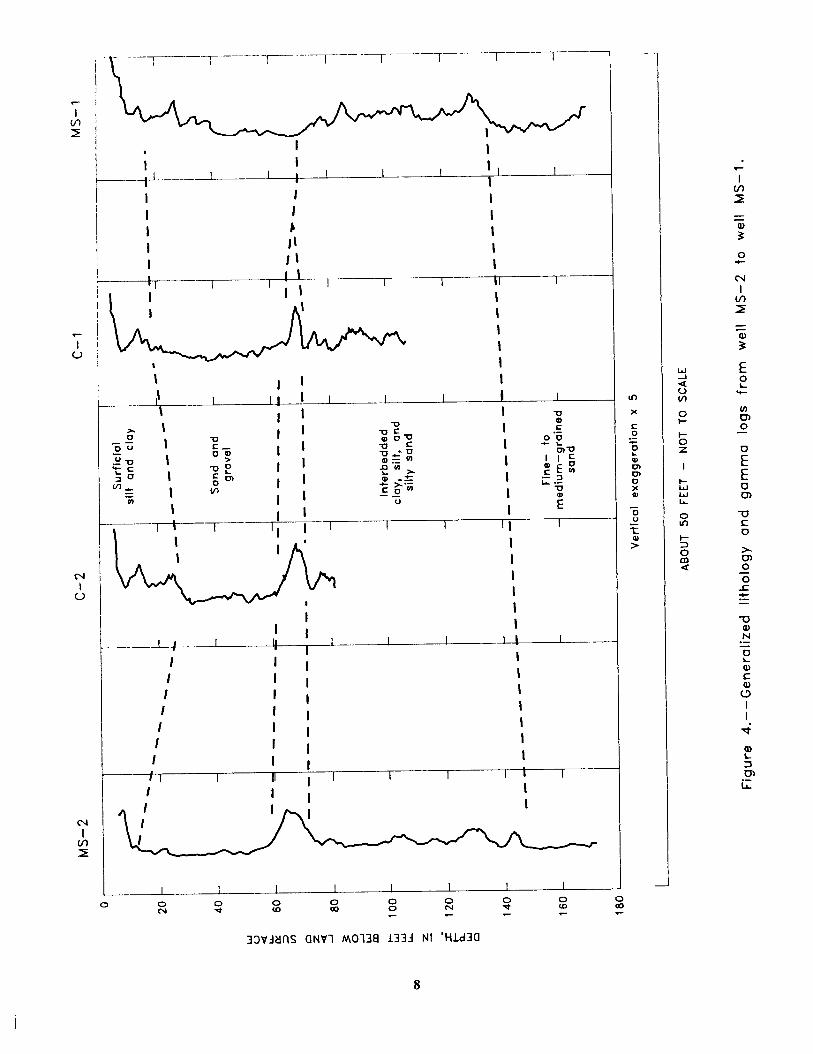
The study area is located within the north-central part of the Mississippi embay- ment, and is underlain by several thousand feet of unconsolidated Cretaceous, Tertiary, and Quaternary age sediments (Cushing and others, 1964). The formations of interest to this study are the alluvium beneath the Wolf River flood plain and the fluvial deposits of Quatemary age in the adjacent uplands and the Cockfield and Cook Mountain Formations and the Memphis Sand of Tertiary age (fig. 3).
The upper part of the alluvium in the study area consists of about 10 to 15 feet of silty clay and clay. The lower part of the alluvium is composed of 20 to 40 feet of sand and gravel with minor clay and silt (Bradley, 1988). The sand is predominantly medium to coarse grained and is locally iron stained. The fluvial deposits occur beneath the uplands and valley slopes north and east of the landfill area. These deposits consist of sand and gravel with some minor amounts of clay. The fluvial deposits are in contact with the allu- vium near the edge of the Wolf River flood plain.
The alluvium and fluvial deposits are separated from the underlying Memphis Sand by a confining layer, which includes strata equivalent to the Jackson Formation and the Cockfield and Cook Mountain Formations of the upper Claibome Group of Tertiary age. Because of the similarity in lithology, these formations have not been subdivided and the confining layer is referred to as the Jackson- upper Claibome confining layer (Graham and Parks, 1986). The Jackson-upper Claibome confining layer consists predominantly of clay, silt, and silty or fine-grained sand and is highly variable in thickness.
Individual beds within the Jackson-upper Claibome confining layer are not areally exten-
sive in this area. The clay or silt layers are lenticular and may pinch out rapidly or grade laterally into silty-sand or sand layers. For example, a clay layer occurring at about 60 to 70 feet below land surface at well MS-2 pinches out laterally and is not present at well MS-1 about 50 feet away (fig. 4).
The Memphis Sand of the Claibome Group underlies the Jackson-upper Claibome confining layer. The upper part of the Mem- phis Sand consists predominantly of sand with some interbedded silt and clay (fig. 3). The upper sand of this formation occurs at about 70 to 135 feet below land surface in the study area (Bradley, 1988). The Memphis aquifer is a term used to distinguish the hydrologic unit from the geologic Memphis Sand formation. The Memphis aquifer consists of the saturated sands of the Memphis Sand.
STREAMFLOW
The area around the Shelby County landfill is drained by intermittent streams and ditches. All of these intermittent streams and ditches discharge to the Wolf River, a major stream with an average annual discharge of about 1,000 ft3/s (USGS, 1980-89).
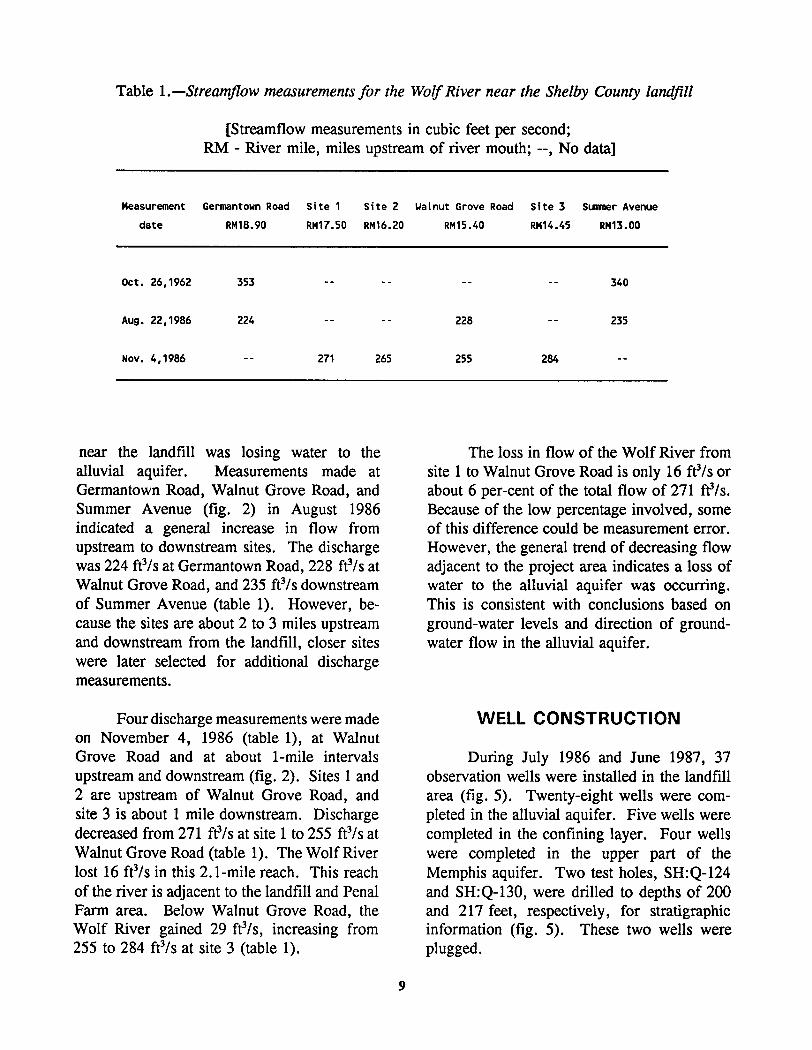
The Wolf River exerts an important role in the hydrology in the vicinity of the landfill. Streamflow data collected since 1962 indicate that in some reaches water infiltrates from the stream into the shallow aquifer with the reverse occurring in other reaches. Discharge measurements made at two sites on the Wolf River during October 1962 showed a stream- flow loss of 13 ft3/s (table 1). Streamflow of the Wolf River was 353 ft3/s upstream of the landfill area at Germantown Road and 340 ft3/s downstream of the area at Summer Avenue (fig. 2, table 1). During this investigation, additional discharge measurements were made to determine if the reach of the Wolf River
Table 1 .-Streamflow measurements for the Wolf River near the Shelby County landfill
[Streamflow measurements in cubic feet per second; RM - River mile, miles upstream of river mouth; --, No data]
Measurement Germantown Road Site 1 Site 2 Ualnut Grove Road Site 3 Sumter Avenue
date RM18.90 RM17.50 RM16.20 RM15.40 RM14.45 RM13.00
Oct. 26,1962 353 __ -- -_ __ 340
Aug. 22,1986 224 -_ -_ 228 __ 235
Nov. 4,1986 __ 271 265 255 284 __
near the landfill was losing water to the alluvial aquifer. Measurements made at Germantown Road, Walnut Grove Road, and Summer Avenue (fig. 2) in August 1986 indicated a general increase in flow from upstream to downstream sites. The discharge was 224 ft3/s at Germantown Road, 228 ft3/s at Walnut Grove Road, and 235 ft3/s downstream of Summer Avenue (table 1). However, be- cause the sites are about 2 to 3 miles upstream and downstream from the landfill, closer sites were later selected for additional discharge measurements.
Four discharge measurements were made on November 4, 1986 (table l), at Walnut Grove Road and at about l-mile intervals upstream and downstream (fig. 2). Sites 1 and 2 are upstream of Walnut Grove Road, and site 3 is about 1 mile downstream. Discharge decreased from 271 fe/s at site 1 to 255 ft3/s at Walnut Grove Road (table 1). The Wolf River lost 16 ft3/s in this 2. l-mile reach. This reach of the river is adjacent to the landfill and Penal Farm area. Below Walnut Grove Road, the Wolf River gained 29 ft3/s, increasing from 255 to 284 ft3/s at site 3 (table 1).
The loss in flow of the Wolf River from site 1 to Walnut Grove Road is only 16 ft3/s or about 6 per-cent of the total flow of 271 ft!/s. Because of the low percentage involved, some of this difference could be measurement error. However, the general trend of decreasing flow adjacent to the project area indicates a loss of water to the alluvial aquifer was occurring. This is consistent with conclusions based on ground-water levels and direction of ground- water flow in the alluvial aquifer.
WELL CONSTRUCTION
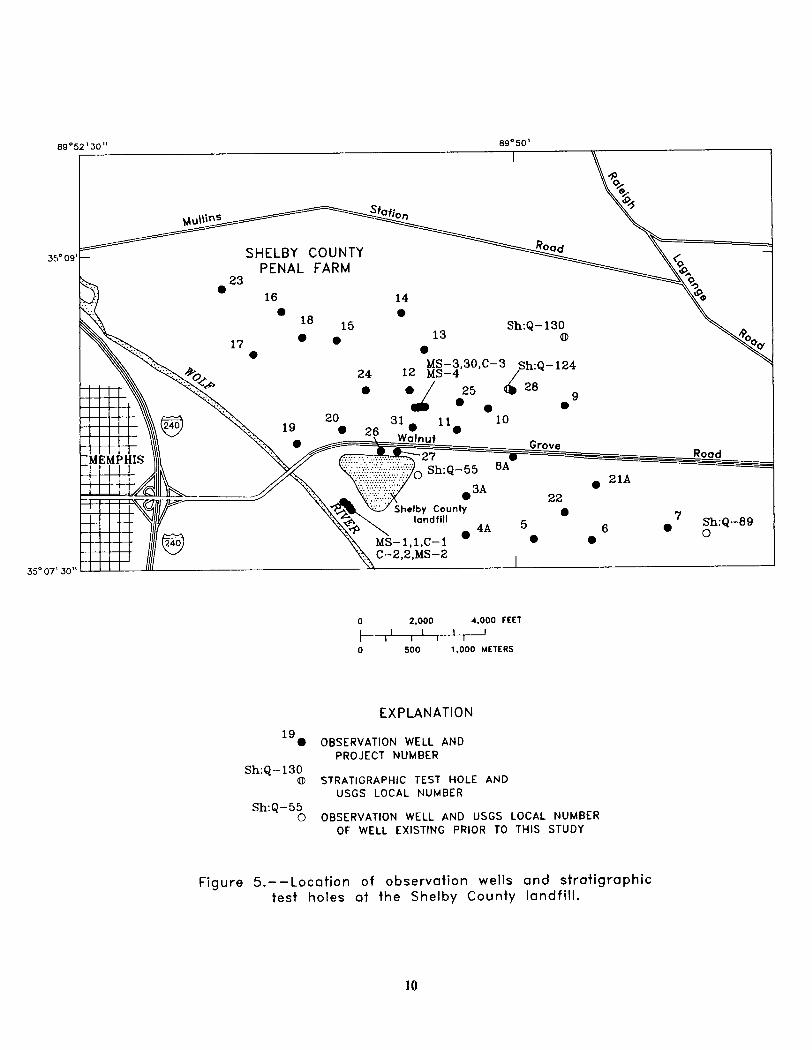
During July 1986 and June 1987, 37 observation wells were installed in the landfill area (fig. 5). Twenty-eight wells were com- pleted in the alluvial aquifer. Five wells were completed in the confining layer. Four wells were completed in the upper part of the Memphis aquifer. Two test holes, SH:Q-124 and SH:Q-130, were drilled to depths of 200 and 217 feet, respectively, for stratigraphic information (fig. 5). These two wells were plugged *
9
16 14 0
l8 0
15 l 0 13
Sh:Q-130 CD
0
24 12 hL&3O,c-3 /Sh:Q-124
D 6 0 0
Sh:Q-89 0
4.000 FEET
OFI 0 500 1 .OOO METERS
EXPLANATION
19 0 OBSERVATION WELL AND
PROJECT NUMBER Sh:Q-130
0 STRATIGRAPHIC TEST HOLE AND USGS LOCAL NUMBER
Sh:Q-55 0 OBSERVATION WELL AND USGS LOCAL NUMBER
OF WELL EXISTING PRIOR TO THIS STUDY
Figure 5.--Location of observation wells and stratigraphic test holes at the Shelby County landfill.
10
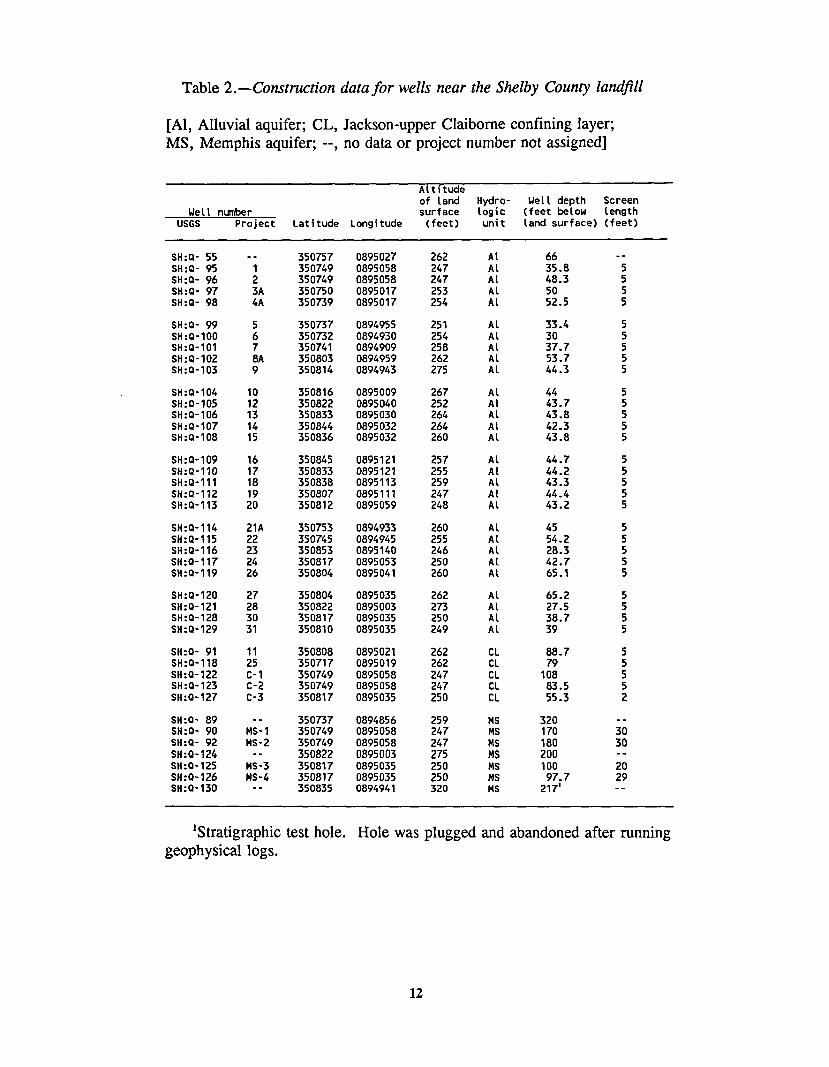
Groups of wells were installed at two sites. One group of wells is located southwest of the landfill near the Wolf River and consists of six wells: 1, 2, C-l, C-2, MS-l, and MS-2 (fig. 5). These wells were completed at 35.8 and 48.3 feet below land surface in the alluvial aquifer (wells 1 and 2); 108 and 83.5 feet below the surface in the confining layer (wells C-l and C-2); and 170 and 180 feet below land surface in the upper Memphis aqui- fer (wells MS-l and MS-2). The second group of wells: 30, C-3, MS-3, and MS-4 (fig. 5), is located in a field north of the landfill. This group consists of one well completed at 38.7 feet below land surface in the alluvial aquifer (well 30), one at 55.3 feet below land surface in the confining layer (well C-3), and 100 feet and 97.7 feet below land surface in the upper Memphis aquifer (wells MS-3 and MS-4).
Construction data are summarized in table 2; more detailed information is given in a report by Bradley (1988). All of the wells were constructed with polyvinyl chloride (PVC) casing and screen. Two existing wells in the study area (SH:Q-55 and SH:Q-89) used for collecting water-quality samples are also listed in table 2.
The wells constructed for this investigation were assigned a project number during the drilling (for example MS-l) and later assigned a formal USGS local number, for example, SH:Q-98. Throughout this report, wells constructed for the project will be identified by the project number. Those wells that were not constructed during this investiga- tion are identified by the USGS local number.
GROUND-WATER HYDROLOGY
The aquifers of concern near the Shelby County landfill are the alluvial aquifer and the
Memphis aquifer. These units are separated by the Jackson-upper Claiborne confining layer.
ALLUVIAL AQUIFER
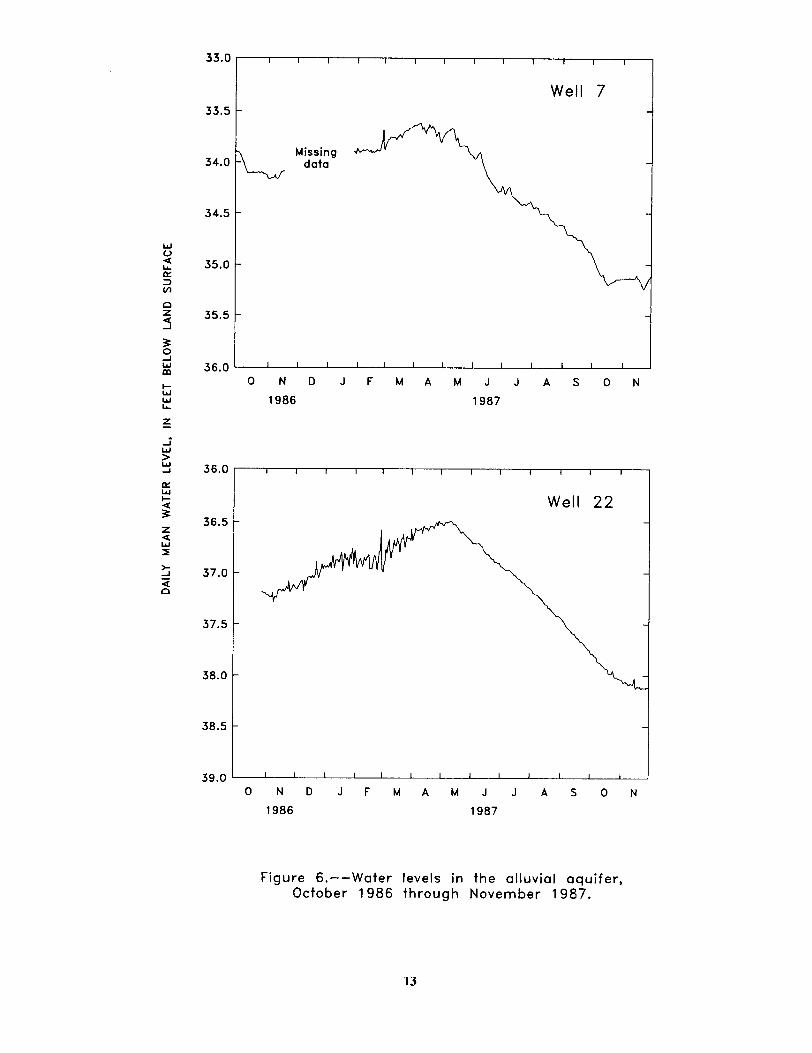
The alluvial aquifer consists of 30 to 50 feet of sand and gravel with some inter- bedded layers of silt and clay. Water levels in the alluvial aquifer fluctuated about 1 foot during October 1986 to June 1987 (fig. 6). These fluctuations were probably in response to changes in recharge and evapotranspiration. Water levels were generally lowest during October and November. Recharge during win- ter and early spring typically caused water levels to rise to their highest levels in March, April, and May (fig. 6). Decreased recharge and increased evapotranspiration during the summer caused water levels in the alluvial aquifer to steadily decline from May through October (fig. 6). There is currently (1989) no ground-water use from the alluvial aquifer in the study area.
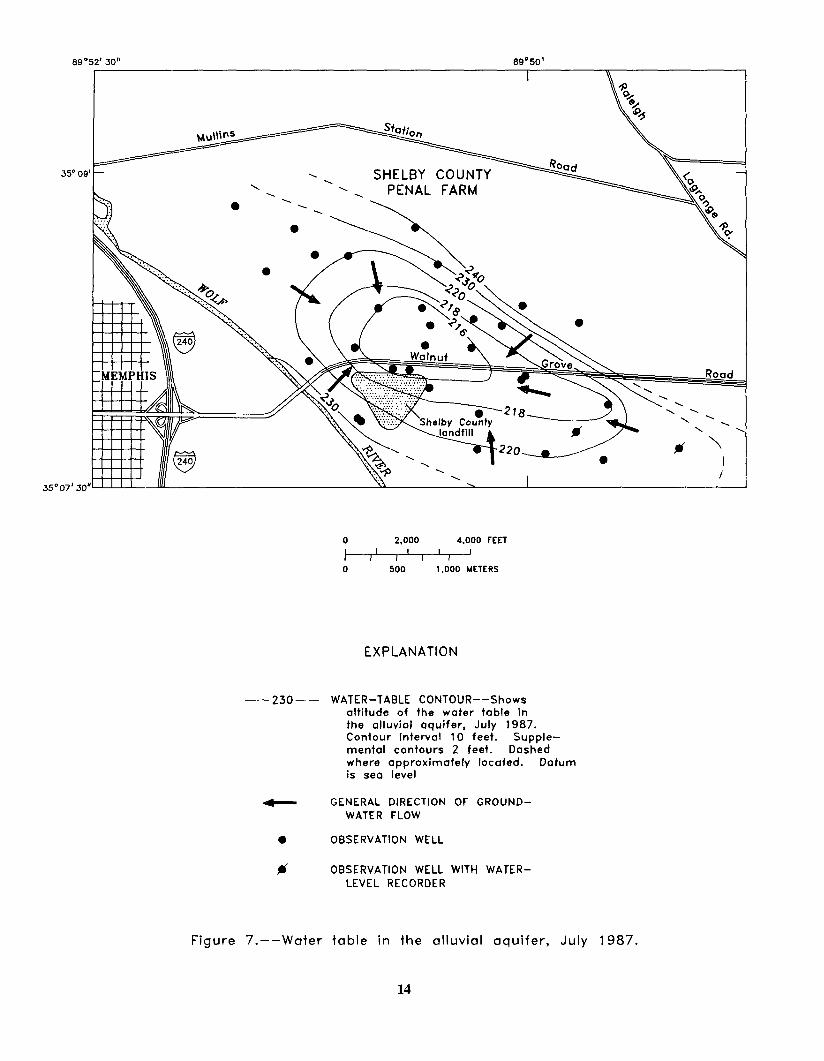
The ground-water-level data from the observation wells in the alluvial aquifer con- firmed the occurrence of a depression in the water table north of the landfill. Water-table altitudes in the alluvial aquifer ranged from about 2 16 to 240 feet above sea level. The water-level measurements were used to define a generalized map of the water table (fig. 7). The lowest altitudes in the water table occur north of the landfill in a broad elliptical depression. The closed depression is similar to water levels surrounding a pumped well with significant drawdown. At this location there is no pumpage, drain, or similar activity that could account for the depressed water levels.
Typically, in a West Tennessee setting similar to the Shelby County landfill area, ground water from the uplands moves through the alluvial aquifer and discharges along the
11
Table 2.-Construction data for wells near the Shelby County landfill
[Al, Alluvial aquifer; CL, Jackson-upper Claibome confining layer; MS, Memphis aquifer; --, no data or project number not assigned]
Altitude of land Hydro- Uell depth Screen
Well number surface logic (feet belou length USGS Project Latitude Longitude (feet) unit land surface) (feet)
SH:Q- 55 SH:Q- 95 SH:Q- 96 SH:Q- 97 SH:P- 98
-_
: 3A 4A
350757 0895027 262 AL 350749 0895058 247 Al 350749 0895058 247 Al 350750 0895017 253 AL 350739 0895017 254 AL
66 35.8 48.3
z.5
SH:Q- 99 SH:Q-100 SH:Q-101 SH:Q-102 SH:Q-103
2 7 8A 9
350737 0894955 251 AL 350732 0894930 254 Al 350741 0894909 258 Al 350803 0894959 262 Al 350814 0894943 275 Al
33.4
E.7 53.7 44.3
SH:Q-104 SH:Q-105 SH:Q-106 SH:Q-107 SH:Q-108
350816 0895009 267 Al 44 350822 0895040 252 Al 43.7 350833 0895030 264 AL 43.8 350844 0895032 264 Al 42.3 350836 0895032 260 Al 43.8
SH:Q-109 SH:Q-110 SH:Q-111 SH:Q-112 SH:Q-113
350845 0895121 257 AL 44.7 350833 0895121 255 Al 44.2 350838 0895113 259 Al 43.3 350807 0895111 247 Al 44.4 350812 0895059 248 Al 43.2
SH:Q-114 21A 350753 0894933 260 Al 45 SH:Q-115 22 350745 0894945 255 Al 54.2 SH:Q-116 23 350853 0895140 246 Al 28.3 SH:Q-117 24 350817 0895053 250 Al 42.7 SH:Q-119 26 350804 0895041 260 Al 65.1
SH:Q-120 SH:Q-121 SH:Q-128 SH:Q-129
27 28
ii
350804 0895035 262 Al 65.2 350822 0895003 273 Al 27.5 350817 0895035 250 Al 38.7 350810 0895035 249 Al 39
‘Stratigraphic test hole. Hole was plugged and abandoned after running geophysical logs.
12
34.0 h Missing data
ONDJFMAMJJASON
1986 1987
36.0
36.5
37.0
37.5
38.0
38.5
39.0
I -
Well 22
I I I I I I I I I I I I ,
ONDJFMAMJJASON
1986 1987
Figure 6.-- Water levels in the alluvial aquifer, October 1986 through November 1987.
13
-230,
0 2,000 4.000 FEET
I I I I I
I 0 500 1,000 METERS
EXPLANATION
WATER-TABLE CONTOUR--Shows altitude of the water table in the alluvial aquifer, July 1987. Contour interval 10 feet. Supple- mental contours 2 feet. Dashed where approximately located. Datum is sea level
GENERAL DIRECTION OF GROUND- WATER FLOW
OBSERVATION WELL
OBSERVATION WELL WITH WATER- LEVEL RECORDER
Figure 7. --Water table in the alluvial aquifer, July 1987.
14
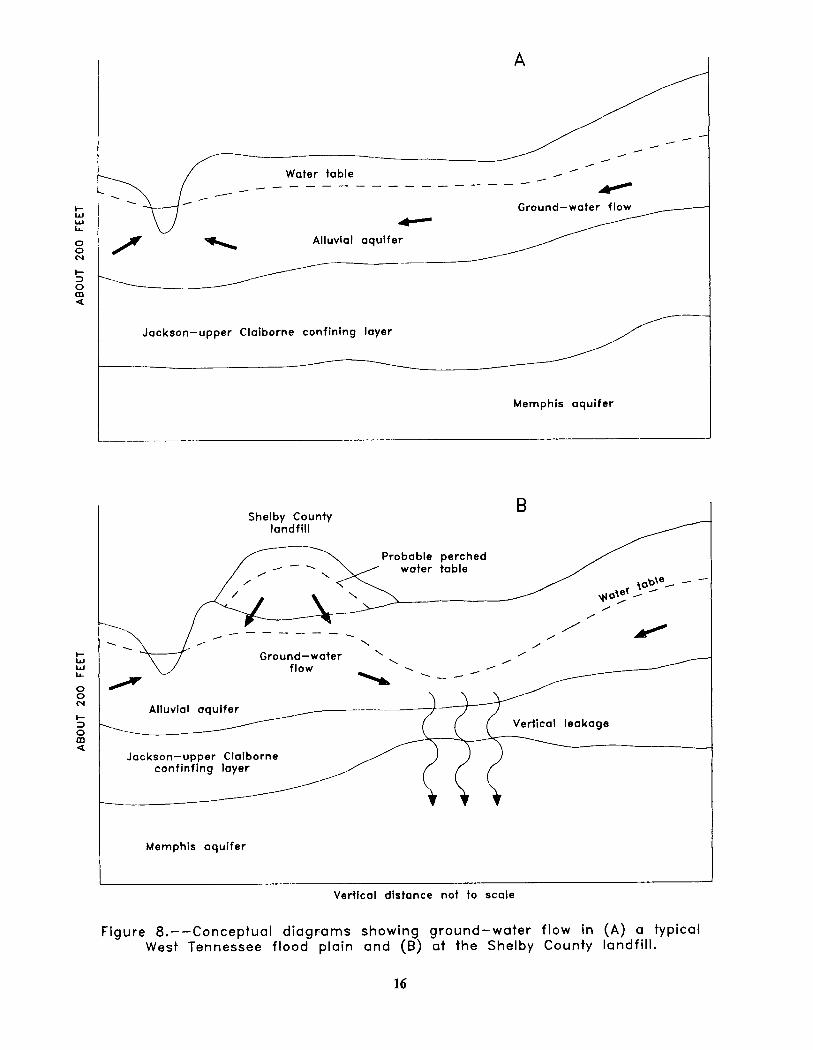
channels of major streams like the Wolf River (fig. 8a). However, in the landfill area, ground water appears to be diverted toward the depression in the water table (fig. 8b). The depression in the water table indicates that the downward movement of water is occurring from the alluvial aquifer to the upper part of the Memphis aquifer. Downward leakage could occur only through a discontinuity or fault in the confining layer separating the allu- vial and Memphis aquifers (fig. 8b). Seeps identified along the sides and base of the land- fill indicated perched water-table conditions may occur at times within the landfill and con- tribute flow to the alluvial aquifer.
MEMPHIS AQUIFER
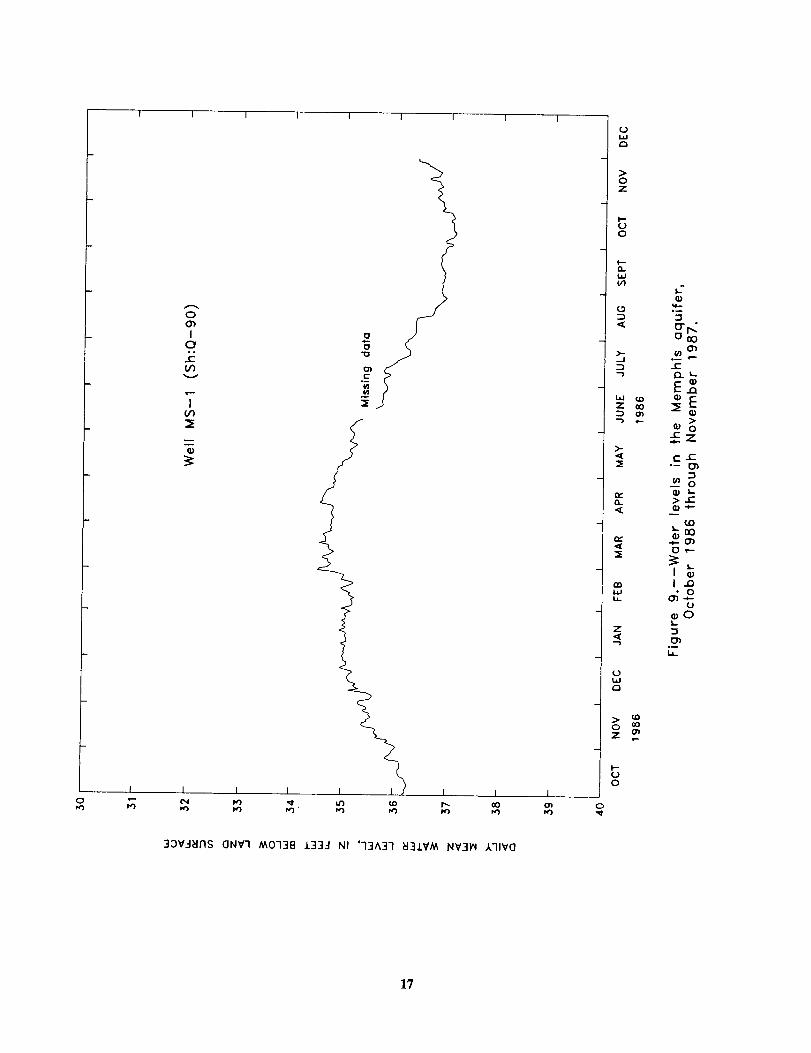
The Memphis aquifer consists of about 500 to 900 feet of sand with minor clay lenses of the Memphis Sand. Water levels fluctuate in the Memphis aquifer in response to natural conditions and pumping at the well fields (Graham, 1982). Water levels generally are highest during the spring months and decline during the summer as a result of increased evapotranspiration, increased pumpage, and decreased recharge. Low water levels occurred in the Memphis aquifer during Sep- tember through November, with water-level fluctuations of approximately 2 feet in MS-l during 1986 and 1987 (fig. 9).
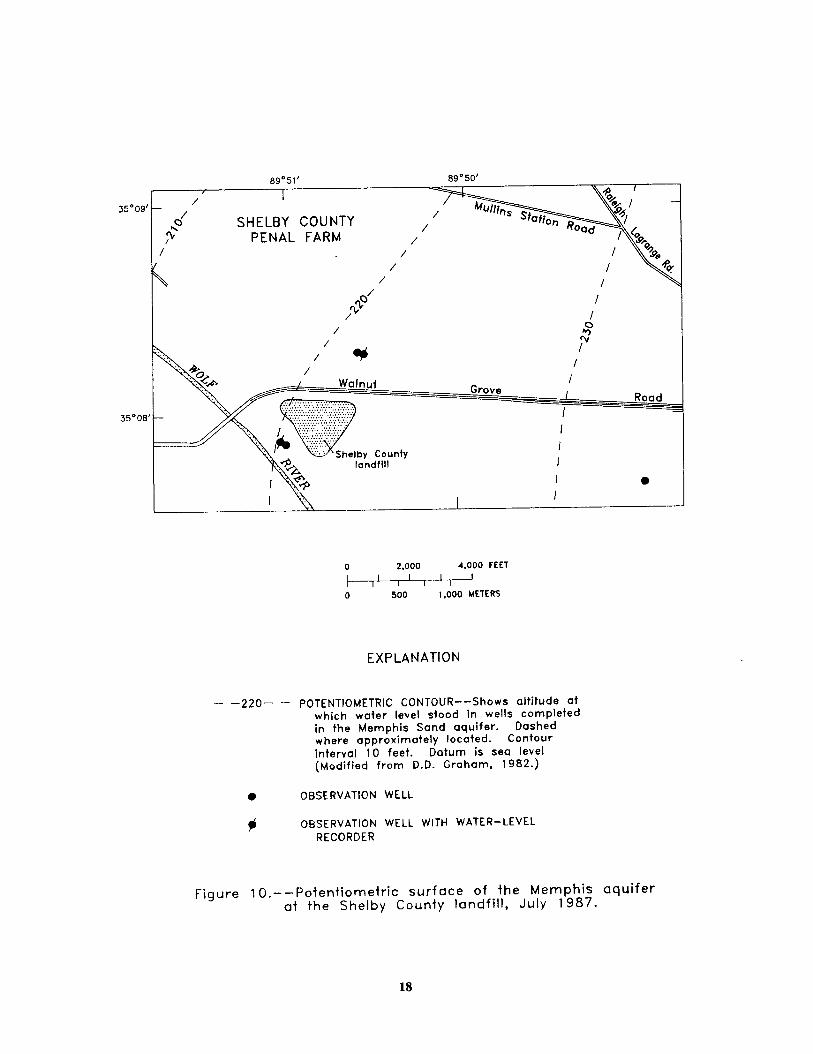
Ground-water flow in the Memphis aquifer in the study area is toward Sheahan and McCord well fields to the west and northwest. The potentiometric surface of the Memphis aquifer ranges from an altitude of about 235 feet above sea level to slightly less than 210 feet above sea level in the study area (fig. 10). Water levels in the wells screened in the Memphis aquifer near the landfill are generally 35 to 37 feet below land surface (fig. 9). These water levels are at lower altitudes than the water table in the alluvial
aquifer. Therefore, a downward hydraulic gradient exists to potentially allow water to flow vertically from the alluvial aquifer down to the Memphis aquifer.
Vertical leakage of ground water into the Memphis aquifer from the overlying alluvial and fluvial deposits and the underlying Fort Pillow aquifer were investigated by Graham and Parks (1986). These investigations found that the movement of ground water down from the alluvial and fluvial (water-table) aquifers to the Memphis aquifer occurs where the confin- ing bed is thin or absent and a downward grad- ient exists. Downward leakage near the southern part of Sheahan well field has been documented from water-quality data, declines in the water-table altitude, and isotope analyses showing recent water in wells Sh:K-73 and Sh:K-74 in the Memphis aquifer (Graham and Parks, 1986). The potential for upward migra- tion of water from the underlying Fort Pillow aquifer into the Memphis aquifer also exists, but between these formations, the amount of leakage is small (Graham and Parks, 1986)
AQUIFER TESTS AND RESULTS
Aquifer tests were conducted at two sites at the Shelby County landfill to estimate the amount of vertical leakage from the alluvial aquifer down to the Memphis aquifer. Wells were installed at each site to monitor water levels in the alluvial aquifer, the confining layer, and the Memphis aquifer. The pumped well at each site was screened in the upper part of the Memphis aquifer. The southern group of wells is located on the southwestern side of the landfill near the Wolf River (fig. 5). Wells 1 and 2 are screened in the alluvial aquifer, C-l and C-2 in the confining layer, and MS-l and MS-2 in the upper Memphis aquifer (table 2). MS-2 was the pumped well at this site. The second group is located in a field north of the Shelby County landfill (fig. 5). In the
15
A
Water table -...--_____------
L if
8 N Alluvial aquifer
c-4
s-. Ez
“_----- \
a
Jackson-upper Claiborne confining layer
-.--- .
Memphis aquifer
Shelby County landfill
Alluvial
Ground-water flow
Memphis aquifer
Vertical distance not to scale
Figure 8. --Conceptual diagrams showing ground-water flow in (A) a typical West Tennessee flood plain and (B) at the Shelby County landfill.
16
I I I I I I I I I
Y 0
33Vjtl1X ClNVl MO138 1334 NI ‘13A3-l tJ31VM NV3W AllVO
17
35°09’
89O51’ 89’50’
/
2’ SHELBY COUNTY 1% PENAL FARM
/ /
/ /
/
/ !.
35’08’ -
landfill
4.000 FEET
OI,.qoo 0 500 I so00 METERS
EXPLANATION
- -ZZO- - POTENTIOMETRIC CONTOUR--Shows altitude at which water level stood in wells completed in the Memphis Sand aquifer. Dashed where approximately located. Contour interval 10 feet. Datum is sea level (Modified from D.D. Graham, 1982.)
0 OBSERVATION WELL
# OBSERVATION WELL WITH WATER-LEVEL RECORDER
Figure 1 O.-- Potentiometric surface of the Memphis aquifer at the Shelby County landfill, July 1987.
18
northern group, well 30 is screened in the alluvial aquifer, well C-3 in the confining layer, and wells MS-3 and MS-4 in the Memphis aquifer. Well MS-3 was the pumped well during this test.
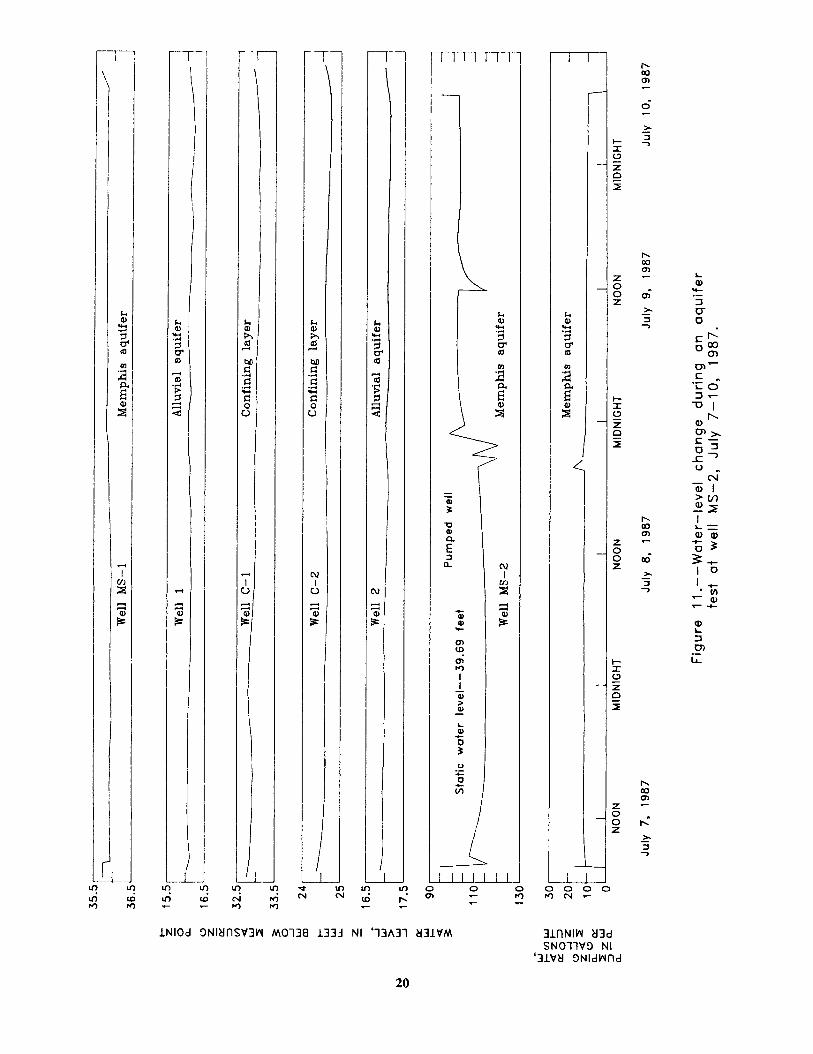
The aquifer test at the south group started on July 7, 1987, and continued for 72 hours. Water levels in the wells and the pumping rate were monitored throughout the test (fig. 11). The initial pumping rate was more than 20 gal/min, but this rate was reduced to 12 gal/min when the water level approached the pump intake at about 120 feet after 5 minutes. This pumping rate, with two exceptions, was maintained throughout the test. Initial drawdowns were observed in all of the observation wells (1, 2, C-l, and MS-l) after the start of the test (fig. 11). Water level in the pumped well was 39.69 feet below the measuring point prior to the start of the test and about 105 feet below the measuring point at the end of the test. Water levels in the observation wells showed little drawdown dur- ing the rest of the test but did respond rela- tively quickly to changes in pumping (fig. 11). Changes in the pumping rate during the night of July 8 caused water-level fluctuations in wells 1, 2, C-2, and MS-l. Maximum draw- down in the observation wells were: 0.16 foot in well MS-l, 0.09 foot in C-l, 0.17 foot in C-2, 0.11 foot in well 1, and 0.09 foot in well 2.
The data collected during this aquifer test were inadequate to quantify vertical leak- age at this site. Because of the natural fluc- tuations in water levels and the relatively small amount of drawdown at the observation wells, the data could not be used for reliable calcula- tions. Water levels in the confining layer and the alluvial aquifer responded to changes in the pumping rate in the Memphis aquifer. This indicates that the alluvial aquifer is hydraulically connected to the Memphis aquifer.
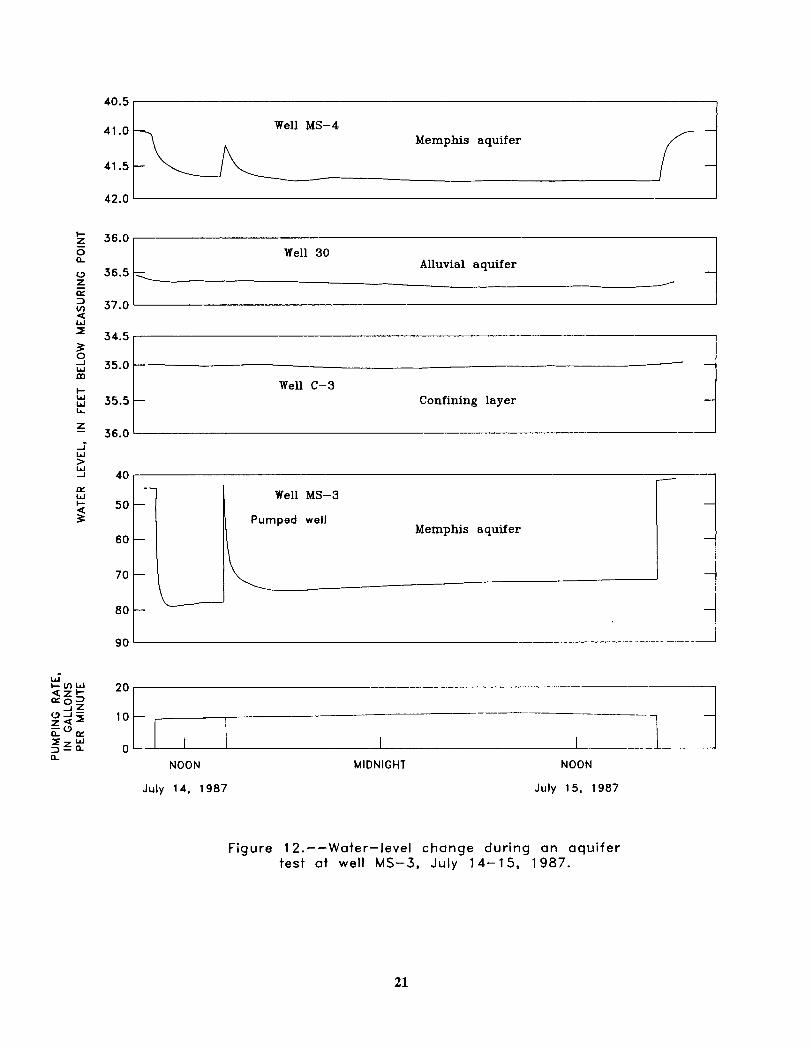
Well MS-3 in the northern group was pumped for about 31 hours during July 14 and 15, 1987. The pumping rate was 10 gal/min (fig. 12). About 4 hours after the test started, the pump was shut off briefly and then pump- ing resumed at 10 gal/min. Only the pumped well and the observation well MS-4 in the Memphis aquifer responded significantly to pumping. Maximum drawdown at the end of the test was 31.34 feet in well MS-3 and 0.54 foot in observation well MS-4. Water levels in both wells 30 and C-3 fluctuated only about 0.05 foot during the aquifer test (fig. 12). Any drawdown that may have occurred in wells 30 or C-3 could not be separated from natural fluctuation or measurement error. About 30 feet of relatively dense clay is present in the confining layer separating the alluvial aquifer from the Memphis aquifer at this site (Bradley, 1988). The northern group of wells is located in the depression in the water-table surface, and water levels were expected to respond to pumping. Evidently, the pumping stress in the Memphis aquifer was not great enough to affect water levels in the alluvial aquifer or the confining layer.
WATER QUALITY
SAMPLING AND ANALYSES
During the study, water samples were col- lected from 14 wells completed in the alluvial aquifer and 4 wells completed in the Memphis aquifer. Samples were analyzed for major and trace inorganic constituents, total organic carbon, and selected volatile organic com- pounds. A scan for the presence of semivola- tile organic compounds using a gas chromato- graph equipped with a flame ionization detector (GC/FID) was also conducted on samples from each well.
Samples from the alluvial aquifer were collected after purging the wells with a 2-inch,
19
I ,
Y .I
, ,
; ‘:
:: <
r 7-
C *
1NlOd 3NltlnSV3W MO138 133A NI ‘13A31 t131V’M
20
I I I
I /
1
, ,
I I 000 PJv
-
-
31nNIW t13d SNOllV’3 Nl
‘31Vtl 9NldWIld
0, L al
2 ol
r;
r 3 -l
Well MS-4 Memphis aquifer
s 36.0 5 a Well 30
Alluvial aquifer 0 z
36.5 -\ .
E 2 37.0 ’ I a 2 34.5
g A ii
35.0 .
L Well C-3
k! 35.5 - Confining layer
z - 36.0 I
40
50
60
70
80
Well MS-3
Pumped well Memphis aquifer
90
Elnw qz+ 20
“5s gir 10 ___- - ---__
FL”rr X--a IZ” 0 L 1 a
NOON MIDNIGHT NOON
July 14, 1987 July 15, 1987
Figure 12. --Water-level change during an aquifer test at well MS-3, July 14-l 5, 1987.
21
stainless-steel, submersible pump. A minimum of five casing volumes of water was purged and sampling was conducted after temperature, pH, and specific conductance stabilized. Standard procedures for the collection of the samples were followed to ensure that samples represented water from the aquifers sampled (Claassen, 1982). Water-quality analyses of these samples were performed at the USGS National Laboratory in Denver, Colorado, using standard methods (Brown and others, 1970; Wershaw and others, 1987). Analyses of water from other selected wells were con- ducted by the Tennessee Department of Health and Environment, Division of Solid Waste Management.
ALLUVIAL AQUIFER
Natural water quality in the alluvial aquifer in Shelby County is variable due to the heterogeneous nature of the deposits. The water quality is affected by the occurrence and type of clay layers, the presence and decom- position of organic material, and the occur- rence of ferrugineous sand. The alluvial aqui- fer in the Memphis area generally contains a calcium-bicarbonate water with dissolved-solids concentrations ranging from 197 to 652 milli- grams per liter (mg/L) and a median concen- tration of 314 mg/L (Brahana and others, 1987). The water from the alluvial aquifer is typically very hard, having a median hardness value of 285 mg/L as CaCO,. Dissolved-iron concentrations in 11 water samples from Shelby County wells in the alluvial aquifer ranged from 200 to 24,000 pg/L with a median concentration of 5,200 pg/L (Brahana and others, 1987).
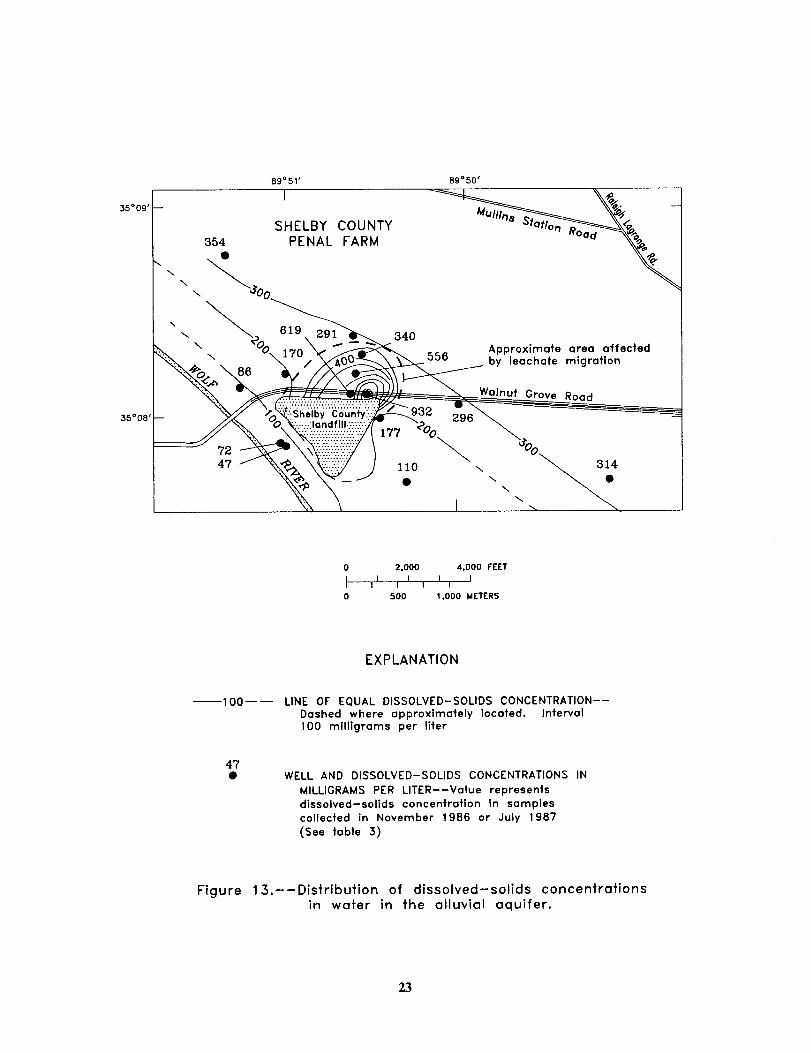
The concentrations of dissolved solids in the alluvial aquifer in the study area ranged from 47 to 932 mg/L (fig. 13, table 3). The distribution of the dissolved-solids concentra-
tions shows the effect of surface-water infiltra- tion and leachate migration from the Shelby County landfill (fig. 13). The concentrations of dissolved solids in parts of the alluvial aqui- fer unaffected by the leachate ranged from less than 100 mg/L near the Wolf River to more than 300 mg/L to the north and southeast of the landfill. In areas affected by leachate migration, dissolved-solids concentrations ranged from 340 to 932 mg/L. Dissolved- chloride concentrations in ground water in unaffected areas generally ranged from about 3 mg/L to about 9 mg/L. Concentrations of dissolved chloride ranged from 7.5 to 91 mg/L where the ground water is affected by leachate migration from the landfill (fig. 14).
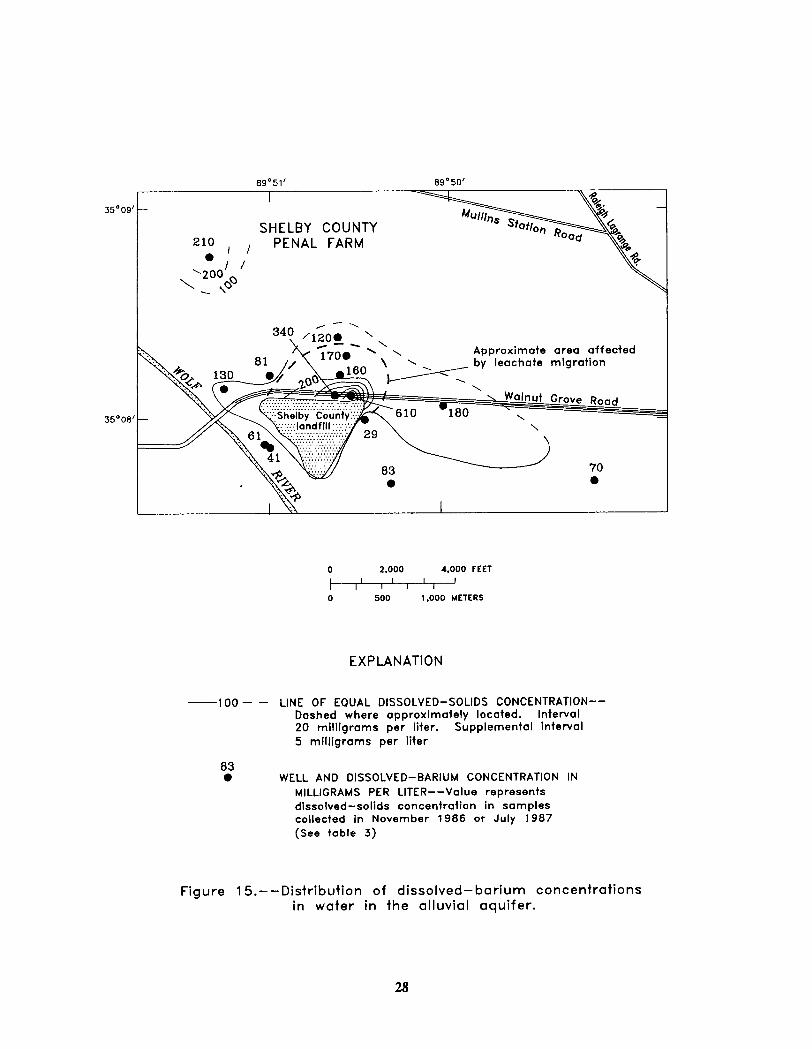
Concentrations of trace inorganic constituents also indicate leachate migration north from the landfill into the alluvial aquifer. Concentrations of dissolved barium were 120 to 610 pg/L in the areas north of the landfill; and were generally less than 100 pg/L south and east of the landfill (fig. 15, table 3).
Anomalously high concentrations were detected in water from some wells which, based on estimated flow direction, would not be affected by leachate migration. These con- centrations were detected in water from wells 8A and 16 (fig. 5). Water from these wells had relatively high concentrations of sodium, chloride, and barium (table 3). These wells may have been affected by localized, nonpoint sources of contamination. Very high concen- trations of iron and manganese (31,000 pg/L and 1,300 pg/L, respectively), were detected in water from well 4A (table 3). The source of these high concentrations is uncertain, but may have been from the ferrugineous sands encountered during drilling. Iron concentra- tions in the alluvial aquifer in other parts of Shelby County are as high as 24,000 pg/L (Brahana and others, 1987).
22
SHELBY COUNTY 354 PENAL FARM
300
Approximate area affected by leachate migration
4.000 FEET
OI 0 500 1 .OOO METERS
EXPLANATION
-lOO- - LINE OF EQUAL DISSOLVED-SOLIDS CONCENTRATION-- Dashed where approximately located. Interval 100 milligrams per liter
47 0 WELL AND DISSOLVED-SOLIDS CONCENTRATIONS IN
MILLIGRAMS PER LITER--Value represents dissolved-solids concentration in samples collected in November 1986 or July 1987 (See table 3)
Figure 13. --Distribution of dissolved-solids concentrations in water in the alluvial aquifer.
- 5 - - LINE OF EQUAL DISSOLVED-SOLIDS CONCENTRATlON-- Dashed where approximately located. Interval 20 milligrams per liter. Supplemental interval 5 milligrams per liter
4.2 0 WELL AND DISSOLVED-CHLORIDE CONCENTRATION IN
MILLIGRAMS PER LITER--Value represents dissolved-solids concentration in samples collected in November 1986 or July 1987 (See table 3)
Figure 14.-- Distribution of dissolved-chloride concentrations in water in the alluvial aquifer.
27
.39°51’ 89O50’
35Oo9’ -
SHELBY COUNTY
/ PENAL FARM
Approximate area affected by leochate migration
0 2.000 4.000 FEET
t I’ I’ I ‘I ’ 0 500 1,000 METERS
EXPLANATION
-100 - - LINE OF EQUAL DISSOLVED-SOLIDS CONCENTRATION-- Dashed where approximately located. Interval 20 milligrams per liter. Supplemental interval 5 milligrams per liter
83 0 WELL AND DISSOLVED-BARIUM CONCENTRATION IN
MILLIGRAMS PER LITER--Value represents dissolved-solids concentration in samples collected in November 1986 or July 1987 (See table 3)
Figure 15.-- Distribution of dissolved-barium concentrations in water in the alluvial aquifer.
28
MEMPHIS AQUIFER
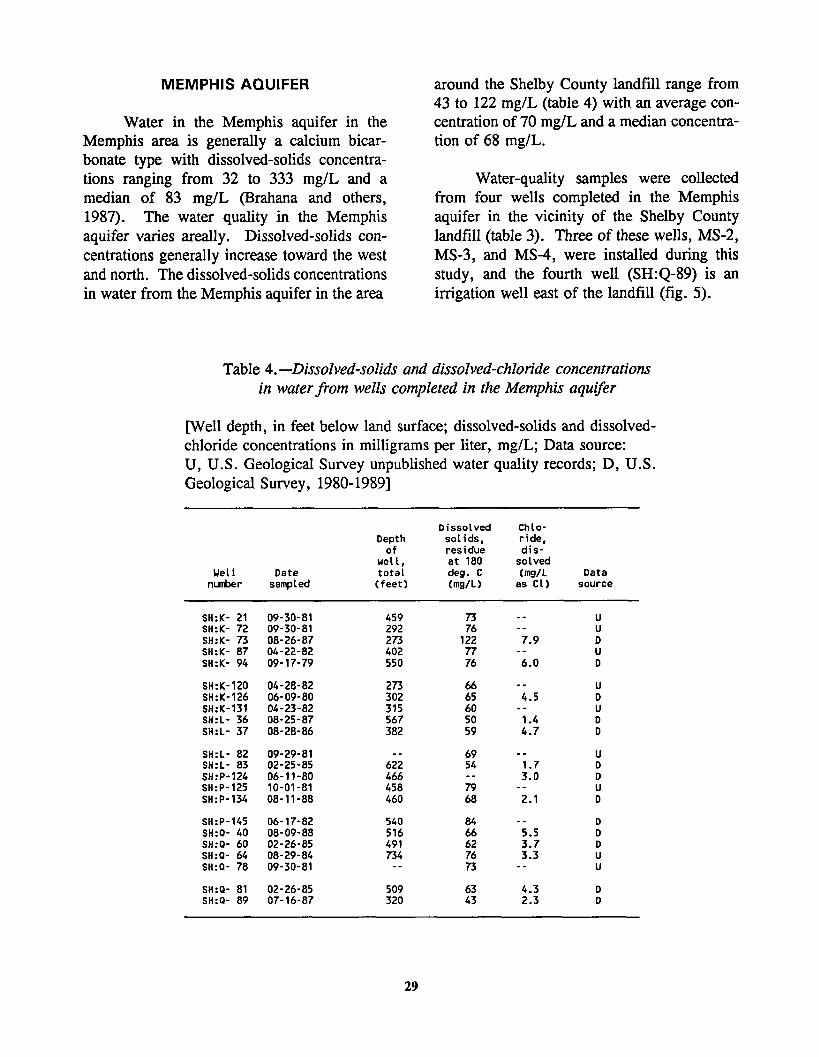
Water in the Memphis aquifer in the Memphis area is generally a calcium bicar- bonate type with dissolved-solids concentra- tions ranging from 32 to 333 mg/L and a median of 83 mg/L (Brahana and others, 1987). The water quality in the Memphis aquifer varies areally. Dissolved-solids con- centrations generally increase toward the west and north. The dissolved-solids concentrations in water from the Memphis aquifer in the area
around the Shelby County landfill range from 43 to 122 mg/L (table 4) with an average con- centration of 70 mg/L and a median concentra- tion of 68 mg/L.
Water-quality samples were collected from four wells completed in the Memphis aquifer in the vicinity of the Shelby County landfill (table 3). Three of these wells, MS-2, MS-3, and MS-4, were installed during this study, and the fourth well (SH:Q-89) is an irrigation well east of the landfill (fig. 5).
Table 4.-Dissolved-solids and dissolved-chloride concentrations in water porn wells completed in the Memphis aquifer
[Well depth, in feet below land surface; dissolved-solids and dissolved- chloride concentrations in milligrams per liter, mg/L; Data source: U, U.S. Geological Survey unpublished water quality records; D, U.S. Geological Survey, 1980-19891
Dissolved chlo- Depth solids, ride,
of residue dis- well, at 180 solved
Well Date total deg. C (mg/L Data nunber sampled (feet) (mg/L) as Cl) source
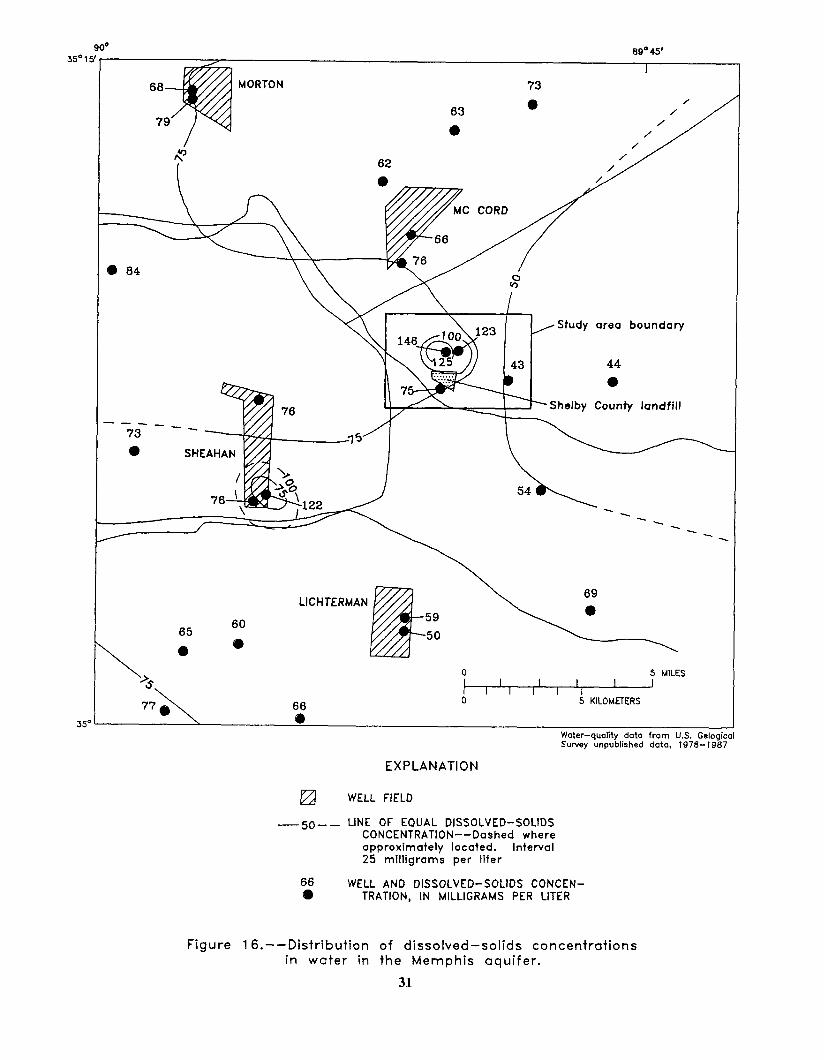
Concentrations of dissolved solids gener- ally increase from about 44 mg/L to about 84 mg/L toward the west (fig. 16). The dissolved-solids concentrations are highest in water from wells in the southern part of Sheahan well field and from wells just north of the Shelby County landfill. In these two areas, dissolved-solids concentrations are greater than 100 mg/L (fig. 16).
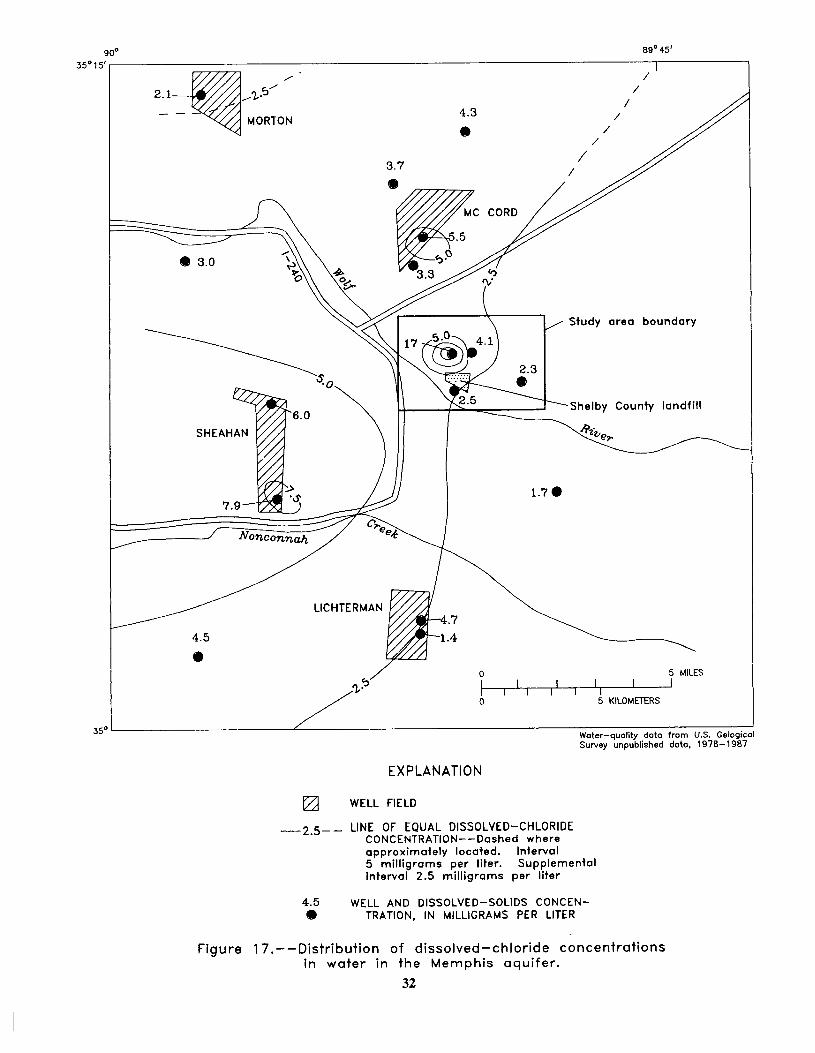
The concentration of dissolved chloride in the Memphis aquifer can also be used as an indicator of potential leakage from the alluvial aquifer. Dissolved-chloride concentrations in water from wells in the Memphis aquifer within a lo-mile radius of the landfill generally were less than 28 mg/L. Dissolved-chloride concentrations were 17 mg/L in water from well MS-3 just north of the landfill (fig. 17).
The water quality of the Memphis aquifer near the Shelby County landfill indicated a significant difference in dissolved-solids concentrations between the upper and lower parts of the Memphis aquifer. Samples from wells drilled into the upper part of the aquifer just below the confining layer (MS-2, MS-3, MS-4) had dissolved-solids concentrations that ranged from 61 to 146 mg/L. In comparison, a sample from the deeper irrigation well (SH: Q-89) contained a dissolved-solids con- centration of 43 mg/L (table 3). Higher dissolved-solids concentrations in the upper part in the Memphis aquifer could be due to vertical leakage from the alluvial aquifer. This comparison, however, is based on only one analysis from the deeper well.
POTENTIAL EFFECTS OF VERTICAL LEAKAGE
Vertical leakage downward from the alluvial aquifer could affect the water quality of the underlying Memphis aquifer. In Shelby
County dissolved-solids concentrations are, on the average, about four times higher in water from the alluvial aquifer than in water from the Memphis aquifer (314 mg/L in the alluvial aquifer and 83 mg/L for the Memphis aquifer, Brahana and others, 1987). The downward movement of water from the alluvial aquifer could, therefore, increase the dissolved-solids concentrations in the upper part of the Mem- phis aquifer. Leachate from the landfill, which could have an even higher dissolved- solids concentrations than water from the alluvial aquifer, could have a more pronounced effect on the quality of water in the Memphis aquifer. A statistical test can be applied to determine if the difference in dissolved-solids concentrations between water from the alluvial aquifer in the upper Memphis aquifer near the landfill and the Memphis aquifer in other areas are significant. The Wilcoxon-Mann-Whitney test for two populations was used for this purpose (Iman and Conover, 1983).
The Wilcoxon-Mann-Whitney test is a non-parametric statistical analysis that can be used to compare the differences between two populations at a given significance level. The first test was conducted to determine if there is a significant difference between the dissolved- solids concentrations in the upper Memphis aquifer near the landfill (wells MS-2, MS-3, and MS-4) and the dissolved-solids concentra- tions for the Memphis aquifer in areas not affected by vertical leakage. Wells MS-2 and MS-4 were each sampled twice (table 3). For the purpose of the statistical analyses described below, the dissolved-solids concentrations of samples collected at the end of the aquifer tests were used (61 mg/L for MS-2 and 123 mg/L for well MS-4). Dissolved-solids concentra- tions for the Memphis aquifer in areas unaffected by leakage were those of samples from wells outside the Shelby County landfill area and away from South Sheahan well field where slightly elevated concentrations were found (fig. 16; table 4).
30
go* 5’ ,
8Q0 45’
I
MORTON
/Study area boundary
44
0
‘Shelby County landfill
LICHTERMAN
65 60
e
O- M’LES 66 0 5 KILOMETERS
8
Water-quality data from U.S. Gelcgicol Survey unpublished data. 1978-1987
EXPLANATION
El WELL FIELD
-SD-- LINE OF EQUAL DISSOLVED-SOLIDS CONCENTRATION --Dashed where approximately located. Interval 25 milligrams per liter
66 WELL AND DISSOLVED-SOLIDS CONCEN- 0 TRATION, IN MILLIGRAMS PER LITER
Figure 16. --Distribution of dissolved-solids concentrations in water in the Memphis aquifer.
31
31
1.7 @
- -f /---- Nonconnah /
Study area boundary
Shelby County landfill
O/ M’LES 0 5 KILOMETERS
Water-quality doto from U.S. Gelogical Survey unpublished data. 1978-1987
EXPLANATION
El WELL FIELD
-2.s - LINE OF EQUAL DISSOLVED-CHLORIDE CONCENTRATION--Dashed where approximately located. Interval 5 milligrams per liter. Supplemental interval 2.5 milligrams per liter
4.5 WELL AND DISSOLVED-SOLIDS CONCEN- @ TRATION, IN MILLIGRAMS PER LITER
Figure 17. --Distribution of dissolved-chloride concentrations in water in the Memphis aquifer.
32
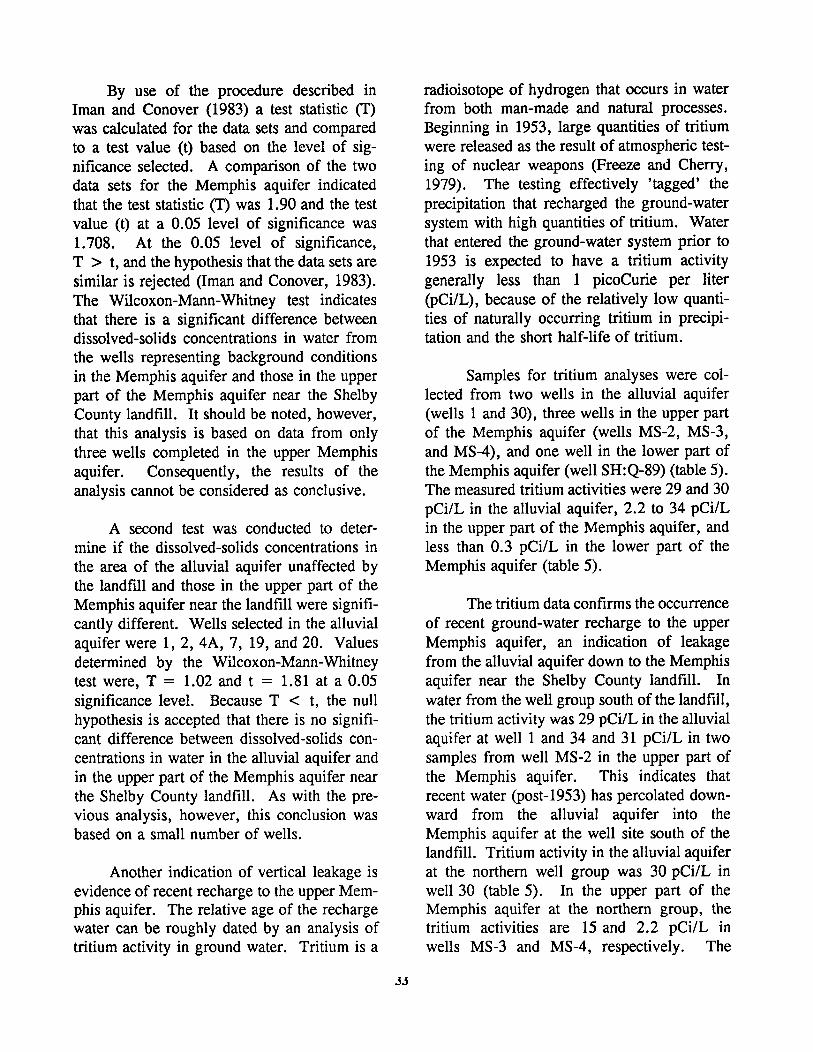
By use of the procedure described in Iman and Conover (1983) a test statistic (T) was calculated for the data sets and compared to a test value (t) based on the level of sig- nificance selected. A comparison of the two data sets for the Memphis aquifer indicated that the test statistic (T) was 1.90 and the test value (t) at a 0.05 level of significance was 1.708. At the 0.05 level of significance, T > t, and the hypothesis that the data sets are similar is rejected (Iman and Conover, 1983). The Wilcoxon-Mann-Whitney test indicates that there is a significant difference between dissolved-solids concentrations in water from the wells representing background conditions in the Memphis aquifer and those in the upper part of the Memphis aquifer near the Shelby County landfill. It should be noted, however, that this analysis is based on data from only three wells completed in the upper Memphis aquifer. Consequently, the results of the analysis cannot be considered as conclusive.
A second test was conducted to deter- mine if the dissolved-solids concentrations in the area of the alluvial aquifer unaffected by the landfill and those in the upper part of the Memphis aquifer near the landfill were signifi- cantly different. Wells selected in the alluvial aquifer were 1, 2, 4A, 7, 19, and 20. Values determined by the Wilcoxon-Mann-Whitney test were, T = 1.02 and t = 1.81 at a 0.05 significance level. Because T C t, the null hypothesis is accepted that there is no signifi- cant difference between dissolved-solids con- centrations in water in the alluvial aquifer and in the upper part of the Memphis aquifer near the Shelby County landfill. As with the pre- vious analysis, however, this conclusion was based on a small number of wells.
Another indication of vertical leakage is evidence of recent recharge to the upper Mem- phis aquifer. The relative age of the recharge water can be roughly dated by an analysis of tritium activity in ground water. Tritium is a
radioisotope of hydrogen that occurs in water from both man-made and natural processes. Beginning in 1953, large quantities of tritium were released as the result of atmospheric test- ing of nuclear weapons (Freeze and Cherry, 1979). The testing effectively ‘tagged’ the precipitation that recharged the ground-water system with high quantities of tritium. Water that entered the ground-water system prior to 1953 is expected to have a tritium activity generally less than 1 picocurie per liter (pCi/L), because of the relatively low quanti- ties of naturally occurring tritium in precipi- tation and the short half-life of tritium.
Samples for tritium analyses were col- lected from two wells in the alluvial aquifer (wells 1 and 30), three wells in the upper part of the Memphis aquifer (wells MS-2, MS-3, and MS-4), and one well in the lower part of the Memphis aquifer (well SH:Q-89) (table 5). The measured tritium activities were 29 and 30 pCi/L in the alluvial aquifer, 2.2 to 34 pCi/L in the upper part of the Memphis aquifer, and less than 0.3 pCi/L in the lower part of the Memphis aquifer (table 5).
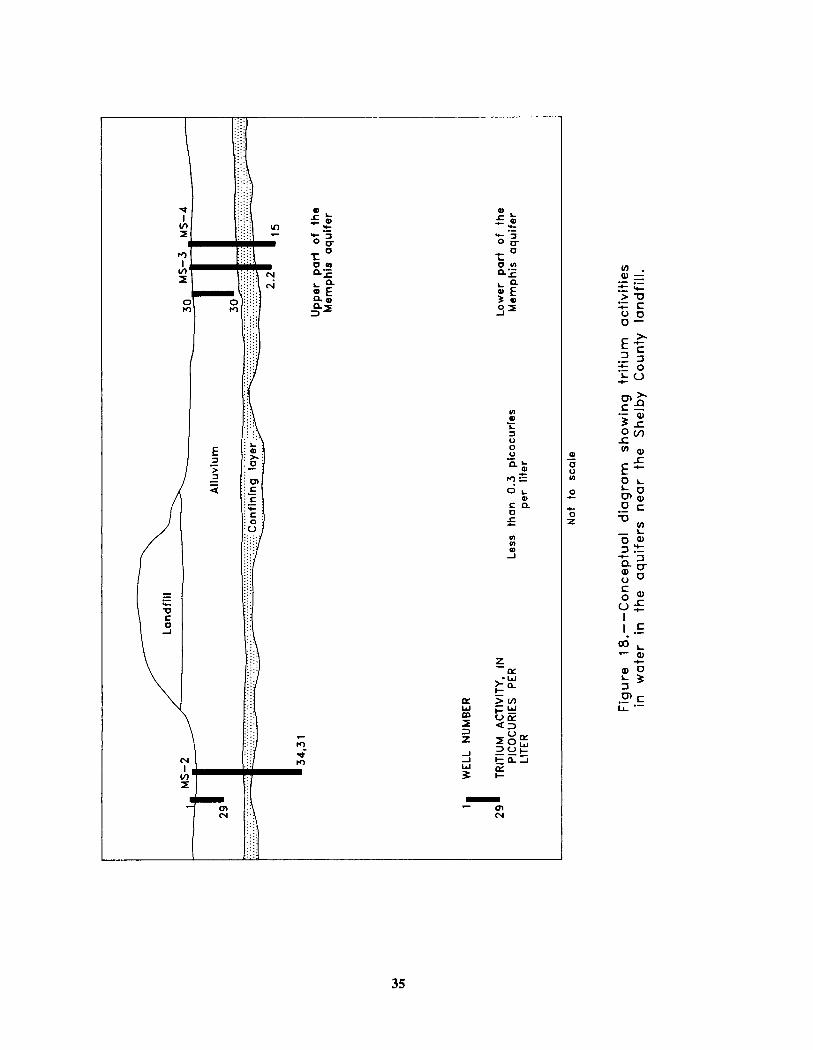
The tritium data confirms the occurrence of recent ground-water recharge to the upper Memphis aquifer, an indication of leakage from the alluvial aquifer down to the Memphis aquifer near the Shelby County landfill. In water from the well group south of the landfill, the tritium activity was 29 pCi/L in the alluvial aquifer at well 1 and 34 and 31 pCi/L in two samples from well MS-2 in the upper part of the Memphis aquifer. This indicates that recent water (post-1953) has percolated down- ward from the alluvial aquifer into the Memphis aquifer at the well site south of the landfill. Tritium activity in the alluvial aquifer at the northern well group was 30 pCi/L in well 30 (table 5). In the upper part of the Memphis aquifer at the northern group, the tritium activities are 15 and 2.2 pCi/L in wells MS-3 and MS-4, respectively. The
33
Table 5.-Tritium activity of water from wells completed in the alluvial and Memphis aquifers near the Shelby County landfill
well depth is feet below land surface; total tritium activities are in picoCuries per liter, pCi/L; --, project number not assigned]
Uell Tritiun, Well number Date depth total Aquifer
water from wells MS-3 and MS-4 appears to be a mixture of alluvial aquifer water that has migrated vertically downward and water in the Memphis aquifer. Water from well SH:Q-89 completed deeper in the Memphis aquifer had tritium activity less than 0.3 pCi/L. The low tritium activity in this water indicates the water in the well occurred as recharge prior to 1953 and is not affected by the vertical leakage of recent water. A conceptual diagram of the distribution of tritium activities at the Shelby County landfill is shown in figure 18.
LEACHATE MIGRATION
The migration of leachate from the landfill to the alluvial aquifer was determined from data collected from the shallow wells. This was an important element of the study because the potential for leakage from the alluvial aqui- fer to the Memphis aquifer had been demon- strated. The occurrence of leachate was docu- mented from analyses of water samples from wells in the alluvial aquifer that indicate high concentrations of dissolved solids, trace elements, and synthetic organic compounds. These results were as follows:
l Water samples from wells 26,27, 30, and 31 in areas affected by leachate migration (fig. 13, table 3), had dissolved-solids concentrations ranging from 340 to 932 mg/L. Other wells in unaffected areas had lower dissolved-solids con- centrations ranging from 47 to 354 mg/L.
0 Dissolved-chloride concentrations in sam- ples from some wells affected by leachate range from 7.5 to 91 mg/L. Chloride concentrations in other wells unaffected by leachate ranged from about 3 to about 9 mg/L.
0 Evidence showing leachate migration to the Memphis aquifer is not conclusive. A relatively high concentration of dissolved chloride (17 mg/L) in well MS-3 in the upper part of the Memphis aquifer may be due to the effect of leachate, but the data are not conclusive.
l Wells drilled into the Memphis aquifer on the south side of the landfill do not con- tain any chemical constituents associated with leachate migrations, but do show evidence of downward leakage from the alluvial aquifer, based on the tritium analyses.
34
i:j:: .:j:: :_:.
irt ,E
::: fij ::: :: ;I: . .
1 ;: . . ::. .:. ;;;i ii:: :: 1::
35
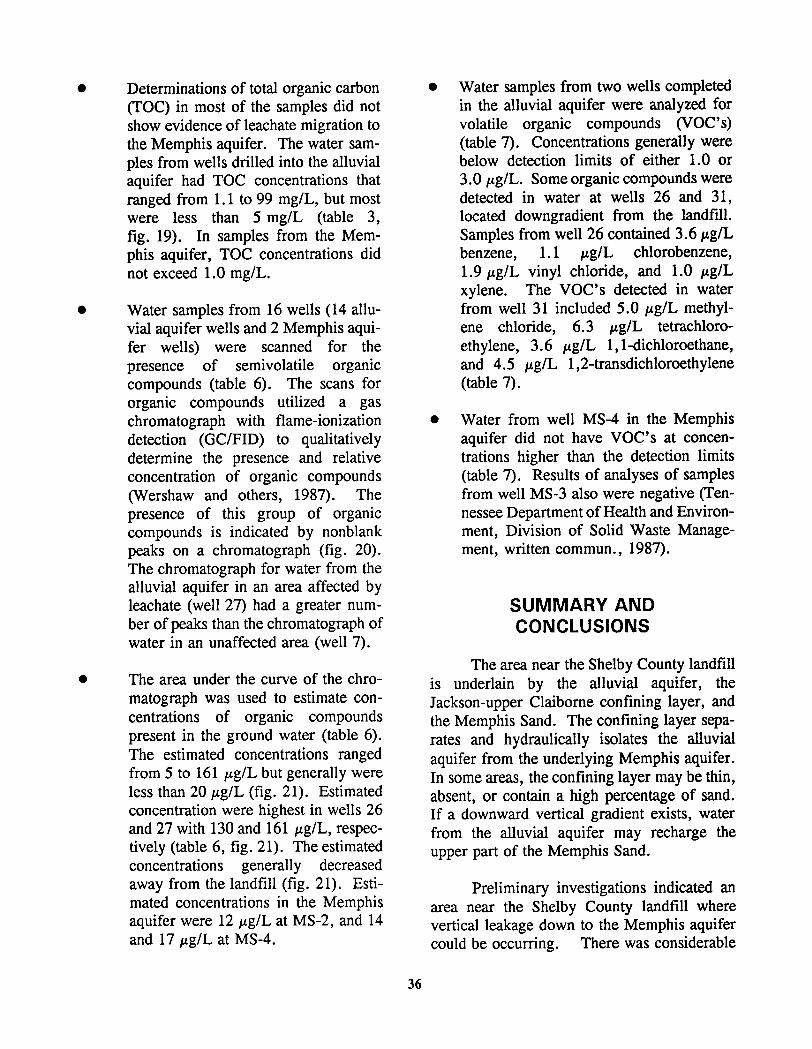
0 Determinations of total organic carbon (TOC) in most of the samples did not show evidence of leachate migration to the Memphis aquifer. The water sam- ples from wells drilled into the alluvial aquifer had TOC concentrations that ranged from 1.1 to 99 mg/L, but most were less than 5 mg/L (table 3, fig. 19). In samples from the Mem- phis aquifer, TOC concentrations did not exceed 1 .O mg/L.
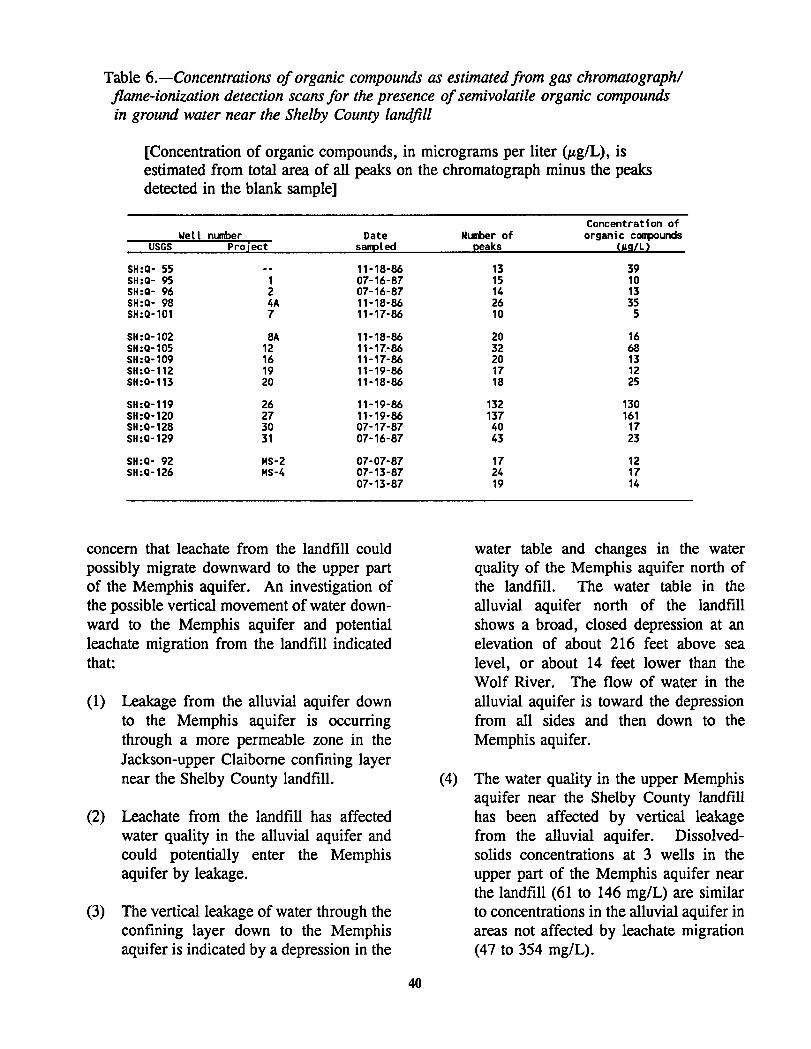
0 Water samples from 16 wells (14 allu- vial aquifer wells and 2 Memphis aqui- fer wells) were scanned for the presence of semivolatile organic compounds (table 6). The scans for organic compounds utilized a gas chromatograph with flame-ionization detection (GUFID) to qualitatively determine the presence and relative concentration of organic compounds (Wershaw and others, 1987). The presence of this group of organic compounds is indicated by nonblank peaks on a chromatograph (fig. 20). The chromatograph for water from the alluvial aquifer in an area affected by leachate (well 27) had a greater num- ber of peaks than the chromatograph of water in an unaffected area (well 7).
0 The area under the curve of the chro- matograph was used to estimate con- centrations of organic compounds present in the ground water (table 6). The estimated concentrations ranged from 5 to 161 pg/L but generally were less than 20 pg/L (fig. 21). Estimated concentration were highest in wells 26 and 27 with 130 and 161 FglL, respec- tively (table 6, fig. 21). The estimated concentrations generally decreased away from the landfill (fig. 21). Esti- mated concentrations in the Memphis aquifer were 12 pg/L at MS-2, and 14 and 17 pg/L at MS-4.
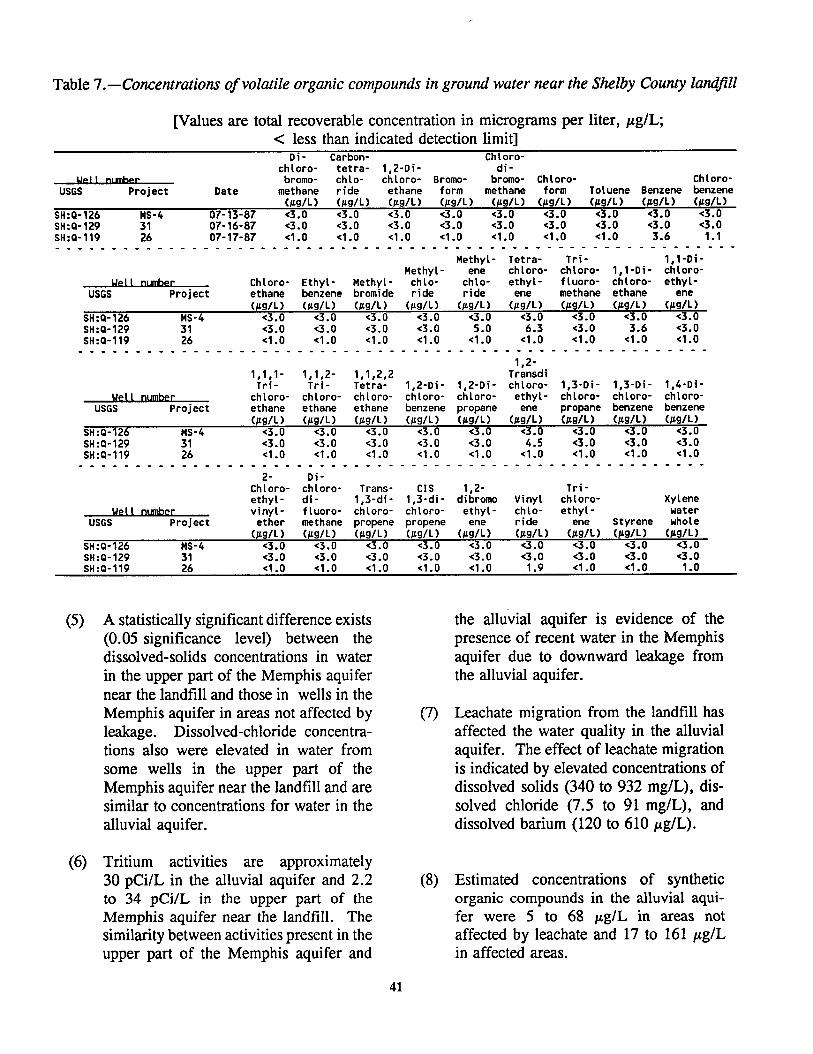
0 Water samples from two wells completed in the alluvial aquifer were analyzed for volatile organic compounds (VOC’s) (table 7). Concentrations generally were below detection limits of either 1.0 or 3.0 pg/L. Some organic compounds were detected in water at wells 26 and 31, located downgradient from the landfill. Samples from well 26 contained 3.6 pg/L benzene, 1.1 pg/L chlorobenzene, 1.9 FglL vinyl chloride, and 1.0 pg/L xylene. The VOC’s detected in water from well 3 1 included 5.0 pg/L methyl- ene chloride, 6.3 pg/L tetrachloro- ethylene, 3.6 FglL 1 , 1-dichloroethane, and 4.5 PglL 1,2-transdichloroethylene (table 7).
0 Water from well MS-4 in the Memphis aquifer did not have VOC’s at concen- trations higher than the detection limits (table 7). Results of analyses of samples from well MS-3 also were negative (Ten- nessee Department of Health and Environ- ment, Division of Solid Waste Manage- ment, written commun., 1987).
SUMMARY AND CONCLUSIONS
The area near the Shelby County landfill is underlain by the alluvial aquifer, the Jackson-upper Claiborne confining layer, and the Memphis Sand. The confining layer sepa- rates and hydraulically isolates the alluvial aquifer from the underlying Memphis aquifer. In some areas, the confining layer may be thin, absent, or contain a high percentage of sand. If a downward vertical gradient exists, water from the alluvial aquifer may recharge the upper part of the Memphis Sand.
Preliminary investigations indicated an area near the Shelby County landfill where vertical leakage down to the Memphis aquifer could be occurring. There was considerable
36
89051 89050’
I 35Oo9’ -
SHELBY COUNTY 1.7 PENAL FARM
0
Approximate area affected by leachate migration
4.000 FEET
O, 0 500 1,000 METERS
EXPLANATION
5 -- LINE OF EQUAL TOTAL ORGANIC CARBON CONCENTRATION-- Dashed where approximately located. Interval 5 milligrams per liter
3.2 0 WELL AND TOTAL ORGANIC CARBON CONCENTRATION, IN
MILLIGRAMS PER LITER--Value represents total organic carbon concentration in samples collected in November 1986 or July 1987
Figure 19.-- Distribution of total organic carbon concentrations in water in the alluvial aquifer.
37
sb ss bs bs S S b
sb ss bs bs b
Well 27
RETENTION TIME b
EXPLANATION
S STANDARD OR SURROGATE COMPOUND ADDED BY LABORATORY PRIOR TO ANALYSIS
b COMPOUND ALSO DETECTED IN BLANK SAMPLE
Figure 20. --Gas chromatographs showing response of gas chromatograph/ flame-ionization detection scans of water from wells 7 and 27.
38
!39O51' 8g050'
I 35OO9' -
SHELBY COUNTY 13 PENAL FARM
0
-- Approximate area affected \ _ by leachate migration
4.000 FEET
OI 0 500 1 .OOO METERS
EXPLANATION
l: WELL AND ESTIMATED CONCENTRATION OF ORGANIC COMPOUNDS, IN MICROGRAMS PER LITER, FOR WATER FROM THE ALLUVIAL AQUIFER--Samples collected in November 1986 and July 1987
12 WELL AND ESTIMATED CONCENTRATION OF ORGANIC 0 COMPOUNDS, IN MICROGRAMS PER LITER, FOR
WATER FROM THE MEMPHIS AQUIFER--Samples collected in November 1986 or July 1987
Figure 21. --Estimated concentrations of organic compounds as determined by gas chromatograph/flame-ionization detection scans of ground water near the Shelby County landfill.
39
Table 6.-Concentrations of organic compounds as estimated j?om gas chromatograph/ flame-ionization detection scans for the presence of semivolatile organic compounds in ground water near the Shelby County landfill
[Concentration of organic compounds, in micrograms per liter &g/L), is estimated from total area of all peaks on the chromatograph minus the peaks detected in the blank sample]
Concentration of Well nunber Date Nmberof organic conpounds
concern that leachate from the landfill could possibly migrate downward to the upper part of the Memphis aquifer. An investigation of the possible vertical movement of water down- ward to the Memphis aquifer and potential leachate migration from the landfill indicated that:
(1) Leakage from the alluvial aquifer down to the Memphis aquifer is occurring through a more permeable zone in the Jackson-upper Claibome confining layer near the Shelby County landfill.
(2) Leachate from the landfill has affected water quality in the alluvial aquifer and could potentially enter the Memphis aquifer by leakage.
(3) The vertical leakage of water through the confining layer down to the Memphis aquifer is indicated by a depression in the
40
water table and changes in the water quality of the Memphis aquifer north of the landfill. The water table in the alluvial aquifer north of the landfill shows a broad, closed depression at an elevation of about 216 feet above sea level, or about 14 feet lower than the Wolf River. The flow of water in the alluvial aquifer is toward the depression from all sides and then down to the Memphis aquifer.
(4) The water quality in the upper Memphis aquifer near the Shelby County landfill has been affected by vertical leakage from the alluvial aquifer. Dissolved- solids concentrations at 3 wells in the upper part of the Memphis aquifer near the landfill (61 to 146 mg/L) are similar to concentrations in the alluvial aquifer in areas not affected by leachate migration (47 to 354 mg/L).
Table 7.-Concentrations of volatile organic compounds in ground water near the Shelby County landfill
[Values are total recoverable concentration in micrograms per liter, pg/L; C less than indicated detection limit]
Di- Carbon- Chloro- chloro- tetra- 1,2-Di- di-
U.-II Q&&y- bromo- chlo- chloro- Bromo- bromo- Chloro- Chloro- USGS Project Date methane ride ethane form methane form Toluene Benzene benzene
(5) A statistically significant difference exists (0.05 significance level) between the dissolved-solids concentrations in water in the upper part of the Memphis aquifer near the landfill and those in wells in the Memphis aquifer in areas not affected by leakage. Dissolved-chloride concentra- tions also were elevated in water from some wells in the upper part of the Memphis aquifer near the landfill and are similar to concentrations for water in the alluvial aquifer.
(6) Tritium activities are approximately 30 pCi/L in the alluvial aquifer and 2.2 to 34 pCi/L in the upper part of the Memphis aquifer near the landfill. The similarity between activities present in the upper part of the Memphis aquifer and
41
the alluvial aquifer is evidence of the presence of recent water in the Memphis aquifer due to downward leakage from the alluvial aquifer.
(7) Leachate migration from the landfill has affected the water quality in the alluvial aquifer. The effect of leachate migration is indicated by elevated concentrations of dissolved solids (340 to 932 mg/L), dis- solved chloride (7.5 to 9 1 mg/L), and dissolved barium (120 to 610 PglL).
(8) Estimated concentrations of synthetic organic compounds in the alluvial aqui- fer were 5 to 68 FglL in areas not affected by leachate and 17 to 161 pg/L in affected areas.
(9) The quality of water in the Memphis aquifer near the landfill has been affected by water from the alluvial aquifer. Water-quality data from this investiga- tion, however, do not conclusively indicate the migration of leachate down
to the Memphis aquifer from the landfill. The occurrence of dissolved chloride at a concentration of 17 mg/L in samples of water from a well drilled into the Mem- phis aquifer could be the result of leachate migration.
SELECTED REFERENCES
Bradley, M.W., 1988, Construction, geologic and ground-water data for observation wells near the Shelby County landfill, Memphis, Tennessee: U.S. Geological Survey Open-FileReport 88-486, 32 p.
Brahana, J.V., Parks, W.S., andGaydos, M.W., 1987, Quality of water from freshwater aquifers and principal well fields in the Memphis area, Tennessee: U.S. Geological Survey Water- Resources Investigations Report 87-4052, 22 p.
Brown, Eugene, Skougstad, M.W., and Fishman, M.J., 1970, Methods for collection and analysis of water samples for dissolved mineral and gases: U.S. Geological Survey Techniques of Water Resources Investigations, Book 5, Chapter Al, 160 p.
Claassen, H.L., 1982, Guidelines and techniques for ob- taining water samples that accurately represent the water chemistry of an aquifer: U.S. Geological Survey Open-File Report 82-1024, 49 p.
Cushing, E.M., Boswell, E.H., and Hosman, R.L., 1964, General geology of the Mississippi embayment: U.S. Geological Survey Pro- fessional Paper 448-B, 28 p.
Freeze, R.A., and Cherry, J.A., 1979, Groundwater: Englewood Cliffs, Prentice Hall, Inc., 604 p.
Graham, D-D., 1982, Effects of urban development on the aquifers in the Memphis area, Tennessee: U.S. Geological Survey Water-Resources Inves- tigations Report 87-4024, 20 p.
Graham, D.D., and Parks, W.S., 1986, Potential for leakage among principal aquifers in the Memphis
area, Tennessee: U.S. Geological Survey Water-Resources Investigations Report 854295, 46 p.
Hem, J.D., 1985, Study and interpretation of the chem- ical characteristics of natural water (3rd ed.): U.S. Geological Survey Water-Supply Paper 2254, 263 p.
Iman, R.L., and Conover, W.J., 1983, A modem approach to statistics: New York, John Wiley and Sons, Inc., 497 p.
McMaster, B.W., and Parks W.S., 1988, Concentra- tions of selected trace constituents and synthetic organic compounds in the water-table aquifers in the Memphis area, Tennessee: U.S. Geological Survey Open-File Report 88-485, 23 p.
Tennessee Department of Health and Environment, 1988, Public water systems, in Rules of Tennessee Department of Health and Environment-Bureau of Environment, Division of Water Supply: Tennessee Department of Health and Environment, Bureau of Environment, Chapter 1200-5-1, 61 p.
U.S. Geological Survey, 1980-1989, Water resources data, Tennessee, water years 1979-1988: U.S. Geological Survey Water-Data Reports TN-79-1 to TN-88-l (published ammally).
Wershaw, R-L., Fishman, M-J., Grabbe, R.R., and Lowe, L.E., editors, 1987, Methods for the determination of organic substances in water and fluvial sediments: U.S. Geological Survey, Techniques of Water Resources Investigations, Book 5, Chapter A3, 80 p.