Ranchi Khunti Ramgarh Bokaro Gumla SIMDEGA West Singhbhum Saraikela Kharsawan Lohardaga Koderma Giridih Deoghar Jamtara Dumka Pakur Sahibganj Godda Dhanbad East Singhbhum Garhwa Latehar Palamau Chatra ORISSA WEST BENGAL BIHAR U.P. CHHATTISGARH Hazaribagh भ ू जल स ू चना प ु तिका देवघर जला, झारखंड Ground Water Information Booklet Deoghar District, Jharkhand State केरीय भ ू मिजल बोड जल संसाधन िंालय (भारि सरकार) राय एकक कायाालय, राची मय-प ू वी े पटना Central Ground water Board Ministry of Water Resources (Govt. of India) State Unit Office,Ranchi Mid-Eastern Region Patna मसतंबर 2013 September 2013
Transcript
Ranchi
Khunti
Ramgarh
Bokaro
Gumla
SIMDEGA
West
Singhbhum
Saraikela
Kharsawan
Lohardaga
Koderma
GiridihDeoghar
Jamtara
Dumka
Pakur
Sahibganj
Godda
Dhanbad
East
Singhbhum
Garhwa
Latehar
PalamauChatra
ORISSA
WESTBENGAL
BIHAR
U.P
.
CH
HA
TTISG
AR
H
Hazaribagh
भूजल सूचना पुस्तिका देवघर स्जला, झारखंड
Ground Water Information Booklet
Deoghar District, Jharkhand State
केन्द्रीय भमूिजल बोर्ड जल संसाधन िंत्रालय (भारि सरकार) राज्य एकक कायाालय, रााँची मध्य-पूवी क्षेत्र पटना
Central Ground water Board Ministry of Water Resources
(Govt. of India) State Unit Office,Ranchi
Mid-Eastern Region Patna
मसतंबर 2013
September 2013
भूजल सूचना पुस्तिका देवघर स्जला, झारखंड
Ground Water Information Booklet
Deoghar District, Jharkhand State
Updated By
के रिेश रेड्र्ी (वैज्ञाननक ख )
K. RAMESH REDDY
(Scientist B)
राज्य एकक कायाालय, रााँची मध्य-पूवी क्षेत्र,पटना
State Unit Office, Ranchi
Mid Eastern Region, Patna
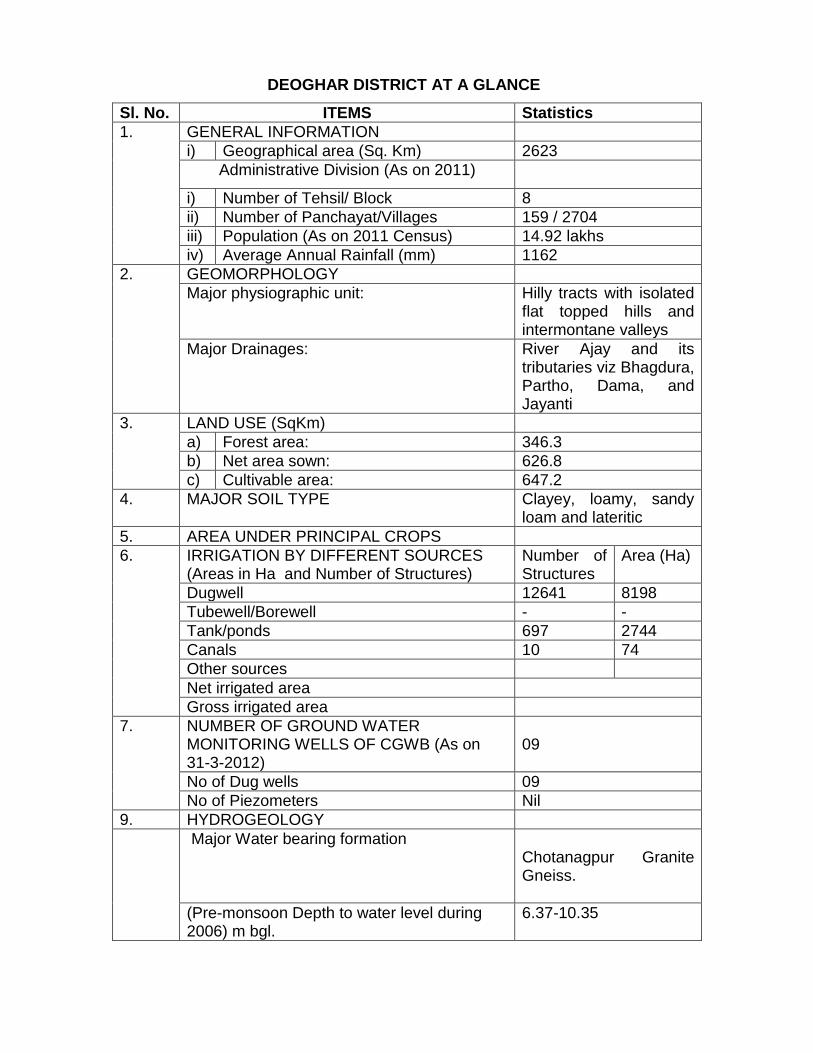
DEOGHAR DISTRICT AT A GLANCE
Sl. No. ITEMS Statistics
1. GENERAL INFORMATION
i) Geographical area (Sq. Km) 2623
Administrative Division (As on 2011)
i) Number of Tehsil/ Block 8
ii) Number of Panchayat/Villages 159 / 2704
iii) Population (As on 2011 Census) 14.92 lakhs
iv) Average Annual Rainfall (mm) 1162
2. GEOMORPHOLOGY
Major physiographic unit:
Hilly tracts with isolated flat topped hills and intermontane valleys
Major Drainages:
River Ajay and its tributaries viz Bhagdura, Partho, Dama, and Jayanti
3. LAND USE (SqKm)
a) Forest area: 346.3
b) Net area sown: 626.8
c) Cultivable area: 647.2
4. MAJOR SOIL TYPE Clayey, loamy, sandy loam and lateritic
5. AREA UNDER PRINCIPAL CROPS
6. IRRIGATION BY DIFFERENT SOURCES (Areas in Ha and Number of Structures)
Number of Structures
Area (Ha)
Dugwell 12641 8198
Tubewell/Borewell - -
Tank/ponds 697 2744
Canals 10 74
Other sources
Net irrigated area
Gross irrigated area
7. NUMBER OF GROUND WATER MONITORING WELLS OF CGWB (As on 31-3-2012)
09
No of Dug wells 09
No of Piezometers Nil
9. HYDROGEOLOGY
Major Water bearing formation
Chotanagpur Granite Gneiss.
(Pre-monsoon Depth to water level during 2006) m bgl.
6.37-10.35
(Post-monsoon Depth to water level during 2006) m bgl.
2.55-5.47
Long term water level trend in 10 yrs (1997-2006) in m/yr
--
10. GROUND WATER EXPLORATION BY CGWB (As on 31-12-2012)
No of wells drilled (EW, OW, PZ, SH, Total) 21 (EW), 08 (OW)
Depth range (m)
Storativity (S) 2.2*10-4 to 1.0*10-5
Transmissivity (m2/day) 22-128
11. GROUND WATER QUALITY Potable
Presence of Chemical constituents more than permissible limit (e.g EC, F, As, Fe)
Fe
Type of water
12. DYNAMIC GROUND WATER RESOURCES(2009)- in ham
Annual Replenishable Ground water Resources
23960
Net Annual Ground Water Draft 7155
Projected Demand for Domestic and industrial Uses up to 2025
2605
Stage of Ground Water Development 33.18%
13. AWARENESS AND TRAINING ACTIVITY
Mass Awareness Programmes organized 01
Date: 13/3/06
Place: Town Hall, Deoghar
No of participant :
Water Management Training Programmes organized
-
Date -
Place -
No of participant -
14. EFFORT OF ARTIFICIAL RECHARGE & RAIN WATER HARVESTING
Project completed by CGWB(No & Amount spent)
-
Project under technical guidance of CGWB (Numbers)
-
15. GROUND WATER CONTROL AND REGULATION
Number of OE Blocks Nil
Number of Critical Blocks Nil
Number of Blocks notified Nil
18 MAJOR GROUND WATER PROBLEMS AND ISSUES
Iron concentration above permissible limit (1 mg/l) in Palajori and Sarawan block
DEOGHAR DISTRICT INFORMATION BOOKLET
1.0 INTRODUCTION
1.1 Administrative Details
Deoghar district spreading over an area of 2623 sq.km, lies between North latitudes
24° 02´ 00´´ : 24° 40´ 00´´ and East longitudes 86° 20´ 00´´ : 87° 05´ 00´´, with its
district headquarter at Deoghar. The district is divided into 8 blocks namely i) Deoghar
ii)Mohanpur iii)Sarwan iv)Devipur v)Madhupur vi)Karaon vii)Sarath viii)Palajhori. The
district is bounded in the north by Jamui and Banka districts of Bihar, in the south and
east by Dumka, in the west by Giridih. The total population of Deoghar district as per the
2011 census is 10,42,886 persons.
TABLE 1: POPULATION OF DEOGHAR DISTRICT (2011)
Sr. No.
Block Total Rural population
Urban population
Male Female
1 Deoghar 346089 142966 203123 182595 163494
2 Mohanpur 175845 175845 0 91477 84368
3 Sarwan 90757 90757 0 47269 43488
4 Devipur 107015 107015 0 55679 51336
5 Madhupur 190748 135510 55238 98716 92032
6 Karaon 88251 88251 0 45317 42934
7 Sarath 169238 169238 0 87698 81540
8 Palajori 161281 161281 0 82593 78688
Total 1492073 1233712 258361 775022 717051
1.2 Drainage
The river Ajay and its tributaries control the drainage of the area. River Ajay originates
from the hills of the Chotanagpur plateau at an elevation of 346.23m amsl. Prominent
among the tributaries are the Bhagdura, Partho, Dama, and Jayanti. These apart, there are
several seasonal streams and nallas which ultimately join the river Ajay and its
tributaries.(Fig -1)
Fig-1, Index map of Deoghar District
1.3 Studies/Activities carried out by CGWB
Central Ground Water Board has carried out hydrogeological surveys and ground water
exploration in the district. Ground water regime monitoring is carried out 4 times
annually from 9 HNS wells in the district. Water samples are collected during the month
of May to study the changes in water quality along with monitoring of pre-monsoon
water level.
2.0 HYDROMETEROLOGY
The climate of the district varies from sub-tropical to sub-humid. May is the hottest
month with an average temperature of 35.8°C and December is the coldest month with
an average temperature of 12.5°C. August and September are the wettest months.
Average annual rainfall of the district is 1162 mm of which about 88% is received
between June and October.
3.0 GEOMORPHOLOGY AND SOIL TYPES
In terms of the physiography, the district shows the following three broad categories of
landforms
i) Mountainous tracts of Chotanagpur granitic gneisses with isolated flat topped
hills, steeper escarpments and intermontane valleys
ii) Plateaus consisting of weathered granite gneiss and Gondwanas
iii) Alluvium found in the immediate vicinity of major rivers as basin fill
deposits.
In general the area shows a general slope from north to south. The land surface is rugged
and uneven ranging from flat lands to almost steep slopes. However, in general the slopes
are gradual and these have been worked into terraced paddy fields at several places.
The surface lithology has exercised profound impact on the development of soil types.
The district is characterized by a wide variety of soils, which can be classified as clayey,
loamy, sandy loam and lateritic. Sandy loams to loamy sands are common in uplands
whereas loam to sandy loam is common in lowlands.
4.0 GROUND WATER SCENARIO
4.1 Hydrogeology
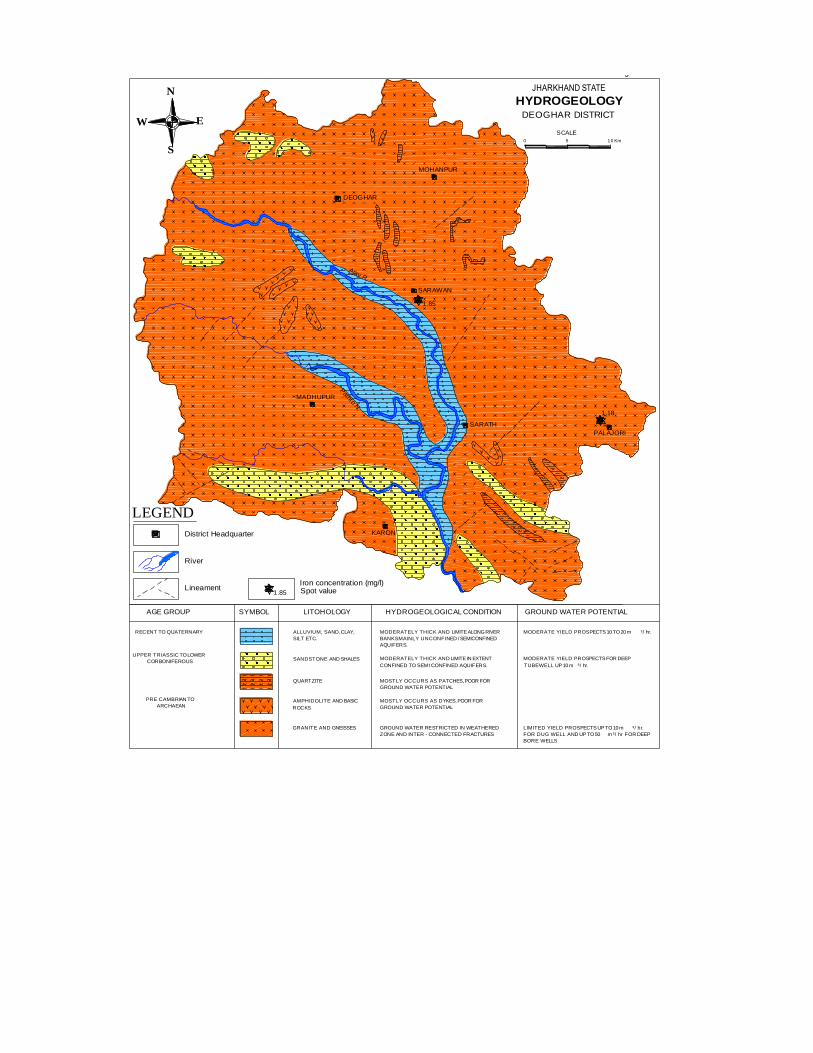
Deoghar district is largely covered by Chotanagpur granites and gneissic complex
associated with some metasediments and metabasic rocks. The Gondwanas have been
developed in tectonic basin fill deposits and are resting on Archaean basements. The
Gondwanas mainly consist of sandstones, shales, coal seams and are exposed in Karon
and Madhupur blocks of the district. Alluvium occurring along the river channels and
adjoining areas and are mainly composed of fine to coarse sand and clays. Laterites occur
in isolated patches. About 70% of the district area is underlain by hard and compact
granitic rocks, known as Chotanagpur granite gneiss. Weathering, fracturing and jointing
have introduced secondary porosities in these hard rocks and these govern the occurrence
and movement of groundwater in these rocks. In these formations groundwater occurs
under unconfined condition in the weathered mantle and under semi-confined to confined
conditions in the fractures underneath. Groundwater also occurs under unconfined
condition in the narrow stretches of alluvium along stream courses; however,
groundwater potentiality in the alluvium is not promising.(Fig-2)
RECENT TO QUATERNARY
UPPER TRIASSIC TO LOWER
CORBONIFEROUS
PRE CAMBRIAN TO
ARCHAEAN
ALLUVIUM, SAND, CLAY,
SILT ETC.
SANDSTONE AND SHALES
QUARTZITE
AMPHIDOLITE AND BASIC
ROCKS
GRANITE AND GNEISSES
MODERATELY THICK AND LIMITE ALONG RIVER
BANKSMAINLY UNCONFINED / SEMICONFINED
AQUIFERS.
MODERATELY THICK AND LIMITE IN EXTENT
CONFINED TO SEMI CONFINED AQUIFERS.
MOSTLY OCCURS AS PATCHES, POOR FOR
GROUND WATER POTENTIAL
MOSTLY OCCURS AS DYKES, POOR FOR
GROUND WATER POTENTIAL
GROUND WATER RESTRICTED IN WEATHERED
ZONE AND INTER - CONNECTED FRACTURES
MODERATE YIELD PROSPECTS 10 TO 20 m ³/ hr.
MODERATE YIELD PROSPECTS FOR DEEP
TUBEWELL UP 10 m ³/ hr.
LIMITED YIELD PROSPECTS UP TO 10 m ³/ hr.
FOR DUG WELL AND UP TO 50 m ³/ hr FOR DEEP
BORE WELLS
AGE GROUP LITOHOLOGY HYDROGEOLOGICAL CONDITION GROUND WATER POTENTIALSYMBOL
0 5 10 Km
DEOGHAR
MOHANPUR
SARAWAN
SARATH
PALAJORI
KARON
MADHUPUR
JHARKHAND STATE
HYDROGEOLOGYDEOGHAR DISTRICT
SCALE
Ajay R.
Pathro N
.
LEGEND
District Headquarter
River
Lineament
N
W
S
E
1.85
1.18
Iron concentration (mg/l)
1.85 Spot value
Figure - 5
4.1.1 Depth to Water level
During May 2011, the depth to water levels in HNS wells(Fig-1) tapping shallow aquifer
ranged from 5.63 to 12.00 mbgl. Depth to ground water levels during the post monsoon
(November 2011) varied between 2.61 mbgl and 12.00 m bgl. Categorization of depth to
water level of pre-monsoon period (May 2011) for HNS in Deoghar district is presented
below in table -1.Depth to water level map has been prepared and presented inFig-3.
Table-1 Categorization of depth to water level of pre-monsoon period (May 2011)
No. of
wells
measured
Depth to
water level (m
bgl)
0-2 (m) 2-5 (m) 5-10 (m) 10-20(m)
Min Max No. % No. % No. % No. %
8 5.63 12.00 0 0 0 0 6 75 2 25
Fig-3- Pre Monsoon Depth to Water Level Map
Categorization of depth to water level of post-monsoon period (November 2011) for HNS
in Deoghar district is presented below in table- 2. Depth to water level map has been
prepared and presented in Fig -4.
Table-2 Categorization of depth to water level of post-monsoon period
No. of
wells
measured
Depth to
water level
(m bgl)
0-2 (m) 2-5 (m) 5-10 (m) 10-20(m)
Min Max No. % No. % No. % No. %
7 2.61 12.00 0 0 5 71.4 1 14.3 1 14.3
Fig-4- Post Monsoon Depth to Water Level Map
4.1.2 Aquifer Parameters
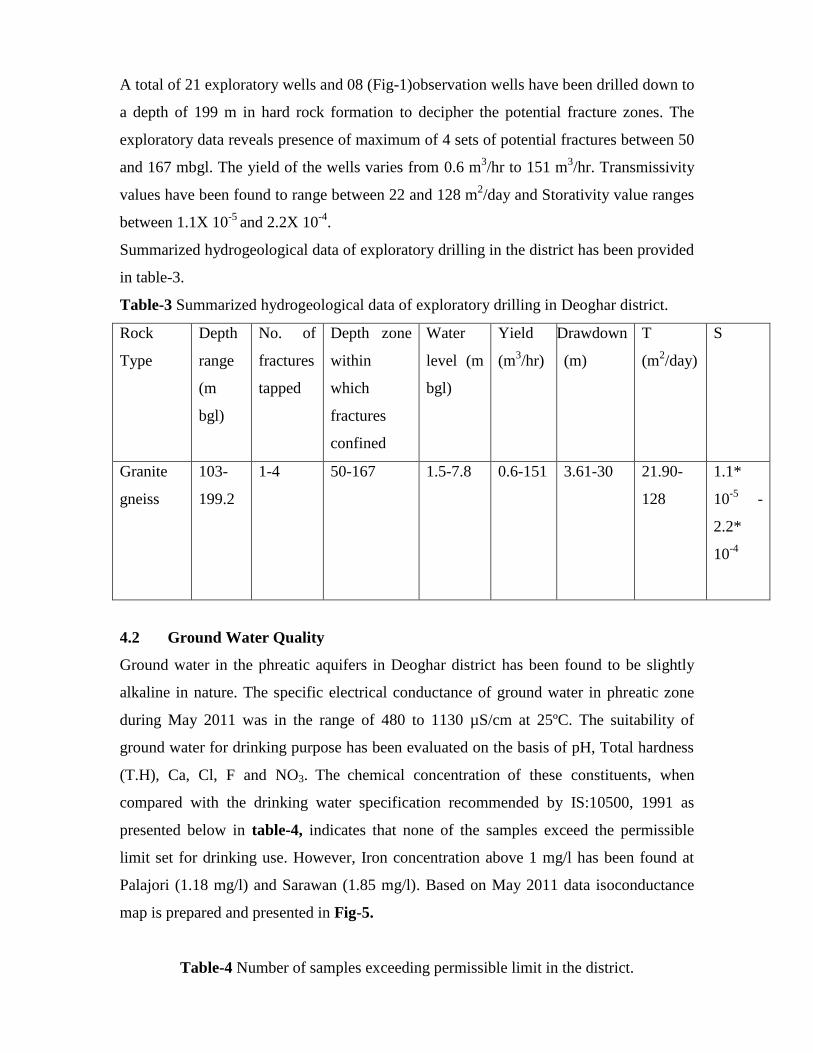
A total of 21 exploratory wells and 08 (Fig-1)observation wells have been drilled down to
a depth of 199 m in hard rock formation to decipher the potential fracture zones. The
exploratory data reveals presence of maximum of 4 sets of potential fractures between 50
and 167 mbgl. The yield of the wells varies from 0.6 m3/hr to 151 m
3/hr. Transmissivity
values have been found to range between 22 and 128 m2/day and Storativity value ranges
between 1.1X 10⁻⁵
and 2.2X 10⁻⁴
.
Summarized hydrogeological data of exploratory drilling in the district has been provided
in table-3.
Table-3 Summarized hydrogeological data of exploratory drilling in Deoghar district.
Rock
Type
Depth
range
(m
bgl)
No. of
fractures
tapped
Depth zone
within
which
fractures
confined
Water
level (m
bgl)
Yield
(m3/hr)
Drawdown
(m)
T
(m2/day)
S
Granite
gneiss
103-
199.2
1-4 50-167 1.5-7.8 0.6-151 3.61-30 21.90-
128
1.1*
10-5
-
2.2*
10-4
4.2 Ground Water Quality
Ground water in the phreatic aquifers in Deoghar district has been found to be slightly
alkaline in nature. The specific electrical conductance of ground water in phreatic zone
during May 2011 was in the range of 480 to 1130 µS/cm at 25ºC. The suitability of
ground water for drinking purpose has been evaluated on the basis of pH, Total hardness
(T.H), Ca, Cl, F and NO3. The chemical concentration of these constituents, when
compared with the drinking water specification recommended by IS:10500, 1991 as
presented below in table-4, indicates that none of the samples exceed the permissible
limit set for drinking use. However, Iron concentration above 1 mg/l has been found at
Palajori (1.18 mg/l) and Sarawan (1.85 mg/l). Based on May 2011 data isoconductance
map is prepared and presented in Fig-5.
Table-4 Number of samples exceeding permissible limit in the district.
Quality IS:10500, 1991 No. of samples in
the district
exceeding
permissible limit
Desirable limit Permissible limit
pH 6.5-8.5 No relaxation 0
T.H 300 600 0
Ca 75 200 0
Cl 250 1000 0
F 1.0 1.5 0
NO3 45 100 0
Fig-5- Isoconductance map of Deoghar district
4.2.1 Status of Ground Water Development
In the rural areas of the district, the entire water supply is dependent on ground water.
Ground water development is mainly through dug wells and hand pumps. In general dug
wells are of 2 m diameter and the depth ranges between 8 and 15 m depending on the
thickness of the weathered zone, tapping the shallow aquifer in the weathered zone and
uppermost slice of the basement. Large numbers of dug wells used for drinking purpose
are under private ownership for which there is no reliable data. Over the years Mark II/
Mark III hand pumps are being installed in large numbers for ground water development.
These hand pumps have the two major advantages i.e. i) Less susceptible to
contamination from surface sources and ii) Tap fractures between 20-60m depth which
have been found to be less affected by seasonal water level fluctuation and thus have
lesser chances of failure even during extreme summer. In rural areas of the district,
PHED has drilled 13515 wells fitted with hand pumps, out of which 10906 nos. are under
working condition at present.
In the urban areas ground water plays a supplementary role in water supply sector, as the
major volume of supply being made from dams, reservoirs or weirs across rivers or
streams. No authentic data is available for the existing number of ground water structures
catering to urban water supply. For Deoghar urban area, the dependence on ground water
for drinking purpose has been considered as 25%.
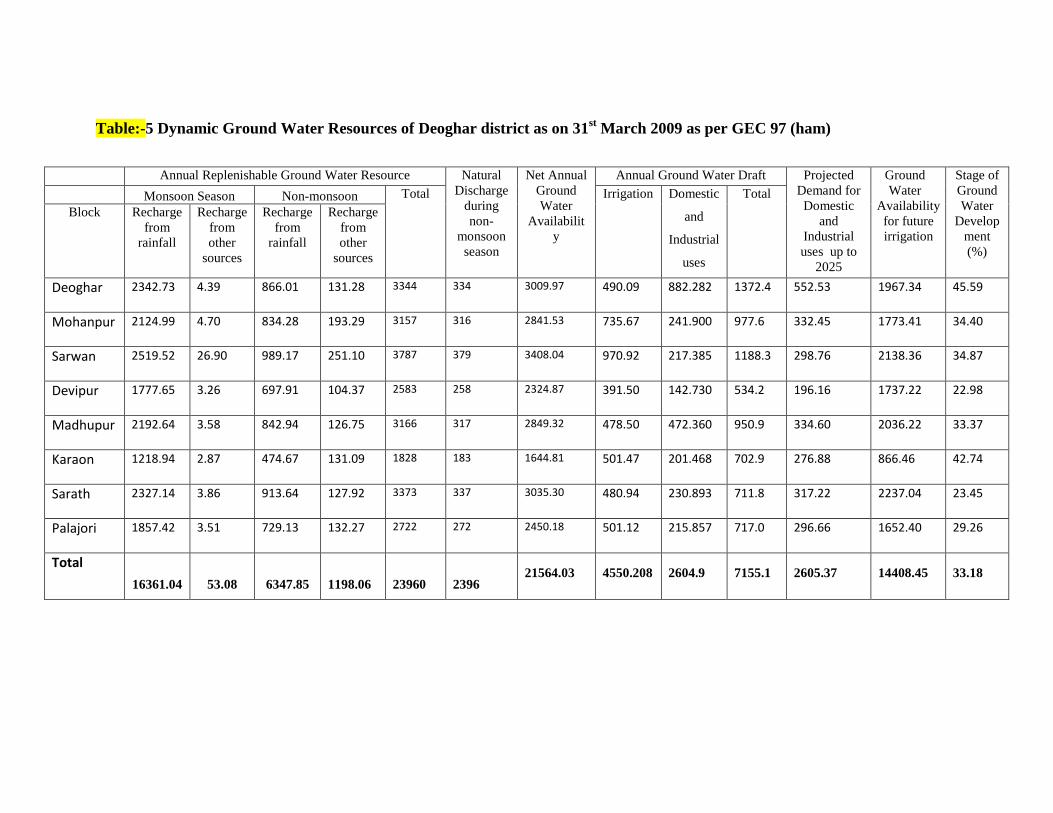
As per the latest ground water resource estimation carried out following GEC 97
methodology, the overall stage of ground water development in Deoghar district(Fig-6
&7) is 33.18% indicating sufficient scope of future development. The ground water
resource of Deoghar district is shown in the table-5 below-
Table:-5 Dynamic Ground Water Resources of Deoghar district as on 31st March 2009 as per GEC 97 (ham)
Annual Replenishable Ground Water Resource Natural
Discharge
during
non-
monsoon
season
Net Annual
Ground
Water
Availabilit
y
Annual Ground Water Draft Projected
Demand for
Domestic
and
Industrial
uses up to
2025
Ground
Water
Availability
for future
irrigation
Stage of
Ground
Water
Develop
ment
(%)
Monsoon Season Non-monsoon Total Irrigation Domestic