78
TEXAS W.t4TER DEVELOPMENT BOARD Report 136 GROUND- WATER RESOURCES OF MONTGOMERY COUNT'Y, TEXAS NOVEMBER 1971
TEXASW.t4TERDEVELOPMENTBOARD
Report 136
GROUND-WATER RESOURCES OFMONTGOMERY COUNT'Y, TEXAS
NOVEMBER 1971

TEXAS WATER DEVELOPMENT BOARD
REPORT 136
GROUND-WATER RESOURCES OF
MONTGOMERY COUNTY, TEXAS
By
Barney P. PopkinUnited States Geological Survey
Prepared by the U.S. Geological Surveyin cooperation with the
Texas Water Development BoardMontgomery County Commissioners Court
San Jacinto River Authorityand the
City of Conroe
November 1971

TEXAS WATER DEVELOPMENT BOARD
W. E. Tinsley, ChairmanRobert B. GilmoreMilton T. Potts
Marvin Shurbet, Vice ChairmanJohn H. McCoyCarl Illig
Harry P. Burleigh, Executive Director
Authorization for use or reproduction of any material contained in thispublication, i.e., not obtained from other sources, is freely granted without thenecessity of securing permission therefor. The Board would appreciateacknowledgement of the source of original material so utilized.
Published and distributedby the
Texas Water Development BoardPost Office Box 13087Austin, Texas 78711
ii

TABLE OF CONTENTS
Page
ABSTRACT , .
INTRODUCTION 3
Location and Extent of the Area . . . . . . . . . . . . . . . . . . . . . . . . . . . . . . . . . . . . . . . . . . . . . . 3
Purpose and Scope of the Investigation . . . . . . . . . . . . . . . . . . . . . . . . . . . . . . . . . . . . . . . . . . 3
Previous Investigations 3
Methods of Investigation . . . . . . . . . . . . . . . . . . . . . . . . . . . . . . . . . . . . . . . . . . . . . . . . 4
Well-Numbering System . . . . . . . . . . . . . . . . . . . . . . . . . . . . . . . . . . . . . . . . . . . . . . . . . . . . 4
Acknowledgments 4
Population and Economy of the Area. . . . . . . . . . . . . . . . . . . . . . . . . . . . . . . . . . . . . . . . . . . 4
Physiography and Drainage 8
Climate 8
GROUND-WATER HYDROLOGY 9
General Geology 9
Source and Occurrence of Ground Water 9
Hydrologic Units 11
Catahoula Sandstone. . . . . . . . . . . . . . . . . . . . . . . . . . . . . . . . . . . . . . . . . . . . . . . . . . 11
Lower Part of the Jasper Aquifer. . . . . . . . . . . . . . . . . . . . . . . . . . . . . . . . . . . . . . . . . . 11
Upper Part of the Jasper Aquifer. . . . . . . . . . . . . . . . . . . . . . . . . . . . . . . . . . . . . . . . . . 15
Burkeville Aquiclude. . . . . . . . . . . . . . . . . . . . . . . . . . . . . . . . . . . . . . . . . . . . . . . . . . 15
Evangeline Aquifer . . . . . . . . . . . . . . . . . . . . . . . . . . . . . . . . . . . . . . . . . . . . . . . . . . . 15
Chicot Aquifer . . . . . . . . . . . . . . . . . . . . . . . . . . . . . . . . . . . . . . . . . . . . . . . . . . . . . . 15
Hydraulic Properties of the Aquifers 15
Recharge, Movement, and Discharge of Ground Water .. .' . . . . . . . . . . . . . . . . . . . . . . . . . . . . . 30
CHEMICAL QUALITY OF GROUND WATER. . . . . . . . . . . . . . . . . . . . . . . . . . . . . . . . . . . . . . . . 30
Relationship of Quality of Water to Use . . . . . . . . . . . . . . . . . . . . . . . . . . . . . . . . . . . . . . . . . 32
Water Quality in the Hydrologic Units 34
iii
TABLE OF CONTENTS (Cont'd.)
Page
Catahoula Sandstone. . . . . . . . . . . . . . . . . . . . . . . . . . . . . . . . . . . . . . . . . . . . . . . . . . 34
Lower Part of the Jasper Aquifer. . . . . . . . . . . . . . . . . . . . . . . . . . . . . . . . . . . . . . . . . . 34
Upper Part of the Jasper Aquifer. . . . . . . . . . . . . . . . . . . . . . . . . . . . . . . . . . . . . . . . . . 34
Burkeville Aquiclude. . . . . . . . . . . . . . . . . . . . . . . . . . . . . . . . . . . . . . . . . . . . . . . . . . 34
Evangeline Aquifer . . . . . . . . . . . . . . . . . . . . . . . . . . . . . . . . . . . . . . . . . . . . . . . . . . . 34
Chicot Aquifer. . . . . . . . . . . . . . . . . . . . . . . . . . . . . . . . . . . . . . . . . . . . . . . . . . . . . . 35
Water-Quality Problems. . . . . . . . . . . . . . . . . . . . . . . . . . . . . . . . . . . . . . . . . . . . . . . . . . . . 35
Disposal of Oil-Field Brines 35
Protection of Water Quality in Oil-Field Drilling Operations . . . . . . . . . . . . . . . . . . . . . . . . . . . . 35
DEVELOPMENT OF GROUND WATER 35
Use of Ground Water 35
Water-Level Declines and Land-Surface Subsidence . . . . . . . . . . . . . . . . . . . . . . . . . . . . . . . . . . 37
Well Construction. . . . . . . . . . . . . . . . . . . . . . . . . . . . . . . . . . . . . . . . . . . . . . . . . . . . . . . . 38
AVAILABILITY OF GROUND WATER 49
NEED FOR FUTURE STUDIES. . . . . . . . . . . . . . . . . . . . . . . . . . . . . . . . . . . . . . . . . . . . . . . . . . 51
REFERENCES CITED 53
TABLES
1. Well Numbers Used in This Report and CorrespondingNumbers Used in Older Reports 5
2. Hydrogeologic Units Used in This Report and inReports on Adjacent Counties 10
3. Characteristics of the Hydrologic Units in Montgomery County 12
4. Summary of Aquifer Tests in the Upper Part of theJasper Aquifer in Montgomery and Adjacent Counties. . . . . . . . . . . . . . . . . . . . . . . . . . . . . . 31
5. Source and Significance of Dissolved-MineralConstituents and Properties of Water . . . . . . . . . . . . . . . . . . . . . . . . . . . . . . . . . . . . . . . . . 33
6. Estimated Use of Ground Water in Montgomery County, 1966 . . . . . . . . . . . . . . . . . . . . . . . . . . 38
7. Records of Wells in Montgomery and Adjacent Counties 55
8. Drillers' Logs of Wells in Montgomery and Adjacent Counties. . . . . . . . . . . . . . . . . . . . . . . . . . . 82
9. Water Levels in Wells in Montgomery and Adjacent Counties 107
iv
TABLE OF CONTENTS (Cont'd.)
Page
10. Chemical Analyses of Water From Wells in Montgomery and Adjacent Counties. . . . . . . . . . . . . . . 118
11. Field Analyses of Water From Wells in Montgomery and Adjacent Counties 125
FIGURES
1. Map Showing Location of Montgomery County . . . . . . . . . . . . . . . . . . . . . . . . . . . . . . . . . . . . 3
2. Graph Showing Annual Precipitation at Conroe, 1931-66 . . . . . . . . . . . . . . . . . . . . . . . . . . . . . . 8
3.
4.
Graph Showing Average Monthly Precipitation at Conroe, 1931-66
Graph Showing Average Monthly Temperature at Conroe, 1931-66
9
9
5. Photograph of Well TS-60-53-502, the Largest CapacityFlowing Well in Montgomery County . . . . . . . . . . . . . . . . . . . . . . . . . . . . . . . . . . . . . . . . . 11
6.
7.
Map Showing the Approximate Altitude of the Base of the Catahoula Sandstone
Map Showing the Approximate Altitude of the Base of the Lower Part of theJasper Aquifer and Base of the Sand Containing Fresh Water in the Aquifer
13
17
8. Map Showing the Approximate Altitude of the Base of the Lower Part of the Jasper Aquiferand Base of the Sand Containing Slightly Saline Water in the Aquifer. . . . . . . . . . . . . . . . . . . . 19
9. Map Showing the Approximate Altitude of the Base of the Upper Part of the Jasper Aquiferand Areas Where Slightly Saline Water is Present in the Aquifer. . . . . . . . . . . . . . . . . . . . . . . . 21
10. Map Showing the Approximate Altitude of the Base of the Burkeville Aquiclude .. . . . . . . . . . . . . 23
11. Map Showing the Approximate Altitude of the Base of the Evangeline Aquifer and theThickness of Fresh Water-Bearing Sands in the Chicot and Evangeline Aquifers 25
12.
13.
14.
Map Showing the Approximate Altitude of the Base of the Chicot Aquifer and theApproximate Altitude of Water Levels in Wells Screened in the Aquifer, 1966-67
Graph Showing Relation of Drawdown to Transmissibility and Distance
Photograph Showing a Comparison of New and Corroded Check Valves
27
29
36
15. Graph Showing Comparison Between Depth of Sands Containing Fresh to Slightly Saline Waterand the Depth of Protection Required in Oil Fields in Montgomery County 37
16. Hydrographs of Water Levels in Wells Tapping theUpper Part of the Jasper Aquifer at Conroe . . . . . . . . . . . . . . . . . . . . . . . . . . . . . . . . . . . . . 39
17. Map Showing the Approximate Altitude of Water Levels inWells Screened in the Upper Part of the Jasper Aquifer, 1966-67 41
18. Map Showing Approximate Altitude of Water Levels in WellsScreened in the Evangeline Aquifer, 1942-43 . . . . . . . . . . . . . . . . . . . . . . . . . . . . . . . . . . . . 43
19. Map Showing Approximate Altitude of Water Levels in WellsScreened in the Evangeline Aquifer, 1966-67 . . . . . . . . . . . . . . . . . . . . . . . . . . . . . . . . . . . . 45
v

TABLE OF CONTENTS (Cont'd.)
Page
20. Hydrograph of Selected Water Levels in a Well Tapping the Chicot Aquifer at Conroe 47
21. Map Showing the Approximate Altitude of the Base ofFresh Water in the Report Area. . . . . . . . . . .. . .. . . . . . . . . . . . . . . . . . . . . . . . . . . . . . . 133
22. Map Showing the Approximate Thickness of FreshWater-Bearing Sands Below the Burkeville Aquiclude 135
23. Map Showing the Approximate Altitude of the Base ofSlightly Saline Water in the Report Area. . . . . . . . . . . . . . . . . . . . . . . . . . . . . . . . . . . . . . . 137
24. Map Showing the Approximate Thickness of Fresh to SlightlySaline Water-Bearing Sands Below the Burkeville Aquiclude 139
25. Hydrogeologic Map Showing Location of Wells in Montgomery and Adjacent Counties .. . . . . . . . . 141
26. Hydrologic Section A-A' 143
27. Hydrologic Section B-B', Harris and Montgomery Counties 145
28. Hydrologic Section C-C', Walker, Montgomery, and Harris Counties. . . . . . . . . . . . . . . . . . . . . . . 147
29. Hydrologic Section 0-0', Montgomery and Harris Counties 149
vi

GROUND-WATER RESOURCES OF
MONTGOMERY COUNTY, TEXAS
ABSTRACT
Ground water in Montgomery County is containedin sands of the Catahoula Sandstone, lower part of theJasper aquifer, upper part of the Jasper aquifer,Burkeville aquiclude, Evangeline aquifer, and Chicotaquifer. The Chicot, Evangeline, and upper part of theJasper generally contain fresh water throughout thecounty. The Catahoula Sandstone and lower part of theJasper contain fresh and slightly saline water in thenorthern and central parts of the county. The Evangel inetransmits about 10 mgd (million gallons per clay) and theupper part of the Jasper transmits about 3,,5 mgd. Thequality of water in the aquifers is good and can be usedfor most purposes.
The ground-water resources of the county arepractically untapped. In 1966, about 6.2 mgd of groundwater was used for all purposes. The principal uses,
about 2.6 mgd, were for rural domestic and livestocksupplies. Almost all of the water was obtained from theEvangeline and the upper part of the Jasper.
About 80 million acre-feet of fresh ground water isin storage in Montgomery County. However, most ofthis water cannot be economically produced.Calculations based on the transmission capacity of theEvangeline and upper part of the Jasper indicate thatabout 65 mgd could be obtained with pumping levelsnot exceeding 400 feet along an assumed line ofdischarge in the latitude of Conroe. Probably as much as150 mgd could be pumped with only moderatewater-level declines and land-surface subsidence. If therejected recharge in the outcrop areas were salvaged, anadditional 140,000 acre-feet per year (125 mgd) ofwater would be available.

GROUND-WATER RESOURCES OF
MONTGOMERY COUNTY, TEXAS
INTRODUCTION
Location and Extent of the Area
Montgomery County is in southeastern Texas inthe West Gulf Coastal Plain physiographic: province(Fenneman, 1938). It is bordered by Walker County onthe north, San Jacinto and Liberty Counties on the east,Harris County on the south, and Waller and GrimesCounties on the west. Peach Creek is the boundary withSan Jacinto County, and Spring Creek forms most of theboundary with Harris County. Montgomerv County,which is adjacent to the Houston metropolitan area, hasan area of 1,090 square miles (Figure 1).
Figure 1.-Location of Montgomery County
Purpose and Scope of the Investigation
The Montgomery County ground-water investigation was started in May 1966 as a cooperative projectof the Texas Water Development Board, the San JacintoRiver Authority, the Montgomery County Commissioners Court, the city of Conroe, and the U.S.Geological Survey. Its purpose was to determine theoccurrence, quality, and quantity of the ground-waterresources of Montgomery County and to describe the
- 3-
availability and dependability of sources of water suitable for municipal supply, industrial use, and irrigation.A related purpose was to determine areas of present orpotential ground-water pollution.
The study included a determination of: (1) theextent and location of sands containing fresh water(dissolved solids less than 1,000 milligrams per liter) andslightly saline water (dissolved solids of 1,000 to3,000 milligrams per liter); (2) the quantity of groundwater pumped and the effect of pumping on waterlevels; (3) the hydraulic characteristics of the aquifers;and (4) the quantity of ground water available fordevelopment.
Previous Investigations
The first investigation of the ground-water resources of Montgomery County was that ofTaylor (1907), who discussed briefly the railroad wellsat Dobbin and Conroe. Deussen (1914) discussed thegeology and ground-water resources of the county inmore detail. Both reports contained records of wells,drillers' logs, and chemical analyses of water samples.
Livingston (1939) inventoried 56 wells inMontgomery County and published chemical analysesand drillers' logs. Rose (1943) described 138 wells andpublished chemical analyses, drillers' logs, and columnarsections of sands.
Wood (1956) and Wood, Gabrysch, andMarvin (1963) discussed the ground-water supplies potentially available from the principal water-bearing unitsin the Gulf Coast region of Texas, includingMontgomery County. Wood and Gabrysch (1965) discussed the hydrology of the Houston district, includingparts of Montgomery County. Measurements of waterlevels in wells in Montgomery County have been madesince 1931 as part of the observation-well program inTexas. Records of these measurements have been published by the Texas Water Development Board and theU.S. Geological Survey (see Rayner, 1959; Sayre, 1957;and Hackett, 1962).

Methods of Investigation
The investigation of the ground-water resources ofMontgomery County included an inventory of 497 wellsin the county and 81 wells in adjacent counties, including all industrial, public supply, and irrigation wells,and a representative number of livestock and domesticwells (Table 7).
Figure 25 shows the location of inventoried wellsand test holes. Electrical logs of test holes were used tocorrelate and evaluate the subsurface characteristics ofthe water-bearing sands. Drillers' logs (Table 8), electrical logs of selected test holes, and analyses of samplesof water collected from a large number of wells(Table 10) were used to determine the chemica~ qualityof the water and the total thickness of sands containingfresh to slightly saline water.
Field analyses of water from selected wells weremade to determine pH at the time of sampling(Table 11). Pumping test data (Table 4) were collectedto determine the hydraulic characteristics of the freshwater-bearing sands. Measurements of water levels inwells and records of past measurements were used todetermine the effects of pumping. Pumpage of groundwater for municipal supply, industrial use, and irrigationwas inventoried. Elevations of water wells were determined from U.S. Geological Survey topographic maps.Climatological records and streamflow records werecollected and analyzed.
Well-Numbering System
The well-numbering system used in this report is astatewide system adopted by the Texas Water Development Board.
the well number. Each well within a 2%-minute quadrangle is given a two-digit number in the order in whichit is inventoried, starting with 01. These are the lasttwo digits of the well number.
All of Montgomery County is within the 1-degreequadrangle 60. The second two digits are shown in theupper left corner of each 7%-minute quadrangle on thewell location map (Figure 23); the last three digitsappear at the well location.
In order to facilitate the use of well data fromother reports, the previously inventoried wells wereassigned new State numbers. The old and new numbersare cross-referenced in Table 1.
Acknowledgments
The author acknowledges the assistance of thosewho contributed data and helped with the preparationof this report. Particular thanks are due the officials ofHumble Oil and Refining Company; Texaco, Incorporated; Tennessee Gas and Transmission Company; andthe City of Conroe for their assistance in supplyingrecords of their wells and oil and gas tests.
Drillers of water wells generously supplied drillers'logs, electrical logs, and well-completion data.Layne-Texas Company and Con-Tex Water Wells wereespecially helpful. Property owners granted access totheir lands, wells, and records. The active and retiredemployees of Humble Oil and Refining Company,Superior Oil Company, Sun Oil Company, andTidewater Oil Company gave generous field assistance inlocating many of the old flowing water wells in theConroe and Lake Creek oil fields.
A 2-letter prefix to the well number is used toidentify each county. The prefix assigned toMontgomery County is TS. Prefixes assigned to adjacentcounties are:
Under this system, each one-degree quadrangle inthe State is given a number consisting of two digits from01 to 89. These are the first two digits in the wellnumber. The one-degree quadrangles are divided into7%-minute quadrangles which are given two-digit numbers from 01 to 64. These are the third and fourth digitsof the well number. Each 7%-minute quadrangle issubdivided into 2%-minute quadrangles which are given asingle digit number from 1 to 9. This is the fifth digit of
COUNTY
Grimes
Harris
Liberty
PREFIX
KW
LJ
S8
COUNTY
San Jacinto
Walker
Waller
PREFIX
WU
YU
YW
- 4-
Population and Economy of the Area
Montgomery County had a population of 2,384in 1850. By 1900, the population had increasedto 17,067. The oil boom in the 1930's did not substantially increase the county population because the city ofHumble, in Harris County, served as the operationheadquarters. During the period 1950-70, the populationincreased from 24,504 to 46,950. Conroe, with a population of 10,931 in 1970, is the county seat. Willis,Montgomery, and Cut and Shoot are among the smallercommunities.
The county serves as a recreational center formuch of the Houston area. The Sam Houston NationalForest, the W. Goodrich Jones State Forest, the BoyScout camp (Camp Strake), and numerous lakes, camps,and country clubs are integral parts of the county'srecreational facilities. Lake Conroe, the 32.8 square-milelake under construction on the West Fork San JacintoRiver, will add to these facilities.
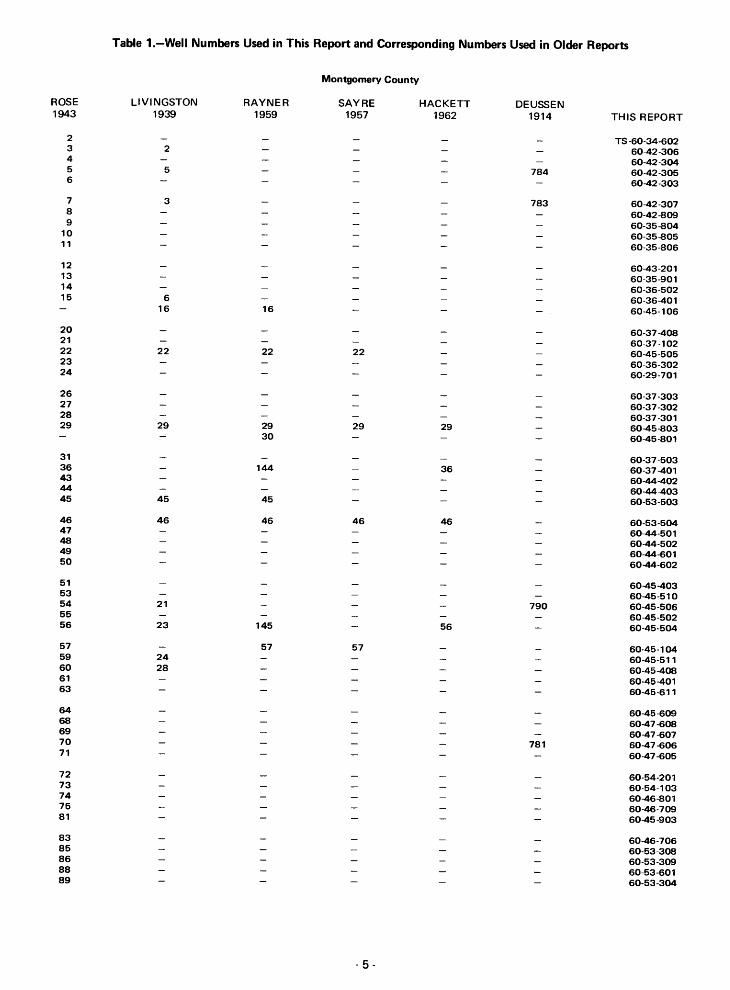
Table 1.-Well Numbers Used in This Report and Corresponding Numbers Used in Older Reports
Montgomery County
ROSE LIVINGSTON RAYNER SAYRE HACKETT DEUSSEN1943 1939 1959 1957 1962 1914 THIS REPORT
2 TS -60-34-6023 2 60-42-3064 60-42-3045 5 784 60-42-3056 60-42-303
7 3 783 60-42-3078 60-42-8099 60-35-804
10 60-35-80511 60-35-806
12 60-43-20113 60-35-90114 60-36-50215 6 60-36-401
16 16 60-45-106
20 60-37-40821 60-37-10222 22 22 22 60-45-50523 60-36-30224 60-29-701
26 60-37-30327 60-37-30228 60-37-30129 29 29 29 29 60-45-803
30 60-45-801
31 60-37-50336 144 36 60-37-40143 60-44-40244 60-44-40345 45 45 60-53-503
46 46 46 46 46 60-53-50447 60-44-50148 60-44-50249 60-44-60150 60-44-602
51 60-45-40353 60-45-51054 21 790 60-45-50655 60-45-50256 23 145 56 60-45-504
57 57 57 60-45-10459 24 60-45-51160 28 60-45-40861 60-45-40163 60-45-611
64 60-45-60968 60-47-60869 60-47-60770 781 60-47-60671 60-47-605
72 60-54-20173 60-54-10374 60-46-80175 60-46-70981 60-45-903
83 60-46-70685 60-53-30886 60-53-30988 60-53-60189 60-53-304
- 5-

Table 1.-Well Numbers Used in This Report and Corresponding Numbers Used in Older Reports-Continued
ROSE1943
9091929394
95969899
101
102104105110111
112113114115116
117118121122123
124125129131132
133134139
CROMACK1943
3651646566
6768
194206205
209210216217218
LIVINGSTON1939
35
41
545047
4849
RAYNER1959
SAYRE1957
- 6-
HACKETT1962
DEUSSEN1914 THIS REPORT
TS -60-53-30560-53-30660-53-30760-53-30360-53-201
60-45-70660-45-70260-44-80160-52-10660-52-101
60-52-10460-51-30660-51-30260-50-30260-50-605
60-50-60660-51-40360-51-40160-51-50260-51-901
60-51-90560-52-40360-61-20660-53-70660-53-806
60-53-50260-53-50160-54-60360-55-30160-55-505
60-55-80560-55-70160-62-60160-45-10760-45-409
60-35-20160-35-20260-45-10860-37-70460-45-408
60-45-80160-52-204
THIS REPORT
KW-60-18-70160-26-20560-26-70260-26-70360-26-704
60-26-70560-26-70660-34-10160-34-80160-42-101
60-42-50260-42-10360-42-70260-42-80160-42-802

Table 1.-Well Numbers Used in This Report and Corresponding Numbers Used in Older Reports-Continued
Harris County
WHITE AND OTHERS1944
93298
WINSLOW1950
1-34J-18J-19K-11K-18L- 6
FLUELLEN1952
0-14
LIVINGSTON AND TURNER1939
93
Walker County
Waller County
- 7 -
THIS REPORT
LJ-60-61 -50465-06-305
THIS REPORT
YU-60-26-20160-27-60160-28 ·40160-29-70560-29-80360-29-902
THIS REPORT
YW-60-58-203
Montgomery County derives its income principallyfrom the petroleum and timber industries. Farming,dairying, gravel production, and beef cattle productionalso contribute to the economy of the area. Thediscovery of oil near Conroe in 1931 was the beginningof large-scale oil production. Over 400 million barrels ofoil were produced in the county prior to 1966. Consequently, petrochemical industries and refineries havebeen establ ished.
West Fork San Jacinto River has a stream gradientof about 5 feet per mile in the northern part of thecounty and about 3 feet per mile in the central andsouthern parts. Caney Creek has a gradient of 8 to12 feet per mile in the northern part of the county andabout 5 feet per mile in the central and southern parts.Spring Creek has a gradient of about 5 feet per mile inthe southwestern part of the county and about 3 feetper mi Ie in the southeastern part.
Physiography and Drainage Climate
The topographic surfaces vary from almost flatnear the larger streams and in the southern part of thecounty to hilly in the northern part. Altitudes rangefrom about 45 feet above mean sea level in the southeastern corner of the county to about 440 feet in thenorthwestern corner.
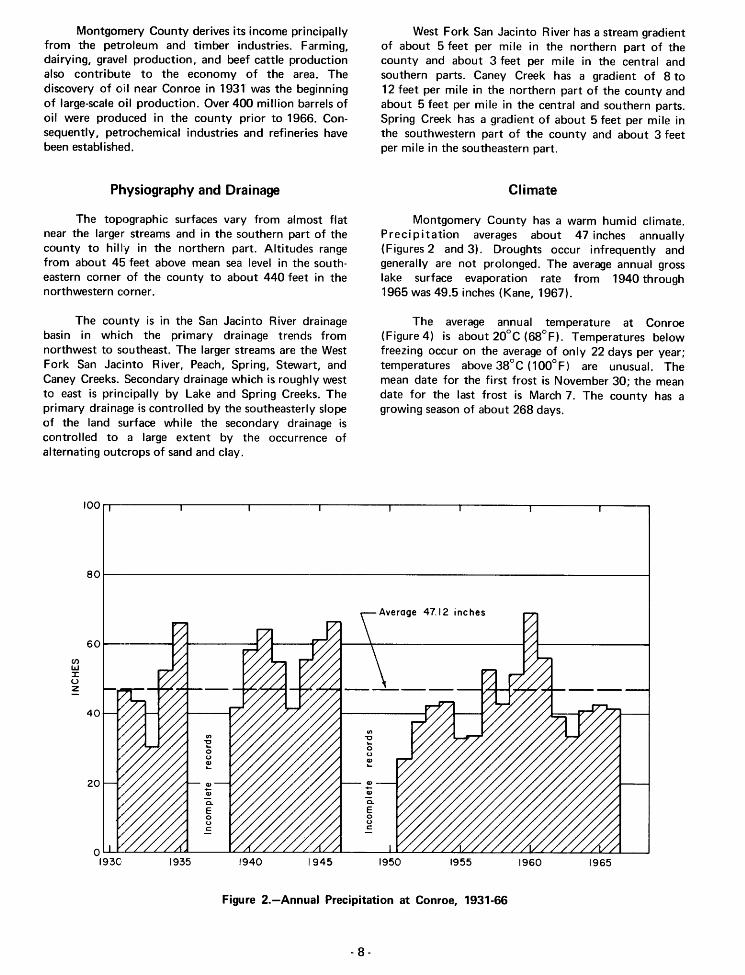
Montgomery County has a warm humid climate.Precipitation averages about 47 inches annually(Figures 2 and 3). Droughts occur infrequently andgenerally are not prolonged. The average annual grosslake surface evaporation rate from 1940 through1965 was 49.5 inches (Kane, 1967).
The county is in the San Jacinto River drainagebasin in which the primary drainage trends fromnorthwest to southeast. The larger streams are the WestFork San Jacinto River, Peach, Spring, Stewart, andCaney Creeks. Secondary drainage which is roughly westto east is principally by Lake and Spring Creeks. Theprimary drainage is controlled by the southeasterly slopeof the land surface while the secondary drainage iscontrolled to a large extent by the occurrence ofalternating outcrops of sand and clay.
The average annual temperature at Conroe(Figure 4) is about 20°C (68°F). Temperatures belowfreezing occur on the average of only 22 days per year;temperatures above 38°C (100°F) are unusual. Themean date for the first frost is November 30; the meandate for the last frost is March 7. The county has agrowing season of about 268 days.
1001""'T"""------r-----....-------.--------.,r--------,----~----"""T'"--___,
801---------------------------------------~
196519601955
Average 47.12 inches
19501194519401935oU-LL..L.....c......L....L..LLI__---..1L..J.CLL....L.....c......L....L.....L.L.LL..L.L__---JL...l...o~...L.....L.L.....LJL.L_L....~~..L....k:...L....L.....L.L...L.....£....I(.~L.._____I
1930
20
40
CJ)UJ:I:UZ
601------V A------f
Figure 2.-Annual Precipitation at Conroe, 1931·66
- 8-

Figure 3.-Average Monthly Precipitationat Conroe, 1931-66
which dips at a rate of 40 feet per mile, is overlapped bythe Willis Sand of Pliocene(?) age, which dips at a rate of10 feet per mile; consequently, the Goliad is exposedonly in the deeper stream valleys. The units crop out inbelts that are approximately parallel to the coast. Theyounger units, which crop out nearer the coast, form aplain composed of remnants of terraces; the older units,which crop out farther inland at higher elevations, formcuestas or sand hills.
The formations dip toward the Gulf at an anglegreater than the slope of the land surface, and the dipincreases with depth. For example, the base of theCatahoula Sandstone dips about 90 feet per mile whilethe base of the Willis Sand dips about 10 feet per mile.Intermediate beds dip at rates ranging from 85 to 40 feetper mile.
The major structural features are the deep-seatedConroe Dome and the northern flanks of the highlyfaulted, deep-seated Tomball Dome and the PiercementHumble Dome, which are mostly in adjacent HarrisCounty. These domes cause a flattening of the regionaldip and thinning of the overlying water-bearing units.
More detailed discussions of the geology of thearea can be found in the publications of Deussen (1914),Sellards, Adkins, and Plummer (1932), Doering (1935),Michaux and Buck (1936), Fisk (1940), Metcalf (1940),Weeks (1945), Bernard, LeBlanc, and Major (1962), andBernard and LeBlanc (1965a and 1965b). Table 2 correlates the geologic units and the hydrologic units usedin this and other reports. Montgomery County isincluded in the Beaumont sheet of the Geologic Atlas ofTexas (Bureau Economic Geology, 1968).
20
30
Jon. FeD Mar. Apr May June July AUQ. Sept Oct Nov. Dec
~- I IAVerOf)t annual 67,6°F I--- --.......'- .-
V/ '"""//- \.
[7 '"...- / " I
~
~-
--I
--- ,
100
40
80
20
60
Figure 4.-Average Monthly Temperatureat Conroe, 1931-66 Source and Occurrence of Ground Water
GROUND-WATER HYDROLOGY
General Geology
The 9..eologic units that contain fresh to slightlysaline water in Montgomery County are, from oldest toyoungest: the Catahoula Sandstone of Miocene age; theFleming Formation of Miocene age; the Goliad Sand ofPliocene age; the Willis Sand of Pliocene(?) age; theBentley Formation, Montgomery Formation, andBeaumont Clay of Pleistocene age; and the alluvium ofHolocene age (Table 2). These units consist of alternating beds of sand and clay with minor amounts ofgravel. Local occurrences of limestone are reported insome drillers' logs.
Except for the Catahoula Sandstone and most ofthe Goliad Sand, all of these geologic units are exposedwithin the county. The Catahoula crops out north ofMontgomery County. The Goliad Sand of Pliocene age,
The principal source of ground water inMontgomery County is rainfall within the county and inadjoining areas to the north. Most precipitation runs off,evaporates, or is transpired by plants. Only a small partof it percolates through the soil and into the underlyingrocks.
Ground water in Montgomery County occursunder two conditions-water-table and artesian. Watertable conditions exist where the water is under atmospheric pressure only and the water table is free to rise orfall in response to changes in the volume of water stored.Water-table conditions occur in the outcrop areas of thewater-bearing rocks.
Artesian conditions exist where an aquifer, orwater-bearing unit, is overlain by a less permeable bedthat confines the water under hydrostatic pressure.Artesian conditions occur downdip from the outcrops ofthe aq~ifers. Under these conditions, water in wells willrise above the top of the aquifer. If the pressure head is
- 9-

....o
Table 2.--Hydrogeologic Units Used in This Report and in Reports on Adjacent Counties
HYDROGEOLOGIC UNITS USED IN OTHER REPORTS UNITS USED IN THIS REPORT
Walker County, Houston District, Houston District, San Jacinto County,Winslow (1950, plate 2) Lang and Winslow Wood and Gabrysch Sandeen (1968) System Series Geologic Unit Hydrologic Unit
(1950, plate 1) (1965, figure 3) y
Alluvium Holocene Alluvium
Beaumont Clay and Beaumont Clay and Quaternary Beaumont ClayAlta Loma Sand Alta Loma Sand Pleistocene Montgomery Formation Chicot aquifer
Chicot aquifer Bentley Formation
PlioceneWillis Sand ( 1) Willis Sand
(Absent) Zone 3, 4, 5, 6, 7 Heavily pumped Evangeline aquifer Pliocene Goliad Sand Evangeline aquiferlayer
Lagarto Clay Zone 2 Zone 2 Burkeville aquiclude Tertiary Burkeville aquiclude
Miocene Fleming Formation Upper part of JasperOakville Sandstone Zone 1 Zone 1 aquifer
Jasper aquiferLower part of Jasper
Catahou1a Sandstone aquifer
Catahou1a Sandstone Catahoula Sandstone Catahou1a Sandstone
Jackson Group,undifferentiated Jackson Group Eocene Jackson Group
Y Also, Liberty County (Anders and others, 1968) and Austin and Waller Counties (Wilson, 1967).
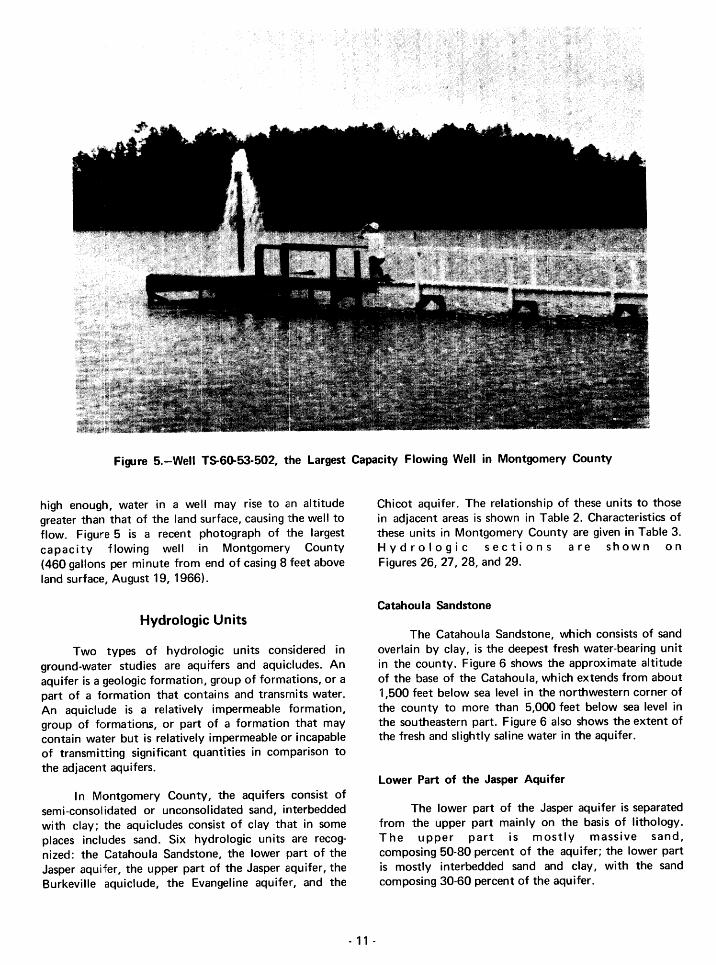
Figure 5.-Well T8-6o-53-502, the Largest Capacity Flowing Well in Montgomery County
high enough, water in a well may rise to an altitudegreater than that of the land surface, causing the well toflow. Figure 5 is a recent photograph of the largestcapacity flowing well in Montgomery County(460 gallons per minute from end of casing 8 feet aboveland surface, August 19, 1966).
Hydrologic Units
Two types of hydrologic units considered inground-water studies are aqurfers and aquic:ludes. Anaquifer is a geologic formation, group of formations, or apart of a formation that contains and transmits water.An aquiclude is a relatively impermeable 'formation,group of formations, or part of a formation that maycontain water but is relatively impermeable or incapableof transmitting significant quantities in comparison tothe adjacent aquifers.
In Montgomery County, the aquifers consist ofsemi-consolidated or unconsolidated sand, interbeddedwith clay; the aquicludes consist of clay that in someplaces includes sand. Six hydrologic units are recognized: the Catahoula Sandstone, the lower part of theJasper aquifer, the upper part of the Jasper aquifer, theBurkeville aquiclude, the Evangeline aquifer, and the
- 11 -
Chicot aquifer. The relationship of these units to thosein adjacent areas is shown in Table 2. Characteristics ofthese units in Montgomery County are given in Table 3.Hydrologic sections are shown onFigures 26, 27, 28, and 29.
Catahou la Sandstone
The Catahoula Sandstone, which consists of sandoverlain by clay, is the deepest fresh water-bearing unitin the county. Figure 6 shows the approximate altitudeof the base of the Catahoula, which extends from about1,500 feet below sea level in the northwestern corner ofthe county to more than 5,000 feet below sea level inthe southeastern part. Figure 6 also shows the extent ofthe fresh and slightly saline water in the aquifer.
Lower Part of the Jasper Aqu ifer
The lower part of the Jasper aquifer is separatedfrom the upper part mainly on the basis of lithology.The upper part is mostly massive sand,composing 50-80 percent of the aquifer; the lower partis mostly interbedded sand and clay, with the sandcomposing 30-60 percent of the aquifer.

Table 3.-Characteristics of the Hydrologic Units in Montgomery County
HYDROLOGIC APPROXIMATE GENERAL DIP PERCENT AVERAGE COEFFICIENTUNIT THICKNESS OF BASE SAND OF PERMEABILITY
(FEET) (FEET PER MILE) (GPD/Fr 2)
Chicot 0- 200 10 60-80 500Waquifer
REMARKS
Aquifer consists of unconsolidated sands and gravels, oftenferruginous. Red sands and gravels io the Chicot overlie whiteclays and sands in the Evangeline.
Chicot and Evangeline aquifers may be distinguished by differencesin self potential curve on electrical logs.
Aquifer contains very fresh, often acidic and iron-rich water. Smallwells developed; large capacity wells may be developed insoutheastern part of county.
....I\,)
Evangelineaquifer
Burkevilleaquiclude
Upper partof Jasper aquifer
Lower partof Jasper aquifer
CatahoulaSandstone
0-1300
0- 300
100- 400
1100-2200
300- 500
40
40
50
85
90
40-70
0-20
50-80
30-60
30-50
250W
240
Water levels higher than in the Chicot aquifer, except insoutheastern part of cou nty .
Contains fresh water. Small wells developed; large capacity wellsmay be developed except in areas near the upper limit of theoutcrop.
Massive blanket clay with thin interbeds of sand to massive siltysands.
Small wells developed in a few areas where fresh water is present.
Massive blanket sand with thin interbeds of clay to massive sandyclays.
Large wells developed in some areas, but may be developed in allareas except in extreme northwest corner of county. Fresh,often hard water.
Contains interbedded sands and clays. Lower part of Jasper aquiferand Catahoula Sandstone may be distinguished by differences inself potential curve on electrical logs.
Large quantities of slightly and moderately saline water. Moderatequantities of fresh water. Generally, water at base of unit is moresaline than at top of Lower Catahoula Sandstone.
Massive sand underlies clay, silty sands, or moderately salinewater-bearing sand.
Contains moderate quantities of fresh water, and appears to be lessconsolidated and more permeable than the sands above it.
W Estimated from data in adjoining counties.

The lower part of the Jasper aquifer contains onlysmall amounts of fresh water in Montgomery County.Figure 7 shows the approximate altitude of the base ofthe lower part of the Jasper aquifer and the base of thesand containing fresh water in the aquifer. Figure 8shows the approximate altitude of the base of the lowerpart of the Jasper aquifer and the base of the sandcontaining slightly saline water in the aquifer.
Upper Part of the Jasper Aqu ifer
The upper part of the Jasper aquifer consists of amassive sand below the base of the Burkeville aquiclude.The aquifer correlates with "Zone 1" in the Houstondistrict (Lang and Winslow, 1950, pI. 1) and with mostof the fresh water-bearing sands of the upper part of theJasper aquifer in San Jacinto (Sandeen, 1968), Liberty(Anders, McAdoo, and Alexander, 1968), and Austinand Waller (Wilson, 1967) Counties. Figure 9 shows theapproximate altitude of the base of the upper part of theJasper aquifer and the areas where slightly saline water ispresent in the aquifer.
Burkeville Aquiclude
The Burkeville aquiclude consists of a generallymassive cia,! near the top of the Fleming Formation. Theaquiclude correlates with "Zone 2" in the! Houstondistrict (Lang and Winslow, 1950, pI. 1, and Wood andGabrysch, 1965, fig. 3). It is the same unit de!scribed asthe Burkeville aquiclude in reports on Liberty (Andersand others, 1968), Austin and Waller (Wilson, 1967),and San Jacinto (Sandeen,1968) Counties. Figure 10shows the approximate altitude of the base of theBurkeville aquiclude.
Evangeline Aquifer
The Evangeline aquifer, which is an importantsource of water in the Houston area, is composed of asequence of alternating sands and clays of the GoliadSand and the part of the Fleming Formation above theBurkeville aquiclude. In the northern part of the county,remnants of the Willis Sand and younger deposits, whichare in hydraulic continuity with the Evangeline, areincluded in the Evangeline aquifer. The base of theaquifer correlates with the base of "Zone :3" in theHouston district (Lang and Winslow, 1950, pI. 1). TheEvangeline aquifer is the same hydrologic unit referredto as the "Heavily Pumped Layer" by Wood andGabrysch (1965, fig. 4). The base of the unit correlateswith the base of the Evangeline aquifer as described inreports in neighboring counties.
Figure 11 shows the approximate altitude of thebase of the Evangeline aquifer and the thickness of freshwater-bearing sands in the Chicot and Evangelineaquifers.
- 15 -
Chicot Aquifer
The Chicot is a continuous aquifer in the southernpart of the county. It consists of the Willis Sand, Bentleyand Montgomery Formations, and younger deposits. Aspreviously explained, remnants of these formations inthe northern part of the county are included in theEvangeline. The base of the Chicot aquifer is noteverywhere the base of the Willis Sand. The Alta LomaSand in the Houston district (Wood and Gabrysch, 1965,fig. 3) is the basal part of the Chicot aquifer. Figure 12shows the approximate altitude of the base of the Chicotaquifer and the approximate altitude of water levels inwells screened in the aquifer, 1966-67. The thickness offresh water-bearing sands in the Chicot and Evangelineaquifers can be seen on Figure 11.
Hydraulic Properties of the Aquifers
"The worth of an aquifer as a fully developedsource of water depends largely on two inherentcharacteristics: its ability to store and its ability totransmit water" (Ferris and others, 1962, p. 70). Thesecharacteristics are expressed by the coefficient of storageand the coefficient of transmissibility.
The coefficients of transmissibility and storage areused to predict theoretical drawdown in water levels inwells caused by pumping. Figure 13 shows the theoretical drawdown of water levels in wells at distances upto 10 miles from a well or group of wells pumping 1 mgdfor 1 year. Calculations to obtain the curves were basedon the different assumptions of coefficients of transmissibility and storage shown on the graph.
Little is known about the hydrologic properties ofthe Catahou la Sandstone and the lower part of theJasper aquifer in Montgomery County. A short aquifertest performed on wells tapping the CatahoulaSandstone in the city of Huntsville (Walker County)indicates coefficients of transmissibility, permeability,and storage of 27,400 gpd (gallons per day) per foot,200 gpd per square foot, and 0.0037, respectively(Winslow, 1950, p. 19).
The coefficient of storage of an aquifer is thevolume of water it releases from or takes into storage perunit surface area of the aquifer per unit change in thecomponent of head normal to that surface. Underwater-table conditions, the coefficient of storage isnearly equal to the specific yield, which is the amount ofwater a saturated formation will yield by draining underthe force of gravity. The storage coefficients of aquifersunder water-table conditions range from about 0.05 to0.30 while those under artesian conditions range fromabout 0.00001 to 0.001. Under artesian conditions, thecoefficient of storage is a measure of the elasticity of thewater and the aquifer. Additionally, in places inMontgomery County where significant water-level

o
20
40
60
80
I- 1001LJ1LJu...
~
Z 120;:oo~a::Cl 140
160
V-""T= 100,OOOT=50,OOO -~
10---T=20,oOO - I--- L------~ - ---v v--- ......
t.----l---- ~
/ ~ ~L------
~ ~~
I/
v/~~
I /I 1/
//I
T=coefficient of transmissibility in gpd per footS=coefficient of storage
S"O.OOI for T=50,OOO and 100,000S=O.OOOI for T= 5,000, 10,000, and 20,000
Dra'Ndowns calculated for a well or group ofwells pumping I mgd for I year
180
200
220
240o 2 3 4 5 6 7DISTANCE: FROM CENTER OF PUMPING, IN MILES
8 9 10
Figure 13.-Relation of Drawdown to Transmissibility and Distance
declines have caused land-surface subsidence, the storagecoefficient is also a measure of the water released fromcompaction of clay beds.
Permeability is a measure of the ability of anaquifer to transmit water. The coefficient of permeability is defined as the rate of flow of water in gallonsper day through a cross-sectional area of one square footunder a hydraulic gradient of one foot per foot at atemperature of 16°C (60°F). In field practice, the
- 29·
temperature adjustment is disregarded and the permeability is then understood to be a field coefficient at theprevailing water temperature. The coefficient of transmissibility is the product of the field coefficient ofpermeability and the saturated thickness of the aquifer.
The coefficients of storage and transmissibility ofthe upper part of the Jasper aquifer were determined by9 aquifer tests made in 6 wells near Conroe and atCleveland (Liberty County). The test data were analyzed

by the Theis recovery method (Wenzel, 1942, p. 95-97)or by the Theis recovery method as modified by Cooperand Jacob (1946, p. 526-534). The results of the testsare shown in Table 4. The calculated values of permeability are based on the total amount of sand believed tobe contributing to the well.
The coefficients of permeability ranged from150 to 300 gpd per square foot, and averaged 240 gpdper square foot. The average permeability is within therange of 212 to 272 gpd per square foot obsl~rved inAustin and Waller Counties by Wilson (1967, p. 13), andvery close to the 247 gpd per square foot observed inSan Jacinto County by Sandeen (1968). Based on anaverage saturated thickness of 150 feet and an averagepermeability of 240 gpd per square foot, the averagecomposite transmissibility of the upper part of theJasper aquifer is about 36,000 gpd per foot. Thecoefficients of transmissibility determined from the testsaveraged 33,500 gpd per foot. This value is greater thanobtained by Wilson (1967, p. 13) and Sandeen (1968).
Little is known about the transmissibility orstorage characteristics of the Evangeline and Chicotaquifers in Montgomery County. Although a fewlarge-capacity wells are completed in the Evangeline,none are completed in the Chicot. However, the characteristics of these aquifers have been extensively tested inHarris and other counties where the aquifer has beendeveloped by wells. Wood and Gabrysch(1965, figs. 34 and 35) indicate a range in transmissibility from 50,000 to 150,000 gpd per foot and astorage coefficient of 0.0025 in the "Heavily PumpedLayer," or Evangeline aquifer in the northern part of theHouston district. The average coefficient of permeabilityof the "Heavily Pumped Layer" in this area is about300 gpd per square foot (Wood and Gabrysch,1965, figs. 33 and 34). Wilson (1967) calculated an average permeability of 215 gpd per square foot from26 tests in Austin and Waller Counties. The estimatedaverage permeability in the Evangeline aquifer inMontgomery County is 250 gpd per square foot, and theestimated average composite transmissibility of the fullthickness of the Evangeline is 50,000 gpd per foot.
The Chicot aquifer in Montgomery County wasnot tested. The average permeability of the "Alta Loma"in southern Harris and northern Galveston Counties isabout 500 gpd per square foot (Wood and Gabrysch,1965, figs. 36 and 37). This figure is probably near theaverage permeability of the aquifer in MontgomeryCounty. Based on a permeability of 500 gpd per squarefoot, the average composite transmissibility is about25,000 gpd per foot.
Recharge, Movement, andDischarge of Ground Water
The Chicot and Evangeline aquifers and the upperpart of the Jasper aquifer crop out in Montgomery
·30 -
County and are recharged by precipitation on theoutcrops. Part of the water infiltrates to the zone ofsaturation and then moves downdip through the aquifer.The Catahou la Sandstone and the lower part of theJasper aquifer crop out north of Montgomery County; inMontgomery County these aqu ifers are recharged bydowndip movement of water from the outcrop area.
The amount of precipitation on the outcropsexceeds the amount that can be transmitted through theaqu ifers, and a large part of the rainfall runs off intostreams. A lesser part of the water that infiltrates to thezone of saturation emerges as spring flow that maintainsthe base flow of the streams. The base flow is regardedas rejected recharge. As development increases thetransmission capacities of the aquifers, the presentrejected recharge will move through the aquifers asrecharge and the base flow of the streams will bereduced.
Ground water moves from areas of recharge toareas of discharge under the influence of gravity. Thegeneral direction of movement is downdip toward theareas of natural or artificial discharge. The rate ofmovement is dependent upon the hydraulic gradient, thepermeability of the aquifer, and the temperature of thewater. The rate of general movement is about 20,40,and 60 feet per year in the upper part of the Jasper, inthe Evangeline, and in the Chicot aquifers, respectively.In areas of ground-water withdrawal, ground watermoves from all directions into the areas being pumped.
Ground water is discharged naturally and artificially. Natural discharge is by springs, seeps, andtranspiration. Artificial discharge is by pumping fromwells and by drainage from pits and channels.
CHEMICAL QUALITY OFGROUND WATER
The chemical constituents in the ground water inMontgomery County originate principally from the soiland rocks through which the water has moved and thusreflect the differences in the mineral content of thegeologic formations with which the water has been incontact. The quantities of some constituents, especiallysodium and chloride, indicate the extent of removal ofconnate water by flushing. Generally, the chemicalcontent of the water increases with depth. The temperature of ground water near the land surface is generallyabout the same as the mean air temperature of theregion but increases with depth. General discussions ofthe quality of ground water are included in A Primer onWater Quality by Swenson and Baldwin (1965) and inthe Study and Interpretation of the Chemical Characteristics of Natural Water by Hem (1959). The chemicalanalyses of water from selected wells are given inTable 10.

Table 4.-Summary of Aquifer Tests in the Upper Part of the Jasper Aquifer in Montgomery and Adjacent Counties
COEFFICIENT FIELDDATE OF TRANSMIS- COEFFICIENT COEFFICIENT TYPE
WELL OF TEST SIBILITY OF PERMEABIL- OF OF REMARKS(GPD/FT) ITY (GPD/FT2) STORAGE TEST
T8-60-45-402 July 24, 1966 41,600 210 - R~ Measurements by driller. Well pumped at 1200 gpm for 24 hours.
do July 25, 1966 39,400 200 - R Do.
T8-60-45-503 Apr. 24, 1954 40,600 300 - R Pumped well at 1000 gpm for 24 hours.
T8-60-45-505 June 24, 1942 44,000 300 4.7x10⁻⁵ 191 Pumped T8-60-45-504 at 440 gpm for 9 hours. Observed drawdown and recoveryin T8-60-45-505.
do do 44,000 300 3.1 x10⁻⁴ I Pumped T8-60-45-506 at 110 gpm for 10 hours. Observed recovery inT8-60-45-505.
T8-60-45-506 June 24, 1942 50,200 280 6.6x10⁻⁴ I Pumped T8-60-45-504 at 440 gpm for 3Y2 hours. Observed drawdown inT5-60-45-506.
T8-60-~5-507 Nov. 2, 1953 20,500 150 - R Measurements by driller. Well pumped at 750 gpm for 3% hours.
88-60-48-202 Dec. 2,1965 11,300 230 - R Measurements by driller. Well pumped at 600 gpm for 24 hours.
W do Jan. 14, 1966 10,000 200 - R Flowed 60 gpm.- -!Y Recovery test.
bli nterference test.

Relationship of Quality of Water to Use
The dissolved-solids content is an indication of thechemical quality of the water. A general classification ofwater based on dissolved-solids content, in mg/I(milligrams per liter), is as follows (modified fromWinslow and Kister, 1956):
The major factors that determine the suitability ofa water supply are the limitations imposed by thecontemplated use of the water. Among the variouscriteria established for water quality are: bacterialcontent; physical characteristics, such as temperature,odor, color, and turbidity; and chemical constituents.Usually, the bacterial content and the undesirablephysical properties can be alleviated economically, butthe removal of undesirable chemical constituents can bedifficult and expensive.
DESCRIPTION
Fresh
DISSOLVE D-SOLI DSCONTENT (MG/Ll
Less than 1,000
The quality of water requirements for industrialuses range widely, as almost every industrial requirementhas different standards. In general, water used forindustry may be placed in three categories-processwater, cooling water, and boiler water. Process water isthe term used for the water incorporated into or incontact with the manufactured products. Water forcooling and boiler uses should be noncorrosive andrelatively free of scale-forming constituents. In boilerwater the presence of silica is undesirable because itforms a hard scale or encrustation, the scale-formingtendency increasing with the pressure in the boiler(Moore, 1940, p. 263). Suggested water-quality tolerances for a number of industries have been summarizedby Hem (1959, p. 250-254) and Moore (1940).
Several factors other than the chemical quality areinvolved in determining the suitability of water forirrigation. The type of soil, adequacy of drainage, cropsgrown, climatic conditions, and quantity of water usedhave an important bearing on the continued productivityof irrigated land.
JI Based on annual average of maximum daily air temperaturerecords at Conroe, Texas.
Table 5 is a summary of the source and significance of dissolved-mineral constituents and the properties of water.
CONCENTRATION
SUBSTANCE (MG/Ll
Chloride (CI) 250
Fluoride (F) 1.0Y
Ir,on (Fe) 0.3
Nitrate (N03) 45
Sulfate (S04) 250
Dissolved solids 500
The U.S. Public Health Service (1962) has established and periodically revises standards of drinkingwater to be used on common carriers engaged ininterstate commerce. The standards are widely acceptedfor evaluating domestic and public water supplies.According to the standards, chemical constituentsshould not be present in a public water supply in excessof the listed concentrations shown in the followingtable, except where other more suitable supplies are notavailable:
A classification for judging the quality of a waterfor irrigation was proposed in 1954 by the U.S. SalinityLaboratory Staff (1954, p.69-82). This classification,which is now commonly used, is based on the salinityhazard as measured by the electrical conductivity of thewater and the sodium hazard as measured by the SAR(sodium-adsorption ratio). Sodium can be a significantfactor in evaluating the quality of irrigation waterbecause water with a high SAR will cause the soilstructure to break down by deflocculating the colloidalsoil particles. Consequently, the soil can become plastic,thereby causing poor aeration and low water availability.This possibility is especially true of fine-textured soils.Wilcox (1955, p. 15) stated that the system of classification of irrigation waters proposed by the LaboratoryStaff " ... is not directly applicable to supplementalwaters used in areas of relatively high rainfall". Wilcox(1955, p. 16) indicated that generally water may be usedsafely for supplemental irrigation if its conductivity isless than 2,250 microhos per centimeter at 26°C and itsSAR is less than 14.
Another factor in assessing the quality of water forirrigation is the RSC (residual sodium carbonate) in thewater. Excessive RSC will cause the water to be alkaline,and the organic material in the soil will tend to dissolve.The soil may become a grayish-black and the land areasaffected are referred to as "black alkali". Wilcox(1955, p. 11) states that laboratory and field studieshave resulted in the conclusion that water containingmore than 2.5 epm (equivalents per million) RSC is notsuitable for irrigation. Water containing from 1.25 to 2.5epm is marginal, and water containing less than1.25 epm RSC probably is safe. However, the successfuluse of marginal water for irrigation might be madepossible by proper irrigation practices and use of soil
1,000 to 3,000
10,000 to 35,000
More than 35,000
3,000 to 10,000
Very saline
Brine
Moderately saline
Slightly saline
·32 -

Table 5.-Source and Significance of Dissolved-Mineral Constituents and Properties of Water
CONSTITUENTOR
PROPERTY
Silica 1S102)
Iron IFe)
Calcium (Ca) andmagnesium (Mg)
Sodium (Na) andpotassium (K)
Bicarbonate (HC03)and carbonate (C03 )
Chloride (CI)
Fluoride (F)
Nitrate (N03)
Dissolved solids
Hardness as CaC03
Specific conductance(mlcrorrhos at 250 C)
Hydrogen ionconcentration (pH)
SOURCE OR CAUSE
Dissolved from practically allrocks and soils, commonly lessthan 30 mgll. High concentrations, as much as 100 mg/I, generally occur in highly alkalinewaters.
Dissolved from practically allrocks and soils. May also bederived from iron pipes, pumps,and other equipment. More than1 or 2 mg/I of iron in surfacewaters generally indicates acidwastes from mine drainage orother sources.
Dissolved from practically all soilsand rocks, but especially fromlimestone, dolomite, and gypsum.Calcium and milgnesium arefound in large quantities in somebrines. Magnesium is present inlarge quantities in sea water.
Dissolved from practically allrocks and soils. Found also inancient brines, sea water, industrial brines, and sewi~ge.
Action of carbon dioxide in wateron carbonate rocks such as limestone and dolomite.
Dissolved from roc:ks and soilscontaining gypsum, iron sulfides,and other sulfur compounds.Commonly present in mine watersand in some industrial wastes.
Dissolved from rocks and soils.Present in sewage ilrtd found inlarge amounts in ancient brines,sea water, and industrial brines.
Dissolved in small to minutequantities from most rocks andsoils. Added to many waters byfluoridation of municipal supplies.
Decaying organic miltter, sewage,fertilizers, and nitratlts in soil.
Chiefly mineral con!itituents dissolved from rocks and soils.Includes some water of crystallization.
In most waters nearly all thehardness is due to calcium andmagnesium. All the metalliccations other than the alkalimetals also cause hardness.
Minerai content of the water.
Acids, acid-generating salts, andfree carbon dioxide lower the pH.Carbonates, bicarbomltes, hydroxides, and phosphatlts, silicates,and borates raise the pH.
- 33-
SIGNIF ICANCE
Forms hard scale in pipes and boilers. Carried over in steam ofhigh pressure boilers to form deposits on blades of turbines.Inhibits deterioration of zeolite-type water softeners.
On exposure to air, iron in ground water oxidizes to reddishbrown precipitate. More than about 0.3 mg/I stains laundry andutensils reddish-brown. Objectionable for food processing, textile processing, beverages, ice manufacture, brewing, and otherprocesses. U.S. Public Health Service (1962) drlnking-waterstandards state that iron should not exceed 0.3 mg/l. Largerquantities cause unpleasant taste and favor growth of ironbacteria.
Cause most of the hardness and scale-forming properties ofwater; soap consuming (see hardness). Waters low in calcium andmagnesium desired in electroplating, tanning, dyeing, and intextile manufacturing.
Large amounts, in combination with chloride, give a salty taste.Moderate quantities have little effect on the usefulness of waterfor most purposes. Sodium salts may cause foaming in steamboilers and a high sodium content may\limit the use of water forirrigation.
Bicarbonate and carbonate produce alkalinity. Bicarbonates ofcalcium and magnesium decompose in steam boilers and hotwater facilities to form scale and release corrosive carbon diox idegas. In combination with calcium and magnesium, cause carbonate hardness.
Sulfate in water containing calcium forms hard scale in steamboilers. In large amounts, sulfate in combination with other ionsgives bitter taste to water. Some calcium sulfate is consideredbeneficial in the brewing process. U.S. Public Health Service(1962) drinking-water standards recommend that the sulfatecontent should not exceed 250 mg/1.
In large amounts in combination with sodium, gives salty taste todrinking water. In large quantities, increases the corrosiveness ofwater. U.S. Public Health Service (1962) drinking-water standards recommend that the chloride content should not exceed250 mg/I.
Fluoride in drinking water reduces the incidence of tooth decaywhen the water is consumed during the period of enamelcalcification. However, it may cause mottling of the teeth,depending on the concentration of fluoride, the age of the child,amount of drinking water consumed, and susceptbility of theindividual. (Maier, 1950)
Concentration much greater than the local average may suggestpollution. U.S. Public Health Service (1962) drinking-waterstandards suggest a limit of 45 mg/I. Waters of high nitratecontent have been reported to be the cause of methemoglobinemia (an often fatal disease in infants) and therefore shouldnot be used in infant feeding. Nitrate has been shown to behelpful in reducing inter-crystalline cracking of boiler steel. Itencourages growth of algae and other organisms which produceundesirable tastes and odors.
U.S. Public Health Service (1962) drinking-water standardsrecommend that waters containing more than 500 mg/l dissolvedsolids not be used if other lass mineralized supplies are available.Waters containing more than 1000 mg/l dissolved solids areunsuitable for many purposes.
Consumes soap before a lather will form. Deposits soap curd onbathtubs. Hard water forms scale in boilers, water heaters, andpipes. Hardness equivalent to the bicarbonate and carbonate iscalled carbonate hardness. Any hardness in excess of this iscalled non-carbonate hardness. Waters of hardness as much as 60ppm are considered soft; 61 to 120 mg/I, mOderately hard; 121to 180 mg/I, hard; more than 180 mg/I, very hard.
Indicates degree of mineralization. Specific conductance is ameasure of the capacity of the water to conduct an electriccurrent. Varies with concentration and degree of ionization ofthe constituents.
A pH of 7.0 indicates neutrality of a solution. Values higher than7.0 denote increasing alkalinity; values lower than 7.0 indicateincreasing acidity. pH is a measure of the activity of thehydrogen ions. Corrosiveness of water generally increases withdecreasing pH. However, excessively alkaline waters may alsoattack metals.

amendments. Furthermore, the degree of leaching willmodify the permissible limit to some extent (Wilcox,Blair, and Bower, 1954, p. 265).
Boron is essential to proper plant nutrition, but anexcessive boron content will make water unsuitable forirrigation. Wilcox (1955, p. 11) indicated that a boronconcentration of as much as 1.0 mg/I is permissible forirrigating sensitive crops.
Water Quality in the Hydrologic Units
Fresh water in Montgomery County is generallyfree of excessive chemical constituents that are harmfulto health, and is therefore suitable for public supply anddomestic use. Though water-quality demands of variousindustries are different (Collins, 1926; Conklin, 1956;Hem, 1959; Mussey, 1955 and 1957), ground water inMontgomery County is generally suitable for industrialuse. The water is also suitable for irrigation because itgenerally contains low concentrations of toxic constituents, and the soils are generally sandy and well drained.Records of laboratory analyses of water from wells inMontgomery and adjacent counties are given inTable 10. Records of field analyses are given in Table 11.
Catahoula Sandstone
Electrical-log interpretations indicate that freshwater-bearing sands are present in the Catahou laSandstone in the northern and central part ofMontgomery County (Figure 6). Where fresh water ispresent in the Catahoula, it is generally overllain byslightly or moderately saline water. The maximumthickness of sand containing fresh water is 160 feet,which occurs about 5 miles northwest of Willis. Theaverage fresh-water sand thickness in the county isabout 100 feet. The maximum thickness of sand containing slightly saline water is 200 feet, which occursnorthwest of the town of Montgomery. Natural gas ispresent in the fresh and slightly saline water-bearing sandon the flanks of the Conroe Dome.
Lower Part of the Jasper Aquifer
Electrical-log interpretations indicate that as muchas 270 feet of fresh water-bearing sand is present in thelower part of the Jasper aquifer in the northern andcentral parts of the county. Slightly saline water is alsopresent in the aquifer as shown on Figure 8.
Upper Part of the Jasper Aquifer
The upper part of the Jasper aquifer containswater that is generally fresh, hard, and alkaline. Samplesfrom wells 725 feet or less in depth were of the calciumbicarbonate type; those from wells 1,100 feet or more in
- 34·
depth were of the sodium bicarbonate type.Dissolved-solids content ranged from 49 to 665 mg/I,but In most of the samples ranged from 300 to 500 mgt!.Most of the samples had a pH ranging from 7.5 to 8.0.Hardness ranged from 10 to 258 mg/I, but generallyranged from 60 to 180 mgt!. Very hard water is found inwells in the outcrop area and south of the outcrop in abelt about 15 miles wide. Wells south of this belt yieldsoft water.
Electrical logs indicate that there are areas in thesouthern part of the county where slightly saline water ispresent in the upper part of the Jasper aquifer. Thelocations of these areas are shown on Figure 9.
Temperatures of water from 38 flowing orpumped wells screened in the Evangeline aquifer and inthe upper part of the Jasper aquifer indicate a thermalincrease of about 1°C per 125 feet increase indepth (1 ° F per 70 feet). However, a larger gradientexists near the Humble Dome. Based on the thermalgradient, fresh water as warm as 35°C (95°F) is probablypresent at the base of the upper part of the Jasperaquifer.
Burkeville Aquiclude
Only one water well, TS-60-34-502, completed insands within the Burkeville aquiclude was sampled inMontgomery County. Electrical-log interpretations indicate that as much as 65 feet of fresh water-bearing sandis present in the aquiclude. However, this sand isdiscontinuous because the Burkeville is mostly clay.
Evangeline Aquifer
Analyses of water from wells in the Evangelineaquifer indicate that water in this unit is generally freshand hard, with the hardest water occurring in or near theoutcrop area. Electrical-log interpretations indicate thatwater in the aquifer is fresh throughout most of thecounty. Dissolved solids ranged from 66 to 3,420 mgt!.However, most of the samples had a dissolved-solidscontent that ranged from 250 to 400 mgt!.
Only three samples had dissolved-solids contentgreater than 700 mgt!. Two came from wells(TS-60-53-302 and TS-60-53-311) in areas of abandonedsalt-water disposal pits, and the other came from a well(LJ-65-06-305) near the Humble Dome. Hardness rangedfrom 21 to 1,890 mg/I, but the range for most sampleswas from 60 to 180 mgt!. Hardness exceeded 500 mg/Iin samples from two wells (TS-60-53-302 andTS-60-53-311) in areas of abandoned salt-water disposalpits.' All of the soft water came from wells south of theoutcrop area. The samples that had a dissolved-solidscontent greater than 400 mg/I, but less than 700 mg/Icame from wells developed in or near the outcrop area.

The pH of the water samples ranged from 5.f) to 8.2, butmost of the samples had a pH of 6.5 to 7.5. Sampleswith a pH of less than 6.5 came from shallow wells southof the outcrop area.
Chicot Aquifer
Water from the Chicot aquifer is generally soft andfresh. Hardness ranged from 8 to 140 mgll, but wasgenerally less than 60 mg/l. The pH ranged from 5.0to 7.5, but most of the samples had a pH of 5.0 to 6.7.Dissolved solids ranged from 36 to 268 mg/I, but mostof the samples had a dissolved-solids content of lessthan 150 mg/1.
Water-Qual ity Problems
Although most of the water contained in theupper part of the Jasper, the Evangeline, and the Chicotaquifers is fresh, some water-quality problems, involvingwaters that are hard, corrosive, or iron-bearing, exist inMontgomery County. All of these problems can beeffectively eliminated by proper well-completionmethods or water treatment.
The most popular treatment for hardne!ss is the useof an ion exchange or zeolite softener. A cold lime-sodasoftening precipitator may be used to remove hardness,iron, and manganese. Treatment for water hardness isnot commonly used in Montgomery County because thepeople have become adjusted to using hard water, andindustrial water usage is still slight.
Corrosive (acidic) ground waters are found in theEvangeline and Chicot aquifers. Such water may corrodepump parts (Figure 14), plumbing fixtures, and ironcasings in less than a year of contact. Table 11 showsfield measurements of pH and other paramet1ers.
There are two possible sources of iron in water inMontgomery County. One source is the solution of ironfrom ferruginous sands and gravels. The other source iscorrosion of well casings and water distribution systemsby water of low pH.
To alleviate the problem of iron caused by acidicwater acting on ferrous metal, materials such as fiberglass, stainless steel, or plastics may be used in theconstruction of the well and distribution system. Ironmay be removed by aeration, which precipitates theiron, and by filtration which removes the precipitatefrom the water. Various lime and oxidizin~1 filters mayalso be used to treat water with high iron content.
Disposal of Oil-Field Brines
According to data obtained from the files of theTexas Railroad Commission (Texas Water Commission
- 35-
and Texas Water Pollution Control Board, 1963),about 26 million barrels of oil-field brine was producedin Montgomery County during 1961. Of this total, 9.2percent was disposed of by miscellaneous means, 4.3percent was diverted to surface pits, and 86.5 percentwas disposed of by injection through wells that penetrated deep formations.
The disposal pits in Montgomery County havebeen located generally in sandy soils. Some of these pitswere abandoned because overflow of the brine tended todestroy vegetation and to contaminate nearby streams.Seepage from the pits contaminates shallow groundwater. A large number of these pits once existed in theConroe Oil Field, and shallow sands in some areas ofabandoned pits still contain brine. A water sample fromwell TS-60-53-311 completed in one such areacontained 2,140 mg/I chloride. The Texas Railroad Commission issued orders, effective January 1, 1969, to closeall salt-water disposal pits in the State.
The disposal of oil-field brines has not resulted inwidespread damage to the chemical quality of theground-water supplies in Montgomery County, butdamage has occurred in local areas. Considerable care iscurrently exercised in the disposal of brines and othermunicipal and industrial wastes.
Protectiot1 of Water Quality inOil-Field Drilling Operations
The Texas Railroad Commission requires thatdrilling contractors use casing and cement or by alternative protection devices to protect fresh-water stratafrom contamination. In recent years, the Texas WaterDevelopment Board has made recommendations to theoil operators and the Railroad Commission on thedepths to which the water of usable quality should beprotected. Where oil or gas fields are established, therecommended depths are incorporated in the field rules.Figure 15 shows the depth of protection required by theTexas Railroad Commission and the depth of fresh toslightly saline water in various oil fields in MontgomeryCounty. The water-bearing strata in the older fields are,in general, not as well protected as in the more recentlydeveloped fields.
DEVELOPMENT OF GROUND WATER
Use of Ground Water
Duri ng the early days of settlement ofMontgomery County, the only water used was fordomestic and livestock purposes. This water was drawnfrom shallow dug wells, natural and developed springsand ponds, and streams. Deusse., (1914, p. 306)reported that as early as 1901, deep wells had beendrilled to supply the steam boilers of locomotives. The

1,,
jI
Figure 14
Comparison of New and Corroded Check Valves
. 36 .

Figure '15.-Comparison Between Depth of SandsContaining Fresh to Slightly Saline Water and
the Depth of Protection Required in OilFields in Montgomery County
The use of ground water has increased with theincrease in population and industry. In 1850, probablyless than 0.5 mgd (million gallons per day) of ground
earliest reported deep wells were drilled in towns thathad railroad switches, such as Fostoria, Wilburton,Esperanza, Conroe, Tamina, and Splendora. The searchfor oil brought in many flowing water wells, some ofwhich are still in use.
Durin!J the period 1910-43, ground water wasdeveloped for public supply, saw mills, railroads, oil andgas production, and pipeline stations. By the mid-1950's,the city of Conroe developed a well field, and recreational camps and clubs used drilled wells. By 1960, afew petroleum-related industries moved near Conroe anddeveloped deep wells. The most recent ground-waterdevelopers are the small communities and real estatesubdivisions.
VVater-Level Declines andL.and-Surface Subsidence
Periodic measurements of water levels have beenmade in Montgomery County since 1931 (Tables 7and 9). According to Deussen (1914, p.304-306),Livingston (1939, p.1-6), and Rose (1943, p.2-17),wells completed in the upper part of the Jasper aquiferin the early HlOO's flowed as much as 750 gpm. Staticwater levels in these wells at that time were as follows:about 45 feet above land surface at Tamina, 20 feetabove land surface at Conroe and Dobbin, and 25 feetabove land sur'face at Fostoria. By the mid-40's, many ofthe wells at Conroe stopped flowing, and in 1967, somewater levels were 30 feet below land surface. However,some of the wells still flow. Static water levels in theflowing wells in 1966-67 are as follows: about 20 feetabove land surface at Tamina, 10 feet above land surfaceat Dobbin, and 5 feet above land surface at Fostoria.Since developrmmt began, water levels have declined asmuch as 50 feet in wells tapping the upper part of theJasper aquifer at Conroe, 10 feet at Dobbin, 20 feet atFostoria, and 25 feet at Tamina. Figure 16 shows thefluctuations o'f water levels in two wells completed inthe upper part of the Jasper aquifer at Conroe. Thelong-term decline of these water levels is probablyrelated to purnpage, but variations in average rainfallmay cause short-term fluctuations.
Water levels have declined in wells completed inthe EvangelinE! aquifer. According to Deussen (1914,p.304-306), Livingston (1939, p. 1-6), and Rose (1943,p. 2-17), water levels in wells developed in this aquifer atFostoria and Tamina were about 10 and 5 feet aboveland surface in the 1900's, but these wells no longerflow. Many wells completed in this aquifer in the ConroeOil Field during the 1930's and 1940's flowed, but bythe early 1950's, many of them stopped flowing. Since
Figure 1"7 shows the approximate altitude of waterlevels in wells screened in the upper part of the Jasperaquifer, based on measurements made in the 1966-67period. The average hydraulic gradient is 2.7 feet permile.
water was withdrawn. In 1900, about 3.5 mgd wasproduced; in 1940, about 4.7 mgd was withdrawn.About 6.2 mgcl was pumped from ground-water aquifersin Montgomery County in 1966. Table 6 shows, byaquifers, the quantity of ground water that was pumpedfor public supply, rural domestic and livestock, industrial, and irri!)ation uses in the county in 1966. Thefigures are based on population data and industrial usageestimates. About 81 percent of the ground waterwithdrawal in 1966 was for public supply, domesticsupply, and Iivestock uses; about 18 percent was forindustrial use, and 1 percent for irrigation. The upperpar t 0 f the Jasp er supp lied 3. 50 mgd; theEvangeline, 2.Ei4 mgd; and the Chicot, 0.05 mgd.
Unprotected fresh toslightly saline water
b'0'<"'"
.q}~~"~' ~ t}
~lj 0-' ,.<::- ~\ ~~<t. ",0\" ...~ cJ"I:l Ii \0" 0" 0" ~" ,0
':t-"<Q"~ <0"<::- c.P<::-
<::-\ r¥ <::l' «.0"c.P c.; ,,5:'
Depth of cemented cosingspec if ed in field rules of theTexas Railroad Commiss ion
-
I- >c, ->C,,
I- ~ ~ -<:, ~)( ~
~~ ~ f/
~~ ~ ~
I- ~~ ~ ~-[I; ~I--~~
~ ~ ~ ~I- ~~ ~ ~ ~
~ ~ ~~ ~ ~ -
f/j
~~ ~I-
~-
~ ~
~ ~ ~~I-
~-
~ ~~ r~~ ~
-
I-- ~~
'----'--
4000
3600
~ 2000.....JWmIw~ 2400
~
II-~ 2800o
w 1200u~a::J
If) 1600oz~.....J
800
o
3200
400
- 37-

Table G.-Estimated Use of Ground Water in Montgomery County, 1966
AQUIFER (MGO)USE UPPER PART EVANGELINE
OF JASPER
Public supply 2.28 0.07
Rural domestic .53 2.07and livestock
II ndustrial .69 .44
Irrigation .06V
Totals 3.50 2.64
y 70 acre-feet, from 1964 records (G illett and Janca. 1965, p. 20).
CHICOT
0.05
0.05
TOTAL PERCENTAGE(MGO)
2.35 37.9
2.65 42.9
1.13 18.2
.06V 1.0
6.19 100.0
development began, water levels in wells tapping theEvangeline aquifer have declined as much as 50 feet atFostoria and 35 feet at Tamina.
Figures 18 and 19 show the altitude of water levelsin wells in the Evangeline aquifer measured in 1942-43and 1966-67. The average hydraulic gradient increasedfrom 4.3 to 5.4 feet per mile from 1943 to 1967. Waterlevels declined 10 to 25 feet in the Conroe area and 40to 50 feet in the southeastern part of the county. Therate of water-level decline in the southeastern part of thecounty was as much as 2.1 feet per year. The areas ofpumpage changed very little. Pumpage from theEvangeline increased about 0.5 mgd to 2.5 mgdbetween 1943 and 1967. Ground water taken from the"Heavily Pumped Layer" in Harris County, the equivalent of the Evangeline in Montgomery County, haslowered water levels in wells tapping the Evangelineaquifer in the southeastern part of Montgomery County.
Water levels in the Chicot aquifer, which areclosely related to fluctuations of recharge, do not show along-term trend. Figure 12 shows water levels in wellscompleted in the aquifer. The average hydraulic gradient'is about 3.8 feet per mi Ie. Figure 20 shows the fluctuation of selected water levels in a well tapping the Chicotat Conroe.
Water-level declines have caused some subsidenceof the land surface in the southern part of MontgomeryCounty. Withdrawal of water from the artesian aquifersresults in an immediate decrease in the hydraulicpressure in the aqu ifers. The resulting pressure differencebetween the sands and clays causes water to move fromthe clays into the sands, and the clays are compressed.Some of the clay particles are permanently rearrangedand the clay :is permanently compacted. As compressionand compaction of the beds occur, the land surfacesubsides (Winslow and Doyel, 1954; Winslow andWood, 1959).
- 38·
Slight decreases of altitude along the level linesestablished by the U.S. Coast and Geodetic Survey showthat less than 0.5 foot of land surface subsidence hasoccurred between 1943 and 1964 in the southern half ofMontgomery County (Gabrysch,1967, fig. 19). Thisprobably has been caused by the large ground-waterwithdrawals in the adjacent Houston district. However,greater amounts of subsidence may have occurred inMontgomery County in the vicinity of oil, gas, andsalt-water withdrawals.
Well Construction
Most large capacity wells in Montgomery Countyare in the Conroe area. When a well is to be drilled formunicipal or industrial use, a small diameter test hole isdrilled by the hydraulic-rotary method to the depthdesired, usually to the base of the upper part of theJasper aquifer. During drilling, formation samples arecollected, and upon completion of the test holes, anelectrical log may be run.
If the data collected indicate favorable conditions,the test hole is reamed from 16 to 24 inches in diameterfrom the surface to or near the top of the first sand tobe screened. A 12- to 20-inch diameter casing, called thepump pit, or surface casing, is installed and cementedinto place. The section of sand to be screened is thenreamed to a large diameter hole (about 30 inches) usingthe largest reamer that can pass the surface casing. Thescreen is then installed and the bottom of the screen isclosed off with a back-pressure valve.
The wells are finished with a perforated section ofpipe 6 to 14 inches in diameter that has been wrappedwith stainless steel wire (fiberglass was used in a recentlycompleted well, TS-60-45-605, for the casing below thepump pit and the well screen). In gravel-packed wells,the openings in the screen range from 0.040 to 0.050inches in diameter. This opening is larger than the

diameters of most of the sand grains but smaller than thediameters of most of the gravel particles in the gravelpack. Blank pipe of the same diameter as the screenextends above 100 feet from the top of the screen intothe surface casing. Sized gravel is placed around thescreen by means of a gravel tube, which is withdrawn asthe annular space is filled with gravel. The gravelincreases the effective diameter ()f the well and protectsthe screen from caving of the sand.
The well is developed by surging, swabbing,pumping, back-washing, by the use of chemicals, or by acombination of these processes until the specific capacity and sand-water ratio is satisfactory. Finally, the wellis tested by pumping for 4 to 24 hours, during whichtime samples of water are collected for chemicalanalyses.
The size and type of pump installed dependsprincipally upon the pumping lift and the quantity ofwater reeded. In general, municipal and industrial wellsin Montgomery County have high-capacity, deep-wellturbine pumps powered by electricity .. The wells produce from 200 to 1,200 gpm (gallons per minute). Pumpsettings range from about 50 to 200 feet below landsurface. Specific capacities range from 3 to 12 gallonsper minute per foot of drawdown.
Most of the small-capacity wells that furnish waterfor domestic use and small industry in the county arecompleted with a straight wall and a single screen. Thesize of the screen and pipe ranges from 1-1/4 to 4 inches.In some smali-capacity wells more than one size ofscreen or pipe may be used.
In the construction of some smaU-capacitymunicipal, industrial, and domestic wells, 4- or 6-inchcasing is cemented from the surface to the top of thesand to be developed. Then a slightly smaller size screenis lowered through the pipe and set in the sand. A shortsection (1 to 10 feet) of blank pipe and·a lead nipple areplaced on top of the screen. The lead nipple is battereddown to form a seal between the surface pipe and thepipe to which the screen is attached. The screen isusually stainless steel or plastic because these materialsare resistant to corrosion. The openings in the screenrange from 0.08 to 0.018 inch in diameter, which issmaller than the diameter of most of the sand grains.
Most small-capacity wells are equipped with smalljet pumps or air compressors. Larger jet pumps, smallcapacity deep well turbines, and submersible pumps arealso common.
AVAILABILITY OF GROUND WATER
The availability of water for future developmentfrom the aquifers in Montgomery County is dependentupon a number of factors. The most important are: theability of the aquifers to transmit water; the amount of
- 49-
water in storage; the rate of recharge to the aquifers; thechemical quality of the water; and economic factorsincluding the cost of wells.
The altitude of the base of fresh water rangesfrom 1,670 feet below sea level in the northwesterncorner of the county to 3,870 feet below sea level in thecentral part (Figure 21).
The potential for development of the fresh-waterresources of Montgomery County is greater in the areaswhere the total thickness of sands is greater. Figure 22shows the thickness of sands containing fresh waterbelow the Burkeville aquiclude (sands in the CatahoulaSandstone and in the lower and upper parts of the Jasperaquifer). The thickness of the sands ranges from 30to 550 feet, and averages about 200 feet.
The sands of the Evangeline and Chicot aquifers(the sands above the Burkeville aquiclude) contain onlyfresh water. F igu re 11 is a map of the base of theEvangeline aquifer showing the thickness of fresh waterbearing sands in the Evangeline and Chicot aquifers.These sands are as thick as 570 feet in the southeasternpart of the county and average about 250 feetthroughout the county.
The altitude of the base of slightly saline waterranges from less than 1,500 feet below sea level in thewest central part of the county to 3,870 feet below sealevel in the central part (Figure 23). The thickness ofsand below the Burkeville aquiclude containing fresh toslightly saline water ranges from 80 to 780 feet(Figure 24).
Storage calculations were based on anestimated 250-foot thickness of fresh water-bearingsands a bove the Burkeville aquiclude and anestimated 200-foot thickness of fresh water-bearingsands below the Burkeville. A porosity of thirty percentis assumed. The volume of fresh water stored in theaquifers underlying Montgomery County is estimated tobe about 80 million acre-feet, of which 40 millionacre-feet is in the Evangeline and Chicot aquifers, 30million acre-feet is in the upper part of the Jasperaquifer, and 10 million acre-feet is below the upper partof the Jasper. Theoretically, about half of this amountof water could be drained from the aquifers assuming norecharge. By orderly development and by utilizingrecharge, the quantity of ground water economicallyrecoverable may in time greatly exceed the quantity ofwater now in storage.
A large quantity of water is available from artesianstorage and from compaction of clays. The water fromclay compaction cannot be replaced by naturalprocesses. On the basis of studies made in the Houstonarea, when compaction occurs, it is estimated that 0.5to 1.0 foot of land-surface subsidence will occur per 100feet of water-level decline (Winslow and Doyel, 1954,p. 143), thus releasing from storage an equivalentvol ume of water.

The calculations of the present quantity of watermoving through an aquifer are based upon the transmissibility of the aquifer, the hydraulic gradient, and widthof the aquifer. Coefficients of transmissibility of 36,000gpd per foot and 50,000 gpd per foot were assumed forthe upper part of the Jasper aquifer and the Evangelineaquifer, respectively. On the basis of these assumptions,about 3.4 mgd, or 3,800 acre-feet per year, is movingthrough the upper part of the Jasper aquifer across a lineperpendicular to the hydraulic gradient at Conroe.Approximately 9.5 mgd, or 10,600 acre-feet per year, ismoving through the Evangeline aquifer across this line.These figures are based on the present hydraulicgradients of 2.7 feet per mile in the upper part of the.Jasper aquifer and 5.4 feet per mile in the Evangelineaquifer.
One of the principal factors in determining thequantity of water available is the ability of an aquifer totransmit water to wells. The transmission capacity of anaquifer, as defined by Wood and others (1963, p. 98), isthe quantity of water that can be transmitted through agiven width of an aquifer at a given hydraulic gradient.Calculations of the potential transmission capacity ofthe upper part of the Jasper aquifer and the Evangelineaquifer in Montgomery County were based on theseassumptions:
1. Water levels will be lowered to 400 feet belowland surface along a line that is perpendicular tothe direction of water movement and approximately parallel to the outcrop of the aquifers. Thisline, which would pass through Conroe, about 19miles southeast of the outcrop, would be 36 mileslong.
2. Recharge to the aquifer occurs only along aline, parallel to the line of discharge, that is in themiddle of the outcrop area.
3. Water levels in the area of the outcrop will notdecline.
4. The hydraulic gradient is the slope of a straightline between the average altitude of the waterlevels at the outcrop and the altitude of the waterlevels at the line of discharge. After water levelsare lowered to 400 feet along the line of discharge,the hydraulic gradient would be 24 feet per mile.
5. All sands between the line source of rechargeand the line of wells will transmit water from theoutcrop to the line of discharge. These sands havean average thickness of 300 feet and an averagecoefficient of permeability of 250 gpd per squarefoot. The coefficient of transmissibility i,s 75,000gpd per foot.
Under these conditions, the transmission capacityof the upper part of the Jasper and the Evangelineaquifers would be 65 mgd, or 72,800 acre-feet per year.
- 50-
An even greater perenn ial supply of fresh water can beobtained if the fresh water-bearing sands in the lowerCatahoula Sandstone, and lower part of the Jasper andthe Chicot aquifers are developed.
The area of the outcrop of the Evangeline andupper part of the Jasper aquifers comprises about 790square miles in Grimes, Montgomery, and WalkerCounties. About 1.7 inches of recharge per year wouldbe required in this area to maintain a transmissioncapacity of 65"mgd. This quantity of required recharge israther small compared to the quantity available in otherparts of southeastern Texas. If the rejected recharge(spring flow) in the outcrop areas were salvaged, anadditional 140,000 acre-feet of water peryear (125 mgd) would be available. Calculations ofrejected recharge are based on streamflow records forCaney Creek near Splendora from 1944 to 1967, PeachCreek at Splendora from 1944 to 1967, Spring Creeknear Spring from 1939 to 1967, and West Fork SanJacinto River near Conroe from 1924 to 1927 and 1939to 1967.
Another way to estimate the quantity of freshground water avai lable for development in MontgomeryCounty is to compare this area to areas having similarhydrologic systems in which large developments havetaken place, such as the Houston district and LibertyCounty. Observations of the performance of the aquifersin response to large withdrawals have been made inthe 5,000 square miles of the Houston districtsince 1929. Pumping in the Houston district is from theChicot and Evangeline aquifers exclusively. Pumpage ofground water in the Katy and Houston areas wasabout 186 mgd in 1960 and 278 mgd in 1965(Gabrysch, 1967, p. 11). Since development began,water levels have declined as much as 50 feet in the Katyarea and 250 feet in the Houston area (Wood andGabrysch, 1965, fig. 10; Gabrysch, 1967, p. 21).
In 1965, about 51 mgd was pumped in LibertyCounty, and about 200 mgd was estimated to beperennially available from properly spaced wellsdeveloped in the Chicot and Evangeline aquifers,without excessive water-level declines (Anders andothers, 1968, p.30 and 46). The water-bearing beds inLiberty County are considered to be less, prolific thanthose in the Houston district. The upper part of theJasper aquifer, which contains fresh water along thenorthern boundary of Liberty County, was not includedin this estimate.
It was conservatively estimated that about 56 mgdcould be pumped from wells developed in the Chicotand Evangeline aquifers in the southern part of Austinand Waller Counties (Wilson, 1967, p. 68).
The aquifers in Montgomery County are verysimi lar to those in Austin, Waller, and Liberty Counties,and in the Houston and Katy areas. MontgomeryCounty, in fact, is the recharge area for much of the

ground water withdrawn in the Houston district. Withthe proper spacing and development of wells, about 150mgd of ground water could be pumped perennially fromthe upper part of the Jasper, Evangeline, and Chicotaquifers in Montgomery County, with onlv moderatewater-level declines and land-surface subsidence. Additional supplies of fresh water could be obtained fromsands below the upper part of the Jasper .. Currently,about 6.2 mgd, or 4 percent of the available supply isbeing used.
Aground-water development of 1510 mgd inMontgomery County probably would affect large scaleground-water development in adjoining areas, especiallyin the Houston district. The effect in the Houstondistrict would be an accelerated decline in water levelsand probably a reduction in the yields of wells.
Wells yielding 1,000 gpm could be developedanywhere in Montgomery County, and in many areas,wells yielding 3,000 gpm could be developed. This isconfirmed in Waller and Harris Counties (Wilson, 1967,Table 5; Lang and Winslow, 1950, p.6) by yields ofwells developed in sands similar to those present inMontgomery County.
The upper part of the Jasper aquifer will probablybe developed first in Montgomery County because itcontains softer water which is under the highest pressurehead. With increased pumping, the head in the upperpart of the Jasper will be lowered, and as a result, morewells will be completed in the Evangeline aquifer.Except in areas of large withdrawals, wells completed inthe Evangeline aquifer will have higher water levels thanthose completed in the Chicot aquifer. Eventually, theChicot aquifer win be developed.
NEED FOR FUTURE STUDIES
The present investigation described the basichydraulic framework of the aquifers. A continuingprogram of hydrologic data collection is prerequisite to
- 51 -
efficient development of the ground-water resources.This work should include the following:
1. A continuing inventory should be conducted ofall new large-capacity wells, including the collection of drillers' and electrical logs and wellcompletion data. Annual inventories of the quantities of ground water used should be made.
2. Periodic measurements of water levels in representative wells should be made to observe changesin the hydraulic gradients and to observe the effectof pumping. An adequate number of wells in therecharge areas should be included.
3. Pumping tests should be made on new largecapacity wells to more accurately determine theaqu ifer characteristics.
4. Measurements of base flow of streams shouldbe made to determine more accurately thequantities of rejected recharge available for futureuse.
5. U.S. Coast and Geodetic Survey benchmarksshould be relevelled to determine land-surfacesubsidence.
6. A study should be conducted of the relationships between acid ground water, rainfall, andforest cover; and between hard ground water andlimy and clayey soils as a method of delineatingareas of corrosive ground water.
The continuing program of basic-data collection mustextend into adjoining counties because the effects of thedevelopment in nearby areas will affect the ground-watersupplies in Montgomery County. The area of observationshould include, in addition to Montgomery County, atleast half of Walker County and parts of the otheradjoining counties.

REFERENCES CITED
Anders, R. B., McAdoo, G. D., and Alexander, W. H.,Jr., 1968, Ground-water resources of Liberty County,Texas: Texas Water Devel. Board Rept. 72,140 p.
Bernard, H. A., and LeBlanc, R. J., 1965a, Resume ofthe Quaternary geology of the northwest Gulf ofMexico, in the Quaternary of the United States: NewJersey, Princeton Univ. Press, p. 137-185.
__1965b, Resume of Quaternary geology of thenorthwestern Gulf of Mexico province: Shell Devel.Co., EPR Pub. 400.
Bernard, H. A., LeBlanc, R. J., and Major, C. F., 1962,Recent and Pleistocene geology of southeast Texas, inGeology of the Gulf Coast and central Texas andguidebook of excursions: Houston Geol. Soc., Ann.Meeting Geol. Soc. of America and associatedsocieties, Houston, Texas., p. 175-224.
Bureau of Economic Geology, 1968, Geologic atlas ofTexas, Beaumont sheet: Univ. Texas, Bur. Econ.Geology map.
Collins, W. D., 1926, Relations between quality of waterand industrial development in the United States: U.S.Geol. Survey Water-Supply Paper 559,43 p.
Conklin, H. L., 1956, Water requirements of thecarbon-black industry: U.S. Geol. SurveyWater-Supply Paper 1330-B, p. 73-101.
Cooper, H. H., Jr., and Jacob, C. E., 1946, A generalizedgraphical method for evaluating formation constantsand summarizing well-field history: Am. Geophys.Union Trans., v. 27, p. 526-534.
Darton, N. H., Stephenson, L.. W., and Gardner,Julia, 1937, Geologic map of Texas: U.S. Geol.Survey geol. map.
Deussen, Alexander, 1914, Geology and undergroundwaters of the southeastern part of the Texas CoastalPlain: U.S. Geol. Survey Water-SupplyPaper 335, 365 p.
Doering, John, 1935, Post-Fleming surface formations ofsouthwest Texas and south Louisiana: j~m. Assoc.Petroleum Geologists Bull., v. 19, no. 5, p.651-688.
Fenneman, N. M., 1938, Physiography of eastern UnitedStates: New York, McGraw-Hili Book Co.,Inc., 714 p.
Ferris, J. G., Knowles, D. B., Brown, R. H., andStallman, R. W., 1962, Theory of aquifer tests: U.S.Geol. Survey Water-Supply Paper 1536-E, 173 p.
- 53-
Fisk, H. N., 1940, Geology of Avoyelles and RapidesParishes: Louisiana Dept. Conserv. Bull. 18,240p., 50 figs.
Gabrysch, R. K., 1967, Development of ground water inthe Houston district, Texas, 1961-65: Texas WaterDevel. Board Rept. 63, 35 p.
Gillett, P. T., and Janca, I. G., 1965, Inventory of Texasirrigation, 1958 and 1964: Texas Water Comm.Bull. 6515, 317 p.
Hackett, O. M., 1962, Ground-water levels in the UnitedStates, 1956-59, south-central states: U.S. Geol.Survey Water-Supply Paper 1549, 192 p.
Hem, J. D., 1959, Study and interpretation of thechemical characteristics of natural water: U.S. Geol.Survey Water-Supply Paper 1473, 269 p.
Jones, P. H., 1952, Electric-logging methods, principlesof interpretation, and applications in ground-waterstudies: U.S. Geol. Survey open-file rept., 34 p.
Kane, J. W., 1967, Monthly reservoir evaporation ratesfor Texas, 1940 through 1965: Texas Water Devel.Board Rept. 64, 111 p.
Lang, J. W., and Winslow, A. G., 1950, Geology andground-water resources of the Houston district,Texas: Texas Board Water Engineers Bull. 5001, 55 p.
Livingston, Penn, 1939, Records of wells, drillers' logs,water analyses, and map showing location of wells inMontgomery County, Texas: Texas Board WaterEngineers duplicated rept., 13 p.
Maier, F. J., 1950, Fluoridation of public water supplies:Am. Water Works Assoc. Jour., v. 42,pt. 1, p. 1120-1132.
Metcalf, R. J., 1940, Deposition of Lissie and BeaumontFormations of the Gulf Coast of Texas: Am. Assoc.Petroleum Geologists Bull., v. 24, no. 4, p. 693-700.
Michaux, F. W., Jr., and Buck, E. 0., 1936, Conroe OilField, Montgomery County, Texas, Am. Assoc.Petroleum Geologists Bull., vol. 20, no. 6, p. 736-779.
Moore, E. W., 1940, Progress report on the committeeon quality tolerances of water for industrial uses:New England Water Works Assoc.Jour., v. 54, p. 261-272.
Mussey, O. D., 1955, Water requirements of the pulpand paper industry: U.S. Geol. Survey Water-SupplyPaper 1330-A, p. 1-71.

Mussey, O. D., 1957, Water requirements of the rayonand acetate fiber industry: U.S. Geol. Survey WaterSupply Paper 1330-D, p. 141-179.
Rayner, F. A., 1959, Records of water-levelmeasurements in Chambers, Liberty, andMontgomery Counties, Texas, 1931 throughApril 1958: Texas Board Water EngineersBull. 5901, 33 p.
Rose, N. A., 1943, Records of wells, drillers' logs, wateranalyses, and map showing locations of wells inMontgomery County, Texas: Texas Board WaterEngineers duplicated rept., 30 p.
Sandeen, W. M., 1968, Ground-water resources of SanJacinto County, Texas: Texas Water Devel. BoardRept. 80, 89 p.
Sayre, A. N., 1957, Water levels and artesian pressures inobservation wells in the United States, 1955, Pt. 4,South-central states: U.S. Geol. Survey Water-SupplyPaper 1407,216 p.
Sellards, E. H., Adkins, W. S., and Plummer, F. B., 1932,The geology of Texas, v. 1, Stratigraphy: Univ. TexasBull. 3232, 1007 p.
Swenson, H. A., and Baldwin, H. L., 1965, A primer onwater quality: Washington, U.S. Govt. PrintingOffice, 27 p.
Taylor, T. U., 1907, Underground waters of the CoastalPlain of Texas: U.S. Geol. Survey Water-SupplyPaper 190, 73 p.
Texas Water Commission and Texas Water PollutionControl Board, 1963, A statistical analysis of data onoil field brine production and disposal in Texas forthe year 1961 from an inventory conducted by theTexas Railroad Commission: Summary vol., 81 p.
U.S. Public Health Service, 1962, Public Health Servicedrinking water standards: Public Health ServicePub. 956, 61 p.
U.S. Salinity Laboratory Staff, 1954, Diagnosis andimprovement of saline and alkali soils: U.S. Dept.Agr. Handbook 60, 160 p.
Weeks, A. W., 1945, Oakville, Cuero, and GoliadFormations of Texas Coastal Plain between BrazosRiver and Rio Grande: Am. Assoc. PetroleumGeologists Bull., v. 29, no. 12, p. 1721-1732.
- 54-
Wenzel, L. K., 1942, Methods for determiningpermeability of water-bearing materials, with specialreference to discharging-well methods: U.S. Geol.Survey Water-Supply Paper 887, 192 p.
Wilcox, L. V., 1955, Classification and use of irrigationwaters: U.S. Dept. Agr. Circ. 969, 19 p.
Wilcox, L. V., Blair, G. Y., and Bower, C. A., 1954,Effect of bicarbonate on suitability of water forirrigation: Soil Sci., v. 77, no. 4, p. 259-266.
Wilson, C. A., 1967, Ground-water resources of Austinand Waller Counties, Texas: Texas Water Devel.Board Rept. 68, 231 p.
Winslow, A. G., 1950, Geology and ground-waterresources of Walker County, Texas: Texas BoardWater Engineers Bull. 5003, 48 p.
Winslow, A. G., and Doyel, W. W., 1954, Land-surfacesubsidence and its relation to the withdrawal ofground water in the Houston-Galveston region,Texas: Economic Geol., v. 49, no. 4, p. 413-422.
Winslow, A. G., and Kister, L. R., 1956, Saline-waterresources of Texas: U.S. Geol. Survey Water-SupplyPaper 1365, 105 p.
Winslow, A. G., and Wood, L. A., 1959, Relation of landsubsidence to ground-water withdrawals in the upperGulf Coast Region, Texas: Mining Eng., Am. Inst. ofMining Eng., Ann. Meeting, 13 p.
Wood, L. A., 1956, Availability of ground-water in theGulf Coast Region of Texas: U.S. Geol. Surveyopen-file rept., 55 p.
Wood, L. A., and Gabrysch, R. K., 1965, Analog modelstudy of ground water in the Houston district, Texas:Texas Water Comm. Bull. 6508,103 p.
Wood, L. A., Gabrysch, R. K., and Marvin, Richard,1963, Reconnaissance investigation of theground-water resources of the Gulf Coast Region,Texas: Texas Water Comm. Bull. 6305, 123 p.

Table S.-Drillers' Logs of Wells in MontgolT\!!ry and Adjacent Counties
THICKNESS DEPTH THICKNESS DEPTH(FEET) (FEET) (FEET) (FEET)
Montgomery County Sand, medium, white and ~Iack 37 401
Well TS-6G-29-802 Shale 402
Owner: Mrs. MerrillDriller: Con-Tex Water Well Co.
Well TS-6G-34-604
Sand and red clay 12 12 Owner: Robert E. WebbDriller: Tomball Drilling Co.
Sand, brown 12 24 Soil 8 8
Clay with gravel 129 153 Shale, red 7 15
Sand, white 30 183Sand 6 21
Well TS-6G-34-502 Shale, blue 5 26
Owner: Texas Forest Product Co. Sand 12 38
Driller: Layne-Texas Co.Shale 29 67
Clay 5 5Sand, salt and pepper 22 89
Sand, soft 39 44
Clay, brown 24 68 Well TS-6G-34-903
Clay, sandy 8 76 Owner: GrayDriller: Con-Tex Water Well Co.
Sand, fine and clay, broken 8 84Clay 31 31
Shale, tough, brown and blue 27 111Sand 19 50
Sand, fine, white 23 134Sand and clay 4 54
Shale, sandy 6 140Sand 19 73
Shale, soft, sandy 22 162
Shale, tough, brown, and blue 25 187 Well TS-6G-35-302
Sand, hard, fine, and Owner: J. A. Bond
shale with lime streaks 31 218 Driller: Con-Tex Water Well Co.
Shale 3 221 Clay, red and sand 20 20
Shale, sandy, and lime 4 225 Clay and iron ore 32 52
Shale, sandy 4 229 Sand and sandy shale 4 56
Shale, tough 7 236 Sand, white 20 76
Shale, sandy 15 251 Shale and lime streaks 28 104
Shale, tough 12 263 Sand, gray and black 22 126
Shale, sand with hard lime streaks 28 291 Sand, shale, and lime 6 132
Rock 292Well TS-60-35-802
Sand and shale, broken 12 304Owner: City of Montgomery
Sand and shale, streaks 14 318 Driller: Falkenbury
Sand and shale, broken 6 324 Clay and rock 70 70
Sand, fine, white and black 11 335Sand 10 80
Shale 2 337No record 5 85
Sand, medium, white and black 9 346 Sand 20 105
Rock 347 Clay 90 195
Shale, sandy 17 364 Sand, fine 25 220
- 82·

Table S.-Drillers' Logs of Wells in Montgomery and Adjacent Counties-Continued
THICKNESS DEPTH THICKNESS DEPTH(FEET) (FEET) (FEET) (FEET)
Well T8-6~35-802-Continued Shale and boulders 42 512
Clay and rock 235 455 Shale, sticky 108 620
Clay 65 520 Shale, sandy 130 750
Sand 70 590 Sand, artesian flow 24 774
Shale 46 820Well TS-6~36·20 I
Shale, sticky 130 950Owner: Bonanza Corp.
Driller: Con-Tex Water Well Co. Sand, water 22 972
Clay 18 18 Shale and boulders 52 1,024
Sand with clay 12 30 Shale, sticky 76 1,100
Sand 44 74 Sand 12 1,112
Clay with sand 11 85 Shale, sticky 18 1,130
Sand 20 105 Shale 44 1,174
Sand, hard 106 Sand and boulders 47 1,221
Clay and gravel 13 119 Shale 89 1,310
Sand 34 153 Shale, sticky 90 1,400
Clay and lime 85 238 Sand, artesian flow 24 1,424
Sand 17 255 Shale 36 1,460
Shale and lime 29 284 Total depth 4,316
Sand, hard with clay streaks 90 374Well TS·60-36-601
Sand with shale streaks 25 399Owner: Hulan Lakes Subdivision
Shale 33 432 Driller: Con-Tex Water Well Co.
Sand 38 470 Clay, red 67 67
Sand and shale 3 473 Shale, sandy and sand, hard streaks 29 96
Sand, hard 2 98Well T5-60-36·401, partial log
Sandstone 99Owner: Luther E. HallDriller: Sprague Oil Co. Sand, hard streaks 6 105
Soil 8 8 Shale and lime 39 144
Sand 40 48 Shale, sand and lime 14 158
Shale 12 60 Lime, hard sandy 2 160
Shale, sandy 25 85 Shale and lime 34 194
Shale, stick~ 100 185 Shale, sandy 18 212
Shale and boulders 65 250 Sand 23 235
Shale, stick 1/ 60 310 Shale 3 238
Sand, artesian flow 20 330 Shale, sandy 11 249
Shale, stick 1/ 30 360 Sand 29 278
Sand, hard 24 384 Shale and sand streaks 9 287
Shale, sticky 64 448 Shale and lime 6 293
Sand, artesian flow 22 470 Sand 37 330
- 83-

Table S.-Drillers' Logs of Wells in Montgomery and Adjacent Counties-Continued
THICKNESS DEPTH THICKNESS DEPTH(FEET) (FEET) (FEET) (FEET)
Well T5-6G-36-601·Continued Clay and gravel 44 69
Sand and shale 16 346 Sand, hard and clay 11 80
Sand 38 384 Shale 24 104
Sand, hard streaks, and shale 45 429 Shale with lime 67 171
Sand 32 461 Sand 36 207
Well TS-6G-37-103 Well TS-6G-37·304
Owner: Ray F. Weston Owner: Afton Park Subdivision
Driller: Con-Tex Water Well Co. Driller: Kerns Water Wells
Clay and ore 12 12 Clay 14 14
Sand and red clay 27 39 Sand 17 31
Clay and gravel streaks 24 63 Clay 7 38
Sand, hard and red clay 11 74 Sand 39
Sand, hard streaks 10 84 Clay 12 51
Clay and sand 4 88 Sand, red 17 68
Sand, gray and black 9 97 Clay 38 106
Clay and sand streaks 8 105 Sand with hard streaks 11 117
Sand, brown 6 111 Clay, sand 9 126
Clay 23 134 Sand 8 134
Shale and hard sandy lime 16 150 Clay and rock 93 227
Shale and lime 27 177 Sand and rock 11 238
Sand, firm 32 209 Sand 18 256
Shale and lime 8 217 Clay and rock 38 294
Sand 36 253 Rock and sand 8 302
Sand 60 362Well TS-6G-37-105
Owner: Robert Hardy, Jr. Well TS-6G-37·401Driller: Con-Tex Water Well Co.
Owner: City of Willis, Well 1Clay 16 16 Driller: Layne-Texas Co.
Sand, hard 6 22 Clay, sandy 25 25
Clay with sand streaks 41 63 Gravel 15 40
Sand, hard and sandy lime 33 96 Clay 10 50
Clay with lime 16 112 Sand 30 80
Clay 5 117 Clay 50 130
Sand and shale 29 146 Clay, sandy 11 141
Sand 37 183 Clay 27 168
Clay with hard streaks 76 244Well TS-6O-37-202
Sand, hard 10 254Owner: S. Noviski
Driller: Con-Tex Water Well Co. Shale 22 276
Clay and gravel 8 8 Sand, hard fine 21 297
Sand 17 25 Shale' 23 320
- 84-
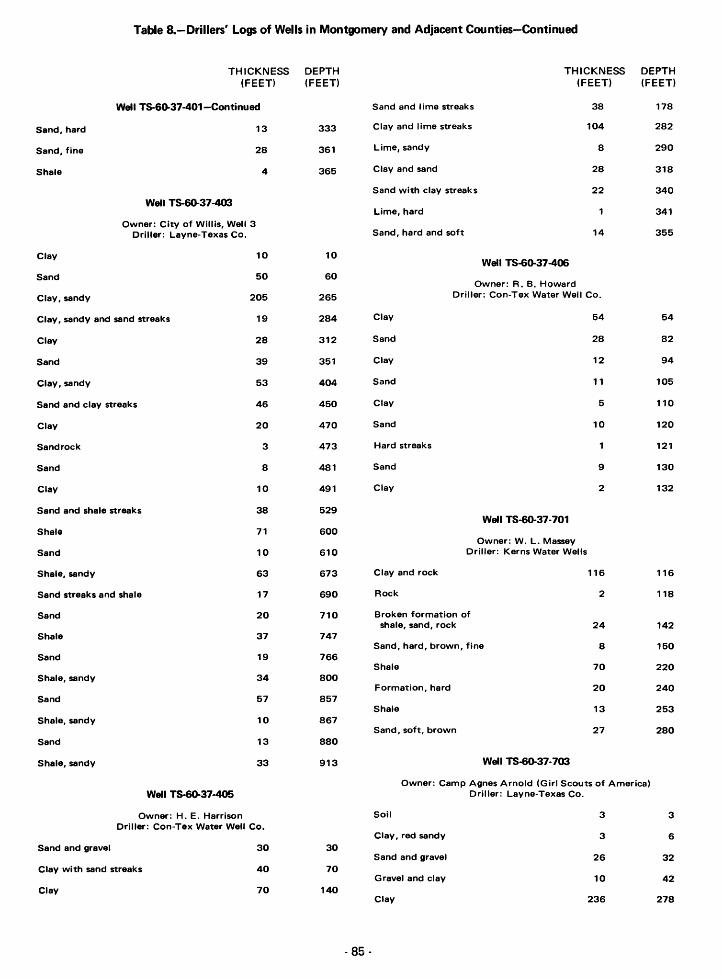
Table 8.-Drillers' Logs of Wells in Montgomery and Adjacent Counties-Continued
THICKNESS DEPTH THICKNESS DEPTH(FEET) (FEET) (FEET) (FEET)
Well TS-6D-37-401-Continued Sand and lime streaks 38 178
Sand, hard 13 333 Clay and lime streaks 104 282
Sand, fine 28 361 Lime, sandy 8 290
Shale 4 365 Clay and sand 28 318
Sand with clay streaks 22 340
Well TS-&o.37-403Lime, hard 341
Owner: City of Willis, Well 3Driller: Layne-Texas Co. Sand, hard and soft 14 355
Clay 10 10Well TS-6D-37-406
Sand 50 60Owner: R. B. Howard
Clay, sandy 205 265 Driller: Con-Tex Water Well Co.
Clay, sandy and sand streaks 19 284 Clay 54 54
Clay 28 312 Sand 28 82
Sand 39 351 Clay 12 94
Clay, sandy 53 404 Sand 11 105
Sand and clay streaks 46 450 Clay 5 110
Clay 20 470 Sand 10 120
Sandrock 3 473 Hard streaks 121
Sand 8 481 Sand 9 130
Clay 10 491 Clay 2 132
Sand and shale streaks 38 529Well TS-60-37·701
Shale 71 600Owner: W. L. Massey
Sand 10 610 Driller: Kerns Water Wells
Shale, sandy 63 673 Clay and rock 116 116
Sand streaks and shale 17 690 Rock 2 118
Sand 20 710 Broken formation ofshale, sand, rock 24 142
Shale 37 747Sand, hard, brown, fine 8 150
Sand 19 766Shale 70 220
Shale, sandy 34 800Formation, hard 20 240
Sand 57 857Shale 13 253
Shale, sandy 10 867Sand, soft, brown 27 280
Sand 13 880
Shale, sandy 33 913 Well TS-6D-37·703
Owner: Camp Agnes Arnold (Girl Scouts of America)Well Ts-&o.37~405 Driller: Layne-Texas Co.
Owner: H. E. Harrison Soil 3 3Driller: Con-Tex Water Well Co.
Clay, red sandy 3 6Sand and gravel 30 30
Sand and gravel 26 32Clay with sand streaks 40 70
Gravel and clay 10 42Clay 70 140
Clay 236 278
- 85-

Table B.-Drillers' Logs of Wells in Montgomery and Adjacent Counties-Continued
THICKNESS DEPTH THICKNESS DEPTH(FEET) (FEET) (FEET) (FEET)
Well Ts.6G-37-703-Continued Sand 4 119
Sand and boulders 11 289 Clay 44 163
Clay 111 400 Sand, hard streaks 5 168
Clay, sandy 3 403 Sand 13 181
Sand, fine 20 423 Hard streaks 182
Clay 39 462 Sand 39 221
Clay, sandy 11 473 Clay 222
Clay 25 498Well TS-60-37-904
Sand, fine 17 515Owner: S. C. Boone
Clay 5 520 Driller: Con-Tex Water Well Co.
Sand 2 522 Sand and red clay 24 24
Clay 20 542 Sand and red gravel 12 36
Clay, sticky 44 586 Clay 3 39
Clay, sandy 24 610 Sand and clay 3 42
Clay, sticky 109 719 Sand 33 75
Clay 16 735Well TS-60-42-202
Sand 8 743Owner: Robert and James Herzog
Clay, sticky 20 763 Driller: Tomball Drilling Co.
Clay, sandy 25 788 Soil 2 2
Clay, sticky 37 825 Shale 26 28
Clay and hard sandy layers 9 834 Sand 13 41
Sand and clay layers 49 883 Shale 17 58
Sand 30 913 Sand 46 104
Sand and boulders 5 918 Shale 6 110
Clay 13 931 Sand 9 119
Shale 19 138Well Ts.6Q.37-902
Sand 28 166Owner: Carl Currie
Driller: Con-Tex Water Well Co.Well TS-6O-42-307
Clay 21 21Owner: Gulf, Colorado and S.F. R.R.
Sand and gravel 24 45 Driller: W. J. Giles
Clay with sand and gravel streaks 12 57 Clay, yellow 12 12
Clay 27 84 Sand, shale and gravel 10 22
Sand, hard and clay streaks 10 94 Rock, white lime 2 24
Sand, trashy 7 101 Clay, brown 4 28
Clay 2 103 Rock, white lime 2 30
Sand, hard streaks 104 Clay, brown 2 32
Sand 4 108 Rock, white lime 3 35
Clay 7 115 Clay, brown and white 20 55
·86 -

Table S.-Drillers' Logs of Wells in Montgomery and Adjacent Counties-Continued
THICKNESS DEPTH THICKNESS DEPTH(FEET) (FEET) (FEET) (FEET)
Well T8-6~42·307-Continued Well TS-6O-42·501
Rock, white lime 3 58 Owner: A. C. CoumesDriller: Con-Tex Water Well Co.
Clay, gray 40 98Sand and clay, red 40 40
Sand, brown 16 114Clay, red 4 44
Gumbo, gray 51 165Sand, brown 14 58
Rock, white lime 3 168Clay, brown 13 71
Clay, gray 20 188Clay and lime 26 97
Gumbo, gray 12 200Lime, hard 3 100
Shale, red 12 212Sand with clay 8 108
Gumbo, brown 34 246Clay with hard lime streaks 82 190
Sand, blue 31 277Clay, white sandy 24 214
Shale, hard blue 13 290Sand 33 247
Rock, white lime 21 311
Sand, blue 23 334 Well TS-60-42-901
Rock, white lime 6 340 Owner: Toby SmithDriller: Carl Rudel
Sand, blue and shale 34 374Clay, yellowish 40 40
Gumbo, blue 23 397Clay, white 40 80
Shale, blue and sand 14 411Sand 18 98
Rock, white lime 8 419
Sand, blue and shale 25 444 Well TS-60-43-102
Shale, hard blue 33 477 Owner: J. R. LittleDriller: Con-Tex Water Well Co.
Gumbo, blue 28 505Clay, lime streaks 113 113
Rock, white lime 2 507Sand 7 120
Gumbo, blue 13 520Clay, lime streaks 3 123
Water sand 40 560Sand 8 131
Gumbo, brown 26 586Clay 2 133
Rock, white lime 2 588Sand, hard streaks 9 142
Sand, fine-grained, blue 4 592Sand 20 162
Rock, white lime 593
Shale, gray 19 612 Well TS·6~43-201
Sand, white 4 616 Owner: Keith DicksonDriller: Layne-Texas Co.
Rock, sand 3 619Sand, gravel and clay 35 35
Sand, hard 14 633Clay 30 65
Sand and shale 22 655Clay and boulders 94 159
Rock, sand 2 657Sand, hard 29 188
Sand 35 692Clay with sandy clay layers 63 251
Rock, sand 3 695Clay 22 273
Sand 51 746Clay, sandy 14 287
- 87-
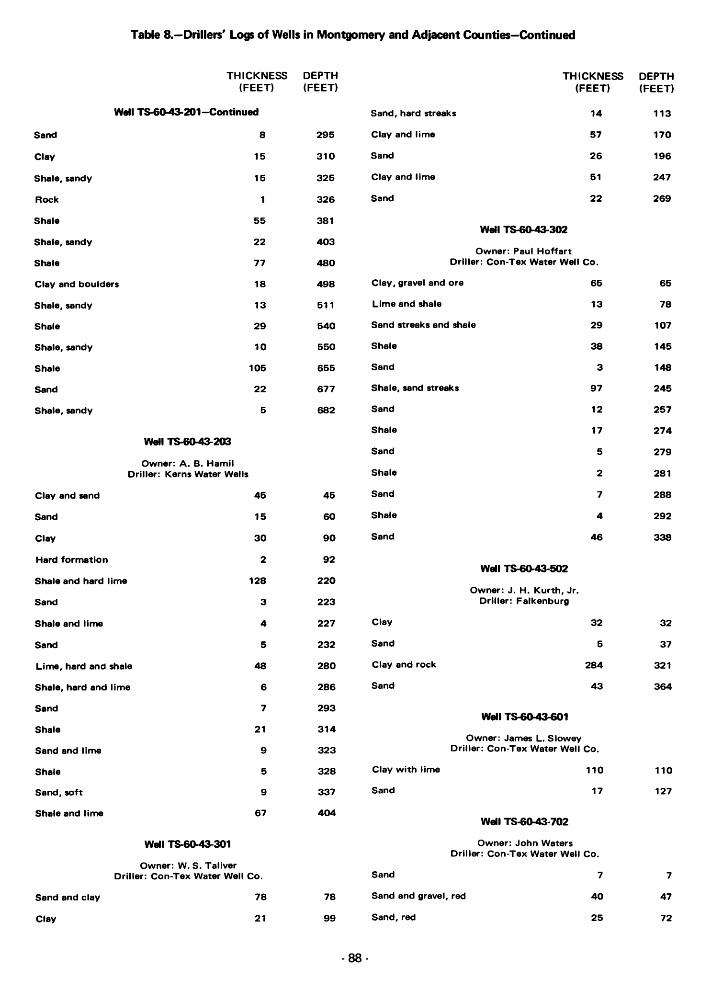
Table S.-Drillers' Logs of Wells in Montgomery and Adjacent Counties-Continued
THICKNESS DEPTH THICKNESS DEPTH(FEET) (FEET) (FEET) (FEET)
Well T8-60-43-201-Continued Sand, hard streaks 14 113
Sand 8 295 Clay and lime 57 170
Clay 15 310 Sand 26 196
Shale, sandy 15 325 Clay and lime 51 247
Rock 326 Sand 22 269
Shale 55 381Well~302
Shale, sandy 22 403Owner: Paul Hoffart
Shale 77 480 Driller: Con-Tex Water Well Co.
Clay and boulders 18 498 Clay, gravel and ore 65 65
Shale, sandy 13 511 Lime and shale 13 78
Shale 29 540 Sand streaks and shale 29 107
Shale, sandy 10 550 Shale 38 145
Shale 105 655 Sand 3 148
Sand 22 677 Shale, sand streaks 97 245
Shale, sandy 5 682 Sand 12 257
Shale 17 274Well TS-60-43-203
Sand 5 279Owner: A. B. Hamil
Driller: Kerns Water Wells Shale 2 281
Clay and sand 45 45 Sand 7 288
Sand 15 60 Shale 4 292
Clay 30 90 Sand 46 338
Hard formation 2 92Well TS-6O-43·502
Shale and hard lime 128 220Owner: J. H. Kurth, Jr.
Sand 3 223 Driller: Falkenburg
Shale and lime 4 227 Clay 32 32
Sand 5 232 Sand 5 37
Lime, hard and shale 48 280 Clay and rock 284 321
Shale, hard and lime 6 286 Sand 43 364
Sand 7 293Well TS-60-43-601
Shale 21 314Owner: James L. Slowey
Sand and lime 9 323 Driller: Con-Tex Water Well Co.
Shale 5 328 Clay with lime 110 110
Sand, soft 9 337 Sand 17 127
Shale and lime 67 404Well TS~·702
Well TS-6O-43-301 Owner: John WatersDriller: Con-Tex Water Well Co.
Owner: W. S. TaliverDriller: Con-Tex Water Well Co. Sand 7 7
Sand and clay 78 78 Sand and gravel, red 40 47
Clay 21 99 Sand, red 25 72
- 88·

Table S.-Orillan' Logs of Wells in Montgomery and Adjacent Counties-Continued
THICKNESS DEPTH THICKNESS DEPTH(FEET) (FEET) (FEET) (FEET)
Well T8-6G-43-702-Continued Well TS-6G-44-204
Clay and gravel streaks 9 81 Owner: Mrs. Libie VickDriller: Kerns Water Wells
Clay and sand streaks 25 106Clay 58 58
Clay 14 120Sand, fine brown 40 98
Clay and gravel 14 134Hard formation 11 109
Sand 14 148
Clay 18 166 Well TS-6G-44-302
Sand 19 185 Owner: G. A. WilksonDriller: Con-Tex Water Well Co.
Shale 3 188Sand and clay, red 14 14
Well T$-6Q.43·703 Clay, brown and gray 59 73
Owner: J. Neeves Clay and gravel streaks, gray 8 81Driller: Con-Tex Water Well Co.
Clay and lime 28 109Clay, red 14 14
Lime, hard sand and clay streaks 11 120Sand, red 10 24
Clay and lime 35 155Clay 2 26
Clay, sand and lime 6 161Sand, white 17 43
Sand 22 183Sand and gravel, white 9 52
Shale and lime, blue 56 239Clay 2 54
Lime, hard 2 241Sand, white 25 79
Shale, sandy and lime 16 257
Well TS-60-43-901 Sand 12 269
Owner: E. B. Hethcoth Shale 15 284Driller: Con-Tex Water Well Co.
Sand, gray 52 336Sand and clay 36 36
Clay 11 347Clay, brown 9 45
Sand 26 373Sand with clay, red 12 57
Clay 19 392Clay with gravel streaks 76 133
Sand, blue 30 422Clay with sand streaks 47 180
Clay and lime 100 280 Well TS·60-44-401
Clay with sandy lime 88 368 Owner: Charles GlassDriller: Kerns Water Wells
Sand 22 390Clay, sand and gravel 18 18
Well T8-60-44-104 Clay 18 36
Owner: B. J. Higgins Sand, brown 20 56Driller: Con-Tex Water Well Co.
Clay 42 98Clay, red 13 13
Sand, hard brown 26 124Sand and clay, sand and gravel, red 81 94
Clay 29 153Sandstone, broken and shale 8 102
Sand, soft 17 170Sand with hard streaks 10 112
Clay 3 173Shale and lime 98 210
Sand, soft 30 203Sand, dark gray 17 227
Clay and rock 4 207
- 89-

Table S.-Drillers' Logs of Wells iin Montgomery and Adjacent Counties-Continued
THICKNESS DEPTH THICKNESS DEPTH(FEET) (FEET) (FEET) (FEET)
Well TS-60-44-402 Shale, hard 16 290
Owner: Wayne Broyles Lime, hard sandy, and shale 16 306Driller: J. A. Walling
Lime, hard 13 319Clay and sand 168 168
Shale and lime 11 330Clay, yellow 22 190
Sand and shale 68 398Clay, blue 40 230
Sand 24 422Clay and sand 22 252
Clay, blue 40 292 Well TS-6G-44-702
Rock 293 Owner: H. E. NormanDriller: Con-Tex Water Well Co.
Clay 19 312Sand and gravel, red 22 22
Sand 23 335Clay with gravel, brown 86 108
Clay 40 375Sand, hard streaks 4 112
Clay and sand 20 395Sand 7 119
Clay 83 478Clay 16 135
Sand 21 499Sand 25 160
Sand and gravel 89 588
Clay and boulders 244 832 Well TS-6G-44-801
Sand 59 891 Owner: Superior Oil Co.Driller: Luther Patterson
Well TS-60-44-503 Soil 24 24
Owner: John E. Sykora Sand 21 45Driller: Con-Tex Water Well Co.
Shale 44 89Clay, red 23 23
Sand 49 138Sand and gravel 37 60
Shale 2 140Clay, white 41 101
Shale, sandy 23 163Clay with sand streaks 44 145
Sand with hard streaks 17 162 Well TS·60-45-105
Sand, brown 22 184 Owner: Panorama Development Co.Driller: Layne-Texas Co.
Well TS-Go-44-506 Clay, sandy and clay 5 5
Owner: Charles S. Scott Clay, sandy 7 12Driller: Con-Tex Water Well Co.
Sand, brown 13 25Surface sand and clay 45 45
Sand and gravel 25 50Clay 41 86
Clay 57 107Sand 46 132
Sand, fine brown 31 138Sand with hard streaks 13 145
Shale and sandy shale 353 491Sand with clay 34 179
Shale, sandy and streaks of sand 58 549Sand, clay and hard lime 16 195
Shale and sandy shale 75 624Clay 12 207
Sand, broken and streaks of shale 31 655Clay with lime 11 218
Shale, sandy and streaks of sand 115 770Shale, hard and lime 56 274
- 90-

Table 8.-Drillen' Logs of Wells in Montgomery and Adjacent Counties-Continued
THICKNESS DEPTH THICKNESS DEPTH(FEET) (FEET) (FEET) (FEET)
Well TS-6~105-Continued Well TS-60-45-402
Sand, fine 15 785 Owner: City of ConroeDriller: Katy Drilling Co.
Shale 23 808Sand and soil 12 12
Sand, broken 21 829Clay 47 59
Shale 3 832Sand 60 119
Sand 24 856Clay 14 133
Shale 19 875Sand 37 170
Sand 15 890Clay 59 229
Shale, sandy and streaks of sand 10 900Sand with rock strips 27 256
Sand 21 921Clay, hard 132 388
Shale, sandy and streaks of sand 29 950Sand 20 408
Sand and gravel 76 1,026Clay with sand strips 67 475
Sand 67 1,093Sand 55 530
Shale 10 1,103Clay 41 571
Well TS-6O-45-201 Sand 50 621
Owner: Montgomery County Airport Clay 3 624Driller: Layne-Texas Co.
Sand 31 655Sand 4 4
Clay 30 685Clay 17 21
Sand 35 720Clay, sandy 22 43
Clay 77 797Clay 8 51
Sand 14 811Sand 19 70
Clay 16 827Clay 3 73
Sand 21 848Sand 14 87
Clay 35 883Sand and gravel 17 104
Sand 21 904Clay, sandy 16 120
Rock 905Clay and boulders 21 141
Sand 906Shale, hard 8 149
Clay 19 925Rock 150
Rock and sand 77 1,002Shale, hard 54 204
Clay 25 1,027Shale, sandy 20 224
Sand and limerock 122 1,149Shale, hard 61 285
Shale, hard 156 1,305Rock 3 288
Sand, hard and rocky 18 1,323Shale, hard streaks 248 536
Shale, hard 78 1,401Shale, sandy 35 571
Sand 21 592 Well TS-6~407
Shale, sandV 5 597 Owner: Wayne H. EdwardsDriller: Con-Tex Water Well Co.
Sand and gravel 10 607Clay and red are 12 12
Shale 2 609Clay and red sand 12 24
- 91 -

Table 8.-Drillers' Logs of Wells in Montgomery and Adjacent Counties-Continued
THICKNESS DEPTH THICKNESS DEPTH(FEET) (FEET) (FEET) (FEET)
Well TS-6~45-407-Continued Shale, blue 30 518
Clay, red 41 65 Gumbo 10 528
Sand, red and wh ite 51 116 Shale, blue 20 548
Clay and lime 62 178 Shale, chocolate 18 566
Sand 38 216 Rock 3 569
Clay and lime 86 302 Sand, blue shale and boulders 59 628
Shale, sandy with sand streaks 32 334 Sand and blue shale mixed' 41 669
Lime, hard and shale 4 338 Shale, chocolate 20 689
Sand and lime 9 347 Gumbo, soft 20 709
Lime, hard 2 349 Shale, blue 41 750
Shale and lime 70 419 Shale, hard 20 770
Shale with sand streaks 52 471 Rock, soft and chocolate shale 20 790
Shale, hard and lime 8 479 Shale 17 807
Sand 32 511 Rock, soft 3 810
Gumbo, soft 40 850Well TS-6~45-408
Gumbo, tough 40 890Owner: J. S. Hunt and R. E. Floyd
Driller: Layne-Texas Co. Shale 19 909
Sand and clay 22 22 Rock, soft 20 929
Sand, white 38 60 Gumbo and boulders 61 990
Clay, yellow 55 115 Gumbo, tough 20 1,010
Sand 14 129 Gumbo 20 1,030
Clay 15 144 Sand and shale mixed 20 1,050
Sand 19 163 Water sand 41 1,091
Sand and gravel 12 175 Rock, soft and sand 20 1,111
Clay, yellow 58 233 Water sand 41 1,152
Sand 10 243 Sand and gravel 20 1,172
Clay 81 324Well TS-6Q-45-505
Shale 14 338Owner: City of Conroe, Well 1
Clay 7 345 Driller: D. G. Hamil
Rock 346 Clay, red 60 60
Clay 20 366 Sand 30 90
Shale, blue and brown 20 386 Clay 15 105
Clay, tough 40 426 Sand 35 140
Shale 21 447 Clay 45 185
Gumbo 10 457 Sand 45 230
Shale, blue 18 475 Clay 75 305
Rock 2 477 Sand 12 317
Gumbo 11 488 Clay 63 380
- 92 -
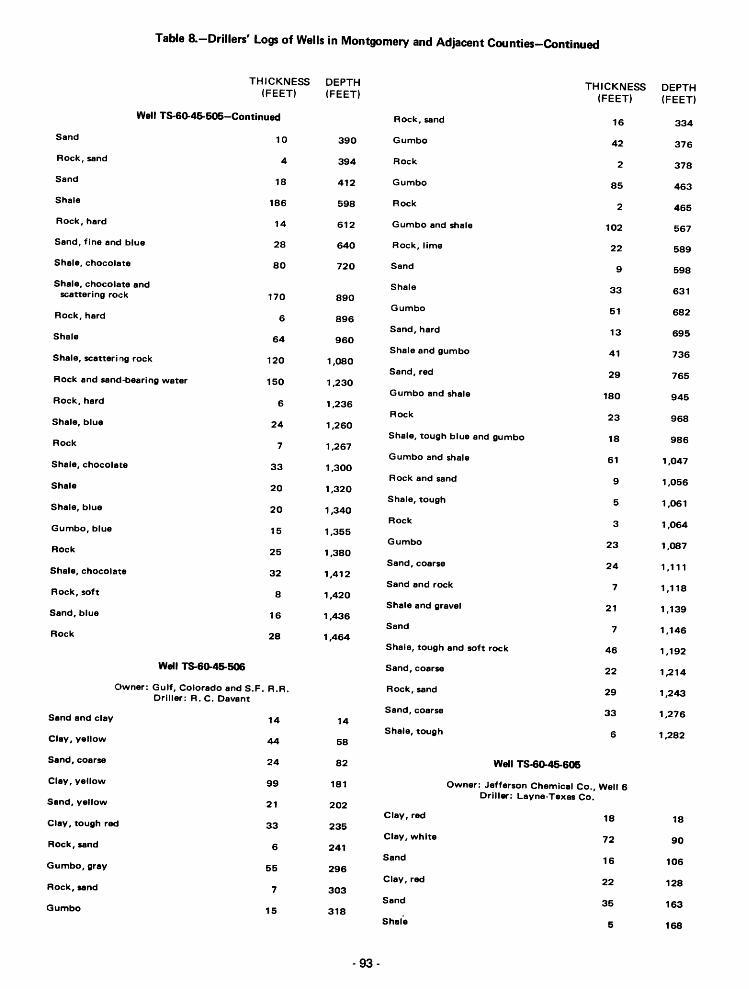
Table S.-Drillers' Logs of Wells in Montgomery and Adjacent Counties-Continued
THICKNESS DEPTH THICKNESS DEPTH(FEET) (FEET) (FEET) (FEET)
Well T8-6G-45-505-Continued Rock, sand 16 334
Sand 10 390 Gumbo 42 376
Rock, sand 4 394 Rock 2 378
Sand 18 412 Gumbo 85 463
Shale 186 598 Rock 2 465
Rock, hard 14 612 Gumbo and shale 102 567
Sand, fine and blue 28 640 Rock, lime 22 589
Shale, chocolate 80 720 Sand 9 598
Shale, chocolate and Shale 33 631scattering rock 170 890
Gumbo 51 682Rock, hard 6 896
Sand, hard 13 695Shale 64 960
Shale and gumbo 41 736Shale, scatteri ng rock 120 1,080
Sand, red 29 765Rock and sand-bearing water 150 1,230
Gumbo and shale 180 945Rock, hard 6 1,236
Rock 23 968Shale, blue 24 1,260
Shale, tough blue and gumbo 18 986Rock 7 1,267
G umbo and shale 61 1,047Shale, chOCOlate 33 1,300
Rock and sand 9 1,056Shale 20 1,320
Shale, tough 5 1,061Shale, blue 20 1,340
Rock 3 1,064Gumbo, blue 15 1,355
Gumbo 23 1,087Rock 25 1,380
Sand, coarse 24 1,111Shale, chocolate 32 1,412
Sand and rock 7 1,118Rock, soft 8 1,420
Shale and gravel 21 1,139Sand, blue 16 1,436
Sand 7 1,146Rock 28 1,464
Shale, tough and soft rock 46 1,192
Well TS-6G-45-506 Sand, coarse 22 1,214
Owner: GUlf, Colorado and S.F. R.R. Rock, sand 29 1,243Driller: R. C. Davant
Sand, coarse 33 1,276Sand and clay 14 14
Shale, tough 6 1,282ClaY, yellow 44 58
Sand, coarse 24 82 Well TS-6G-45-605
Clay, yellow 99 181 Owner: Jefferson Chemical Co., Well 6Driller: Layne-Texas Co.
Sand, yellow 21 202Clay, red 18 18
Clay, tough red 33 235Clay, white 72 90
Rock, sand 6 241Sand 16 106
Gumbo, gray 55 296ClaY, red 22 128
Rock, sand 7 303Sand 35 163
Gumbo 15 318Shafe 5 168
- 93 -

Table S.-Drillers' Logs of Wells in Montgomery and Adjacent Counties-Continued
THICKNESS DEPTH THICKNESS DEPTH(FEET) (FEET) (FEET) (FEET)
Well TS-6Q-45-606 Shale, sandy 12 1,042
Owner: Jefferson Chemical Co., Well 4 Sand 42 1,084Driller: Layne-Texas Co.
Shale and sandy shale 18 1,102Clay 85 85
Shale, sandy 10 1,112Sand, yellow and gravel 25 110
Sand, fine 8 1,120Shale 5 115
Shale and sandy shale 46 1,166Sand, white 52 167
Sand, broken 12 1,178Sand, fine 30 197
Shale, sandy and sand streaks 36 1,214Shale 9 206
Shale, sandy 21 1,235Shale and sandy shale 15 221
Shale 26 1,261Shale 81 302
Shale, sandy and sand streaks 40 1,301Shale, sandy 21 323
Sand 24 1,325Shale 37 360
Shale, sandy 12 1,337Sand, fine and hard streaks 18 378
Shale 16 1,353Shale 118 496
Sand, fine 10 506 Well TS-6Q-45-607
Shale, sandy and streaks of shale 24 530 Owner: Jefferson Chemical Co., Well 5Driller: Layne-Texas Co.
Shale 48 578Soil 3 3
Sand, fine 37 615Clay 62 65
Shale 42 657Clay, sandy and streaks of sand 13 78
Sand, fine 24 681Sand 27 105
Rock 2 683Clay 20 125
Sand and lignite 10 693Sand and streaks of clay 42 167
Shale 38 731Clay, sandy 5 172
Shale and sandy shale 24 755
Sand 5 760 Well TS·6Q-45-608
Shale, sandy 14 774 Owner: Columbia Carbon Co., Well 9Driller: Layne-Texas Co.
Sand, fine and shale streaks 9 783Fill 2 2
Sand and layers of rock 14 797Clay, soft 12 14
Shale and sandy shale 12 809Clay, white 18 32
Shale and sticky shale 76 885Clay and breaks of sandy clay 30 62
Rock and hard sand streaks 7 892Sand, coarse and gravel 43 105
Sand 12 904Clay and streaks of coarse sand 29 134
Rock 2 906Clay, hard 17 151
Shale 34 940Clay and streaks of sand 90 241
Shale, sandy 7 947Clay and few boulders 103 344
Sand 26 973Clay and boulders 77 421
Shale 13 986Shale, streaks of sand,
Sand, fine and layers of and boulders 121 542sandy shale 44 1,030
- 94-

Table S.-Drillers' Logs of Wells in Montgomery and Adjacent Counties-Continued
THICKNESS DEPTH THICKNESS DEPTH(FEET) (FEET) (FEET) (FEET)
Well T8-6().45.608-Continued Sand, good 23 630
Rock, sand 2 544 Shale, sandy 5 635
Shale 14 558 Sand, broken and shaley 8 643
Shale and sandy shale 18 576Well TS-60-45-805
Shale, sandy shale, andsand breaks 38 614 Owner: Walter M. Mischer
Driller: Layne-Texas Co.
Shale, hard 165 779Clay, sandy 3 3
Sand 3 782Sand and gravel 20 23
Sand and shale 8 790Clay 21 44
Shale and sandy shale 76 866Sand 21 65
Shale and rock layers 5 871Clay 23 88
Rock 3 874Clay, sandy 6 94
Sand, fine 24 898Sand 50 144
Shale and sandy shale 24 922Clay 5 149
Sand and shale streaks 15 937Sand 4 153
Shale 31 968Clay 11 164
Sand 7 975Sand and clay layers 31 195
Boulders 4 979Clay 16 211
Shale, sand and breaks of fine sand 11 990Sand 4 215
Shale, hard 21 1,011Clay 29 244
Sand, fine green 61 1,072Hard streaks 2 246
Sand, fine and break.of shale 19 1,091Sand 4 250
Shale and breaks of sand y shale 19 1,110Clay 71 321
Shale and sand breaks 5 1,115Clay and hard layers 5 326
Well Ts-60-45-703 Sand 14 340
Owner: Camp Martha F. Madeley (Girl Scouts of America) Clay and sand 4 344Driller: Lowry Water Wells, ! nco
Clay, sand and hard layers 18 362Clay, gray 10 10
Clay 36 398Sand 45 55
Sand and clay layers 10 408Shale 19 74
Clay and sand streaks 9 417Sand with broken shale 100 174
ClaY, sticky 8 425Shale, white, soft 90 264
Clay, sand streaks and hard layers 70 495Clay, tough, white 82 346
Clay, sandy 35 530Sand and sandrock 14 360
Clay 10 540ClaY, tough, white 139 499
Clay, sandy 50 590Sand with wh its clay 16 515
Sand and hard streaks 26 616Gumbo, sandy and tough 42 557
Shale 2 618Sand, tough, broken 32 589
Sand and shale layers 66 684Shale, sandy 18 607
- 95-
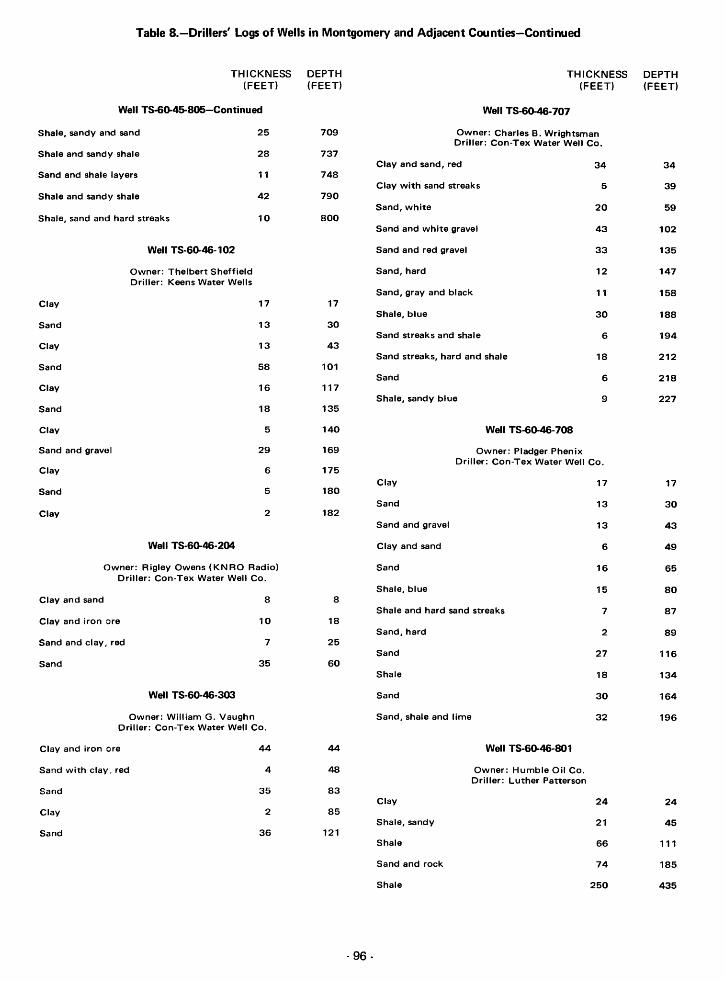
Table S.-Drillers' Logs of Wells in Montgomery and Adjacent Counties-Continued
THICKNESS DEPTH THICKNESS DEPTH(FEET) (FEET) (FEET) (FEET)
Well T5-6G-45-805-Continued Well TS·6G-46·707
Shale, sandy and sand 25 709 Owner: Charles B. WrightsmanDriller: Con-Tex Water Well Co.
Shale and sandy shale 28 737Clay and sand, red 34 34
Sand and shale layers 11 748Clay with sand streaks 5 39
Shale and sandy shale 42 790Sand, white 20 59
Shale, sand and hard streaks 10 800Sand and white gravel 43 102
Well TS·6G-46·102 Sand and red gravel 33 135
Owner: Thelbert Sheffield Sand, hard 12 147Driller: Keens Water Wells
Sand, gray and black 11 158Clay 17 17
Shale, blue 30 188Sand 13 30
Sand streaks and shale 6 194Clay 13 43
Sand streaks, hard and shale 18 212Sand 58 101
Sand 6 218Clay 16 117
Shale, sandy blue 9 227Sand 18 135
Clay 5 140 Well TS·6G-46·708
Sand and gravel 29 169 Owner: Pladger PhenixDriller: Con-Tex Water Well Co.
Clay 6 175Clay 17 17
Sand 5 180Sand 13 30
Clay 2 182Sand and gravel 13 43
Well TS-6G-46·204 Clay and sand 6 49
Owner: Rigley Owens (KNRO Radio) Sand 16 65Driller: Con-Tex Water Well Co.
Shale, blue 15 80Clay and sand 8 8
Shale and hard sand streaks 7 87Clay and iron ore 10 18
Sand, hard 2 89Sand and clay, red 7 25
Sand 27 116Sand 35 60
Shale 18 134
Well TS-6G-46-303 Sand 30 164
Owner: William G. Vaughn Sand, shale and lime 32 196Driller: Con-Tex Water Well Co.
Clay and iron ore 44 44 Well TS·6G-46·801
Sand with clay. red 4 48 Owner: Humble Oil Co.Driller: Luther Patterson
Sand 35 83Clay 24 24
Clay 2 85Shale, sandy 21 45
Sand 36 121Shale 66 111
Sand and rock 74 185
Shale 250 435
·96 -

Table S.-Drillers' Logs of Wells in Montgomery and Adjacent Counties-Continued
THICKNESS DEPTH THICKNESS DEPTH(FEET) (FEET) (FEET) (FEET)
Well T5-6G-46-801-Continued Sand, broken 45 168
Shale, sandy 41 476 Rock 2 170
Shale 43 519 Shale 34 204
Shale, sandy 69 588 Sand, broken 51 255
Shale 14 602 Shale 98 353
Rock 30 632 Sand 7 360
Shale 8 640 Shale 7 367
Sand 30 670 Sand 30 397
Shale 5 402Well T5-6G-47-606
Sand 28 430Owner: Foster Lumber Co., Well 1
Driller: W. J. Giles Shale 106 536
Sand and gravel 60 60 Rock 2 538
ClaY, red 40 100 Shale 113 651
Gravel and gumbo 50 150 Sand 19 670
Sand, packed 25 175 Shale 22 692
Rock, gray 20 195 Sand 28 720
Gumbo 25 220 Shale 18 738
Sand, packed 27 247 Sand 52 790
Gumbo 135 382 Shale 14 804
Sand 10 392 Sand 62 866
Gumbo 27 419 Sand, broken 41 907
Gravel 21 440 Shale 4 911
Gravel and gumbo 18 458 Sand 26 937
Gumbo 76 534 Shale 177 1,114
Gravel 30 564 Sand 23 1,137
Gumbo 22 586 Shale 7 1,144
Rock 2 588 Sand 60 1,204
Boulders 8 596 Shale 5 1,209
Gumbo 10 606 Sand 5 1,214
Shale and gumbo 160 766 Shale 5 1,219
Water-bearing sand and gravel 40 806Well TS-6G-50-302
Well TS-60-47-609 Owner: City of MagnoliaDriller: McMasters-Pomeroy
Owner: Foster Lumber Co., Well 5Driller: Layne-Texas Co. Clay, yellow 75 75
No record 4 4 Sand 20 95
Soil and clay 20 24 Clay 26 121
Sand, broken 71 95 Sand 25 146
Shale, sandy 28 123 Pack sand 42 188
·97 -

Table S.-Drillers' Logs of Wells in Montgomery and Adjacent Counties-Continued
THICKNESS DEPTH THICKNESS DEPTH(FEET) (FEET) (FEET) (FEET)
Well Ts-6G-~302-Continued Well TS-6G-51·103
Hard rock 16 204 Owner: T. A. SatterwhiteDriller: Leo R. Doyle
Sand and boulders 74 278Clay, red 45 45
Gumbo 125 403Sand 10 55
Rock 2 405Clay, brown 5 60
Gumbo and boulders 110 515Sand 7 67
Sand, hard pack 89 604Clay, white, brown 23 90
Sand, fine-grained 36 640Sand 20 110
Shale, brown 67 707Clay, white 10 120
Rock, hard lime 708Sand 20 140
Shale, brown 10 718Clay 5 145
Sand 23 741Sand 25 170
Pack sand 32 773
Gumbo 10 783 Well TS·6G-51·204
Hard sand 25 808 Owner: Frank McWhorterDriller: C. A. Rudel
Shale, brown 20 828Clay, red 50 50
Sand 7 835Sand, fine 10 60
Shale and gumbo 148 983Sand, mixed and clay 20 80
Sand and shale 45 1,028Clay, red 30 110
Gumbo 38 1,066Clay, bluish 40 150
Sand and gravel 19 1,085Sand 20 170
Gumbo 97 1,182
Shale and boulders 10 1,192 Well TS·6G-51·301
Gumbo, tough 108 1,300 Owner: Superior Oil Co., Well 3Driller: Layne-Texas Co.
Sand and gumbo 7 1,307Soil 3 3
Rock 2 1,309Clay and gravel 9 12
Sand 12 1,321Sand 5 17
Lime rock 4 1,325Clay, yellow 61 78
Sand 22 1,347Sand ·and clay layers 78 156
Gumbo 4 1,351Clay 6 162
Rock 4 1,355Sand and fine gravel 45 207
Sand 28 1,383Clay 3 210
Gumbo, sand and lime 6 1,389
Pack sand 41 1,430 Well TS-6G-51·302
Shale, blue 16 1,446 Owner: Superior Oil Co., Well 2Driller: Layne-Texas Co.
Gumbo, tough 6 1,452Sandy soil 3 3
Sand, red and clay and gravel 18 21
·98 -

Table S.-Drillers' Logs of Wells in Montgomery and Adjacent Counties-Continued
THICKNESS DEPTH THICKNESS DEPTH(FEET) (FEET) (FEET) (FEET)
Well T8-6Q.51·302-Continued Clay 60 282Sand, yellow and fine gravel 17 38 Sand 44 326Clay, red and yellow 61 99 Clay 33 359Sand 32 131 Sand, coarse1Jrained 7 366Clay, soft yellow 15 146 Clay and sandy clay 42 408Sand 61 207 Sand 6 414Clay, yellow 3 210 Clay 18 432
Sand 4 436Well TS·6Q.51·506Sand and clay 28 464Owner: Lester Goodson
Driller: Lowry Water Wells, Inc. Rock 465Clay, red, iron ore 30 30 Clay 14 479Sand, red 52 82 Sand 6 485Clay, white 44 126 Shale 16 501Sand, good 37 163 Sand, fine-grained, and hard layers 26 527Shale, broken 10 173 Shale 66 593Sand, broken 10 183 Sand 32 625Sand,good 28 211 Sand with thin clay layers 8 633
Clay 26 659Well TS·60-51·902Sand 17 676Owner: Dr. M. D. Meredith
Driller: C. A. Rudel Clay 18 694Clay, red 60 60 Sand 72 766Sand, fine 10 70 Clay 10 776Sand and clay mixed 20 90
Well TS-6Q.52·104Clay, yellow 30 120Owner: Superior Oil Co.Clay, bluish, soft 30 150 Driller: Layne-Texas Co.
Clay streaks and rock 10 160 Soil 4 4Water sand 20 180 Clay 75 79
Sand 53 132Well TS-6Q.52·101Clay 3 135Owner: Superior Oil Co., Well 1
Driller: Layne-Texas Co. Sand 124 259Soil 14 14 Clay 51 310Clay 51 65 Sand 9 319Clay, sandy 20 85 Sand, broken and clay 49 368Sand, fine-grained and clay 49 134 Clay 3 371Clay, sandy 19 153 Shale 78 449Sand 9 162 Sand, fine-grained 18 467Clay, sandy 20 182 Shale and layers of sand 40 507Sand, coarse-grained 40 222 Shale 23 530
- 99 -

Table S.-Drillers' Logs of Wells in Montgomery and Adjacent Counties-Continued
THICKNESS DEPTH THICKNESS DEPTH(FEET) (FEET) (FEET) (FEET)
Well TS-6()"52-104-Continued Well TS-6()"53-102
Sand 10 540 Owner: John F. AdamsDriller: Con-Tex Water Well Co.
Gumbo 5 545Clay with red sand 24 24
Clay 49 594Sand with gravel 16 40
Sand 56 650Clay with red gravel 23 63
Rock 651Sand and gravel 15 78
Clay 40 691
Sand, broken 7 698 Well TS-60-53-103
Sand 54 752 Owner: W. G. Jones State ForestDriller: Frye Drilling Co.
Clay, sandy 8 760Soil 12 12
Sand 24 784Sand, red and clay 10 22
Clay 5 789Sand and gravel 20 42
Well TS-6()"52-706 Clay, sandy 30 72
Owner: J. M. Williams Shale and gravel 10 82Driller: Norman R. Corgey
Gumbo, yellow 30 112Soil 9 9
Sand 20 132Clay 9 18
Sand and thin shale 10 142Sand 22 40
Shale 40 182Clay 5 45
Shale and sand 10 192Sand 30 75
Shale with thin shale layers 20 212Clay 15 90
Gravel 10 100 Well TS-6()"53-104
Clay 4 104 Owner: W. G. Jones State ForestDriller: Layne-Texas Co.
Sand 6 110Clay 30 30
Clay 8 118Sand and gravel 50 80
Sand 23 141Clay 41 121
Well TS-6()"52-S06 Sand 88 209
Owner: Frank MartinDriller: Leo Doyle Well TS·6()"53-202
Clay 17 17 Owner: Ted BrannonDriller: Con-Tex Water Well Co.
Sand 33 50Sand, white 23 23
Clay 25 75Clay, red 8 31
Sand 20 95Sand, red and white 21 52
ClaY 15 110Clay with gravel 35 87
Sand 24 134Sand 12 99
- 100-

Table S.-Drillers' Logs of Wells in Montgomery and Adjacent Counties-Continued
THICKNESS DEPTH THICKNESS DEPTH(FEET) (FEET) (FEET) (FEET)
Well T5-6G-53-302 Well TS·6G-54·402
Owner: C. Layton Owner: G. A. NelsonDriller: Con-Tex Water Well Co. Driller: Con-Tex Water Well Co.
Sand 5 5 Clay and gravel 28 28
Clay 15 20 Sand, white and gravel 23 51
Sand 20 40 Clay 29 80
Clay 20 60 Sand and clay streaks 15 95
Sand 12 72 Clay, blue and gravel 22 117
Clay 9 81 Sand 13 130
Sand 11 92Well TS·&o-54-604
Clay 13 105Owner: John F. Freeman
Sand, coarse, white 43 148 Driller: Con-Tex Water Well Co.
Clay 12 160 Clay 18 18
Sand, fine white 35 195 Sand and gravel 11 29
Clay and sand 11 40Well TS·6G-53·805
Sand 10 50Owner: Lake Chateau Woods
Driller: Con-Tex Water Well Co. Clay and sand 6 56
Sand and clay, red 25 25 Sand and gravel 22 78
Sand and gravel, red 46 71 Shale 4 82
Clay 8 79 Sand 38 120
Sand 14 93Well TS-6G-SS-202
Clay with lime 76 169Owner: L. E. Jernigen
Sand 28 197 Driller: Noak Drilling Co.
Clay with lime 11 208 Clay, red and iron ore 22 22
Sand and gravel 28 236 Clay, white 8 30
Sand and fine gravel 34 64Well T5-&o-54-101
Clay, red and white 8 72Owner: Humble Club
Driller: Con-Tex Water Well Co. Sand 48 120
Sand and clay 14 14 Sand and clay streaks 10 130
Sand and gravel, red 19 33 Clay, red and white 35 165
Clay 15 48 Sand 11 176
Sand, red 10 58 Clay 3 179
Clay, white 17 75 Sand 9 188
Sand 27 102 Sand and lime with rock streaks 6 194
Clay, blue 28 130 Clay 39 233
Sand 16 146 Sand 25 258
Shale, sandy 29 175
Sand 20 195
- 101 -

Table S.-Drillers' Logs of Wells in Montgomery and Adjacent Counties-Continued
THICKNESS DEPTH THICKNESS DEPTH(FEET) (FEET) (FEET) (FEET)
Well TS-6o-SS-S04 Sand 24 192
Owner: Philip Dearing Shale, loose and broken 116 308Driller: C & C Contractors
Sand, top loose and broken 28 336Soil, sandy 2 2
Sand, good 17 353Iron ore, sandy 8 10
Shale, off white 8 18 Well TS-6o-S5-905
Sand, reddish and shale 8 26 Owner: San Jacinto Girl ScoutsDriller: Lowry Water Wells, Inc.
Clay, gray 14 40Clay, red 35 35
Shale, red and blue 8 48Sand 66 101
Water sand and gravel 32 80
Well TS-6o-S8-205Well TS-6o-SS-801
Owner: A. D. McMillianOwner: John Calhoun Driller: Tomball Drilling Co.
Driller: Con-Tex Water Well Co.Soil 5 5
Clay 12 12Shale 3 8
Sand, red 38 50Sand and broken rock 12 20
Clay 12 62Shale, sandy 6 26
Sand, red 38 100Sand 29 55
Clay 16 116Shale 3 58
Sand, white, coarse 53 169Sand, gravel and iron ore 28 86
Well TS-6o-S5-901 Shale, blue 64 150
Owner: D. V. Robinson Sand 10 160Driller: Noak Drilling Co.
Soil 7 7 Well TS-60-61-206, partial log
Clay, red 3 10 Owner: C. L. FitchDriller: Brains
Water sand 4 14Clay 20 20
Clay, blue 6 20Sand, white 79 99
Sand and gravel 17 37Clay 3 102
Clay, blue with streaks 5 42Sand, white 36 138
Sand, fine-grained 16 58Clay 11 149
Sand, coarse and fine gravel 12 70Sand 4 153
Clay, blue with streaks 2 72Gumbo 37 190
Sand, fine 10 82Sand, hard 26 216
Well TS-6o-SS-904 Shale and boulders 40 256
Owner: San Jacinto Girl Scouts Rock and gumbo 10 266Driller: Lowry Water Wells, Inc.
Rock and sand 13 279Clay, red 37 37
Shale and boulders 21 300Sand 94 131
Shale, red and brown 68 368Clay, white and shale 37 168
Gumbo, red 11 379
- 102 -

Table S.-Drillers' Logs of Wells in Montgomery and Adjacent Counties-Continued
THICKNESS DEPTH THICKNESS DEPTH(FEET) (FEET) (FEET) (FEET)
Well TS-6G-61-206, partial log-Continued Sand and boulders 43 1,371
Sand, hard 15 394 Shale, blue 16 1,387
Gumbo, pink 102 496 Pack sand and boulders 15 1,402
Rock 2 498 Shale, blue 32 1,434
Shale, brown 32 530 Sand, hard white 6 1,440
Gumbo, pink 10 540 Sand, blue and white 15 1,455
Shale, brown 12 552 Gumbo 75 1,530
Gumbo, pink 10 562 Total depth 2,285
Rock 2 564Well TS-6G-62-301
Gumbo 5 569Owner: Floyd Oil Co.
Rock 570 Driller: -
Gumbo, pink 10 580 Shale, yellow 45 45
Sand and boulders 8 588 Water sand with streaks of shale 291 336
Gumbo, pink and boulders 47 635 Sand and shale 84 420
Shale, blue 15 650 Shale 45 465
Gumbo, pink 13 663 Sand and shale 731 1,196
Shale, sandy 14 677 Shale and shells 130 1,326
Gumbo, pink 51 728 Sand with streaks of shale 61 1,387
Sand, blue 22 750 Shale 217 1,604
Sand, blue water 15 765 Sand 25 1,629
Shale, blue 23 788 Shale 53 1,682
Shale, white sandy 4 792 Shale, sticky 78 1,760
Rock, hard 17 809 Shale, sandy 280 2,040
Shale, blue 17 826 Shale 920 2,960
Water sand 92 918 Shale, sandy 35 2,995
Gumbo 32 950 Shale 45 3,040
Shale, sandy and boulders 45 995 Sand 40 3,080
Gumbo 15 1,010 Shale 126 3,206
Lime, sandy 25 1,035 Sand, hard 8 3,214
Shale and gumbo 49 1,084 Sand, hard, lime and shell 58 3,272
Shale, sandy and boulders 16 1,100 Shale 118 3,390
GumbO and lime 95 1,195 Shale and shells 322 3,712
Shale, blue and boulders 15 1,210 Shale with streaks of sand 90 3,802
Gumbo 8 1,218 Sand 70 3,872
Water sand 7 1,225 Shale and shells 359 4,231
Gumbo, pink, blue and brown 90 1,315 Shale and lime 225 4,456
Sand, blue gumbo 3 1,318 Shale and shells 310 4,766
Shale, pink and blue 10 1,328 Shale with sand streaks 16 4,782
- 103-

Table S.-Drillers' Logs of Wells in Montgomery and Adjacent Counties-Continued
THICKNESS DEPTH THICKNESS DEPTH(FEET) (FEET) (FEET) (FEET)
Well TS-6Q-62-301-Continued Sand 8 948
Shale 188 4,970 Shale 4 952
Sand. hard 4 4,974 Sand 6 958
Shale, sandy 41 5,015 Gumbo 9 967
Shale and lime shells 130 5,145 Sand 13 980
Shale and shells 140 5,285 Gumbo 12 992
Shale, sandy 40 5,325Well TS·60-63-101
Shale with streaks of sand 84 5,409Owner: H. L. McConnell
Shale and shells 252 5,661 Driller: C & C Contractors
Shale with breaks of lime and shell 706 6,367 Soil 3 3
Shale 250 6,617 Clay, yellowish-brown 37 40
Sand, fine 10 50Well TS·6Q-62·601
Clay, bluish 6 56Owner: Baker Brothers
Driller: H. R. Adams Water sand 18 74
Sand 150 150Well TS-6Q-63·105
Clay, red 15 165Owner: New Laney I ndependent School D ist.
Sand and boulders 25 190 Driller: Noack
Clay 15 205 Clay 60 60
Sand 45 250 Sand 37 97
Clay and gravel 30 280 Clay 44 141
Sand 45 325 Sand 4 145
Gumbo, blue 15 340 Rock and sand 7 152
Sand 55 395 Clay 29 181
Clay, sandy 20 415 Sand 14 195
Clay 35 450 Clay 7 202
Sand 90 540 Sand 41 243
Clay 25 565 Clay 41 284
Sand 65 630 Sand 11 295
Clay 20 650 Clay 11 306
Sand 80 730 Sand 3 309
GumbO 10 740 Clay 5 314
Clay, sandy 26 766 Sand 38 352
Gumbo 20 786 Rock and clay 14 366
Artesian water sand 94 880 Sand 27 393
Gumbo, tough 6 886Well TS·6Q-63-403
Gumbo 24 910Owner: V. H. Edwards
Shale, sandy 22 932 Driller: C & C Contractors
Sand 3 935 Soil 3 3
Shale, sandy 5 940 Sand 35 38
- 104-
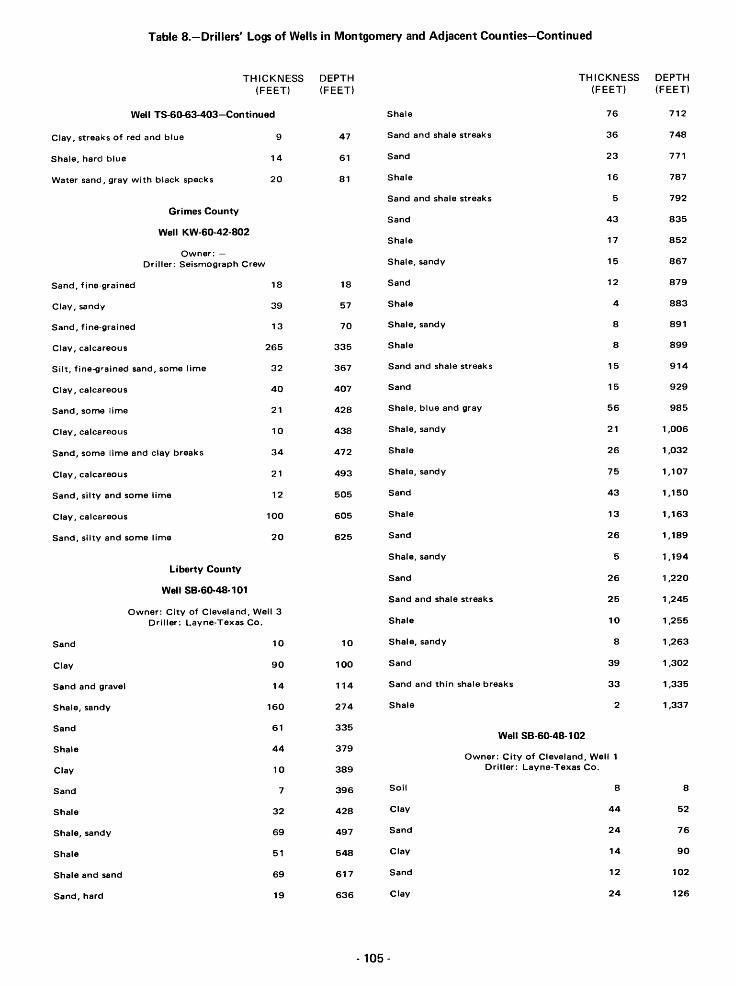
Table 8.-Drillers' Logs of Wells in Montgomery and Adjacent Counties-Continued
THICKNESS DEPTH THICKNESS DEPTH(FEET) (FEET) (FEET) (FEET)
Well TS-6~63·403-Continued Shale 76 712
Clay, streaks of red and blue 9 47 Sand and shale streaks 36 748
Shale, hard blue 14 61 Sand 23 771
Water sand, gray with black specks 20 81 Shale 16 787
Sand and shale streaks 5 792Grimes County
Sand 43 835Well KW-60-42-802
Shale 17 852Owner: -
Driller: Seismograph Crew Shale, sandy 15 867
Sand, fine-grained 18 18 Sand 12 879
Clay, sandy 39 57 Shale 4 883
Sand, fine-grained 13 70 Shale, sandy 8 891
Clay, calcareous 265 335 Shale 8 899
Silt, fine-grained sand, some lime 32 367 Sand and shale streaks 15 914
Clay, calcareous 40 407 Sand 15 929
Sand, some lime 21 428 Shale, blue and gray 56 985
Clay, calcareous 10 438 Shale, sandy 21 1,006
Sand, some lime and clay breaks 34 472 Shale 26 1,032
Clay, calcareous 21 493 Shale, sandy 75 1,107
Sand, silty and some lime 12 505 Sand 43 1,150
Clay, calcareous 100 605 Shale 13 1,163
Sand, silty and some lime 20 625 Sand 26 1,189
Shale, sandy 5 1,194Liberty County
Sand 26 1,220Well SB·6~48-101
Sand and shale streaks 25 1,245Owner: City of Cleveland, Well 3
Driller: Layne-Texas Co. Shale 10 1,255
Sand 10 10 Shale, sandy 8 1,263
Clay 90 100 Sand 39 1,302
Sand and gravel 14 114 Sand and thin shale breaks 33 1,335
Shale, sandy 160 274 Shale 2 1,337
Sand 61 335Well SB-60-48-102
Shale 44 379Owner: City of Cleveland, Well 1
Clay 10 389 Driller: Layne-Texas Co.
Sand 7 396 Soil 8 8
Shale 32 428 Clay 44 52
Shale, sandy 69 497 Sand 24 76
Shale 51 548 Clay 14 90
Shale and sand 69 617 Sand 12 102
Sand, hard 19 636 Clay 24 126
- 105-

Table S.-Drillers' Logs of Wells in Montgomery and Adjacent Counties-Continued
THICKNESS DEPTH THICKNESS DEPTH(FEET) (FEET) (FEET) (FEET)
Well SB-6G-48-102-Continued Sand 6 26
Clay, soft, sandy 18 144 Clay 24 50
Sand 9 153 Sand 29 79
Clay 54 207 Clay 2 81
Sand 12 219 Sand 29 110
Clay 16 235 Clay 5 115
Clay breaks, sand and gravel 16 251 Sand 30 145
Clay 30 281 Clay 61 206
Sand 9 290 Sand, coarse and gravel 11 217
Sand and gravel 53 343 Clay 17 234
Clay 87 430 Gravel 51 285
Sand 24 454 Clay, soft, yellow, and sand 4 289
Clay 70 524 Sand and gravel 25 314
Hard layers 525 Clay with sand breaks 21 335
Clay, sandy, and breaks of sand 9 534 Clay 98 433
Clay 84 618 Hard layers 434
Sand 18 636 Clay 61 495
Clay, sandy 4 640 Hard layers 2 497
Clay 8 648 Clay 29 526
Shale, hard, sticky 19 667 Hard layers 527
Clay 87 754 Clay 83 610
Sand 20 774 Sand 26 636
Clay 20 794 Clay 10 646
Sand breaks and shale 21 815 Gumbo 105 751
Sand 17 832 Sand 19 770
Shale 13 845 Shale, sticky 21 791
Shale, hard, sandy 22 813Well SB-6G-48-103
Sand breaks and shale 17 830Owner: City of Cleveland, Well 2
Driller: Layne-Texas Co. Shale, sticky 80 910
Soil 6 6 Sand 16 926
Clay, soft, yellow 14 20 Shale, sticky 3 929
- 106-

Table g.-Water Levels in Wells in Montgomery and Adjacent Counties(Depth to water in feet below land surface)
DATEWATERLEVEL DATE
WATERLEVEL DATE
WATERLEVEL
Nov.
Montgomery County
Well T8-6o-35-201
OWnl!r: Flower Follett
28, 1952 56.03
June
Sept.
Dec.
Feb.
16, 1955
20
21
14, 1956
50.18
50.41
50.60
50.63
Feb.
June
Dec.
Feb.
9, 1966
22
2
15, 1967
50.86
50.67
50.85
51.13
Dec. 22 55.87 June 13 50.83Well TS-6o-37-401
Owner: City of Willis, Well 1Feb.
June
Oct.
Dec.
Feb.
June
Sept.
Dec.
Feb.
June
Sept.
Dec.
Feb.
June
Sept.
Dec.
Feb.
June
Dec.
2, 1953
22
2
9
16, 1954
14
28
14
4, 1955
16
20
21
12, 1956
13
21
11
19, 1957
13
12
55.99
55.98
56.18
56.34
56.27
56.19
56.54
56.59
56.83
57.03
57.26
57.94
57.37
57.54
59.91
Dry
Dry
Dry
Dry
Sept.
Dec.
Feb.
June
Sept.
Dec.
Feb.
June
Sept.
Dec.
Feb.
June
Sept.
Dec.
Mar.
June
Sept.
Feb.
June
Dec.
21
11
19, 1957
13
13
12
20, 1958
10
17
16
12, 1959
16
23
17
1, 1960
10
19
23, 1961
15
13
51.04
51.27
51.36
51.42
51.62
51.70
51.51
51.12
51.37
51.48
51.33
51.37
51.50
51.38
51.34
51.05
50.99
50.28
49.95
50.07
June
Dec.
Feb.
Sept.
Dec.
Feb.
June
Sept.
Dec.
Feb.
June
Sept.
Dec.
Feb.
June
Sept.
Mar.
Sept.
10, 1942
9, 1955
14, 1956
21
11
19, 1957
13
13
12
20, 1958
10
17
16
12, 1959
16
23
1,1960
19
180.70
185.11
185.00
197.26
187.07
186.71
186.33
187.18
186.71
186.26
186.25
187.33
187.08
186.53
186.70
187.05
186.27
186.21
Nov.
Dec.
Feb.
June
Oct.
Dec.
Feb.
June
Sept.
Well T8-6o-35-202
Owner: Flower Follett
28, 1952
22
2, 1953
22
2
9
16, 1954
14
28
58.32
48.17
49.30
49.35
49.53
49.48
49.45
49.37
49.83
Feb.
June
Sept.
Dec.
Mar.
Feb.
June
Sept.
Dec.
Feb.
,June
20, 1962
19
25
14
1, 1963
17,1964
17
18
2
2, 1965
49.92
49.87
50.10
50.36
50.12
50.55
50.27
50.72
50.60
50.48
50.49
Feb.
Dec.
Feb.
Sept.
Dec.
Nov.
Feb.
Feb.
Feb.
Feb.
23, 1961
13
20, 1962
25
14, 1962
1,1963
17, 1964
10, 1965
9, 1966
15, 1967
Well TS-60-38-801
185.19
185.54
185.88
186.23
186.48
186.06
186.61
188.04
190.59
190.69
Dec. 12 49.92Sept. 16 50.68 Owner: Finch-Jacobsen
Feb. 4, 1955 49.47Dec. 3
- 107-
50.93Dec.
Sept.
9,1965
13, 1966
21.96
21.49

Table g.-Water Levels in Wells in Montgomery and Adjacent Counties-Continued(Depth to water in feet below land surface)
DATEWATERLEVEL DATE
WATERLEVEL DATE
WATERLEVEL
Well TS-6~38-801-Continued Well TS-60-45-104 Sept. 18, 1947 39.11
Owner: F inch-JacobSEln
Sept.
Sept.
Oct.
Oc:t.
Oct.
Nay.
Nay.
Nay.
Dec.
Dec.
Dec.
Jan.
Feb.
Feb.
Feb.
Mar.
Apr.
Dec.
Sept.
Sept.
Sept.
Oct.
Noy.
Noy.
Noy.
Dec.
Dec.
Dec.
Jan.
Feb.
16, 1966
18
10
24
25
6
21
23
2
13
28
12, 1967
13
15
28
26
18
Well TS-6~38-805
9, 1965
9, 1966
16
18
24
6
21
23
2
13
28
12, 1967
13
21.31
21.54
21.70
21.68
21.74
21.75
21.88
21.90
21.87
21.87
21.73
21.71
21.69
21.50
21.56
21.31
21.48
12.04
13.71
13.00
13.11
13.92
13.41
13.45
13.51
13.88
13.30
13.17
13.16
14.06
Oct.
Dec.
Jan.
Feb.
Apr.
June
July
Aug.
Sept.
Nay.
Dec.
Jan.
May
July
Sept.
Jan.
Mar.
July
Aug.
Jan.
May
July
Sept.
Dec.
Jan.
Mar.
June
Jan.
May
July
Sept.
Owner: R. E. Hix andJ. W. Bolinghouse
3, 1940
5
27,1941
26
8
3
3
15
19
4
16
22, 1942
7
29
18
20, 1943
28
21
26
28, 1944
29
21
18
13
24, 1945
26
15
11,1946
27
10
20
44.40
44.20
43.57
43.35
42.53
42.16
41.82
41.93
42.02
40.67
40.45
40.43
39.10
39.05
38.72
38.81
39.53
39.53
39.66
40.52
40.07
40.48
40.63
40.94
40.33
39.56
39.16
39.76
39.07
39.02
39.78
Dec.
Feb.
June
Sept.
Dec.
Feb.
June
Sept.
Dec.
Feb.
June
Sept.
Dec.
Mar.
June
Sept.
Dec.
Feb.
June
Sept.
Oct.
Feb.
June
Oct.
Dec.
Feb.
June
Sept.
Dec.
Feb.
June
Sept.
18
18,1948
16
28
16
14, 1949
15
28
19
14, 1950
20
26
7
5, 1951
19
20
11
11,1952
23
9
22
2, 1953
22
2
9
16,1954
14
28
14
7,1955
16
20
39.92
39.94
40.88
41.27
41.80
41.92
41.61
42.02
41.61
40.86
39.78
40.64
41.38
41.51
42.32
42.98
43.34
43.32
43.97
44.14
44.33
44.53
44.69
44.92
44.93
44.98
45.30
45.49
45.54
45.34
45.74
Welldestroyed
Feb.
Feb.
Apr.
15
28
18
13.18
13.20
12.96
Dec.
Jan.
Mar.
June
6
31, 1947
17
4
·108 -
39.30
37.79
38.09
37.94Nay.
Nay.
Well TS-60-45-106
Owner: R. E. Hix
13, 1931
25
16.00
15.98

Table g.-Water Levels in Wells in Montgomery and Adjacent Counties-Continued(Depth to water in feet below land surface)
DATEWATERLEVEL DATE
WATERLEVEL DATE
WATERLEVEL
Well TS-6Q.45-106-Continued Well TS-6o-45-107 June 21,1943 8.39
Dec.
Dec.
Dec.
Dec.
Dec.
Jan.
Jan.
Jan.
Jan.
Feb.
Feb.
Feb.
Feb.
Mar.
Mar.
Mar.
Mar.
Apr.
Apr.
Apr.
Apr.
May
May
May
July
Aug.
Sept.
Oct.
Feb.
May
Oct.
Dec.
Jan.
May
Aug.
2, 1931
9
15
22
29
5, 1932
12
19
28
2
9
15
22
7
14
21
28
4
11
18
25
2
9
16
25
31
27
21
7, 1938
13
26
17
26, 1939
24
3
15.46
12.90
11.38
9.79
10.70
5.42
2.18
6.41
4.78
7.50
8.78
9.27
2.26
5.59
7.19
8.66
9.90
9.84
11.06
11.10
11.25
11.62
11.95
11.75
14.60
15.50
12.78
16.43
31.71
30.80
43.84
43.39
43.96
43.84
44.70
June
June
June
June
June
June
June
July
July
Aug.
Oct.
Dec.
Jan.
Jan.
Jan.
Jan.
Feb.
Feb.
Feb.
Mar.
May
May
June
June
July
July
Aug.
Sept.
Sept.
Nov.
Dec.
Jan.
July
Sept.
Jan.
Mar.
Owner: J. M. Liles
10, 1940
11
12
13
15
21
26
16
21
4
5
9, 1941
18
24
31
14
22
27
25
13
27
10
20
8
30
15
3
19
4
16
22, 1942
29
18
20, 1943
28
- 109-
10.86
10.42
10.20
9.99
9.88
10.22
10.54
10.20
9.05
11.12
12.13
9.29
8.64
8.48
8.32
8.54
8.50
8.45
8.19
7.07
6.45
7.70
6.70
5.62
6.85
7.20
7.98
8.77
9.26
5.48
7.24
7.78
6.28
1.85
5.70
7.23
Aug.
Jan.
June
July
Sept.
Dec.
Jan.
Mar.
June
Jan.
May
July
Sept.
Dec.
Jan.
Mar.
June
Sept.
Dec.
Feb.
June
Sept.
Dec.
Feb.
June
Sept.
Dec.
Feb.
June
Sept.
Dec.
Mar.
June
Sept.
Dec.
Feb.
June
26
28, 1944
3
21
18
13
24, 1945
26
15
11,1946
27
10
20
6
31,1947
17
4
18
18
18, 1948
16
28
16
14, 1949
15
28
19
14, 1950
20
26
7
5, 1951
19
20
11
11,1952
23
4.84
.63
5.92
8.60
9.54
7.61
6.05
6.08
6.88
7.07
4.89
6.21
9.00
5.43
4.71
6.57
6.49
9.91
8.93
7.75
9.84
11.36
12.06
10.48
9.59
11.19
7.19
6.46
6.69
10.33
11.45
11.57
11.75
12.59
13.09
12.36
11.02

Table g.-Water Levels in Wells in Montgomery and Adjacent Counties-Continued(Depth 'to water in feet below land surface)
DATEWATERLEVEL DATE
WATERLEVEL DATE
WATERLEVEL
Well T5-6o-45-1 07-Continued Oct. 4, 1940 12.59 Sept. 20, 1946 9.14
Sept.
Dee.
Feb.
June
Oct.
Dee.
Feb.
June
Oct.
Dee.
Feb.
June
Sept.
Dee.
Feb.
June
Sept.
Dee.
Feb.
June
Sept.
Dec.
June
June
June
June
June
June
June
June
June
July
July
Aug.
12, 1952
22
2, 1953
22
2
9
16, 1954
14
28
14
7,1955
16
20
21
14, 1956
13
21
11
19, 1957
13
13
12
1958
Well T5-6()'45-1 08
Owner: J. M. Liles
8, 1940
10
11
12
13
15
21
26
16
21
12.56
12.52
13.17
10.53
12.17
12.59
10.80
11.99
13.16
11.91
9.69
11.33
12.61
13.18
10.85
11.86
13.47
13.75
13.67
11.30
13.29
10.90
9.59
11.65
11.47
11.08
10.72
10.79
10.75
10.94
11.21
10.94
10.73
11.66
(Iec.
Jan.
Jan.
Jan.
Jan.
Feb.
Feb.
Feb.
May
May
May
June
June
July
July
Sept.
Sept.
Nov.
[lee.
Jan.
Sept.
J,an.
Mar.
June
Aug.
J,an.
June
July
Sept.
Clec.
J,an.
May
June
J,an.
May
July
5
9, 1941
18
24
31
14
22
27
25
13
27
10
20
8
30
15
3
19
4
16
29, 1942
18
20, 1943
28
21
26
28, 1944
3
21
18
13
24, 1945
26
15
11,1946
27
10
- 110 -
10.16
9.44
9.25
9.08
9.28
9.21
9.19
8.95
7.88
8.26
8.34
7.45
6.52
7.66
7.91
8.61
9.31
9.82
6.40
7.93
8.16
8.30
7.69
9.02
10.04
10.28
8.92
7.77
10.22
11.15
8.95
8.04
7.93
8.64
9.00
6.88
8.03
Dee.
Jan.
Mar.
June
Sept.
Dee.
Feb.
June
Sept.
Dec.
Feb.
June
Sept.
Dee.
Feb.
June
Sept.
Dee.
Mar.
June
Sept.
Dec.
Feb.
June
Sept.
Dee.
Feb.
June
Oct.
Dee.
Feb.
June
Sept.
Dec.
Feb.
June
Sept.
6
31,1947
17
4
18
18
18, 1948
16
28
16
14, 1949
15
28
19
14, 1950
20
26
7
5, 1951
19
20
11
11,1952
23
12, 1953
22,1952
2
22
2
9, 1953
16, 1954
14
28
14
7, 1955
16
20
5.87
5.13
6.88
6.82
9.96
9.24
8.09
10.01
11.42
12.07
10.78
9.84
11.34
7.73
6.97
7.04
10.42
11.98
12.17
12.33
13.12
13.64
13.06
11.67
13.14
13.31
12.86
11.22
12.79
13.22
11.58
12.54
13.23
12.76
10.76
12.02
13.22
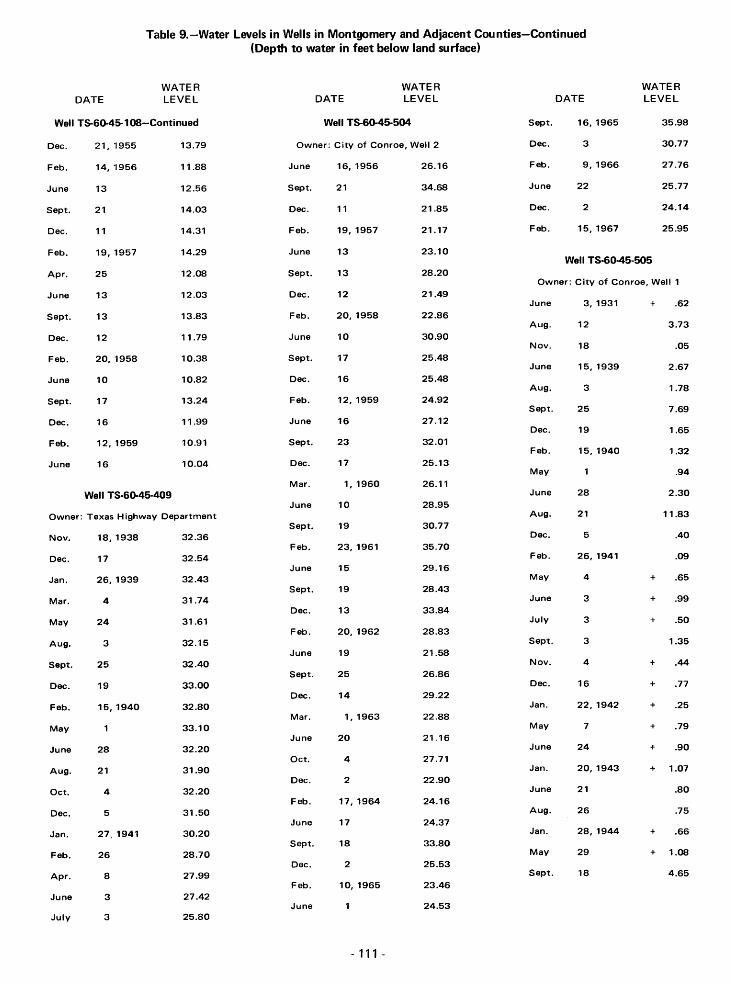
Table g.-Water Levels in Wellls in Montgomery and Adjacent Counties-Continued(Depth to water in feet below land surface)
DATEWATERLEVEL DATE
WATERLEVEL DATE
WATERLEVEL
Well TS-6~45-108-Continued Well TS-6Q-45-504 Sept. 16, 1965 35.98
Dec. 21,1955 13.79 Owner: City of Conroe, Well 2 Dec. 3 30.77
Feb.
June
Sept.
Dec.
14, 1956
13
21
11
11.88
12.56
14.03
14.31
June
Sept.
Delc.
Feb.
16, 1956
21
11
19, 1957
26.16
34.68
21.85
21.17
Feb.
June
Dec.
Feb.
9, 1966
22
2
15, 1967
27.76
25.77
24.14
25.95
Feb.
Apr.
19, 1957
25
14.29
12.08
June
Sept.
13
13
23.10
28.20Well TS-60-45-505
Owner: City of Conroe, Well 1
Owner: Texas Highway Department
June
Sept.
Dec.
Feb.
June
Sept.
Dec.
Feb.
June
Nov.
Dec.
Jan.
Mar.
May
Aug.
Sept.
Dec.
Feb.
May
June
13
13
12
20, 1958
10
17
16
12, 1959
16
Well TS·6~45-409
18,1938
17
26,1939
4
24
3
25
19
15,1940
28
12.03
13.83
11.79
10.38
10.82
13.24
11.99
10.91
10.04
32.36
32.54
32.43
31.74
31.61
32.15
32.40
33.00
32.80
33.10
32.20
DEIC.
Feb.
June
Sept.
DEIC.
June
Sept.
DElc.
Mar.
June
Sept.
FElb.
June
Sept.
DI!C.
FElb.
June
Sept.
DI!C.
M.:lr.
June
12
20, 1958
10
17
16
12, 1959
16
23
17
1,1960
10
19
23, 1961
15
19
13
20, 1962
19
25
14
1,1963
20
21.49
22.86
30.90
25.48
25.48
24.92
27.12
32.01
25.13
26.11
28.95
30.77
35.70
29.16
28.43
33.84
28.83
21.58
26.86
29.22
22.88
21.16
June
Aug.
Nov.
June
Aug.
Sept.
Dec.
Feb.
May
June
Aug.
Dec.
Feb.
May
June
July
Sept.
Nov.
Dec.
Jan.
May
June
3, 1931
12
18
15,1939
3
25
19
15,1940
28
21
5
26, 1941
4
3
3
3
4
16
22, 1942
7
24
+
+
+
+
+
+
+
+
+
.62
3.73
.05
2.67
1.78
7.69
1.65
1.32
.94
2.30
11.83
.40
.09
.65
.99
.50
1.35
.44
.77
.25
.79
.90
Aug.
Oct.
Dec.
21
4
5
31.90
32.20
31.50
Oet.
Dc!c.
FElb.
4
2
17,1964
27.71
22.90
24.16
Jan.
June
Aug.
20, 1943
21
26
+ 1.07
.80
.75
+ 1.08
Jan.
Feb.
27, 1941
26
30.20
28.70
June
SElpt.
17
18
24.37
33.80Jan.
May
28, 1944
29
+ .66
Apr.
June
July
8
3
3
27.99
27.42
25.80
DI:lc.
Fob.
2
10, 1965
- 111 -
25.53
23.46
24.53
Sept. 18 4.65

Table g.-Water Levels in Wells in Montgomery and Adjacent Counties-Continued(Depth to water in feet below land surface)
DATEWATERLEVEL DATE
WATERLEVEL DATE
WATERLEVEL
Well T5-6Q-45-505-Continued Dec. 14, 1954 16.40 May 13, 1938 27.45
Dec.
Jan.
Mar.
13, 1944
24,1945
26
.26
.05
1.62
June
4, 1955
16
23.82
Welldestroyed
Oct.
Nov.
Dec.
26
18
17
29.98
29.21
29.50
June
Jan.
15
11,1946
6.50
3.95
Well TS-6Q-45·507
Owner: City of Conroe
Jan.
Mar.
26, 1939
4
28.36
26.72
Owner: Elizabeth Moody
Well TS-6Q-45-706
May
July
Sept.
Dec.
Jan.
Mar.
June
Sept.
27
10
20
6
31,1947
17
4
18
+
1.33
10.57
4.30
6.88
5.87
.51
.64
2.63
Dec.
Oct.
Dec.
Jun.
May
Nov.
16,1948
1954
8, 1955
13, 1967
1941
9, 1966
+ 12.00
2.00
11.42
20.21
Flows
4.22
May
Aug.
Sept.
Dec.
Feb.
May
June
Aug.
24
3
25
19
15, 1940
28
25
28.56
28.96
29.56
30.40
30.39
29.90
29.52
29.94
Sept.
Dec.
Feb.
28, 1948
16
14, 1949
11.11
3.40
2.44
Feb. 28, 1967
Well TS-6Q-45-801
4.23Oct.
Dec.
4
5
30.25
Welldestroyed
June
Sept.
Dec.
Feb.
June
Sept.
Dec.
Mar.
June
Sept.
Dec.
Feb.
June
Sept.
Dec.
Feb.
June
Oct.
Dec.
Feb.
June
Sept.
15
28
19
14, 1950
20
26
7
5,1951
19
20
11
11,1952
23
12
22
2,1953
22
10
9
16,1954
14
28
2.30
1.79
2.06
1.16
1.23
3.22
6.55
4.73
11.53
10.24
8.42
3.89
10.79
11.81
13.27
11.78
19.74
19.07
11.72
12.29
14.86
21.26
June
Nov.
Dec.
Jan.
Jan.
Mar.
Apr.
May
July
Sept.
(lct.
Nov.
[)ec.
Jan.
Mar.
Feb.
Feb.
Owner: L. Johnson
3, 1931
12
25
15
19, 1932
29
21
25
21
25
27
21
26
30
25, 1933
15
21, 1935
27, 1936
7, 1938
- 112 -
26.20
24.30
25.77
23.68
20.70
17.93
18.50
19.64
21.88
24.34
25.68
27.12
27.48
26.91
29.80
25.84
26.45
25.84
27.22
Nov.
Nov.
Dec.
Dec.
Dec.
Dec.
Dec.
Jan.
Jan.
Jan.
Jan.
Feb.
Feb.
Feb.
Feb.
Mar.
Mar.
Mar.
Well T5-6Q-45-803
Owner: Brown Estate
18, 1931
25
2
9
15
22
29
5,1932
12
19
28
2
9
15
29
7
14
21
24.45
24.83
24.48
23.15
22.42
20.94
20.78
20.34
18.54
18.70
16.78
16.82
17.53
17.82
15.98
15.45
16.29
16.37

Table g.-Water Levels in Wells in Montgomery and Adjacent Counties-Continued(Depth to water in feet below land surface)
Well TS-60-4&803-Continued
Mar.
Apr.
Apr.
Apr.
Apr.
May
May
May
July
Sept.
Oct.
Nov.
Dec.
Jan.
Mar.
May
Nov.
May
Aug.
Feb.
Feb.
May
Oct.
Nov.
Dec.
Jan.
Mar.
May
Aug.
Sept.
Dec.
Feb.
May
June
Aug.
Oct.
Dec.
DATE
28,1932
4
11
18
25
2
9
16
27
21
26
30
25, 1933
15
8
24, 1934
29, 1935
21
27, 1936
7, 1938
13
26
18
17
26, 1939
4
24
3
25
19
15, 1940
28
25
4
5
WATERLEVEL
16.76
18.27
18.70
18.84
19.31
20.46
20.78
20.86
22.15
23.90
24.65
24.82
24.64
24.79
21.00
22.87
25.86
16.00
21.60
20.75
22.31
22.64
24.25
24.48
24.80
22.48
21.61
23.35
23.65
24.46
25.30
25.04
24.76
24.26
24.52
25.10
24.00
Jan.
Feb.
Apr.
June
July
Sept.
Sept.
Nov.
Dec.
Jan.
May
July
Sept.
Jan.
Mar.
June
Aug.
Jan.
May
July
Sept.
Dec.
Jan.
Mar.
June
.Jan.
May
.July
Sept.
IDec.
.Jan.
Mar.
.June
Sept.
Dec.
Feb.
.Iune
Sept.
DATE
27, 1941
26
8
3
3
3
19
4
16
22, 1942
7
29
18
20, 1943
28
21
26
28, 1944
29
21
18
13
24, 1945
26
15
11,1946
27
10
20
6
31,1947
17
4
18
18
18, 1948
16
28
- 113·
WATERLEVEL
21.25
20.60
19.05
17.93
17.00
19.88
20.53
13.96
15.71
17.06
14.26
15.37
15.90
15.23
16.81
18.85
19.63
19.84
15.38
18.55
21.21
20.00
16.48
16.38
15.46
20.90
15.51
14.71
19.48
15.63
13.48
15.71
16.24
21.67
22.25
21.65
22.52
24.01
Dec.
Feb.
June
Sept.
Dec.
Feb.
June
Sept.
Dec.
Mar.
June
Sept.
Dec.
Jan.
Feb.
June
June
July
Aug.
Sept.
Sept.
Dec.
Dec.
Jan.
Feb.
Mar.
Mar.
Mar.
Mar.
Apr.
Apr.
Apr.
Mar.
June
June
July
Aug.
Sept.
DATE
16, 1948
14, 1949
15
28
19
14, 1950
20
26
7
5, 1951
19
20
11
13, 1952
11
23
30
31
2
2
9
22
23
7,1953
2
5
12
23
30
6
14
20
21
22
7
3
WATERLEVEL
24.87
24.92
22.12
23.63
18.79
15.83
14.52
21.28
23.16
24.18
24.54
25.25
25.72
26.00
26.30
24.40
24.39
24.83
24.81
25.20
25.30
25.95
25.97
25.75
25.60
25.26
25.03
24.83
24.70
24.61
24.67
24.74
21.82
21.82
22.91
23.32
23.86
24.32

Table 9.-Water Levels in Montgomery and Adjacent Counties-Continued(Depth to water in feet below land surface)
DATEWATERLEVEL DATE
WATERLEVEL DATE
WATERLEVEL
Well TS-6~4S.803-Continued Mav 17, 1958 21.78 Oct. 4, 1963 23.86
Oct.
Nay.
Dec.
Jan.
Feb.
Mar.
Apr.
May
June
July
Aug.
Sept.
Oct.
Nay.
Dec.
Jan.
Feb.
Mar.
Apr.
May
June
June
July
Aug.
Sept.
Oct.
June
June
July
Aug.
Sept.
1, 1953
27
29, 1954
10
3
14
30
24
14
26
31, 1955
18
31
3
16
26
18
20
27
13, 1957
16
25
24.65
25.07
25.16
24.75
24.58
24.66
25.04
25.19
25.52
25.63
25.75
25.99
25.90
26.13
26.18
25.66
25.03
24.66
24.56
24.83
25.06
25.20
25.56
25.76
25.94
26.21
25.95
25.99
25.91
26.08
26.00
June
JulV
Sept.
Oct.
Nov.
Dec.
Jan.
Feb.
Mar.
Apr.
JUnt:1
Aug.
Sept.
Dec.
Mar.
May
Junl~
Aug.
Sept.
Oct.
Nay.
Dec.
Jan.
Feb.
Feb,
Apr"
May
JUnE,
July
Sept.
22
27
16
23, 1959
12
13
14
16
20
23
17
1, 1960
31
10
4
19
7
18
29
18, 1961
20
23
3
9
15
28
19
22.15
23.13
23.75
24.36
24.56
24.29
24.41
24.69
23.15
22.83
21.24
20.73
22.31
22.79
23.07
18.81
20.44
20.92
18.58
18.52
19.46
16.50
13.58
12.04
11.98
11.05
13.62
15.61
17.69
13.96
15.02
Dec.
Feb.
Dec.
Jan.
Feb.
Mar.
Apr.
May
June
July
Aug.
Sept.
Oct.
Nay.
Dec.
Jan.
Feb.
Mar.
Apr.
May
June
July
Aug.
Sept.
Oct.
Nay.
Dec.
Jan.
Feb.
Mar.
Apr.
2
17, 1964
2
4, 1965
4
20
29
17
30
31
29
24
30
30
17, 1966
4
25
15
2
27
31
31
30
29
28
24
5, 1967
15
9
18
24.43
24.14
24.01
24.00
23.82
22.70
22.80
22.81
22.30
22.99
23.64
24.08
24.44
24.48
24.50
23.38
22.53
21.18
21.19
20.50
20.42
21.81
22.34
23.18
23.32
23.87
24.17
24.25
24.27
24.49
22.44
Oct.
Nay.
15
23
25.96
25.06
Dec.
Feb.
13
20, 1962
19.58
19.02Well TS-6G-45-806
Owner: M. H. Crighton
Dec.
Feb.
Mar.
Apr.
31
28,1958
13
5
24.48
21.68
21.60
21.88
JunEI
Dec.
Mar.
JunEI
19
14
1, 1963
20
- 114 -
20.03
22.94
19.72
22.43
Nay.
Dec.
Jan.
Mar.
18, 1938
17
26, 1939
4
3.65
3.53
2.33
1.56

Table g.-Water Levels in Montgomery and Adjacent Counties-Continued(Depth to water in feet below land surface)
DATEWATERLEVEL DATE
WATERLEVEL DATE
WATERLEVEL
Well TS-6~45-806-Continued Dec. 17,1938 23.53 May 27, 1946 14.63
May
Aug.
Sept.
Dec.
24, 1939
3
25
19
Well T5-6~47-607
3.44
3.84
3.78
4.50
.Jan.
Mar.
May
Aug.
Sept.
Dec.
26, 1939
4
24
3
23
19
22.27
22.91
22.56
23.55
24.15
23.80
July
Sept.
Dec.
Jan.
Mar.
June
10
20
6
31, 1947
17
4
13.75
14.18
12.26
10.73
10.50
11.24Owner: Foster Lumber Co., Well 2
1914 + 10.00Feb.
May
15, 1940 23.40
24.02
Sept.
Dec.
18
18
13.16
13.45June
Jan.
5,1942
26, 1966
Well T5-6~5·1·302
14.95
6.98June
Aug.
Oct.
28
25
4
24.10
24.40
24.40
Feb.
June
Sept.
18, 1948
16
28
13.05
20.71
14.10
Owner: Superior Oill Co., Well 2 Dec. 5 22.15 Dec. 16 15.36
June
Dec.
Nov.
Dec.
Jan.
Mar.
May
July
Aug.
Sept.
Nov.
Dec.
Jan.
Nov.
May
Aug.
1942
23
6, 1966
Well T5-6~53-503
Owner: Blair and Sons
18, 1931
15
19, 1932
21
21
31
27
26
30
25,1933
29, 1934
29, 1935
21
84.00
84.04
88.40
16.20
15.98
16.21
16.28
15.60
15.82
16.04
21.18
21.60
21.20
21.74
23.71
24.08
26.78
Jan.
Feb.
Apr.
June
July
Sept.
Nov.
Dec.
Jan.
May
July
Sept.
Jan.
Mar.
June
July
Jan.
May
July
Sept.
27, 1941
26
8
3
3
3
4
16
22, 1942
7
29
18
20, 1943
28
21
26
28, 1944
29
21
18
23.30
21.86
23.32
23.81
24.38
23.20
20.59
21.10
20.78
21.60
19.02
19.23
17.16
18.43
21.46
20.63
20.87
19.29
20.98
20.69
Feb.
June
Sept.
Dec.
Feb.
June
Sept.
Dec.
Mar.
June
Sept.
Dec.
Feb.
June
June
July
Sept.
Dec.
Feb.
June
14, 1949
15
28
19
14, 1950
20
26
7
5, 1951
19
20
11
11,1952
23
30
31
12
22
2, 1953
22
14.82
14.98
14.91
13.93
12.88
16.28
17.39
19.30
16.09
14.83
15.03
15.40
15.33
14.20
14.24
14.44
14.97
15.50
15.72
14.33Feb.
Feb.
May
27,1936
6, 1938
13
22.34
21.56
21.70
Dec.
Jan.
Mar.
13
23, 1945
26
17.61
16.75
16.93
Well TS-6~53·504
Owner: E. W. Castleschouldt
Oct.
Nov.
26
18
24.13
24.17
June
Jan.
15
11,1946
- 115 -
17.96
15.11
June
Aug.
Dec.
2, 1931
12
15
29.80
29.43
29.38

Table g.-Water Levels in Montgomery and Adjacent Counties-Continued(Depth to water in feet below land surface)
DATEWATERLEVEL DATE
WATERLEVEL DATE
WATERLEVEL
Well TS-6G-53-504-Continued Jan. 27, 1941 30.68 Sept. 28, 1948 28.06
Jan.
Feb.
Mar.
Apr.
May
July
Aug.
Sept.
Oct.
Nov.
Dec.
Jan.
Mar.
May
June
Nov.
May
July
Feb.
Aug.
Feb.
May
Oct.
Nov.
Dec.
Jan.
Mar.
May
Aug.
Sept.
Dec.
Feb.
May
June
Aug.
Oct.
Dec.
19, 1932
29
21
25
21
31
27
21
26
30
25, 1933
15
8
24
29, 1934
29,1935
21
27,1936
13
6, 1938
13
26
18
17
26, 1939
4
24
3
25
19
15, 1940
28
25
4
5
29.50
29.28
28.91
29.67
29.46
30.57
30.08
29.60
31.60
29.97
29.77
29.84
30.24
29.98
31.44
20.24
30.52
30.87
30.15
38.91
30.35
30.19
32.30
30.79
30.73
39.90
39.73
31.01
30.92
31.55
31.38
30.44
29.52
31.64
31.96
31.78
30.62
Feb.
Apr.
Jul'l'
Sept.
Nov.
Dec.
Jan,
Mav
JulV
Sept.
Jan,
Mar.
June
Jan.
Mav
JulV
Sept.
Dec.
Jan.
Mar.
June
Jan.
Mav
JulV
Sept.
Dec;.
Jan.
Mar.
June
Sept.
Dec:.
Feb.
June
26
8
3
3
15
19
4
16
22,1942
7
29
18
20, 1943
28
21
26
28, 1944
29
21
18
13
24, 1945
26
15
11,1946
27
10
20
6
31, 1947
17
4
18
18
18, 1948
16
- 116-
28.90
31.30
30.96
31.45
31.75
31.05
29.52
30.97
31.37
30.82
31.04
30.25
30.39
29.96
30.12
30.35
29.53
29.30
29.73
29.56
29.41
28.98
29.16
29.27
28.52
28.56
28.65
28.96
28.45
28.04
27.96
27.92
28.08
27.76
27.66
28.14
Dec.
Feb.
June
Sept.
Dec.
Feb.
Sept.
Dec.
Mar.
June
Sept.
Dec.
Feb.
June
June
July
Sept.
Dec.
Feb.
June
Oct.
Dec.
Feb.
June
Sept.
Dec.
Feb.
June
Sept.
Dec.
Feb.
June
Sept.
Dec.
Feb.
June
Sept.
16
14, 1949
15
28
19
14, 1950
26
7
5, 1951
19
20
11
11, 1952
23
30
31
12
22
2, 1953
22
2
9
16, 1954
14
28
4
4, 1955
16
20
21
14, 1956
13
21
11
19, 1957
13
13
27.98
27.88
28.23
23.23
27.26
27.46
27.86
28.15
28.05
28.40
28.48
28.66
28.52
28.94
28.88
28.83
29.03
28.90
29.15
29.33
29.65
29.43
29.48
30.38
30.65
27.87
29.93
30.38
30.50
30.29
30.15
30.85
30.72
30.77
30.89
39.92
31.05
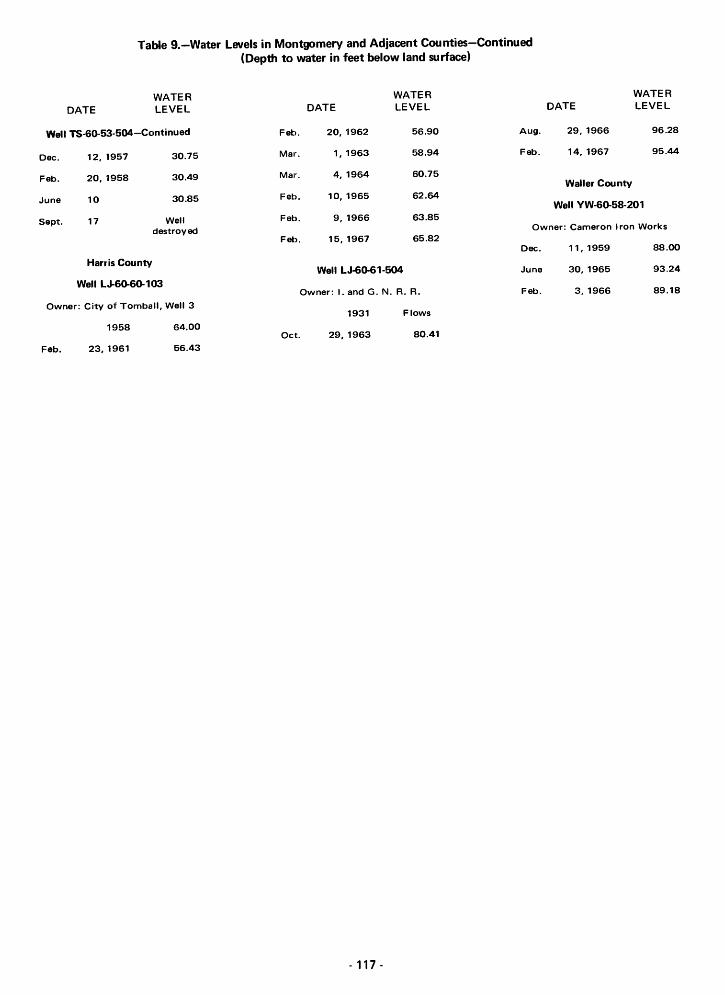
Table g.-Water Levels in Montgomery and Adjacent Counties-Continued(Depth to water in feet below land surface)
Well LJ.6Q-6Q-103
Well TS-6Q-53-S04-Continued
Dec. 12, 1957 30.75
Feb. 20, 1958 30.49
June 10 30.85
Sept. 17 Welldestroyed Owner: Cameron I ron Works
Well YW-6Q-S8-201
89.18
93.24
88.00
95.44
96.28
WATERLEVEL
3, 1966
11,1959
30, 1965
29, 1966
14, 1967
Waller County
DATE
Dec.
Feb.
June
Feb.
Aug.
Well LJ-6Q-61-S04
Owner: I. and G. N. R. R.
WATERDATE LEVEL
Feb. 20, 1962 56.90
Mal". 1, 1963 58.94
Mal'. 4, 1964 60.75
Feb. 10, 1965 62.64
Feb. 9, 1966 63.85
Feb. 15, 1967 65.82
WATERLEVEL
Harris County
DATE
Owner: City of Tomball, Well 31931 Flows
1958 64.00Oct. 29, 1963 80.41
Feb. 23,1961 56.43
- 117 -

.....I'.)01
Table 11.--Fie1d Analyses of Water From Wells in Montgomery and Adjacent Counties
DATESPECIFIC
WELL OF pHCONDUCTANCE CASING SCREEN
ANALYSIS(MICROMHOS MATERIAL MATERIAL REMARKS
AT 25 0 C)
Montgomery County
21 TS-60-28-901 June 27, 1966 6.4 725 Steel Steel Reported iron problem. Iron conduc-tor pipe pulled and found corroded.Clear water sample turned red inabout 5 hours after sampling.
29-701 do 6.9 450 Concrete -- Reported hardness problem. Usesspecial soap to lather. Water notused for cooking. Water has offen-sive tasteo
801 June 28, 1966 -- 740 Steel Steel Reported no iron problem.
903 June 27, 1966 7.4 650 do do Reported hardness problem.
21 36-302 do 7.8 425 do do Reported no iron problem.
303 July 27, 1966 701 -- do do Do.
405 Nov. 3, 1966 6.3 350 Concrete -- Reported iron problem. Observedcorrosion on plumbing fixtures andiron discoloration on ceramics.
21 37-102 June 27, 1966 5.9 130 Rock -- Reported iron problem when plumb-ing fixtures were iron. Installa-tion of plastic and copper fix-tures ended problem. Conductorpipe is plastic.
201 June 28, 1966 -- 700 Concrete -- Reported no iron problem.
308 June 27, 1966 5.2 75 Plastic Plastic Reported occasional iron problem.Observed corroded plumbing fix-tures.
406 June 28, 1966 7.2 550 Steel Steel Reported hardness problem. Usesspecial soap to lather.
See footnote at end of table.

I\Jm
Table ll.--Field Analyses of Water From Wells in Montgomery and Adjacent Counties--Continued
DATESPECIFIC
CONDUCTANCE CASING SCREENWELL OF pH (MICROMHOS MATERIAL MATERIAL REMARKS
ANALYSIS AT 25° C)
TS -60 -3 7-501 June 28 J 1966 5.7 42 Steel Steel Reported soft water. Reported noiron problem. Observed no corro-sion in well or in distributionsystem.
504 Aug. 28, 1966 5.3 145 Plastic -- Reported iron problem when casingwas iron. Formerly replaced ironcasing yearly because of corrosion.Substitution of plastic casingended iron problem.
!# 602 June 30, 1966 5.6 -- Concrete -- Reported iron problem. "Water getsrusty during heavy rain."
901 June 28, 1966 -- 310 Steel Steel Reported no iron problem.
902 June 21, 1966 -- 390 do do Do.
903 June 28, 1966 -- 130 Concrete -- Do.
38-401 July 8, 1966 5.7 52 do -- Reported no iron problem. Waterdistribution system is plastic.
506 do 6.7 75 do -- Reported iron problem when well isfirst turned on.
701 do 5.6 68 Plastic -- Reported no iron problem.
~ 44 -602 July 1, 1966 -- 590 Steel Steel Do.
803 Nov. 28, 1966 -- 210 do do Observed corrosion on casing.
45 -202 July 5, 1966 5.6 135 do do Reported iron problem only whenwell is first turned on. Reportedsoft water.
See footnote at end of table.

I\,)'-oJ
Table ll.--Field Analyses of Water From Wells in Montgomery and Adjacent Counties--Continued
DATESPECIFIC
CONDUCTANCE CASING SCREENWELL OF pH (MICROMHOS MATERIAL MATERIAL REHARKS
ANALYSIS AT 25 0 C)
21 TS -60 -45 -203 July 5, 1966 5.3 120 Plastic Plastic Reported iron problem developed afew months after well was com-pleted. Iron problem diminisheswith increased water usage. Ob-served rust stains on enamel ofsinks and tubs. Water distributionsystem is iron.
602 Oct. 24, 1966 -- 80 Steel Steel Reported iron problem developed15 to 18 months after well wascompleted. Air compressor "knocksout the iron. 1i
802 June 17, 1966 6.5 200 Concrete -- Reported no iron problem. "Wateroccasionally blue." Water distri-bution system is copper.
21 46-101 July 6, 1966 7.3 625 Steel Steel Reported no iron problem. Waterdistribution system is plastic.
201 do -- 65 do do Reported iron problem when wellpumps only occasionally.
203 July 12, 1966 5.7 180 Concrete -- Reported iron problem. Reportediron deposition in water heater.Water distribution system is iron.
301 July 6, 1966 5.9 145 Wood -- Reported no iron problem. Conduc-tor pipe is plastic.
404 do -- 195 Steel Steel Reported iron problem.
405 July 13, 1966 6.6 290 Concrete -- Reported no iron problem.
601 July 6, 1966 -- 115 do -- Reported iron problem. Water dis-tribution system is iron. Conduc-tor pipe is plastic.
See footnote at end of table.

I\J00
Table 11.--Field Analyses of Water From Wells in Montgomery and Adjacent Counties--Continued
IDATE
SPECIFIC
ICONDUCTANCE CASING SCREENWELL OF pH (MICROMHOS MATERIAL MATERIAL REMARKS
ANALYSIS AT 25° C)
'T'S-fiO-4fi -fiO/ .Tll1y fi; 1 qfifi -- 110 Pl~stic Pla~ticD~~n_~~~ ~_~_ ~_~ ~~_~____ ---~
'''''-1'' - ..... &,.._u ....... V.L'" <..41.1\".1. 1.10. .... Ul1c;.::> ~ 1"'.L VU
lems. Water distribution system isiron and is reportedly corroded.
603 July 12, 1966 6.5 175 Concrete -- Reported iron problem. Conductorpipe is plastic.
703 July 13, 1966 -- 290 Steel Steel Reported iron problem. Water dis-tribution system is iron.
803 July 12, 1966 -- 150 do do Reported no iron problem. Wellpumped with air compressor. Watertreated with filter.
~ 47-102 May 26, 1966 5.7 -- Concrete -- Reported occasional iron problem.Reported soft water.
407 do 6.2 -- do -- Reported no iron problem. Conduc-tor pipe is plastic.
~ 501 May 25, 1966 609 -- Steel Steel Reported iron problem.
503 do 6.3 -- do do Reported iron problem decreases aswell is pumped.
610 May 27, 1966 7.1 -- do do Reported iron problem. Observedcorrosion on casing and storagetank.
801 do 7.8 -- do do Reported no iron problem. Reportedsoft water.
53-203 Nov. 21, 1966 -- 700 do do Reported no iron problem.
54-301 June 15, 1966 5.9 410 Concrete -- Reported iron problem. Conductorpipe is iron.
303 do 8.2 370 Steel Steel Reported no iron problem.
See footnote at end of table.

~
I\,)(0
Table 11.--Field Analyses of Water From Wells in Montgomery and Adjacent Counties--Continued
DATESPECIFIC
CONDUCTANCE CASING SCREENWEI.I, OF pH (MICROMHOS MATERIAL MATERIAL REMARKSANALYSIS AT 25° C)
T:>-60-54-j04 June b, 19bb b.4 l~U Concrete -- Reported no iron problem. Conduc-tor pipe is plastic.
401 June 10, 1966 5.4 280 Steel -- Reported iron problem. Conductorpipe is plastic.
502 do 6.9 -- do Steel Reported no iron problem.
503 June 16, 1966 707 540 do do Do.
601 do 7.5 440 do do Reported no iron problem. Conduc-tor pipe is plastic.
602 do 7.4 510 Concrete -- Reported no iron problem.
604 June 15, 1966 7.5 380 Steel Steel Reported no iron problem. Reportedhardness problem.
605 do 7.6 480 do do Reported iron problem in original72-foot-deep well. Well deepenedto 154 feet, and no iron problemencountered. Occasional hardnessproblem.
606 June 16, 1966 6.9 -- Wood -- Reported no iron problem.
801 June 10, 1966 6.3 -- Steel Steel Reported iron problem, especiallywhen water is allowed to settle.Water distribution system is plas-tic.
802 do 6.7 -- do do Reported iron problem.
902 do 7.5 -- do do Reported no iron problem.
903 do 7.1 -- do do Reported occasional iron problem.
See footnote at end of table.

Table ll.--Field Analyses of Water From Wells in Montgomery and Adjacent Counties--Continued
wo
~
~
WELL
'!'S-60-5 /! -901:
55-204
305
702
704
902
903
904
62-302
303
63-102
103
401
DATEOF
ANALYSIS
T"...... 1 () 1 al:.I:.-_..- --, -~ --
May 27, 1966
do
June 6, 1966
do
do
do
do
June 16, 1966
June 9, 1966
June 20, 1966
June 7, 1966
June 9, 1966
pH
70'2
7.1
706
705
7.5
7.6
7.6
8.2
7.3
7.1
6.5
7.9
6.1
SPECIFICCONDUCTANCE(MICROMHOSAT 25° C)
240
CASINGMATERIAL
COii.\:r~tc
Steel
do
do
do
Plastic
Steel
do
do
Plastic
Steel
do
do
SCREENMATERIAL
Steel
do
do
do
Plastic
Steel
do
do
Plastic
Steel
do
do
REMARKS
R~PULL~U nu irun problem. Wacerdistribution system and conductorpipe are plastic.
Reported no iron or hardness problems.
Reported no iron problem.
Do.
Do.
Reported no iron or hardness problems.
Reported no iron problem.
Do.
Reported no iron problem. Reportedhardness problem.
Reported no iron problem.
Reported iron problem. Observedcorroded pump. Water used only towash trucks.
Reported no iron problem.
Reported iron problem.
, , " , , I _"~ ,
See footnote at end of table.

w....
Table ll.--Field Analyses of Water From Wells in Montgomery and Adjacent Counties--Continued
DATESPECIFIC
WELL OF pHCONDUCTANCE CASING SCREEN
ANALYSIS(MICROMHOS MATERIAL MATERIAL REMARKS
AT 25° C)
San Jacinto County
~ WU-60-4 7-302 Oct. 5, 1965 6.2 -- Steel Steel Reported iron problem. Originaliron casing corroded by water andreplaced. "Water makes bad coffee."Water is filtered before use.
Walker County
YU-60-29-702 June 27, 1966 7.1 1,150 do do Reported "slightly hard andalkaline" water.
~ See Table 10 for a more complete laboratory chemical analysis.
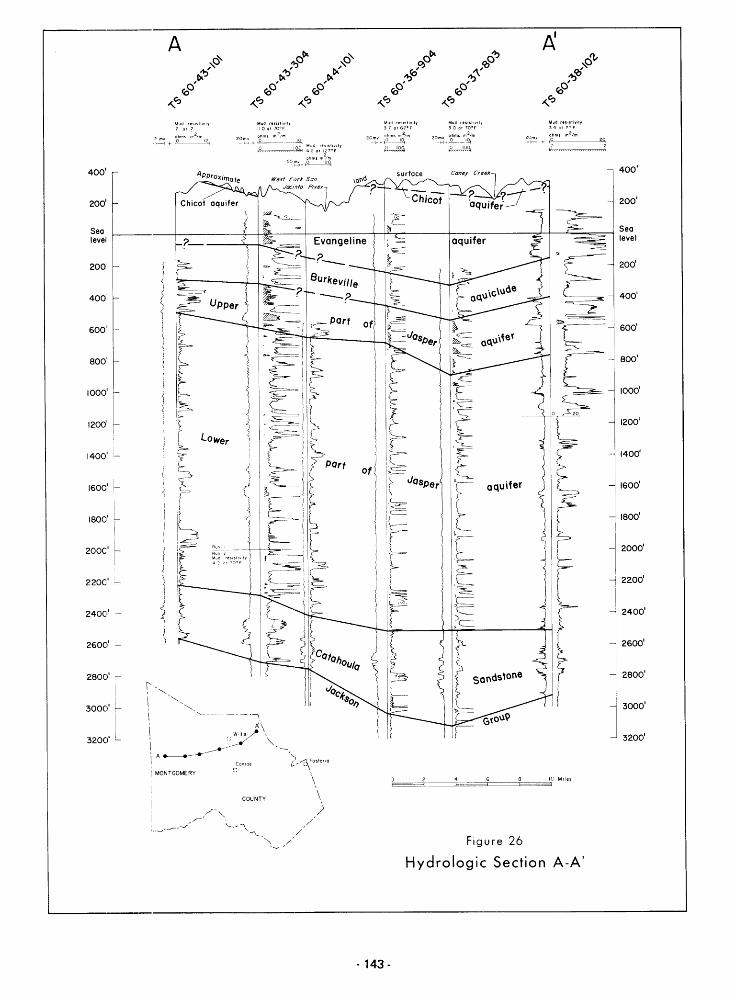
400'
200'
Sealevel
200
400
600'
800'
1000'
1200'
1400'
1600'
1800'
200C'
220C'
2400' ~
2600' -
2800'
3000'
3200'
A
Mod, ", m,
. f-< +
1 I[~C
ILI~'C:
2 ItLOwer51 C I~~
<,e ,[ILJasper I'e-- aquifer
I~ L,<==)1[:
I~E .~
I~-jI==',C=
f=I ,c=
rl.ott-
,~
~tO0'
CO.<.,C:>
~~d orle~l~t~"iIY
ohms m2/m
2_o;::+i~~~~
400'
200'
Sealevel
'z= 200'
400'
~
~f600'
800'
1000'
o?~
I~1200'
1400'
I ~>
'~ 1600'
( 1800'
[~ 2000'
r 2200'
i§-- 2400'
t 2600'
(~
!I2800'
3000'
3200'
. 143-
Figure 26
Hydrologic Section A-A'


