Groundwater and PFAS: Section 3, Human and Ecological Impacts 3.1 One of eight sections prepared by National Ground Water Association volunteers. Each section was prepared to stand independently, or to be integrated with the other seven sections. The Groundwater NGWA Association SM Press Human and Ecological Impacts Section 3 Groundwater and PFAS: State of Knowledge and Practice DRAFT COPY Not NGWA Board-approved Not for circulation
Transcript
Groundwater and PFAS: Section 3, Human and Ecological Impacts 3.1
One of eight sections prepared by National Ground Water Association volunteers. Each section was prepared to stand independently, or to be integrated with the other seven sections.
The GroundwaterNGWA
Association
SM
Pres
s
Human and Ecological Impacts Section 3
Groundwater and PFAS: State of Knowledge
and Practice
DRAFT COPY
Not NGWA Board
-approved
Not for c
irculatio
n
Groundwater and PFAS: Section 3, Human and Ecological Impacts
Groundwater and PFAS: State of Knowledge and Practice
INTRODUCTION Poly- and perfluoroalkyl substances—collectively
referred to as PFAS—are terms used to describe a group of organic fluorinated alkanes.1 In the perflu-oroalkyls, all hydrogen atoms attached to carbons in the aliphatic chain have been replaced by fluorines.2 The polyfluoroalkyls have at least one hydrogen on the alkane that remains unfluorinated (Buck et al. 2011). The six PFAS addressed in this section are categorized as either perfluoroalkyl carboxylic acids (PFCAs) or perfluorosulfonic acids (PFSAs). The PFCAs perfluorooctanoic acid (PFOA), perfluorononanoic acid (PFNA), and perfluoroheptanoic acid (PFHpA) are perfluoroalkyls that contain a fully fluorinated carbon chain of seven, eight, or six carbons, respectively, and a terminal carboxylic acid functional group.3
The PFSAs perfluorooctane sulfonate (PFOS), perflu-orohexane sulfonate (PFHxS), and perfluorobutane sulfonate (PFBS) contain a perfluorinated alkyl carbon chain of eight, six, and four carbons, respectively, and a terminal sulfonate or sulfonic acid group. These six PFAS were selected based on their inclusion in the USEPA’s Third Unregulated Contaminant Monitoring Rule (UCMR3), a program conducted under the Safe Drinking Water Act (SDWA) to develop information on the occurrence of unregulated contaminants in public water systems (USEPA 2012a).
Table 3.1 provides a list of the PFAS addressed in this section: their acronyms, chemical abstract service (CAS) registry numbers, and molecular formulas.
PHYSICAL AND CHEMICAL PROPERTIES
Many of the chemical and physical properties of PFAS that have made them commercially valuable as surfactants also determine their potential for parti-tioning, persistence, and accumulation in the environ-ment and in biota. The PFAS listed in Table 3.1 have low pKa’s4, and as a result, these PFAS tend to exist in their ionic (charged) forms in environmental and biotic media (Conder et al. 2008; CONCAWE 2016). These characteristics also contribute to their relatively high aqueous solubility. The fluorinated carbon chain of the PFCAs and PFSAs is hydrophobic and lipopho-bic, and in combination with the carboxylate and sulfonate functional groups, imparts amphiphilic and surfactant characteristics to these compounds.5
Because of the amphiphilic properties of many PFAS, they do not preferentially partition to lipids, but instead tend to bind to proteins. In humans, the highest concentrations have been detected in serum and liver, and to a lesser extent, the kidney and other organs. The carbon-fluorine bond is extremely strong and renders PFAS resistant to biotic and abiotic degradation; PFAS are not metabolized (ECHA 2013; CONCAWE 2016).
Human and Ecological Impacts
3.2
Disclaimer: This publication is a collaborative effort to try to set forth best suggested practices on this topic but science is always evolving, and individual situations and local conditions may vary, so members and others utilizing this publication are free to adopt differing standards and approaches as they see fit based on an independent analysis of such factors. This publication is provided for informational purposes only, so members and others utilizing this publication are encouraged, as appropriate, to conduct an independent analysis of these issues. The NGWA does not purport to have conducted a definitive analysis on the topic described in this publication, and it assumes no duty, liability or responsibility for the contents or use of the publication.
1 An alkane is a molecule in which all of the carbon-carbon bonds are single. An alkyl is an alkane where at least one hydrogen has been replaced by a non-hydrogen atom or molecule. An alkyl has the general formula CnH2n+1; the perfluoroalkyls have the basic formula CnF2n+1– (Buck et al. 2011).
2 Except those hydrogen atoms whose substitution would modify the nature of any functional groups present (Buck et al. 2011).
3 A carboxylic acid functional group has the molecular formula COOH. A sulfonic acid functional group has the molecular formula SO3H.
4 The pKa is a measure of the tendency of an acid (in this context, the perfluorocarboxylic and perfluorosulfonic acids) to dissociate in solution (i.e., the aqueous environment). In general, a low pKa indicates that an acid dissociates fairly readily to form the corresponding positively and negatively charged chemical species. For example, PFOA will dissociate to form F(CF2)7COO- and H+.
5 An amphiphilic compound has both hydrophilic and lipophilic properties, and as a result, does not fully solubilize in either medium. In biological systems, these compounds tend to partially partition to both aqueous and lipid compartments.
Groundwater and PFAS: Section 3, Human and Ecological Impacts 3.3
BioaccumulationOctanol-water partition coefficients (Kow) can
be used as a predictor of bioaccumulation, as they provide a measure of the extent to which a chemical partitions between water and lipid. In general, par-titioning to lipids is associated with the potential to persist and bioaccumulate, given the limited meta-bolic capacity and blood flow of lipid tissue. Given the amphiphilic nature of many PFAS, determination of Kow’s is not experimentally feasible. Thus, while Kow’s have been calculated for PFAS (see e.g., CONCAWE 2016), it is not clear that they provide a meaningful predictor of the potential of PFAS to accumulate or biomagnify (Conder et al. 2008; ECHA 2013; UNEP 2015; CONCAWE 2016).
The potential for bioaccumulation is typically assessed by empirical measurements of biocon-centration factors (BCFs); bioaccumulation factors (BAFs), biomagnification factors (BMFs), and trophic magnification factors (TMFs). These terms are defined in Appendix 1, which also provides a summary and interpretation of reported values for the PFAS ad-dressed in this section.
The Stockholm Convention Persistent Organic Pollutants Review Committees for PFOS (OECD 2002) and PFOA (UNEP 2015) considered the weight of evidence sufficient to support conclusions that both PFOS and PFOA are bioaccumulative. Accumulation of PFNA in wildlife is well-documented (see section on Exposure of Ecological Receptors). Although there are little to no empirical data on the potential bioac-cumulation of PFBS, PFHpA, and PFHxS, a review of published values indicates that in general, BAFs and BCFs increase with the number of fluorinated carbons (Conder et al. 2008).
HUMAN EXPOSURE As previously discussed, PFAS, including PFOA
and PFOS, are often characterized as persistent since they are extremely resistant to typical environmental degradation processes. They do not hydrolyze, pho-tolyze, or biodegrade under environmental condi-tions (USEPA 2012b), resulting in widespread human exposure.
Human exposure to these chemicals can occur through the following pathways:
• Ingestion of PFAS-containing food, either direct-ly contaminated (food grown on contaminated soils, fish caught from contaminated waters) or indirectly (food contaminated from PFAS-treated food paper wrappings such as pizza boxes, sand-wich wrappers, popcorn bags, etc.)
• Ingestion of PFAS in drinking water• Occupational exposure• Direct contact through the use of consumer
products containing PFAS Teflon Stainmaster carpets Scotchgard Gore-Tex Personal care products (e.g., dental floss,
cosmetics)• Inhalation of ambient air and dust, or contact
with PFAS-contaminated soils.Currently, the relative importance of the human
routes of exposure to these compounds is not well established.
Due to the ubiquitous use of PFAS in a variety of products and industrial applications, it is estimated that PFAS exposure is widespread throughout the U.S. population. Multiple biomonitoring studies have
Table 3.1. Name, acronyms, and molecular formulas of PFAS.
Name Acronym CAS Registry Number Molecular Formula
Groundwater and PFAS: Section 3, Human and Ecological Impacts
estimated that greater than 95% of the general pop-ulation have been exposed to PFAS (CDC 2009; Olsen et al. 2005, 2007, 2008, 2012; Biomonitoring California 2016).
In 2002, 3M Company, a principal manufacturer of PFOS at that time, discontinued production of PFOS and related chemicals. In 2006, the USEPA launched the PFOA Stewardship Program. The goals of the program for member companies were to commit to a 95% reduction in emissions of PFOA, precursor chemicals, and product content levels and to work toward eliminating these chemicals from emissions and products by 2016. Under the Stewardship Pro-gram and through the Toxic Substances Control Act (TSCA), as of 2015 EPA will have removed or restricted approximately 300 distinct PFAS from the market (USEPA 2016a).
Calafat et al. (2007) and Olson et al. (2005, 2007, 2008, 2012) have evaluated the temporal trend of PFAS concentrations in blood plasma. Data from the NHANES study (Calafat et al. 2007) and from Olson and coworkers’ evaluation of PFAS serum concentra-tions of adult American Red Cross blood donors have shown that serum concentrations of PFOS, PFOA, and PFHxS have declined following reduction of PFOS and related chemical production. Olsen et al. (2012) de-termined the decline in PFOS serum concentrations suggest a population halving time of 4.3 years which is generally consistent with a PFOS excretion half-life of 4.5–7.4 years (Harada et al. 2005).
A discussion of the potential routes of human exposure and the relative importance of each route follows in the discussion below.
Domestic Water UsePFOS and PFOA have been widely detected in
surface water including rivers, lakes, and streams (Boulanger et al. 2004, 2005; Kim and Kannan 2007; Nakayama et al. 2007; Lasier et al. 2011), and in groundwater in the United States (USEPA 2017, NJDWQI 2016; ATSDR 2016a). PFHpA and PFHxS were commonly detected in the few studies that analyzed surface water for these compounds (Kim and Kannan 2007; Nakayama et al. 2007; Simcik and Dorweiler 2005). Reported concentrations of PFAS in surface wa-ter samples are generally below 50 nanograms (ng)/L (ATSDR 2015).
Surface water contamination can occur as a result of wastewater discharge from PFAS manufactur-
ing (Davis et al. 2007; USEPA 2008), from municipal wastewater facilities (Boulanger et al. 2005; Sinclair and Kannan 2006), through the use of PFAS con-taining firefighting foam at military installations and firefighting training facilities (Moody and Field 1999; Moody et al. 2003), and through the land application of biosolids contaminated with PFAS (ATSDR 2016a; Hurley et al. 2016).
The USEPA uses the Unregulated Contaminant Monitoring Rule (UCMR) program to collect data for contaminants suspected to be in drinking water, but do not yet have health-based standards set under the Safe Drinking Water Act (SDWA). There is less informa-tion regarding the presence of other non-UCMR PFAS in surface water. The USEPA develops a new list of UCMR contaminants every five years. Under the third revision to UCMR (UCMR3), the USEPA began testing public water supplies (PWSs) in 2013 for six PFAS; the agency’s data provides the most comprehensive population-based data set of PFAS occurrence in drinking water. Table 3.2 summarizes the UCMR data as of January 2017.
In 1035 samples of raw and finished PWS water in New Jersey, PFOA was the most frequently detect-ed PFAS. It was detected in 65% of 72 public water supplies, with the highest detection in finished water of 100 ng/L, and at least one sample with concentra-tions exceeding 40 ng/L in 17% of the public water supplies tested (NJDWQI 2016).
One of the most robust studies investigating PFAS exposure due to groundwater contamination is the C8 Health Project which was created, authorized, and funded as part of the settlement agreement reached in the case of Jack W. Leach et al. v. E.I. du Pont de Ne-mours & Company (no. 01-C-608 W.Va., Wood County Circuit Court, filed 10 April 2002). Industrial discharg-es of PFOA to the atmosphere with subsequent deposition and leaching into groundwater as well as direct releases into the Ohio River led to groundwa-ter contamination over six water districts (Frisbee et al. 2009). The C8 Health Project published a series of Probable Link Reports which, based upon the avail-able scientific evidence, linked PFOA exposure to a number of human diseases including diagnosed high cholesterol, testicular and kidney cancer, ulcerative colitis, thyroid disease, pregnancy-induced hyper-tension, and reduced antibody titer rise (C8 Science Panel 2013; Looker et al. 2014).
3.4
Groundwater and PFAS: Section 3, Human and Ecological Impacts 3.5
Drinking Water
Biomonitoring studies have shown drinking water can be a significant source of exposure among popu-lations whose water is impacted with PFAS contami-nation (Frisbee et al. 2009; Hoffman et al. 2011; ATSDR 2013; MN DOH 2009; NH DHHS 2016), often resulting in PFAS serum concentrations above those measured in the general population (CDC 2009). Frisbee et al. (2009) and Hoffman et al. (2011) conducted biomoni-toring as part of the C8 Health Project. Frisbee and co-workers evaluated data for 66,899 study participants and found that four PFAS (PFHxS, PFOS, PFOA, PFNA) were detectable in >97% of the serum samples. The geometric mean PFOA serum concentrations were approximately 8.5 times higher in the C8 study pop-ulation as compared to the NHANES study popula-tion. Concentrations of PFHxS, PFOS, and PFNA were comparable between the two groups (Frisbee et al. 2009; CDC 2009). In a subset of the C8 Study Popula-tion, Hoffman and coworkers used a pharmacokinetic model to evaluate the relationship between drinking water and serum PFOA levels. The authors concluded that for each 1 µg/L increase in PFOA water con-centration, there was a 141.5 µg/L (95% confidence interval, 134.9–148.1) increase in serum concentra-tion. The steady-state serum:drinking water ratio from the pharmacokinetic model was calculated to be 114 (Hoffman et al. 2011).
Less is known however, as to whether drinking water is a significant route of PFAS exposure among the general population. Hurley et al. (2016) deter-mined there was an association between PFOS and PFOA serum concentrations in women and concen-trations of these compounds in public drinking water supplies. Study participants were linked to UCMR3
public water drinking supply PFAS results through residential zip code. It was determined that 40% of the combined concentrations of PFOS and PFOA exceeded the USEPA Drinking Water Health Advisory (HA) of 0.07 µg/L (USEPA 2016c, d). The investigators found median serum concentrations of PFOS and PFOA were 29% and 38% higher, respectively, among those with detectable levels of PFOS and PFOA in water compared to those without detectable levels.
Showering/bathing
Dermal: Studies have shown very limited ab-sorption of PFAS through the skin, and thus routine showering or bathing will not likely cause significant exposure to PFAS (ATSDR 2016b; MDDOH 2016). Although there is experimental evidence PFOA is dermally absorbed in experimental animals (Kennedy 1985; O’Malley and Ebbens 1981), it is not expected to be a significant route of exposure (Fasano et al. 2005). There are little to no data available on the der-mal absorption of other PFAS but they are expected to be similar to PFOA.
Incidental Ingestion: There is no information regarding exposure to PFAS through incidental inges-tion during showering, bathing, or brushing teeth. It has been recommended by various state agencies to avoid ingestion of PFAS-contaminated water during these activities in order to reduce exposure. However, the incidental ingestion of PFAS during showering, bathing, or brushing teeth is not expected to be a significant source of exposure due to the negligible amount of water ingested (NJDOH 2016; AKDHHS 2015; MNDOH 2016; VT ANR DOH 2016).
Recreational Exposure: There is no informa-tion regarding exposure to PFAS through incidental
Table 3.2. Summary of UCMR3 data1 (January 2017).
Contaminant MRL (μg/L) # PWSs with Results > MRL
HA (μg/L) # PWSs with Results > HA
PFOA 0.02 117/4920 0.07 13
PFOS 0.04 95/4920 0.07 46
PFNA 0.02 14/4920 No Value Not Applicable
PFHxS 0.03 55/4920 No Value Not Applicable
PFHpA 0.01 86/4920 No Value Not Applicable
PFBS 0.09 8/4920 No Value Not Applicable
1 January 2017 UCMR3 Data Summary for Chemical Contaminants, USEPA 2017. MRL = UCMR Minimum Reporting Level; HA = Health Advisory
Groundwater and PFAS: Section 3, Human and Ecological Impacts
ingestion or dermal exposure during recreational activities such as swimming. However, the inciden-tal ingestion of PFAS during recreational activities such as swimming is not expected to be a significant source of exposure due to the negligible amount of water ingested. As discussed in the previous section, dermal absorption is also expected to be negligible and insignificant.
Food: Food is a significant source of exposure to PFAS (Trudel et al. 2008; ATSDR 2015; Lindstrom et al. 2011; Vestergren and Cousins 2009; ASTSWMO 2015), and modeling has indicated that 90% of human ex-posure to PFOS and PFOA may be through ingestion of contaminated food (Fromme et al. 2009). PFOA has been detected in a variety of foods including snack foods, vegetables, meat, dairy products, human breast milk, and fish. PFOS has been detected in eggs, milk, meat, fish, root vegetables, and human breast milk. Occurrence in food products can result from the use of contaminated water in processing and prepa-ration; growth of food in contaminated soils (e.g., in areas that receive biosolids soil amendments from wastewater treatment plants); direct and indirect exposures of domestic animals to PFAS from drink-ing water and consumption of feed crops grown in contaminated soil; fish tissue bioaccumulation from contaminated waterways; and food packaging mate-rials containing PFAS (Hag et al. 2011; Lindstrom et al. 2011; Sepulvado et al. 2011; Venkatesan and Halden 2013; Armstrong et al. 2016; ATSDR 2015; Forns et al. 2015; USEPA 2016c, d). Studies have shown breast milk is a significant exposure route for infants to PFAS. Hag et al. (2011) have shown breast milk contributed greater than 94% of total PFOS exposure in 6-month-old infants, and greater than 83% of PFOA exposure.
Some studies suggest the consumption of fish from contaminated waters may be a major source of human exposure to PFOS (Trudel et al. 2008; Fromme et al. 2009; Domingo 2012). PFOS has been shown to bioaccumulate readily in fish, appears to have the highest bioaccumulation potential of the PFAS in food webs, and is the predominant PFAS detected in fish tissue (Houde et al. 2011). In a study of PFAS concentrations in fish and surface water in New York State, although PFOA was typically found at higher concentrations in water than PFOS, concentrations
of PFOS in fish tissue were approximately 9,000-fold greater than the levels in surface water (Sinclair et al. 2006). The USEPA national screening study of PFAS in freshwater fish determined 80% of samples of urban river fish tissue samples and 100% of Great Lake fish tissue samples contained some detectable PFAS. PFOS was the most commonly detected PFAS in both fish populations; the maximum detected PFOS con-centrations were 127 ppb and 80 ppb in river fish and Great Lake fish tissues, respectively (Stahl et al. 2014).
Exposure to PFAS-Containing ProductsConsumer Products
Although not a primary exposure route, use of PFAS-containing consumer products may result in potential exposure. Some examples are listed below (ATSDR 2015; USEPA 2016c, d).
• Stain/water repellants on clothing, bedding materials, upholstered furniture, carpets, and automobile interiors (Walters and Santillo 2006; Lindstrom et al. 2011). These materials can be a particularly important exposure route for infants and children because of their hand-to-mouth behaviors. PFOA — Stainmaster™, Zonyl™, Nuva™,
Occupational use of PFAS-containing products may result in potential exposure. Some examples are listed as follows (USEPA 2016c, d).
3.6
6 In January 2016, the Food and Drug Administration amended their food additive regulations to no longer allow for the use of perfluoroalkyl ethyl containing food-contact substances as oil and water repellants for paper and paperboard for use in contact with aqueous and fatty foods (USEPA 2016c, d).
Groundwater and PFAS: Section 3, Human and Ecological Impacts 3.7
• Metal plating and finishing (continuing use, PFOS)
use, PFOA)• Aqueous film forming foams (continuing use;
used for firefighting) (PFOS, PFOA)• Semiconductor industry (PFOS)• Oil and mining (PFOS)• Electronics (PFOA)• Flame repellants (PFOS, PFOA).
Ambient air and dustPFOA and PFOS are not volatile and airborne
fractions are primarily bound to aerosol particles (Tru-del et al. 2008; USEPA 2016c, d; ATSDR 2015). These compounds can be released into the atmosphere from fluoropolymer manufacturing and industrial and municipal waste incinerators (ATSDR 2015; USEPA 2016c, d). They can be transported long distances through the atmosphere and have been detected globally at low concentrations (Jahnke et al. 2007). PFOS has been detected in samples collected over the Atlantic Ocean east of southern Africa. Shoeib et al. (2006) detected PFAS concentrations crossing the North Atlantic and the Canadian Arctic Archipelago. Given the widespread commercial and industrial use of PFOA and PFOS and their physical properties, air is a potential source of exposure.
PFAS have been measured in indoor dust in residential, commercial, and office settings because of their use in carpets, textiles, paint, furniture, and other consumer products. Strynar and Lindstrom (2008) detected nine PFAS in indoor dust samples collected from homes and daycare centers in Ohio and North Carolina. PFOS and PFOA were the most commonly detected (94.6% and 96.4% of samples, respectively) with maximum detections of 12,100 ng/g for PFOS and 35,700 ng/g for PFOA. Incidental exposure from indoor dust is an important exposure route, particularly for small children because of their hand-to-mouth behaviors (USEPA 2016c, d).
SoilIncidental Ingestion
Incidental ingestion of soils represents a potential exposure route for PFAS. There is little information regarding background concentrations of PFAS in soil
(ATSDR 2015) and the one limited study found con-centrations to be very low or below detection limits (Washington et al. 2009). Soil contamination tends to occur at manufacturing sites of producers and users of PFAS (3M 2007, 2008) or where disposal of treated products has occurred (e.g., landfills) (USEPA 2016c, d), and potentially where biosolids containing PFAS are applied (Washington et al. 2009; Sepulvado et al. 2011; Venkatesan and Halden 2013; Armstrong et al. 2016). Contaminated soils also can be transported offsite via water and wind.
The use of biosolids as a soil amendment has resulted in the contamination of soils and in the indi-rect contamination of produce and domestic animal feed grown on contaminated soils when wastewater plants received PFAS-containing industrial waste (USEPA 2011; Yoo et al. 2009; Yoo et al. 2011). PFAS have been detected in biosolids samples (Sepulvado et al. 2011; Venkatesan and Halden 2013; Armstrong et al. 2016). Sepulvado et al. (2011) measured the occurrence and fate of PFAS in soil following the land application of municipal sludge biosolids. PFOS was the dominant PFAS detected in both the biosolids and the amended soils. They also found trace lev-els of shorter-chain PFAS in soil cores from biosol-ids-amended soils to depths of 120 cm, suggesting potential movement of these compounds within the soil profile over time and confirming the higher trans-port potential for short-chain PFAS in soils amended with municipal biosolids. Venkatesan and Halden (2013) and Armstrong et al. (2016) also found PFOS was the most abundant PFAS identified in biosolids. Concentrations in biosolids are expected to decline because of the phaseout of the use of PFOS and PFOA in manufacturing and industrial processes.
Dermal
As discussed in the previous sections, the dermal absorption of PFOS is slow and not significant. Although there are little to no data on other PFAS, dermal absorption is also expected to be insignificant.
Inhalation of re-suspended soil particulates
There is no information available regarding ex-posure through the inhalation of re-suspended soil particulates. However, this pathway is not expected to be a relevant exposure pathway to the general population unless located near contaminated soil sites or near agricultural fields where PFAS-contami-nated biosolids were applied as a soil amendment.
Groundwater and PFAS: Section 3, Human and Ecological Impacts
ConclusionsAs discussed, PFAS have been used in a variety
of products and industrial applications, resulting in widespread exposure of the general population. Bio-monitoring studies have estimated more than 95% of the U.S. population have been exposed to PFAS and have measurable concentrations in their blood. How-ever, it should be noted these concentrations have been demonstrably decreased since the discontinu-ation of production of these chemicals in 2002. The greatest portion of chronic intake is likely from the ingestion of contaminated foods and drinking water. Consumer products, recreational activities, ambient air, and soil exposures contribute to a lesser extent to the total chronic intake. Small children, however, experience higher exposure due to hand-to-mouth transfer of chemicals from treated carpets and indoor dust.
EXPOSURE OF ECOLOGICAL RECEPTORS
PFAS have been detected in the tissues of in-vertebrates, fish, birds, and mammals around the globe (Kelly et al. 2009; Butts et al. 2010; Houde et al. 2011; CONCAWE 2016). Much of the published tissue monitoring data are for PFCAs and PFSAs in fish-eat-ing Arctic marine mammals (e.g., seals, dolphins, whales) and polar bears. PFOS is the most frequently detected PFAS; has generally been measured at the highest concentrations; and is the dominant PFAS found in all species and locations around the world (Butts et al. 2010; Houde et al. 2011). PFOA, PFHpA, PFNA, and PFHxS have also been detected (Kelly et al. 2009; Houde et al. 2011; CONCAWE 2016). In the Arctic, PFNA (and perfluoroundecanoate) levels are generally second only to PFOS, with elevated levels of other longer-chain PFCAs observed in seabirds (Butts et al. 2010).
PFAS may discharge to the marine environment via groundwater seepage and surface water flow; however, the prevalence of PFOS and other PFAS in Arctic species such as polar bears, seals, and beluga whales is attributed to precursor volatilization and atmospheric degradation to these terminal stable species, followed by deposition to marine and terres-trial environments and food chain transfer (Houde et
al. 2011; Government of Canada 2013).7 The recent review by Houde et al. (2011) noted PFAS accumula-tion in wildlife is common; long-chain PFCAs (C7-C12), especially the C8 PFOS and the C9 PFNA, have accumulated in Russian seals, Arctic seabirds, and polar bears. These patterns have been observed in Europe and Asia as well; in general, lower PFAS levels have been measured in wildlife from the Southern Hemisphere.
The direct discharge of PFAS to the ocean from groundwater or surface water is partially mitigat-ed by dilution and dispersion associated with tidal fluctuation, wave action, and currents. Additionally, the salinity of ocean water reduces the solubility of PFAS (USEPA 2014) and promotes its adhesion to sedi-ments (Chen 2012), thus reducing its concentration in marine water. Consequently, emerging surface water criteria for marine waters are less stringent than for freshwater.
Contamination ProfilesThe Canadian government has monitored con-
centrations of “PFOS and precursors” and “PFCAs and precursors” in Arctic biota since the early 1990s. For PFCAs and precursors (most recently analyzed in 2011), significant increasing trends in concentrations have been documented in lake trout and landlocked char (select locations), and polar bears. For other monitoring locations, these and other species of wild-life exhibited either no significant change, a declining concentration trend, or a significant increase in the early 2000s but with concentrations currently stable or declining. For all monitored species and locations, concentration trends of PFOS and precursors are either stable or declining; no significant concentra-tion increases are currently evident (Government of Canada 2013).
Hong et al. (2014) detected PFAS in fish, bivalves, crabs, gastropods, shrimp, starfish, and polychaetes off the coast of South Korea. Of these species, tissue samples from bivalves, gastropods, shrimp, and fishes exhibited PFOS concentrations in excess of the draft Canadian Federal Environmental Quality Guideline for PFOS in Mammalian Wildlife Diet (i.e., food/tissue) of 4.6 ng/g wet weight (ww) (Environment Canada 2013). Marine gastropods from the Solberg Scandinavian AFFF site in Norway exhibit a PFOS tissue concentra-
3.8
7 Buck et al. (2011) defines PFAS precursors as large functional derivatives and polymers that contain a perfluoroalkyl moiety and degrade in the environment to form PFOS, PFOA, and similar substances that are stable and resistant to further degradation.
Groundwater and PFAS: Section 3, Human and Ecological Impacts 3.9
tion of 23 ng/g (wet weight) where a stream with a PFOS concentration of 68.8 µg/L discharges to the ocean (Norwegian Pollution Control Authority 2008).
Wildlife EffectsWildlife tissue measurements have primarily been
made on samples collected from free-ranging wildlife species, with few correlations made between tissue levels and adverse effects. The exceptions to this in-clude Kelly et al. (2009) who calculated nursing beluga whale calves in Hudson Bay were exposed to PFOS via maternal transfer at concentrations (2.7 × 10⁻⁵ to 8 × 10⁻⁴ mg/kg-d) that could be toxicologically signif-icant, and Kannan et al. (2006) who established the mean concentrations of PFOA (69 ng/g) and PFOS (65 ng/g) in California sea otters were significantly asso-ciated with mortality from disease. Dietary exposures of mallard and quail to PFBS (100–900 mg/kg) had no effect on mortality, organ histology, or reproductive endpoints such as egg production, viability, hatch-ability, and hatchling success and survival (Newsted et al. 2008). In contrast, PFOS caused mortality when fed to mallards and quail at 50 and 150 mg/kg in the diet, and 10 mg/kg PFOS affected egg hatchability and survival of quail (Newsted et al. 2007). Substan-tially lower concentrations of PFOS (1 to 5 mg/kg) injected into the eggs of chickens elicited a spectrum of adverse effects including increases in spleen and liver weights, and developmental and immunologic effects such as shorter wings, brain asymmetry, and lowered antibody levels. Average serum PFOS levels (154 ng/g) in these chickens were within levels ob-served in wild birds, indicating environmental expo-
sures of birds have the potential to cause biologically significant effects.
Marine gastropods and bivalves occur at the marine interface where groundwater and/or surface water discharge to the ocean. As certain PFAS are bioaccumulative, these shellfish are effectively “trap samplers” that can be collected and analyzed for PFAS. They have a limited range and their locations can be mapped. Such samples are not confounded by tides, currents, and wave action that make it difficult to obtain a meaningful and representative open water sample. Moreover, marine gastropods and bivalves are located lower in the food web. Sampling and tissue analysis of marine gastropods and bivalves may help map the nature and extent of PFAS impacts at the marine interface while serving as a screening measure for ecological health.
TOXICOKINETICS For the general population, ingestion is likely the
primary route by which humans are exposed to PFOA and PFOS (Trudel et al. 2008; Fromme et al. 2009); oral exposure may also be a significant exposure route for PFHpA, PFHxS, PFBS, and PFNA, but this has not been unequivocally established.
Following oral exposure, PFOA, PFOS, PFHxS, and PFBS are absorbed across the gastrointestinal tract and bind to albumin and other serum proteins. PFOA and PFOS are known to distribute from serum to organs via the action of several different classes of transporter proteins. The distribution of these trans-porter proteins—and thus the distribution of PFAS—varies between organs. The liver typically accumu-
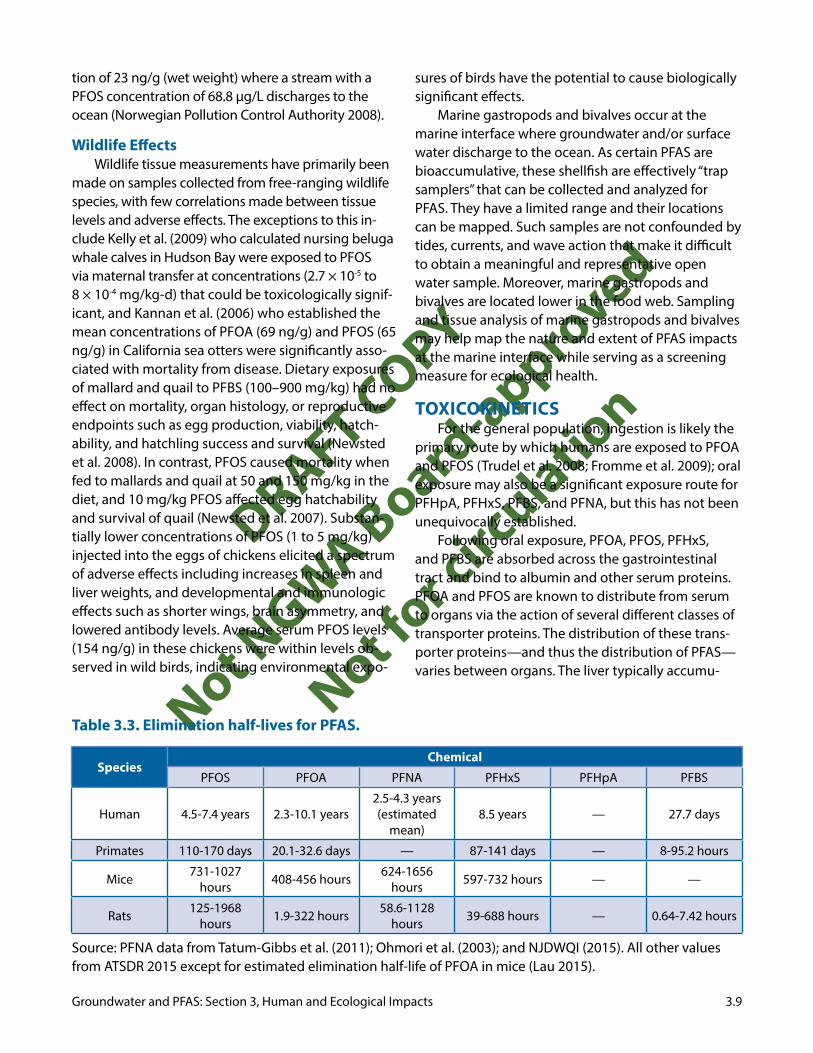
Table 3.3. Elimination half-lives for PFAS.
SpeciesChemical
PFOS PFOA PFNA PFHxS PFHpA PFBS
Human 4.5-7.4 years 2.3-10.1 years2.5-4.3 years (estimated
mean)8.5 years — 27.7 days
Primates 110-170 days 20.1-32.6 days — 87-141 days — 8-95.2 hours
Mice 731-1027 hours 408-456 hours 624-1656
hours 597-732 hours — —
Rats 125-1968 hours 1.9-322 hours 58.6-1128
hours 39-688 hours — 0.64-7.42 hours
Source: PFNA data from Tatum-Gibbs et al. (2011); Ohmori et al. (2003); and NJDWQI (2015). All other values from ATSDR 2015 except for estimated elimination half-life of PFOA in mice (Lau 2015).
Groundwater and PFAS: Section 3, Human and Ecological Impacts 3.10
lates the greatest concentrations of PFAS, with lesser amounts in the kidneys and other organs (ATSDR 2015; Lau 2015; USEPA 2016f, g).
Due to the strength and stability of the car-bon-fluorine bond, PFAS are not metabolized. Their elimination varies with PFAS carbon chain length, species, and gender, with the longest half-lives for PFSAs > C4 and PFCAs > C6 in humans. Primates also eliminate PFAS slowly, and rodents tend to clear PFAS more quickly (Table 3.3). In general, males eliminate PFAS more slowly than females. PFAS are eliminated in the urine, with minor amounts also eliminated in the bile. Significant reabsorption from the kidney occurs in humans and primates, and to a much more limited extent in rodents, and is thought to be a key factor in the species-specific differences in elimina-tion half-lives (ATSDR 2015; Lau 2015; USEPA 2016f, g).
TOXICOLOGICAL EFFECTS OF PFAS PFOA and PFOS have been linked to a multiplicity
of adverse effects including hepatic toxicity, repro-ductive and developmental toxicity, suppression of the immune system, and cancer. The data for PFNA, PFHxS, and PFBS are much more limited, but suggest these compounds also affect the liver. PFNA caused developmental toxicity that was qualitatively similar to that associated with PFOS and PFOA; available data indicate PFBS and PFHxS do not cause reproductive or developmental effects. PFCAs and PFSAs do not appear to be genotoxic or mutagenic (USEPA 2016f, g; Butenhoff et al. 2014).
Reproductive and Developmental EffectsPFAS cross the placenta of humans and animals,
and can also be transferred to offspring during lacta-tion (Karrman et al. 2007; Fenton et al. 2009; Gutzcow et al. 2012).
PFOA. PFOA is one of the PFAS known to cross the mammalian placenta, and exposures during gestation have been tied to a range of reproductive and de-velopmental effects (USEPA 2016f ). Epidemiological studies of individuals exposed to PFOA-contaminated drinking water from industrial discharges (“highly exposed populations”) have demonstrated an associ-ation between PFOA and pregnancy-induced hyper-tension (Darrow et al. 2013; USEPA 2016f ). Although PFOA has not been linked to low birth weight in these highly exposed populations, there is some evidence associating PFOA exposure in the general population
to small decreases in birth weight (Verner et al. 2015), decreases in fecundity (Velez et al. 2015) and fertility (Fei et al. 2009). In mice, PFOA has a significantly lon-ger half-life than in rats—a fact that likely contributes to the greater sensitivity of mice to the reproductive and developmental effects of PFOA (Lau 2015). In mice, PFOA (≥1 mg/kg) has caused decreases in pup body weight and decreased neonatal survival, where-as higher doses (> 5 mg/kg) increased litter resorp-tion and numbers of still births. Rats also experience developmental effects of PFOA, albeit at larger doses than mice. Decreased body weight gain, delayed sex-ual maturity, and decreased viability were observed in rat offspring after gestational exposure to 30 mg/kg (Butenhoff et al. 2004). The USEPA identified reduced ossification of the fore- and hindlimbs in male and female mouse pups, and accelerated puberty in male mice pups administered 1 mg/kg PFOA for derivation of the reference dose (RfD) (USEPA 2016f ).
PFOS. In human populations, fetal PFOS exposure has been linked with lower average birth weights and with low infant body weight. Elevated serum PFOS levels have also been associated with decreased fertil-ity and fecundity, manifested as greater time to preg-nancy (USEPA 2016g). Several studies have shown ef-fects of PFOS on semen quality, although the majority of studies that examined sperm parameters have not found a significant effect (USEPA 2016g). Additional evidence has linked serum PFOS with pre-gestational diabetes, and pregnancy-induced hypertension (USE-PA 2016g). In rodents, PFOS has caused increased pup mortality, decreased body weight, and developmen-tal delays. Exposure of rodents during gestation and lactation has been associated with abnormal glucose regulation in the offspring at maturity (USEPA 2016g). The EPA identified decreased body weights in new-born rats as the most sensitive endpoint observed from toxicity studies, and used the no observed ad-verse effect level (NOAEL) of 0.1 mg/kg-d as the basis of the RfD (USEPA 2016g).
PFNA. In mice, PFNA caused qualitatively similar developmental toxicity to PFOA and PFOS, with oral PFNA exposure causing dose-related effects in the number of live pups at birth and survival to weaning (Wolf et al. 2010) and neonatal mortality (Das et al. 2015). Surviving pups (1, 3, and 5 mg/kg) exhibited delayed eye opening and a delay in the onset of puberty (Das et al. 2015).
Groundwater and PFAS: Section 3, Human and Ecological Impacts 3.11
Other PFAS. Limited data indicate neither PFHxS nor PFBS are reproductive or developmental toxins, in that orally administered PFBS (30–1000 mg/kg) did not affect fertility, reproduction, or multiple indices of developmental toxicity in rats including litter size, mean pup birth weight, or pup survival (Lieder et al. 2009a). Similarly, PFHxS did not cause reproductive or developmental effects in rats given 0.3 to 10 mg/kg prior to mating, and during gestation and lactation (Butenhoff et al. 2009). However, increasing serum concentrations of PFHxS have been correlated to small decrements in human fecundity (Velez et al. 2015). There are no data on the reproductive or devel-opmental effects of PFHpA.
Liver and LipoproteinsPFOA. In PFOA-exposed workers and nearby
“highly exposed” community members exposed via drinking water, multiple epidemiology studies have linked elevated PFOA serum concentrations with increases in total cholesterol and low-density lipopro-teins (serum PFOA levels of 0.4 to 12 micrograms per milliliter [μg/mL] in workers, and an average of 0.08 μg/mL in community members). PFOA serum levels of 0.002 to 0.007 μg/mL were associated with elevat-ed levels of triglycerides (USEPA 2016f ). In animals, PFOA (and PFOS) tend to lower levels of total choles-terol, triglycerides, and lipoproteins (USEPA 2016f ). Epidemiology studies of PFOA-exposed workers and residents of communities affected by industri-al discharges of PFOA have consistently shown a relationship between serum PFOA levels and the liver enzymes alanine aminotransferase and gamma-glu-tamyl transaminase. These results notwithstanding, epidemiology data have not provided evidence of PFOA-induced liver damage. Rodents exposed to PFOA frequently exhibit increased liver weight and hepatocellular hypertrophy. Unless there is concomi-tant necrosis or cellular degeneration however, these effects are generally not considered biologically sig-nificant as they tend to be reversible once exposure ends (USEPA 2016f ).
PFOS. Data from epidemiology studies have demonstrated an association between serum PFOS levels (0.0084 μg/mL to 0.022 μg/mL) and increases in total cholesterol (USEPA 2016g). Multiple species of animals exposed to PFOS (0.098 to 1.56 mg/kg) have exhibited a similar spectrum of hepatic effects to those induced by PFOA, including cellular hypertro-
phy, increased liver weight, and vacuolation (USEPA 2016g).
Other PFAS. Limited data indicate the liver is also a target for PFNA, PFBS, and PFHxS, with hepa-tocellular hypertrophy, increased liver weight, and decreased lipoprotein synthesis observed. PFBS exposure elicited increased liver weight and adap-tive hepatic hypertrophy in rats following doses of 300–1000 mg/kg (Lieder et al. 2009a). PFHxS caused increased liver weight and hypertrophy in rats (0.3–10 mg/kg); decreased triglyceride levels (rats, 3–10 mg/kg; mice, 30 mg/kg), and decreased levels of cho-lesterol and various lipoproteins in mice (6 mg/kg) were also features of PFHxS exposure (Butenhoff et al. 2009; Bijland et al. 2011). While PFBS exposure (30 mg/kg) has also been associated with impaired lipoprotein synthesis, the effects were limited to triglycerides (Bijland et al. 2011).
There are no data on the potential effects of PFH-pA on the liver.
Immune SystemPFOA and PFOS. Evidence from both human and
animal studies indicate PFOA and PFOS adversely affect multiple components of the immune system and as a result, can alter immune function (National Toxicology Program [NTP] 2016). Both PFOA and PFOS suppressed the antibody response and in-creased hypersensitivity-related outcomes in humans and animals. In humans, there is also evidence PFOA decreased resistance to infectious disease and in-creased autoimmune disease (NTP 2016). Animal data also indicate PFOS suppresses disease resistance and natural killer (NK) cell activity (NTP 2016).
Other PFAS. PFNA was cytotoxic to the spleen and thymus of mice (key organs of the immune system), reducing populations of splenic T cells, impairing cell replication in the thymus, and impairing the produc-tion of cell-signaling molecules (Fang et al. 2008).
There are no data on the effects of PFHpA, PFBS, or PFHxS to the immune system.
CarcinogenicityPFOA and PFOS. Available data indicate neither
PFOA nor PFOS are genotoxic or mutagenic (USEPA 2016e, f ); however, both PFOA and PFOS induce tu-mors in rodents after long-term high-level exposure. The USEPA Office of Water determined that there is
Groundwater and PFAS: Section 3, Human and Ecological Impacts 3.12
“suggestive evidence of carcinogenic potential” for PFOA (USEPA 2016c) and PFOS (USEPA 2016d). The International Agency for Research on Cancer (IARC 2016) found PFOA to be “possibly carcinogenic.” Nei-ther agency nor independent scientists have evaluat-ed the genotoxicity, mutagenicity, or carcinogenicity of other PFAS.
Epidemiology studies from highly exposed popula-tions exposed to PFOA in drinking water found associ-ations between serum PFOA serum levels and kidney and testicular cancers (C8 Science Panel 2013). In rats, PFOA exposure led to liver, testicular, and pancreatic tumors (reviewed in USEPA 2016d). Based on the rat testicular data for PFOA, the USEPA (2016d) derived a cancer slope factor (CSF) of 0.07 (mg/kg-d-1).
The evidence regarding the potential carcinogenic-ity of PFOS is more limited than for PFOA, and consists of somewhat equivocal epidemiologic evidence link-ing human exposure to PFOS to bladder and prostate cancer. Animal data support an association between PFOS exposure and an increased incidence of sever-al tumor types, with the strongest evidence for liver tumors (USEPA 2016e). The USEPA (2016e) found the PFOS tumor data insufficient to derive a CSF.
Other PFAS. The carcinogenicity of PFNA, PFHpA, PFBS, and PFHxS has not been evaluated.
RISK ASSESSMENT OF PFAS Many PFAS are environmentally persistent,
bioaccumulate in living organisms, and have demon-strated toxicity in laboratory animals and humans. The C8 Health Project, one of the most robust studies of PFOA exposure, provided data on approximately 70,000 exposed Ohio and West Virginia residents. Drinking water exposure to PFOA was linked to serum PFOA concentrations and a range of specific adverse health outcomes. Additionally, national biomonitor-ing studies have shown that the majority of the U.S. population has been exposed to PFAS. It is therefore prudent to assess and potentially mitigate human and/or environmental exposures.
Available Toxicity Criteria and Screening LevelsToxicity Criteria
Non-Cancer RfD: USEPA developed updated oral Reference Doses of 2E-05 mg/kg/day, applicable to both PFOS and PFOA. The RfDs were derived from developmental toxicity studies in mice (PFOA) (USEPA
2016e) and rats (PFOS) (USEPA 2016f ). The RfD is an estimated daily exposure level for the human pop-ulation (including sensitive subpopulations) that is likely to be without an appreciable risk of deleterious effects during a lifetime (USEPA 1989). USEPA recom-mends this value for both short-term (sub-chronic) and chronic (lifetime) exposures. USEPA has derived a provisional sub-chronic RfD (0.2 mg/kg/day) and a provisional chronic RfD (0.02 mg/kg/day) for perfluo-robutane sulfonate (PFBS) based upon a sub-chronic and reproductive study in rats (USEPA 2014b).
At this time, there are insufficient data available to calculate an inhalation Reference Concentration (RfC) for PFOS and PFOA (USEPA 2016e, f ).
Cancer Slope Factor: PFOA and PFOS have been classified as having Suggestive Evidence of Carcino-genic Potential in humans by USEPA (USEPA 2016e, f ), while PFOA has also been classified as a Group 2B carcinogen (possibly carcinogenic to humans) by the International Agency for Research on Cancer (IARC) (IARC 2016). An oral cancer slope factor of 0.07 (mg/kg/day-1) has been developed for PFOA by USEPA, based upon testicular cancer (Leydig Cell tumors) in rodents (USEPA 2016e). An oral cancer slope factor has not been calculated for PFOS since the avail-able tumor data were determined to be inadequate for quantitative assessment (USEPA 2016f ). PFBS is provisionally classified as “Inadequate Information to Assess Carcinogenic Potential” (USEPA 2014b). Cancer slope factors provide an upper-bound estimate of the probability of a response (i.e., cancer) per unit intake of a chemical over a lifetime (USEPA 1989).
Drinking Water Health Advisory
Currently there are no federal regulations un-der the Safe Drinking Water Act (SDWA) or national recommended ambient water quality criteria under the Clean Water Act (CWA) for PFAS. In 2009, USEPA developed interim, provisional HAs for short-term ex-posure to PFOS and PFOA of 0.2 and 0.4 µg/L, respec-tively (USEPA 2009). HAs identify the concentration of a contaminant in drinking water at which adverse health effects are not anticipated to occur over specif-ic exposure durations (e.g., 1 day, 10 days, a lifetime). HAs serve as informal technical guidance to assist federal, state, and local officials and managers of pub-lic or community water systems in protecting public health when emergency spills or other contamination situations occur (USEPA 2016c, d).
Groundwater and PFAS: Section 3, Human and Ecological Impacts 3.13
Entity Resident Industrial Worker
Recreational User
Outdoor Commercial
Worker
Excavation or Construction
Worker
PFOS PFOA PFOS PFOA PFOS PFOA PFOS PFOA PFOS PFOA
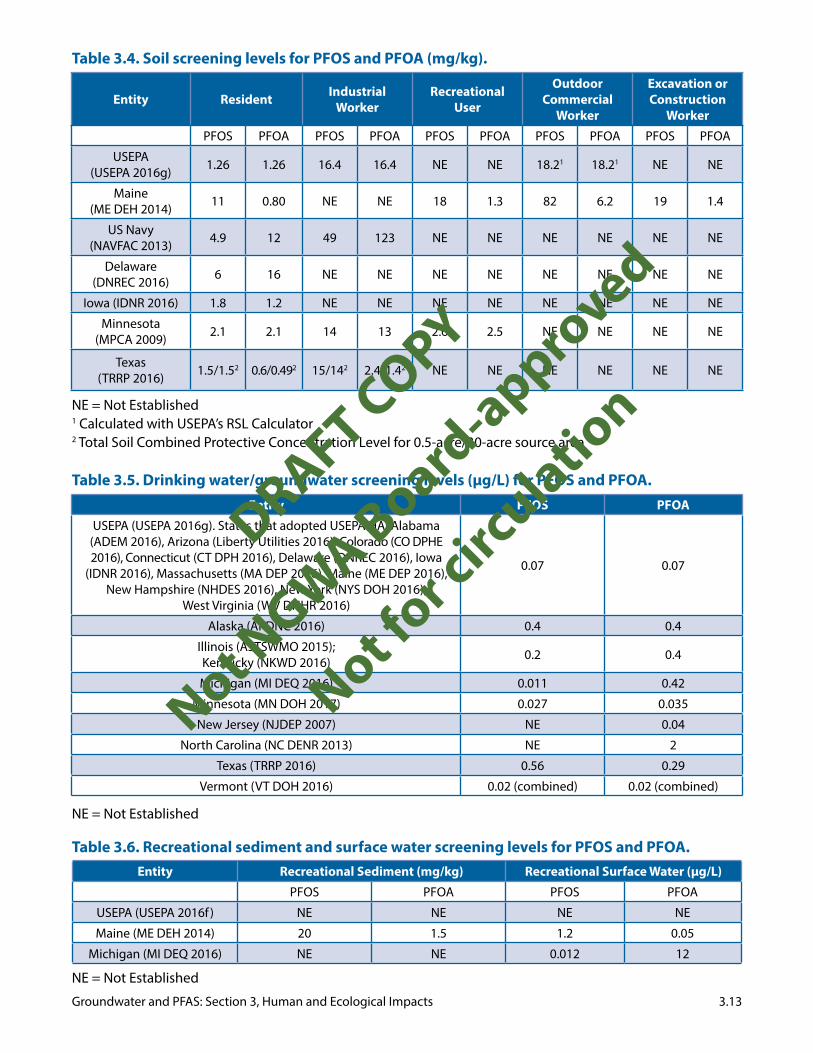
USEPA (USEPA 2016g) 1.26 1.26 16.4 16.4 NE NE 18.21 18.21 NE NE
Maine (ME DEH 2014) 11 0.80 NE NE 18 1.3 82 6.2 19 1.4
US Navy (NAVFAC 2013) 4.9 12 49 123 NE NE NE NE NE NE
Delaware (DNREC 2016) 6 16 NE NE NE NE NE NE NE NE
Iowa (IDNR 2016) 1.8 1.2 NE NE NE NE NE NE NE NE
Minnesota (MPCA 2009) 2.1 2.1 14 13 2.6 2.5 NE NE NE NE
Texas (TRRP 2016) 1.5/1.52 0.6/0.492 15/142 2.4/1.42 NE NE NE NE NE NE
Table 3.4. Soil screening levels for PFOS and PFOA (mg/kg).
NE = Not Established1 Calculated with USEPA’s RSL Calculator2 Total Soil Combined Protective Concentration Level for 0.5-acre/30-acre source area
Table 3.5. Drinking water/groundwater screening levels (µg/L) for PFOS and PFOA.
Vermont (VT DOH 2016) 0.02 (combined) 0.02 (combined)
Entity Recreational Sediment (mg/kg) Recreational Surface Water (µg/L)
PFOS PFOA PFOS PFOA
USEPA (USEPA 2016f ) NE NE NE NE
Maine (ME DEH 2014) 20 1.5 1.2 0.05
Michigan (MI DEQ 2016) NE NE 0.012 12
Table 3.6. Recreational sediment and surface water screening levels for PFOS and PFOA.
NE = Not Established
Groundwater and PFAS: Section 3, Human and Ecological Impacts 3.14
REFERENCES3M. 2007. Remedial investigation report. Phase 2. Fluorochemical (FC) Data assessment report for the Cottage Grove, MN site. St. Paul, MN: 3M Corporate Toxicology. As cited in ATSDR 2015.
3M. 2008. Screening level human exposure assessment report. 3M Decatur, Alabama facility PFOA site-related environmental monitoring program. St. Paul, MN: 3M Company. As cited in ATSDR 2015.
ADEM (Alabama Department of Environmental Management). 2016. ADEM Announces EPA national health advi-sory. Thursday, May 19. http://www.adem.state.al.us/newsEvents/pressreleases/2016/ADEMEPAHealthAdvisory.pdf
AKDEC (Alaska Department of Environmental Conservation). 2016. Interim technical memorandum: Comparing DEC cleanup levels for perfluorooctane sulfonate (PFOS) and perfluorooctanoic acid (PFOA) to EPA’s health advi-sory levels. Division of Spill Prevention and Response. Contaminated Sites Program. August 25. https://dec.alaska.gov/spar/csp/guidance_forms/docs/Interim%20Tech%20Memo%20-%20DEC%20cleanup%20levels%20and%20EPA%20HAs%20for%20PFOS%20and%20PF OA%20August%202016%20Final.pdf
As of May 2016, the lifetime drinking water HA for PFOA and PFOS is 0.07 µg/L, which is applicable to either chemical individually or collectively. The HA is based upon the RfD of 2 × 10⁻⁵ mg/kg discussed previously. Since the HA was developed based upon sensitive developmental effects, it is also protective of adverse effects seen in adults (liver and kidney toxicity). Because the HA is lower than the concen-tration derived for carcinogenic effects of PFOA, it is also protective of carcinogenic effects for the general population (USEPA 2016c, d).
Screening Levels
A summary of available screening levels for PFOS and PFOA are provided in Tables 3.4 (Soil), 3.5 (Drinking Water/Groundwater) and 3.6 (Recreational Sediment and Surface Water). Additional screening levels for PFBS and a number of other PFAS are available from USEPA (USEPA 2016g) and from other state agencies including Delaware (DNREC 2016), Indiana (IDEM 2016), Minnesota (MPCA 2009; MN 2016), New Jersey (NJDEP 2015, 2016), Nevada (NDEP 2015), North Carolina (NC DENR 2016), and Texas (TRRP 2016).
Relative Source Contribution in the Derivation of PFAS Risk-Based Criteria
A Relative Source Contribution (RSC) factor takes into account drinking water and non-drinking water exposures to a contaminant including food, soil, air, water, and consumer product use. The RSC is applied in the USEPA HA calculation to ensure an individual’s total exposure from a contaminant (i.e., PFOA) does not exceed the RfD. The RSC accounts for the portion of the RfD attributed to drinking water (directly or indirectly
in beverages like coffee, tea, or soup); the remainder of the RfD is allocated to other potential exposure sourc-es. In the case of PFOA, other potential sources include ambient air, foods, incidental soil/dust ingestion and consumer products.
The USEPA’s default RSC value is 20%, which means 20% of the total exposure is assumed to come from drinking water and 80% from non-drinking water sources. The USEPA determined there were insufficient data to develop a chemical-specific RSC for PFOA and PFAS, and therefore the default value of 20% was used to calculate the HA (USEPA 2016c, d).
Unique Receptors and/or Exposure Factors Used in the Derivation of PFAS Risk-Based Criteria
The lifetime HAs for PFOS and PFOA were calcu-lated using drinking water intake and body weight parameters for lactating women in order to be protective of this critical exposure period for infants. Studies have shown significant exposure to infants through the ingestion of breast milk (Hag et al. 2011; Forns et al. 2015); consistent with this fact, studies have also shown breast feeding to be a potential excretion route for mothers (Mondal et al. 2014). The lactating woman provides the more protective sce-nario over the pregnant woman, given an increased water intake is needed to support milk production. The use of these exposure factors to calculate the lifetime HA are specific to the most sensitive popu-lation and therefore are protective of pregnant and lactating women as well as the general population (USEPA 2016c, d).
Groundwater and PFAS: Section 3, Human and Ecological Impacts 3.15
AKDHSS (Alaska Department of Health and Social Services). 2015. Perfluorooctane sulfonate (PFOS) fact sheet. June 15. http://dhss.alaska.gov/dph/Epi/eph/Documents/PFOSFactSheet.pdf
Armstrong, D.L., N. Lozano, C.P. Rice, M. Ramirez, and A. Torrents. 2016. Temporal trends of perfluoroalkyl substances in limed biosolids from a large municipal water resource recovery facility. Journal of Environmental Management, vol. 165, 88–95.
ASTSWMO (Association of State and Territorial Solid Waste Management Officials). 2015. Perfluorinated chemicals (PFCs): perfluorooctanoic acid (PFOA) and perfluorooctane sulfonate (PFOS). Information paper. Remediation and reuse focus group. Federal Facilities Research Center. August. https://clu-in.org/download/contaminantfocus/pops/POPs-ASTSWMO-PFCs-2015.pdf
ATSDR (Agency for Toxic Substances and Disease Registry). 2013. Exposure investigation report: PFC serum sam-pling in the vicinity of Decatur, AL Morgan, Lawrence, and Limestone Counties. April 2013. http://www.atsdr.cdc.gov/HAC/pha/Decatur/Perfluorochemical_Serum Sampling.pdf
ATSDR (Agency for Toxic Substances and Disease Registry). 2015. Toxicological Profile for Perfluoroalkyls. Draft. August.
ATSDR (Agency for Toxic Substances and Disease Registry). 2016a. Per- and perfluoroalkyl substances and our health. How is ATSDR involved in investigating PFAS in the environment? https://www.atsdr.cdc.gov/pfc/atsdr_sites_involvement.html
ATSDR (Agency for Toxic Substances and Disease Registry). 2016b. Per- and perfluoroalkyl substances (PFAS). Frequently asked questions. https://www.atsdr.cdc.gov/pfc/docs/pfas_fact_sheet.pdf
Barry, V., A. Winquist, and K. Steenland. 2013. Perfluorooctanoic acid (PFOA) exposures and incident cancers among adults living near a chemical plant. Environmental Health Perspectives, vol. 121, no. 11-12, 1313-1318.
Begley, TH., K. White, P. Honigfort, M.L. Twaroski, R. Neches, and R.A. Walker. 2005. Perfluorochemicals: Potential sources of and migration from food packaging. Food Additives & Contaminants, vol. 22, no. 10, 1023–1031.
Bijland, S., P.C.N. Rensen, E.J. Pieterman, A.C.E. Maas, J.W. van der Hoorn, M.J. van Erk, L.M. Havekes, K.W. van Dijk, S. Chang, D.J. Ehresman, J.L. Butenhoff, and H.M.G. Princen. 2011. Perfluoroalkyl sulfonates cause alkyl chain length-dependent hepatic steatosis and hypolipidemia mainly by impairing lipoprotein production in APOE*3Leiden.CETP mice. Toxicological Sciences, vol. 10, no. 1093.
Boulanger, B., J. Vargo, J.L. Schnoor, and K.C. Hornbuckle. 2004. Detection of perfluorooctane surfactants in Great Lakes water. Environmental Science and Technology, vol. 38, 4064- 4070.
Boulanger, B., A.M. Peck, J.L. Schnoor, and K.C. Hornbuckle. 2005. Mass budget of perfluorooctane surfactants in Lake Ontario. Environmental Science and Technology, vol. 39, 74-79.
Buck, R.C., J. Franklin, U. Berger, J. Conder, I. Cousins, P. de Voogt, A. Astrup, Y. Jensen, K. Kannan, S. Mabury, and S.PJ. Van Leeuwenkk. 2011. Perfluoroalkyl and polyfluoroalkyl substances in the environment: Terminology, classification, and origins. Integrated Environmental Assessment and Management, vol. 7, no. 4, 513-541.
Butenhoff, J.L., G.L. Kennedy Jr., S.R. Frame, J.C. O’Connor, and R.G. York. 2004. The reproductive toxicology of ammo-nium perfluorooctanoate (APFO) in the rat. Toxicology, vol. 196, no. 1-2, 95-116.
Butenhoff, J.L., S.C. Chang, D.J. Ehresman, and R.G. York. 2009. Evaluation of potential reproductive and developmen-tal toxicity of potassium perfluorohexanesulfonate in Sprague Dawley rats. Reproductive Toxicology, vol. 27, no. 3-4, 331-341.
Butenhoff, J.L., G.L. Kennedy, R. Jung, and S-C. Chang. 2014. Evaluation of perfluorooctanoate for potential genotox-icity. Toxicology Reports, vol. 1, 2014, 252-270.
Butts, C.M., U. Berger, R. Bossi, and G.T. Tomy. 2010. Levels and trends of poly- and perfluorinated compounds in the arctic environment. Science of the Total Environment, vol. 10, no. 1016.
C8 Science Panel. 2013. C8 Probable link reports. http://www.c8sciencepanel.org/prob_link.html
Groundwater and PFAS: Section 3, Human and Ecological Impacts 3.16
Calafat, A.M., L-Y. Wong, Z. Kuklenyik, J.A. Reidy, and L.L. Needham. 2007. Polyfluoroalkyl chemicals in the U.S. popu-lation: Data from the National Health and Nutrition Examination Survey (NHANES) 2003-2004 and comparisons with NHANES 1999-2000. Environmental Health Perspectives, vol. 115, no. 11, 1596-1602.
CDC (Centers for Disease Control). 2009. Fourth national report on human exposure to environmental chemi-cals. Department of Health and Human Services. Centers for Disease Control and Prevention. http://www.cdc.gov/exposurereport/pdf/FourthReport.pdf
Chen, H., C. Zhang, and J. Han. 2012. Sorption of perfluorooctane sulfonate (PFOS) on marine sediments. Marine Pollution Bulletin, vol. 65, 902–906.
CO DPHE (Colorado Department of Public Health & Environment). 2016. PFCs – EPA health advisory. https://www.colorado.gov/pacific/cdphe/PFCs/health
CONCAWE. 2016. Report no. 8/16. Environmental fate and effects of poly- and perfluoroalkyl substances (PFAS). Brussels, Belgium: Concawe.
Conder, J.M., R.A. Hoke, W. De Wolf, M.H. Russell, and R.C. Buck. 2008. Are PFCAs bioaccumulative? A critical review and comparison with regulatory criteria and persistent lipophilic compounds. Environmental Science & Technology, vol. 42, no. 4, 995-1003.
CT DPH (Connecticut Department of Public Health). 2016. EPA drinking water health advisory for two perfluorinated compounds. June 10. http://www.ct.gov/dph/lib/dph/drinking_water/pdf/Circular_Letter_2016-16.pdf
Custer, M.C., T.W. Custer, H.L. Schoenfuss, B.H. Pogansk, and L. Solem. 2012. Exposure and effects of perfluoroalkyl compounds on tree swallows nesting at Lake Johanna in east central Minnesota, USA. Reproductive Toxicity, vol. 33, 2012, 556-562.
Darrow, L.A., C.R. Stein, and K. Steenland. 2013. Serum perfluorooctanoic acid and perfluroooctane sulfonate con-centrations in relation to birth outcomes in the Mid-Ohio Valley, 2005-2010. Environmental Health Perspectives, vol. 121, no. 10, 1207-1213.
Das, K., B.E. Grey, M.B. Rosen, C.R. Wood, K.R. Tatum-Gibbs, R.D. Zehr, M.J. Strynar, A.B. Lindstrom, and C. Lau. 2015. Developmental toxicity of perfluorononanoic acid in mice. Reproductive Toxicity, vol. 51, 133-144.
Davis, K.L., M.D Aucoin, B.S. Larsen, M.A. Kaiser, and A.S. Hartten. 2007. Transport of ammonium perfluorooctanoate in environmental media near a fluoropolymer manufacturing facility. Chemosphere 67:2011-2019.
DNREC (Delaware Department of Natural Resources). 2016. Screening level table. July.
Domingo, J.L. 2012. Health risks of dietary exposure to perfluorinated compounds. Environment International 40:187-195.
Environment Canada. 2013. Perfluorooctane Sulfonate in the Canadian Environment.
ECHA. European Chemicals Agency. 2013. Member state committee support document for identification of penta-decafluorooctanoic acid (pfoa) as a substance of very high concern because of its cmr and pbt properties. Adopted on 14 June 2013. SVHC Support Document–PFOA.
European Food Safety Authority. 2014. External Scientific Report: Extensive literature search and provision of sum-maries of studies related to the oral toxicity of perfluoroalkylated substances (PFAS), their precursors and potential replacements in experimental animals and humans. Area 1: Data on toxicokinetics (absorption, distribution, me-tabolism, excretion) in in vitro studies, experimental animals and humans. Area 2: Data on toxicity in experimental animals. Area 3: Data on observations in humans. EFSA supporting publication 2014: EN- 572.
Fang, X., L. Zhang, Y. Feng, Y. Zhao, and J. Dai. 2008. Immunotoxic effects of perfluorononanoic acid on BALB/c mice. Toxicological Sciences, vol. 105, no. 2, 312-321.
Fasano, W.J., G.L. Kennedy, B. Szostek, D.G. Farrar, R.G. Ward, L. Haroun, and W.M. Hinderliter. 2005. Penetration of ammonium perfluorooctanoate through rat and human skin in vitro. Drug & Chemical Toxicology, vol. 28, 79–90.
Fei, C., J.K. McLaughlin, L. Lipworth, and J. Olsen. 2009. Maternal levels of perfluorinated chemicals and subfecundi-ty. Human Reproduction, vol. 1, no. 1, 1-6.
Groundwater and PFAS: Section 3, Human and Ecological Impacts 3.17
Fenton, S., J. Reiner, S. Nakayama, A. Delinskym, J. Stanko, E. Hines, S. White, A. Lindstro, M. Stryner, and S-S. Petropoulou. 2009. Analysis of PFOA in dosed CD-1 mice. Part 2. Disposition of PFOA in tissues and fluids from pregnant and lactating mice and their pups. Reprod Toxicol. 27, no. 3-4, 365–372.
Forns, J., N. Iszatt, R.A. White, S. Mandal, A. Sabaredzovic, M. Lamoree, C. Thomsen, L.S. Hag, H. Stigum, and M. Eggresbo. 2015. Perfluoroalkyl substances measured in breast milk and child neuropsychological development in Norwegian birth cohort study. Environment International, vol. 83, 176-182.
Frisbee, S.J., A.P. Brooks Jr., A. Maher, P. Flensborg, S. Arnold, T. Fletcher, K. Steenland, A. Shankar, S.S. Knox, C. Pollard, J.A. Halverson, V. Vieira, C. Jin, K.M. Leyden, and A.M. Ducatman. 2009. The C8 health project: Design, methods and participants. Environmental Health Perspectives, vol. 117, 1873-1882.
Fromme, H., S.A. Tittlemier, W. Volkel, M. Wilhelm, and D. Twardella. 2009. Perfluorinated compounds – Exposure as-sessment for the general population in western countries. International Journal of Hygiene and Environmental Health, vol. 212, no. 3, 239–270.
Government of Canada. 2013. Canadian Arctic Contaminants Assessment Report III (2013): Persistent Organic Pollutants in Canada’s North. Government of Canada.
Gutzcow, K., L. Haug, C. Thomsen, A. Sabaredzovic, G. Becher, and G. Brunborg. 2012. Placental transfer of perfluo-rinated compounds is selective – A Norwegian mother and child sub-cohort study. International Journal of Hygiene and Environmental Health, vol. 215, 2, 216-219.
Hag, L.S., S. Huber, G. Becher, and C. Thomsen. 2011. Characterization of human exposure pathways to perfluorinat-ed compounds – Comparing exposure estimates with biomarkers of exposure. Environment International, vol. 37, 687–693.
Harada K., K. Inoue, A. Morikawa, T, Yoshingaga, N. Saito, and A. Koizumi. 2005. Renal clearance of perfluorooctane sulfonate and perfluorooctanoate in humans and their species- specific excretion. Environmental Research, vol. 99, 253-261.
Hoffman, K., T.F. Webster, S.M. Bartell, M.G. Weisskopf, T. Fletcher, and V. Vieira. 2011. Private drinking water wells as a source of exposure to perfluorooctanoic acid (PFOA) in communities surrounding a fluoropolymer production facility. Environmental Health Perspectives, vol. 119, no. 1, 92-97.
Hong, S., J.S. Khim, T. Wang, J.E. Naile, J. Park, B. Kwon, S.J. Song, J. Ryu, G. Codling, P.D. Jones, Y. Lu, and J.P. Giesy. 2014, Bioaccumulation characteristics of perfluoroalkyl acids (PFAAs) in coastal organisms from the west coast of South Korea. Chemosphere, in press.
Houde, M., A.O. De Silva, D.C.G. Muir, and R.J. Letcher. 2011. Monitoring of perfluorinated compounds in aquatic biota: An updated review. Environmental Science and Technology, vol. 45, 7962-7973.
Hurley, S., E. Houtz, D. Goldberg, M. Wang, J-S. Park, D.O. Nelson, P. Reynolds, L. Bernstein, H. Anton-Culver, P. Horn-Ross, and M. Petreas. 2016. Preliminary associations between the detection of perfluoroalkyl acids (PFAAs) in drink-ing water and serum concentrations in a sample of California women. Environmental Science & Technology Letters, vol. 3, no. 7, 264-269.
IARC (International Agency for Research on Cancer). 2016. Monograph 110: Perfluorooctanoic acid, tetrafluoroeth-ylene, dichloromethane, 1,2-dichloropropane, and 1,3-propane sultone. July. Perfluorooctanoic acid. http://mono-graphs.iarc.fr/ENG/Monographs/vol110/mono110- 07.pdf
IDEM (Indiana Department of Environmental Management. 2016. Appendix A. Screening levels. http://www.in.gov/idem/landquality/files/risc_screening_table_2016_explanatory.pdf
IDNR (Iowa Department of Natural Resources). 2016. Statewide standards for contaminants in soil and groundwater. https://programs.iowadnr.gov/riskcalc/pages/standards.aspx
Jahnke, A., U. Berger, R. Ebinghaus, and C. Temme 2007. Latitudinal gradient of airborne polyfluorinated alkyl substances in the marine atmosphere between Germany and South Africa (53° N-33° S). Environmental Science & Technology 41(9):3055-3061.
Groundwater and PFAS: Section 3, Human and Ecological Impacts 3.18
Kannan, K, E. Perrotta, and N. Thomas. 2006. Association between perfluorinated compounds and pathological conditions in southern sea otters. Environmental Science and Technology, vol. 40, no 16.
Kärrman, A., I. Ericson, B. van Bavel, P.O. Darnerud, M. Aune, A. Glynn, S. Lignell, G. Lindstrom, S. Lignell, and G. Lindström. 2007. Exposure of perfluorinated chemicals through lactation: Levels of matched human milk and serum and a temporal trend, 1996–2004, in Sweden. Environmental Health Perspectives, vol. 115, 226–230
Kelly, B.C., M.G. Ikonomou, J.D. Blair, B. Surridge, D. Hoover, R. Grace, and F.A.P.C. Gobas. 2009. Perfluoroalkyl contaminants in an arctic marine food web: Trophic magnification and wildlife exposure. Environmental Sci-ence & Technology, vol. 43, no. 11, 4037-4043.
Kennedy Jr., G.L. 1985. Dermal toxicity of ammonium perfluorooctanoate. Toxicology and Applied Pharmacology, vol. 81, no. 2, 348–355.
Kim S., and K. Kannan. 2007. Perfluorinated acids in air, rain, snow, surface runoff, and lakes: Relative importance of pathways to contamination of urban lakes. Environmental Science & Technology, vol. 41, 8328-8334.
Lasier, P.J., J.W. Washington, S.M. Hassan, and T.M. Jenkins. 2011. Perfluorinated chemicals in surface waters and sed-iments from Northwest Georgia, USA, and their bioaccumulation in Lumbriculus varigatus. Environmental Toxicology and Chemistry, vol. 30, no. 10, 2194-2201.
Lau, C. 2015. Perfluorinated Compounds: An Overview (in) Toxicological Effects of Perfluoroalkyl and Polyfluoroalkyl Substances. James DeWitt, Ed. Humana Press.
Liberty Utilities. 2016. Notice to our Communities: Avondale, Goodyear, Litchfield Park and Maricopa County. Notice in response to EPA drinking water health advisories. https://arizona.libertyutilities.com/goodyear/residential/news/pfos-and-pfoa.html
Lieder, P.H., R.G. York, D.C. Hakes, S. Chang, and J.L. Butenhoff. 2009a. A two-generation oral gavage reproduction study with potassium perfluorobutanesulfonate (K+PFBS) in Sprague Dawley rats. Toxicology, vol. 259, no. 1-2, 33-45.
Lieder, P.H., S. Chang, R.G. York, and J.L. Butenhoff. 2009b. Toxicological evaluation of potassium perfluorobutanesul-fonate in a 90-day oral gavage study with Sprague–Dawley rats. Toxicology, vol. 255, no. 1-2, 45-52.
Looker, C., M.I. Luster, A.M. Calafat, V.J. Johnson, G.R. Burleson, F.G. Burleson, and T. Fletcher. 2014. Influenza vaccine response in adults exposed to perfluorooctanoate and perflouorooctanesulfonate. Toxicological Sciences, vol. 138, no. 1, 76-88.
MA DEP (Massachusetts Department of Environmental Protection). 2016. Perfluorooctane sulfonate (PFOS) & perfluorooctanoic acid (PFOA) information. http://www.mass.gov/eea/agencies/massdep/water/drinking/lead-and-other-contaminants-in- drinking-water.html#16
ME DEH (Maine Division of Environmental Health). 2014. Human health risk-based screening levels for perfluo-roalkyl compounds. June 6. https://www1.maine.gov/dep/ftp/RAGS- Background-Documents/PFC_Screeninig Levels_060514.pdf
ME DEP (Maine Department of Environmental Protection). 2016. MDEP RAGs for sites contaminated with hazardous substances. Effective 2/5/2016. http://www.maine.gov/dep/spills/publications/guidance/rags/ME-RAGS-Revised- Final_020516.pdf
MI DEQ (Michigan Department of Environmental Quality). 2016. Rule 57 Water Quality Values. Surface Water Assess-ment Section. October 21. http://www.michigan.gov/documents/deq/wrd-swas-rule57_372470_7.pdf
MN DOH (Minnesota Department of Health). 2009. East Metro PFC biomonitoring pilot project. July. http://www.health.state.mn.us/divs/hpcd/tracking/biomonitoring/projects/eastmetropfc2008.html
MN DOH (Minnesota Department of Health). 2016. Perfluorochemicals (PFCs) and health. http://www.health.state.mn.us/divs/eh/hazardous/topics/pfcshealth.html
MN DOH (Minnesota Department of Health). 2017. Human Health-Based Water Guidance Table. May 2017. http://www.health.state.mn.us/divs/eh/risk/guidance/gw/table.html
Groundwater and PFAS: Section 3, Human and Ecological Impacts 3.19
Mondal, D., R.H. Weldon, B.G. Armstrong, L.F. Gibson, M-J. Lopez-Espinoza, H-M. Shin, and T. Fletcher. 2014. Breast-feeding: A potential excretion route for mothers and implications for infant exposure to perfluoroalkyl acids. Environmental Health Perspectives, vol. 122, no. 2, 187-192.
Moody, C.A., and J.A. Field. 1999. Determination of perfluorocarboxylates in groundwater impacted by fire-fighting activity. Environmental Science & Technology 33(16):2800-2806.
Moody, C.A., G.N. Hebert, S.H. Strauss, and J.A. Field. 2003. Occurrence and persistence of perfluorooctanesulfonate and other perfluorinated surfactants in groundwater at a fire-training area at Wurtsmith Air Force Base, Michigan, USA. Journal of Environmental Monitoring 5:341-345.
MPCA (Minnesota Pollution Control Agency). 2009. Tier 2 soil reference values (SRVs) for residential/recreational/industrial exposure. June. https://www.pca.state.mn.us/sites/default/files/c-r1-02.xls
Nakayama S., M.J. Strynar, L. Helfant, P. Egeghy, X. Ye, and A.B. Lindstrom. 2007. Perfluorinated compounds in the Cape Fear drainage basin in North Carolina. Environmental Science & Technology, vol. 41, no. 15, 5271-5276.
NAVFAC (Naval Facilities Engineering Command). 2013. Navy case study: Occurrence of two emerging contaminants (PFOA and PFOS) at former NAS South Weymouth, MA. Federal Remediation Technology Roundtable. Fall Meeting, Arlington, VA. November. https://frtr.gov/pdf/meetings/nov13/presentations/barclift-presentation.pdf
NC DENR (North Carolina Department of Environment and Natural Resources). 2013. Appendix #1: Interim maxi-mum allowable concentrations (IMACs). https://ncdenr.s3.amazonaws.com/s3fs-public/documents/files/IMAC%20table_5-22-13.pdf
NC DENR (North Carolina Department of Environment and Natural Resources). 2016. Preliminary Soil Remediation Goals (PSRG) Table. April. https://ncdenr.s3.amazonaws.com/s3fs- public/Waste%20Management/DWM/SF/IHS/guidance/SoilTable%20APRIL%202016%20- Final-1pcb1.pdf
N DEP (Nevada Department of Environmental Protection). 2015. Basic comparison levels. http://ndep.nv.gov/bmi/docs/bcl_calculations_February_2015.pdf
Newsted, J., K. Coady, S. Beach, J. Butenhoff, S. Gallagher, and J. Giesy. 2007. Effects of perfluorooctane sulfonate on mallard and northern bobwhite quail exposed chronically via the diet. Arch Environ Contam Toxicol, vol., 23. 1–9.
Newsted, J., S. Beach, S. Gallagher, and J. Giesy. 2008. Acute and chronic effects of perfluorobutane sulfonate (PFBS) on the mallard and northern bobwhite quail. Environmental Toxicology and Pharmacology, vol. 54, 535-545.
NH DES (New Hampshire Department of Environmental Services). 2016. NHDES welcomes new U.S. EPA health advisory for perfluorooctanoic acid (PFOA) and perfluorooctane sulfonate (PFOS). May 19. http://des.nh.gov/media/pr/2016/20160519-pfoa.htm
NH DHHS (New Hampshire Department of Health and Human Services). 2016. Pease PFC blood testing program: April 2015–October 2015. Pease Tradeport, Portsmouth, NH. June.
NIEHS (National Institute of Environmental Health Sciences). 2016. Perfluorinated chemicals (PFCs). July. https://www.niehs.nih.gov/health/materials/perflourinated_chemicals_508.pdf
NJDEP (New Jersey Department of Environmental Protection). 2007. Guidance for PFOA in Drinking Water at Penns-grove Water Supply Company. http://www.nj.gov/dep/watersupply/pdf/pfoa_dwguidance.pdf
NJDEP (New Jersey Department of Environmental Protection). 2015. Ground Water Quality Standard for Perfluor-ononanoic Acid. CASRN # 375-95-1. October. http://www.nj.gov/dep/wms/bears/docs/pfna_fact_sheet.pdf
NJDOH (New Jersey Department of Health). 2016. Drinking water facts: Perfluorinated chemicals (PFCs) in drinking water. May. https://www.nj.gov/health/ceohs/documents/eohap/generic_pfc_factsheet.pdf
NJDWQI (New Jersey Drinking Water Quality Institute). 2015. Health-based maximum contaminant level support document: Perfluorononanoic acid (PFNA).
NJDWQI (New Jersey Drinking Water Quality Institute). 2016. Health-based maximum contaminant level support document: Perfluorooctanoic acid (PFOA). Health Effects Subcommittee. June 27.
Groundwater and PFAS: Section 3, Human and Ecological Impacts 3.20
NKWD (Northern Kentucky Water District). 2016. Emerging contaminants. http://www.nkywater.org/pdfs/NKWD%20Emerging%20Contaminants%20final.pdf
Norwegian Pollution Control Authority. 2008. Screening of polyfluorinated organic compounds at four fire training facilities in Norway (TA- 2444/2008).
NTP. National Toxicology Program. 2016. Systematic review of immunotoxicity associated with exposure to perfluo-rooctanoic acid (PFOA) or perfluorooctane sulfonate (PFOS). US Department of Health and Human Services. June.
NYS DOH (New York State Department of Health). 2016. Joint statement from NYS DOH and DEC on the EPA’s issuance of lifetime health advisory levels for PFOA and PFOS. May. https://www.health.ny.gov/press/releas-es/2016/2016-05-19_joint_statement.htm
Ohmori, K., N. Kudo, K. Katayama, and Y. Kawashima. 2003. Comparison of the toxicokinetics between perfluorocar-boxylic acids with different carbon chain length. Toxicology 184, 135-40.
Olsen G.W., H.Y. Huang, K.J. Helzlsouer, K.J. Hansen, J.L. Butenhoff, and J.H. Mandel. 2005. Historical comparison of perflouorooctanesulfonate, perfluorooctanoate, and other fluorochemical in human blood. Environmental Health Perspectives, vol. 113, no. 5, 539- 545.
Olsen G.W., D.C. Mair, W.K. Reagan, M.E. Ellefson, J.L. Butenhoff, and L.R. Zobel. 2007. Preliminary evidence of a decline in perflouorooctanesulfonate (PFOS) and perfluorooctanoate (PFOA) concentrations in American Red Cross blood donors. Chemosphere, vol. 68, no. 1, 105-111.
Olsen G.W., D.C. Mair, T.R. Church, M.E. Ellefson, W.K. Reagen, T.M. Boyd, R.M Herron, Z. Medhdizadehkashi, J.B. Nobiletti, J.A. Rios, J.L. Butenhoff, and L.R. Zobel. 2008. Decline in perfluorooctanesulfonate and other polyflu-oroalkyl chemicals in American Red Cross adult blood donors, 2000-2006. Environmental Science & Technology, vol. 42, no. 13, 4989-4995.
Olsen G.W., C.C. Lange, M.E. Ellefson, D.C. Mair, T.R Church, C.L. Goldberg, R.M Herron, Z. Medhdizadehkashi, J.B. Nobiletti, J.A. Rios, W.K. Reagen, and L.R. Zobel. 2012. Temporal trends of perfluoroalkyl concentrations in American Red Cross adult blood donors, 2000- 2010. Environmental Science & Technology, vol. 46, no. 11, 6330-6338.
O’Malley, K.D., and K.L. Ebbins. 1981. Repeat application 28-day percutaneous absorption study with T-2618CoC in albino rabbits. Riker Laboratories, St. Paul, MN. U.S. Environmental Protection Agency Administrative Record 226-0446 (as cited in USEPA 2016b).
OECD (Organization for Economic Co-operation and Development). 2002. Co-operation on existing chemicals. Hazard assessment of perfluorooctane sulfonate (PFOS) and its salts. OECD.
Peden-Adams, M.M., J.E. Stuckey, K.M. Gaworecki, J. Berger-Ritchie, K. Bryant, P.G. Jodice, T.R. Scott, J.B. Ferrario, B. Guan, C. Vigo, J.S. Boone, W.D. McGuinn, J.C. Dewitt, and D.E. Keil. 2012. Developmental toxicity in white leghorn chickens following in ovo exposure to perfluorooctane sulfonate (PFOS). Reproductive Toxicity, vol. 27, 2009, 307-318.
Sepulvado, J.G., A.C. Blaine, L.S. Hundal, and C.P. Higgins. 2011. Occurrence and fate of perfluorochemicals in soil following the land application of municipal biosolids. Environmental Science & Technology, vol. 45, no. 19, 8106-8112.
Shoeib, M.T., T. Harner, B.H. Wilford, K.C. Jones, and J. Zhu. 2006. Perfluorinated chemicals in the arctic atmosphere. Environmental Science & Technology, vol. 40, 7577–7583.
Simcik M.F., and K.J. Dorweiler. 2005. Ratio of perfluorochemical concentrations as a tracer of atmospheric deposi-tion to surface waters. Environmental Science & Technology, vol. 39,
Sinclair, E., and K. Kannan. 2006. Mass loading and fate of perfluoroalkyl surfactants in wastewater treatment plants. Environmental Science & Technology, vol. 40, no. 5, 1408-1414.
Sinclair, E., D.T. Mayack, K.J. Roblee, N. Yamashita, and K. Kannan. 2006. Occurrence of perfluoroalkyl surfactants in water, fish, and birds from New York State. Archives of Environmental Contamination and Toxicology, vol. 50, 398-410.
Stahl, L., B. Snyder, T. Olsen, T. Kincaid, J. Wathen, and H. McCarty. 2014. Perfluorinated compounds in fish from U.S. urban rivers and the Great Lakes. Science of the Total Environment, vol. 499, 185-195.
Groundwater and PFAS: Section 3, Human and Ecological Impacts 3.21
Strynar, M.J., and A.B. Lindstrom. 2008. Perfluorinated compounds in house dust from Ohio and North Carolina, USA. Environmental Science & Technology 42:3751-3756.
Tatum-Gibbs, K., J.F. Wambaugh, K.P. Das, R.D. Zehr, M.J. Strynar, A.B. Lindstrom, A. Delinsky, and C. Lau. 2011. Comparative pharmacokinetics of perfluorononanoic acid in rat and mouse. Toxicology 281, 48−55.
TRRP (Texas Risk Reduction Program. 2016. Tables accompanying the Texas Risk Reduction Program (TRRP) rule. March. https://www.tceq.texas.gov/assets/public/remediation/trrp/pcls.pdf
Trudel, D., L. Horowitz, M. Wormuth, M. Scheringer, I. Cousins, and K. Hungerb. 2008. Estimating consumer exposure to PFOS and PFOA. Risk Analysis, vol. 28, no. 2, 251-268.
UNEP. UN Persistent Organic Pollutants Review Committee, Eleventh Meeting. 2015. Proposal to list pentadecafluo-rooctanoic acid (CAS No: 335-67-1, PFOA, perfluorooctanoic acid), its salts and PFOA-related compounds in Annexes A, B and/or C to the Stockholm Convention on Persistent Organic Pollutants. Stockholm.
US DHHS (United States Department of Health and Human Services). 2016. Systematic review of immunotoxicity associated with exposure to perfluorooctanoic acid (PFOA) of perfluorooctane sulfonate (PFOS). Washington, D.C.: U.S. Department of Health and Human Services, National Toxicology Program.
USEPA (United States Environmental Protection Agency). 1989. Risk assessment guidance for superfund. Vol. 1 Human health evaluation manual (Part A). EPA/540/1-898/002. December.
USEPA (United States Environmental Protection Agency). 2000. Methodology for deriving ambient water qual-ity criteria for the protection of human health. EPA-822-B-00-004. U.S. Environmental Protection Agency, Office of Water, Office of Science and Technology, Washington, DC. http://www.nj.gov/drbc/library/documents/EPA_human-health- criteria2000.pdf
USEPA (United States Environmental Protection Agency). 2008. Quarterly MOU status report #10: Phase II monitoring/sampling work plan, DuPont Washington Works (PFOA site-related environmental assessment program), text, tables 4.1 through 5.10. U.S. Environmental Protection Agency. EPA-HQ-OPPT-2004-0113-0430. http://www.regulations.gov/fdmspublic/component/main?main=DocketDetail&d=EPA-HQ- OPPT-20040113. May 18, 2009
USEPA (United States Environmental Protection Agency). 2009. Provisional health advisories for perfluorooctanoic acid (PFOA) and perfluorooctane sulfonate (PFOS). Office of Water. Washington, D.C. January 8. https://www.epa.gov/sites/production/files/2015- 09/documents/pfoa-pfos-provisional.pdf
USEPA (United States Environmental Protection Agency). 2011. Fact Sheet: Perfluorochemical (PFC) Contamination of Biosolids near Decatur, Alabama.
USEPA (United States Environmental Protection Agency). 2012a. The Third Unregulated Contaminant Monitoring Rule (UCMR 3). https://www.epa.gov/sites/production/files/2015- 10/documents/ucmr3_factsheet_general.pdf
USEPA (United States Environmental Protection Agency) 2014b. Provisional peer-reviewed toxicity values for per-fluorobutane sulfonate (CASRN 375-73-5) and related compound potassium perfluorobutane sulfonate (CASRN 29420-49-3). Superfund Health Risk Technical Support Center. National Center for Environmental Assessment. Office of Research and Development. July 17. https://hhpprtv.ornl.gov/issue_papers/PerfluorobutaneSulfonate.pdf
USEPA (United States Environmental Protection Agency). 2016a. UCMR3 (2013–2015) Occurrence data by method classification. July 2016. Zipped database https://www.epa.gov/dwucmr/occurrence-data-unregulated- contaminant-monitoring-rule
Groundwater and PFAS: Section 3, Human and Ecological Impacts 3.22
USEPA (United States Environmental Protection Agency). 2016b. Assessing and managing chemicals under TSCA. Fact Sheet: 2010/2015 PFOA Stewardship Program. Updated May 16. https://www.epa.gov/assessing-and-managing- chemicals-under-tsca/fact-sheet- 20102015-pfoa-stewardship-program
USEPA (United States Environmental Protection Agency). 2016c. Drinking water health advisory for perfluo-rooctanoic acid (PFOA). Office of Water. EPA 822-R-16-005. May.
USEPA (United States Environmental Protection Agency). 2016d. Drinking water health advisory for perfluorooctane sulfonate (PFOS). Office of Water. EPA 822-R-16-004. May.
USEPA (United States Environmental Protection Agency). 2016e. Health effects support document for perfluorooc-tanoic acid (PFOA). Office of Water. EPA 822-R-16-003. May.
USEPA (United States Environmental Protection Agency). 2016f. Health effects support document for perfluorooc-tane sulfonate (PFOS). Office of Water. EPA 822-R-16-002. May.
USEPA (United States Environmental Protection Agency). 2017. The third unregulated contaminant monitoring rule (UCMR3): Data summary, January 2017. https://www.epa.gov/dwucmr/data-summary-third-unregulated-contami-nant-monitoring-rule
Velez, M.P., T.E. Arbuckle, and W.D. Fraser. 2015. Maternal exposure to perfluorinated chemicals and reduced fecundity: The MIREC study. Human Reproduction, vol. 0, no. 0, 1-9.
Venkatesan, A.K., and R.U. Halden. 2013. National inventory of perfluoroalkyl substances in archived U.S. biosolids from the 2001 EPA national sewage sludge survey. Journal of Hazardous Materials, vol. 252–253, 413–418.
Verner, M-A., A.E. Loccisano, N-H. Morken, M. Yoon, H. Wu, R. McDougall, M. Maisonet, M. Marcus, R. Kishi, C. Miyashita, M-H. Chen, W-S. Hsieh, M.E. Andersen, H.J. Clewell III, and M.P. Longnecker. 2015. Associations of perfluoroalkyl sub-stances (PFAS) with lower birth weight: An evaluation of potential confounding by glomerular filtration rate using a physiologically based pharmacokinetic model (PBPK). Environmental Health Perspectives, vol. 123, no. 12, 1317-1324.
Vestergren R., and I.T. Cousins. 2009. Tracking the pathways of human exposure to perfluorocarboxylates. Environ-mental Science & Technology, vol. 43, 5565–5575.
VT ANR DOH (Vermont Agency of Natural Resources Department of Health). 2016. Facts about PFOA for concerned residents. April 11. http://healthvermont.gov/enviro/pfoa/PFOA_health_facts.pdf
VT DOH (Vermont Department of Health). 2016. Memorandum: perfluorooctanoic acid (PFOA) and perfluorooc-tanesulfonic acid (PFOS). Vermont drinking water health advisory.
Walters, A., and D. Santillo. 2006. Uses of perfluorinated substances. GRL-TN-06-2006. Greenpeace research laborato-ries technical note 06/2006. http://www.greenpeace.to/publications/uses-of-perfluorinated-chemicals.pdf
Washington, J.W., J. Ellington, H. Yoo, and T.M. Jenkins. 2009. Results of the analyses of surface soil samples from near Decatur, AL, for fluorinated organic compounds. Prepared for USEPA. https://archive.epa.gov/pesticides/region4/water/documents/web/pdf/final_report_results_7_1 3_09.pdf
Wolf, C.J., R.D. Zehr, J.E. Schmid, C. Lau, and B.D. Abbott. 2010. Developmental effects of perfluorononanoic acid in the mouse are dependent on peroxisome proliferator-activated receptor-alpha. PPAR Research, vol. 2010, ID. 282896, 1-11.
WV DHHR (West Virginia Department of Health and Human Resources). 2016. Perfluorinated compounds drinking water health advisory. Bureau of Public Health. http://www.wvdhhr.org/oehs/documents/bph_pfoa%20pfos_fl.pdf
Yoo, H., J.W. Washington, T.M. Jenkins, and E.L. Libelo. 2009. Analysis of perfluorinated chemicals in sludge: Method development and initial results. Journal of Chromatography, vol. 1216, 7831–7839.
Yoo, H., J.W. Washington, T.M. Jenkins, and J.J. Ellington. 2011. Quantitative determination of perfluorochemicals and fluorotelomer alcohols in plants from biosolid-amended fields using LC/MS/MS and GC/MS. Environmental Science & Technology, vol. 45, no. 19, 7985-7990.
Groundwater and PFAS: Section 3, Human and Ecological Impacts 3.23