STATE OF ILLINOIS ADLAI E. STEVENSON, Governor DEPARTMENT OF REGISTRATION AND EDUCATION NOBLE J. PUFFER, Director DD7ISION OF THE STATE WATER SURVEY A. M. BUSWELL, Chief URBANA BULLETIN NO. 39 GROUNDWATER IN THE PEORIA REGION PART 1—GEOLOGY LELAND HORBERG, STATE GEOLOGICAL SURVEY PART 2—HYDROLOGY MAX SUTER, STATE WATER SURVEY PART 3—CHEMISTRY T. E. LARSON, STATE WATER SURVEY A Cooperative Research Project Conducted by The State Water Survey and The State Geological Survey PRINTED BY AUTHORITY OF THE STATE OF ILLINOIS URBANA, ILLINOIS 1950
Transcript
STATE OF ILLINOIS ADLAI E. STEVENSON, Governor
DEPARTMENT OF REGISTRATION AND EDUCATION NOBLE J. PUFFER, Director
DD7ISION OF THE
S T A T E W A T E R S U R V E Y A. M. BUSWELL, Chief
URBANA
BULLETIN NO. 39
GROUNDWATER IN THE PEORIA REGION
PART 1—GEOLOGY LELAND HORBERG, STATE GEOLOGICAL SURVEY
PART 2—HYDROLOGY MAX SUTER, STATE WATER SURVEY
PART 3—CHEMISTRY T. E. LARSON, STATE WATER SURVEY
A Cooperative Research Project Conducted by The State Water Survey and
The State Geological Survey
PRINTED BY AUTHORITY OF THE STATE OF ILLINOIS
URBANA, ILLINOIS
1950
This report is also a publication of T H E STATE GEOLOGICAL SURVEY
as its BULLETIN N O . 75.
STATE OF ILLINOIS ADLAI E. STEVENSON, Governor
DEPARTMENT OF REGISTRATION AND EDUCATION NOBLE J. PUFFER, Director
DIVISION OF THE
S T A T E W A T E R S U R V E Y A. M. BUSWELL, Chief
URBANA
B U L L E T I N N O . 3 9
GROUNDWATER IN THE PEORIA REGION
PART 1—GEOLOGY LELAND HORBERG, STATE GEOLOGICAL SURVEY
PART 2—HYDROLOGY MAX SUTER, STATE WATER SURVEY
PART 3—CHEMISTRY T. E. LARSON, STATE WATER SURVEY
A Cooperative Research Project Conducted by The State Water Survey and
The State Geological Survey
PRINTED BY AUTHORITY OF THE STATE OF ILLINOIS
URBANA, ILLINOIS
1950
ORGANIZATION
STATE OF ILLINOIS HON. ADLAI E. STEVENSON, Governor
DEPARTMENT OF REGISTRATION AND EDUCATION HON. NOBLE J. PUFFER, Director
BOARD OF NATURAL RESOURCES AND CONSERVATION HON. NOBLE J. PUFFER, Chairman W. H. NEWHOUSE, P H . D . , Geology ROGER ADAMS, P H . D . , D . S C , Chemistry LOUIS R. HOWSON, C.E., Engineering A. E. EMERSON, P H . D . , Biology LEWIS H. TIFFANY, P H . D . , Forestry GEORGE D. STODDARD, P H . D . , L I T T .D. , LL.D., L.H.D.
President of the University of Illinois
WATER SURVEY DIVISION A. M. BUSWELL, P H . D . , Chief
SCIENTIFIC AND TECHNICAL STAFF OF THE
STATE WATER SURVEY DIVISION 60 Noyes Laboratory
Box 232, Urbana
A. M. BUSWELL, P H . D . , Chief
ENGINEERING HERBERT E. HUDSON, JR . , B.S., Engineer and Head W INFRED D. GERBER, B.S., C.E., Engineer Emeritus
Ground Water Hydrology HARMON F. SMITH, B.S., Associate Engineer FRANCIS X. BUSHMAN, B.S., Assistant Engineer GEORGE E. NEHER , B.S., Engineering Assistant
Surface Water Hydrology WYNDHAM J. ROBERTS, M.S., Associate Engineer JACK BRUIN , B.S., Engineering Assistant
Reservoir Sedimentation JOHN B. STALL, B.S., Assistant Engineer
Meteorology GLENN E. STOUT, B.S., Supervisory and Assistant
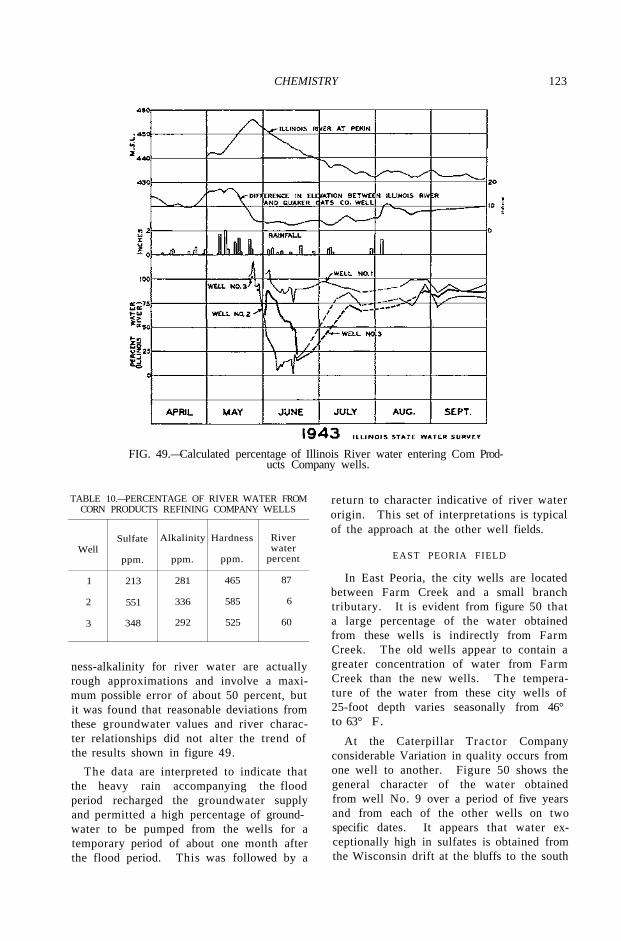
Scientist FLOYD A. HU F F , B.S., Assistant Professional Scientist GERALD W. FARNSWORTH, B.S., Engineering Assistant KENNETH A. FAULK, Radar Operator JAMES A. WEST , Radar Operator
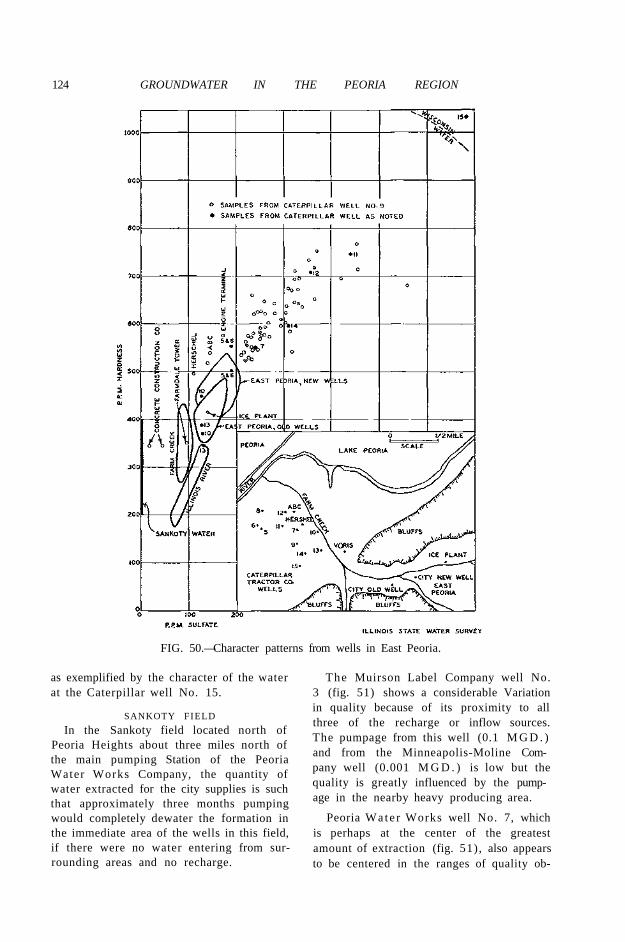
Municipal Ground Water Survey Ross HANSON, B.S., Associate Engineer JULIUS L. GEILS, B.S., Associate Engineer
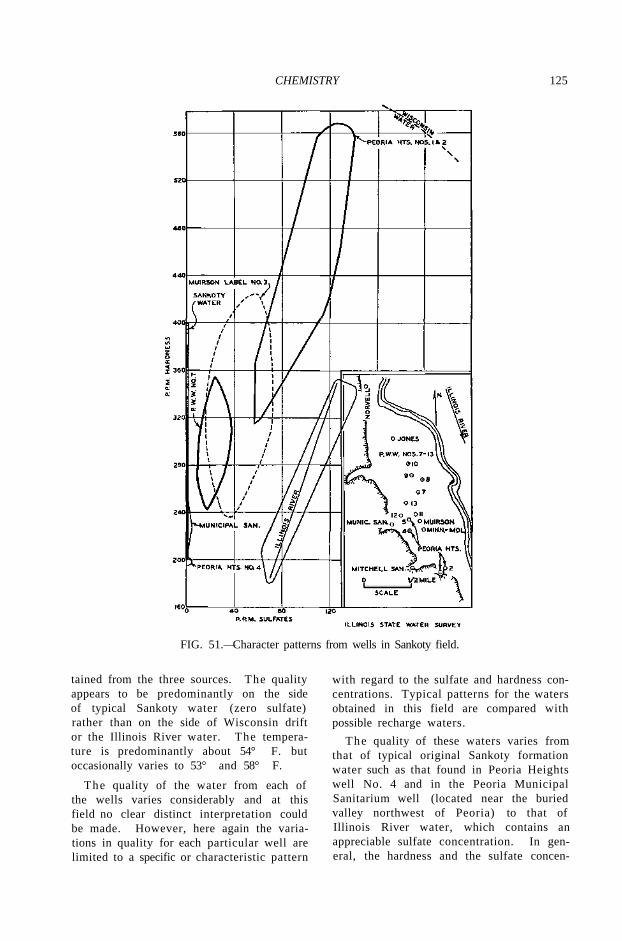
ENGINEERING RESEARCH MA X SUTER, P H . D . , Engineer and Head CARL C. CHAMBERLAIN, Assistant Engineer VIRGINIA WISEGARVER, B.S., Engineering Assistant
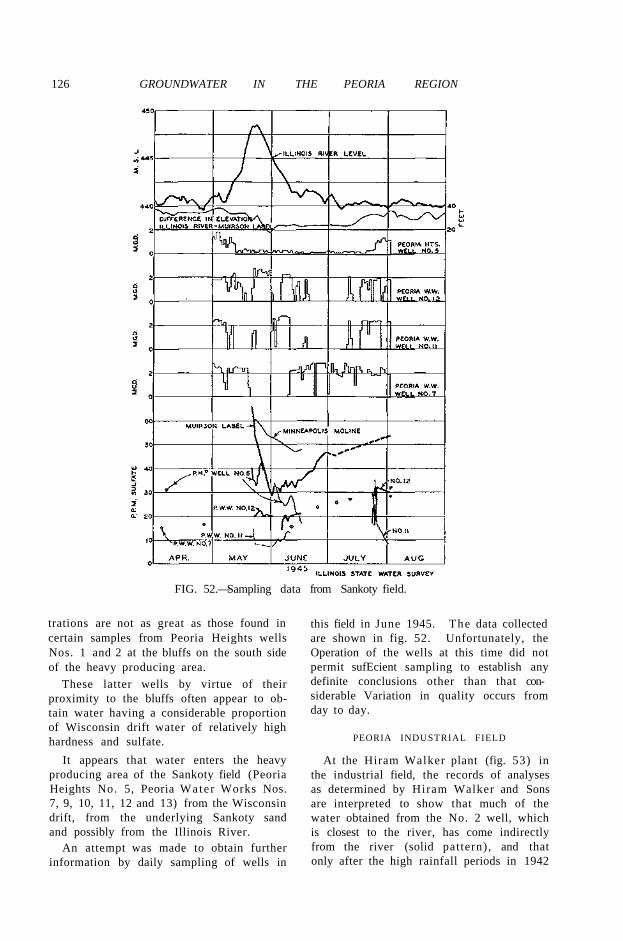
Peoria Region and Laboratory ADOLPH R. KNODEL, B.S., Field Engineer ORVILLE W. VOGEL, B.S., Assistant Chemist ROBERT D. MAHAN, M.S., Assistant Engineer
Chicago-Foliet Region JOHN B. M ILLIS, Field Engineer JACOB S. RANDALL, B.S., Field Engineer HAROLD E. BEMENT, Engineering Assistant
East St. Louis Region EU G E N E G. JONES, B.S., Field Engineer
CHEMISTRY T. E. LARSON, P H . D . , Chemist and Head
Boiler Water Control RUSSELL W. LANE, M.S., Chemist
Corrosion Research ROBERT M. K ING , B.S., Assistant Chemist
Analytical Chemistry WILMA L. PRINTY, B.S., Assistant Chemist ARTHUR H. BODENSCHATZ, B.S., Assistant Chemist
CHEMICAL R E S E A R C H
Bacteriology (In Cooperation with Chemistry Department, University of Illinois)
HENRY F. MUELLER, B.S., Special Research Assistant ARTHUR T. YAHIRO, B.S., Special Research Assistant
Supersonics (In Cooperation with Food Technology Department, University of Illinois)
LILLIAN RUSSELL, M.S., Special Research Assistant
Organic Contaminant Detection in Water (In Cooperation with U.S. Public Health Service)
WALTER F. CLAUSSEN, P H .D . , Research Assistant Professor
ROBERT L. BOHON, M.S., Special Research Assistant DAYLE CLARK, Special Research Assistant RUTH EVANS, M.S., Special Research Assistant JEAN D. FORTNEY, B.S., Special Research Assistant MARY A. SCHERI, M.S., Special Research Assistant
Nitrification Studies (In Cooperation with U.S. Public Health Service)
M. IRENE VAN METER , M.S., Research Instructor JOHN GERKE , M.S., Special Research Assistant TETSUO SHIOTA, M.S., Special Research Assistant
Consultant: Radar, WILLIAM G. ALBRIGHT, M.S., University of
Illinois
FOREWORD
This publication is the outgrowth of investigations of the groundwater re-sources of the Peoria area by the State Water Survey and the State Geological Sur-vey. Considerable study has been given the water supplies at Peoria for many years, but detailed studies were begun in 1940 when some industries noticed a loss in yield of their wells. This report presents the findings from these studies to Janu-ary 1, 1946. Studies are continuing, and it is hoped that, with the help of the hydraulic laboratory under construction at Peoria, these will lead to further clarification of problems of the Peoria area.
The geological and geophysical studies have been made by the State Geological Survey, and the hydrologic and chemical studies have been made by the State Water Survey. Both organizations are grateful for the keen interest and excellent Cooperation and assistance of the well owners, drillers, public officials, and many others of the Peoria region who have facilitated this work.
A number of important facts about the groundwater resources of Peoria from a geologic, hydrologic, and chemical viewpoint are presented in the following pages. These include an improved geologic picture; a demonstration of the com-plexity of interrelations of natural recharge, inflow into the pumping area, and influence of floods; and new chemical data on the variations in composition of ground and surface waters. Overpumpage is shown to be the cause of the local water shortage and the water-level recession.
Local interest is focused on possible remedial measures to supply sufficient water for the public and industrial needs at Peoria. The economic and legal aspects of any such measures will be of great importance, but as is demonstrated by the accompanying studies, the water resources available to Peoria as a Community are vast, and several alternate Solutions are available for consideration:
1. Use of river water. 2. Injection of river water to recharge overpumped groundwater aquifers. 3. Development of the extensive gravels of the buried Valleys outside the
present overpumped area.
It is hoped that this report will contribute materially to a better understanding of the nature of the water problems of the Peoria area and to their Solution. A study of this type develops new concepts that will be broadly applicable to many Illinois groundwater problems and therefore may be of value in many other areas.
Chapter 2—Types of Aquifers 16 Classification 16 Occurrence of groundwater 16
Chapter 3—Bedrock Formations and Their Groundwater Conditions 17 Regional relations 17 Mineral content of groundwaters 17 Pre-St. Peter formations 18 St. Peter and younger Ordovician formations 20
St. Peter sandstone 20 Galena-Platteville dolomite 20 Maquoketa shale 23
Silurian System 23 Devonian System 23 Devonian-Mississippian Systems 23
PLATE 1. Bedrock surface in the Peoria region In pocket 2. Areal geology of the Peoria region In pocket 3. Cross-section of glacial deposits in the Peoria region In pocket 4. Locations of Observation wells In pocket
FIGURE PAGE 1. Index map showing location of the Peoria region and the boundary of the "Coal Meas
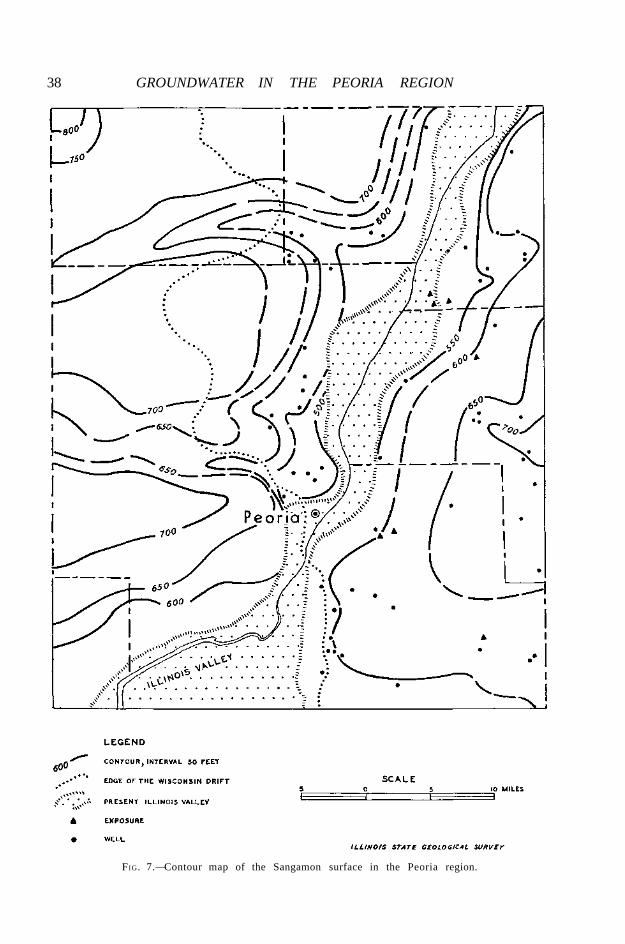
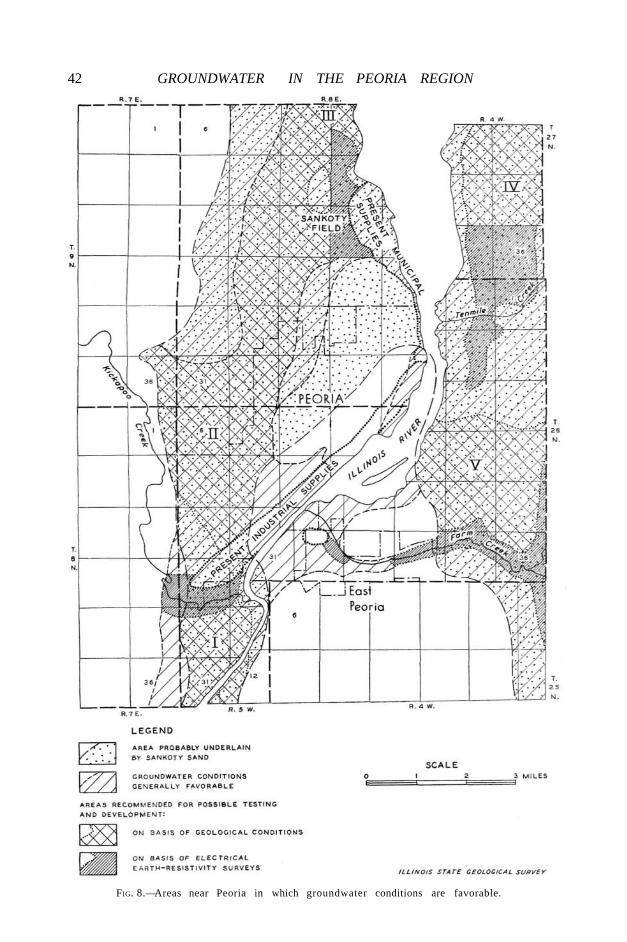
ures" strata 13 2. Generalized geologic column of bedrock formations above the Lower Ordovician 19 3. Structure map of top of the Devonian limestone in the Peoria region 21 4. Graphic logs of some deep wells in the Peoria region 22 5. Generalized geologic column of the glacial deposits in the Peoria region 30 6. Groundwater conditions in the Peoria region 32 7. Contour map of the Sangamon surface in the Peoria region 38 8. Areas near Peoria in which groundwater conditions are favorable 42 9. Bedrock surface near Peoria 43
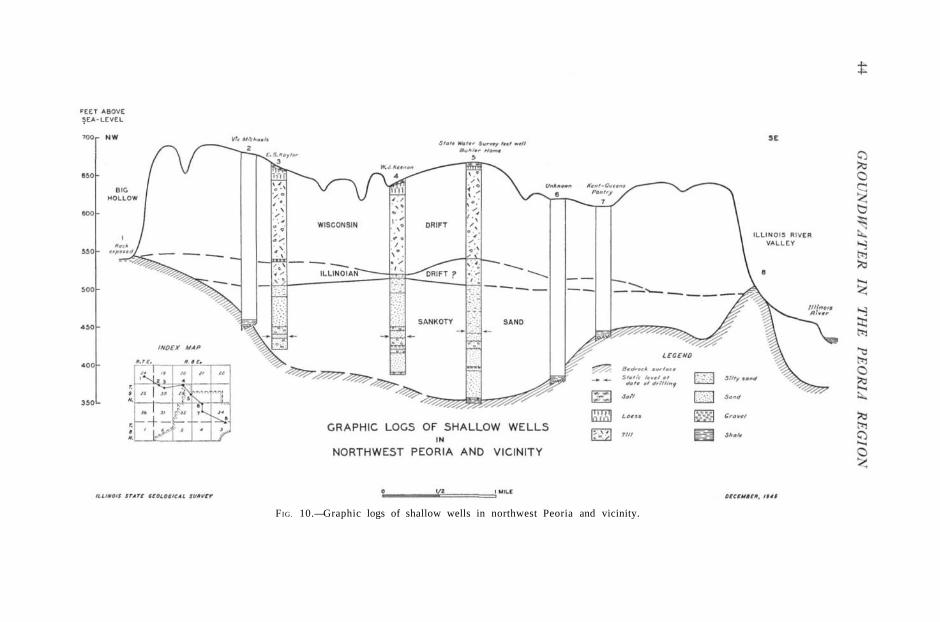
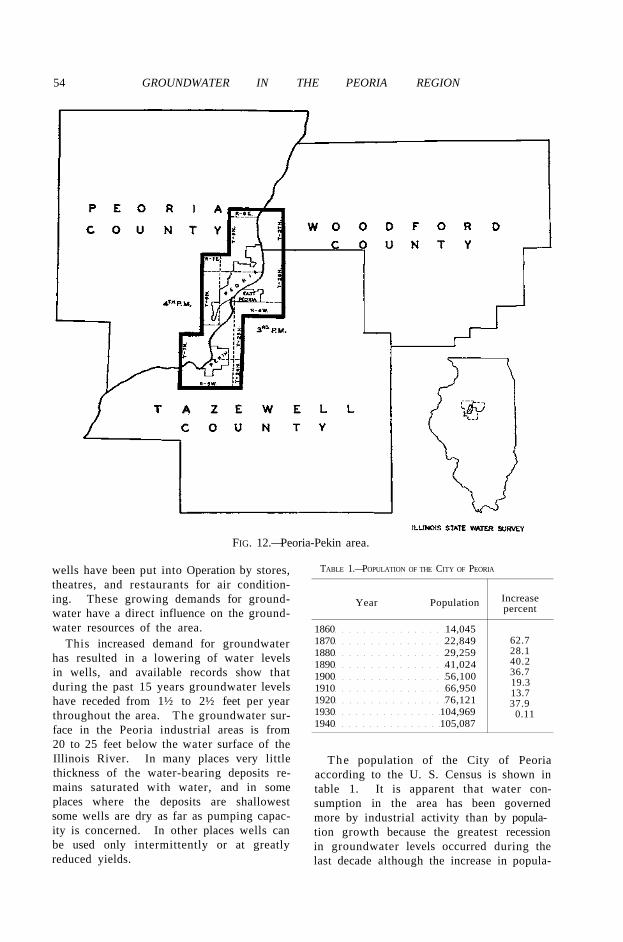
10. Graphic logs of shallow wells in northwest Peoria and vicinity 44 11. Areas covered by electrical earth-resistivity surveys in the Peoria region 46 12. Peoria-Pekin area 54 13. Well fields in Peoria-Pekin area 59
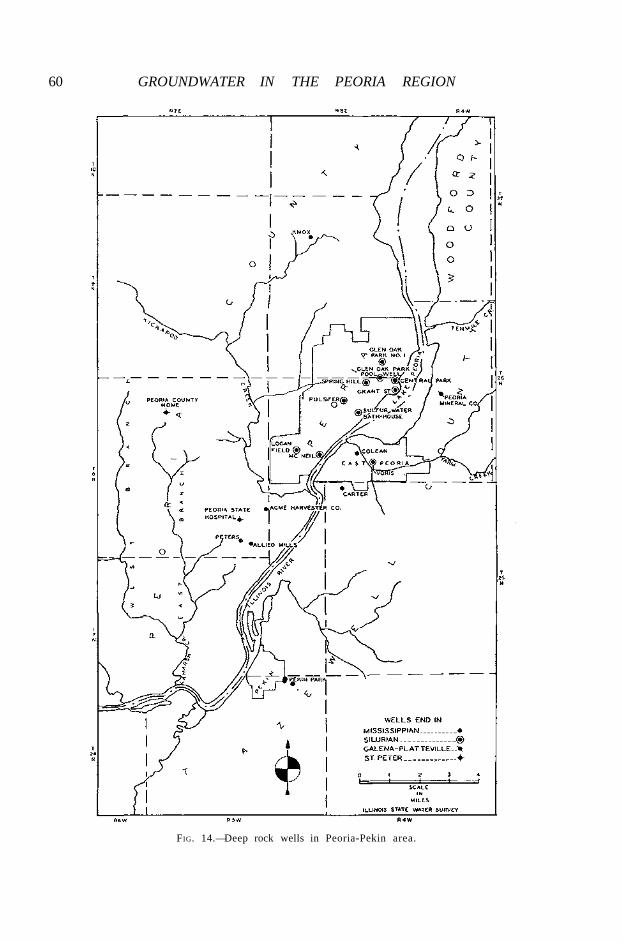
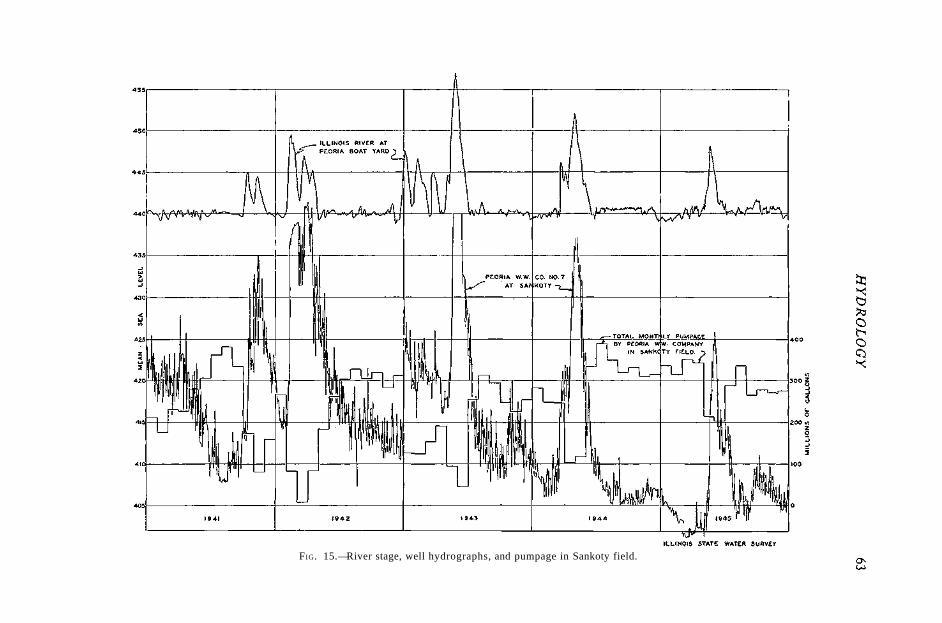
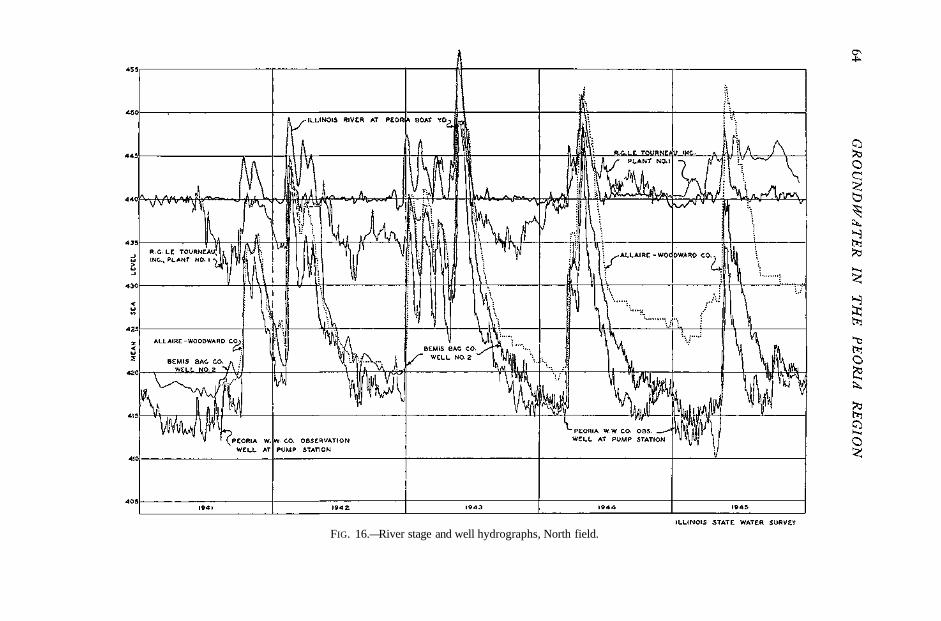
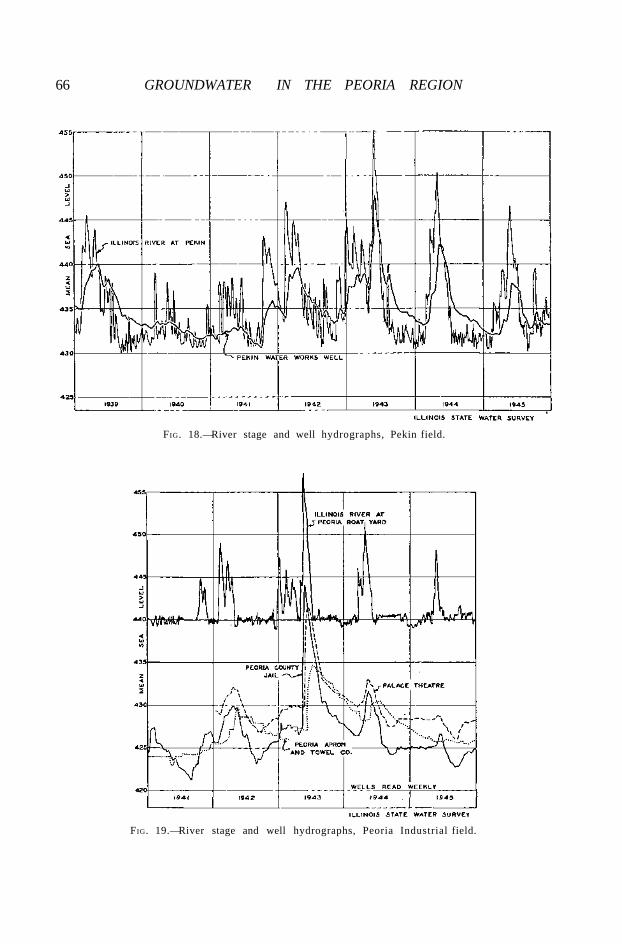
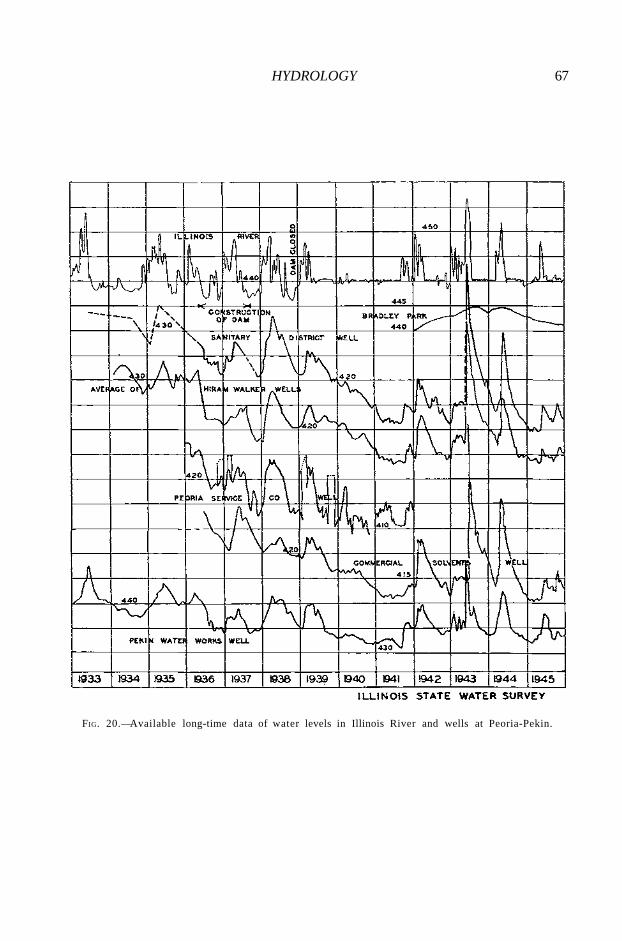
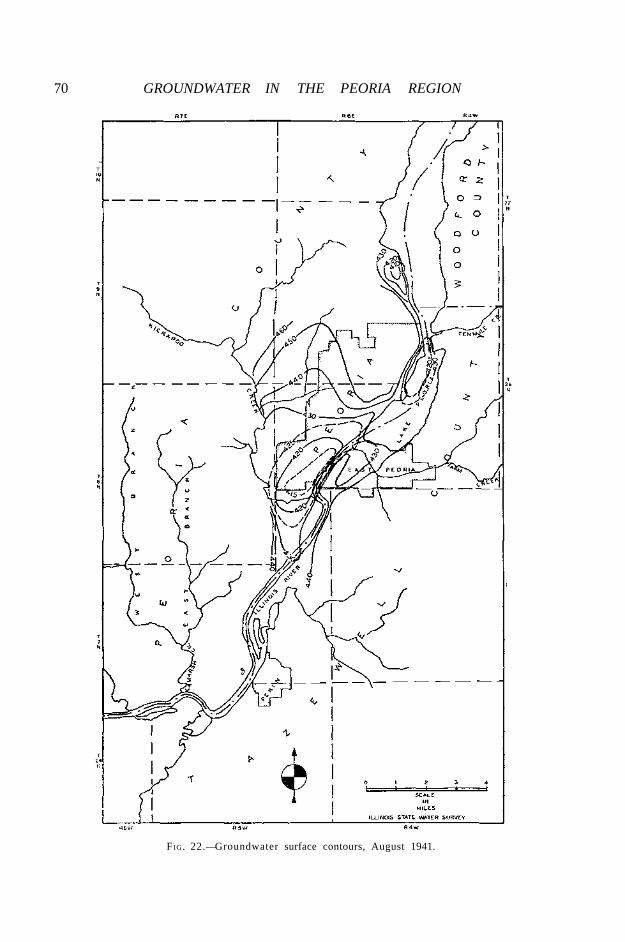
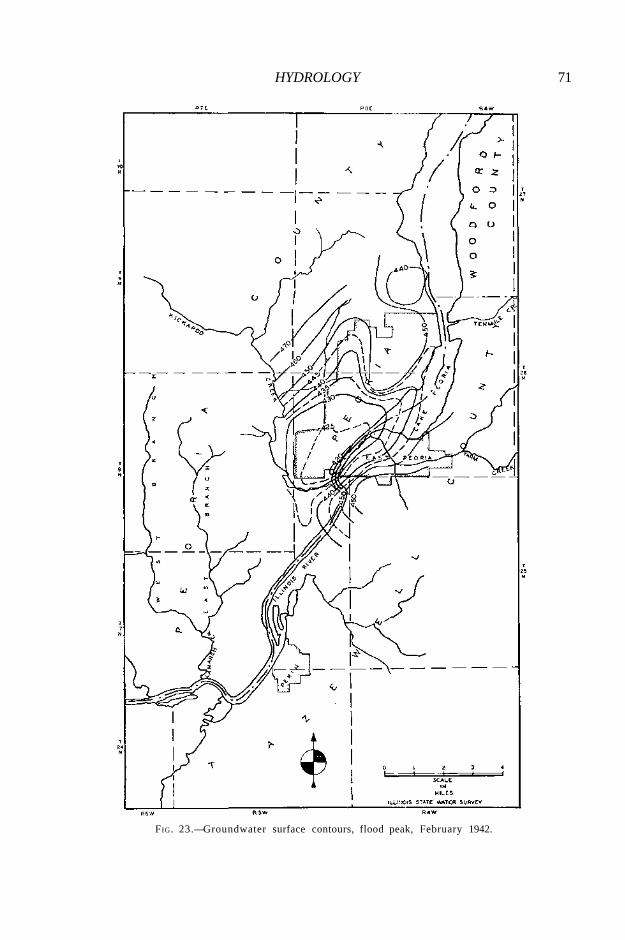
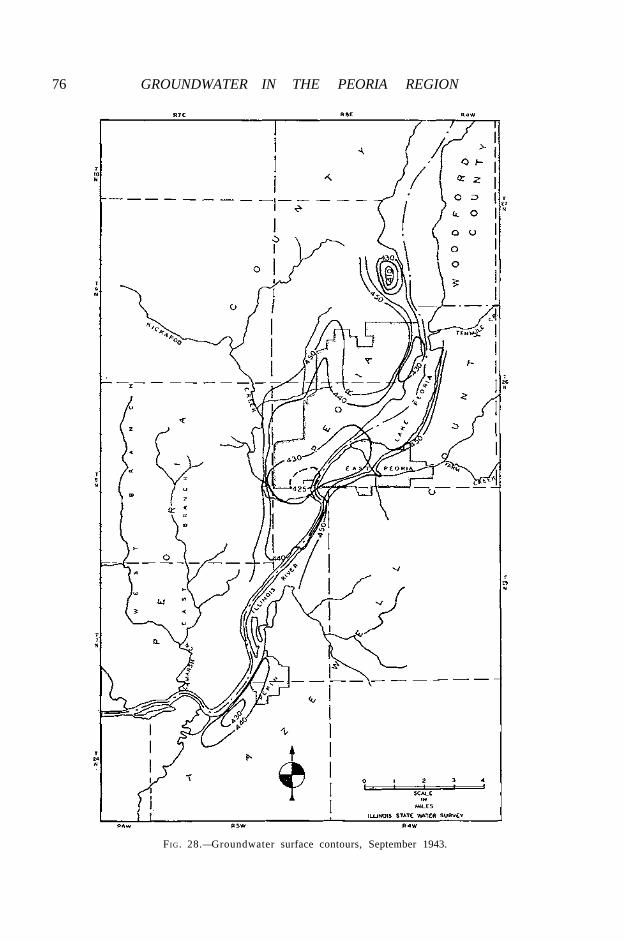
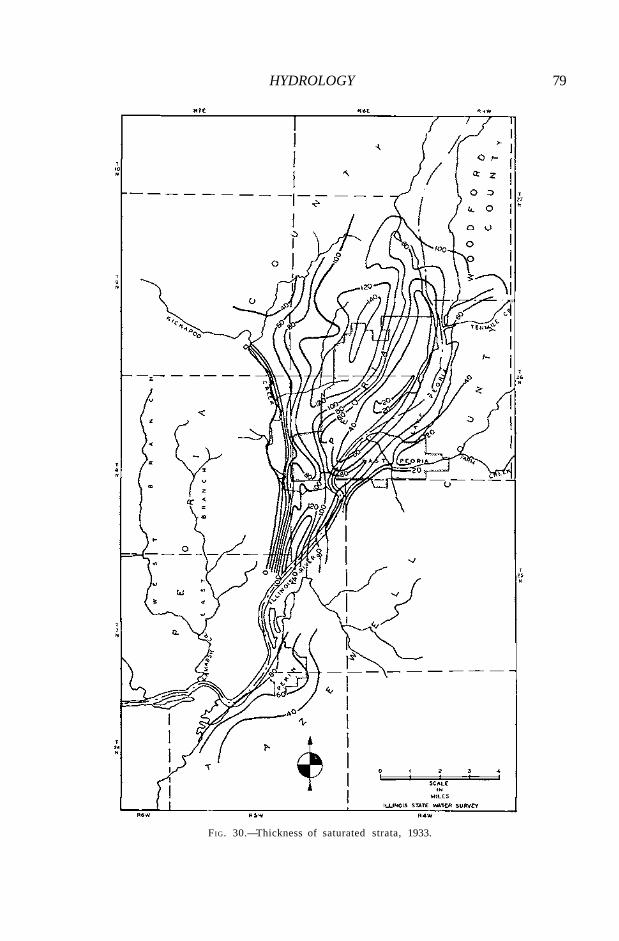
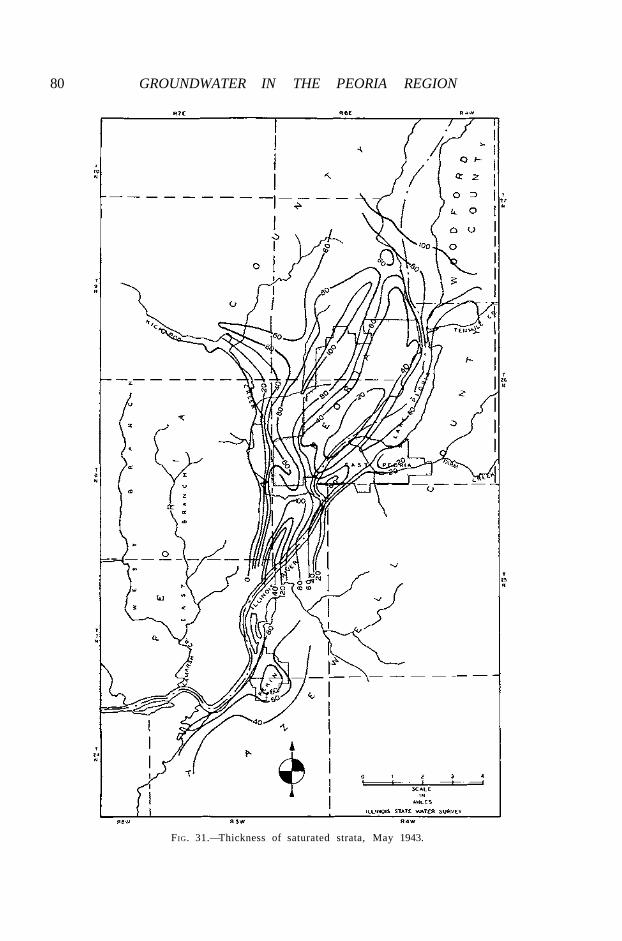
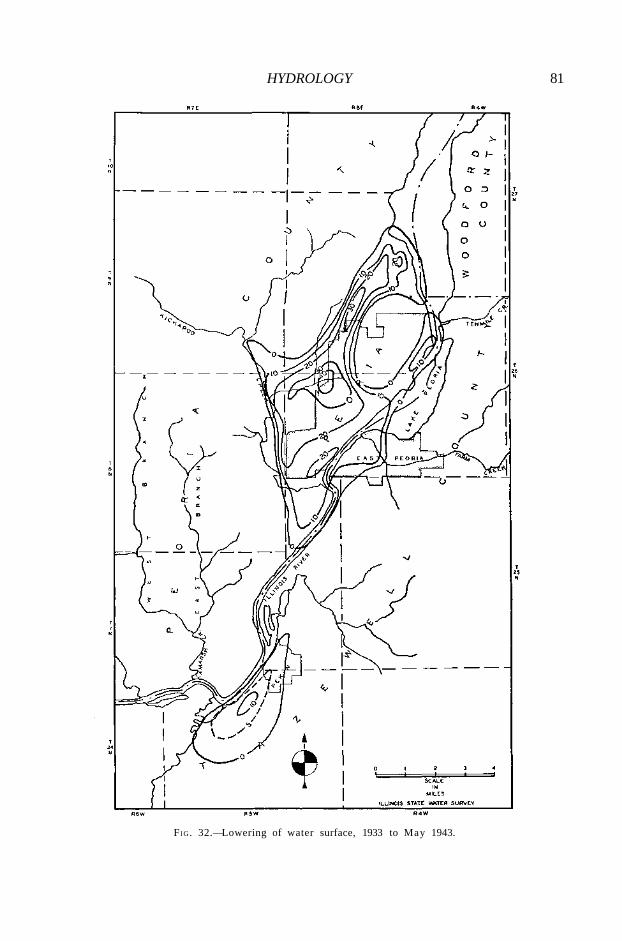
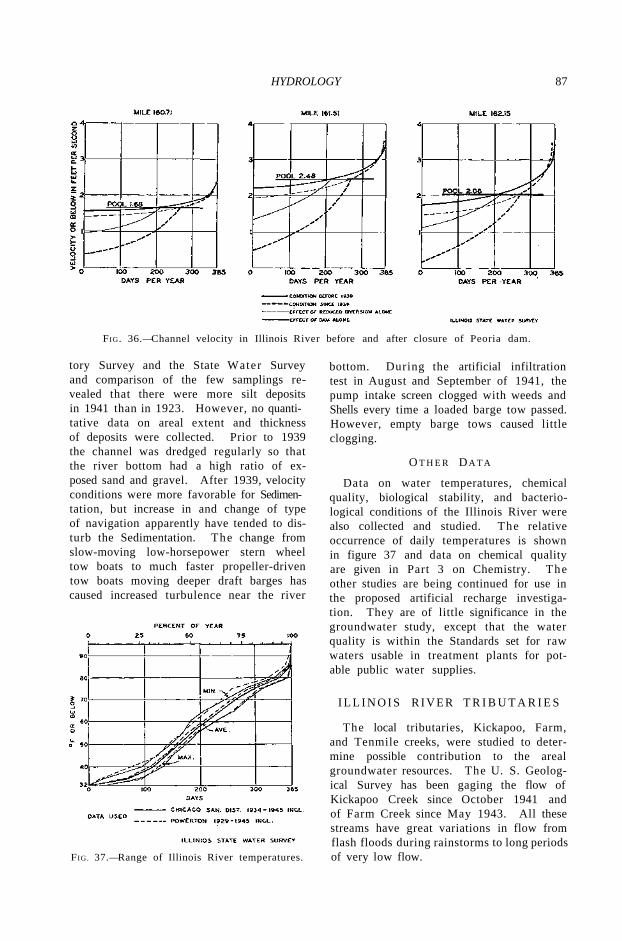
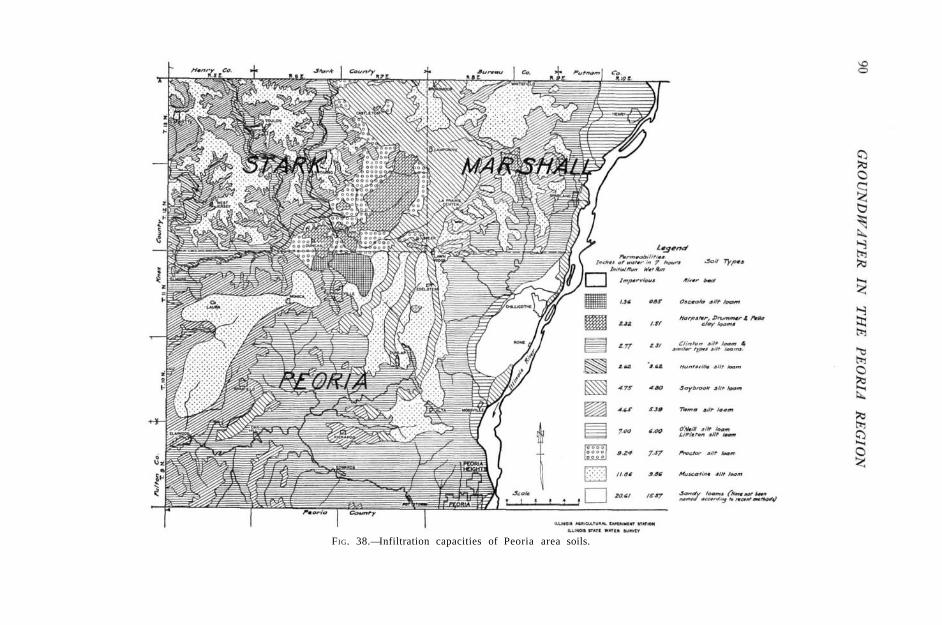
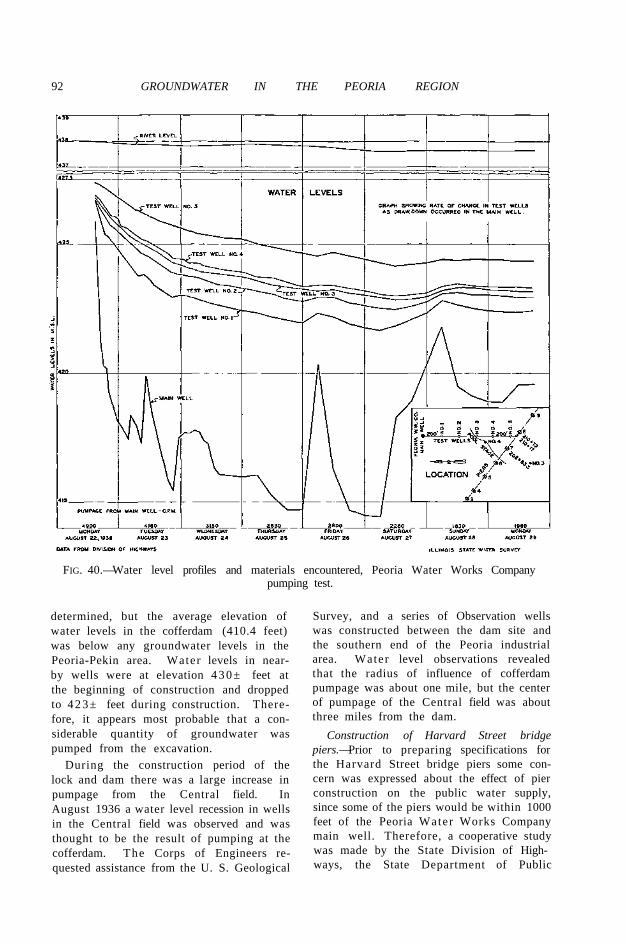
FIGURE PAGE 14. Deep rock wells in area 60 15. River stage, well hydrographs and pumpage in Sankoty field. . . . . . . . . . . . . . . . . . . . . . . . . 63 16. River stage and well hydrographs, North field. . . . . . . . . . . . . . . . . . . . . . . . . . . . . . . . . . . . . . 64 17. River stage and well hydrographs, East Peoria field. . . . . . . . . . . . . . . . . . . . . . . . . . . . . . . . . 65 18. River stage and well hydrographs, Pekin field. . . . . . . . . . . . . . . . . . . . . . . . . . . . . . . . . . . . . . 66 19. River stage and well hydrographs, Peoria Industrial field. . . . . . . . . . . . . . . . . . . . . . . . . . . . 66 20. Available long-time data of water levels in Illinois River and wells at Peoria-Pekin.. . . 67 21. Groundwater surface contours, 1933 69 22. Groundwater surface contours, August 1941 70 23. Groundwater surface contours, flood peak, February 1942 71 24. Groundwater surface contours, September 1942 72 25. Groundwater surface contours, May 1, 1943 73 26. Groundwater surface contours, June 1, 1943 74 27. Groundwater surface contours, July 15, 1943 75 28. Groundwater surface contours, September 1943 76 29. Groundwater surface contours, September 1945 77 30. Thickness of saturated strata, 1933 79 31. Thickness of saturated strata, May 1943 80 32. Lowering of water surface, 1933 to May 1943 81 33. Rainfall, river levels, and groundwater levels, 1936-1945 84 34. Duration of Illinois River turbidities 85 35. Duration of Illinois River flows. . . . . . . . . . . . . . . . . . . . . . . . . . . . . . . . . . . . . . . . . . . . . . . . . . . 86 36. Channel velocity in Illinois River before and after closure of the Peoria dam 87 37. Range of Illinois River temperatures 87 38. Infiltration capacities of Peoria area soils 90 39. Pumpage and water levels, Peoria Dam Construction, 1936-1937 91 40. Water level profiles and materials encountered, Peoria VVater Works Company pump-
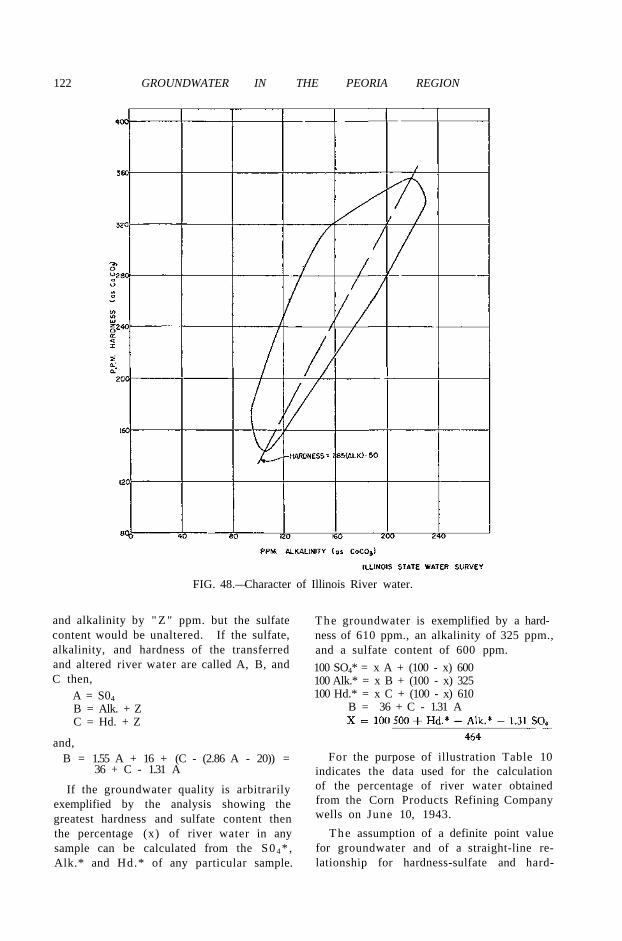
ing test 92 41. Well hydrographs and well locations, Peoria Water Works Company pumping test. . . 94 42. Location of infiltration pit and Observation wells 95 43. Pumpage and hydrographs of levels in Observation wells during infiltration tests 96 44. Selected well hydrographs and river levels, 1943 flood. . . . . . . . . . . . . . . . . . . . . . . . . . . . . .100 45. Relative character of Illinois River and Farm Creek water 116 46. Recorded temperatures of Illinois River water and of Peoria, East Peoria, and Pekin
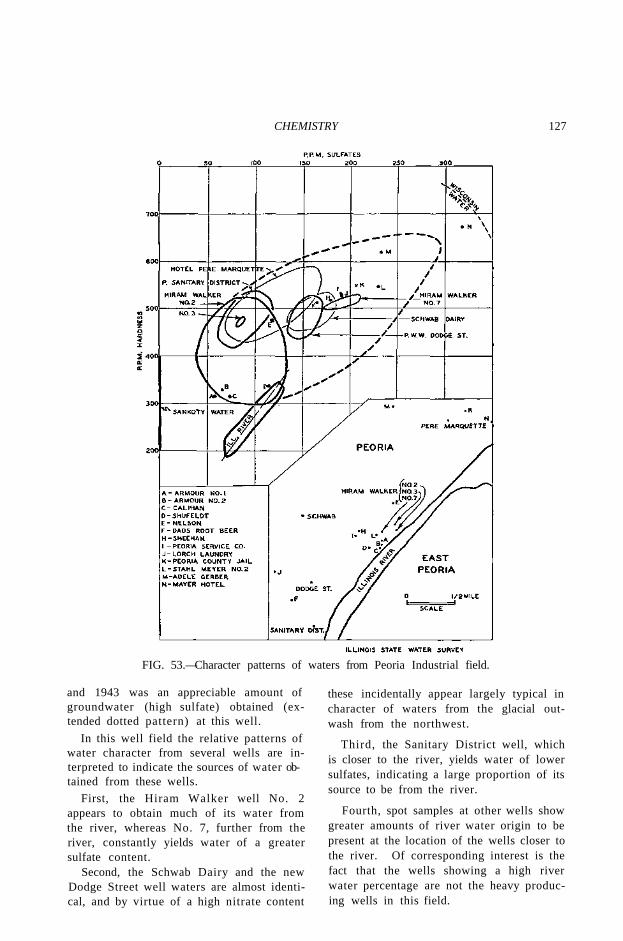
well waters 119 47. Character patterns of waters from industrial wells south of Pekin 121 48. Character of Illinois River water 122 49. Calculated percentage of Illinois River water entering C o r n Products Company wells.. 123 50. Character patterns from wells in East Peoria 124 51. Character patterns from wells in Sankoty field. . . . . . . . . . . . . . . . . . . . . . . . . . . . . . . . . . . . . 125 52. Sampling data from Sankoty field. . . . . . . . . . . . . . . . . . . . . . . . . . . . . . . . . . . . . . . . . . . . . . . . 126 53. Character patterns of waters from Peoria Industrial field. . . . . . . . . . . . . . . . . . . . . . . . . . . . 127
TABLES TABLE PAGE
1. Population of the City of Peoria 54 2. Well fields and field pumpage 58 3. Users and pumpage of Illinois River water 61 4. Change in volume of saturated material, 1933-1943 78 5. Uses of groundwater 83 6. Effect of changing conditions on channel velocity 86 7. Pumpage and water levels, Peoria dam construction, May 1936-May 1937 91 8. Changes in groundwater storage in Central field during and after 1943 Illinois River
flood 104 9. Wells that penetrate bedrock 117
10. Percentage of river water from Corn Products Refining Company wells 123
PART 1
G E O L O G Y
BY
LELAND HORBERG
Associate Geologist
STATE GEOLOGICAL SURVEY
CHAPTER 1
I N T R O D U C T I O N
LOCATION
THE P E O R I A region, in north-central Illinois, includes all of Peoria County
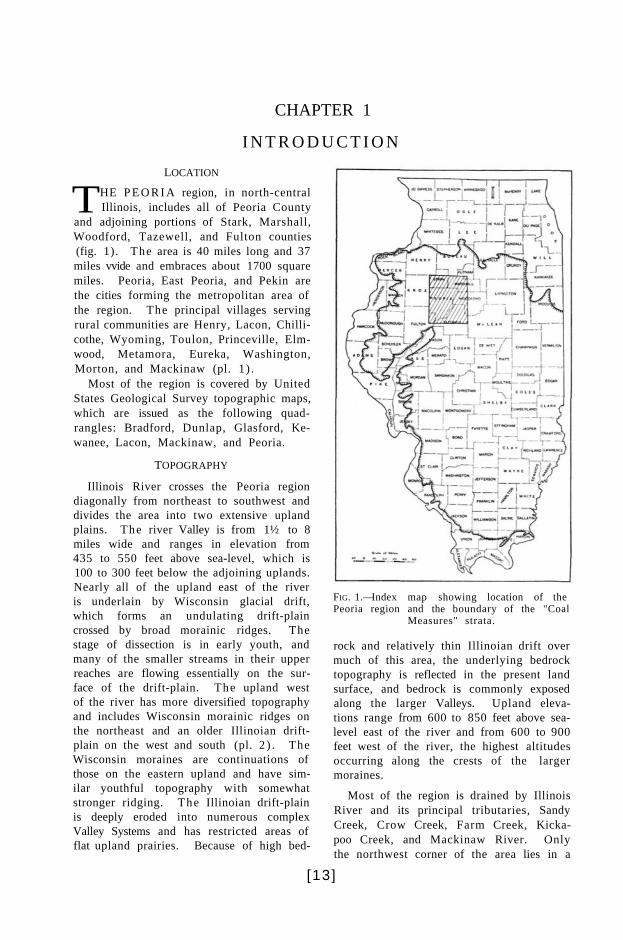
and adjoining portions of Stark, Marshall, Woodford, Tazewell, and Fulton counties (fig. 1). The area is 40 miles long and 37 miles vvide and embraces about 1700 square miles. Peoria, East Peoria, and Pekin are the cities forming the metropolitan area of the region. The principal villages serving rural communities are Henry, Lacon, Chilli-cothe, Wyoming, Toulon, Princeville, Elm-wood, Metamora, Eureka, Washington, Morton, and Mackinaw (pl. 1) .
Most of the region is covered by United States Geological Survey topographic maps, which are issued as the following quad-rangles: Bradford, Dunlap, Glasford, Ke-wanee, Lacon, Mackinaw, and Peoria.
TOPOGRAPHY
Illinois River crosses the Peoria region diagonally from northeast to southwest and divides the area into two extensive upland plains. The river Valley is from 1½ to 8 miles wide and ranges in elevation from 435 to 550 feet above sea-level, which is 100 to 300 feet below the adjoining uplands. Nearly all of the upland east of the river is underlain by Wisconsin glacial drift, which forms an undulating drift-plain crossed by broad morainic ridges. The stage of dissection is in early youth, and many of the smaller streams in their upper reaches are flowing essentially on the sur-face of the drift-plain. The upland west of the river has more diversified topography and includes Wisconsin morainic ridges on the northeast and an older Illinoian drift-plain on the west and south (pl. 2 ) . The Wisconsin moraines are continuations of those on the eastern upland and have sim-ilar youthful topography with somewhat stronger ridging. The Illinoian drift-plain is deeply eroded into numerous complex Valley Systems and has restricted areas of flat upland prairies. Because of high bed-
FIG. 1.—Index map showing location of the Peoria region and the boundary of the "Coal
Measures" strata.
rock and relatively thin Illinoian drift over much of this area, the underlying bedrock topography is reflected in the present land surface, and bedrock is commonly exposed along the larger Valleys. Upland eleva-tions range from 600 to 850 feet above sea-level east of the river and from 600 to 900 feet west of the river, the highest altitudes occurring along the crests of the larger moraines.
Most of the region is drained by Illinois River and its principal tributaries, Sandy Creek, Crow Creek, Farm Creek, Kicka-poo Creek, and Mackinaw River. Only the northwest corner of the area lies in a
[13]
14 GROUNDWATER IN THE PEORIA REGION
separate drainage basin tha t is dra ined by Spoon River and its t r ibutar ies , W a l n u t Creek and Ind ian Creek (p l . 2 ) .
P U R P O S E O F R E P O R T
T h e report summarizes the geologic con-ditions Controlling the occurrence of g round-wa te r in the Peor ia region and a t t empts to evaluate these conditions and indicate areas favorable for the development of addit ional g roundwa te r supplies.
T h e area covered by the report extends beyond the immediate environs of Peor ia in order that the regional extent of the glacial aquifers and buried or part ly fi l led bedrock Valleys may be portrayed and their relat ions to local wate r -bear ing deposits considered. Al though the study is based pr imari ly on subsurface data, i t takes into account the areal geology of the glacial deposits and bedrock formations and the data obtained from several electrical earth-resistivity surveys. T h e areal geology is shown on an out l ine m a p (pl . 2) ra ther than on topographic sheets, because par t of the area was mapped geologically before the topographic maps became available.
No special a t t empt is made to analyze hydrological and product ion data or surface supplies, since these aspects of the problem have been under cont inuous investigation by the Illinois State W a t e r Survey for a n u m -ber of years.1
P R E V I O U S IN V E S T I G A T I O N S
T h e earliest publications dealing wi th the geology of the Peor ia region are those of the original Geological Survey of Il l inois, directed by A. H . W o r t h e n , a s fo l lows:
Fulton County, by A. H. Worthen: Geol. Survey of Illinois, Vol. IV, pp. 90-110, 1870.
Marshall County, by James Shaw: Geol. Survey of Illinois, Vol. V, pp. 202-16, 1873.
Peoria County, by A. H. Worthen: Geol. Survey of Illinois, Vol. V, pp. 235-52, 1873.
Stark County, bv H. A. Green: Geol. Survey of Illinois, Vol. IV, pp. 325-33, 1870.
Tazewell County, by H. M. Bannister: Geol. vey of Illinois, Vol. IV. pp. 176-89, 1870.
Woodford County, by H. A. Green: Geol. Sur-vey of Illinois, Vol. IV, pp. 334-42, 1870.
1 Water resources in Peoria-Pekin District: Illinois State Water Survey Bull. 33, 114 pp., 1940; numerous unpublished reports.
Subsequent publications include general studies of the mineral resources of the Sta te in which references are made to local deposits, and o ther reports, listed below, which contain more detailed descriptions of pa r t s of the region.
Artesian wells in Peoria and vicinity, by J. A. Udden: Illinois Geol. Survey Bull. 8, yearbook for 1907, pp. 313-334, 1908.
Geography of the middle Illinois Valley, by Harlan H. Barrows: Illinois Geol. Survey Bull. 15, 128 pp., 1910.
Geology and mineral resources of the Peoria, Illinois quadrangle, by J. A. Udden: U.S. Geol. Survey Bull. 506, 103 pp., 1912. The only detailed geologic report on the area.
A notable type Pleistocene section—the Farm Creek exposure near Peoria, Illinois, by M. M. Leighton: Jour. Geol., vol. 34, pp. 167-74, 1926; also Illinois Geol. Survey Rept. of Inv. 11, pp. 3-9, 1926; The Peorian loess and the Classification of the glacial drift sheets of the Mississippi Valley, by M. M. Leighton: Jour. Geol., vol. 39, pp. 45-53, 1931. These papers are important in classifying the stratigraphy of the glacial deposits.
Water resources in Peoria-Pekin district: Illinois Water Survey Bull. 33, 114 pp., 1940. This report provides detailed description of many of the important wells and includes numerous water analyses.
In addit ion to the above publications the fol lowing unpublished studies were available to the w r i t e r and made i t possible to compile a detailed areal geology map of the region.
General geology and mineral resources of the Illinois deep waterway from Chicago to Peoria, by H. B. Willman: Illinois Geol. Survey unpublished manuscript, 276 pp., 1931.
Glacial geology of the lower Illinois River Valley, by T. B. Root: Unpublished doctorate thesis, Univ. of Chicago, 313 pp., 1936.
Maps of glacial deposits showing sand and gravel resources, prepared under direction of George E. Ekblaw; maps of Peoria, Stark, and Tazewell counties, by H. A. Sellin; maps of Marshall and Woodford counties by V. H. Jones: Illinois Geol. Survey unpublished maps, 1930.
Geologic map of the Glasford quadrangle, by A. C. Bevan: Illinois Geol. Survey unpublished map, 1929.
Bedrock surface and structure maps of the Glasford quadrangle, by H. R. Wanless: Illinois Geol. Survey unpublished maps, 1945.
T h e results of electrical earth-resistivity surveys summar ized in the report (fig. 5) were d r a w n from the following unpublished studies on file at the Illinois State Geological S u r v e y :
A preliminary earth-resistivity survey at Sparland, by J. P. Gries, 1936.
GEOLOGY 15
Electrical earth-resistivity survey at Metamora, by E. A. Atherton, 1938.
Results of an electrical earth-resistivity survey at Eureka, by M. B. Buhle, 1939.
Results of an electrical earth-resistivity survey at the Sankoty well field, Peoria, by L. E. Workman and M. B. Buhle, 1940.
Results of an electrical earth-resistivity survey at Brimfield, by M. B. Buhle, 1940.
Electrical earth-resistivity survey at Peoria and vicinity, by K. O. Emery, 1941. Includes Tenmile Creek, Sankoty, Kickapoo Creek, and part of East Peoria areas (fig. 8).
Results of an electrical earth-resistivity survey southwest of Metamora, by M. B. Buhle, 1942.
An electrical earth-resistivity survey in the vicinity of Elmwood, by M. B. Buhle, 1943.
Electrical earth-resistivity survey at Camp Grove, by M. B. Buhle, 1944.
An electrical earth-resistivity survey for Wyoming, by M. B. Buhle, 1944.
Electrical earth-resistivity survey for East Peoria, by M. B. Buhle, 1945.
E X T E N T O F S U B S U R F A C E D A T A
Interpretation of bedrock-surface features (pl. 1) and the subsurface stratigraphy of
the glacial deposits (pl. 3) are based on about 900 logs of wells and borings, of which about 110 are records based on studies of sample cuttings. Information on the deep-lying bedrock formations underlying the Pennsylvanian System (figs. 3 and 4) is provided by 38 well records, of which 26 are drillers' records and 12 are records based on sample studies.
A C K N O W L E D G M E N T S
The writer is indebted to several geol-ogists and geophysicists for basic field data without which the present study could not have been completed, to the engineers of the State Water Survey for groundwater pro-duction figures, and to George E. Ekblaw, L. E. Workman, H. B. Willman, C. A. Bays, and M. M. Leighton of the Survey staff for criticism and aid in the prepara-tion of the manuscript and illustrations.
CHAPTER 2
TYPES OF A Q U I F E R S
CLASSIFICATION
Aquifers in the Peoria region can be classed on the basis of groundwater occur-rence and their geologic relations as follows:
A. Unconfined (water-table) aquifers. 1. Recent alluvium—largely shallow dug
wells or well points. 2. Surface deposits of sand and gravel—
shallow wells of various types. 3. Glacial till—commonly shallow dug
wells. B. Confined (artesian) aquifers.
1. Sand and gravel deposits buried below impervious glacial till or clays—drilled wells; water-levels are usually below the water-table.
2. Shallow bedrock aquifers—usually drilled wells; water-levels are usually below the water-table.
3. Deep bedrock aquifers—drilled wells; many of these wells flow or formerly flowed and had water-levels which rose above the water-table.
Of these types, the surface sand and gravel deposits (A2) occurring mainly along the Illinois River Valley and the sand and gravel deposits underlying glacial till on the uplands (B1) are most extensive. Because of their proximity along the Valley, the present large supplies near Peoria are ob-tained almost entirely from the former type (A2) . The second type ( B l ) , however, is significant because widespread buried deposits connect directly with the deposits in the valley and contain undeveloped reserves. These deposits underlie an extensive area up the valley from Peoria, and it is through them that the local aquifers are recharged by lateral flow.
The deep bedrock aquifers (B3) , al-though capable of producing large quanti-ties of water, are limited as to use because of the high mineral content of their waters. The remaining types (A1, A3, and B2) are unimportant as potential sources of large supplies, but in some areas they are the only sources available and are developed for small private supplies.
O C C U R R E N C E O F G R O U N D W A T E R
All openings in the surficial glacial deposits and underlying bedrock, from a
slight depth down to thousands of feet deep, are filled with groundwater.
The upper surface of this saturated zone is termed the water-table, and its position is usually the depth at which water is en-countered in borings and excavations. This is normally only a few feet below the surface in the Peoria region. The water-table surface roughly conforms to surface topog-raphy, rising under the uplands and inter-secting the ground surface along permanent streams, Springs, and swamps. Its position fluctuates from season to season and year to year. Owing to this intermittent draining and recharge, the groundwater is in con-stant motion, the movement under natural conditions being more vigorous at the water-table than at greater depths.
In the upper part of the Saturation zone the groundwater is unconfined and moves freely under control of gravity down the slope of the water-table. Thus the shallow wells, whose water-levels indicate the Position of the water-table, are termed water-table wells. In deeper wells the water is often confined between impervious layers of clay in the glacial drift or shales in the bedrock formations and is under artesian pressure. It is hydraulically independent of the water above, and water-levels in these wells may be either above or below the water-table. In a broad sense all wells of this type are artesian wells.
Essentially all the wells in the Peoria region derive their water from rain and melted snow which entered the ground and filtered slowly downward into the zone of Saturation. In the case of unconfined aquifers, water-levels are subject to seasonal fluctuations in precipitation. In confined aquifers, however, the water is obtained from areas more remote from the wells and is unaffected by recent variations in precipitation. Confined waters in the glacial drift in some cases may have traveled as much as 100 miles, and waters in the deep bedrock aquifers could have come from much greater distances.
[16]
CHAPTER 3
BEDRÜCK F O R M A T I O N S AND T H E I R G R O U N D W A T E R C O N D I T I O N S
R E G I O N A L R E L A T I O N S The region is situated in the north-
western part of the Illinois coal basin (fig. 1), so that Pennsylvanian strata making up the "Coal Measures" occur directly below the glacial drift. A stratigraphic section of about 200 feet of these strata is exposed at the surface along streams which have been superimposed from the glacial deposits onto bedrock uplands. The under-lying beds in the lower part of the Coal Measures and the older bedrock forma-tions, however, are known only from sub-surface data and from geologic relations established outside the area.
The stratigraphic succession from young-est to oldest, and the Classification of the formations in the Peoria region are as follows: Paleozoic era
Pennsylvanian System McLeansboro group Carbondale group Tradewater group
Mississippian System Iowa series
Osage group Keokuk-Burlington formations
Mississippian-Devonian Systems Kinderhook-New Albany shale
Devonian System Cedar Valley limestone Wapsipinicon limestone
Silurian System Niagaran series Alexandrian series
Ordovician System Cincinnatian series
Maquoketa shale Mohawkian series
Galena dolomite Platteville dolomite
Chazyan series St. Peter sandstone
Prairie du Chien series Shakopee dolomite New Richmond sandstone Oneota dolomite
M I N E R A L C O N T E N T O F G R O U N D W A T E R S
The Peoria region lies near the northern margin of a large area encompassing most of the coal basin (fig. 1) in which the groundwaters of the bedrock formations are highly mineralized and of limited Utility. There appears to be an increase in mineral content toward the center of the basin, and this is indicated, in going from north to south, by the increasing mineral content of certain aquifers in the Peoria region. It seems clear that the Silurian, Galena-Platteville, and St. Peter waters at Toulon and elsewhere in the northwestern part of the region are less mineralized than the same aquifers in the vicinity of Peoria.
Variations in the mineral content of the principal bedrock aquifers have been noted2
in the vicinity of Peoria and may apply to the entire region. There appears to be a decrease with depth in both the total mineral content and sodium chloride content, so that the shallower Keokuk-Burlington waters are more highly mineralized than the Silurian waters, which in turn are more highly mineralized than those of the Galena-Platteville and St. Peter aquifers. The hydrogen sulphide content, however, appears to increase with depth and is higher in Galena-Platteville and St. Peter waters than in waters of the overlying aquifers.
The source of mineral matter in Solution presents numerous problems. Originally much of it probably had its source in con-nate marine waters which were contained in the bedrock formations at the time of their deposition. Since then changes in composi-
2 Udden, J. A., Geology and mineral resources of the Peoria quadrangle: U. S. Geol. Survey Bull. 506, pp. 91-93, 1912: Illinois State Water Survey Bull. 33, pp. 16, 28-29, 31 , 40, 60, 76, 97-98, 104 and 114, 1940.
[17]
18 GROUNDWATER IN THE PEORIA REGION
tion may have occurred by dilution with fresh waters entering the formation from the surface or by gravitative settling of more mineralized waters toward the center of the basin. Additions in mineral content are probably less important, but they could have been derived from waters entering the aquifer from associated beds in which soluble minerals, particularly sulphides, are present. Sulphides are of common occurrence in the Cedar Valley limestone, Kinderhook-New Albany shale, and in the coals and black shales of the Pennsylvanian System. Re-peated changes in mineral content have doubtless occurred with changing land altitude ever since deposition of the forma-tions. The unconformities in the geologic section, which evidence former periods of exposure and erosion, are especially signifi-cant since they represent times when fresh waters could have entered the formations.
PRE-ST. P E T E R F O R M A T I O N S
Description.—Because the St. Peter sand-stone is the oldest formation penetrated by borings in the region, the characters of deeper-lying rocks are inferred from records of wells in adjoining areas. A sample study of a well located seven miles west of the area in northern Fulton County provides much of this inf ormation and is given below:
J. S. Young Co.—Midland Electric Coal Co., 1933, NE. ¼, SE. ¼, NE. ¼, sec. 2, T. 8 N., R. 3 E.
Sample study by Margaret Blair, 1933. Elevation—698 feet Thick-
ness Depth Feet Feet
Ordovician System St. Peter sandstone—268 feet thick
Sandstone, white, fine to coarse-grained, incoherent 268 1625
Shakopee dolomite—160 feet thick Dolomite, red and light gray,
fine-grained, with oolitic chert and interbedded shale, red, silty 78 1703
Sandstone, gray and yellow, do-lomitic, fine to coarse-grained, incoherent, and porous 15 1718
Dolomite, gray to red, fine to very fine-grained, argillaceous, slightly sandy 67 1785
New Richmond sandstone—72 feet thick
Sandstone, white, medium and coarse-grained, incoherent, some dolomite as above 72 1857
Oneota dolomite—253 feet thick Dolomite, light gray, fine to
medium - grained, slightly sandy, and glauconitic 220 2077
Dolomite, light brown to gray, fine to medium-grained, with white to light gray oolitic chert 33 2210
No records of nearby borings are available for the formation underlying the Galesville sandstone, and the summary which follows is based largely on subsurface studies in north-central Illinois :3
3 Willman, H. B. , and Payne, J. N., Geology and mineral resources of the Marseilles, Ottawa, and Streator quad-rangles: Illinois Geol. Survey Bull. 66, pp. 53-55, 1942.
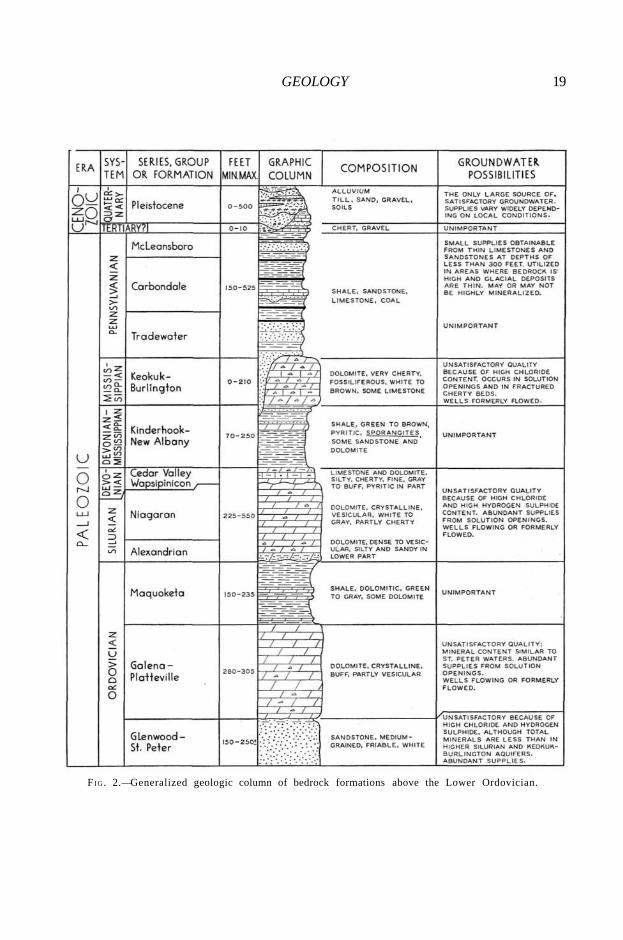
GEOLOGY 19
F IG . 2.—Generalized geologic column of bedrock formations above the Lower Ordovician.
20 GROUNDWATER IN THE PEORIA REGION
Thickness in feet
Min. Max. Cambrian System
Eau Claire . formation—350-500 feet
Dolomite, Sandy, gray to green-ish-gray, finely crystalline, argillaceous 4 30
Sandstone, dolomitic, pink, buff and red, argillaceous, very glauconitic 225 250
Mt. Simon sandstone Sandstone, gray, yellow and
buff, very fine to coarse-grained, fossiliferous, sooty pyrite incrustations 100 170
Pre-Cambrian (?) Fond du Lac (?) sandstone
Sandstone, pink, yellow and pur-ple, with variegated shale and conglomerate, lower portion arkosic 1600 2100
Granite and other crystalline rocks Groundwater conditions. — Important
quantities of water would probably be ob-tainable from the Galesville sandstone, an important aquifer throughout northern Illinois, and from crevice Systems in the overlying dolomites. In the Midland Electric Coal Company well (partial log given above), favorable reservoir conditions appear to exist in the Galesville sandstone and in crevices in the upper part of the Trempealeau and lower part of the Oneota dolomites. T h e waters in these formations, as in overlying beds, are probably highly mineralized and unsatisfactory except for very limited uses. The water from the Midland Electric Coal Company well is used for washing coal.
ST. P E T E R A N D Y O U N G E R O R D O V I C I A N F O R M A T I O N S
ST. PETER SANDSTONE
Description.—St. Peter sandstone is penetrated in eight of the deep wells in the area (figs. 2, 3, and 4, wells 3, 5, 7, 22, 25, 28, 29, and 31) at elevations varying from 593 feet below sea-level in the north to 1016 feet below sea-level in the south. None of the wells go through the entire formation, but records in adjoining areas indicate that the total thickness varies from about 150 to 250 feet, and that the variations in thickness are due to an important basal uncon-
formity. The sandstone is white, medium-grained, friable, and contains abundant rounded and frosted quartz grains. Thin argillaceous beds in the upper part of the sandstone may be referable to the Glenwood formation of northern Illinois.
Groundwater conditions. — Important quantities of water are probably obtainable from the sandstone throughout the area, but the water is highly mineralized. It is probable that flowing wells from the St. Peter could be obtained along the Illinois Valley, as water in the deep well at the Illinois Asylum for the Incurable Insane (fig. 3, well 22) rose to an elevation of about 600 feet above sea-level,4 which is above the valley floor. Village supplies from wells ending in the St. Peter sandstone have been developed at Touion, Wyoming, Princeville, Elmwood, and Glasford.
GALENA-PLATTEVILLE DOLOMITE
Description. — The Galena-Platteville dolomite which overlies the St. Peter sandstone is composed of buff, crystalline, partly vesicular dolomite above, and darker finer-grained dolomite with some cherty beds and occasional shale partings in the lower part.
Groundwater conditions.—The water ap-pears to have a mineral content similar to that from the St. Peter,5 and in many places the two formations may be connected hy-drologically. Because most of the water occurs along fractures ("crevices") and bedding planes which have been enlarged by Solution, the quantity of water obtainable varies from place to place depending upon the size and abundance of the Solution openings. The Logan Field Swimming Pool well (well 19) is reported to have ended in a crevice, and Galena crevices were reported in the deep well at Wyoming. Flowing wells have been drilled along the Illinois Valley where ground-surface elevations are 535 feet or less (fig. 3, wells 9, 10 ?, and 19). Probably most of the water is to be obtained in the upper portion of the dolomite.
4 Udden, J. A., Geology and mineral resources of the Peoria quadrangle: U. S. Geol. Survey Bull. 506, p. 90, 1912. 5 Udden, J . A., op. cit., p. 93 .
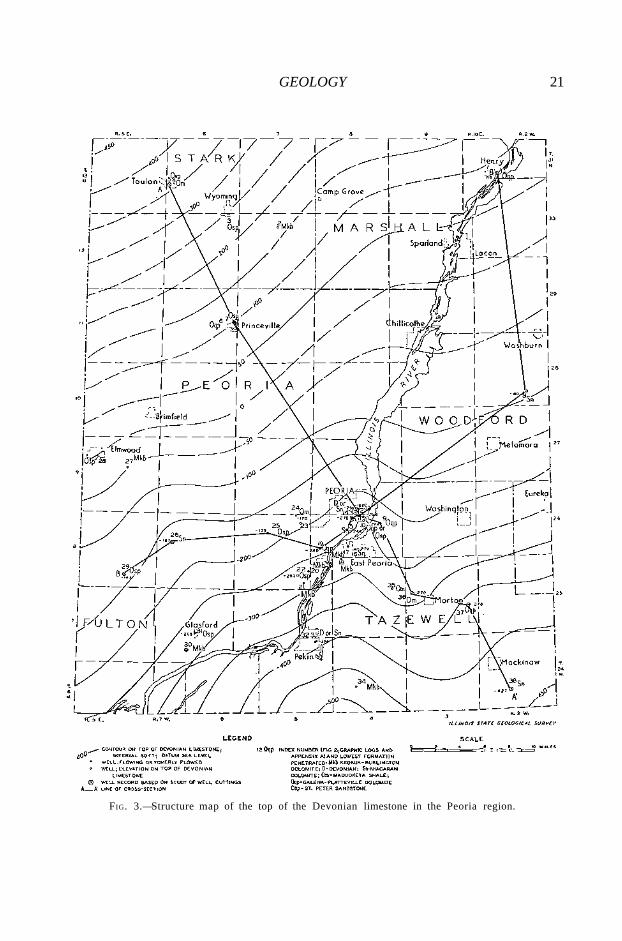
GEOLOGY 21
FIG. 3.—Structure map of the top of the Devonian limestone in the Peoria region.
22 GROUNDWATER IN THE PEORIA REGION
FIG. 4.—Graphic logs of some deep wells in the Peoria region.
GEOLOGY 23
MA Q U O K E T A SHALE
Description. — The Maquoketa shale overlying the Galena-Platteville dolomite consists of upper and lower shales and a middle dolomite member, all of which vary considerably in thickness. The shales are green to gray and brown, dolomitic, especial-ly in the lower member, and in places con-tain pyritic and phosphatic nodules; the dolomite beds are gray to brown, often mottled, argillaceous, and vesicular. Thick-nesses of the formation vary from 150 to 235 feet, the Variation being due to the re-lief on the unconformity at the top and possibly to some regional thinning to the south.
Groundwater conditions. — Small a-mounts of groundwater may be present in the dolomite beds, but the formation as a whole is impermeable and does not merit consideration as a source of supply. It forms an impervious layer separating the Galena-Platteville and Silurian aquifers.
S I L U R I A N S Y S T E M Description.—The Silurian dolomites
overlie the Maquoketa shale unconformably and are composed largely of white to gray, crystalline, vesicular dolomite. The Alexan-drian strata forming the lower 50 feet or so contain more chert than the overlying Niagaran and include basal beds which are silty and sandy. There is a regional thinning of the system from 480 feet in the northeast part of the region to 151 feet in the southwest part (fig. 4, wells 1 and 29) , which is one of the outstanding stratigraphic features of the area. Local variations in thickness are due to the basal unconformity.
Groundwater conditions.—As in the Galena-Platteville dolomite, a b u n d a n t water would be obtainable from crevices and other Solution openings.
Flowing wells have been obtained from the Niagaran near Peoria where the ground-surface elevation is 550 feet or less (flg. 3, wells 11, 12, 13, 14?, 15, 16, 32?, and 33?), and an increase in flow with decrease in elevation has been established.6 The only village well producing largely from the
6 Udden, J. A., op. cit., p. 94.
Silurian is the new well at Toulon which ends in the underlying Maquoketa shale (Appendix, well 5 ) .
D E V O N I A N S Y S T E M
Description. — The Devonian rocks, which overlie the Silurian System unconformably, include argillaceous limestones and dolomites belonging to the Cedar Valley and Wapsipinicon formations. The Cedar Valley beds are more argillaceous than the sublithographic limestone of the Wapsipinicon. Pyrite and chert are present in both formations. The system varies in thickness from 25 to 85 feet.
Groundwater conditions.—The shaly character of the Devonian beds suggests that they are not important aquifers. They are probably connected hydrologically with the underlying Niagaran by a system of Solution openings, and contain water of similar composition. The abundant pyrite present in some places could cause increases in the hydrogen sulphide content of the water, but this has not been noted in the Peoria region. There are no wells which are known to end in the Devonian beds.
D E V O N I A N — M I S S I S S I P P I A N SYSTEMS
K INDERHOOK-NEW ALBANY SHALE
Description.—The Kinderhook-New Albany shale overlies the Devonian limestones without apparent unconformity. The shale is green to brown, pyritic, partly dolomitic, and contains abundant fossil plant spores, called Sporangites. Thin sandstone and dolomite beds are present in the upper half of the formation. Except for places in the northern part of the area where pre-Pennsylvanian erosion has cut down into the Kinderhook (figs. 3 and 4, wells 1, 4, and 5) , the formation varies in thickness from 205 to 255 and in most places is about 225 feet thick.
Groundwater conditions.—The shale forms a thick impermeable layer which separates the Niagaran and Keokuk-Bur-lington aquifers and is not to be considered as a possible source of groundwater.
24 GROUNDWATER IN THE PEORIA REGION
KE O K U K -BU R L I N G T O N FORMATIONS
Description. — The Keokuk-Burlington formations overlie the Kinderhook-New Albany shale without apparent uncon-formity. They form a massive unit of cherty, white to brown dolomite, which is fine to medium-grained, fossiliferous, and partly glauconitic, interbedded with chert and limestone. The formations are absent in the northern part of the area, where the beds have been removed by pre-Penn-sylvanian erosion (figs. 3 and 4, wells 1 and 5) , and reach a maximum thickness of 212 feet in the southeast corner of the region (fig. 3, well 38) . The average thickness in the vicinity of Peoria is about 150 feet.
Groundwater conditions.—Groundwater occurs in Solution openings along joints and bedding planes and in fractured cherty beds, especially in the upper part of the forma-tion. The aquifer is the uppermost which has yielded flowing water, and at least four of the flowing wells terminate within the formation (figs. 3 and 4, wells 17, 18, 20, and 21) . Hydrostatic pressures seem to be considerably lower than in the other artesian aquifers, the head being estimated at about 530 feet above sea-level in 1912.7 Because of its high mineral content, the water would be unsatisfactory for most purposes.
P E N N S Y L V A N I A N S Y S T E M
Description.—The Pennsylvanian beds overlap the older rocks and rest upon progressively older strata from southeast to northwest, so that in places in the northern part of the region they lie directly on Kinderhook shale. Included within the system are an orderly repetition of more or less similar beds of: coal, black fissile shale, limestone, shale and siltstone, sandstone, shale, and fire clay. This sequence, first recognized by J. A. Udden8 in the Peoria region and attributed to cycles of Sedimentation, has formed the basis for recent studies of the Pennsylvanian system. The follow-ing ten units are now recognized in each cyclical repetition of beds or cyclothem where fully developed.9
7 Udden, J. A., op. cit., p. 94. 8 Op. cit., pp . 47-50.
Within the 14 or 15 cyclothems recognized in the Peoria region, shale is the dominant type of rock, followed by sandstone and limestone. Sandstones are most important in the lower one-fourth of the sequence.
T h e thickness of the Pennsylvanian varies from about 150 to 525 feet, the variations being due primarily to relief on the bed-rock surface underlying the glacial deposits.
Groundwater conditions.—No important aquifers capable of producing large supplies are present in the system. Small supplies for private use have been obtained in the western part of the area from limestone, sandstone, and occasionally coal beds at rel-atively shallow depths. The water from these wells probably varies a great deal in quality depending upon local stratigraphic relations, but it is known to have a high mineral content in many places.
T E R T I A R Y (? ) S Y S T E M A gravel deposit composed largely of
yellow chert occurs below the Illinoian drift at one point on the bedrock upland southwest of Peoria.10 Its composition is unlike the glacial deposits in the region and is similar to "Lafayette-type" gravels which occur at many places on the bedrock uplands to the south and west. There are no wells in the region which are known to penetrate the deposit.
B E D R O C K S T R U C T U R E A N D G R O U N D W A T E R M O V E M E N T
The area is situated structurally on the northwest flank of the Illinois basin, and
9 Weller, J. M., Cyclical Sedimentation of the Pennsylvanian and its significance: Jour . Geol., vol. 38, pp. 97-135, 1930: Wanless, H. R., Pennsylvanian cycles in western Ill inois: Illinois Geol. Survey Bull. 60, pp. 179-193, 1931; Weller, J. M. , Henbest, L. G., and Dunbar, C. O., Stratigraphy of the Fusuline-bearing beds of Ill inois: Illinois Geol. Survey Bull. 67, pp. 9-34. 1942.
10 Udden, J. A., op. cit., p. 50 .
GEOLOGY 25
the pre-Pennsylvanian formations dip south-southeastward at uniform rates of about 15 feet per mile. T h e Pennsylvanian beds overlap progressively older strata in a north-west direction but have the same regional structure with slightly less dip. These features are shown by structure contours on top of the Devonian limestone, figure 3, and in the geologic cross-sections, figure 4.
Groundwater in the bedrock formations moves down-dip so that the direction of movement in the Peoria region is from northwest to southeast. Water in the pre-Mississippian aquifers enters the forma
tions in areas where they are exposed at the surface or under porous glacial deposits in northern Illinois and southern Wisconsin. The water in the Keokuk-Burlington aqui-fer, however, would have to enter the for-mation in western Illinois and Iowa and move into the area from the west. It is possible that the Position of this aquifer on the up-dip margin of the formation and away from the line of most direct groundwater movement may account in part for the high mineral content of its water. Part of the mineral matter may also be due to waters moving downward into the aquifer from overlying Pennsylvanian beds.
CHAPTER 4
BEDRÜCK T O P O G R A P H Y AND ITS R E L A T I O N TO GLACIAL A Q U I F E R S
The bedrock surface on which the glacial deposits rest has its own uplands and Valleys which in general do not accord with the present topography. In places in the Peoria region large buried bedrock Valleys under-lie the present uplands and have no surface expression; in other places they have been partly re-excavated and are followed by present streams. The presence of Kansan and probably older deposits in the lower part of the Valley fills near Peoria and to the south indicates that most of the bedrock topography was carved in preglacial time.
D E S C R I P T I O N
The outstanding feature of the bedrock surface is the ancient valley of the Mississippi River which crosses the eastern part of the region (pl. 1) . Bedrock uplands dis-sected by tributary Valleys are present on both sides of the ancient valley. The up-land to the west covers over half the area and rises to elevations between 700 and 750 feet above sea-level; the upland to the east is much less extensive and about 100 feet lower. The bedrock surface ranges in ele-vation from 750 feet above sea-level in the west-central part of the region to below 300 feet above sea-level along the ancient Mississippi Valley, giving a total maximum re-lief of more than 450 feet.
AN C I E N T MISSISSIPPI VALLEY
The bedrock valley formerly occupied by the ancient Mississippi leaves the present Mississippi River above Rock Island in western Illinois and continues eastward under the drift to enter the Illinois Valley near the big bend at Hennepin. Continuing south, the Valley enters the northeast corner of the Peoria region and follows Illinois River to a point south of Chillicothe where it leaves the present valley and continues
south below the drift to the east of the present valley.
The ancient Valley is both wider and deeper than the present valley. It has an average width of about 8 miles compared with about 3 miles for the present valley and is entrenched 300 to 350 feet below ad-joining bedrock uplands. In the northern half of the area, the west bluff of the present valley corresponds closely with the western margin of the bedrock valley, but the eastern bluff is composed entirely of glacial drift fill and lies 2 to 6 miles west of the buried eastern slope of the bedrock valley (pl. 1) .
The buried section of the ancient valley below Chillicothe is not expressed in the present surface topography and is known only from subsurface data. The possible existence of such a valley, however, is in-dicated physiographically by the narrow bedrock channel of the present river between north Peoria and Pekin (pl. 1), which is incongruous with the broad valley above. This relation suggests that the broad upper valley was eroded in the glacial fill of an older bedrock valley and that the narrows resulted from superposition across a spur of the bedrock upland. It was on this general basis that Leverett11 suggested the possible existence of a buried valley east of Peoria long before the location of the ancient Mississippi Valley was established from well records. The position of the bedrock valley is indicated by records of numer-ous wells which penetrate abnormally thick drift and show that bedrock elevations along the old channel are below 400 feet as compared with 550 to 650 feet on adjoining uplands. The presence of two deep Channels surrounding a bedrock island south of Washington is indicated by bedrock elevations of 430 to 490 feet near the center of
11 Leverett, Frank, The Illinois glacial lobe: U. S. Geol. Survey Mon. 38. p. 500, 1899.
[26]
GEOLOGY 27
the lowland. With additional data this Interpretation may be changed, although bedrock elevations of less than 400 feet are shown by well records on all but the north side of the island.
W Y O M I N G BEDROCK VALLEY
The presence of buried Wyoming Valley joining the upper Spoon River drainage basin with the ancient Mississippi Valley to the east is revealed by low bedrock elevations in southwestern Marshall and southern Stark counties (pl. 1) . It is believed that preglacial Spoon River above the narrows northwest of Elmwood followed a reversed course northeast to a point south of Wyoming where, joined by preglacial Walnut Creek, it continued eastward to join the ancient Mississippi. The bedrock valley is two to three miles wide and lies 100 to 250 feet below surrounding bedrock up-lands.
KICKAPOO CREEK BEDROCK VALLEY
The partly buried bedrock Valley of Kickapoo Creek coincides with the west branch and lower course of the present stream and enters Pekin-Sankoty channel northwest of Peoria. In preglacial times the Valley appears to have been occupied by a stream which flowed eastward from southwestern Knox County across present Spoon River and entered the present Kickapoo Valley through a buried valley south of Elmwood. Another bedrock valley about five miles to the north appears to be connected to Kickapoo Valley by a headwater spillway of interglacial and recent origin.
PEKIN-SANKOTY BEDROCK C H A N N E L
This channel is represented by a buried bedrock valley which leaves the ancient Mississippi Valley above Peoria, extends southward under the upland northwest of the city to the mouth of Kickapoo Creek, and continues southward along the present Illinois Valley past Pekin (pl. 1) . The buried northern section of the Valley, shown on Udden's bedrock surface map12 as a broad tributary of the present Valley, was first indicated as a through-channel by
12 Op. cit., pl. V, p . 92, 1912.
Emery13 in 1941. Since then additional wells which support Emery's Interpretation have been drilled along the channel.
The Valley is 2 to 3 miles wide and is en-trenched 275 feet into a spur of the bedrock upland west of the buried ancient Mississippi Valley. The lowest bedrock elevation is 323 feet above sea-level, as revealed by a well in the south end of the buried section of the Valley.
Because of the presence of pre-Kansan Sankoty sand within the Valley, it is believed to be preglacial in age. Although alternative interpretations are possible, the bedrock elevations slightly more than 400 feet along present Illinois Valley, north of Peoria, suggest that the Pekin-Sankoty channel may represent a southward con-tinuation of Wyoming Valley. In this case the narrow upland separating the Valley from the ancient Mississippi Valley to the east was largely removed by later erosion during Sangamon and possibly late Wisconsin and recent time.
NARROWS OF PRESENT VALLEY
The youngest and shallowest section of the present valley between Peoria and East Peoria was cut by the superimposed Illinois River after the deposition of the Illinoian glacial drift. It forms a narrow bedrock trench separating two Segments of the isolated upland east of the Pekin-Sankoty channel (pl. 1 and fig. 8 ) . Rock benches are present on both sides of the Valley, and the channel below the 400-foot contour is less than one-half mile wide. The lowest reported bedrock is 363 feet above sea-level, which is about 40 feet higher than the Pekin-Sankoty channel to the west. To the north the valley widens and merges with the buried ancient Mississippi Valley.
G L A C I A L A Q U I F E R S I N T H E B U R I E D VALLEYS
Glacial sand and gravel deposits supply most of the groundwater used in the region, and their distribution is determined largely by the Position of large bedrock Valleys.
13 Emery, K. O., Electrical earth-resistivity survey at Peoria and vicinity: Illinois Geol. Survey unpublished re-port, fig. 2, 1941.
28 GROUNDWATER IN THE PEORIA REGION
This relation applies not only in the Peoria region, but is indicated by subsurface data throughout the State and by numerous groundwater studies in other areas.
The fundamental reason for the prev-alence of sand and gravel aquifers along bedrock Valleys is found in the conditions under which glacial outwash was deposited. During the glacial invasions of the Pleisto-cene epoch, large volumes of water from the melting ice were concentrated along the larger Valleys and, being overloaded with debris, they deposited valley-trains of sand and gravel which extended for many miles downstream from the glacier fronts. Drainage conditions in other areas were disrupted and streams, formerly eroding, began to aggrade their Valleys with sand, silt, and gravel. In some places the Valley deposits were later overriden by the ice and buried by glacial till; in others the Valleys were left open. Both cases are illustrated by the ancient Mississippi Valley in the Peoria region. During later stages of glaciation younger valley-trains were superimposed on the older fill in Valleys which remained open or had been re-excavated during the intervening interglacial stages. In places
it appears that sags above partially buried Valleys were sites of deposition of younger outwash.
Aside from the ice-drainage conditions, there are two additional reasons which favor the occurrence of groundwater aquifers along bedrock Valleys:
1. There is a Statistical advantage of encountering sand and gravel where the glacial drift is thickest and this is over buried Valleys.
2. Initial concentrations of outwash with-in the Valleys are more likely to be preserved from later glacial erosion than deposits on bedrock uplands which could be swept away readily and destroyed.
As compared with most areas in the State, the Peoria region is favorably situated with respect to bedrock valley aquifers. The bedrock Valley of the ancient Mississippi is one of the largest in the State and con-tains thick deposits of sand and gravel. Additional deposits occur along the Pekin-Sankoty channel, the present valley of Illinois River close to the metropolitan center, and in rural areas along Kickapoo Creek and Wyoming bedrock Valleys.
CHAPTER 5
GLACIAL D E P O S I T S AND G R O U N D W A T E R C O N D I T I O N S
C L A S S I F I C A T I O N O F D E P O S I T S The glacial deposits or "drift" overlie
the bedrock formations unconformably, fill in and bury the irregularities on the bedrock surface, and constitute the main fea-tures of the present land surface. They are composed dominantly of unstratified boul-dery clays called glacial till, but include stratified outwash deposits of sand, silt, and gravel. Wind-blown deposits of silt, de-rived in the main from outwash in the Valleys, form the loess deposits which overlie and interlie the till sheets. In its surface expression the drift is characterized by a number of distinctive land forms, the out-standing being (1) moraines, which are broad, arcuate ridges of till formed by accumulation of debris at the edge of a glacier when the ice front was more or less stationary, (2) ground moraines, which form the wider Stretches of rolling plains between the moraines, (3) outwash plains, which are flat plains of sand and gravel built up along the margin of the ice sheet and front the moraines, and (4) valley-trains, which are outwash deposits confined within Valleys draining away from the glacier.
During the Pleistocene or glacial epoch Continental ice-sheets formed in Canada around three great centers: the Labradorean center in eastern Canada, the Keewatin Center west of Hudson Bay, and the Cordil-leran center in western Canada. From the two eastern centers the ice advanced south-ward into central United States and ulti-mately most of the Mississippi drainage basin was glaciated. Four independent stages of glaciation separated by intergla-cial stages are now generally recognized. These are, from oldest to youngest, the Nebraskan, Kansan, Illinoian, and Wisconsin. In the Peoria region the glacial deposits include Kansan ( ? ) , Illinoian, and Wisconsin drift (fig. 5 ) , all of which were
derived from the Labradorean center with the possible exception of the Kansan. The stratigraphic succession and the Classification of the glacial deposits in the Peoria region is as follows: Cenozoic era
The surface distribution of the various glacial deposits in the region (shown in plate 2) form three physiographic areas: (1) the Illinoian till-plain in the western part of the region, (2) the Wisconsin moraines covering most of the remaining area, and (3) the Wisconsin valley-train terraces and recent deposits along Illinois Valley and its tributaries. Except for small exposures along deep Valleys the pre-Illinoian deposits are concealed below
14 Subsequent to the writing of this report there has been a revision in the Classification of the deposits referred to herein as late Sangamon loess. It has been proposed by M. M. Leighton that these deposits be given a place name, namely "Farmdale loess," from exposure at the Farm Creek section near Farmdale, Tazewell County, Illinois. He re-gards the Farmdale loess as pro-Wisconsin (pre-Iowan) rather than late Sangamon age: personal communication, 1946.
[29]
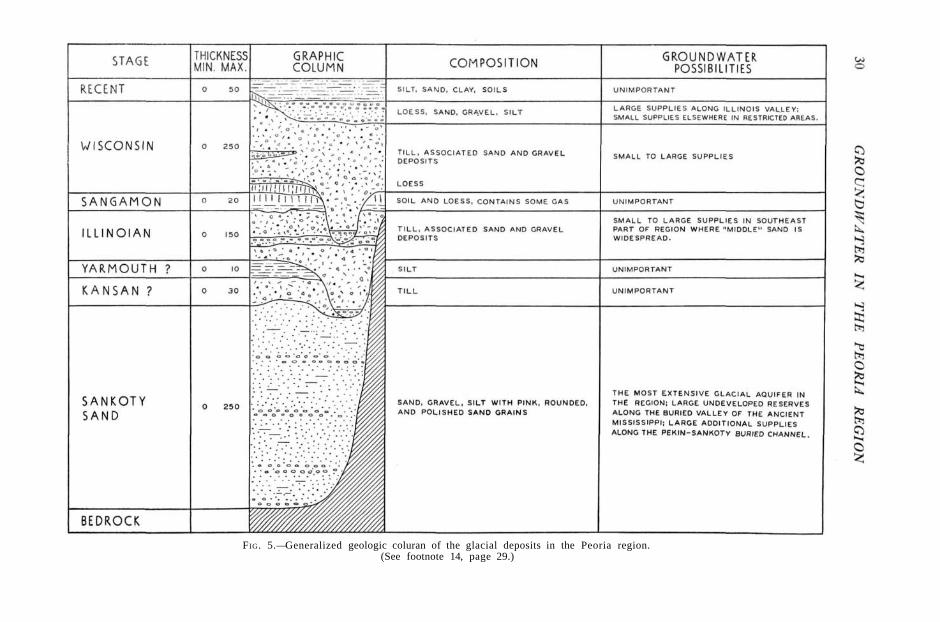
FIG. 5.—Generalized geologic coluran of the glacial deposits in the Peoria region. (See footnote 14, page 29.)
GEOLOGY 31
younger drift and are best known from subsurface studies.
ILLINOIAN T I L L PL A I N
Description.—The Illinoian till plain forms a relatively flat upland surface which has been maturely to submaturely dissected by streams. Formerly the drift sheet covered the entire region, but it is concealed below Wisconsin drift in the eastern part of the area (pls. 2 and 3 ) . The average thickness of the drift sheet resting on the bedrock uplands is about 35 feet, although along buried bedrock Valleys it may reach thicknesses up to 200 feet.
Groundwater conditions.—Except for restricted areas above bedrock Valleys, groundwater conditions are unfavorable, and most supplies are from shallow dug wells in the drift or to the top of rock and from bedrock wells penetrating sandstone or limestone in the upper part of the Pennsylvanian (fig. 6 ) . Municipal supplies within the area at Toulon, Wyoming, Princeville, Elmwood, and Glasford are secured from deep bedrock wells.
W ISCONSIN D R I F T
Description.—The Wisconsin drift sheet forms an extensive upland plain traversed by morainic ridges which have a general north-south to northwest-southeast trend (pl. 2 ) . The moraines were formed during the Tazewell glacial substage and, in the order of recession, include the Shelbyville, Leroy, Bloomington, Metamora, and Normal, of which the Bloomington is the most prominent. The moraines are often drain-age divides and influence the Position of streams. In most places the outer fronts rise more abruptly from the general upland level than the back slopes which descend gradually or by a series of steps. The ground-moraine tracts between moraines are flat to gently rolling and have less local relief than the moraines. There has been considerable erosion of the moraines and ground-moraines along Illinois River, but over much of the area the drainage is poor and the degree of erosion is much less than on the Illinoian till plain.
Most of the moraines are bordered by only narrow fringes of outwash and, except for the extensive outwash plain south of Wyoming in southeastern Stark County, no large outwash plains were formed. Instead, most of the thick outwash deposits were val-ley-trains, and are now reduced to terrace remnants along the larger Valleys. A high-level remnant of the Bloomington outwash plain forms the upland, 590 to 600 feet above sea-level, in the northwest part of Peoria (secs. 5, 6, 7, and 8, T. 8 N., R. 8 E . ) .
Groundwater conditions.—The groundwater conditions in the area are extremely variable and will be discussed in greater detail in connection with subsurface relations. In contrast to the Illinoian drift area, small private supplies are available through-out the area, and all but a few isolated wells obtain water from glacial aquifers (fig. 6) . This is due to the greater average thickness of the Wisconsin drift, which is roughly 125 feet, to its deposition at or near the margin of the glacier, and to the fact that older underlying deposits are in most places more than 100 feet thick and include water-bear-ing sands and gravel.
The deeper aquifers in the Wisconsin drift generally occur at depths of less than 100 feet, although in some areas depths up to 200 feet are reached. Most of the water-bearing deposits are discontinuous and lentic-ular and are unfavorable for obtaining important supplies. They appear to be thickest and most continuous near the outer margins of the moraines. The lower aquifers are confined or partially confined by overlying deposits of relatively impermeable till.
An extensive, shallow unconfined aquifer is coextensive with the outwash plain in southeastern Stark County where domestic supplies are obtained from wells 25 to 40 feet deep.
ILLINOIS VALLEY DEPOSITS
Description.—Wisconsin valley-train ter-races are the most conspicuous feature along the Illinois Valley and, as shown on plate 2, cover the major part of the Valley floor
32 GROVNDWATER IN THE PEORIA REGION
FIG. 6.—Groundwater conditions in the Peoria region.
GEOLOGY 33
in the wider portions of the Valley. In trib-utary Valleys terrace remnants are present along Mackinaw River, Kickapoo Creek and Sandy Creek, and to a lesser extent along Crow Creek and Farm Creek. The glacial outwash deposits underlying the terraces and flood plains are composed al-most entirely of stratified sand and gravel and are exposed at many places.
Three main terraces, about 520, 480, and 460 feet above sea-level, are present along the main Valley. A large part of the city of Peoria below the "bluff" is built on the 520-foot terrace. It is believed that the 520- and 480-foot terraces represent erosion levels cut by the Kankakee torrent during the Cary substage in a thick deposit of outwash which at one time almost filled the Valley. The lower 460-foot terrace is un-derlain by deposits of different composition from the upper terraces and is believed to be a depositional feature formed by the Lake Chicago outlet river during the late Cary and Mankato substages.16
In addition to the terraces, recent deposits of flood-plain alluvium, alluvial-fan material, and dune sand occur along the Valley. Except for the dune sands, which occur chiefly on the terraces on the east side of the Illinois River, these Sediments occur at flood-plain levels, are less well sorted, and contain larger amounts of silt and clay. Alluvial fans are prominently developed at the mouths of Farm Creek, Tenmile Creek, and on the east side of the river opposite Chillicothe. The growth of the alluvial fans shifted the Position of the river channel westward and is responsible for the river's constrictions and expansions. At Peoria the fan of Farm Creek gave rise to Lake Peoria.16
Groundwater conditions.—Geologie con-ditions are favorable throughout almost all the valley (fig. 6 ) , and small to large supplies of groundwater probably would be obtainable in most places. This is due in
15 Willman, H. B., and Ekblaw, George E., personal communication; Willman, H. B., and Payne, J. N. , Geology and mineral resources of the Ottawa, Marseilles and Streator quadrangles: Illinois Geol. Survey Bull. 66, pp. 167-75, 222-25, 1942; Ekblaw, George E. , and Athy, L. F. , Glacial Kankakee torrent in northeastern Illinois: Bull. Geol. Soc. Amer., vol. 36. pp. 417-28, 1925.
18 Barrows, H. H. , Geography of the middle Illinois Valley: Illinois Geol. Survey Bull. 15, pp. 8-11, 1910.
part to the widespread occurrence of the sands and gravels of the Wisconsin valley-train and in part to the presence below much of the valley of the important deeper Sankoty aquifer which will be described more fully later. Most private supplies along the valley, part of the municipal supplies at Henry, Lacon, and Chillicothe, and industrial supplies along the narrows between Peoria and East Peoria are secured from unconfined or partially confined aquifers in the Wisconsin outwash. Outwash deposits along Mackinaw Valley pro-vide part of the village supply at Mackinaw and were formerly utilized at Eureka.
In general the most favorable areas for developing these aquifers are on the terraces themselves. The terrace margins and the areas shown as alluvium in plate 2 should be avoided if possible.
SUBSURFACE R E L A T I O N S
A generalized geologic column of the glacial deposits in the Peoria region, as re-vealed from a study of outcrops and well cuttings, is shown in figure 5.
Variations in the stratigraphic succession and the relations of the deposits to the bed-rock surface and present topography are shown in the graphic cross-sections, plate 3. It is evident that the Peoria region had a complex Pleistocene history of successive glacial and interglacial stages, causing the disruption of the old drainage of preglacial times, new Systems of drainage for each interglacial stage, and repeated Alling and re-excavation along the general course of the ancient Mississippi Valley. This resulted in a complex of deposits which vary both vertically and horizontally. There was order, however, in the chronology of these events and they are summarized in the Appendix.
It is apparent from a study of the cross-sections that some alternative interpreta-tions are possible and, because of the complex relations, certain conclusions are considered to be tentative. The same general succession, however, has been encountered so often in borings in the region and in adjoining
34 GROUNDWATER IN THE PEORIA REGION
areas, that the following broad relations appear to be well substantiated:
1. There is a widespread and thick de-posit of sand, called the Sankoty sand, which rests on bedrock and originally filled the ancient Mississippi bedrock valley up to elevations of more than 500 feet above sea-level.
2. The sand is overlain by Illinoian and probably Kansan drift (pl. 3, cross-section C-C' ) .
3. A broad valley was eroded in Illinoian drift sheet and down into the Sankoty sand during the Sangamon interval as shown by subsurface relations in the northern half of the region (pl. 3, cross-section A-A', B-B' and C-C') .
4. The valley was largely buried by Wisconsin drift of the Tazewell substage but re-excavated so that outwash deposits of the later Cary and Mankato substages now occur at low elevations within the present valley.
SANKOTY SAND
Description.—The Sankoty sand is named from the Sankoty water field north of Peoria, in which area numerous wells pene-trate the deposit and provide most of the water for the city supply.
The sand differs from most glacial sands and has a number of distinctive charac-teristics which are readily recognized in sample cuttings. In its most typical aspect the sand is composed of 70 to 90 percent quartz grains of which 25 percent or more are pink, rounded, and polished. The pink color appears to be due largely to inclusions of hematite. Many grains are pitted and frosted as well as polished. Polishing is not restricted to rounded grains. The tex-ture is usually medium-grained but varies from silty fine sand to coarse gravelly sand. Beds of gravel, silt, and, in places, thin clays are associated with the sand. In many places the sand has ferruginous coatings on the grains and ferruginous cement, giving a yellow or reddish color. Abundant humus is present in some sections and in places ex-tends through the entire thickness of the deposit. Exclusive of quartz, the grains
are composed of crystalline rocks, quartzite, dolomite, and chert in about that order of abundance, indicating derivation from a pre-Cambrian terrain. The crystalline rocks include fragments of granite, rhyolite, dio-rite, basalt, gneiss, and greenstone. The deposit is commonly oxidized and in places the upper portion has been leached.
The thickness of the sand varies greatly because of the irregular bedrock surface on which it was deposited and the uncon-formity at the top. Along Illinois Valley the thickness varies from about 50 to 150 feet, and under the uplands, over buried Valleys, it may reach a possible maximum of almost 300 feet, although the average thickness would be closer to 100 feet.
The composition of the deposit and over-lying deposits is shown in the following re-cord based on the study of samples from a well at the Sankoty water field:
M. Ebert and Co.—Peoria Water Works Co., NW. ¼, SE. ¼, NW. ¼, sec. 15, T. 9 N., R. 8 E.,
Peoria Co. Sample set No. 6521 studied by K. O. Emery and
Leland Horberg Elevation—495 feet Thick-
ness Depth Feet Fect
Recent alluvium Soil and silt with organic material. 10 10 Silt, Sandy, pebbly, buff, contains
angular pebbles 60 70 Pleistocene series
Wisconsin outwash (?) Sand and gravel, buff 15 85
Sankoty sand Sand, pebbly, clean, contains
numerous pink polished grains 20 105 Sand, as above, and gravel 20 125 Sand, pink 12 137
Pennsylvanian System Siltstone
The distribution of the sand in the Peoria region, as in adjoining areas, is determined by the bedrock topography, and occurrences are limited to the ancient Mississippi Valley and the Pekin-Sankoty Channel. Outside the area the sand has been recognized in cuttings from wells along the valley south as far as southern Tazewell County and north to the big bend at Hennepin and thence west as far as Prophetstown in southern Whiteside County. A some-what different deposit containing more
GEOLOGY 35
dolomite particles, but occupying a similar stratigraphic position, has been recognized along the buried bedrock Valley of ancient Rock River which joins the Mississippi Valley in central Bureau County. It ap-pears from the evidence now available that the sand constitutes a widespread and prob-ably continuous fill along the deep bedrock Valleys of the ancient Mississippi drainage system and may even extend northward into Wisconsin and Minnesota.
The origin and age of the deposit is un-certain and involves several unsolved Problems. As indicated by the well record at Washington (pl. 3, cross-section C - C , well 6) and by several sample-study records in adjoining areas, the sand underlies Kansan drift and is thus early Pleistocene or pre-glacial in age. The uniform composition, oxidation, and humus content of the deposit indicate nonglacial derivation and a source in the Paleozoic sandstones and crystalline rocks of Wisconsin and Minnesota. Nevertheless, the causes for the change from valley erosion to aggradation are most logically ascribed to changes in drainage conditions accompanying glacia-tion. It is suggested, therefore, as a work-ing hypothesis that alluviation of the ancient Mississippi Valley to an elevation of possibly 560 feet was initiated by the onset of Nebraskan glacial conditions and continued into Aftonian time. A relatively high base-level seems to be recorded until the Sanga-mon interglacial erosion, as the available elevations of the top of the sand where it underlies Illinoian drift are above 500 feet along both the ancient Mississippi and Pekin-Sankoty Channels. The possible alternative that a very narrow pre-Illinoian valley was excavated to a lower level along the present Valley between Peoria and East Peoria cannot be disproved. The slope of the Sangamon piain (flg. 7 ) , however, favors the interpretation that this section of the valley was established on the Illinoian drift and is therefore younger.
Groundwater conditions.—The Sankoty sand is the most extensive glacial aquifer in the region and one of the largest in the State. Municipal supplies, which are large-
ly from the Sankoty sand, are secured at Chillicothe, Peoria, Pekin, and Washington and probably also at Henry, Lacon, Morton, and Mackinaw. There is additional production from industrial wells in Southwest Peoria and Pekin and from numerous domestic wells throughout the region. Large undeveloped groundwater reserves are present along the ancient Mississippi Valley, and significant additional supplies may be obtain-able along the Pekin-Sankoty channel.
The most favorable locations for future development are determined by the thick-ness of the deposit and by variations in its permeability. The areas of maximum thickness are outlined approximately by contours along the deeper parts of the bedrock Valleys (fig. 6 ) , but variations in permeability have no ascertainable system-atic distribution. It is desirable, therefore, even in areas where geologic conditions ap-pear favorable, that the selection of specific locations be preceded by electrical earth-resistivity surveys and test drilling. The primary problem is one of determining the localities in which the sand has highest permeabilities.
Under the uplands the aquifer is confined below relatively impervious till and is in-dependent hydrostatically from overlying aquifers. Because the sand occurs along the ancient Mississippi Valley at relatively low elevations about 500 feet above sea-level, the hydrostatic levels are low. Along the valley, where the sand is overlain by Wisconsin outwash and recent alluvium, the aquifer is largely unconfined and water-levels coincide closely with the river level.
The regional extent of the sand along the ancient Mississippi Valley and its tributaries above Peoria is of great significance from the Standpoint of the large recharge area that is provided. This condition might have been anticipated, as the high produc-tivity of the Sankoty aquifer near Peoria could hardly be explained on the basis of a local deposit. It is believed that the im-portant recharge areas are to be found along the present valley north to the big bend at Hennepin, in the Green River lowland in Bureau, Henry, and Whiteside counties,
36 GROUNDWATER IN THE PEORIA REGION
and possibly along the upper Mississippi Valley. At most places in these areas the sand is overlain directly by permeable de-posits of outwash and alluvium. Minor recharge probably takes place through the drift sheets on the uplands by way of Wisconsin and Illinoian sands and gravels and by seepage along the top of the bedrock or even through bedrock formations.
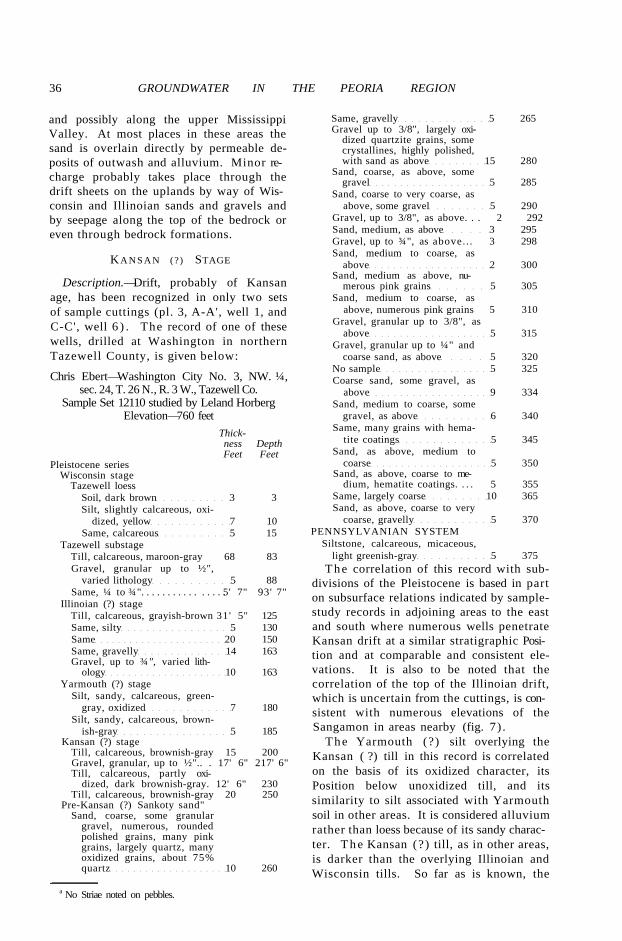
KA N S A N (?) STAGE
Description.—Drift, probably of Kansan age, has been recognized in only two sets of sample cuttings (pl. 3, A-A', well 1, and C-C', well 6 ) . The record of one of these wells, drilled at Washington in northern Tazewell County, is given below:
Chris Ebert—Washington City No. 3, NW. ¼, sec. 24, T. 26 N., R. 3 W., Tazewell Co.
Sample Set 12110 studied by Leland Horberg Elevation—760 feet
Thick-ness Depth Feet Feet
Pleistocene series Wisconsin stage
Tazewell loess Soil, dark brown 3 3 Silt, slightly calcareous, oxi-
dized, yellow 7 10 Same, calcareous 5 15
Tazewell substage Till, calcareous, maroon-gray 68 83 Gravel, granular up to ½",
The correlation of this record with sub-divisions of the Pleistocene is based in part on subsurface relations indicated by sample-study records in adjoining areas to the east and south where numerous wells penetrate Kansan drift at a similar stratigraphic Position and at comparable and consistent ele-vations. It is also to be noted that the correlation of the top of the Illinoian drift, which is uncertain from the cuttings, is consistent with numerous elevations of the Sangamon in areas nearby (fig. 7) .
The Yarmouth (?) silt overlying the Kansan ( ?) till in this record is correlated on the basis of its oxidized character, its Position below unoxidized till, and its similarity to silt associated with Yarmouth soil in other areas. It is considered alluvium rather than loess because of its sandy character. T h e Kansan (?) till, as in other areas, is darker than the overlying Illinoian and Wisconsin tills. So far as is known, the
GEOLOGY 37
gravel penetrated in the well may be a small local deposit.
In addition to the subsurface occurrences of old drift noted above, probable old drift was described by J. A. Udden17 from ex-posures west of Illinois River along La-marsh Creek in the NE. ¼ of sec. 10 and near the NE. corner of sec. 3, T. 7 N., R. 7 E., Peoria County. The drift is described as including boulder clay, silt, sand, and sandy gravel.
Groundwater conditions.—Some ground-water may be obtainable locally from sand and gravel in the Kansan (?) drift, but the deposit as a whole is not continuous enough to warrant consideration as an im-portant aquifer.
ILLINOIAN STAGE
Description.—Illinoian drift is encoun-tered in most wells which go through the Wisconsin drift and is recognized in numer-ous well records. The character of the drift and its relation to overlying deposits are also revealed in surface exposures. A measured section of the deposits at the well-known Farm Creek locality east of Peoria is summarized below:
Farm Creek exposure alone the S. line SE. ¼, sec. 30, T. 26 N., R. 3 W., Tazeweil County18
Iowan loess, calcareous, bluish-green on fresh surface, fossiliferous, peaty and woody 6
Sangamon interglacial stage Soil, leached, dark with flakes of car
bon, wood fragments, loessial in tex-ture 1-1½
17 Op. cit., pp. 52-53. 18 Leighton, M. M., A notable type Pleistocene sec t ion—
the Farm Creek exposure near Peoria. Illinois: Jour. Geol., vol. 34, pp. 167-174, 1926; Illinois Geol. Survey Rept. Inv . 11, pp. 3-9, 1926; The Peorian loess and the Classification of the glacial drift sheets of the Mississippi Valley: Jour. Geol., vol. 39, pp. 45-53, 1931.
Loesslike silt, leached, grayish-yellow to brown with carbon specks, un-stratified 5-6
Gumbotil, leached, oxidized, chocolate brown to red, tenacious, siliceous pebbles 4
Till, calcareous, grayish, limestone pebbles 41
Naturally in well cuttings many of the details shown by the above section cannot be recognized, but in most sample sets the essential relations are clear. Because of the mixing of materials in drilling and the 5-foot interval at which most samples are taken, the thinner units cannot always be identified. This is particularly true of the Iowan loess and the late Sangamon loess. However, the maroon-tinted Wisconsin till, the dark-colored Sangamon soil, the leached and oxidized Illinoian gumbotil, and the underlying unaltered gray Illinoian till can usually be distinguished in sample cuttings. In drillers' records the Sangamon soil is commonly recognized and logged as "old soil," "peat," "black muck," or "dark clay," and the underlying weathered till as "yellow hardpan," "yellow clay," or "green clay." In places where unaltered Wisconsin till rests on eroded unaltered Illinoian till, the two tills cannot be distinguished in drillers' logs, and it is often impossible to do so from sample cuttings of a given well, but nearby wells may furnish the clue.
The Illinoian till, in contrast to the overlying Wisconsin till, is more compact, but appears to contain more sand and silt, has a darker gray color, and is without the maroon tint found in the younger till. Thicknesses of the till-sheet vary from 0 to 150 feet, the average thickness east of the river being about 100 feet (pl. 3 ) .
Sand and gravel, ranging in thickness from a few inches to as much as 50 feet, occur as beds and lenses in the till and commonly are encountered near the middle or at the base of the drift-sheet. A rather continuous deposit appears to be present over a wide area in eastern Tazeweil County. The deposits vary in composition from silt and silty sand to clean gravel. They differ from the Sankoty sand in having a
38 GROUNDWATER IN THE PEORIA REGION
FIG. 7.—Contour map of the Sangamon surface in the Peoria region.
GEOLOGY 39
greater variety of types of rocks and miner-als with lower percentages of quartz grains.
Groundwater conditions.—The Illinoian aquifers are the sources of supply for numerous domestic wells in the eastern part of the area, and in places important quantities of water may be obtainable from them. More data are needed from test drilling and resistivity surveys before favor-able localities can be definitely indicated. It is probable that the so-called "middle sand" in the vicinity of Washington is of Illinoian age, as distinguished from an "upper sand" at the base of the Wisconsin and a "lower sand" which is the Sankoty. The only municipal supply de-rived from an Illinoian aquifer is possibly that at Washburn in northern Woodford County.
SANGAMON DEPOSITS AND T H E
PRE-W ISCONSIN SURFACE
Sangamon deposits consisting largely of soil and loess are preserved below the Wisconsin drift throughout most of the south-eastern part of the region and provide an important datum in subsurface studies. The surface of the Sangamon piain in this area and the large pre-Wisconsin valley eroded below it farther north are shown by a generalized contour map in figure 7. As shown by this map, the piain slopes re-gularly southwestward from an elevation of about 680 feet above sea-level in north-eastern Tazewell County to elevations slightly less than 600 feet near the Illinois River. The piain crosses the ancient Mississippi bedrock valley without interruption and lowest elevations are along the present river. These relations indicate that essen-tially the present course of Illinois River was established on the Illinoian drift-sheet.
The ancient Mississippi Valley of Sangamon time, which is revealed by subsurface data in the northern half of the region, appears to have been eroded to a level of about 470 feet or 130 to 200 feet below the adjoining till-plain (pl. 3, A-A', B-B', and C-C'). In the vicinity of Chillicothe the valley was probably over 10 miles wide and in places was eroded through the Illinoian
drift-sheet and into the underlying Sankoty sand. This interpretation is based on sample-study records in which the maroon-tinted Wisconsin till rests on thin Illinoian drift or directly on Sankoty sand at abnor-mally low elevations. The trend of the valley in Sangamon time corresponds rather closely with the present valley (fig. 7 ) , and it seems likely that present drainage was established along a sag on the Wisconsin drift-sheet above the older valley.
From the evidence available it thus appears that the preglacial bedrock valley of the Mississippi was partially re-excavated at least twice and probably three times dur-ing the Pleistocene: (1) by the ancient Mississippi during the Sankoty-Illinoian in-terval, (2) by the ancient Mississippi during the Sangamon interglacial stage, and (3) by the Illinois River in post-Wisconsin time.
W I S C O N S I N STAGE
Description.—As noted previously, the Wisconsin till is characterized by its ma-roon-gray color and a less sandy texture than the underlying Illinoian till. A differ-ence in coherence is also indicated by drillers who commonly log the Wisconsin till as "clay" and the older tills as "hardpan" or "hard clay." Thicknesses of the drift-sheet depend largely on the surface topography and reach a maximum of more than 250 feet under the highest moraines. The average thickness is about 125 feet.
Lenses and local beds of sand and gravel of variable thickness occur irregularly within the drift and a rather persistent deposit appears to be present at its base (pl. 3 ) . The larger deposits within the drift probably mark boundaries between morainic members and are most common along the outer edges of the individual moraines. The deposits contain a variety of rocks and minerals which were derived largely from sedimentary rocks, although igneous and metamorphic fragments are numerous. They vary in texture from silty sand to coarse gravel.
Groundwater conditions.—A large Proportion of the domestic supplies in the
40 GROUNDWATER IN THE PEORIA REGION
northern and eastern parts of the region are secured from Wisconsin aquifers, and the municipal supply at Metamora is from the basal sand and gravel. Most of the wells are less than 100 feet in depth and a num-
ber are shallow water-table wells in the upper part of the drift. It is improbable that large supplies would be obtainable ex-cept in local areas.
CHAPTER 6
F U R T H E R D E V E L O P M E N T OF G R O U N D -WATER S U P P L I E S
The geologic relations described in pre-ceding chapters have a direct bearing on the further development of groundwater sup-plies in the region, and from them the following major conclusions are reached:
1. The deep bedrock aquifers are capable of producing important quantities of water but are of very limited use because of the high mineral content of their waters.
2. The most important aquifer in the region is the Sankoty sand, which forms a thick fill in the ancient Mississippi bedrock valley and its tributaries; it is a regional aquifer with a large recharge area in north-ern Illinois and for a large part of the region is untested and undeveloped as a source of groundwater.
3. The Wisconsin valley-train deposits along the present Illinois Valley are next in importance and in many places occur as channel fills within the Sankoty sand body and are recharged through it.
4. In local areas important supplies may be obtainable from sand and gravel deposits at the base of the Wisconsin drift or within the Illinoian drift.
The various geologic conditions deter-mining the occurrence of groundwater in the region are shown by maps in figures 6 and 8. These maps indicate that favorable conditions for small to large supplies exist throughout most of the eastern half of the region and that large supplies may be obtainable from Sankoty sand along the ancient Mississippi bedrock valley, the Pekin-Sankoty bedrock channel, and from Wisconsin outwash deposits along the present Illinois Valley. It is to be emphasized, however, that the maps show general conditions, and that plans for development of large supplies at specific locations should be preceded by evaluation of the records of nearby wells and possibly by electrical earth-resistivity surveys and test drilling.
P E O R I A M E T R O P O L I T A N A R E A
PRESENT SUPPLIES
The principal areas of present municipal and industrial supplies extend southward along the west side of the Illinois River from the Sankoty field on the north to south-west Peoria (fig. 8 ) . In these areas wells were developed early in the history of the city and their locations were determined by geographic factors rather than a knowledge of the geologic conditions. It was a fortu-nate circumstance that the Sankoty and Wisconsin valley-train aquifers were avail-able to contribute to industrial growth. As indicated by figure 8, the principal aquifer in the Sankoty field and possibly in the southwestern tip of the industrial area is the Sankoty sand (see page 35). In the intervening area of higher bedrock between the central industrial area and East Peoria, Sankoty sand has not been recognized, and Wisconsin outwash deposits appear to be the main source of supply. It is noteworthy, however, that the outwash deposits are in contact with Sankoty sand on the north and east and probably are recharged through it. On the basis of the areas shown in figure 8 and production figures of the State Water Survey,20 it is estimated that the average daily pumpage from the two principal aquifers for the year 1945 was as follows:
Sankoty sand and Wisconsin outwash Sankoty field area 2 1 . 1 % Southwest industrial area 40.2%
Wisconsin outwash Industrial area 38 .7%
AREAS FAVORABLE FOR DEVELOPMENT
Areas recommended for possible testing and development on the basis of geologic conditions and electrical earth-resistivity
20 Personal communication.
[41]
42 GROUNDWATER IN THE PEORIA REGION
FIG. 8.—Areas near Peoria in which groundwater conditions are favorable.
GEOLOGY 43
FIG. 9.—Bedruck surface near Peoria.
FIG. 10.—Graphic logs of shallow wells in northwest Peoria and vicinity.
GEOLOGY 45
surveys are indicated by numerals in figure 8. The numerals are used for reference only and do not necessarily indicate the relative importance of the areas.
Area I.—This area lies along the Illinois Valley south from the vicinity of Kickapoo Creek and represents a part of the exhumed section of the Pekin-Sankoty channel. The deposits in the area have a maximum thick-ness of about 140 feet and include alluvium and Wisconsin outwash overlying variable thicknesses of Sankoty sand. The outwash gravels appear to be thickest to the north, where favorable conditions were indicated by the resistivity survey (fig. 8 ) , and to thin southward into sections having greater thicknesses of overlying clay and silt. The Sankoty sand varies in composition from fine sand to gravel. An unusually coarse gravel facies was penetrated in test wells of the Commercial Solvents Corporation in sec. 19, T. 8 N., R. 8 E. Further develop-ments should be preceded by test drilling in the area of high resistivities and along the deep part of the bedrock channel (fig. 9 ) .
Area II.—The area includes the buried section of the Pekin-Sankoty channel west and north of the main part of the city in which Sankoty sand is overlain by thick glacial drift. The sand reaches a maximum thickness of about 150 feet and seems to be composed largely of sand with minor amounts of silt and gravel (fig. 10). As most of the area remains to be tested, it constitutes an important potential source of supply. The most favorable conditions probably exist along the deep part of the bedrock channel and in the Kickapoo Creek re-entrant.
Area III.—The area represents an ex-tension of the Sankoty field aquifer north-ward along the Illinois Valley and north-westward under the bluffs. Along the valley, Sankoty sand rests on bedrock and is overlain by Wisconsin outwash or till and alluvium (pl. 3, wells 3 and 4, C-C') . The deposit thickens away from the river and reaches its maximum thickness under the bluffs where it is overlain by thick Wisconsin drift. The productivity of the aquifer at Sankoty field is well known from numer-ous wells and with proper spacing a further
extension northward seems feasible. Favorable areas are indicated by the earth-re-sistivity survey (fig. 8) , and it is probable that similar conditions exist to the north and west.
Area IV.—This area is situated east of Illinois River and extends north from the vicinity of Tenmile Creek. Sankoty sand overlain by Wisconsin outwash and alluvium is present along the valley and extends under the till sheets forming the bluffs to the east (pl. 3, C - C ) . Near the river the Sankoty sand may have been removed during erosion of ,the present valley. The favorable geologic conditions indicated by the resistivity survey appear to continue north and east for many miles. The area is un-developed and additional subsurface data are needed to establish the most desirable locations.
Area V.—The area is situated east of the river and extends north from Farm Creek. Along Farm Creek Valley the Sankoty sand is overlain by alluvium and Wisconsin outwash and possibly in places by thin Illinoian till. On the upland it is overlain by Wisconsin, Illinoian, and possibly older drift (pl. 3, D - D ' ) . The available data indicate that the sand may reach a possible maximum thickness of about 130 feet, but very little is known about its composition. Favorable conditions along Farm Creek are indicated by resistivity surveys (fig. 8) . Under the adjoining uplands resistivity values appear to be masked by thick till deposits and the favorable area north of Farm Creek is extended beyond that of the resistivity finding on the basis of subsurface data.
REGION OUTSIDE T H E PEORIA
METROPOLITAN AREA
The Sankoty sand within the ancient Mississippi and Pekin-Sankoty bedrock Valleys combined with the outwash deposits along the present Illinois Valley underlie an extensive area of large groundwater re-serves. Additional supplies may also be obtainable from deposits along Wyoming and Kickapoo Creek bedrock Valleys and from buried glacial sands in the eastern part of the region (fig. 6 ) . In a number
46 GROUNDWATER IN THE PEORIA REGION
FIG. 11.—Areas covered by electrical earth-resistivity surveys in the Peoria region.
of places resistivity surveys have indicated favorable localities in these and other areas, as shown in figure 11. Over most of the
area, however, additional data would be needed to substantiate the conclusions based on regional relations.
GEOLOGY 47
APPENDIX
L IST O F D E E P W E L L S
1. W. H. Gray Co.—Henry City, 1886. Near NE. corner, NW. 1/4, SE. 1/4, sec. 16. T. 13 N., R. 10 E., Marshall County. Elevation— 491. Ends in Galena dolomite at a depth of 1335 feet. Sample set 195 studied by J. A. Udden and H. X. Bay.
2. M. Ebert Co.—Sarah Ditering, 1941. Near NW. corner, sec. 10, T. 12 N., R. 7 E., Stark County. Elevation—675±. Ends in Burlington limestone at depth of 360 feet. Driller's record.
3. Mr. Dean—Wyoming City, 1902. Near NE. corner, NW. 1/4, NW. 1/4, sec. 1, T. 12 N., R. 6 E., Stark County. Elevation—710±. Ends in St. Peter sandstone at depth of 1557 feet. Incomplete record.
4. Toulon City No. 1, 1911. 1230 feet N. and 1300 feet E. of SW. corner, sec. 19, T. 13 N., R. 6 E., Stark County. Elevation—738. Ends in St. Peter sandstone at depth of 1449 feet. Incomplete record.
5. Varner Well Drilling Co.—Toulon City No. 2, 1942. 20 feet from No. 1 well. Elevation—738. Ends in Maquoketa shale at depth of 780 feet. Sample set 8441 studied by M. P. Meyer Supplements driller's record.
6. Sewell Well Co.—Princeville City No. 1, 1914. Near SE. corner, sec. 13, T. 11 N., R. 6 E., Peoria County. Elevation—745. Ends in St. Peter sandstone at depth of 1560. Sample study by T. E. Savage.
7. Thorpe Well Co.—Princeville City No. 2, 1938. 420 feet N. and 260 feet W. of SE. corner, sec. 13, T. 11 N., R. 6 E., Peoria County. Elevation—745. Ends in Galena dolomite at depth of 1342 feet. Sample set 3001 studied by M. B. Buhle.
8. John Deitrick and Co.—Banta No. 1. Oil test, SW. 1/4, NW. 1/4, SW. 1/4, sec. 26, T. 28 N., R. 2 W., Woodford County. Elevation—740. Ends in Niagaran dolomite at depth of 893 feet. Driller's record and a few sample cuttings studied by L. E. Work-man.
9. Peoria Mineral Co.—Hart Lee, drilled about 1900. 1500 feet E. and 750 feet S. of the NW. corner, sec. 23, T. 26 N., R. 4 W., Tazewell County. Elevation—475. Flow-ing well. Ends in Galena dolomite at depth of 1497 feet. Driller's record.
10. Grant Street Well (now La Tourneau Co.), drilled sometime between 1868 and 1888. 500 feet E. and 2180 feet S. of NW. corner,
sec. 2, T. 8 N., R. 8 E., Peoria County. Elevation—450±. Flowing well, originally an oil test. Total depth variously reported as 1100 to 1200 (Galena dolomite) and 1600 to 1700 (St. Peter sandstone). Incomplete record.
11. Central Park well (now Illinois Power and Light Co.), 1875. 700 feet W. and 700 feet S. of NE. corner, sec. 3, T. 8 N., R. 8 E., Peoria County. Elevation—475 feet. Flowing well now capped. Ends in Niagaran dolomite at depth of 915 feet. Driller's record.
12. Glen Oak Park well. 900 feet E. and 200 feet S. of center, sec. 34, T. 9 N., R. 8 E., Peoria County. Elevation—534. Formerly flowed. Ends in Niagaran dolomite at depth of 1040. Samples examined by J. A. Udden.
13. Gray-Milaeger Well Co.—Glen Oak Park Swimming Pool, 1923. 200 feet S. and 500 feet E. of NW. corner, NE. 1/4, sec. 3, T. 8 N., R. 8 E., Peoria County. Elevation— 515. Flowing well. Ends in Niagaran dolomite at depth of 1023 feet. Driller's record.
14. Dean Sulphur Water Well, Spring Street, Peoria. NW. 1/4, sec. 3, T. 8 N., R. 8 E., Peoria County. Elevation—495. Ends in Niagaran dolomite or Devonian limestone at depth of 875 feet. Probably flowed. Old record compiled by A. L. Campbell.
15. Sulphur Water House Bathing Co., 1885. 950 feet S. and 1030 feet W. of NE. corner, sec. 9, T. 8 N., R. 8 E., Peoria County. Elevation—485. Flowing well. Ends in Niagaran dolomite at depth of 878 feet. Driller's record.
16. Voris or Bailey's well, 1860. 650 feet N. and 1000 feet E. of the SW. corner, NW. 1/4, sec. 33, T. 26 N., R. 4 W., Tazewell County. Elevation—455. First flowing well in Peoria region, now capped. Ends in Niagaran dolomite at a depth of 734 feet. Driller's record.
17. Colean Factory. NW. 1/4, NE. 1/4, sec. 32, T. 26 N., R. 4 W., Tazewell County. Elevation—453. Flowing or capped. Ends in Keokuk-Burlington dolomite at depth of 320 feet. Incomplete record.
18. Carter brickyard well. NE. 1/4, NW. 1/4, NE. 1/4, sec. 6, T. 25 N., R. 4 W., Tazewell County. Elevation—465. Flowing or capped. Ends in Keokuk-Burlington dolomite at depth of about 370 feet. Incomplete driller's record.
48 GROUNDWATER IN THE PEORIA REGION
19. Gray-Milaeger Co.—Logan Field Swimming Pool, 1922. 500 feet S. and 1400 feet E. of center, sec. 18, T. 8 N., R. 8 E., Peoria County. Elevation—535. Flowing well. Ends in crevice in Galena-Platteville dolo-mite at depth of 1297 feet. Driller's record.
20. C. W. Hicks—Acme Harvester Co. Near center, E. 1/2, sec. 25, T. 8 N., R. 7 E., Peoria County. Elevation—460. Flowing or capped. Ends in Keokuk-Burlington dolo-mite at depth of 266 feet. Driller's record.
21. Evans Co., 1933-34. 400 feet W. of center, sec. 36, T. 8 N., R. 7 E., Peoria County. Elevation—460±. Flowing or capped. Ends in Keokuk-Burlington dolomite at depth of 489 feet. Driller's record.
22. J. P. Miller and Co.—Illinois Asylum for Incurable Insane, 1903. 500 feet N. of SE. corner, sec. 26, T. 8 N., R. 7 E., Peoria County. Elevation—605±. Water came to within 13 feet of surface. Ends in St. Peter sandstone at depth of 1864 feet. Driller's record.
23. M. Ebert and Son—Pleasant Valley School, 1936. Near center of N. 1/2, SW. 1/4, sec. 1, T. 8 N., R. 7 E., Peoria County. Elevation—550. Probably ends near top of Keokuk-Burlington dolomite at depth of 365 feet. Driller's record.
24. A. M. Myers—Phillips No. 1 oil test, 1923. NW. corner, NE. 1/4, NE. 1/4, sec. 2, T. 8 N., R. 7 E., Peoria County. Elevation— 500±. Flowing water in Niagaran dolomite. Ends in Maquoketa shale at depth of 1160 feet. Driller's record.
25. C. P. Brant and Co.—Peoria County Home, 1918. SW. 1/4, NE. 1/4, sec. 9, T . 8 N , R. 7 E., Peoria County. Elevation—690. Ends in St. Peter sandstone at depth of 1755 feet. Driller's record.
26. Blue Bell Oil Co.—Kyle No. 1 oil test, 1939. 444 feet S. and 376 feet E. of NW. corner, SW. 1/4, NW. 1/4, sec. 17, T . 8 N., R. 6 E., Peoria County. Elevation—700. Ended in Niagaran dolomite at depth of 1010 feet. Sample set 3829 studied by I. T. Schwade.
27. Kickapoo Development Co.—Super No. 1 oil test, 1928. Sec. 10, T. 9 N., R. 5 E., Peoria County. Ends in Burlington chert at depth of 430 feet. Sample set 729 studied by L. E. Workman.
28. Elmwood City, 1896. 2000 feet N. and 450 feet E. of SW. corner, sec. 8, T. 9 N. R. 5 E., Peoria County. Elevation—620. Ends in St. Peter sandstone at depth of 1498 feet. Incomplete record.
29. Algona Oil Co.—Charles Cramer No. 1 oil test, 1939. 330 N. and 330 feet W. of SE.
corner, SW. 1/4, sec. 27, T. 8 N., R. 5 E., Peoria County. Elevation—640. Ends in St. Peter sandstone at depth of 1560 feet. Sample set 3926 studied by F. E. Tippie.
30. Hanna City Oil and Gas Co.—Sonnemaker No. 1, 1926. 600 N. and 1600 feet E. of SW. corner, sec. 28, T. 7 N., R. 6 E., Peoria County. Elevation—510. Ends in Blooming-ton chert at depth of 315 feet. Sample set 640 studied by L. E. Workman.
31. C. P. Brant and Co.—Glasford City, 1917. NW. 1/4, NW. 1/4, SW. 1/4, sec. 22, T. 7 N., R. 6 E., Peoria County. Elevation— 614. Ends in St. Peter sandstone at depth of 1685 feet. Driller's record.
32. Pekin City Mineral Springs Park No. 1. 1250 feet S. and 1250 feet W. of NE. corner, sec. 2, T. 24 N., R. 5 W., Tazewell County. Elevation—525. Flowing or formerly flowed. Ends in Devonian or upper Silurian strata at depth of 990 feet. Record from memory, Thomas Cooper.
33. Chris Ebert Co.—Pekin Mineral Springs Park No. 2, 1916. Close by No. 1 well. Elevation—525. Originally flowed. Ends in Devonian or upper Silurian at depth of 1000 feet. Driller's record.
34. Turner-Hudnut Co.—W. B. Aydelott Salt Well, before 1916. 700 feet W. and 500 feet N. of SE. corner, sec. 20, T. 24 N., R. 4 W., Tazewell County. Elevation—685. Ends in Keokuk-Burlington dolomite at depth of 757. Driller's record.
35. O'Brian well, 1876. One-third mile W. of NE. corner, sec. 14. T. 25 N., R. 4 W., Tazewell County. Elevation—738. Probably ends in Maquoketa shale at depth of 1442 feet. Incomplete driller's record.
36. Morton Oil and Gas Co.—William Strunk No. 1 oil test, 1939. Near center, sec. 18, T. 25 N., R. 3 W., Tazewell County. Elevation—727. Ends in Maquoketa shale at depth of 1385 feet. Sample set 3353 studied by J. N. Payne.
37. R. Bartelmay Co.—Mathis No. 2 oil test, 1941-43. 534 feet N. and 491 feet E. of SW. corner, NW. ¼, SW. ¼, sec. 24, T. 25 N., R. 3 W., Tazewell County. Elevation— 785. Ended in Galena dolomite at depth of 1798 feet as of 1944. Sample set 8243 studied by Dorothy Speziale.
38. H. V. House Co.—W. H. Greening No. 1 oil test, 1939. NW. 1/4, NW. 1/4, SE. 1/4, sec. 28, T. 24 N., R. 2 W., Tazewell County. Elevation—675. Ends in Niagaran dolomite at depth of 1230 feet. Sample set 3744 Studied by F. E. Tippie.
GEOLOGY 49
SUMMARY OF P L E I S T O C E N E HISTORY
A G E S U B - A G E GEOLOGICAL E V E N T S
Recent Deposition of flood-plain alluvium, alluvial fans, and dune sand; erosion of minor Valleys.
Manka to and late Cary Lake Chicago Outlet River eroded down and deposited lower terrace 460 feet above sea-level.
Cary Kankakee torrent eroded 480- and 520-foot terraces on the higher of which the greater pa r t of Peoria is built.
Wisconsin
Tazewell
Marseilles moraine Farm Ridge moraine Cropsey moraine Glacial Lake Illinois Normal moraine Metamora moraine Bloomington moraine 600-foot outwash terrace fronting
moraine at Peoria Leroy moraine
Glacial Lake Kickapoo Shelbyville moraine
Iowan Loess deposition
Sangamon d. Weather ing and soil and peat formation. c. Deposition of La te Sangamon loess. b. Weather ing and soil formation; Valley erosion. a. Ancient Mississippi occupies present course of Illinois River
between Peoria and E. Peoria.
Illinoian Deposition of Illinoian drift.
Ya rmou th Weather ing and soil formation; Valley erosion.
Kansan Deposition of Kansan drift.
Aftonian ? Erosion of Valleys in Sankoty sand and bedrock.
Nebraskan ? Sankoty sand deposition.
Preglacial Erosion of ancient Mississippi bedrock Valley and its t r ibutary bedrock Valleys.
PART 2
H Y D R O L O G Y
BY
MAX SUTER
Head, Engineering Research Sub-division
STATE WATER SURVEY
ABBREVIATIONS
MSL Mean Sea Level Elevation, 1929 adjustment ft foot or feet gpm gallons per minute mgd million gallons per day cfs cubic feet per second hr hour (hours) ppm parts per million
DATUM PLANES
ELEVATION OF ZERO OF GAGE OF WEATHER BUREAU Peoria:
Memphis datum 435.50 ft. Mean sea-level 1914 adjustment 428.50 ft. Mean sea-level 1929 adjustment 428.39 ft. Peoria city datum 22.28 ft.
Pekin: To August 31, 1930 (1929 adjustment) 431.14 ft. Since September 1, 1930 (1929 adjustment) 433.07 ft.
CHAPTER 7
I N T R O D U C T I O N
AREA
AN INTENSIVE investigation of water resources in the Peoria-Pekin area was
started in 1940. Part 2 contains the review and summary of the work done and con-clusions reached by January 1, 1946. The investigation is continuing and supplemen-tary reports will be prepared as the study progresses.
The area studied is located in central Illinois on the Illinois River and is about 160 miles below Chicago and 200 miles above St. Louis as measured along the water route. The Peoria-Pekin area is a highly industrialized district requiring an enormous volume of water. The industrial areas are surrounded by the fertile agricultural prairie lands of the com belt.
In 1940 the population of the 32 square-mile area was about 180,000 of which 105,087 resided in the city of Peoria and 19,407 in the city of Pekin, located nine miles downstream from Peoria. The total population in 1946 was estimated to be about ten percent greater than it was in 1940.
HISTORY
The Peoria-Pekin area has long enjoyed an enviable reputation for its abundant supply of potable water obtained by vertical wells from shallow sand and gravel deposits that serve as groundwater reservoirs. The uniform low temperatures and satisfactory mineral quality of the water have been at-tractive to many industries. With the con-tinued development and exploitation of this natural resource, a shortage became ap-parent in certain limited areas and the Situation became sufficiently critical in the latter part of 1940 to Warrant a detailed study of the problem. The State Water Survey was requested to assist in solving this problem which is of vital importance to the future welfare of the City of Peoria and neighboring communities and to the State of Illinois.
As the Situation became known, several practices for the conservation of groundwater were voluntarily adopted by some of the industrial users. These are (a) the use of cooling towers and recirculating Systems, and (b) the use of Illinois River water by a few of the larger industries, especially during the winter season when low water temperatures are ideal for cooling and condensing purposes. Despite these practices the groundwater Situation became progressively worse as withdrawal continued to exceed the natural replenishment.
Other methods must be devised to obtain a better balance between replenishment and use of groundwater. The current outlook is uninviting, even for maintaining the present groundwater supply in the industrial area on a dependable basis. It is of im-mediate importance to provide for the in-creasing demand for water that results from normal growth of the municipalities and industries in the area. New industries requiring much groundwater may hesitate be-fore they move into the area.
The public water supply of Peoria is obtained largely from wells located north of the city, but private and industrial supplies are located throughout the city and ad-jacent area. The public demand in the area was estimated (in 1945) to be 20 mil-lion gallons per day and private and industrial demand about 65 million gallons per day, making the total estimated groundwater withdrawal for the Peoria-Pekin area about 85 million gallons per day.
In earlier years river water was used by distilling plants for cooling purposes in the winter, and during the summer season the plants were shut down when the water temperature was too high. After 1933 some of these plants began to operate con-tinuously and used groundwater almost ex-clusively. Large quantities of groundwater are used also by the meat-packing industries, machinery manufacturing plants, and other manufacturers. In the last few years mäny
[53]
54 GROUNDWATER IN THE PEORIA REGION
FIG. 12.—Peoria-Pekin area.
wells have been put into Operation by stores, theatres, and restaurants for air condition-ing. These growing demands for ground-water have a direct influence on the ground-water resources of the area.
This increased demand for groundwater has resulted in a lowering of water levels in wells, and available records show that during the past 15 years groundwater levels have receded from 1½ to 2½ feet per year throughout the area. The groundwater sur-face in the Peoria industrial areas is from 20 to 25 feet below the water surface of the Illinois River. In many places very little thickness of the water-bearing deposits re-mains saturated with water, and in some places where the deposits are shallowest some wells are dry as far as pumping capac-ity is concerned. In other places wells can be used only intermittently or at greatly reduced yields.
The population of the City of Peoria according to the U. S. Census is shown in table 1. It is apparent that water con-sumption in the area has been governed more by industrial activity than by population growth because the greatest recession in groundwater levels occurred during the last decade although the increase in popula-
HYDROLOGY 55
tion was only 0.11 percent. Areal popula-tion trends are closely parallel to that of Peoria.
Some of the basic hydrologic data of the Peoria-Pekin area were published in 1940 by the State Water Survey in Bulletin No. 33, a compilation of all available physical and chemical data on wells of record in the area at that time. Those data are not re-produced in this report. Wi th the Organization of available facts completed, a research program was formulated for the investiga-tion and study of all available water re-sources in the area.1
An outline of the water resources in-vestigation, conducted where needed in Cooperation with other agencies, is as follows:
A. Location of sources of water. 1. Location of all wells in the terri
tory and collection of pertinent data on each.
2. Study of the geological and topo-graphical conditions.
3. Study of the sources of water in the glacial deposits.
4. Study of surface water resources.
B. Estimate of amounts and quality from different sources. 5. Study of variations in groundwater
levels. 6. Study of velocity of the ground
water flow. 7. Study of influence of increased
gradients on the inflow to the main pumping areas.
8. Study of variations in the chemical composition of groundwater from different wells.
9. Study of chemical composition of surface water.
C. Determinations of present and future consumption.
10. Determination of the actual with-drawal.
11. Analysis of the amounts allocated to different uses.
1 Suter, Max, A Pilot Study of Groundwater Resources in Peoria County, Illinois. Trans . Amer. Geo-physical Union, pp. 493-500, 1943.
D. Evaluation of possible remedial meas-ures.
12. Reduction of pumpage from wells by the use of recirculation.
13. Evaluation of other groundwater sources.
14. Replacement of some demands on groundwater by the use of surface water.
15. Improvements to existing wells. 16. Groundwater replenishment by ar-
tificial infiltration.
The remainder of Part 2 is a summary of the work accomplished, the fundamental discoveries made, and the conclusions reached as of January 1, 1946, on the hydrology of the region. An extensive dis-cussion of facts learned and conclusions reached is postponed until the continuing investigation has uncovered more facts, in-cluding the practicability of proposed remedial measures now being studied on an experimental scale.
ACKNOWLEDGMENTS
The State Water Survey acknowledges the most generous Cooperation and assistance from everyone called upon during the course of the program. This wide Cooperation has been one of the most pleasant factors in the work and thus has been the major contri-bution to its success.
The study was begun at the Suggestion of the National Resources Planning Board.
Unremitting support of the project was given by the Peoria Association of Commerce, which placed all its facilities and Services at the disposal of the State Water Survey, and arranged frequent meetings in which the progress of the investigation was made known to the interested industries, thus inspiring their Cooperation.
Valuable assistance was received from federal, State, and local governmental agencies including the U. S. Corps of En-gineers, the U. S. Geological Survey, the Soil Conservation Service, the U. S. Weather Bureau, the Illinois Geological Survey, the University of Illinois Agricul-tural Experiment Station, the State Depart-
56 GROUNDWATER IN THE PEORIA REGION
ment of Public Health, the City of Peoria, the Peoria Park Board, and the Sanitary District of Chicago.
T h e Peoria Water Works Company fur-nished much local information and made bacteriological analyses of the Illinois River water.
Most of the local well drillers furnished information on wells, well logs, and other pertinent data.
All the industries and private well owners cooperated generously in permitting access to their properties for the purpose of lo-cating wells and observing water levels; many of them provided assistance in the making of observations on well levels and pumpage, and in supplying the data. The industries also raised funds for special in-vestigations and for the design of remedial measures.
T h e correlations and interpretations pre-sented herein are based primarily on the facts provided by the cooperative efforts acknowledged above.
T h e work was started in November 1940, by Max Suter of the Urbana office of the State Water Survey. In June 1941, an office was opened in the Alliance Life Building in Peoria and W. Herget was resident engineer there until May 1942. Since that time A. R. Knodel has been resident engineer, with Max Suter remaining in charge. J. J. Doland and J. J. Woltmann acted as advisors in many phases of the study.
C. C. Chamberlain and Miss Virginia Wisegarver assisted in preparing the data for study and correlation. The author is indebted to Harrison E. Romine, Associate Engineer, Engineering Sub-Division, for his careful technical review and editing.
T H E PROBLEM
Briefly, the problem was: to determine the existing Status of groundwater resources; to determine what was happening and had happened to this natural resource and why; and to develop any necessary remedial measures. Thus it was necessary to search out the sources of groundwater and to determine the existing and potential availability of water at each well field in the general area being studied. The existence or non-
existence of over-exploitation had to be established and possible remedial measures, if necessary, investigated. It was recog-nized also that any necessary remedial measures must be capable of satisfying future estimated requirements as well as alleviating any existing deficiencies.
The earliest observations pointed to a simple explanation, but as data were accu-mulated it became apparent that no single simple explanation would suffice for the area. Emphasis, therefore, was placed more and more on obtaining more extensive and re-liable data, a problem that, in itself, had many difficulties. Few active wells were equipped for Observation of water levels; still fewer abandoned wells were available for study, and very few wells were equipped with meters for measuring pumpage. Al-though well owners were willing to co-operate, wartime difficulties and restrictions hindered the introduction of new methods of Observation. In many cases the best study possible was far from the most de-sirable plan.
SUMMARY OF FINDINGS
For years before the start of the investi-gation reported in this bulletin, the State Water Survey had been collecting data on wells, their location, construction, logs, pump capacities, and chemical analyses of the water; but practically no data on pumpage and water levels. Wi th the start of the present investigation older data were re-checked, water levels were collected con-tinuously and expressed on sea-level datum, actual quantity of pumpage was closely estimated, and periodic analyses of river and well waters were made. In a short time some interesting tendencies were in-dicated which have been confirmed and amplified by the accumulation of new data and the recovery of older records.
Some of the conclusions reached thus far are:
(1) A general recession of the water level over a period of years was established as a fact in the Peoria well fields. This recession is due to overpumpage, but it has been characterized by continually rising and falling water levels with a general
HYDROLOGY 57
downward trend rather than a uniform lowering of water levels. Other sub-areas have been developed as fully as present Operations will permit, and still other sub-areas have undeveloped resources.
(2) The studies indicate that the over-pumpage in the Peoria industrial area over a period of'a few years has averaged about 6 million gallons per day.
This amount is calculated from the re-duction of the amount held in storage over a period of years and is based on a constant pumpage rate. Any increase in this pump-age will increase the overpumpage.
(3) High precipitation periods and high river stages each cause a rise in the water levels in the wells. As these two factors generally occur at the same time, it is difficult to evaluate their effects individual-ly. Interpretations are further complicated by the effect of pumpage.
(4) At normal river stages there is apparently no significant recharge of groundwater from the Illinois River above Peoria lock and dam, although the groundwater level near the river is always below the river stage. Recharge apparently does occur at normal river stages in the Pekin area.
There is some infiltration from the river during floods, but the hydrologic evidence does not permit determining the amount of this infiltration.
(5) The rise in groundwater levels during wet periods signifies some actual increase in water storage, but the quantity cannot be calculated accurately, and the source of this increase of stored water has not yet been clearly determined.
(6) At periods of constant navigation pool level, the recession in the Peoria industrial wells near the river has averaged from 5 to 6 feet per year, whereas during the years 1943 through 1945, with above-normal rainfall and high floods annually, the recession amounted to about 1 foot per year. As of January 1, 1946, levels were at an all-time low in most of the wells.
(7) The groundwater conditions at Peoria are very complex and are difficult to interpret.
(8) The wells in the area are in several well fields which for practical purposes are hydrologically independent; that is, there is no immediate interference from wells in one field with wells in the other fields, although factors common to all, such as rainfall and river stages, may influence all fields at the same time.
(9) The danger of dewatering a well or well field is less (a) where the wells are deeper, because the bedrock surface elevatum is low; (b) where the saturated thick-ness of the coarse materials increases below the groundwater level; and (c) where the general inflow can come freely from more than one direction.
(10) The main natural recharge of the groundwater is from precipitation over the Peoria area and contiguous areas. It reaches the well fields through the more or less continuous gravel and sand beds, but the relative contribution of each source of recharge has not yet been determined. This natural recharge, however, is insufficient to satisfy present groundwater demands.
(11) There are undeveloped water resources outside the Peoria Industrial area where new industries could be established, or the areas could be developed to supply additional water to Peoria. This is pri-marily an economic problem and is beyond the scope of this report.
(12) Remedial measures for Peoria are required in order to halt recession of the groundwater table. Measures to be con-sidered are reduction of present pumpage; replenishment of aquifers by artificial recharge; greater use of river water, and development of new groundwater fields; better spacing, arrangement, development, and care of wells. These methods can be carried on singly or simultaneously.
(13) Artificial recharge water is avail-able from the Illinois River and local trib-utaries. To completely relieve the groundwater shortage by artificial recharge, it may be necessary to construct recharge facilities at several places.
CHAPTER 8
P E O R I A AREA AND SOURCES OF WATER SUPPLY
SCOPE
This report covers the same general area as State Water Survey Bulletin No. 33. It embraces the communities of Peoria Heights, City of Peoria, and Bartonville in Peoria County; and East Peoria, Creve Coeur, and Pekin in Tazewell County. The area under intensive study, containing about 32 square miles, is shown in figure 12. Hydrologically, the area contains six general subdivisions:
Illinois River and tributary streams from which surface water supplies are obtained.
Sankoty, North, Central, and Pekin well fields, from which groundwater supplies are obtained.
Bedrock formations which are known to contain water.
The term "well field" designates an area within which a continuous interference can be traced from well to well. T h e well fields are separated by geological features or non-pumped areas, and interference between the well fields is therefore not observed in routine pumping practice, although it is possible that the complete cessation of pumping in certain fields would in time influence adjoining fields.
W A T E R S O U R C E S
The water sources described below are classified under drift wells, deep rock wells, and streams.
Drift wells are wells completed in sand and gravel deposits above the top of the bedrock. The drift wells are grouped by well fields. Rock wells are classified in a separate group.
D R I F T W E L L S
The Water Survey has accumulated data on 361 drift wells located in the well fields outlined on figure 13.
A Classification of these wells by well field and usage is given in table 2. The estimated pumpage from the major wells during 1945 is shown, but the pumpage from domestic wells was relatively insignif-icant.
T A B L E 2 . — W E L L F I E L D S AND F I E L D PU M P A G E S
W e l l f i e l d
Number of Wells
Total Idle Major active
Estimated pumpage
mgd.
Sankoty. . . North Central.... Pekin
Total. . .
32 25
215 89
361
11 14 45 22
91
13 10
155 57
235
10.2 5.7
48.2 20.2 84.3
ROCK W E L L S
Information was available on 23 bedrock wells varying in depth from 320 feet to 1864 feet, of which 9 wells are in active service (fig. 14). Eighteen wells were completed in various formations above a depth of 1300 feet; three wells were completed at depths of 1400 to 1500 feet in the Galena-Platteville dolomite; and two wells drilled to 1755 and 1864 feet pene-trate the St. Peter sandstone.
The bedrock aquifers contain water un-der artesian pressure, but the pressures vary from aquifer to aquifer with indications that the deepest aquifers have the highest pressure. A few of the rock wells are flowing, but pressures have been dropping with time and in many wells the hydrostatic level is below ground level. Some wells tap several water-bearing strata and deliver water of varying mineral quality depending on draw-down and length of pumping period. Mineral quality is discussed in the section on chemistry, but it can be noted here that
HYDROLOGY 59
FIG. 13.—Well fields in Peoria-Pekin area.
60 GROUNDWATER IN THE PEORIA REGION
FIG. 14.—Deep rock wells in Peoria-Pekin area.
HYDROLOGY 61
TABLE 3.—USERS AND PUMPAGE OF ILLINOIS RIVER WATER
Industry Average pumpage mgd.
Bemis Bro. Bag. Co Hiram Walker & Sons, Inc Central Illinois Light Co. (Eas.t Peoria Plant) Keystone Steel & Wire Co American Distilling Co Commonwealth Edison Co Com Products Refining Co
Nominal 20.0 summer—8.0 winter
115.0 70.0
3.0 500.0
12.0
as a general rule the waters from bedrock wells are highly mineralized and corrosive, with temperatures ranging from 60° to 78° F. Such waters are generally not de-sirable for municipal or industrial use.
Pumpage from these wells was negligible, as the average daily consumption was about 0.3 million gallons.
STREAMS
The Illinois River, which flows through the Peoria-Pekin area, is the natural and main source of surface water. The low river flow is about 5000 cfs. (3250 mgd.) and could therefore furnish ample water for all existing needs.
The flow includes the normal runoff from the watershed plus water diverted from the Great Lakes-St. Lawrence River watershed. The diversion at Chicago includes an average of about 1500 cfs. for sewage dilution and maintenance of a
navigable channel in the river and an average of about 1500 cfs. of treated sewage from Chicago. In former years untreated sewage from Chicago and downstream cities was discharged into the Illinois River, giving the river a reputation of being heavily polluted. This reputation is not upheld by chemical and biological studies. The studies show that the water can be used, as it is of a quality that is amenable to treatment. Nevertheless, because of public opinion the water has not been used for municipal or domestic needs, but about 700 mgd. are used by industries for cooling and condensing purposes. Table 3 is a tabulation of users and pumpage of Illinois River water.
Other potential sources of surface water are Farm Creek, Kickapoo Creek, Tenmile Creek, and the Mackinaw River. These streams have not been utilized as water supply sources.
CHAPTER 9
GROUNDWATER I N V E S T I G A T I O N S
Any comprehensive water resources in-vestigation must include the collection of every fact and every possible bit of Information which may be pertinent. Oftentimes it is impossible to obtain precise physical meas-urements, and there are usually isolated areas where no data can be obtained. Many potential avenues explored are found to be blind alleys.
Usually in a groundwater study, access to tbe saturated materials can be gained only from artificial openings, such as wells, test borings, and excavations. These are not always located at the most Strategic places. Where such openings do occur it is usually impossible to secure all the de-sirable information, and other factors usually hinder the collection and preservation of continuous records. It was known from previous experience that the bedrock forma-tions would not be a satisfactory source of groundwater, so this section concerns only sand and gravel water sources.
The basic data for the hydrologic groundwater study were obtained from wells, and the observations included:
a. Location and construction of wells. b. Measurements of water levels (in-
cluding reduction to common datum plane).
c. Determinations of pumpage. d. Chemical composition of water.
Secondary data which were considered pertinent to the investigation were:
a. River stages, discharges, temperatures, and water qualities.
b. Climatological information (rainfall, air temperature, etc.).
Other special observations were made when conditions were favorable or when possible value of information thus gained justified the necessary expenditures.
Most of the observations were made, un-der cooperative agreements where necessary, by agencies both public and private, other
than the State Water Survey. The princi-pal function of the Survey was to direct and coordinate activities, to act as a Clearing house for information, and to analyze and interpret the information collected.
E X I S T I N G W E L L S
LOCATION AND CONSTRUCTION
O F W E L L S
Most of the available data on location and construction of existing wells had been published, or was on file at the start of this investigation, so it was necessary mainly to collect data only on new construction.
OBSERVATIONS OF W A T E R LEVELS
Water-level data were obtained from 112 drift wells in the area including a continuous record of levels in 23 idle wells.
In selecting wells for water-level measurements, the primary objective was to cover the area completely with a network of Observation wells, closely spaced in areas of heavy pumpage. An ideal distribution of Observation wells was naturally impossible because of absence of wells at de-sirable locations. In some wells mechani-cal defects or well operating conditions made observations impractical.
During the period of the investigation many changes occurred: well operating schedules were changed; wells were aban-doned or restored to Service; and new wells were drilled. The distribution of Observation wells is shown on plate 4.
Water-level measurements in some wells were made periodically with steel tape or with pressure gage on air line. Where conditions permitted, continuous water-level recording instruments were installed. The most useful and reliable data were obtained from recording instruments because inter-vals between periodic measurements had to be selected with great care to assure a true
[62]
FIG. 15.—River stage, well hydrographs, and pumpage in Sankoty field.
FIG. 16.—River stage and well hydrographs, North field.
F IG. 17.—River stage and well hydrographs, East Peoria field.
66 GROUNDWATER IN THE PEORIA REGION
FIG. 18.—River stage and well hydrographs, Pekin field.
FIG. 19.—River stage and well hydrographs, Peoria Industrial field.
HYDROLOGY 67
FIG. 20.—Available long-time data of water levels in Illinois River and wells at Peoria-Pekin.
68 GROUNDWATER IN THE PEORIA REGION
picture of changing conditions. At times, the desired control of interval between meas-urements could not be achieved. Also, the error in periodic measurements by generally untrained personnel was greater than auto-matic instrument error.
The measurements were only of "non-pumping" water levels, which are the ob-served levels in wells from which water is not being pumped. The term "static" water level is commonly used but, in areas of heavy pumpage, water levels are in nearly constant movement because of changes in nearby pumpage, in barometric pressure, in climatic (rainfall) conditions, and in river stages in certain areas. The observed water levels were definitely not static, and it was the change in water levels that was im-portant.
GROUNDWATER LEVEL DA T A
HYDROGRAPHS
To gain an idea of the changes in water levels with time, all water-level data were plotted, using convenient scales, as eleva-tion in feet above mean sea-level versus time. Figures 15-19 are examples of this type of plotting and include the most useful water-level data (hydrographs) collected.
Figure 20 is a general summary of long-time areal changes and contains all the historical water-level data available.
From previous investigations it was known that many factors can affect water levels in wells. Some of these factors are: infiltration from rainfall, streams, or flooded land; elastic compressibility; exist-ing and previous pumpage; lateral movement of groundwater from adjacent areas; and variations in atmospheric pressure. Because these factors are often active simul-taneously, it is difficult to determine the relative effects of the various factors, but the effects of single factors must be evaluated before a logical explanation of areal hydrol-ogy can be offered.
GROUNDWATER CONTOUR MAPS
As detailed data on groundwater levels became available, generalized contour maps showing the upper limits of the saturated water-bearing material were constructed. In the few areas where semi-artesian conditions exist, the contours represent the hydro-static pressure of the confined water. Such conditions exist under the river bed and in about 5 percent of the remainder of the area. Water-level contours of various periods from 1933 to 1945 are shown in figures 21-29.
After a few maps were constructed and the general pattern recognized, it was then possible to construct, from the meager data available, a generalized map showing conditions in 1933. It was about this time that the present heavy pumpage started.
Much can be learned from study of the groundwater contour maps. First, the direction of groundwater movement at any point can be determined. Direction of the horizontal component of flow is at a right angle to any contour line towards a contour of lower value. Second, if some knowledge of areal geology is possessed, other geologic facts may be inferred. Third, by comparing a water-level contour map with a bedrock surface contour map of the same area, the depth of water at any point can be determined. This is a very significant factor in determining possible yield of a well constructed at that point. Also, the volume of saturated water-bearing material can be estimated, or accurately calculated if the original data permit construction of precise maps. Fourth, comparison of any two maps shows changes in conditions over the area during the intervening period. The volume of material dewatered or re-saturated can be calculated. Then if the specific yield of the water-bearing material is known, the gain or loss in storage can be computed. The quantity of water yielded by gravity drainage from saturated water-bearing material is termed the specific yield and is expressed as a percentage of the total volume of the material.
HYDROLOGY 69
FIG. 21.—Groundwater surface contours, 1933.
70 GROUNDWATER IN THE PEORIA REGION
F IG. 22.—Groundwater surface contours, August 1941.
HYDROLOGY 71
FIG. 23.—Groundwater surface contours, flood peak, February 1942.
72 GROUNDWATER IN THE PEORIA REGION
F IG. 24.—Groundwater surface contours, September 1942.
HYDROLOGY 73
F IG. 25.—Groundwater surface contours, May 1, 1943.
74 GROUNDWATER IN THE PEORIA REGION
F IG . 26.—Groundwater surface contours, June 1, 1943.
HYDROLOGY 75
FIG. 27.—Groundwater surface contours, July 1, 1943.
76 GROUNDWATER IN THE PEORIA REGION
F IG. 28.—Groundwater surface contours, September 1943.
HYDROLOGY 77
FIG. 29.—Groundwater surface contours, September 1945.
78 GROUNDWATER IN THE PEORIA REGION
TABLE 4 . —CH A N C E IN VOLUME OF SATURATED MATERIAL, 1933-1943
Volume of saturated material, 1933-1943 *Average loss in storage mgd.
Well field 1933
(sq. mi. ft.) May 1943
(sq. mi. ft.) Difference
(sq. mi. ft.)
*Average loss in storage mgd.
Sankoty North Central Pekin
651.0 193.7
2,216.8 327.7
505.5 175.3
1,568.4 305.9
145.5 18.4
648.4 21.8
0.62 0.08 2.78 0.07
Total 3,389.2 2,555.1 834.1 3.55
* Assuming specific yield is 7.S percent.
Available storage.—The available storage of each well field was computed by con-structing differential, water surface—top of bedrock, contour maps with fixed areal boundaries. The differential maps were constructed from the water level contour maps and a bedrock surface contour map, similar to plate 1, in Part 1, and show the depth of water above the bedrock surface throughout the area for the date selected. The limit of influence of pumpage in each well field was a natural boundary to use in computation of the volume of saturated material, but these limits were somewhat indefinite and changed with time. The boundaries actually used were an arbitrary line located about one-half to one mile out-side the known limits of influence, except where bedrock outcrops formed a natural boundary.
Water-surface—bedrock differential con-tours for 1933 and May 1943, prior to flood, are shown in figures 30 and 31. Water—surface—water—surface differential contours for 1933 and May 1943 are shown on figure 32. This figure shows the ap-proximate actual lowering of the water surface.
From the water-surface—bedrock differential contour maps the volume of saturated material was calculated in square-mile feet. The values for 1933 and May 1943 are given in table 4.
Laboratory tests of saturated materials collected during drilling Operations indi-cated the percentage of void Spaces varies from 28 to 33 percent. Void space, or
porosity, and specific yield are not identical. When a material is drained by gravity, a certain volume of water is always retained by capillary and molecular forces. Laboratory tests of aquifer samples from the Peoria area indicated a specific yield of 20 to 28 percent. The entire thickness of saturated material undoubtedly has an average specific yield that is much less because the upper strata that are dewatered and resaturated generally are composed of smaller particles, less uniformly sorted than the screened aquifer sections. In much of the area there is more than one aquifer and the separating relatively watertight strata tend to reduce the average possible yield. The average specific yield of the aquifer is not yet known. In Chapter 12, under certain assumptions, the upper limit of average specific yield is calculated to be about 7.5 percent. Using an average specific yield of 7.5 percent, the average daily loss in storage for the 10-year period is shown in the last column of table 4. An assumed specific yield of 15 percent would double the values shown.
The approximate loss in storage for the ten-year period (12,900 million gallons) is about one-third of one year's pumpage. 31,000 million gallons. The volume of water in storage in 1933 was about 53,000 million gallons (7.5 percent specific yield) or about 1.7 years supply at average pumpage rates, if all of it could have been re-covered. It is then obvious that the water pumped cannot have come entirely from storage. Otherwise the field would have been pumped dry long ago.
HYDROLOGY 79
FIG. 30.—Thickness of saturated strata, 1933.
80 GROUNDWATER IN THE PEORIA REGION
FIG. 31.—Thickness of saturated strata, May 1943.
HYDROLOGY 81
F IG. 32.—Lowering of water surface, 1933 to May 1943.
82 GROUNDWATER IN THE PEORIA REGION
Overpumpage.—Overpumpage is defined as the amount of pumpage exceeding the natural recharge or perennial yield of a water-yielding deposit. Overpumpage can be determined if average annual recharge and average annual withdrawal are known. Net loss in storage is not a direct, or an exact, measure of overpumpage.
The decline of water levels or loss of storage in a developed well field also creates a steeper hydraulic gradient (slope of water surface) causing more water to flow into the well field from its sources of recharge. Therefore, until other factors are con-sidered, it cannot be said that a loss in storage is a direct measure of overpumpage although it is evident that such a decline in water level cannot continue indefinitely. Theoretically, on a level bedrock surface, this process could continue until at the exact center of pumpage there would be no saturated material. Practically, conditions become critical long before that. The bedrock surface is uneven, so that wells located on bedrock ridges would be dry while nearby bedrock-valley wells were still usable. Also a certain depth of water over bedrock is necessary to provide the necessary "draw-down" in a pumped well. Drawdown is defined as the lowering of water level with-in a pumped well, necessary to create a hydraulic gradient that will cause water to move through an aquifer into the well. In addition to drawdown needs, a certain amount of screen submergence is necessary to provide inflow area to the well.
In May 1943 the depth of water over bedrock in a large part of the Central field was less than 20 feet, and the water levels of that date are taken as the minimum de-sirable. Water levels continued to decline somewhat after that date, even with exces-sive rainfall, so it is evident that overpumpage exists.
On examination of long-time hydrographs (fig. 20) it is seen that the period of greatest decline in water levels, which coin-cided with a period of deficient rainfall, was 1939 through 1941. From 1936 through 1938 and from 1942 through 1945 minimum water levels were about the same from year to year. So while the average
loss for a ten-year period was 2.8 mgd. in the Central field, if the overpumpage were calculated on a three-year basis, 1939 through 1941, it would give a value of about 6.0 mgd.
It should be noted that these calculations are based on two primary assumptions. One, that water-table conditions exist, there-by permitting use of water-level contour maps to calculate changes in volume of saturated material, and two, that pumpage was uniform during the period. On the basis of available evidence, the first assump-tion is fairly valid. There are no exact data to support the second assumption.
Pumpage by the Peoria Water Works Company steadily increased from an average of 7.3 mgd. in 1935 to an average of 11.1 mgd. in 1941 and 14.3 mgd. in 1945, or the pumpage was doubled in ten years. Some of this increase was due to a replacing of industrial pumpage by the city supply. Through these years, variations in industrial water requirements occurred but were rel-atively small, seldom more than ±20 percent. Therefore pumpage was not uniform and it is possible that overpumpage did not exist throughout the selected ten-year period, but was concentrated in shorter periods. Since the last assumption appears to be most logical, an arbitrary value of 6.0 mgd. average loss in storage will be used for tentative calculations until a more ac-curate value can be obtained.
Amount of normal recharge.—The differ-ence between the average pumpage (84 mgd.) and the average loss in storage (6.0 mgd.) gives the approximate average normal recharge (78 mgd.) to the developed well fields, but it does not give any clue as to the source of recharge. For the Central field the average normal recharge would be 42 mgd. (48 mgd. pumpage minus 6 mgd. loss in storage), but the calculated loss in storage in the other fields is less than the normal error in the data. Viewed from a different angle, if normal recharge is known and pumpage is known, then the difference is overpumpage or unexploited water, de-pending on the relative values of recharge and pumpage. Thus if the average annual
HYDROLOGY 83
recharge can be determined, the safe yield of the area is known.
Measurements of pumpage.—Reliable measurements of pumpage were very diffi-cult to obtain because only a f ew flow meters were installed at well pumps. Where meters were not installed, pumpage was usually estimated from nominal pump capac-ity and average daily operating time, but in many places even this information was unavailable. In such cases the pumpage was estimated from whatever data were available. It was hoped, and believed, that the total average pumpage was a good ap-proximation because of compensating errors. However, it was generally not possible to determine normal variations in pumpage.
The pumpage from the Sankoty field was mainly for the municipalities of Peoria and Peoria Heights, all of which was metered.
The largest part of pumpage in the North field is by the Peoria Water Works Company, and the balance of the pumpage is by a few industries. Except for four indus-tries, all pumpage in the North field is metered.
In the Central field, with the exception of East Peoria, there was no municipal pumpage prior to 1946. Only a very small part of the industrial pumpage and none of the pumpage for air conditioning plants was metered. Nevertheless, the uniformity of Operation during the war period allowed a fair estimate of the industrial pumpage. The estimates of water consumption by air conditioning plants are, however, unreliable.
In the Pekin field only a small amount of the pumpage is for municipal uses, and that is metered. The requirements for air conditioning are small and indefinite, and only a small part of the large industrial pumpage is metered, but the rest could be estimated with a fair reliability.
Uses of groundwater.—The uses of groundwater in the area for 1945 are shown in table 5.
Search for old records.—An effort was made to collect old operating and water-level data, but the effort was generally un-successful as the usual practice had been to record no data as long as there was no con-
T A B L E 5 . — U S E S O F GR O U N D W A T E R
Million Percent Type of usage gallons of
per day total Municipal Air conditioning Steel plants Food industries Distilleries Non-beverage distilleries Other pumpage
19.0 2.8
10.0 9.5
12.0 14.0 17.0
22.5 3.3
11.9 11.3 14.2 16.6 20.2
Total 84.3 100.0
cern about the possibility of a diminishing water supply. However, a few isolated records were obtained which indicated the general trend of changing conditions.
OTHER DATA
To correctly interpret past and current changes in groundwater conditions, certain other data were necessary. These data, like the basic hydrological data, were obtained from many sources.
Precipitation.—The natural source of replenishment of groundwater resources is precipitation which may have fallen recently or long ago, nearby or far away. The available rainfall data collected by various agencies were obtained for comparison with water-level, pumpage, and river-stage information. Most of the data were assembled and analyzed by J. L. Page, Department of Geography, University of Illinois. A graph showing rainfall, Illinois River levels, and selected well hydrographs is presented in figure 33.
Test drilling.—To Supplement the net-work of Observation wells it became de-sirable to construct test wells in locations where no facilities for water-level measurements were available, or where additional information was needed. All wells were constructed by local drilling contractors after competitive bidding.
To Supplement the water-level Observation network, 6-inch wells were drilled at Bradley, Madison, and Lincoln Parks in Peoria; at the East Peoria Sewage Treat-ment Plant ; and at the Sword property in East Peoria. For groundwater velocity measurements, two additional 4-inch wells
84 GROUNDWATER IN THE PEORIA REGION
FIG. 33.—Rainfall, river levels, and groundwater levels, 1936-1945.
were drilled at Madison Park, Lincoln Park, the Sewage Treatment Plant and Sword property. Three 8-inch wells were also drilled at the Hiram Walker & Sons, Incorporated plant for obtaining data dur-ing an artificial recharge experiment.
Drilling the Bradley Park well in Octo-ber 1941 disclosed the presence of the buried valley lying west of Peoria which had been suspected from the groundwater contour map of August 1941. That was before the resistivity survey made in 1942 by K. O. Emery, State Geological Survey. Because of the great depth to bedrock, the plans for making velocity measurements at this loca-tion1 were abandoned. The discovery of the buried Valley was checked by a test hole drilled at the Christian Buehler Memorial Home in September 1943 with pipe salvaged
1 See p. 27 of Part 1, Geology. Udden has bedrork at ±350 feet. Bradley well at 346.6 feet. Christian Buehler Home well at 353.1 feet.
from the 4-inch wells drilled previously and used for velocity measurements.
Velocity determinations.—For groundwater velocity measurements, three test wells were drilled at the corners of 50-foot equilateral triangles. Water levels were measured very carefully to determine direc-tion of movement. Then common salt was added to the upstream well and length of time required for the salt to appear in the downstream wells permitted calculation of velocity. Appearance of salt in the downstream well was determined by increase in conductivity of water.
The results were not entirely satisfactory as the salt appeared in the other wells slowly and in irregularly rising amounts. The data collected indicated that the average groundwater velocity was about 50 feet per day at the locations where measurements were made. The hydraulic gradient ob-served was about 2 feet per mile.
CHAPTER 10
SURFACE WATER I N V E S T I G A T I O N S
I L L I N O I S R I V E R
With the recognition that the Illinois River and areal tributaries might be a major source of groundwater replenishment, an evaluation of the factors affecting river-bed permeability was made.
At the time when exploitation of groundwater resources was greatly increasing, two possible significant and mutually dependent events occurred in the history of the Illinois River. Simultaneously with reduction in diversion of water from Lake Michigan into the Illinois River, the river was subjected to strict artificial control of low water stages at Peoria by the construction and Operation of the Peoria lock and dam.
The Illinois River in the Peoria-Pekin area consists of three distinct reaches separated by a natural structure and an artificial structure. The Farm Creek alluvial fan is a natural dam (see Part 1 on Geology) creating Lake Peoria which extends up the valley beyond Chillicothe. Below this natural dam (or below Franklin Street bridge) the river is confined to a rel-atively narrow channel for several miles, but this reach is subdivided by the Peoria dam. The river has a slope of 21.4 ft. (1.1 inches per mile) from 70 miles above to 160 miles below Peoria. Most of the fall is concentrated (19.5 feet) at two naviga-tion dams, which leaves an average slope of 0.05 inch per mile for the actual river course. Pool stage above the Peoria dam is 440 feet MSL. and below the dam is 430 feet MSL. These conditions make the stream an aggrading river, with low flow velocities incapable of moving any sediment except very fine particles.
FL O W AND TURBIDITY
The Sanitary District of Chicago col-lected daily turbidity samples at the old upper bridge (now removed), and analysis of the data for the years 1935 through 1945
revealed that the turbidity was generally low, as might be expected, because low velocities in the lake-like basins between Hennepin and Peoria would be favorable for Sedimentation. The turbidity was below 50 ppm, more than half the time, but storms of course caused periods of high turbidity. The yearly maximum varied from 270 to 800 ppm. A Statistical analysis of the data is shown in figure 34.
FIG. 34.—Duration of Illinois River turbidities.
A study to determine relationship between turbidity and velocity was made, but it was found that no Statistical relationship existed. It was found that turbidity was high im-mediately after the beginning of an increase in river flow (higher stream velocity) but that turbidity decreased rapidly and was relatively low at flood crests. This is at-tributed to the flashy discharge characteris-tics of local tributaries.
C H A N N E L VELOCITY
By order of the U. S. Supreme Court, effective January 1, 1939, the diversion of water from Lake Michigan into the Illinois Waterway was reduced from 5000 cfs. to an average of 1500 cfs. To maintain a
[85]
86 GROUNDWATER IN THE PEORIA REGION
navigable Channel in the waterway, the Peoria lock and dam was constructed and placed in Operation concurrent with the re-duction in diversion.
The stream-flow data, 1925 through 1945, of the Illinois River at Peoria col-lected by the U. S. Geological Survey were used to determine the effects of diversion and stage-control on channel velocity, and hence, the possible effect on channel Sedimentation. Preliminary calculations indicated that de-creased diversion and stage-control would have very little or no effect on the stream velocity in Lake Peoria. Therefore, the investigation was confined to the channel between Franklin Street bridge and the Peoria dam.
The stream-flow data revealed that from 1925 through 1938 the discharge was never less than 5000 cfs., from 1926 through 1929 was never less than 10,000 cfs. and that the discharge from 1925 through 1938 was less than 10,000 cfs. about 15 percent of the time. From 1939 through 1945 discharge was less than 5000 cfs. about 20 percent of the time and was less than 10,000 cfs. about 60 percent of the time. Maximum discharge at pool stage is 16,000 cfs. Diversion and stage-control had no effect on peak discharges, in fact, the maximum discharges measured were in 1944 and 1945. The relative duration of flows is shown in figure 35. Using representative cross-sections of the channel near the Peoria & Pekin Union R. R. bridge, Cedar Street bridge, and Illinois Terminal R. R. bridge, the stream velocity under varying conditions was cal-culated (see table 6 and fig. 36) .
TABLE 6.—EFFECT OF CHANGING CONDITIONS ON CHANNEL VELOCITY
Duration days Velocities ft./sec.
cfs or less
Duration days Before closure of dam After closure of dam
Using values for the cross-section near Cedar Street bridge (mile 161.51) the minimum stream-velocity during the 1925-38 period was 2.2 feet per second, and minimum velocity during the 1939-45 period with reduced diversion and stage control was 0.5 feet per second. Reduced diversion alone would decrease velocity (using 1925-38 data) to 1.9 feet per second, and stage control alone would reduce velocity to 1.3 feet per second, but the two factors operating simultaneously have had a great effect on channel velocity at low flows.
Some river bed sampling was done in 1923 and 1941 by the State Natural His-
HYDROLOGY 87
FIG. 36.—Channel velocity in Illinois River before and after closure of Peoria dam.
tory Survey and the State Water Survey and comparison of the few samplings re-vealed that there were more silt deposits in 1941 than in 1923. However, no quantitative data on areal extent and thickness of deposits were collected. Prior to 1939 the channel was dredged regularly so that the river bottom had a high ratio of ex-posed sand and gravel. After 1939, velocity conditions were more favorable for Sedimentation, but increase in and change of type of navigation apparently have tended to dis-turb the Sedimentation. The change from slow-moving low-horsepower stern wheel tow boats to much faster propeller-driven tow boats moving deeper draft barges has caused increased turbulence near the river
FIG. 37.—Range of Illinois River temperatures.
bottom. During the artificial infiltration test in August and September of 1941, the pump intake screen clogged with weeds and Shells every time a loaded barge tow passed. However, empty barge tows caused little clogging.
O T H E R DA T A
Data on water temperatures, chemical quality, biological stability, and bacterio-logical conditions of the Illinois River were also collected and studied. The relative occurrence of daily temperatures is shown in figure 37 and data on chemical quality are given in Part 3 on Chemistry. The other studies are being continued for use in the proposed artificial recharge investiga-tion. They are of little significance in the groundwater study, except that the water quality is within the Standards set for raw waters usable in treatment plants for pot-able public water supplies.
I L L I N O I S R I V E R T R I B U T A R I E S
The local tributaries, Kickapoo, Farm, and Tenmile creeks, were studied to deter-mine possible contribution to the areal groundwater resources. The U. S. Geolog-ical Survey has been gaging the flow of Kickapoo Creek since October 1941 and of Farm Creek since May 1943. All these streams have great variations in flow from flash floods during rainstorms to long periods of very low flow.
88 GROUNDWATER IN THE PEORIA REGION
Farm Creek has little visible flow at times, but has considerable water in its Channel alluvial deposits from which a great part of the East Peoria water is obtained from shallow (25-foot) wells. No major water supplies have been developed in the shallow channel deposits of Kickapoo and Tenmile creeks.
During flood discharges all the streams carry considerable debris which has been deposited in alluvial fans in the Illinois River Valley. Test drilling in the Farm
Creek fan indicates that the deposits are irregularly sorted (see Part 1) and that wells constructed in the southern areas of the outwash deposits are of small capacity. Similar results were obtained in the Kickapoo Creek fan. However, groundwater recharge can and probably does occur through the fans, but the quantity cannot be deter-mined from available hydrologic data.
The Mackinaw River probably contrib-utes to the Pekin well field, but is con-sidered to have no effect on the Peoria fields.
CHAPTER 11
GROUNDWATER R E P L E N I S H M E N T I N V E S T I G A T I O N S
As the complexity of the study was recog-nized, other special observations or studies were made in an effort to discover new f acts or to interpret existing conditions. One of the problems concerned the source of groundwater—whether it was the Illinois River, storage in the sands and gravels, or rainfall on the well fields and contiguous areas. In an attempt to ascertain the source, or sources, of the groundwater, the following investigations were made.
N A T U R A L I N F I L T R A T I O N S T U D I E S
RAINFALL ON GROUND SURFACE
In Cooperation with the Soil Physics Division of the Illinois Agricultural Experiment Station a field investigation of the infiltration of water into the various soil types of the Peoria area was made in 1942. The study was made by R. S. Stauffer, Assistant Professor of Soil Physics.1
From the data obtained during the field tests and the University of Illinois Agricultural Experiment Station soil maps, figure 38 was constructed to show infiltration rates of the different soils in the area north-west of Peoria. It should be noted that the maximum possible rate of infiltration of the surface soils is shown but no informa-tion is made known about subsoil percola-tion, quantity of water that might be lost by evaporation and transpiration, or what the actual average rate of infiltration into the groundwater stream might be. Geologic conditions are favorable for water movement towards Peoria, but as yet the hydraulic gradient, necessary to cause movement, has been only partially determined.
1 Stauffer, R. S., Infiltration of Soils in the Peoria area: Illinois State Water Survey Rept. Inv . 5, 1949.
ILLINOIS RIVER
A few opportunities were presented to observe the possible effect of disturbance of river bed on groundwater conditions. These opportunities were dredging in the river channel and construction of Peoria lock and dam and the Harvard Street bridge piers.
Dredging in Illinois River Channel.—A permit was granted R. G. LeTourneau, Incorporated, in January 1945, by the Illinois Division of Waterways, for the removal of about 500,000 cubic yards of material from the river channel (Lake Peoria) just upstream from Grant Street in Peoria. The material was used for hydraulic land fill adjacent to the Company plant. The conditions of the permit were that (1) dredging Operations would cease im-mediately at any particular place if gravel were encountered, (2) bacteriological samples were to be collected from the two LeTourneau wells and the Bemis Brother Bag Company well before and during dredging Operations.
When Operations ceased in January 1946 a total of 770,000 cubic yards of material had been removed from approximately mid-channel. Gravel was encountered fre-quently and Operations were immediately shifted. No contamination was detected in the well samples.
Construetion of Peoria lock and dam.— During construetion of Peoria lock and dam (near Creve Coeur) a large quantity of water was pumped from the cofferdam excavation. Pumpage was continuous from May 26, 1936, to September 11, 1937, and the data collected on pumpage, river stages and cofferdam water levels by the Corps of Engineers are shown in figure 39. Table 7, showing total pumpage, average daily pumpage, and average drawdown relative
[89]
FIG. 38.—Infiltration capacities of Peoria area soils.
HYDROLOGY 91
FIG. 39.—Pumpage and water levels, Peoria dam construction, 1936-1937.
TABLE 7.—PUMPAGE AND WATER LEVELS, PEORIA DAM
Year and month Total pumpage mill. gal.
Average pumpage
mgd.
Average elevation
inside cofferdam
MSL
Average drawdown relative to river stage
1936 May June July
September October November December
1937 January
March April May
285 593 922
1061 1001 977 850 673
621 682 716 688 780
14.2 19.7 29.7 34.1 33.4 31.5 28.3 21.7
20.0 24.4 23.1 22.2 25.2
435.0 416.0 410.5 410.2 408.2 407.7 407.0 409.4
413.0 411.0 410.4 409.4 411.0
6.0 21.3 25.3 25.5 29.8 31.4 32.2 28.4
30.0 31.4 31.6 33.8 33.4
Total 9819 Av. 26.1* Av. 410.4 Av. 29.5*
* Excl. May 1936.
to river stage by months, was prepared from the data available. Data on cofferdam water levels were not available after May 31, 1937.
The minimum water level inside the cofferdam was 406.0 feet MSL. on November 30, 1936; greatest drawdown below river stage was 37 feet on May 10, 1937; and maximum pumpage was 41.7 million
gallons on September 7, 1936. Nearly 12,000 million gallons were pumped from the excavation during the 15-month construction period at an average rate of 24.4 mgd., which is equivalent to approximately one-half of the daily pumpage from wells in the Central field. The relative percent-ages of groundwater and river water leakage pumped from the excavation has not been
92 GROUNDWATER IN THE PEORIA REGION
FIG. 40.—Water level profiles and materials encountered, Peoria Water Works Company pumping test.
determined, but the average elevation of water levels in the cofferdam (410.4 feet) was below any groundwater levels in the Peoria-Pekin area. Water levels in near-by wells were at elevation 4 3 0 ± feet at the beginning of construction and dropped to 4 2 3 ± feet during construction. There-fore, it appears most probable that a con-siderable quantity of groundwater was pumped from the excavation.
During the construction period of the lock and dam there was a large increase in pumpage from the Central field. In August 1936 a water level recession in wells in the Central field was observed and was thought to be the result of pumping at the cofferdam. The Corps of Engineers re-quested assistance from the U. S. Geological
Survey, and a series of Observation wells was constructed between the dam site and the southern end of the Peoria industrial area. Water level observations revealed that the radius of influence of cofferdam pumpage was about one mile, but the center of pumpage of the Central field was about three miles from the dam.
Construction of Harvard Street bridge piers.—Prior to preparing specifications for the Harvard Street bridge piers some con-cern was expressed about the effect of pier construction on the public water supply, since some of the piers would be within 1000 feet of the Peoria Water Works Company main well. Therefore, a cooperative study was made by the State Division of Highways, the State Department of Public
HYDROLOGY 93
Health, the State Geological Survey, the Attorney General of the State, the City of Peoria, the Peoria Water Works Company, and the State Water Survey: (1) to deter-mine possible hydrologic or sanitary effects of pier construction on the public water supply, (2) if deleterious effects were possible, to formulate construction plans to avoid these effects.
A series of Observation wells, spaced 200 feet apart, was constructed on a line from the Water Company main well to the pro-posed bridge location, and water level meas-urements were made in these wells from August 22 through 29, 1938, while pump-ing in the main well at rates of production from 2.5 to 4.0 mgd. These observations revealed a definite hydraulic gradient from the proposed bridge site to the main well, the slope varying from 1.5 feet per 1000 feet at no pumpage to 10.0 feet per 1000 feet at a 4.0 mgd. rate of production. When pumping at a rate of 4.0 mgd. the water level was lowered 12.0 feet at the well and 4.2 feet at the bridge location. Also, groundwater level in the Observation well at the bridge location varied from 10 to 14 feet below river stage. Peoria lock and dam was not in use during the test and there was no regulation of flow at Peoria. The well locations, well hydrographs, and other data are shown in figures 40 and 41.
With this knowledge, the pier construction plans were modified to prevent any possible contamination of the groundwater. The procedure followed was to construct an Observation well at the upstream end of each (piers 7, 8, 9, and 10) pier cofferdam and during excavation to keep the water inside the cofferdam pumped to the bottom of the excavation or to elevation of water
level in the adjacent Observation well, whichever was higher. Groundwater levels in the Observation wells varied from 420.0 to 428.0 feet M S L . and pool stage was at 440 feet. The groundwater was under artesian pressure below the river bed and produced boils in the bottom of the cofferdam excavations. Daily bacteriological tests were made of the water from the main well and no contamination was detected.
During the construction of three of the bridge piers, it was possible to obtain un-disturbed samples of the materials forming the river bottom. The first layer of 1 to 2 inches thickness was a very fluid, slimy silt containing about 80 percent water. The next layer of about six inches was a yellow to brownish silt, hard enough that foot tracks impressed about ½ inch deep. This silt contained 30 percent water and could be molded. The third layer was a blue clay-like silt, hardening rapidly with depth, and at a depth of 18 inches it contained only 12½ percent water and was too dry to be molded. The latter type of silt continued to the bottom of the deposition.
Samples of these clays were obtained by pushing 1½-in. copper tubing, with sharp edges, into the clay and digging out the tubes. The ends of the tubing were closed with rubber stoppers. Permeability tests were made on three of the samples in the copper tubing as taken in the field. The permeability of the 6-inch long samples of the silt (12½ percent moisture content) against 10 feet head was 0.6, 0.75, and 1.0 ml. in 12 hours. This would give a flow of about 0.5 mgd. over an area of 5 square miles at a gradient 2:1 (20 ft. loss of head through 10 ft. strata) an insignificant amount. (See equation below.)
Over 5 square miles at 20:1 slope
At slope 2:1 this would be
94 GROUNDWATER IN THE PEORIA REGION
F IG. 41.—Well hydrographs and well locations, Peoria Water Works Company Pumping fest.
HYDROLOGY 95
Dredging of the river bed by the Le-Tourneau Company and pier construction for the Harvard Street bridge revealed that silt deposits at these locations ranged from 5 to 25 feet in thickness.
ILLINOIS RIVER AT FLOOD STAGE
It was generally known that floods in the Illinois River were accompanied by marked rises in groundwater levels. This phenomenon has led many to believe that major recharge of the water-bearing deposits occurs during floods.
In an effort to provide a logical explana-tion for this phenomenon, a detailed study
FIG. 42.—Location of Infiltration pit and Observation wells.
of areal groundwater conditions before, during, and after the floods of 1943, 1944, and 1945 was made. More frequent water level measurements in some wells were ob-tained. A discussion of the observations is included in Chapter 6.
A R T I F I C I A L I N F I L T R A T I O N S T U D I E S
To obtain some idea of the feasibility of restoring groundwater by land flooding, a relatively large scale experiment was made. Hiram Walker and Sons, Incorporated, furnished land, equipment, chemicals, and labor for the tests. The relative locations of the test pit (abandoned gravel pit) and all Observation wells are shown in figure 42.
Water was pumped from the Illinois River at an approximate rate of 2200 gpm. (average 3.2 mgd.), chlorinated, and dis-charged into the test pit having a surface area of about 0.1 acre. The pumping periods, behavior of water levels, and groundwater temperatures in selected Observation wells are indicated in figure 43. Salt tests made to measure groundwater velocity indicated velocities ranging from 75 to 200 feet per day. Bacteriological contamination attributed to the infiltration test was detected in a nearby well owned by Armour and Co. The average rate of infiltration during the test periods was 37 million gallons per acre per day.
Possibly the most significant phenomenon observed was the close similarity of well hydrographs in relation to recharge in the test pit with hydrographs of wells along the river bank during Illinois River flood periods.
FIG. 43.—Pumpage and hydrographs of levels in Observation wells during infiltration tests.
CHAPTER 12
I N T E R P R E T A T I O N O F H Y D R O L O G I C OBSERVATIONS
The factors governing groundwater development, conservation (beneficial use) and replenishment are very complex. In making the necessary simplifications and generalizations required for a general un-derstanding or mathematical treatment of the involved phenomena, there are many opportunities to ignore or minimize the influence of pertinent data and thus be led astray in logical reasoning. It is with this knowledge in mind that, in the following, more stress is given to the relationships between the interacting forces than to the presentation of explanations. Where ex-planations are given they are admittedly incomplete and serve only as an aid to planning until more facts and studies permit the formulation of better explanations.
S A N K O T Y F I E L D
The Sankoty well field is isolated from the effects of other well fields by bedrock outcrops and distance.
In figure 15 are shown Illinois River stages, non-pumping water levels in Peoria Water Works Company well No. 7 (con-structed in 1911) located near the center of the Sankoty field, and the monthly pump-age by the Peoria Water Works Company, from 1941 through 1945. It is seen that water level in well No. 7 was always below river stage but that changes in groundwater levels were much greater than changes in river stages. Comparing river stages, water levels and rainfall (flg. 33) for September and October of 1941 it is seen that there was excessive rainfall in the area, and that while the maximum rise in river stage was 5 feet, groundwater levels rose 25 feet. At the same time pumpage was reduced to an average of about 2.5 mgd. (including no pumpage for certain periods), as the field was used only when necessary to Supplement pumpage from the Peoria Water Works
main Station (in the North field). Be-ginning in January of 1943 there occurred a period of heavy rainfall culminating in the flood of May 1943 in which Peoria Water Works Company pumpage was reduced from about 10 to 4 mgd. but the maximum change in river stage was 17 feet as compared to a 30-foot rise in groundwater levels. From June 1943 to February 1944 was a period of deficient rainfall and with pumpage averaging about 8.9 mgd., the groundwater level at the center of pumpage dropped to 405 feet M S L . as compared to river pool stage of 440 feet. It is un-fortunate that no water-level data are available prior to 1941, since there is no other means of determining the effect, if any, of closing Peoria lock and dam.
Examination of the water-level contour maps (figs. 21-29) and the water-water differential contour map (fig. 32) reveals the existence of local recharge, but not the source. The wet period in September and October of 1941 would indicate the possi-bility of considerable direct Infiltration ex-cept that a thick layer of Wisconsin drift overlying the Sankoty sand (see Part 1 on Geology) might preclude rapid direct in-filtration. Not shown but pertinent to the possibility of recharge from the upland area is the hydrograph of the Municipal Sani-tarium well. For a brief period after the flood crest of 1943, water level in this well was above river stage although water levels in wells nearer the river were below river stage. This indicates that substantial recharge was occurring from the upland areas.
On the east side of the river, Wisconsin glacial outwash sands and gravels of the Illinois River Valley fill are in contact with the Sankoty sands and also the alluvial outwash fan of Tenmile Creek located south-east of the field. Thus there is the possibility that considerable recharge occurs from these directions.
[ 9 7 ]
98 GROUNDWATER IN THE PEORIA REGION
The present channel of the Illinois River is also eroded in the Sankoty sand1 and direct infiltration from the river is a possi-bility, but this portion of the channel (Lake Peoria) is extensively silted. Using the permeability data obtained during construc-tion of the Harvard Street bridge piers (Chapter 11) and using generous estimates for thickness of silt and hydraulic gradient, the maximum recharge from the approxi-mately five square miles of river bed in a favorable position at pool stage to recharge the Sankoty field could be about 1.0 mgd., or about 10 percent of the pumpage.
Other possible sources of recharge are from Dunlap buried Valley to the west and the buried Mississippi channel to the north. The groundwater divide in the Pekin-Sankoty channel connecting Sankoty and Central fields precludes recharge' from that direction, and the bedrock hill just south of Sankoty is an effective barrier. There is as yet no hydrologic data available to per-mit estimation of relative contribution from each of the various possible sources.
The lowest noted depth of water over bedrock in the field was about 40 feet (Feb-ruary-March 1945) when field pumpage was about 13.0 mgd. This plus the be-havior of water level indicates that although the field is not seriously overpumped, it has been fully developed. However, individual wells have pumping levels below top of screens during low-water periods, which generally shortens well life and causes operating difficulties.
N O R T H F I E L D
The North well field is limited in extent and development by both topographic and subsurface geologic features, being located on a narrow terrace between the Illinois River and the bluff. The field is limited on the northwest and southeast by buried bedrock hills.
Figure 16 shows Illinois River stages and hydrographs of wells at the Peoria Water Works main Station, Bemis Brother Bag Company, Allaire-Woodward Company and R. G. LeTourneau and Company from 1941
1 See Plate 3.
through 1945. This field shows the same general relationship between river stage, groundwater levels, and rainfall that was observed in the Pekin and Sankoty fields. During periods of receding river level after major floods there is a noticeable time lag in groundwater level recession in wells pro-gressively farther from the Peoria Water Works. This effect is attributed to pumpage by the Peoria Water Works Company as it accounts for about 90 percent of the field pumpage. It is also noted that groundwater levels at the Allaire-Woodward Company are occasionally above river stage for a brief period after passage of river crest stage. At the LeTourneau plant, water levels were sometimes above river stage, and after the flood of 1944 which was accompanied by heavy local rainfall, groundwater levels were above river stage from mid-1944 through 1945. This would indicate local direct recharge from the bluff area west of the field because the bedrock hill is presumably impervious and thus a barrier to lateral groundwater movement. However, during most of 1945, groundwater levels remained 3 to 5 feet above river stage, and this may have been due, in part, to the hydraulic fill being placed in the area (Chapter 11) . This may also be an indication of direct surface recharge.
The difference in groundwater level and river stage at the Peoria Water Works Station is favorable to infiltration from the river, but less than one Square mile of river bed is within the possible cone of influence and, using permeability data as before, the river recharge would be about 0.2 mgd. or about 4 percent of the pumpage. The be-havior of water levels in the Observation wells during the pumping test of 1938 (figs. 39 and 40) possibly indicates that consider-able recharge was occurring from the river. The water-level profile was normal except for Observation well No. 5. The shoreline at the time was between Observation wells No. 4 and No. 5 and the abrupt rise in hydraulic gradient between the two wells indicates that recharge was occurring near well No. 5. Details of construction of the Observation wells are not available and it is possible that the change in gradient is
HYDROLOGY 99
the result of leakage around the casing, but the behavior of water levels at the different pumping rates indicates greater infiltration than could occur around a single string of pipe.
The other possible sources of recharge are lateral flow from the ancient Mississippi channel and from the alluvial outwash fan of Tenmile Creek which is directly opposite the Peoria Water Works. No hydrologic data are available that will permit estima-tion of relative quantity of recharge from each of the various possible sources.
Pumpage was commenced in the North field by the Peoria Water Works in 1892, and in 1909 it was reported that ground-water levels varied with river stage and that in a dry year the estimated available yield of the main well was 5.0 mgd. and of all auxiliary and reserve wells about 3.4 mgd. Estimated average pumpage increased from 4.5 mgd. in 1904 to 6.08 mgd. in 1908 and to 8.0 mgd. in 1910 at which time develop-ment of Sankoty field was started.
By comparison of the above data with the average pumpage data available from 1941 through 1945 it is apparent that the total average pumpage from the field had been reduced, and that although the 1945 devel-opment was probably somewhere near the safe annual yield of the field, there was no overpumpage, and with due regard to well spacing, very limited additional supplies could be developed. During low ground-water periods there is only 15 to 20 feet of water above the bottom of the wells to provide for necessary drawdown and screen submergence.
C E N T R A L F I E L D
For discussion purposes the Central well field is divided into the East Peoria portion and the Peoria industrial portion.
EAST PEORIA PORTION
The East Peoria portion has some pecu-liarities which distinguish it from the re-mainder of the Central field. The hydro-logic data indicate two partially independent aquifers in this portion of the Central field.
Shallow wells in Farm Creek Valley seem unaffected by deeper wells in the Illinois valley.
In the valley of the Farm Creek and the top part of the alluvial fan of the Farm Creek in the Illinois River valley are shallow sand deposits (25 to 30 feet deep) fur-nishing considerable water. The East Peoria municipal supply and a few air con-ditioning wells are in this aquifer. Wells in this aquifer seem to be unaffected by the pumpage in the nearby but deeper wells of the Caterpillar Company, but show rapid changes with rainfall and flash-floods of Farm Creek, from which they are in all probability directly recharged. This might explain the low visible flow at times in Farm Creek and the development of these shallow deposits to the maximum safe yield in dry periods.
The larger industrial supplies have been developed in outwash deposits of Farm Creek which perhaps are mingled with Illinois valley-train deposits (see Part 1 on Geology). The slope of the bedrock hill on which the North well field is located extends beneath the Illinois River to the East Peoria field, and consequently wells drilled near the river encounter bedrock at shallower depths than wells drilled nearer the east bluffs.
Conditions in the southern part of the East Peoria portion are typical of confined groundwater. This was observed clearly while drilling the test wells at the East Peoria sewage treatment plant. On the other hand no such confined water conditions were found in the northern part at the Sword property although much fine silt was found.
Illinois River stages and hydrographs of water levels in wells owned by Caterpillar Tractor Company and the East Peoria sewage treatment plant are shown in figure 15. The period of Observation is too short (1942 through 1945) to develop any signif-icant trends. It appears that groundwater levels are primarily controlled by rate of pumping (minor changes excluded) at the Caterpillar plant and that this effect masks any but the major changes caused by varia-
FIG. 44.—Selected well hydrographs and river levels, 1943 flood.
HYDROLOGY 101
tions in rainfall or river stages. Approxi-mately 80 percent of the field pumpage (6.0 out of 7.6 mgd.) is withdrawn by the Caterpillar Company. During flood periods there is a definite lag of groundwater level peaks behind river crest stage and the lag is greater at the Caterpillar plant, which is farther from Illinois River, than at the East Peoria Sewage Works. This is more clearly shown in figure 44, which gives the hydrographs during the flood of 1943. At peak river stages, the East Peoria Sewage Works well flowed, thereby preventing determination of maximum groundwater levels. This behavior is analogous to sand boils which commonly occur behind levees during flood periods in many areas and is attributed to artesian conditions.
The general shape of groundwater con-tours in the East Peoria field (figs. 21-29) indicates general movement of water from the Farm Creek alluvial fan to the Peoria industrial district. However, Caterpillar Company pumpage distorts the contour lines to a certain extent. Figure 26, show-ing groundwater contours on June 1, 1943, clearly shows a restricted cone of influence in the East Peoria industrial area which indicates recharge from all directions, Farm Creek to the east and the Illinois River to the north, west, and south. There is also probably direct surface infiltration from rainfall. In 1944, a connection was acci-dentally broken on a fuel oil storage tank at the Caterpillar plant and the oil which escaped reached a nearby pumped well in a very short time. Although the physical properties of oil and water affecting rate of movement are different, the incident does indicate that direct surface infiltration oc-curs.
The present pumped area appears to be developed to maximum potential yield, and test drilling in the southern area of the fan indicates less favorable materials. As good or better water-bearing material may be located in the up-stream area of Farm Creek fan, but the effect of additional develop-ment on yield of existing wells cannot be predicted.
PEORIA INDUSTRIAL PORTION
The Peoria Industrial field includes all the area west of the Illinois River and north of Kickapoo Creek not included in the well fields previously described. Wells are located throughout the area but the major pumpage is concentrated in a narrow belt along the Illinois River between Franklin Street bridge and Kickapoo Creek.
It was shown in Chapter 9 that recharge to the Central field must occur from some source or sources, since if the water had come only from storage the field would have been pumped dry long ago. Study of the available data reveals that the possible major recharge sources are direct surface infiltration, infiltration and percolation from present and buried Kickapoo Valleys, and infiltration and percolation from the Illinois River. It also appears that most of the recharge occurs during river flood periods which generally coincide with periods of heavy local rainfall, thus even when fair data are available it is difficult to determine relative effects.
In figure 33 are shown the long-time (1936-1945) hydrographs of wells at Hiram Walker and Sons, Incorporated, and the Peoria Sanitary District, together with river stage and rainfall data. Both these plants are located near the river and near the center of heaviest pumpage. A study of this and of some earlier water-level data shown in figure 20 (1933-1945) indicates a continual fluctuation in groundwater levels which have a close relationship with river stages, but which are not as closely related to areal rainfall variations as are the fluctuations in Sankoty field. It was observed in the Sankoty field that the heavy rainfall in late 1941 together with a major reduction in withdrawal, and relatively minor changes in river stage, caused a 25-foot rise in water levels. In the North field the comparable rise was 20 feet, but in the Hiram Walker wells in the Central field the rise was less than 5 feet. Thus it appears that there was less rapid recharge to the Peoria Industrial field than to the Sankoty and North fields although the total quantity was probably greater. It is also
102 GROUNDWATER IN THE PEORIA REGION
observed that although levels subsequently fell, none of the levels dropped to the previous 1941 low, prior to the flood of February 1942.
It is also observed on figure 33 that the longest period of uninterrupted recession in groundwater levels was from early 1939 until late 1941 during which time the river stage was controlled, there was a rainfall deficiency, and there were no floods. It is also observed that floods in 1942, 1943, and 1944 caused large changes in water levels, but little benefit to groundwater levels was observed as compared to the effects of lesser floods in 1936, 1937, and 1938. As the pumpage did not change greatly in the period 1943 to 1945, this does not seem to be a major factor. It may be pertinent to note that these wells are adjacent to that portion of the Illinois River below Lake Peoria and above Peoria lock and dam. Rate of infiltration during low river stages may have been influenced by lowered diver-sion and river stage control resulting in low stream velocities with consequent greater tendency to bed silting.
CENTRAL F IELD AS A W H O L E
Despite the somewhat independent be-havior, particularly during floods, of water levels in the East Peoria and the Peoria Industrial well fields, the fields are hydro-logically interconnected. This was demon-strated by variations in water levels in cer-tain recorder wells which could be traced to known causes. Shutdowns at the Caterpillar and Hiram Walker plants, which did not occur simultaneously, were reflected in the East Peoria sewage plant recorder well. Likewise, water levels in recorder wells at Pabst Brewing Corporation and Gipps Brewing Company were affected by variations in pumpage at the Caterpillar plant and by Hiram Walker's pumpage. Water levels in the Sword well were influenced by Caterpillar pumpage, but not by any other pumpage.
Flood Effects.—The effect of all floods on groundwater levels appears to have been similar, so a study of one flood appears to be sufficient. There may be some difference in
effect of floods before and after closing the Peoria lock and dam but little information is available for the earlier period and it is the latter period with which we are most concerned.
In figure 44 are shown hydrographs of certain wells from April 10 to October 1, 1943, a period which includes the flood of April 25 to July 1, with crest on May 23. The average of Armour and Hiram Walker well data is plotted as one curve. These plants and the Century Distilling Company are located on the river. During rising river stages there was a very short time lag in rise of groundwater levels, but during falling river stages there was a very pro-nounced time lag in recession of groundwater levels. Three months after the river stage had returned to pool level, groundwater levels in these wells were about 5 feet higher than on April 10, although no change occurred in rate of pumping. This is in definite contrast to groundwater level behavior in the East Peoria field where pre-flood levels recurred promptly.
The Lincoln Park well is located about 3000 feet from the river and the Armour-Hiram Walker wells. Water levels con-tinued to decline slowly in this well from April 10 to May 20 and then started a slow rise to a maximum level which was reached about July 1, by which time the river had returned to pool stage.
At the time of the peak at Lincoln Park, water levels in the Hiram Walker and Armour wells had returned from higher values to the same elevation as that in the Lincoln Park well. .
Water level in the well declined slowly from July 1 to October 1. On April 10, and from September 1 to October 1, the level was 7 feet above water levels in the Armour-Hiram Walker wells. This is be-lieved to be the normal condition of the hydraulic gradient (slope of water surface) between the Lincoln Park well and Armour-Hiram Walker wells and is attrib-uted to the effect of heavier pumpage in the vicinity of the latter wells. Therefore, if the hydraulic gradient between the wells on April 10 and on September 1 is a "normal" or "stable" condition, then the
HYDROLOGY 103
rise in areal water levels between April 10 and September 1 represents an actual in-crease in the volume that is saturated with water. During the "stable" periods, ground-water movement would be from the Lincoln Park well to the industrial area (towards the river). However, from May 20 to June 22 water levels in the Armour-Hiram Walker wells were above the water level in the Park well and groundwater movement during the period was away from the river. This plus the shape of groundwater con-tours (fig. 26) does not, however, clearly identify the source of the water.
The same phenomena are observed farther up the river opposite the lower end of Lake Peoria. In figure 19 is shown the hydrograph of wells at Peoria County Jail, Palace Theatre, and the Peoria Apron and Towel Supply located approximately 1400, 2200, and 3000 feet from the Illinois River, respectively. There is a distinct time lag between rise in river stage and rise in groundwater level, and the time lag in-creases with increased distance from the river. In each case the well farthest from the river reaches its peak when water in the wells closer to the river declines to the elevation of that peak.
The hydrograph of the Bradley Park well (fig. 20) , located in the Pekin-Sankoty buried Channel and in the present valley of Dry Run Creek, reveals that water levels in this well have been 1 to 5 feet above pool stage for the period of Observation. Changes in river stage have little or no effect on water levels in this well. There is apparent-ly some relationship between water levels and areal rainfall, which indicates field recharge from the northwest.
The areal groundwater contours also re-veal the same phenomena, but insufficient quantitative hydrologic data are available to permit estimation of relative contribution of the various sources of recharge. Calcula-tions made from the groundwater contour maps are not exact, since the contours are of necessity somewhat generalized. However, such calculations give a good idea of the magnitude of the observed changes.2
2 Suter, Max, Apparent changes in water storage during floods at Peoria, Illinois: Trans, Amer. Geophysical Union, Vol. 28, pp. 425-437, June 1947.
The pumpage during this period in 1943 was fairly constant and did not vary more than ±5 percent.
In Chapter 9, the average net change in volume of saturated material was computed for the ten-year period 1933 through 1943. By the same methods, the apparent changes in storage during rising and falling river stages during the flood of 1943 was computed. The periods selected were May 1 to June 1, June 1 to July 15, and July 15 to September 1. The river crested May 23, but water levels in wells reached maximum elevations from four days to four weeks later, depending on location of wells and distance from the river. During the period from June 1 to July 15, conditions were very unstable as the water levels in some wells were rising and in others levels were receding as the field was adjusting itself to changing rates of infiltration and relatively constant pumpage. Although this adjust-ment appears to be entirely without reason when one studies individual well hydro-graphs, it is actually very orderly when one studies the water-level contour maps (figs. 25-28). After July 15, water levels in the field began a normal adjustment to pumping conditions and well hydrographs were simi-lar to those obtained in other areas during well field pumping tests.
If, after assuming no outflow to the river or inflow from the uplands, the specific yield is calculated for the period July 15 to September 1, 1943, a value of 7.3 percent is obtained. If it is attempted to calculate comparative "balance sheets" for inflow, recharge, pumpage, and removal-from-stor-age for any flood period, a balance cannot be obtained, no matter what specific yield (in the range 0-30 percent) is assumed. This makes it appear that there is some in-terfering influence, possibly a compressi-bility effect. In table 8 are shown material balances for the periods between May 1 and September 1.
The data available are not adequate on the following points, which require further investigation:
1. Extent of artesian influences in the area.
HYDROLOGY 105
4 f eet, possibly lowering the natural hydrau-lic gradient to the pumped wells which had to be compensated by an equal lowering of water level at the wells. Increased pump-age and lower river stage appear to be sufficient cause to account for the industrial area water-level recession, so there appears to be no cause for immediate alarm over the existing Situation.
The present industries in the area may have both wells and plants spaced too close-
ly for best well yields. However, the avail-able evidence indicates (1) that the ground-water resources of the area are not over-developed, and (2) that additional water is available to existing or potential users without detrimental effects on present developments providing that consideration be given to geologic conditions and that hydraulic principles be applied to well spacing.
CHAPTER 13
R E M E D I A L M E A S U R E S
In previous chapters, it is shown that the Central well field and particularly its Peoria Industrial portion is the only well field in the Peoria-Pekin area where the condition of the groundwater supply is critical, although it is apparent that the Sankoty and North well fields are devel-oped to near maximum potential. There-fore, possible remedial measures are dis-cussed primarily from the viewpoint of alleviating conditions in the Peoria Industrial field.
There are many possible Solutions to the problem of recreating a dependable and ade-quate groundwater supply in the Peoria area. The methods discussed may be classi-fied as follows:
1. Reduction of pumpage and wastage. 2. Development of new well fields. 3. Substitution of surface water. 4. Replenishment of groundwater.
Another possible Solution, negative in ap-proach, would be to attempt nothing and let economic and geographic factors bring a readjustment in conditions with resultant detrimental effects to all but a few. The purpose of this study is to suggest possible Solutions that would be of benefit to all.
R E D U C T I O N O F P U M P A G E A N D W A S T A G E
It was shown that the approximate over-pumpage in the Central field was about 6.0 mgd. The annual increase in water consumption is estimated to average from 1 to 3 mgd., most of which will be for industrial use and air conditioning. Thus, low-temperature water during the warmer months, obtainable from wells only, is re-quired. The increased overpumpage may easily reach 20 mgd. in 10 years. This water must be provided by some means.
Normal growth of industries, population, and Standard of living necessitates a steady
increase in the demand for water, and pres-ent trends are towards higher per capita consumption, both for domestic purposes and for industrial needs. It is therefore difficult, if not impossible, to reduce water consumption unless an actual shortage exists. However, by eliminating waste uses, the rate of increase in consumption can be held to a minimum.
For many purposes, more recirculating Systems using either groundwater or surface water could be substituted for "single shot" groundwater cooling. In many air conditioning installations the only change in the groundwater pumped is a 2° F. tem-perature rise between well and sewer. This is an inefficient use. In many plants, water first used for cooling could then be used for processing. Economic studies based both on short-term and long-term planning may give vastly different results.
D E V E L O P M E N T O F N E W W E L L F I E L D S
Another possibility for relieving the exist-ing and potential groundwater shortage in the Peoria industrial area is the development of new well fields, conveying the water through pipelines to existing users. To re-lieve the existing shortage of about 6.0 mgd., a single field with a safe annual yield equiv-alent to Sankoty field (about 10 mgd.) would be required. To relieve the probable future shortage in addition to the existing shortage would require the equivalent of two Sankoty-like developments. On the basis of geologic and hydrologic data, such potential well fields do exist. The actual development, of course, will be determined by economic and other considerations as well as geologic and hydrologic factors.
On figure 7, in Part 1, are shown the areas contiguous to the Peoria industrial area which from geologic data are favorable for the development of groundwater. The
[106]
HYDROLOGY 107
same areas are discussed on the basis of hydrologic data in addition to the geologic data.
Area I is within limits of influence of Peoria Industrial pumpage, so additional development in this area will only increase the existing water shortage in the Peoria Industrial area. The hydrologic data (Chapter 12) indicated very little infiltra-tion from the Illinois River at normal stages upstream from Peoria lock and dam, and additional wells would intercept water now moving to the center of pumpage.
There are two other areas downstream which may be capable of furnishing a safe yield of several million gallons per day. The area over Pekin-Sankoty channel between Peoria lock and dam and Pekin would re-quire about five miles of pipeline including a river crossing to make the water avail-able at Peoria. The area in the bend of the river opposite Pekin has not been explored. Its development would require about eight miles of pipeline to Peoria and protection of facilities against flood.
Area II is also within the limits of influence of Peoria Industrial pumpage and additional development will increase the existing water shortage. Drilling in the Pekin-Sankoty channel between Sankoty field and the Central field has been dis-appointing in that it has not been possible to develop large capacity wells in the ma-terials encountered. Total thickness of un-consolidated materials in the Kickapoo Creek re-entrant is about 40 feet, thus def-initely limiting the yield of any well, and any development would intercept water now moving to the center of pumpage. It is possible that constructing wells in the coarse materials known to exist near the inter-section of Pekin-Sankoty buried channel and present Kickapoo Creek will permit operating economies, but this will not alle-viate the existing shortage.
Area III is located in Pekin-Sankoty channel north of Sankoty field. The cone of recession of the Sankoty field extends about one mile from the center of pumpage. A similar development in similar materials would require a minimum distance of two
miles to avoid interf erence with the Sankoty field. Drilling in the upland areas revealed that only the lower few feet of Sankoty sand is saturated and that large capacity wells cannot be constructed. This limits development to the Illinois River flood-plain north of the south line of Township 10 North. Ten to 12 miles of pipeline would be needed to convey the water to existing users as the carrying capacity of present lines was reported to be fully utilized. On the basis of hydrologic data, the area is favorable for development of additional supplies. Much exploratory and testing work will be needed to determine the actual quantity of water that might be developed.
Area IV includes the Tenmile Creek alluvial fan and areas northward. There has been considerable test drilling and well testing in the southern end of this area, which has revealed a large potential supply. The water has a high iron content which must be removed to make it satisfactory for use. The area may be an intake area for recharge to the Sankoty and North fields. About nine miles of pipeline (including a river crossing) would be required to make the water available to existing users.
Area V located north of Farm Creek is from general hydrologic principles not re-garded as being favorable. Any development along the Illinois River bottoms would be within the range of influence of pumpage from the Central field. Where thick drift deposits (upland area) overlie water-bearing sands and gravels, the rate of recharge is generally low. Although large quantities of water can often be pumped from existing storage in such areas for a few years, the safe annual yield is much smaller than in a deposit of equal size which is recharged from close-by sources. The area does Warrant additional study, particularly if a tentative decision is made to supply groundwater to Peoria from out-side areas.
Other Areas outside the Peoria metropoli-tan district have not been thoroughly in-vestigated but it is apparent that groundwater supplies could be developed.
108 GROUNDWATER IN THE PEORIA REGION
Any such area, however, has to be studied not only for its possible water yield, but also for the economic evaluation of its use. This latter phase is outside of the sphere of studies of the State Water Survey.
Additional areas used for groundwater supplies must furnish, economically, the present deficit of about 6 mgd., plus water for industrial expansion, or these areas may be incorporated in a regional plan for de-centralization of industry and for the loca-tion of new industries. The econom-ical considerations of bringing additional groundwater to the Peoria Industrial area may naturally be changed by the demand for water and by relative changes in con-struction costs.
S U B S T I T U T I O N O F S U R F A C E W A T E R
Surface water from the Illinois River can be and is being used for certain purposes where bacteriological purity, chemical qual-ity, and temperature are of minor impor-tance. Temperature of the water is im-portant for cooling and condensing purposes, and some industries use surface water only when its temperature is below that of the groundwater. Certain industries, by installing equipment to handle larger volumes of warm surface water as com-pared to smaller volumes of colder groundwater, have reduced the drain on existing groundwater supplies. Others could do the same. It would require a plant-by-plant investigation to determine the practicability of this method, and there is also a practical limit to the reduction in groundwater with-drawal that could be obtained.
For many uses, both temperature and quality are of major importance. This re-quires treatment of the raw water and also limits use to periods when cold water can be obtained from the river.
It appears that intermittent use or year-around use with treatment is not a com-plete Solution to the problem, although such usage can ease the existing Situation.
R E P L E N I S H M E N T O F G R O U N D W A T E R
It became apparent during this investigation that replenishment of groundwater resources by artificial means seemed the most practical method of completely solving the existing groundwater problems. Some experimental work was done and much more will be needed to overcome operating difficulties. There is an adequate source of reasonably good quality water available— the Illinois River.
NATURAL M E T H O D S
Increased recharge by natural means was ruled out on the basis of relative high cost and lack of control. The field infiltration studies indicated that the natural recharge in the upland areas could be increased by contour farming, but there is as yet no proof that increased recharge in the upland area would materially increase the groundwater supply at Peoria. Dredging in the Illinois River channel was ruled out be-cause a 15-year record of dredging in the channel between Franklin Street bridge and Peoria dam did not indicate much benefit to groundwater resources, and even if benefits did occur there could be no control over possible bacterial contamination or temperature of water recharged.
ARTIFICIAL M E T H O D S
Artificial infiltration can be accomplished by several methods including (1) flooding of suitable but otherwise unprepared land, (2) infiltration pits which are specially pre-pared and maintained to recharge untreated water, and (3) recharge wells through which only clean pure water can be put into existing aquifers.
General land flooding is practicable only where a very particular set of geographic, geologic, and hydrologic conditions occur simultaneously over a fairly large area con-tiguous to the groundwater reservoir. The rate of infiltration is generally about one mgd. per acre in such areas. Such areas are apparent in the Peoria-Pekin area, but none appear to be close enough to the Peoria Industrial field to be of value to that area.
HYDROLOGY 109
Infiltration pits also require a special set of natural conditions, but the conditions are not as rigid as for general land flooding. A smaller area is required, as the rate of infiltration is about 20 mgd. per acre, but excavation of overburden (if any) to the top of clean (water-transmitting) sand and gravel is necessary, and periodic removal of silt accumulations during use is required. The only water treatment required is chlorination.
Recharge wells require the same careful construction that is used in pumped wells, and often the same well can be used for both purposes—as a return well in certain seasons and as a pumped well at other times. In order to avoid well failure it is necessary to remove all solid and organic material and to stabilize chemically the water before putting it into the well. Ex-perience in other areas indicates that even with water treatment, it is necessary to rehabilitate the return wells from time to time.
Groundwater Storage Space.—Artificial infiltration aims to store cold surface water Underground. To be effective it requires (1) that sufficient Underground storage
space is available to last through the dry season and (2) that conditions are favor-able for a high percentage recovery of the infiltrated water. Calculations from groundwater contour maps show that on an aver-age 250 square mile feet of gravels are available for storage below elevation 440 feet. To store 10 mgd. for six months on a basis of 10 percent specific yield would require 86 square mile feet. This much storage is available below an elevation of 423 feet.
There is little danger that this stored water will be lost, even by outflow below the dam. The lowest river elevation below the Peoria dam is 430 feet, due to the effect of the LaGrange dam 77 miles below the Peoria dam. At this elevation the average storage space is 125 square mile feet, or more than that needed for the Peoria re-quirements.
In conclusion, it appears that both infiltration pits and return wells are feasible in the Peoria area, but too little is known of operating costs and difficulties to favor one over the other. Much additional large scale experimental work is required before the best method is known and it may be that both will have a place in the Peoria area.
PART 3
C H E M I S T R Y
BY
T. E. LARSON
Head, Chemistry Sub-division
STATE WATER SURVEY
CHAPTER 14
GENERAL
While the geologic and hydrologic studies were in progress, water samples were col-lected at many points in the Peoria-Pekin district. Study of the results of these analyses was carried on in liaison with the other parts of the work.
Since it was found, by correlation, that the water from a particular source is of generally constant character, it became possible to interpret the analytical data to show the origin of the waters obtained in each well field. Changes in character that occurred at any particular well were ac-companied by relative changes in hydrostatic pressure in the immediate vicinity as a re-sult of both extraction and recharge. It was therefore necessary to consider rainfall, river elevations, and such pumpage records and water level data as were available.
The study concerned the water quality of the Illinois River and the industrial and municipal well fields of Peoria, and also those of Peoria Heights, East Peoria, and Pekin. All available records on farm and Community wells in the surrounding area within roughly a 25-mile radius were also included. With few exceptions only drift wells above the bedrock were examined which range in depth from about 50 to 300 feet. Water from the bedrock is not con-sidered in this report because it is highly mineralized and is not a major water supply factor in the area.
A N A L Y T I C A L M E T H O D S
The determinations made on the samples included Volumetric procedures for chloride, alkalinity, calcium, magnesium, and total hardness, a colorimetric procedure for iron, and the conductivity procedure for total mineral content. Nitrates were determined on some samples because this constituent was found to be present in an appreciable concentration. This determination is not considered of quantitative significance due
to bacterial changes in nitrogen Compounds that can take place in the samples during the time between sampling and analysis. Sulfates were determined by the gravimetric procedure. Methods were in accordance with procedures in the Ninth Edition of A.P.H.A. Standard Methods of Water Analysis.
G L A C I A L D E P O S I T S
The immediate Peoria-Pekin area offered no fixed reference values for the quality of water to be expected from any particular glacial deposit, because extraction and recharge during the history of well water use in the immediate area have altered the com-position of the available water in the forma-tions and continue to do so.
To establish a working basis for compari-son, well water samples were obtained from the geologic formations in the region surrounding the area under study.
In Part 1 it has been shown that a broad buried Valley connected with the Mississippi River existed at one time about 20 miles east of Peoria. Bedrock elevations range from 300 to 750 feet M S L (Mean Sea Level datum). Ground surface ranges from 440 to 850 feet MSL. This buried rock valley is now filled with a preglacial or early glacial sand deposit (called Sankoty sand) to an elevation of about 500 feet MSL. This sand is also found in places along and under the present Illinois River and at the base of another buried valley north and west of Peoria.
The Sankoty sand is covered almost uni-formly by the Illinoian glacial till. The latter was extensively cut by streams and does not constitute a major source of water. For the most part the Sankoty and Illinoian formations are overlain by the deposits from the Wisconsin glacial period. These Wisconsin moraines and till-sheets are extensive
[113]
114 GROUNDWATER IN THE PEORIA REGION
and cover almost the whole area. There has been considerable erosion along the pres-ent Illinois River, and outwash deposits are found here and as narrow fringes bordering the moraines. These deposits are thickest in these areas. For the most part water is
found only in discontinuous and lenticular deposits in the Wisconsin drift, but the outwash deposits below the lower terrace along the Illinois River are generally well strati-fied and are therefore favorable areas for groundwater development.
CHAPTER 15
GEOLOGIC CORRELATION
C H E M I C A L C H A R A C T E R
GLACIAL DEPOSITS
Water from the Sankoty formation was found to be invariably characterized by a low sulfate content and by the presence of appreciable concentrations of ammonia and iron. All 66 samples of water from this formation showed these waters to have a sulfate content less than 7 ppm. The iron content was invariably greater than 1.0 ppm. and the ammonia up to 10 ppm.
Waters from the Wisconsin drift and the glacial outwash deposits are characterized by the presence of appreciable sulfate concentrations (greater than 10 ppm.). A further distinction was apparent in the nitrate content. Waters from glacial outwash deposits and from outwash Valleys cut in any of the lower formations almost al-ways had a high percentage of nitrate. Samples from 21 wells penetrating glacial outwash were found to contain 12 to 425 ppm. nitrate. The iron content of these samples was frequently but not always low and the sulfate content ranged from 40 to 207 ppm. Some wells in the Wisconsin formation near the areas where the bedrock crops out yield water of 600-1000 ppm. sulfate.
Waters from all 19 samples from lentic-ular sand deposits in the Wisconsin drift areas contained 0 to 1 ppm. ammonia, 1 to 15 ppm. nitrates, and 15 to 102 ppm. sulfate. The iron content varied from 0.2 to 6 ppm.
The hardness and alkalinity of the samples from each formation were far from distinctive, ranging from 200 to 400 ppm. and 300 to 450 ppm., respectively, for Sankoty water. For the Wisconsin and outwash waters, the hardness ranged from 300 to 600 ppm. and the alkalinity from 200 to 500 ppm. Neither the hardness-alkalinity nor the calcium-magnesium ratio
was consistently distinctive for waters from any formation.
ILLINOIS RIVER
Another factor considered in this study is the quality of the Illinois River water. There is a dam across the narrow Channel of the river south of the industrial district, which maintains a minimum level of 440 feet MSL. in the river and in Lake Peoria. The quality of the river water (minimum flow 4000 second-feet) is influenced not by the pool level but by the total flow and by the Proportion of the total flow which originated as diversion from Lake Michigan and as sewage from Chicago.
The mineral quality of the Illinois River water is characterized by its hardness-sulfate ratio. In general, the hardness (as CaCO 3 ) varies linearly with the sulfate ( S O 4 " ) concentration. The total hardness varies from 182 to 352 ppm. and the total mineral content from 196 to 443 ppm. The Chlorides vary from 7 to 30 ppm. The nitrate content is less than 15 ppm. The sulfate-hardness characteristic of the Illinois River water is distinctively different from that of Farm Creek water (fig. 45) and from any of the groundwaters in the area (figs. 48, 50, 51, 53) .
BEDROCK
Below the drift, water can be and is ob-tained from the Pennsylvanian sandstones, the Keokuk-Burlington limestone, the Silu-rian dolomite, the Galena-Platteville dolo-mite, and the St. Peter sandstone. Analyses of these waters are tabulated in table 9 according to depth.
Water from the Pennsylvanian formation just below the drift is typified by analyses of waters from two wells located just west of Peoria. These waters are characterized by a high mineral content, chiefly chloride, the absence of sulfate, and the relatively low hardness.
[115]
116 GROUNDWATER IN THE PEORIA REGION
FIG. 45.—Relative character of Illinois River and Farm Creek water.
Water from wells in the Keokuk-Burling-ton formation (320-757 feet depth) has an exceptionally high mineral content (8000 ppm.), greater than that of any of the other formations, and is characterized by a chloride concentration of about 4500 ppm. The sulfate concentration is absent or very low.
Water from wells finished in the Silurian formation (774-1040 feet depth) is also highly mineralized (3500 ppm.) and is characterized by the presence of sufficient hydrogen sulfide to produce an obnoxious odor. The chloride content of this water is about 1500 ppm. and the hardness is generally about 175 ppm. The temperature of this water has been variously reported as
62° to 70° F. The most correct value is estimated to be 70° F.
Water from the St. Peter sandstone at the Asylum well has a total mineral content of about 1600 ppm., a chloride concentration of about 300 ppm. and a sulfate concentration of 650 ppm. The total hardness is about 300 ppm. The temperature has been reported as 77° and 78° F.
One peculiarity has been noted in the rock wells. The Grant Street well in 1934 yielded water of quality typical for Galena-Platteville water at a depth greater than 1400 feet. Analyses in 1941 through 1945 have shown this water to contain a higher chloride concentration approaching that which is typical for Silurian water. Actual-ly in 1934 the presence of some Silurian water in this well was evidenced by the reported odor of hydrogen sulfide which still persists. The increase in chloride has been quite large and may be an indication of partial bridging in the well between the Silurian and Galena-Platteville formations.
The Peoria Mineral Company well now on the R. G. LeTourneau private farm, located on the east side of the Illinois River just north of East Peoria, has shown a consistently increasing chloride concentration and the samples collected in 1933 and 1941 were reported to have an odor of hydrogen sulfide. These data indicate that at these wells the artesian head of the Galena-Platteville formation has receded to a point where it is below the non-pumping level of the Silurian formation. thereby per-mitting the entrance of some Silurian water.
At the Peoria State Hospital well the water is largely typical of St. Peter sandstone quality when pumped at 200 gpm. but includes a high proportion of Silurian water when pumped at 600 gpm.
T E M P E R A T U R E
The temperature data have been analyzed with the following factors in mind.
1. The ground temperature at the sur-face varies seasonally with air temperature. This Variation becomes less and less with increased depth to approximately 50 feet
T A B L E 9 . — W E L L S T H A T P E N E T R A T E BEDROCK
* Hydrogen sulfide present. ** Collected during drilling.
118 GROUNDWATER IN THE PEORIA REGION
where the temperature should be equal to or somewhat less than the average annual temperature which at Peoria is about 52° F. The depth of 5 0 ± feet is approximate and will depend on the composition of the materials above. The Variation in the temperature of the ground above 50 feet will have a definite lag behind the seasonal Variation in air temperature due to the heat capacity of the ground.
2. Below 5 0 ± feet the temperature steadily increases with increased depth, and below sea-level in this vicinity the rate is above 1° F. per 67 feet. The ground temperatures at elevations between sea-level and 50 feet below the ground surface vary accordingly where a sea-level temperature of 58-59° F. is estimated.
3. Flowing groundwater has a pro-nounced effect on the temperature at any depth. Recharge water warms or cools the ground to a temperature between that of the recharge water and that of the ground. This effect decreases with increasing dis-tance between the point of recharge and the point of sampling because the heat capacity of the ground eventually absorbs the differ-ence in temperature. Increasing geologic time, or strictly speaking, increasing the total quantity of water increases the distance of temperature influence from the point of rech arge.
4. Chemical reactions taking place in and between the ground and the water affect the temperature depending on whether heat is evolved or absorbed. The Solution of gases is always attended by the evolution of heat, and the Solution of solids may be attended by the evolution or the absorption of heat. The Solution of 1 ppm. CaSO4 evolves 0.02 calories per liter. This is not of quantitative significance in groundwater studies.
5. Bacterial activity may also have an effect on temperature. The conversion of elements of one Compound into another often evolves an appreciable amount of heat. For example, 1 ppm. N H 4 + when con-verted to N O 3 — evolves 5.8 calories per liter. Naturally a large portion of this heat is used for energy by the bacteria.
6. At any particular well, the temperature of the water measured at the pump dis-charged is also affected by the discharge pressure or the change in pressure as the water passes through the tap. It can also be affected by friction at tight bearings or by recirculation within the well if there is a hole in the pump bowls or column pipe. The temperature of water pumped by means of air lift will of course not be representa-tive.
Comparison of recorded temperatures shows that the normal groundwater temperature is 54°-56° F. This has been established at the Meadowbrook Dairy, the Peoria Municipal Sanitarium wells, and at Schwab's Dairy well. T h e recorded temperatures at the Allaire-Woodward and Muirson Label Company wells are in-fluenced by passage through elevated tanks and long pipelines in the building. At Pekin the temperatures are somewhat high because the water passes through about 25 feet of 1-inch pipe before it reaches the sampling point.
At the Peoria Heights wells the temperatures are somewhat lower, possibly due to the fact that the wells are located in a shaded area on the east side of the bluffs.
The waters from the Power House well of the St. Francis Hospital, from Peoria Heights wells Nos. 4 and 5, the Peoria Water Works well No. 7, and the Creve Coeur wells rarely display any appreciable deviation from the normal groundwater temperature.
Figure 46 shows the recorded temperatures at the American Distilling Company well, the new East Peoria city wells, and at three of the Hiram Walker (plant No. 1) wells. This figure also shows the recorded temperature of the Illinois River and the mean monthly air temperatures. It will be noted that the East Peoria wells are about 25 feet in depth. At a depth as great as this the air temperature could hard-ly cause the groundwater temperatures to vary from 46°-63° F. T h e chemical data, however, indicate with certainty (fig. 51) that a large percentage of the water from these wells is obtained indirectly from Farm
CHEMISTRY 119
FIG. 46.—Recorded temperatures of Illinois River water and of Peoria, East Peoria, and Pekin well waters.
Creek. The temperature variations are therefore attributed to local recharge.
The Hiram Walker wells are about 50 feet in depth. T h e No. 2 well is dosest to the river, No. 5 the farthest, and No. 3 al-most as far. The No. 2 well-water temperature varies seasonally with about a three months lag behind the Variation in the Illinois River temperature and about a four months lag behind the Variation in the mean monthly air temperature. It is interesting to note that seasonal Variation in the temperature of the No. 3 well water is not as great and that the general temperature has decreased since 1940. Also the temperature of the No. 5 well water (62° F.) is appreciably higher and has but little Varia
tion. The effect of steam lines and the presence of buildings in this vicinity appears to be great.
No satisfactory explanation is offered for the apparent increased uniformity of the temperature of the American Distilling Company well water from June 1943 to December 1945.
The temperatures at the Hotel Pere Marquette 76-foot well are higher than normal, probably due to its location in the steam district. The Caterpillar Tractor Company 66-foot well No. 9 also yields water of high temperature, presumably due to its location on grounds occupied by buildings heated from a central steam plant.
CHAPTER 16
H Y D R O L O G I C I N T E R P R E T A T I O N
M E T H O D O F A P P R O A C H
It became evident early in the investiga-tion that each well or group of wells in a particular well field required a study separate and distinct from the others. Each was influenced by local geological conditions and local pumpage.
The greatest variations in analyses of samples from individual wells were found to occur in the sulfate and hardness concen-trations and it was found that the relative concentrations of these two constituents served as excellent bases for interpretation. Variations were also noted in the tempera-ture and in the alkalinity of the water from some wells. The alkalinity variations Support the interpretation that there is some infiltration of river water into the water-bearing gravel. Estimates of the sources of the water at any well are based on the general character of the waters, as exempli-fied graphically by patterns showing the hardness-sulfate relationships, rather than on the month-to-month variations. This procedure is necessary due to the rapid changes that have been found to take place from day to day and even from hour to hour.
I N T E R P R E T A T I O N O F D A T A
P E K I N FIELD
This field is located on the east side of the Illinois River south of Peoria and down-stream from the dam. It includes the Pekin city wells and the industrial wells southwest of Pekin. Figure 47 shows the water quality patterns for several of these wells and for the three possible sources. It is apparent that the quality from each well varies considerably. In view of the character identifications discussed so far, two in-terpretations could be made.
It may be reasoned that the patterns rep-resent mixtures of Wisconsin drift water
and Sankoty water with a small quantity of Illinois River water. However, if this were true, first, each pattern should be con-fined within a narrow band limited by the hypothetical mixtures of these two waters. Actually the hardness variations overhang the band on both sides, indicating the presence of a considerable proportion of water from other sources. Second, several tests have shown that the Saturation index of Sankoty water is positive, indicating Saturation with respect to calcium carbo-nate. Third, waters from the Sankoty for-mation invariably contain more than 1 ppm. iron. No indication of iron has been given in the analyses of the water from these wells. Water from the American Distilling Company well shows only four samples con-taining more than 0.1 ppm. iron out of 72 samples. These considerations indicate that the Pekin field derives water from a major source other than the Sankoty and the Wisconsin formations.
The Illinois River is a possible third source of water. Since this water has a negative Saturation index, it could readily dissolve additional calcium and magnesium.
On the basis that all sodium and potas-sium salts and all salts of calcium and magnesium other than dolomite are very soluble when compared to the solubility of dolomite, it was assumed that over a long period of time practically all of the soluble salts in the ground formation under and near the river have been leached out, where-as much of the relatively insoluble dolomite still remains. With this consideration in mind it was then postulated that if Illinois River water entered the ground, its chemi-cal character would be altered only by the Solution of dolomite, thereby increasing the hardness and alkalinity by equal but not predictable amounts.
Therefore, the pattern for the Commonwealth Edison Powerton Station well No. 9 is interpreted to represent mixtures of
[120]
CHEMISTRY 121
FIG. 47.—Character patterns of waters from Industrial wells south of Pekin.
Sankoty water (no sulfate) with Illinois River water and possibly some Wisconsin or outwash water.
The patterns for the Powerton Station wells No. 4 and No. 1, and the Corn Products Company wells Nos. 1, 3, and 2 are interpreted to show these waters to be pre-dominantly mixtures containing progres-sively greater proportions of Wisconsin or outwash waters with water of Illinois River origin. Further consideration of the relative location of these wells with respect to the Illinois River and to the Channels to the Powerton Station and of the relative pump-age from these wells and other wells in the immediate district confirms and explains the Interpretation of the analytical data.
In 1943, during and after a severe flood, the Corn Products Company made frequent
analyses of samples of water from their wells. At no time were analyses found to be identical in quality or character to Illinois River water, but with the aid of the assumptions concerning the possible altera-tion of river water quality, an equation was developed to indicate the percentage of water originally from the river in each sample.
The character of Illinois River water was defined by the general relationship between the hardness and sulfate content and the hardness and alkalinity (figs. 45, 48) .
On passing through the ground toward the well this water would dissolve some dolomite and thereby increase in hardness
122 GROUNDWATER IN THE PEORIA REGION
FIG. 48.—Character of Illinois River water.
and alkalinity by " Z " ppm. but the sulfate content would be unaltered. If the sulfate, alkalinity, and hardness of the transferred and altered river water are called A, B, and C then,
A = S04 B = Alk. + Z C = Hd. + Z
and, B = 1.55 A + 16 + (C - (2.86 A - 20)) =
36 + C - 1.31 A
If the groundwater quality is arbitrarily exemplified by the analysis showing the greatest hardness and sulfate content then the percentage (x) of river water in any sample can be calculated from the S0 4 * , Alk.* and Hd.* of any particular sample.
The groundwater is exemplified by a hardness of 610 ppm., an alkalinity of 325 ppm., and a sulfate content of 600 ppm. 100 SO4* = x A + (100 - x) 600 100 Alk.* = x B + (100 - x) 325 100 Hd.* = x C + (100 - x) 610
B = 36 + C - 1.31 A
For the purpose of illustration Table 10 indicates the data used for the calculation of the percentage of river water obtained from the Corn Products Refining Company wells on June 10, 1943.
The assumption of a definite point value for groundwater and of a straight-line re-lationship for hardness-sulfate and hard-
CHEMISTRY 123
FIG. 49.—Calculated percentage of Illinois River water entering Com Products Company wells.
TABLE 10.—PERCENTAGE OF RIVER WATER FROM CORN PRODUCTS REFINING COMPANY WELLS
Well Sulfate
ppm.
Alkalinity
ppm.
Hardness
ppm.
River water
percent
1 213 281 465 87
2 551 336 585 6
3 348 292 525 60
ness-alkalinity for river water are actually rough approximations and involve a maxi-mum possible error of about 50 percent, but it was found that reasonable deviations from these groundwater values and river charac-ter relationships did not alter the trend of the results shown in figure 49.
The data are interpreted to indicate that the heavy rain accompanying the flood period recharged the groundwater supply and permitted a high percentage of groundwater to be pumped from the wells for a temporary period of about one month after the flood period. This was followed by a
return to character indicative of river water origin. This set of interpretations is typical of the approach at the other well fields.
EAST PEORIA FIELD
In East Peoria, the city wells are located between Farm Creek and a small branch tributary. It is evident from figure 50 that a large percentage of the water obtained from these wells is indirectly from Farm Creek. The old wells appear to contain a greater concentration of water from Farm Creek than the new wells. The tempera-ture of the water from these city wells of 25-foot depth varies seasonally from 46° to 63° F.
At the Caterpillar Tractor Company considerable Variation in quality occurs from one well to another. Figure 50 shows the general character of the water obtained from well No. 9 over a period of five years and from each of the other wells on two specific dates. It appears that water ex-ceptionally high in sulfates is obtained from the Wisconsin drift at the bluffs to the south
124 GROUNDWATER IN THE PEORIA REGION
FIG. 50.—Character patterns from wells in East Peoria.
as exemplified by the character of the water at the Caterpillar well No. 15.
SANKOTY FIELD In the Sankoty field located north of
Peoria Heights about three miles north of the main pumping Station of the Peoria Water Works Company, the quantity of water extracted for the city supplies is such that approximately three months pumping would completely dewater the formation in the immediate area of the wells in this field, if there were no water entering from sur-rounding areas and no recharge.
The Muirson Label Company well No. 3 (fig. 51) shows a considerable Variation in quality because of its proximity to all three of the recharge or inflow sources. The pumpage from this well (0.1 M G D . ) and from the Minneapolis-Moline Company well (0.001 M G D . ) is low but the quality is greatly influenced by the pumpage in the nearby heavy producing area.
Peoria Wa te r Works well No. 7, which is perhaps at the center of the greatest amount of extraction (fig. 51), also appears to be centered in the ranges of quality ob-
CHEMISTRY 125
FIG. 51.—Character patterns from wells in Sankoty field.
tained from the three sources. The quality appears to be predominantly on the side of typical Sankoty water (zero sulfate) rather than on the side of Wisconsin drift or the Illinois River water. The tempera-ture is predominantly about 54° F. but occasionally varies to 53° and 58° F.
The quality of the water from each of the wells varies considerably and at this field no clear distinct interpretation could be made. However, here again the varia-tions in quality for each particular well are limited to a specific or characteristic pattern
with regard to the sulfate and hardness con-centrations. Typical patterns for the waters obtained in this field are compared with possible recharge waters.
The quality of these waters varies from that of typical original Sankoty formation water such as that found in Peoria Heights well No. 4 and in the Peoria Municipal Sanitarium well (located near the buried valley northwest of Peoria) to that of Illinois River water, which contains an appreciable sulfate concentration. In gen-eral, the hardness and the sulfate concen-
126 GROUNDWATER IN THE PEORIA REGION
FIG. 52.—Sampling data from Sankoty field.
trations are not as great as those found in certain samples from Peoria Heights wells Nos. 1 and 2 at the bluffs on the south side of the heavy producing area.
These latter wells by virtue of their proximity to the bluffs often appear to ob-tain water having a considerable proportion of Wisconsin drift water of relatively high hardness and sulfate.
It appears that water enters the heavy producing area of the Sankoty field (Peoria Heights No. 5, Peoria Water Works Nos. 7, 9, 10, 11, 12 and 13) from the Wisconsin drift, from the underlying Sankoty sand and possibly from the Illinois River.
An attempt was made to obtain further information by daily sampling of wells in
this field in June 1945. The data collected are shown in fig. 52. Unfortunately, the Operation of the wells at this time did not permit sufEcient sampling to establish any definite conclusions other than that considerable Variation in quality occurs from day to day.
PEORIA INDUSTRIAL FIELD
At the Hiram Walker plant (fig. 53) in the industrial field, the records of analyses as determined by Hiram Walker and Sons are interpreted to show that much of the water obtained from the No. 2 well, which is closest to the river, has come indirectly from the river (solid pattern), and that only after the high rainfall periods in 1942
CHEMISTRY 127
FIG. 53.—Character patterns of waters from Peoria Industrial field.
and 1943 was an appreciable amount of groundwater (high sulfate) obtained (ex-tended dotted pattern) at this well.
In this well field the relative patterns of water character from several wells are in-terpreted to indicate the sources of water obtained from these wells.
First, the Hiram Walker well No. 2 appears to obtain much of its water from the river, whereas No. 7, further from the river, constantly yields water of a greater sulfate content.
Second, the Schwab Dairy and the new Dodge Street well waters are almost identi-cal, and by virtue of a high nitrate content
these incidentally appear largely typical in character of waters from the glacial out-wash from the northwest.
Third, the Sanitary District well, which is closer to the river, yields water of lower sulfates, indicating a large proportion of its source to be from the river.
Fourth, spot samples at other wells show greater amounts of river water origin to be present at the location of the wells closer to the river. Of corresponding interest is the fact that the wells showing a high river water percentage are not the heavy produc-ing wells in this field.
128 GROUNDWATER IN THE PEORIA REGION
D I S C U S S I O N
Some question has been raised concerning the extent to which river water may enter the groundwater formations. This question is based on the fact that the river bottom above the dam is covered with a silt deposit of an estimated average thickness of 10 feet and a maximum recorded thickness of 25 feet. It is conceivable that this silt deposit (having only about 12 percent water content) may act as a relatively impervious barrier to the transfer of river water. The interpretations, however, do not indicate where or how river water entered the
ground at each field, but do indicate that it did to a variable extent, depending on the location of the well.
Overall it is estimated that some 34 percent of the estimated pumpage of the area exclusive of Sankoty field is of river origin. The 11 mgd. pumped in the Pekin field below the dam derives some 73 percent of its water from the river. Of the 37 mgd. pumped in the Peoria industrial and the East Peoria fields, only 14 percent is estimated to be of river origin. Ten of the 14 percent is estimated to be from Farm Creek. No estimate is made on the percentage at Sankoty field.