Report no. WST 17 October 2009 Looking after all our water needs technical series Groundwater interactions with acid sulfate soil: a case study in Torbay, Western Australia A technical report for the project Tackling acid sulfate soils on the WA coast Government of Western Australia Department of Water
Transcript
Report no. WST 17October 2009
Looking after all our water needs
technical series
Groundwater interactions with acid sulfate soil:a case study in Torbay, Western Australia A technical report for the projectTackling acid sulfate soils on the WA coast
Government of Western AustraliaDepartment of Water
Groundwater interactions with acid sulfate soil: a case study in Torbay, Western Australia A technical report for the project: Tackling acid sulfate soils on the WA coast
Looking after all our water needs
KL Kilminster
Department of Water
Water Science Technical series
Report no. 17
October 2009
Groundwater interactions with acid sulfate soil: a case study in Torbay, Western Australia
ii Department of Water
Department of Water 168 St Georges Terrace Perth Western Australia 6000 Telephone +61 8 6364 7600 Facsimile +61 8 6364 7601 www.water.wa.gov.au
This work is copyright. You may download, display, print and reproduce this material in unaltered form only (retaining this notice) for your personal, non-commercial use or use within your organisation. Apart from any use as permitted under the Copyright Act 1968, all other rights are reserved. Requests and inquiries concerning reproduction and rights should be addressed to the Department of Water.
ISSN 1836-2869 (print) ISSN 1836-2877 (online)
ISBN 978-1-921675-65-2 (print) ISBN 978-1-921675-33-1 (online)
Acknowledgements
This project was funded by the Australian Federal and Western Australian governments. The Department of Water would like to thank the following people for their contribution to this publication. This report was written by Dr Kieryn Kilminster. Field work was carried out by staff from Water Science branch (K Kilminster, A Green) and Albany regional office (T Calvert, S Randall, K Logan, A Plapp) with assistance from G Bastyan. The author acknowledges the contributions during the report’s review from B Degens, S Fisher, E van Looij and M Robb.
Reference details
The recommended citation for this publication is:
Kilminster, KL 2009, Groundwater interactions with acid sulfate soil: a case study in Torbay, Western Australia, Water science technical series, Report no. 17, Department of Water, Western Australia.
For more information about this report, contact Dr Kieryn Kilminster, Water Science branch, Department of Water.
1.1 Background to project ......................................................................................................1 1.2 Importance of groundwater ..............................................................................................1 1.3 Threat to groundwater by acid sulfate soils......................................................................1
2 Aims and scope ...................................................................................................................3
2.1 Objective ..........................................................................................................................3 2.2 Study site location ............................................................................................................3 2.3 Sampling sites..................................................................................................................4 2.4 Sampling method .............................................................................................................6 2.5 Data analysis ...................................................................................................................6
Appendix A: Nutrient data ......................................................................................................31
Appendix B: Instances were guideline trigger values were exceeded ...................................32
Figures
Figure 1 Fluctuations of groundwater level (through drainage, dewatering, groundwater abstraction or seasonal level fluctuation) may lead to acidification and mobilisation of metals if acid sulfate soils are present in the soil profile. ...............2
Groundwater interactions with acid sulfate soil: a case study in Torbay, Western Australia
iv Department of Water
Figure 2 A map of Western Australia showing the study site location. Bore locations (in inset) which were only sampled once (September 2007) are marked with orange symbols..................................................................................................................5
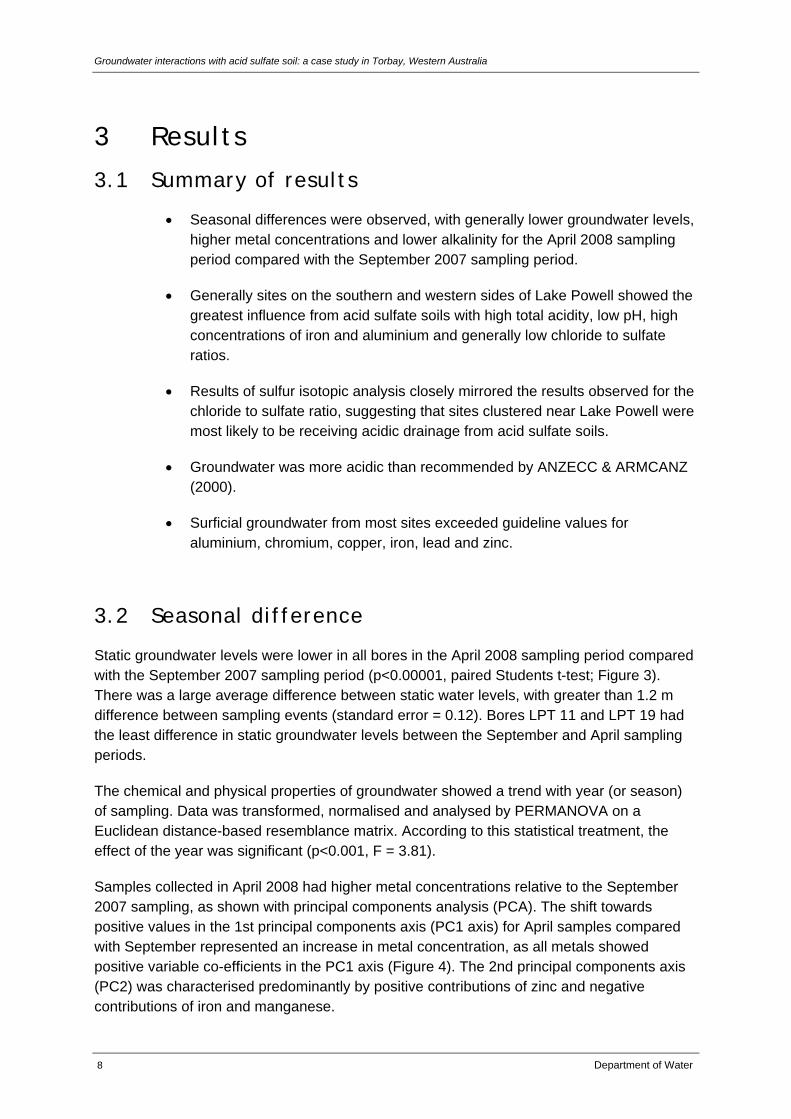
Figure 3 The static water level of groundwater for each bore was closer to the surface (i.e. higher) in the September 2007 sampling period than the April 2008 sampling period.....................................................................................................................9
Figure 4 Principal components analysis (PCA) of groundwater sampled in September 2007 and April 2008 for total (unfiltered) metals (Al, As, Cr, Cu, Fe, Ni, Pb, V, Zn, Mn).......................................................................................................................10
Figure 5 Average metal concentrations for aluminium and iron in groundwater were higher in April 2008 than in September 2007 – columns with different letters are significantly different (p<0.05, paired Students t-test), sol = soluble, tot = total, error bars are + standard error, n = 15). ..............................................................11
Figure 6 Diagram showing measurements of total acidity obtained in groundwater sampled in September 2007 and April 2008. The highest total acidity measurements were recorded on the southern and western sides of Lake Powell (LPT 11, 14 and 18), with the highest acidity concentrations measured in the April 2008 sampling event............................................................................................13
Figure 7 Diagram showing measurements of pH in groundwater sampled in September 2007 and April 2008. The lowest pH was recorded at sites near Lake Powell. ...14
Figure 8 Soluble aluminium measurements in groundwater were higher (or equal) in the April 2008 sampling event than the September 2007 sampling event for all bores except LPT 25. The highest concentrations of aluminium were observed on the southern side of Lake Powell (LPT 11, 14 and 18). .............................................15
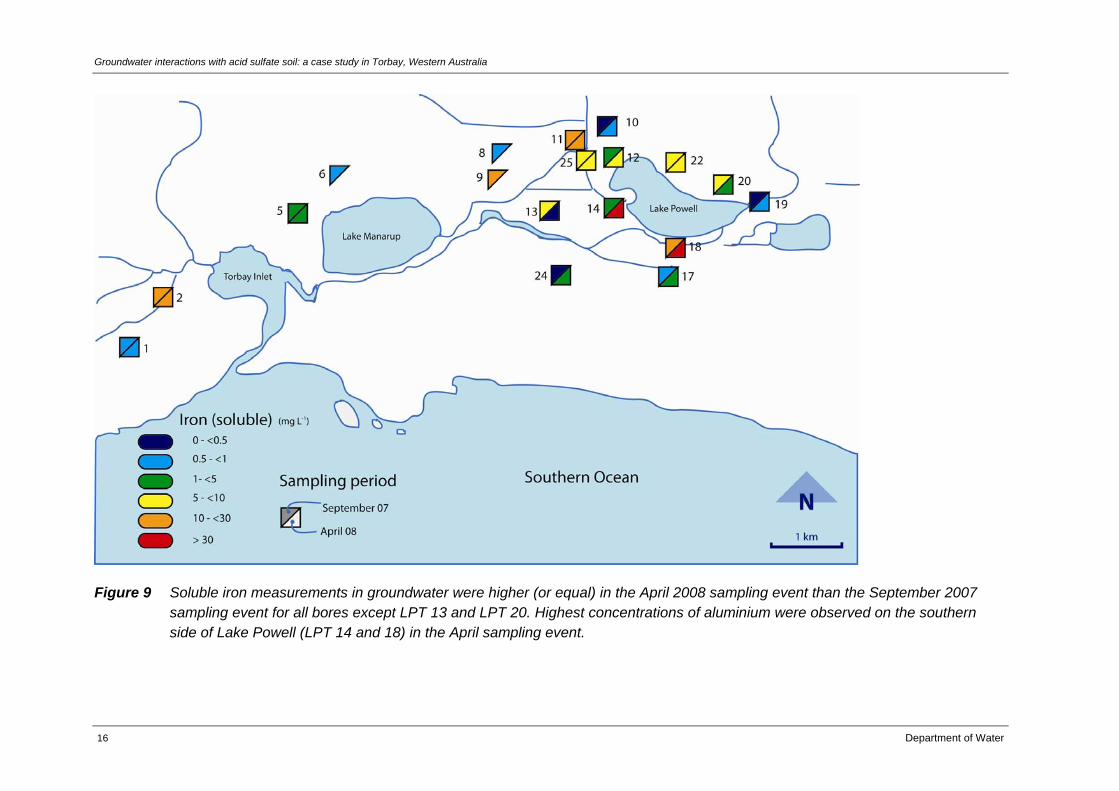
Figure 9 Soluble iron measurements in groundwater were higher (or equal) in the April 2008 sampling event than the September 2007 sampling event for all bores except LPT 13 and LPT 20. Highest concentrations of aluminium were observed on the southern side of Lake Powell (LPT 14 and 18) in the April sampling event.16
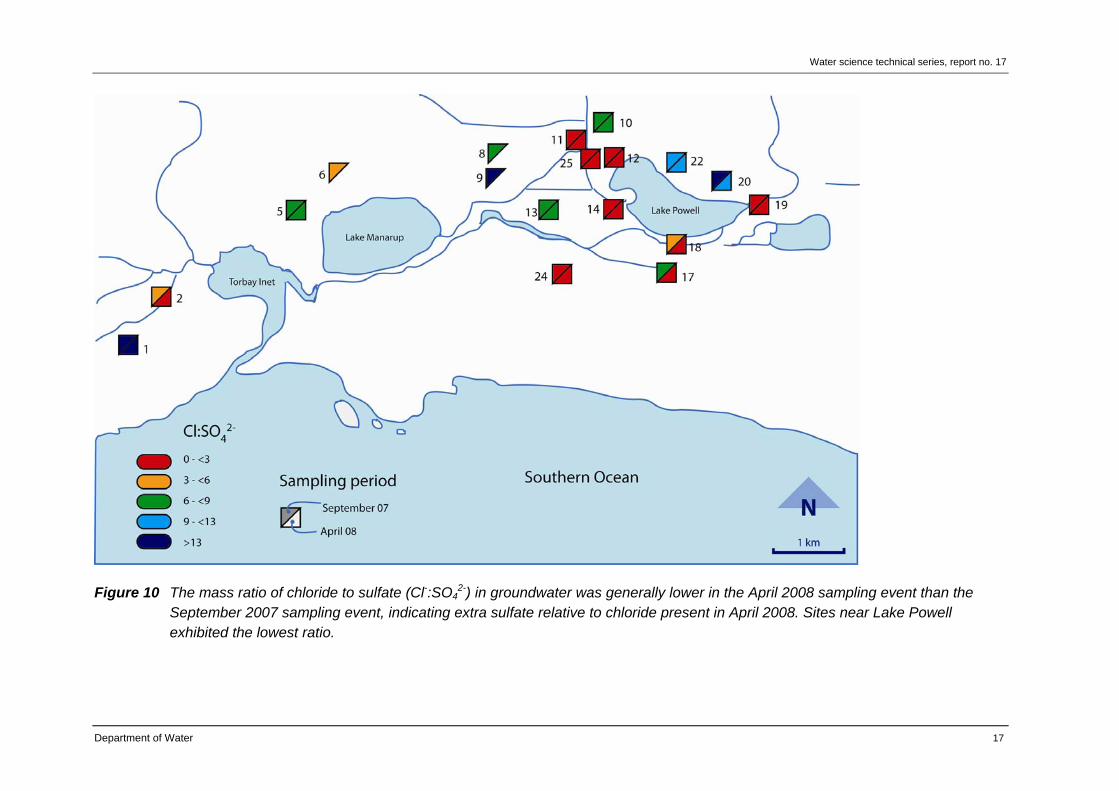
Figure 10 The mass ratio of chloride to sulfate (Cl-:SO42-) in groundwater was generally
lower in the April 2008 sampling event than the September 2007 sampling event, indicating extra sulfate relative to chloride present in April 2008. Sites near Lake Powell exhibited the lowest ratio..........................................................................17
Figure 11 Ternary plot for major anions (chloride, sulfate and bicarbonate) and cations (sodium, calcium and magnesium). Iso-groups assigned on the basis of sulfur isotope values and excess sulfur show separation on plot for iso-group 3, which has more sulfate and calcium present relative to the other ions. Iso-group 3 shows enrichment in sulfate, magnesium and calcium when compared with seawater major ion composition. Iso-group 4b shows depletion in sulfate when compared with seawater major ion composition. .................................................20
Figure 12 The iso-groups (categorised by sulfur isotope and excess sulfate) for groundwater were generally consistent between the April 2008 sampling event and the September 2007 sampling event. Sites with iso-groups 2, 4a and 4b are likely to be dominated by sulfate-reduction, while sites with iso-group 3 are likely to be impacted by acidic drainage (i.e. sulfate from the oxidation of pyrite). .......21
Figure 13 Acid sulfate soil risk map for the Torbay catchment (DEC 2006) overlain by the iso-groups determined with sulfur stable isotope analysis. Iso-group 3 is most likely to indicate acidification from acid sulfate soils. ...........................................26
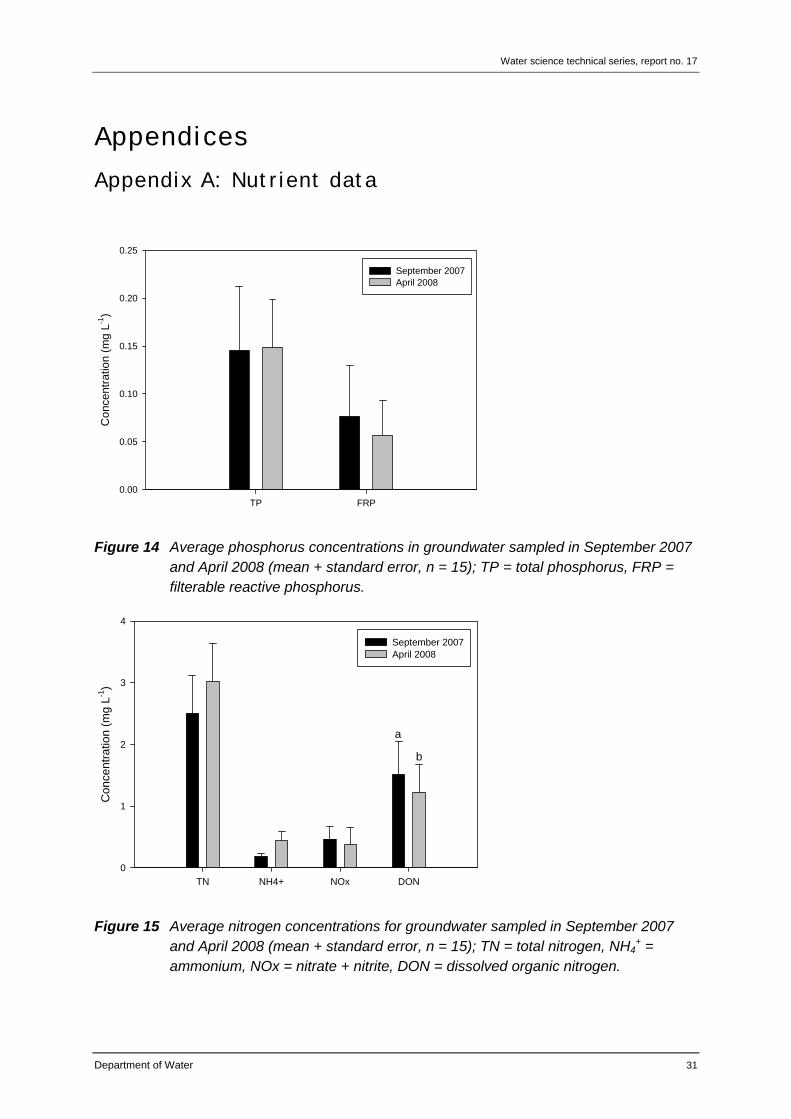
Figure 14 Average phosphorus concentrations in groundwater sampled in September 2007 and April 2008 (mean + standard error, n = 15); TP = total phosphorus, FRP = filterable reactive phosphorus..............................................................................31
Figure 15 Average nitrogen concentrations for groundwater sampled in September 2007 and April 2008 (mean + standard error, n = 15); TN = total nitrogen, NH4
Table 1 Description of bores used in 2007–08 sampling....................................................4 Table 2 Details of sample collection and chemical analysis ...............................................7 Table 3 Average water quality measurements for groundwater samples in September
2007 and April 2008. Numbers in parentheses are standard error, n = 15. Results marked with asterisk (*) are significantly different (p<0.05, paired Students t-test).11
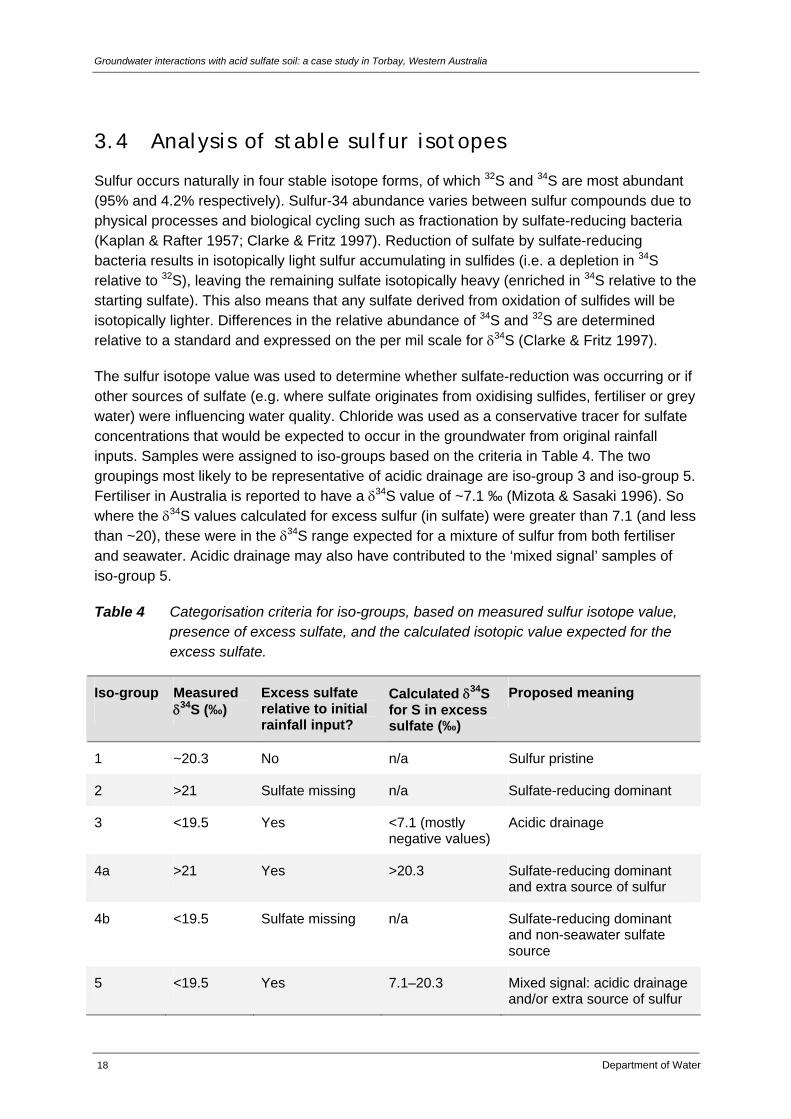
Table 4 Categorisation criteria for iso-groups, based on measured sulfur isotope value, presence of excess sulfate, and the calculated isotopic value expected for the excess sulfate. .....................................................................................................18
Table 5 Comparison of groundwater data to guideline values. Guideline values are ANZECC & ARMCANZ (2000) trigger values for freshwater (95% and 80% protection level) unless otherwise stated.............................................................23
Table 6 Matrix table showing samples which exceeded ANZECC 95% protection-guideline trigger values from 18 bores in September 2007 and April 2008 (iron guideline is from British Columbia (Phippen et al. 2008) and pH is from the ANZECC & ARMCANZ guideline for physical and chemical stressors for south-west Australia for lowland rivers). Orange shading of box means guideline exceeded; red shading of box means guideline greatly exceeded (x100 for metals and metalloids, or pH <4); grey shading means not sampled..............................32
Table 7 Matrix table showing samples which exceeded ANZECC & ARMCANZ 80% protection-guideline trigger values from 18 bores in September 2007 and April 2008. Orange shading of box means guideline exceeded; red shading of box means guideline greatly exceeded (x100 for metals and metalloids); grey shading means not sampled. ............................................................................................33
Table 8 Matrix table showing samples which exceeded nutrient-guideline trigger values from 18 bores in September 2007 and April 2008. Orange shaded boxes indicate guideline exceeded for ANZECC & ARMCANZ default trigger (slightly disturbed ecosystems) values for physical and chemical stressors for south-west Australia for A: lowland rivers and B: wetlands. Data was compared with triggers for both lowland rivers and wetlands as the bores are located in the lower Torbay catchment, close to the coast, where rivers and wetlands are both present. ......34
Groundwater interactions with acid sulfate soil: a case study in Torbay, Western Australia
vi Department of Water
Water science technical series, report no. 17
Department of Water vii
Summary
Shallow groundwater bores in the lower Torbay catchment (near Albany, Western Australia) were sampled for a suite of chemical parameters at two sampling times, approximately six months apart. The analysis suite included variables aimed at identifying the influence and extent of groundwater acidification related to acid sulfate soils. Acid sulfate soils were first identified in this area in the early 1900s, and since then substantial modification of drainage and groundwater levels in the catchment has occurred.
Depletion in alkalinity was observed from September 2007 to April 2008, and this was coupled with an increase in metal concentrations. Total metals increased (in April 2008 compared with September 2007) more substantially than soluble metals, although measures of particulate metals may not be representative of the water that could be moving through the shallow aquifers to surface ecosystems. While total acidity (a measure of all acid-forming components of the water) did increase in the April sampling compared with the earlier sampling, the variation was high between sites, so the difference in this variable among years was not statistically significant.
The groundwater quality was not uniform across all sites in the area. Sites on the south-western side of Lake Powell tended to have higher metal concentrations and a lower chloride to sulfate ratio (indicative of influence from acid sulfate soils). Similarly, using sulfur isotope ratio and concentrations of chloride and sulfate to categorise sites also provided a useful indicator of the sites most affected by acid sulfate soils.
Water in almost all bores was acidified with pH <6.5, and the water in three of these bores had a pH <4. Comparison with guideline values showed that all samples from all bores exceeded the aluminium guidelines – irrespective of whether it was soluble (filtered) or total (unfiltered) aluminium. Guideline values for chromium, copper, iron, lead and zinc were also exceeded in more than half the samples. Total arsenic was exceeded in three samples, but soluble arsenic was not exceeded in any sample. It must be noted that ANZECC & ARMCANZ1 (2000) trigger values are for surface water and not explicitly for groundwater. The concentration of these metals in groundwater will decrease on contact with receiving waters through dilution.
This study suggests that groundwater in the lower Torbay catchment contains indications of impacts from acid sulfate soil disturbance; thus management of groundwater and drainage in this area needs to take this into consideration. In particular, drawdown should be avoided in low-lying areas with high risk of shallow soils containing acid sulfate soils, as further surficial groundwater may be contaminated as a result. In addition, any activity that further disturbs the soil profile (such as digging, excavation or deep drainage) may contribute to increased impacts on aquatic life within the nearby streams and lakes, with base flow supplied by acidified and/or contaminated shallow groundwater.
1 Australian and New Zealand Environment Conservation Council & Agriculture and Resource Management
Council of Australia and New Zealand
Groundwater interactions with acid sulfate soil: a case study in Torbay, Western Australia
viii Department of Water
In this study we used sulfur isotope ratio and concentrations of chloride to sulfate to categorise sites which were most affected by acid sulfate soils. It is likely that this technique would be able to identify the shift towards acidification from acid sulfate soils before a significant drop in pH had occurred within affected groundwater. Sulfur isotope categorisation provides a tool to identify more subtle effects from groundwater systems affected by acid sulfate soils. Avoiding acidification of the surficial groundwater is particularly important for the ecology of many groundwater-dependent wetlands and streams in south-west Western Australia.
Water science technical series, report no. 17
Department of Water 1
1 Introduction
1.1 Background to project
The project Tackling Acid Sulfate Soils on the Western Australian Coast was a state wide project funded by the Australian Federal and Western Australian governments through the Natural Heritage Trust (NHT) and the National Action Plan for Salinity and Water Quality (NAP). Project funding was administered through the State Natural Resource Management Office and Department of Water was the lead agency for the project.
This study of groundwater quality associated with acid sulfate soils was carried out as part of the surveillance for abiotic indicators of influence of the acid sulfate soils in coastal waterways of south-western Australia.
1.2 Importance of groundwater
Groundwater is an important ecological and economic resource. Groundwater is used for domestic, rural and industrial water use, as well as for agricultural and domestic garden irrigation purposes. Groundwater also provides water to rivers, lakes and wetlands and this water sustains aquatic and riparian flora and fauna. Effective management of groundwater resources involves ensuring sufficient quantity as well as maintaining the quality of groundwater appropriate to end use.
1.3 Threat to groundwater by acid sulfate soils
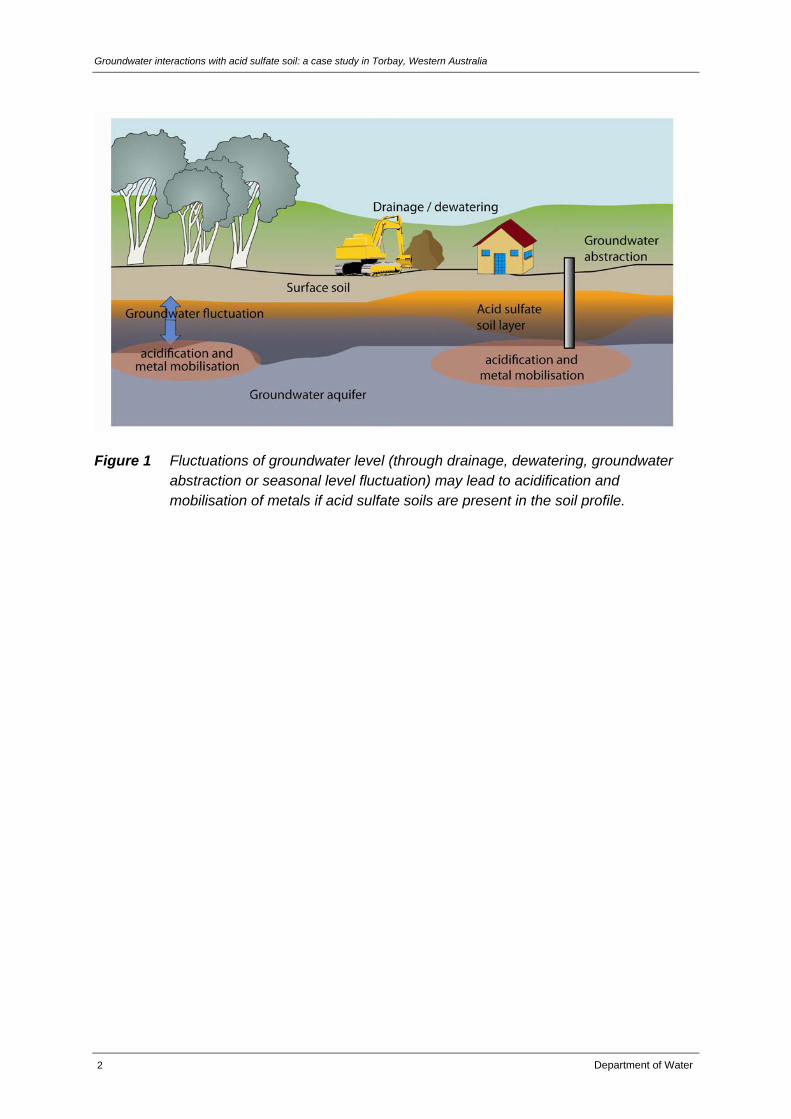
Groundwater abstraction, drainage, vegetation clearing and a drying climate are processes that have the potential to influence groundwater levels. Where acid sulfate soils exist within the soil profile at similar depths to the groundwater level, the surface groundwater is at risk of acidifying. Metal contaminants may also be mobilised with this acidification because most metals are more soluble under acidic conditions. The conceptual diagram in Figure 1 describes these processes.
Groundwater interactions with acid sulfate soil: a case study in Torbay, Western Australia
2 Department of Water
Figure 1 Fluctuations of groundwater level (through drainage, dewatering, groundwater abstraction or seasonal level fluctuation) may lead to acidification and mobilisation of metals if acid sulfate soils are present in the soil profile.
Water science technical series, report no. 17
Department of Water 3
2 Aims and scope
2.1 Objective
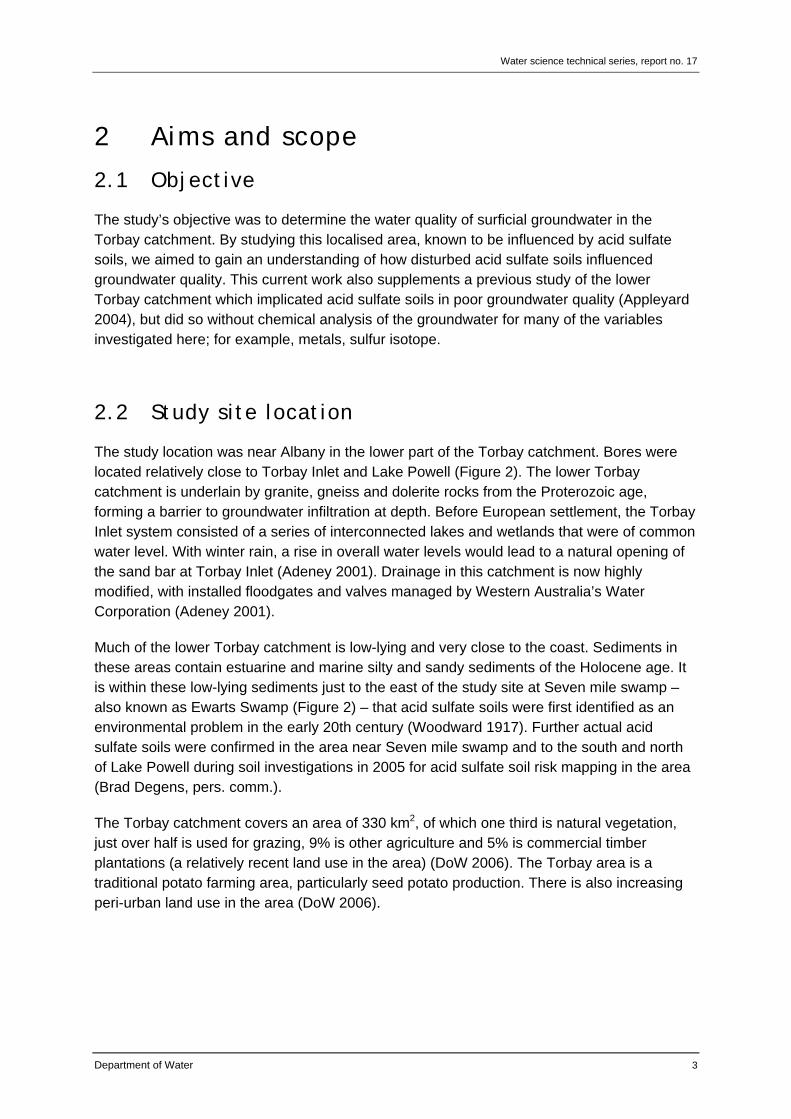
The study’s objective was to determine the water quality of surficial groundwater in the Torbay catchment. By studying this localised area, known to be influenced by acid sulfate soils, we aimed to gain an understanding of how disturbed acid sulfate soils influenced groundwater quality. This current work also supplements a previous study of the lower Torbay catchment which implicated acid sulfate soils in poor groundwater quality (Appleyard 2004), but did so without chemical analysis of the groundwater for many of the variables investigated here; for example, metals, sulfur isotope.
2.2 Study site location
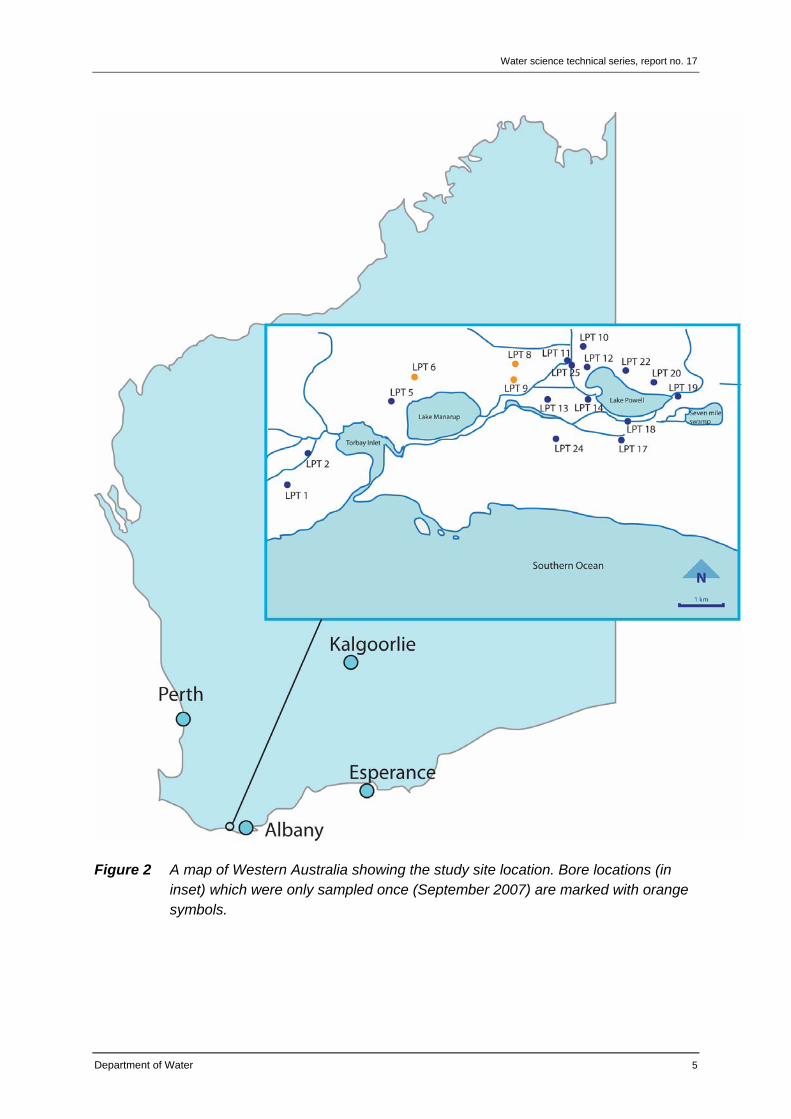
The study location was near Albany in the lower part of the Torbay catchment. Bores were located relatively close to Torbay Inlet and Lake Powell (Figure 2). The lower Torbay catchment is underlain by granite, gneiss and dolerite rocks from the Proterozoic age, forming a barrier to groundwater infiltration at depth. Before European settlement, the Torbay Inlet system consisted of a series of interconnected lakes and wetlands that were of common water level. With winter rain, a rise in overall water levels would lead to a natural opening of the sand bar at Torbay Inlet (Adeney 2001). Drainage in this catchment is now highly modified, with installed floodgates and valves managed by Western Australia’s Water Corporation (Adeney 2001).
Much of the lower Torbay catchment is low-lying and very close to the coast. Sediments in these areas contain estuarine and marine silty and sandy sediments of the Holocene age. It is within these low-lying sediments just to the east of the study site at Seven mile swamp – also known as Ewarts Swamp (Figure 2) – that acid sulfate soils were first identified as an environmental problem in the early 20th century (Woodward 1917). Further actual acid sulfate soils were confirmed in the area near Seven mile swamp and to the south and north of Lake Powell during soil investigations in 2005 for acid sulfate soil risk mapping in the area (Brad Degens, pers. comm.).
The Torbay catchment covers an area of 330 km2, of which one third is natural vegetation, just over half is used for grazing, 9% is other agriculture and 5% is commercial timber plantations (a relatively recent land use in the area) (DoW 2006). The Torbay area is a traditional potato farming area, particularly seed potato production. There is also increasing peri-urban land use in the area (DoW 2006).
Groundwater interactions with acid sulfate soil: a case study in Torbay, Western Australia
4 Department of Water
2.3 Sampling sites
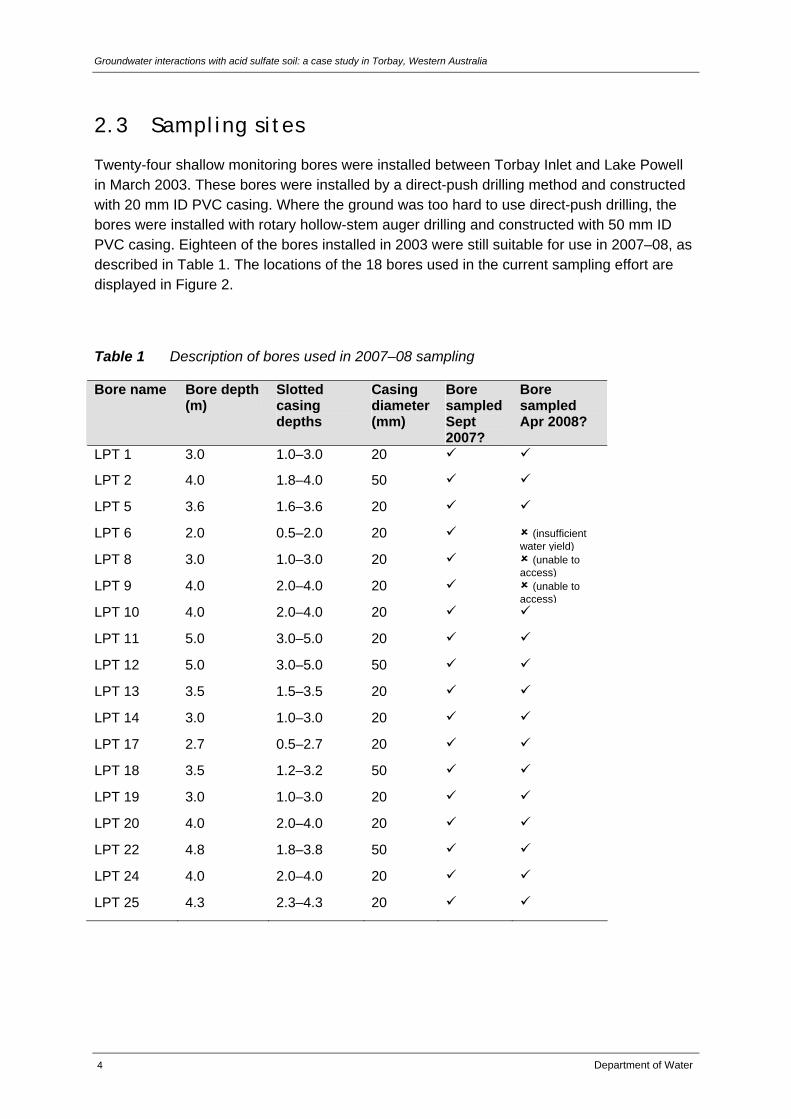
Twenty-four shallow monitoring bores were installed between Torbay Inlet and Lake Powell in March 2003. These bores were installed by a direct-push drilling method and constructed with 20 mm ID PVC casing. Where the ground was too hard to use direct-push drilling, the bores were installed with rotary hollow-stem auger drilling and constructed with 50 mm ID PVC casing. Eighteen of the bores installed in 2003 were still suitable for use in 2007–08, as described in Table 1. The locations of the 18 bores used in the current sampling effort are displayed in Figure 2.
Table 1 Description of bores used in 2007–08 sampling
Bore name Bore depth (m)
Slotted casing depths
Casing diameter (mm)
Bore sampled Sept 2007?
Bore sampled Apr 2008?
LPT 1 3.0 1.0–3.0 20
LPT 2 4.0 1.8–4.0 50
LPT 5 3.6 1.6–3.6 20
LPT 6 2.0 0.5–2.0 20 (insufficient water yield)
LPT 8 3.0 1.0–3.0 20 (unable to access)
LPT 9 4.0 2.0–4.0 20 (unable to access)
LPT 10 4.0 2.0–4.0 20
LPT 11 5.0 3.0–5.0 20
LPT 12 5.0 3.0–5.0 50
LPT 13 3.5 1.5–3.5 20
LPT 14 3.0 1.0–3.0 20
LPT 17 2.7 0.5–2.7 20
LPT 18 3.5 1.2–3.2 50
LPT 19 3.0 1.0–3.0 20
LPT 20 4.0 2.0–4.0 20
LPT 22 4.8 1.8–3.8 50
LPT 24 4.0 2.0–4.0 20
LPT 25 4.3 2.3–4.3 20
Water science technical series, report no. 17
Department of Water 5
Figure 2 A map of Western Australia showing the study site location. Bore locations (in inset) which were only sampled once (September 2007) are marked with orange symbols.
Groundwater interactions with acid sulfate soil: a case study in Torbay, Western Australia
6 Department of Water
2.4 Sampling method
Bores were sampled on two occasions, September 2007 and April 2008, to capture extremes in groundwater level. The static water level at each bore was established before pumping with a water level meter (Heron Dipper T). Water was pumped from the bore with minimal drawdown by using a variable-speed peristaltic pump (Geotech Series I Geopump) at low pumping speed. A water quality meter (Hydrolab Quanta) with flow-cell was used to monitor the in situ variables of groundwater (pH, temperature, specific conductivity, dissolved oxygen and redox potential).
Samples of groundwater were collected after three casing volumes of water were purged from the bore and the in situ readings (redox and dissolved oxygen) had stabilised. Approximately 3.5 litres of sample were collected from each bore for various chemical analyses (Table 2). Samples were kept on ice or refrigerated and sent by courier to the National Measurement Institute within 48 hours of collection for analysis of all analytes except sulfur isotopes. Water samples for sulfur isotope analysis were sent separately to Monash University for analysis.
The risk of the groundwater samples being contaminated was minimised by using a new piece of disposable tubing (silicon rubber and LDPE) with the peristaltic pump for each bore, and rinsing all other equipment in Decon90, scheme water and finally deionised water. In addition, replicate samples and procedural blanks were collected twice in each sampling period for quality control purposes.
2.5 Data analysis
Results from each of the in situ and laboratory measurements were checked for normality and log-transformed if necessary. The computer software package PRIMER 6 + PERMANOVA was used to explore multivariate data relationships in groundwater chemistry. Further details about the statistical routines employed in PRIMER (Plymouth Routines in Multivariate Ecological Research) and PERMANOVA (Permutational Multivariate Analysis of Variance) can be found in Clarke and Warwick (2001) and Anderson et al. (2008). Data was standardised within PRIMER (normalise function) before further multivariate data analysis (e.g. principal components analysis and PERMANOVA). Sigmaplot version 10 (Systat Software Inc.) was used for graphical representations of data. The paired Students t-test was also performed to evaluate differences between season of sampling.
Water science technical series, report no. 17
Department of Water 7
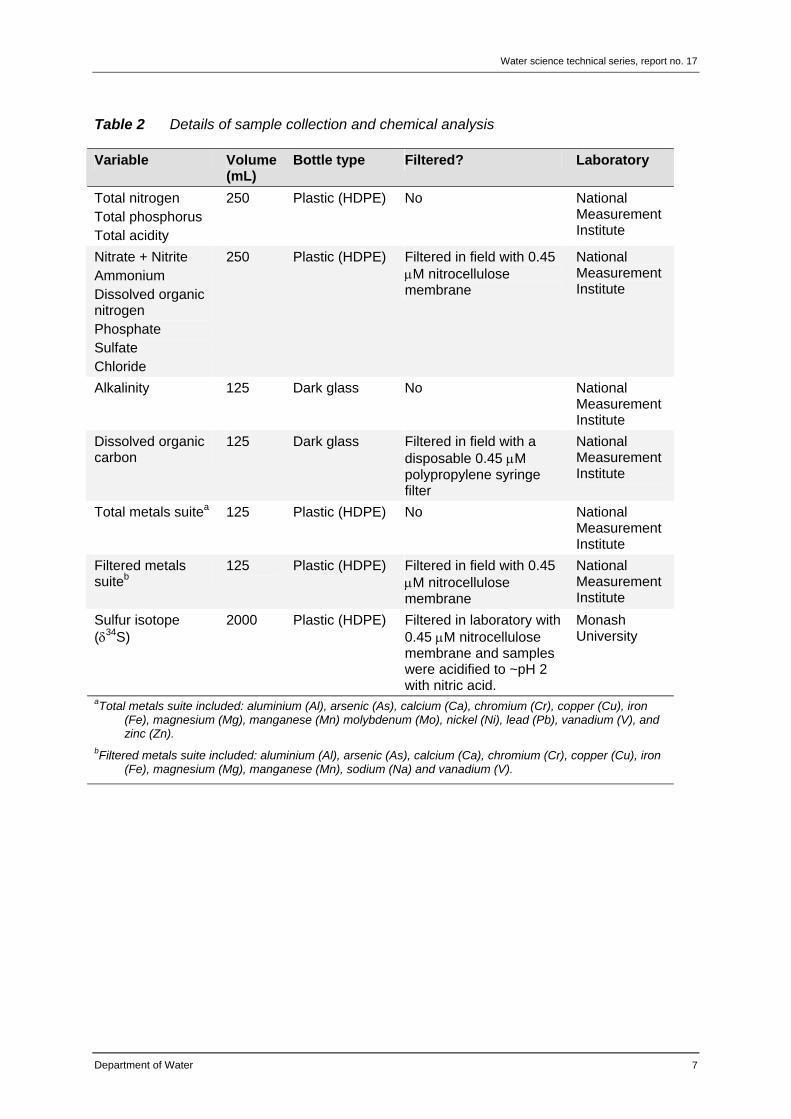
Table 2 Details of sample collection and chemical analysis
Variable Volume (mL)
Bottle type Filtered? Laboratory
Total nitrogen Total phosphorus Total acidity
250 Plastic (HDPE) No National Measurement Institute
250 Plastic (HDPE) Filtered in field with 0.45 M nitrocellulose membrane
National Measurement Institute
Alkalinity 125 Dark glass No National Measurement Institute
Dissolved organic carbon
125 Dark glass Filtered in field with a disposable 0.45 M polypropylene syringe filter
National Measurement Institute
Total metals suitea 125 Plastic (HDPE) No National Measurement Institute
Filtered metals suiteb
125 Plastic (HDPE) Filtered in field with 0.45 M nitrocellulose membrane
National Measurement Institute
Sulfur isotope (34S)
2000 Plastic (HDPE) Filtered in laboratory with 0.45 M nitrocellulose membrane and samples were acidified to ~pH 2 with nitric acid.
Monash University
aTotal metals suite included: aluminium (Al), arsenic (As), calcium (Ca), chromium (Cr), copper (Cu), iron (Fe), magnesium (Mg), manganese (Mn) molybdenum (Mo), nickel (Ni), lead (Pb), vanadium (V), and zinc (Zn).
bFiltered metals suite included: aluminium (Al), arsenic (As), calcium (Ca), chromium (Cr), copper (Cu), iron (Fe), magnesium (Mg), manganese (Mn), sodium (Na) and vanadium (V).
Groundwater interactions with acid sulfate soil: a case study in Torbay, Western Australia
8 Department of Water
3 Results
3.1 Summary of results
Seasonal differences were observed, with generally lower groundwater levels, higher metal concentrations and lower alkalinity for the April 2008 sampling period compared with the September 2007 sampling period.
Generally sites on the southern and western sides of Lake Powell showed the greatest influence from acid sulfate soils with high total acidity, low pH, high concentrations of iron and aluminium and generally low chloride to sulfate ratios.
Results of sulfur isotopic analysis closely mirrored the results observed for the chloride to sulfate ratio, suggesting that sites clustered near Lake Powell were most likely to be receiving acidic drainage from acid sulfate soils.
Groundwater was more acidic than recommended by ANZECC & ARMCANZ (2000).
Surficial groundwater from most sites exceeded guideline values for aluminium, chromium, copper, iron, lead and zinc.
3.2 Seasonal difference
Static groundwater levels were lower in all bores in the April 2008 sampling period compared with the September 2007 sampling period (p<0.00001, paired Students t-test; Figure 3). There was a large average difference between static water levels, with greater than 1.2 m difference between sampling events (standard error = 0.12). Bores LPT 11 and LPT 19 had the least difference in static groundwater levels between the September and April sampling periods.
The chemical and physical properties of groundwater showed a trend with year (or season) of sampling. Data was transformed, normalised and analysed by PERMANOVA on a Euclidean distance-based resemblance matrix. According to this statistical treatment, the effect of the year was significant (p<0.001, F = 3.81).
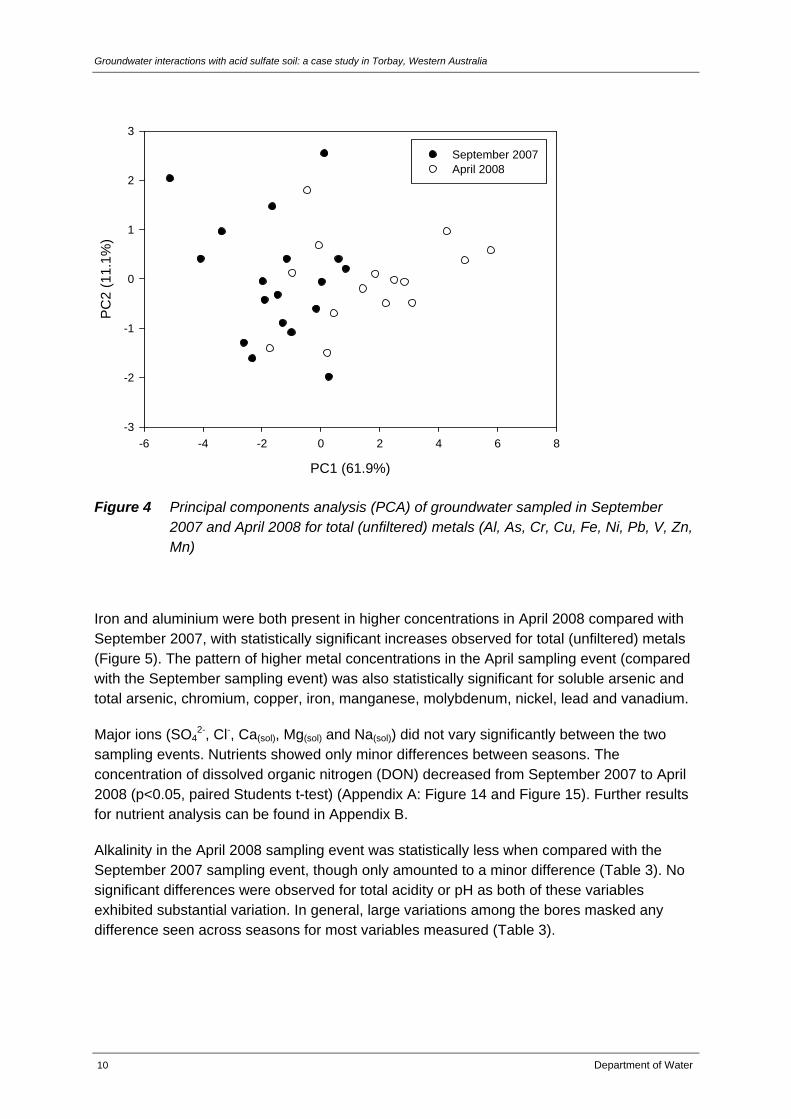
Samples collected in April 2008 had higher metal concentrations relative to the September 2007 sampling, as shown with principal components analysis (PCA). The shift towards positive values in the 1st principal components axis (PC1 axis) for April samples compared with September represented an increase in metal concentration, as all metals showed positive variable co-efficients in the PC1 axis (Figure 4). The 2nd principal components axis (PC2) was characterised predominantly by positive contributions of zinc and negative contributions of iron and manganese.
Water science technical series, report no. 17
Department of Water 9
Bore number
1 2 5 6 8 9 10 11 12 13 14 17 18 19 20 22 24 25
Sta
tic w
ater
leve
l (m
etre
s be
low
sur
face
)
-3.2
-2.8
-2.4
-2.0
-1.6
-1.2
-0.8
-0.4
0.0
0.4
0.8
September 2007April 2008
Surface
Figure 3 The static water level of groundwater for each bore was closer to the surface (i.e. higher) in the September 2007 sampling period than the April 2008 sampling period.
Groundwater interactions with acid sulfate soil: a case study in Torbay, Western Australia
10 Department of Water
PC1 (61.9%)
-6 -4 -2 0 2 4 6 8
PC
2 (
11.1
%)
-3
-2
-1
0
1
2
3
September 2007April 2008
Figure 4 Principal components analysis (PCA) of groundwater sampled in September 2007 and April 2008 for total (unfiltered) metals (Al, As, Cr, Cu, Fe, Ni, Pb, V, Zn, Mn)
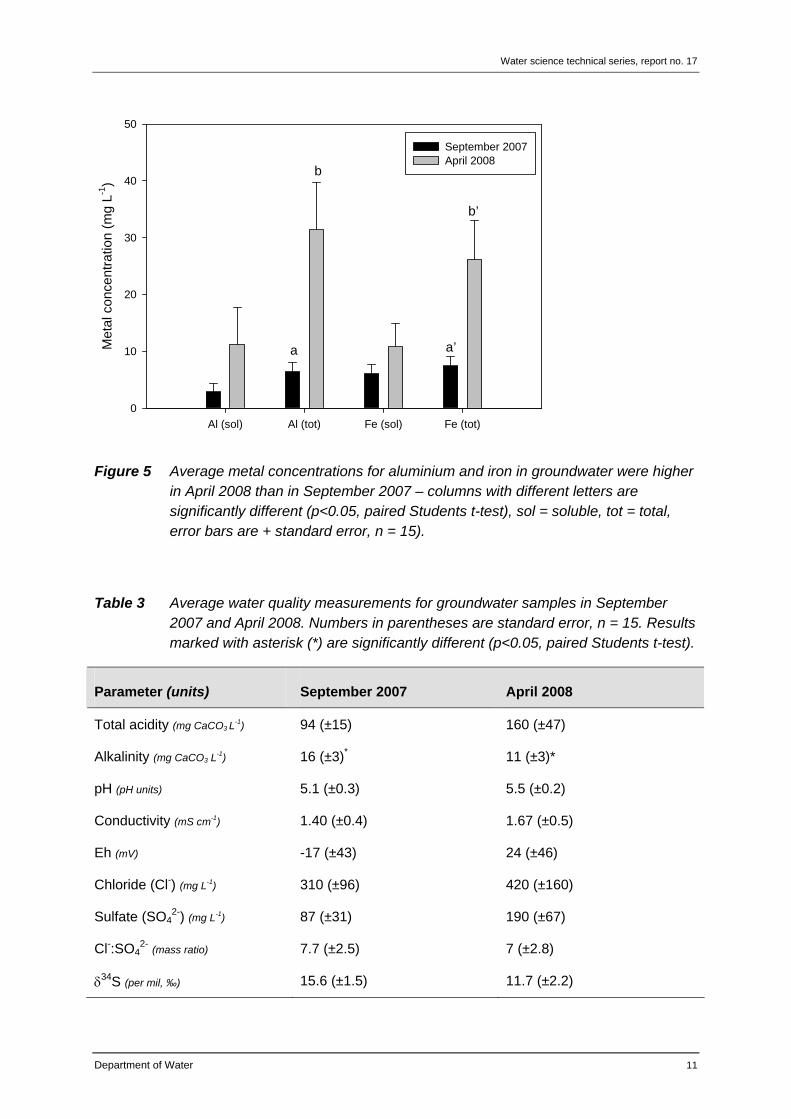
Iron and aluminium were both present in higher concentrations in April 2008 compared with September 2007, with statistically significant increases observed for total (unfiltered) metals (Figure 5). The pattern of higher metal concentrations in the April sampling event (compared with the September sampling event) was also statistically significant for soluble arsenic and total arsenic, chromium, copper, iron, manganese, molybdenum, nickel, lead and vanadium.
Major ions (SO42-, Cl-, Ca(sol), Mg(sol) and Na(sol)) did not vary significantly between the two
sampling events. Nutrients showed only minor differences between seasons. The concentration of dissolved organic nitrogen (DON) decreased from September 2007 to April 2008 (p<0.05, paired Students t-test) (Appendix A: Figure 14 and Figure 15). Further results for nutrient analysis can be found in Appendix B.
Alkalinity in the April 2008 sampling event was statistically less when compared with the September 2007 sampling event, though only amounted to a minor difference (Table 3). No significant differences were observed for total acidity or pH as both of these variables exhibited substantial variation. In general, large variations among the bores masked any difference seen across seasons for most variables measured (Table 3).
Water science technical series, report no. 17
Department of Water 11
Al (sol) Al (tot) Fe (sol) Fe (tot)
Met
al c
once
ntra
tion
(mg
L-1)
0
10
20
30
40
50
September 2007April 2008
a
b
a’
b’
Figure 5 Average metal concentrations for aluminium and iron in groundwater were higher in April 2008 than in September 2007 – columns with different letters are significantly different (p<0.05, paired Students t-test), sol = soluble, tot = total, error bars are + standard error, n = 15).
Table 3 Average water quality measurements for groundwater samples in September 2007 and April 2008. Numbers in parentheses are standard error, n = 15. Results marked with asterisk (*) are significantly different (p<0.05, paired Students t-test).
Parameter (units) September 2007 April 2008
Total acidity (mg CaCO3 L-1) 94 (±15) 160 (±47)
Alkalinity (mg CaCO3 L-1) 16 (±3)* 11 (±3)*
pH (pH units) 5.1 (±0.3) 5.5 (±0.2)
Conductivity (mS cm-1) 1.40 (±0.4) 1.67 (±0.5)
Eh (mV) -17 (±43) 24 (±46)
Chloride (Cl-) (mg L-1) 310 (±96) 420 (±160)
Sulfate (SO42-) (mg L-1) 87 (±31) 190 (±67)
Cl-:SO42- (mass ratio) 7.7 (±2.5) 7 (±2.8)
34S (per mil, ‰) 15.6 (±1.5) 11.7 (±2.2)
Groundwater interactions with acid sulfate soil: a case study in Torbay, Western Australia
12 Department of Water
3.3 Spatial distribution
The chemical and physical properties of the groundwater showed variation associated with the location sampled. Data was transformed, normalised and analysed by PERMANOVA on a Euclidean distance-based resemblance matrix, which showed the effect of the site was significant (p<0.0001, F = 2.66).
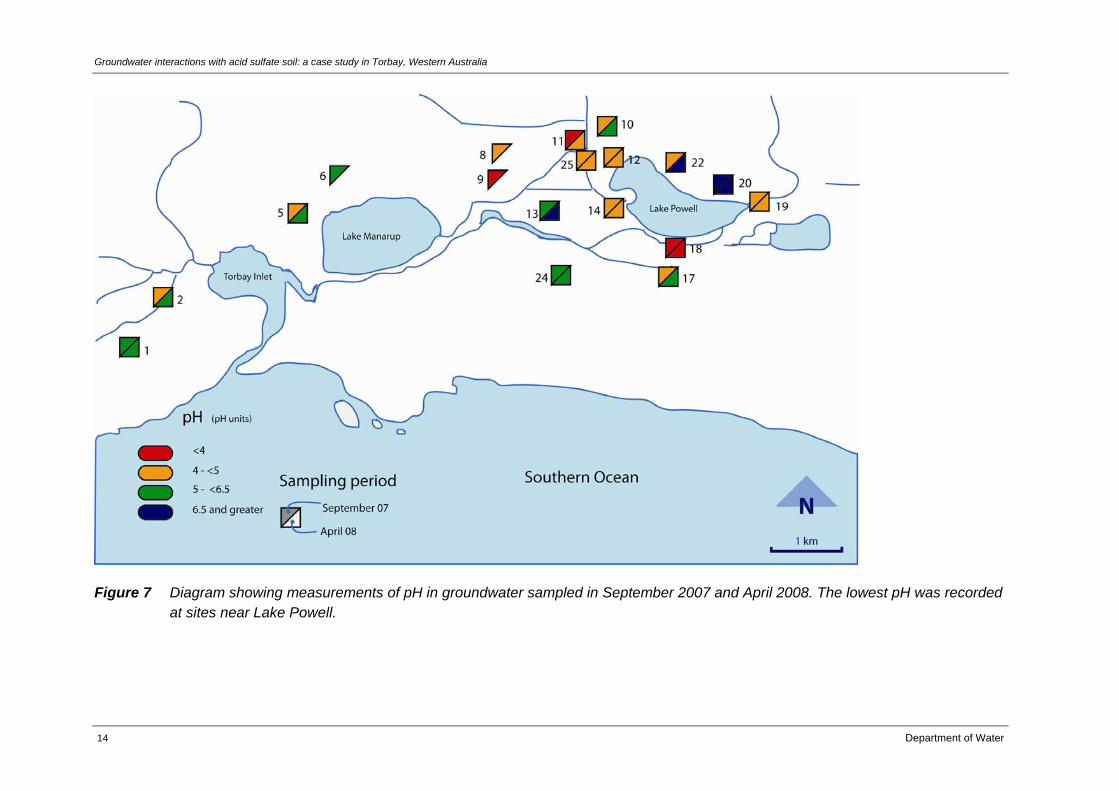
Generally sites on the southern and western sides of Lake Powell exhibited the highest acidity and lowest pH, although there was some spatial variability (Figure 6 and Figure 7). Groundwater from the south-western side of Lake Powell also had high concentrations of aluminium and iron (Figure 8 and Figure 9). Elevated iron was also observed at site LPT 2 on the western side of Torbay Inlet. Chloride to sulfate ratio was lowest around the south-western sides of Lake Powell, with low chloride to sulfate ratio also recorded at LPT 2 and LPT 19 (eastern point of Lake Powell) (Figure 10).
Water science technical series, report no. 17
Department of Water 13
Figure 6 Diagram showing measurements of total acidity obtained in groundwater sampled in September 2007 and April 2008. The highest total acidity measurements were recorded on the southern and western sides of Lake Powell (LPT 11, 14 and 18), with the highest acidity concentrations measured in the April 2008 sampling event.
Groundwater interactions with acid sulfate soil: a case study in Torbay, Western Australia
14 Department of Water
Figure 7 Diagram showing measurements of pH in groundwater sampled in September 2007 and April 2008. The lowest pH was recorded at sites near Lake Powell.
Water science technical series, report no. 17
Department of Water 15
Figure 8 Soluble aluminium measurements in groundwater were higher (or equal) in the April 2008 sampling event than the September 2007 sampling event for all bores except LPT 25. The highest concentrations of aluminium were observed on the southern side of Lake Powell (LPT 11, 14 and 18).
Groundwater interactions with acid sulfate soil: a case study in Torbay, Western Australia
16 Department of Water
Figure 9 Soluble iron measurements in groundwater were higher (or equal) in the April 2008 sampling event than the September 2007 sampling event for all bores except LPT 13 and LPT 20. Highest concentrations of aluminium were observed on the southern side of Lake Powell (LPT 14 and 18) in the April sampling event.
Water science technical series, report no. 17
Department of Water 17
Figure 10 The mass ratio of chloride to sulfate (Cl-:SO42-) in groundwater was generally lower in the April 2008 sampling event than the
September 2007 sampling event, indicating extra sulfate relative to chloride present in April 2008. Sites near Lake Powell exhibited the lowest ratio.
Groundwater interactions with acid sulfate soil: a case study in Torbay, Western Australia
18 Department of Water
3.4 Analysis of stable sulfur isotopes
Sulfur occurs naturally in four stable isotope forms, of which 32S and 34S are most abundant (95% and 4.2% respectively). Sulfur-34 abundance varies between sulfur compounds due to physical processes and biological cycling such as fractionation by sulfate-reducing bacteria (Kaplan & Rafter 1957; Clarke & Fritz 1997). Reduction of sulfate by sulfate-reducing bacteria results in isotopically light sulfur accumulating in sulfides (i.e. a depletion in 34S relative to 32S), leaving the remaining sulfate isotopically heavy (enriched in 34S relative to the starting sulfate). This also means that any sulfate derived from oxidation of sulfides will be isotopically lighter. Differences in the relative abundance of 34S and 32S are determined relative to a standard and expressed on the per mil scale for 34S (Clarke & Fritz 1997).
The sulfur isotope value was used to determine whether sulfate-reduction was occurring or if other sources of sulfate (e.g. where sulfate originates from oxidising sulfides, fertiliser or grey water) were influencing water quality. Chloride was used as a conservative tracer for sulfate concentrations that would be expected to occur in the groundwater from original rainfall inputs. Samples were assigned to iso-groups based on the criteria in Table 4. The two groupings most likely to be representative of acidic drainage are iso-group 3 and iso-group 5. Fertiliser in Australia is reported to have a 34S value of ~7.1 ‰ (Mizota & Sasaki 1996). So where the 34S values calculated for excess sulfur (in sulfate) were greater than 7.1 (and less than ~20), these were in the 34S range expected for a mixture of sulfur from both fertiliser and seawater. Acidic drainage may also have contributed to the ‘mixed signal’ samples of iso-group 5.
Table 4 Categorisation criteria for iso-groups, based on measured sulfur isotope value, presence of excess sulfate, and the calculated isotopic value expected for the excess sulfate.
Iso-group
Measured 34S (‰)
Excess sulfate relative to initial rainfall input?
5 <19.5 Yes 7.1–20.3 Mixed signal: acidic drainage and/or extra source of sulfur
Water science technical series, report no. 17
Department of Water 19
Groundwater begins as rainfall, which contains sulfate derived from seawater. The 34S measured in rainwater (in the Perth area) was between 18.2 and 20.0 ‰, confirming a seawater-dominated sulfur isotope signal for rainfall. Iso-groups were determined using the seawater chloride:sulfate ratio, which has a value of approximately 7.2. As a comparison, iso-groups were also calculated assuming all sulfur in the groundwater sample was derived from rain, and an expected ratio of Cl-:SO4
2- in rainwater of 5.3 was used – based on data from Hingston and Gailitis (1976). In most cases, using this alternative ratio did not affect the final iso-group assigned to the sample, so a chloride:sulfate ratio of 7.2 was used for consistency with other work in catchments and estuaries where seawater is likely to dominate sulfur inputs.
Data for groundwater resulted in only three samples being assigned to iso-groups 2 and 4a, with most sites falling into iso-groups 3 and 4b. Iso-groups 2, 4a and 4b are dominated by sulfate-reduction processes. Iso-group 3 is most likely indicative of sulfur inputs from oxidised pyrite; that is, acidic drainage, because the calculated isotopic value for the extra sulfate was negative.
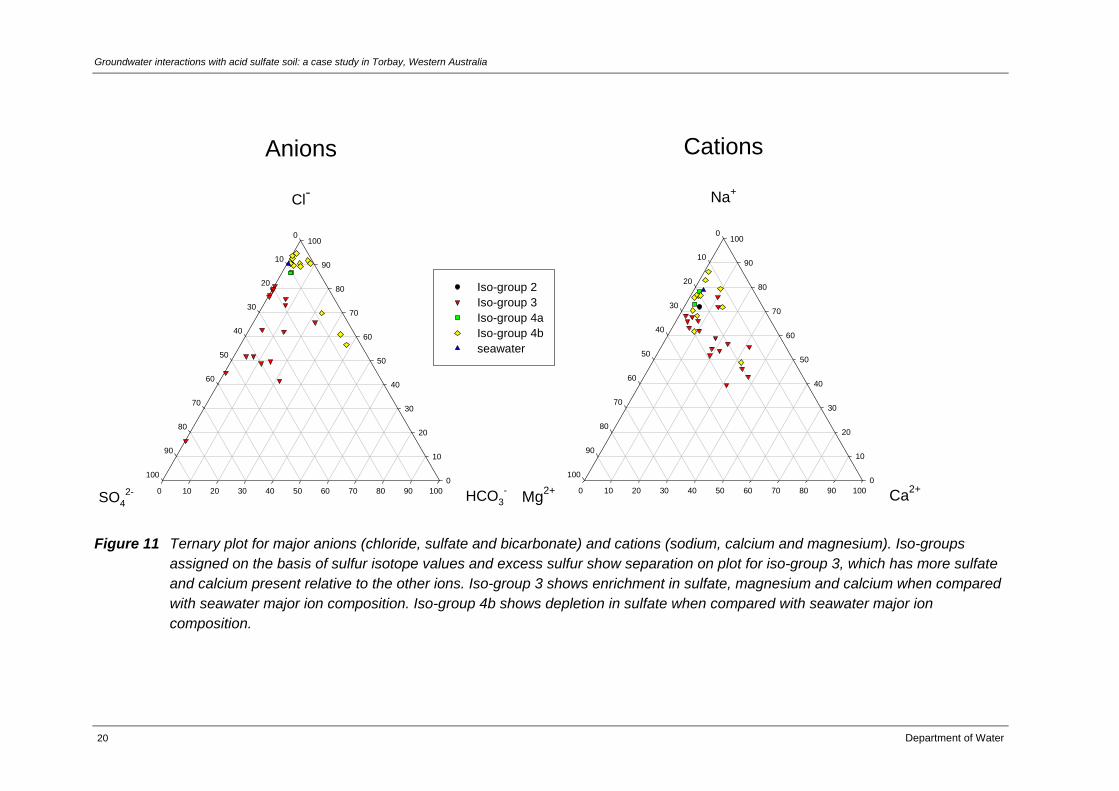
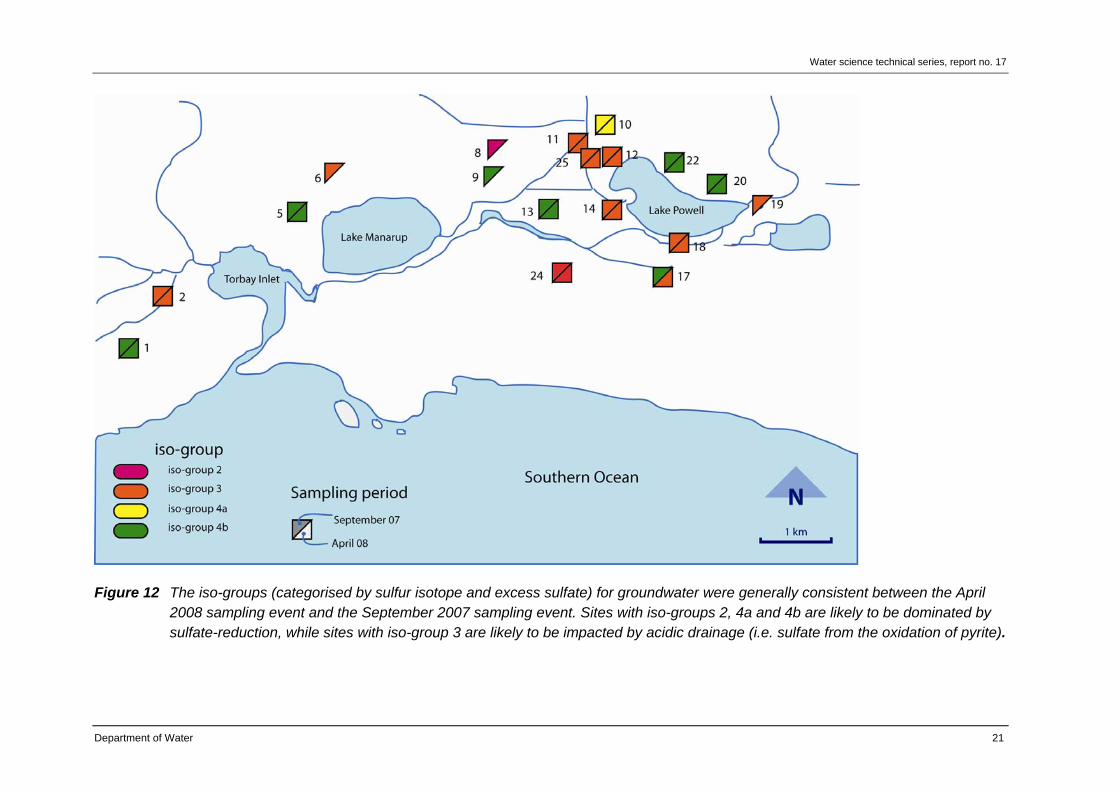
Major ion chemistry of the groundwater sampled was explored by ternary plots of anions and cations, and compared with the major ion composition typical for seawater (Figure 11). Deviations away from the composition of seawater suggest the groundwater has undergone interactions with soil and/or geology that has altered the water chemistry. Iso-group 3 (most likely affected by acidic drainage) had relatively more sulfate and calcium than the other iso-groups (Figure 11). This would be consistent with dissolution of carbonates and/or leaching of such base cations from soils where oxidation of acid sulfate soil materials and generation of acidity might be occurring. Iso-group 4b shows depletion in sulfate when compared with seawater major ion composition (Figure 11), consistent with the idea that iso-group 4b comprises sites where sulfate-reduction processes are enhanced. Spatial distribution of the iso-groups mirrors closely that observed for the chloride to sulfate ratios, with sites clustered near Lake Powell most likely to be receiving acidic drainage (Figure 12).
Groundwater interactions with acid sulfate soil: a case study in Torbay, Western Australia
Figure 11 Ternary plot for major anions (chloride, sulfate and bicarbonate) and cations (sodium, calcium and magnesium). Iso-groups assigned on the basis of sulfur isotope values and excess sulfur show separation on plot for iso-group 3, which has more sulfate and calcium present relative to the other ions. Iso-group 3 shows enrichment in sulfate, magnesium and calcium when compared with seawater major ion composition. Iso-group 4b shows depletion in sulfate when compared with seawater major ion composition.
Water science technical series, report no. 17
Department of Water 21
Figure 12 The iso-groups (categorised by sulfur isotope and excess sulfate) for groundwater were generally consistent between the April 2008 sampling event and the September 2007 sampling event. Sites with iso-groups 2, 4a and 4b are likely to be dominated by sulfate-reduction, while sites with iso-group 3 are likely to be impacted by acidic drainage (i.e. sulfate from the oxidation of pyrite).
Groundwater interactions with acid sulfate soil: a case study in Torbay, Western Australia
22 Department of Water
3.5 Comparison to guidelines
The use of assessment levels should be based on the potential use and management objectives of the water resource. When assessing groundwater contamination, it is recommended that the Guideline on the investigation levels for soil and groundwater (National Environment Protection Council 1999) be applied relative to the immediate use of the groundwater (e.g. drinking water or irrigation) or the likelihood of adverse environmental effects at the point of discharge (e.g. wetland or river).
In this study, the protection of freshwater aquatic ecosystems was the most appropriate assessment level, as the groundwater bore sites are located close to Lake Powell and Lake Manarup. Freshwater guidelines were also used since the salinity of the surficial groundwater in this area is predominantly fresh to slightly brackish, despite being close to the coast and saline ocean waters. Individual data points were compared with ANZECC & ARMCANZ (2000) trigger values at both the 95% ecological protection level and the 80% ecological protection level for freshwater (Table 5). The 80% protection level was applied because the Lower Torbay catchment is highly modified, although meeting the 95% protection level is still desirable for a healthy system. The guideline values do not signify threshold levels of pollution since there is no certainty that significant impacts will occur if contaminant concentrations are above the recommended limits (ANZECC & ARMCANZ 2000). Rather, exceeding these guidelines should trigger further investigations to determine whether management action or remediation is needed.
ANZECC & ARMCANZ guidelines do not exist for all metals and metalloids, and for some elements these guidelines refer to a speciated fraction of the element, such as Cr(VI). As metals were not speciated in this study, guidelines for speciated fractions are not directly comparable. In cases where other appropriate guidelines were available, these were applied instead, as outlined in Table 5. Where guidelines for speciated fractions have been compared – 80% protection level for Cr(VI) and As(III) (Table 5) – we are likely to be over-estimating the number of sites that exceed these guidelines because not all of the chromium; for example, will be present as Cr(VI). For metals and metalloids, guidelines were first applied to total metal concentrations, and then to soluble metal concentrations. Exceeding the guideline value by the soluble fraction is of more ecological concern, as soluble metals are more likely to be bioavailable than the insoluble fraction within total metals. Furthermore, total metals may reflect materials dislodged from bore casings or from the surrounding packing or soil formation and may not represent the water that could be moving through the shallow aquifers to surface ecosystems.
Groundwater was more acidic than recommended by the ANZECC & ARMCANZ default trigger values for south-west Australia, lowland rivers. All sites, except LPT 20 and LPT 13 for the April 2008 sampling event, were below the recommended level of pH 6.5.
Water science technical series, report no. 17
Department of Water 23
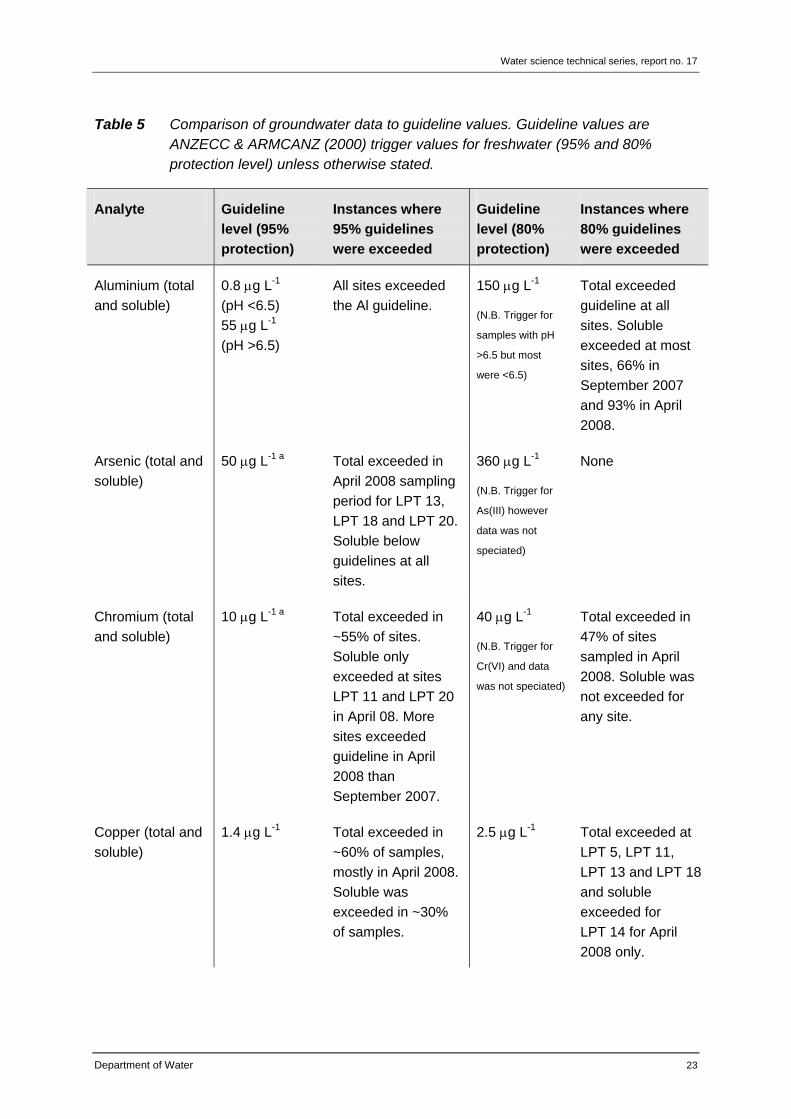
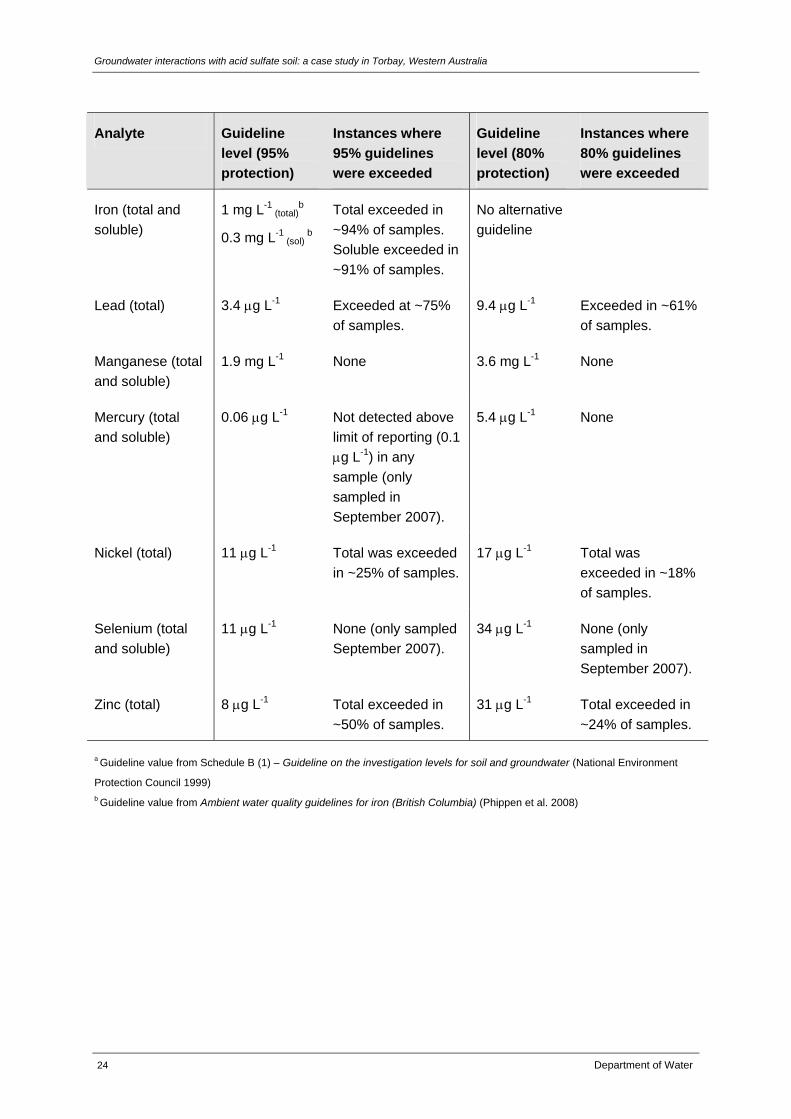
Table 5 Comparison of groundwater data to guideline values. Guideline values are ANZECC & ARMCANZ (2000) trigger values for freshwater (95% and 80% protection level) unless otherwise stated.
Analyte Guideline
level (95%
protection)
Instances where
95% guidelines
were exceeded
Guideline
level (80%
protection)
Instances where
80% guidelines
were exceeded
Aluminium (total
and soluble)
0.8 g L-1
(pH <6.5)
55 g L-1
(pH >6.5)
All sites exceeded
the Al guideline.
150 g L-1
(N.B. Trigger for
samples with pH
>6.5 but most
were <6.5)
Total exceeded
guideline at all
sites. Soluble
exceeded at most
sites, 66% in
September 2007
and 93% in April
2008.
Arsenic (total and
soluble)
50 g L-1 a Total exceeded in
April 2008 sampling
period for LPT 13,
LPT 18 and LPT 20.
Soluble below
guidelines at all
sites.
360 g L-1
(N.B. Trigger for
As(III) however
data was not
speciated)
None
Chromium (total
and soluble)
10 g L-1 a Total exceeded in
~55% of sites.
Soluble only
exceeded at sites
LPT 11 and LPT 20
in April 08. More
sites exceeded
guideline in April
2008 than
September 2007.
40 g L-1
(N.B. Trigger for
Cr(VI) and data
was not speciated)
Total exceeded in
47% of sites
sampled in April
2008. Soluble was
not exceeded for
any site.
Copper (total and
soluble)
1.4 g L-1 Total exceeded in
~60% of samples,
mostly in April 2008.
Soluble was
exceeded in ~30%
of samples.
2.5 g L-1
Total exceeded at
LPT 5, LPT 11,
LPT 13 and LPT 18
and soluble
exceeded for
LPT 14 for April
2008 only.
Groundwater interactions with acid sulfate soil: a case study in Torbay, Western Australia
24 Department of Water
Analyte Guideline
level (95%
protection)
Instances where
95% guidelines
were exceeded
Guideline
level (80%
protection)
Instances where
80% guidelines
were exceeded
Iron (total and
soluble)
1 mg L-1 (total)
b
0.3 mg L-1 (sol)
b
Total exceeded in
~94% of samples.
Soluble exceeded in
~91% of samples.
No alternative
guideline
Lead (total) 3.4 g L-1 Exceeded at ~75%
of samples.
9.4 g L-1 Exceeded in ~61%
of samples.
Manganese (total
and soluble)
1.9 mg L-1 None 3.6 mg L-1 None
Mercury (total
and soluble)
0.06 g L-1 Not detected above
limit of reporting (0.1
g L-1) in any
sample (only
sampled in
September 2007).
5.4 g L-1 None
Nickel (total) 11 g L-1 Total was exceeded
in ~25% of samples.
17 g L-1 Total was
exceeded in ~18%
of samples.
Selenium (total
and soluble)
11 g L-1 None (only sampled
September 2007).
34 g L-1 None (only
sampled in
September 2007).
Zinc (total) 8 g L-1 Total exceeded in
~50% of samples.
31 g L-1 Total exceeded in
~24% of samples.
a Guideline value from Schedule B (1) – Guideline on the investigation levels for soil and groundwater (National Environment
Protection Council 1999) b Guideline value from Ambient water quality guidelines for iron (British Columbia) (Phippen et al. 2008)
Water science technical series, report no. 17
Department of Water 25
4 Discussion
4.1 Acidification impact
The groundwater in Torbay catchment is acidified, characterised by low pH, high total acidity and high concentrations of metals across most sites investigated. Water from these bores appears to have undergone further acidification since the bores were installed in 2003, at which time measurements of groundwater were between pH 4.9 and 6.8 (Appleyard 2004). Groundwater measured over the following year (2004) produced a lowest pH of 2.9 (similar to the current study) (Appleyard 2004). Without a long-term dataset it is impossible to say whether changes in land use and/or climate are contributing to the acidification in this area.
Measurements of alkalinity in the bores (for the present study) were typically very low, with only a few locations showing buffering resistance to further acidification. Total metals were higher and coincided with reduced alkalinity in the April 2008 sampling (low groundwater level) when compared with the September 2007 sampling (high groundwater level). Surficial groundwater from most sites exceeded guideline values for aluminium, chromium, copper, iron, lead and zinc. Total arsenic occasionally exceeded the guidelines, although this was probably not present in a bioavailable form as concentrations of soluble arsenic were much lower.
The 95% protection-level trigger value for soluble aluminium was exceeded at all sites and most sites (79%) also exceeded the 80% protection-level trigger value. While aluminium is a common product from the oxidation of acid sulfate soils, it is also possible that the high abundance of aluminium is natural and not anthropogenically influenced. Aluminium is a highly abundant element within the deeply weathered soils occurring throughout the south-west of Western Australia (Division of Soils CSIRO 1983). As such, aluminium may be naturally mobile within the environment. It is not known whether Western Australian native species have evolved with a tolerance to aluminium.
4.2 Indicators of acidification
The Department of Environment and Conservation has produced an acid sulfate soil risk map for the Torbay-Albany region (DEC 2006). This map shows the likelihood of potential acid sulfate soils occurring in the top 3 m of natural soil and therefore where actual acid sulfate soils might occur if inappropriate drainage, groundwater pumping or excavation is carried out. Historical (Woodward 1917) and recent soil-coring evidence (Brad Degens 2009, pers. comm.) confirms the presence of actual acid sulfate soils in the region, particularly in and around Seven mile swamp.
The groundwater chemistry indicates that much of the study area shows some evidence of acid sulfate soil materials having oxidised, though not necessarily generating highly acidic groundwater. The iso-groups determined are overlaid onto the risk map in Figure 13. Of all
Groundwater interactions with acid sulfate soil: a case study in Torbay, Western Australia
26 Department of Water
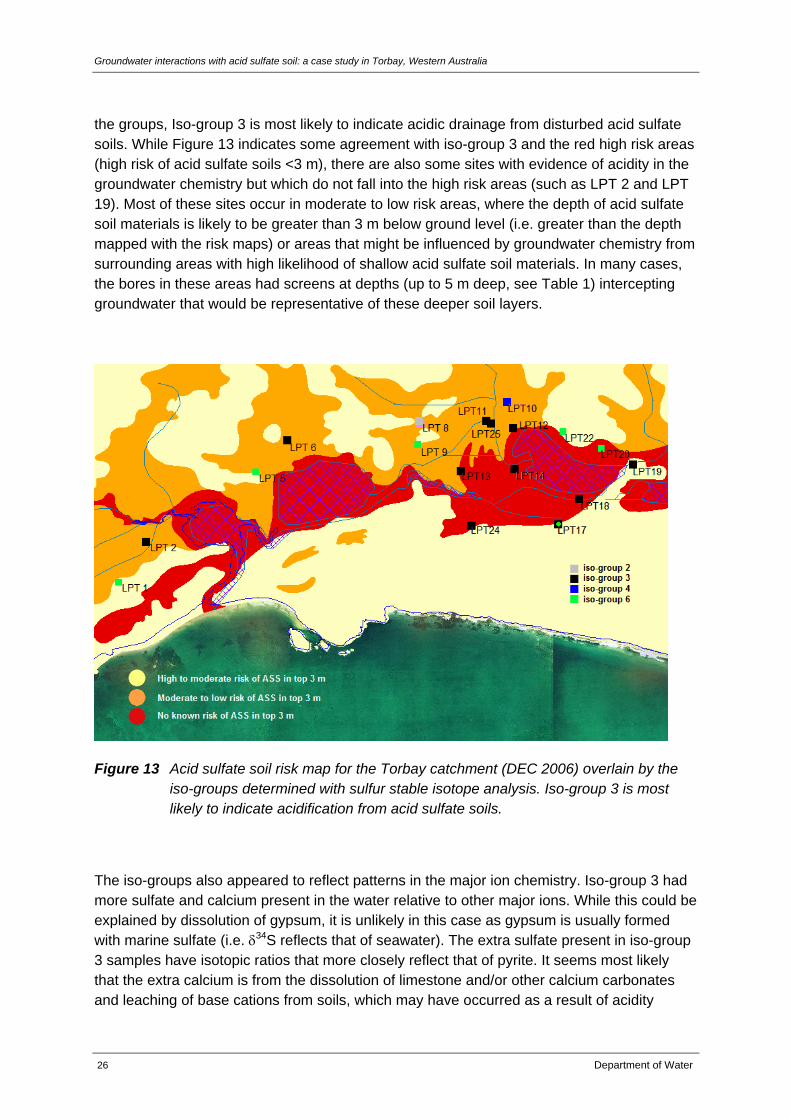
the groups, Iso-group 3 is most likely to indicate acidic drainage from disturbed acid sulfate soils. While Figure 13 indicates some agreement with iso-group 3 and the red high risk areas (high risk of acid sulfate soils <3 m), there are also some sites with evidence of acidity in the groundwater chemistry but which do not fall into the high risk areas (such as LPT 2 and LPT 19). Most of these sites occur in moderate to low risk areas, where the depth of acid sulfate soil materials is likely to be greater than 3 m below ground level (i.e. greater than the depth mapped with the risk maps) or areas that might be influenced by groundwater chemistry from surrounding areas with high likelihood of shallow acid sulfate soil materials. In many cases, the bores in these areas had screens at depths (up to 5 m deep, see Table 1) intercepting groundwater that would be representative of these deeper soil layers.
Figure 13 Acid sulfate soil risk map for the Torbay catchment (DEC 2006) overlain by the iso-groups determined with sulfur stable isotope analysis. Iso-group 3 is most likely to indicate acidification from acid sulfate soils.
The iso-groups also appeared to reflect patterns in the major ion chemistry. Iso-group 3 had more sulfate and calcium present in the water relative to other major ions. While this could be explained by dissolution of gypsum, it is unlikely in this case as gypsum is usually formed with marine sulfate (i.e. 34S reflects that of seawater). The extra sulfate present in iso-group 3 samples have isotopic ratios that more closely reflect that of pyrite. It seems most likely that the extra calcium is from the dissolution of limestone and/or other calcium carbonates and leaching of base cations from soils, which may have occurred as a result of acidity
Water science technical series, report no. 17
Department of Water 27
generation in soil profiles by sulfide oxidation. Dissolution of carbonates would also contribute to buffering of major falls in pH. The iso-group analysis also indicates some sites where sulfate-reduction is a dominant process (iso-groups 2, 4a and 4b). Reducing processes may also influence the concentration of metal and metalloids observed. For example, sulfide may react with dissolved metals to form insoluble metal sulfides.
4.3 Spatial heterogeneity
Concentrations of analytes in the samples displayed significant heterogeneity across the sites measured. Sites very close to each other (250 m) within the moderate to low risk area had quite different groundwater quality, both by chemical and physical measurements. This is not entirely unexpected, and possibly reflects the local-scale heterogeneity of soils in the area (not captured by the initial risk mapping). The variation also indicates that local, probably near-surface processes, influence groundwater chemistry.
4.4 Eutrophication
High nutrient concentrations in the Torbay catchment’s groundwater suggest eutrophication. There does not seem to be a significant seasonal fluctuation so it is probable that the eutrophication is historical rather than a pulse associated with current agricultural practices in the area. This is also consistent with earlier reporting on groundwater chemistry in the area (Appleyard 2004) suggesting that oxidation of organic matter in surface profiles was potentially a significant source of nutrients to the area’s groundwater. Dissolved organic nitrogen did show a seasonal signal, with slightly lower concentrations in the April 2008 sampling than the September 2007 sampling. Irrespective of which trigger value applied (lowland river or wetland; Appendix B – Table 8), total nitrogen exceeded trigger values in approximately two thirds of samples, and total phosphorus exceeded trigger values in approximately one third of samples. Most dissolved inorganic nitrogen was in the form of ammonium rather than nitrate or nitrite, which reflected the reducing nature of the groundwater in many of the bores.
4.5 Implications for drainage and groundwater use
Surficial groundwater in the Torbay catchment area was shown to be significantly contaminated with metals, although the degree of contamination varied spatially and showed the imprint of water chemistry originating from actual acid sulfate soils. The groundwater quality was such that impacts on receiving aquatic ecosystems maintained by groundwater would be expected. The extent of those impacts on the receiving environment has not been evaluated. Further drawdown of groundwater levels in this area is likely to exacerbate poor water quality in the area, with continued oxidation of sediments containing acid sulfate soil materials. Drainage design that increases groundwater discharge, rather than reducing
Groundwater interactions with acid sulfate soil: a case study in Torbay, Western Australia
28 Department of Water
surface flooding, also risks increasing the mobility of contaminants from the groundwater into surface environments.
There is potential for groundwater drawn from bores in this area to be used for irrigation (domestic or agricultural) or for livestock. Guideline values suggested for irrigation and livestock are often more conservative than the ecosystem protection values. A preliminary survey of private bores in the area suggests that most bores for domestic or livestock purposes are drilled to a depth of approximately 30 m. However, there are also some bores in the region that draw from the superficial aquifer with slotted depths around 3–4 m (similar to the zone investigated in this study). The deeper bores are unlikely to be affected by the poor quality water at the top of the superficial aquifer. The shallower bores are likely to be acidified (pH <6.5) and may also be contaminated with metals.
Water science technical series, report no. 17
Department of Water 29
5 Conclusions and recommendations
This case study demonstrates that acid sulfate soils can substantially affect the quality of surficial groundwater in areas where modification of drainage and/or land disturbance results in the oxidation of acid sulfate soils. At the majority of sites, acidity, nutrients and metal concentrations exceed trigger values. Contamination of the surficial water quality is likely to affect the ecology of the aquatic receiving environments (e.g. Lake Powell, Lake Manarup and Torbay Inlet), although these effects have not been determined here. A previous study using the Australian River Assessment System (AUSRIVAS) tool (DoE 2005) showed impacts on the macroinvertebrate community. Two sites were considered extremely impaired (with the lowest AUSRIVAS score). Site 6031134, located north of LPT 1 in this study, had very low macroinvertebrate diversity with a low pH measured (pH 3). Site 6031291 was also considered extremely impaired and is located adjacent to LPT 11 in this study, a site which showed influence from acid sulfate soils. It is probable the reduced macroinvertebrate diversity is a result of acidification.
Acidification of groundwater by disturbed acid sulfate soils also makes the surficial groundwater unsuitable for use in irrigation and for livestock. However, it is not known how deep the layer of acidified water penetrates into the groundwater table in the lower Torbay catchment.
Significant heterogeneity associated with spatial coverage was observed in the study, and did not always match what was expected from the acid sulfate soil risk map. This is not entirely unexpected, as groundwater migrates through soil and the resolution of data collection that determined the map was on a relatively coarse scale. Seasonal variation was also observed with higher concentrations of metals found in the groundwater low (April 2008) than the groundwater high (September 2007) season.
Recommendation 1: Groundwater extracted from shallow bores in the Torbay region is unlikely to be suitable for irrigation, livestock or domestic uses.
Recommendation 2: Major fluctuations in groundwater level in the Torbay region should be avoided to reduce risk of further acidification and flushing of groundwater into drains. Drains design should consider minimising drainage of groundwater while maximising movement of surface waters.
Recommendation 3: Given the spatial heterogeneity of groundwater quality in the current study, future investigations of groundwater for acidification require adequate numbers of bores within an area to ensure representative sampling.
Recommendation 4: Guideline levels for aluminium should be established with ecotoxicological testing using appropriate Western Australian plant and animal species.
Groundwater interactions with acid sulfate soil: a case study in Torbay, Western Australia
30 Department of Water
General recommendation: Groundwater drawdown should be avoided in low-lying areas with high risk of shallow soils containing acid sulfate soils, as surficial groundwater may be contaminated as a result. Avoiding acidification of the surficial groundwater is particularly important for the ecology of many groundwater-dependent wetlands and streams in south-west Western Australia.
Water science technical series, report no. 17
Department of Water 31
Appendices
Appendix A: Nutrient data
TP FRP
Con
cent
ratio
n (m
g L
-1)
0.00
0.05
0.10
0.15
0.20
0.25
September 2007April 2008
Figure 14 Average phosphorus concentrations in groundwater sampled in September 2007 and April 2008 (mean + standard error, n = 15); TP = total phosphorus, FRP = filterable reactive phosphorus.
TN NH4+ NOx DON
Con
cent
ratio
n (m
g L-1
)
0
1
2
3
4
September 2007April 2008
a
b
Figure 15 Average nitrogen concentrations for groundwater sampled in September 2007 and April 2008 (mean + standard error, n = 15); TN = total nitrogen, NH4
Groundwater interactions with acid sulfate soil: a case study in Torbay, Western Australia
32 Department of Water
Appendix B: Instances were guideline trigger values were exceeded
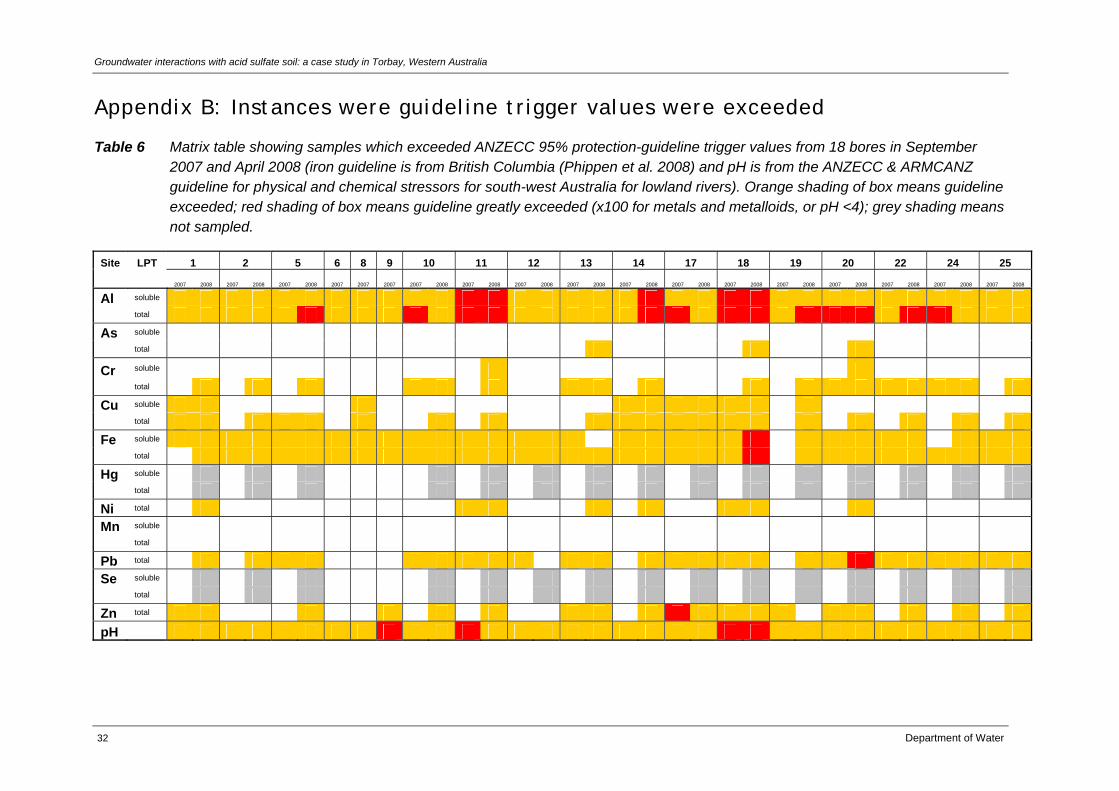
Table 6 Matrix table showing samples which exceeded ANZECC 95% protection-guideline trigger values from 18 bores in September 2007 and April 2008 (iron guideline is from British Columbia (Phippen et al. 2008) and pH is from the ANZECC & ARMCANZ guideline for physical and chemical stressors for south-west Australia for lowland rivers). Orange shading of box means guideline exceeded; red shading of box means guideline greatly exceeded (x100 for metals and metalloids, or pH <4); grey shading means not sampled.
Cr soluble total Cu soluble total Fe soluble total Hg soluble total Ni total Mn soluble total Pb total Se soluble total Zn total
pH
Water science technical series, report no. 17
Department of Water 33
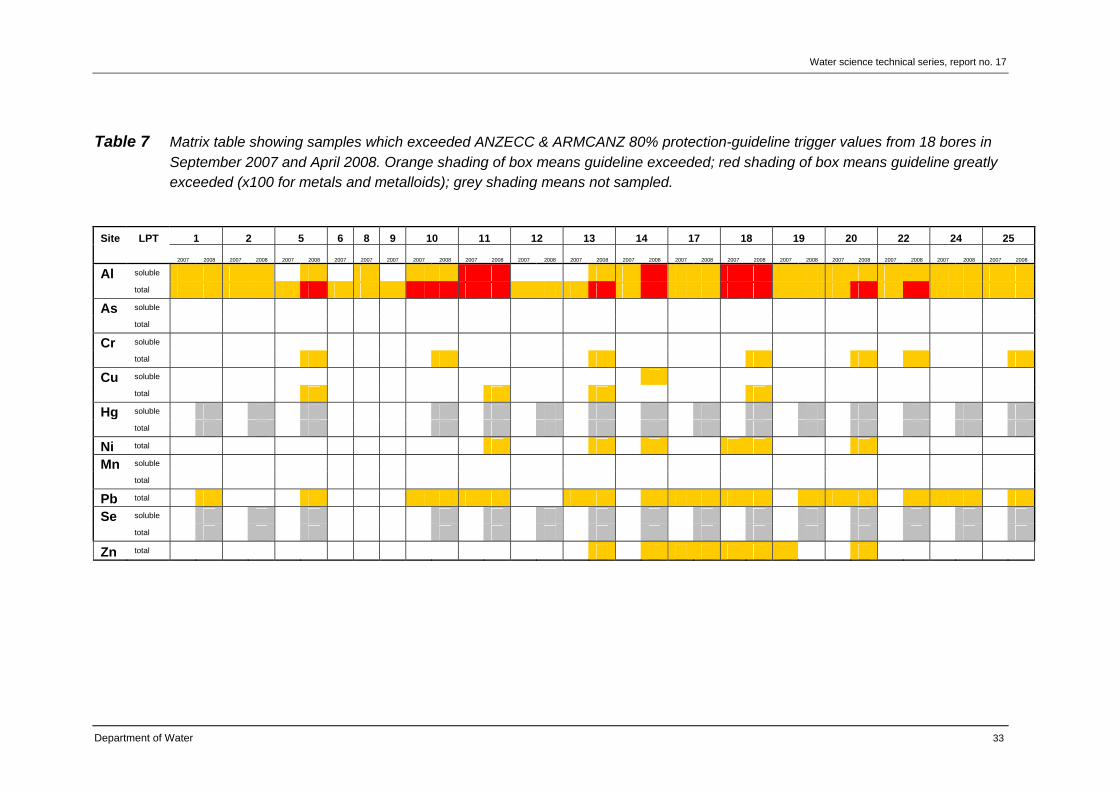
Table 7 Matrix table showing samples which exceeded ANZECC & ARMCANZ 80% protection-guideline trigger values from 18 bores in September 2007 and April 2008. Orange shading of box means guideline exceeded; red shading of box means guideline greatly exceeded (x100 for metals and metalloids); grey shading means not sampled.
Al soluble total As soluble total Cr soluble total Cu soluble total Hg soluble total Ni total Mn soluble total Pb total Se soluble total
Zn total
Groundwater interactions with acid sulfate soil: a case study in Torbay, Western Australia
34 Department of Water
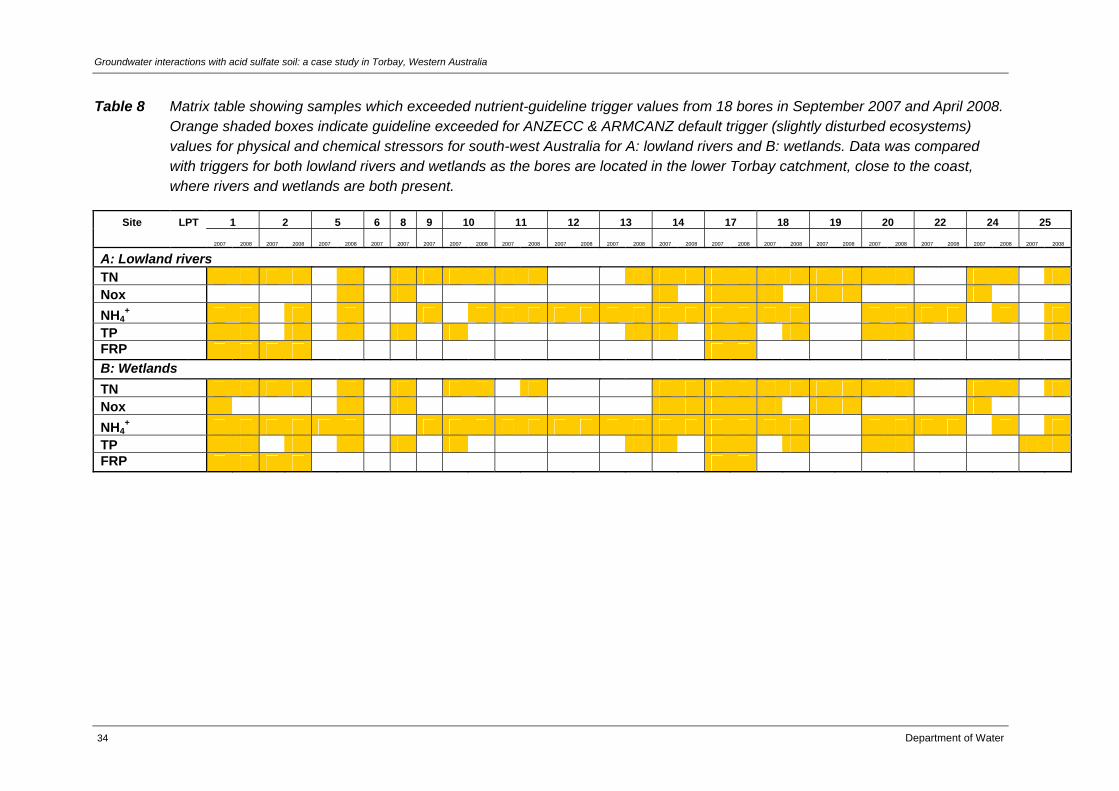
Table 8 Matrix table showing samples which exceeded nutrient-guideline trigger values from 18 bores in September 2007 and April 2008. Orange shaded boxes indicate guideline exceeded for ANZECC & ARMCANZ default trigger (slightly disturbed ecosystems) values for physical and chemical stressors for south-west Australia for A: lowland rivers and B: wetlands. Data was compared with triggers for both lowland rivers and wetlands as the bores are located in the lower Torbay catchment, close to the coast, where rivers and wetlands are both present.
Acronyms ANZECC Australian and New Zealand Environment Conservation Council
ARMCANZ Agriculture and Resource Management Council of Australia and New Zealand
AUSRIVAS Australian River Assessment System
CSIRO Commonwealth Scientific and Industrial Research Organisation
DEC Department of Environment and Conservation
DoE Department of Environment (before it was amalgamated with the Department of Conservation and Land Management to form DEC in 2006)
DoW Department of Water
PERMANOVA Permutational Multivariate Analysis of Variance
PRIMER Plymouth Routines in Multivariate Ecological Research
Groundwater interactions with acid sulfate soil: a case study in Torbay, Western Australia
36 Department of Water
Glossary Abstraction Removal (of groundwater).
Acid sulfate soils Naturally occurring, these are soils containing significant quantities of reduced sulfur (pyrite and other sulfides). When these soils are disturbed the reduced sulfur is oxidised, resulting in the release of acidity and often toxic metals.
Anion A negatively charged ion.
Aquifer A geological formation or group of formations able to receive, store and/or transmit large amounts of water.
Buffer A solution that resists changes in pH when a small amount of strong acid or base is added.
Buffering capacity
A measure of the ability of a solution to resist changes in pH.
Cation A positively charged ion.
Dissolution The process of dissolving a solid to produce a solution.
Eutrophication An excess of nutrients (nitrogen and phosphorus) in an ecosystem, often resulting in excessive primary production.
Grey water Non-industrial wastewater from domestic activities such as dishwashing, bathing or laundry.
Groundwater Water that occupies the pores within the rock or soil profile.
Groundwater level
An imaginary surface representing the total head of groundwater. Defined by piezometer readings.
Holocene age The geological period that started approximately 10 000 years ago and extends to the present.
Ion An atom which has lost or gained electrons and therefore carries an electrical charge.
Isotopes Atoms of an element that have different numbers of neutrons and therefore different atomic masses.
Isotopic fractionation
The process by which different isotopes of the same element are separated by physical, chemical or biological processes.
Iso-group A categorical grouping of water quality for a site using sulfur isotope measurements.
Metalloid An element whose properties are between those of metals and non-metals.
Oxidation A process resulting in the loss of electrons from a chemical species
Water science technical series, report no. 17
Department of Water 37
accompanied by an increase in oxidation state. This process does not necessarily require the presence of oxygen.
pH The negative logarithm of the concentration of hydrogen ions.
Proterozoic age The geological age (2500 to 542 million years before present) representing the period before complex life developed.
Reduction A process resulting in the gain of electrons by a chemical species accompanied by a decrease in oxidation state.
Riparian fauna or flora
Plants and animals living at the interface between land and a stream.
Stressor An agent, condition or other stimulus that causes stress to an organism or ecosystem.
Surficial Pertaining to the surface.
Groundwater interactions with acid sulfate soil: a case study in Torbay, Western Australia
38 Department of Water
References
Adeney, JA 2001, Cyanobacterial issues in the Lake Powell/Torbay Inlet drainage system, Technical report 44/01, CSIRO Land and Water.
Anderson, MJ, Gorley, RN & Clarke, KR 2008, PERMANOVA+ for PRIMER: Guide to software and statistical methods, PRIMER E: Plymouth, UK.
ANZECC & ARMCANZ 2000, Australian and New Zealand guidelines for fresh and marine water quality, Australia and New Zealand Environment and Conservation Council & Agriculture and Resource Management Council of Australia and New Zealand.
Appleyard, SJ 2004, What lies beneath... Impact of groundwater and subsoil geochemical processes on the health of waterways in the Lower Torbay catchment, South Coast Region, DRAFT, Department of Environment.
Clarke, I & Fritz, P 1997, Environmental isotopes in hydrogeology, Lewis Publishers, CRC Press LLC, Boca Raton.
Clarke, KR & Warwick, RM 2001, Change in marine communities: an approach to statistical analysis and interpretation, PRIMER-E: Plymouth.
DEC 2006, Acid sulfate soil risk map for the Albany-Torbay region: metadata statement, Department of Environment and Conservation, Government of Western Australia.
Division of Soils CSIRO 1983, Soils: an Australian viewpoint, CSIRO: Melbourne, Academic Press: London.
DoE 2005, Torbay Catchment AUSRIVAS Assessment – 2003, Aquatic Science Branch, Department of Environment, Government of Western Australia.
DoW 2006, Torbay catchment restoration plan, Department of Water.
Hingston, FJ & Gailitis, V 1976, 'The geographic variation of salt precipitated over Western Australia', Australian Journal of Soil Research, vol. 14, pp. 319-335.
Kaplan, IR & Rafter, TA 1957, 'Fractionation of stable isotopes of sulfur by thiobacilli', Science, vol. 127, pp. 517-518.
Mizota, C & Sasaki, A 1996, 'Sulfur isotope composition of soils and fertilizers: Differences between Northern and Southern hemispheres', Geoderma, vol. 71, pp. 77-93.
National Environment Protection Council 1999, Schedule B (1) – Guideline on the investigation levels for soil and groundwater National Environment Protection (Assessment of Site Contamination).
Phippen, B, Horvath, C, Nordin, R & Nagpal, N 2008, Ambient water quality guidelines for iron, Ministry of Environment, Province of British Columbia.
Woodward, HP 1917, Investigation into the cause of the mineralisation of the "Seven-Mile" swamp at Grassmere, near Albany, south-west division, Bulletin 74, Report no. 64.
Looking after all our water needs
Department of Water168 St Georges Terrace, Perth, Western Australia
PO Box K822 Perth Western Australia 6842Phone: (08) 6364 7600