SSFL Regional Groundwater Salinity with Depth AquaResource Inc, 2007. 1 Groundwater Salinity with Depth from Oil & Gas Well Log Interpretation Introduction In the preliminary stages of developing the Regional Scale Conceptual Model (RSCM) of groundwater flow for the SSFL Oil and Gas well logs were reviewed. Some of these logs documented changes in groundwater quality with depth from freshwater near surface to saline formation water at depth. The progression from fresh, to brackish, to saline water with depth reflects the depth of freshwater circulation since the deposition of these formations in a seawater environment. The interface between the freshwater zone and the saline water zone represents a flow divide and defines the bottom to the fresh groundwater flow system. Below this depth driving forces are not strong enough to counteract buoyancy and viscosity forces such that there is little mixing of modern groundwater recharge with formation waters. By determining the depth of this mixing zone throughout the study area, a physically based bottom boundary can be represented in the groundwater model (base of freshwater system). Based on sampling of porewater beneath the SSFL, groundwater salinity is considered low (<2500 mg/L) to depths greater than 900 feet or 275 m (SSFL is approximately 1800 ft asl). To further investigate groundwater salinity with depth additional data were sought to aid in defining the bottom of the freshwater flow system. In the 1980’s the Ventura Basin Study Group (VBSG) compiled and analyzed 1200 deep wells for the purposes of petroleum exploration and hydrocarbon development (ICS, 2007). A number of these wells in this dataset lie within the vicinity of the SSFL. The VBSG datasets include drilling/geologic logs and wireline (borehole geophysics) logs (ICS, 2007). The drilling/geologic logs provide qualitative salinity/water quality information at sporadic depths that is useful in identifying water salinity horizons. Of greater utility are the borehole geophysics logs (e.g. spontaneous potential, resistivity, and gamma ray) which can be used to estimate formation water salinity continuously with depth and correlate these values with specific formations. This technical memo outlines the methodology employed to interpret the VBSG well data for wells in the vicinity of the SSFL to identify the depth of circulation of fresh groundwater, the depth to saline formation water, and the approximate thickness of the mixing zone (brackish). The purpose of this exercise was to map the depth to (or elevation of) the bottom of the fresh water system near the SSFL so that it could be used to assign a bottom boundary in the groundwater flow model. Additionally, the interpretation attempts to identify any climatic, topographic or geologic controls on the depth of the freshwater system.
Transcript
SSFL Regional Groundwater Salinity with Depth
AquaResource Inc, 2007. 1
Groundwater Salinity with Depth from Oil & Gas Well Log
Interpretation
Introduction
In the preliminary stages of developing the Regional Scale Conceptual Model (RSCM) of
groundwater flow for the SSFL Oil and Gas well logs were reviewed. Some of these logs
documented changes in groundwater quality with depth from freshwater near surface to
saline formation water at depth. The progression from fresh, to brackish, to saline water
with depth reflects the depth of freshwater circulation since the deposition of these
formations in a seawater environment.
The interface between the freshwater zone and the saline water zone represents a flow
divide and defines the bottom to the fresh groundwater flow system. Below this depth
driving forces are not strong enough to counteract buoyancy and viscosity forces such
that there is little mixing of modern groundwater recharge with formation waters. By
determining the depth of this mixing zone throughout the study area, a physically based
bottom boundary can be represented in the groundwater model (base of freshwater
system). Based on sampling of porewater beneath the SSFL, groundwater salinity is
considered low (<2500 mg/L) to depths greater than 900 feet or 275 m (SSFL is
approximately 1800 ft asl).
To further investigate groundwater salinity with depth additional data were sought to aid
in defining the bottom of the freshwater flow system. In the 1980’s the Ventura Basin
Study Group (VBSG) compiled and analyzed 1200 deep wells for the purposes of
petroleum exploration and hydrocarbon development (ICS, 2007). A number of these
wells in this dataset lie within the vicinity of the SSFL.
The VBSG datasets include drilling/geologic logs and wireline (borehole geophysics)
logs (ICS, 2007). The drilling/geologic logs provide qualitative salinity/water quality
information at sporadic depths that is useful in identifying water salinity horizons. Of
greater utility are the borehole geophysics logs (e.g. spontaneous potential, resistivity,
and gamma ray) which can be used to estimate formation water salinity continuously
with depth and correlate these values with specific formations.
This technical memo outlines the methodology employed to interpret the VBSG well data
for wells in the vicinity of the SSFL to identify the depth of circulation of fresh
groundwater, the depth to saline formation water, and the approximate thickness of the
mixing zone (brackish). The purpose of this exercise was to map the depth to (or
elevation of) the bottom of the fresh water system near the SSFL so that it could be used
to assign a bottom boundary in the groundwater flow model. Additionally, the
interpretation attempts to identify any climatic, topographic or geologic controls on the
depth of the freshwater system.
SSFL Regional Groundwater Salinity with Depth
AquaResource Inc, 2007. 2
Methodology
The VBSG datasets are proprietary but copies can be obtained for commercial and
exploration purposes from Tom E. Hopps, Rancho Energy Consultants, Inc., Ventura, CA
93001. Phone: (805) 652-0066, one of the original study authors (ICS, 2007).
Tom Hopps was contracted by MWH to compile the available datasets within the SSFL
study area and complete the analysis of the logs for the purposes of identifying the depth
of the freshwater system. Information from 783 well logs was compiled. Of these wells
32 were within the regional study area and had sufficient information to interpret salinity
with depth (SP log and drill mud resistivity, geology log). The method presented below
was carried out by Tom Hopps with input from the MWH. For the purposes of this
analysis the study team defined three depths of interest to be interpreted by Tom Hopps
in the available well logs. The depths include:
1. Bottom of Freshwater, salinity equal to 2,500 mg/L
2. Bottom of Brackish water, salinity equal to 5,000 mg/L
3. Top of the saline water, salinity equal to 10,000 mg/L
The well logs were then interpreted by first looking at the geology from various surface
and subsurface sources to determine the presence of possible aquifers and their depth.
Salinity of formation water was evaluated based principally using the Spontaneous
Potential (SP) log within aquifer units. In permeable strata, SP excursion from the
baseline indicates a contrast in salinity between the drilling fluid and the surrounding
media. A lack of excursion indicates the resistivity of the formation water and drilling
fluid to be the same while the direction of any excursion indicates resistivity greater or
less than that of the drilling fluid (Figure 1).
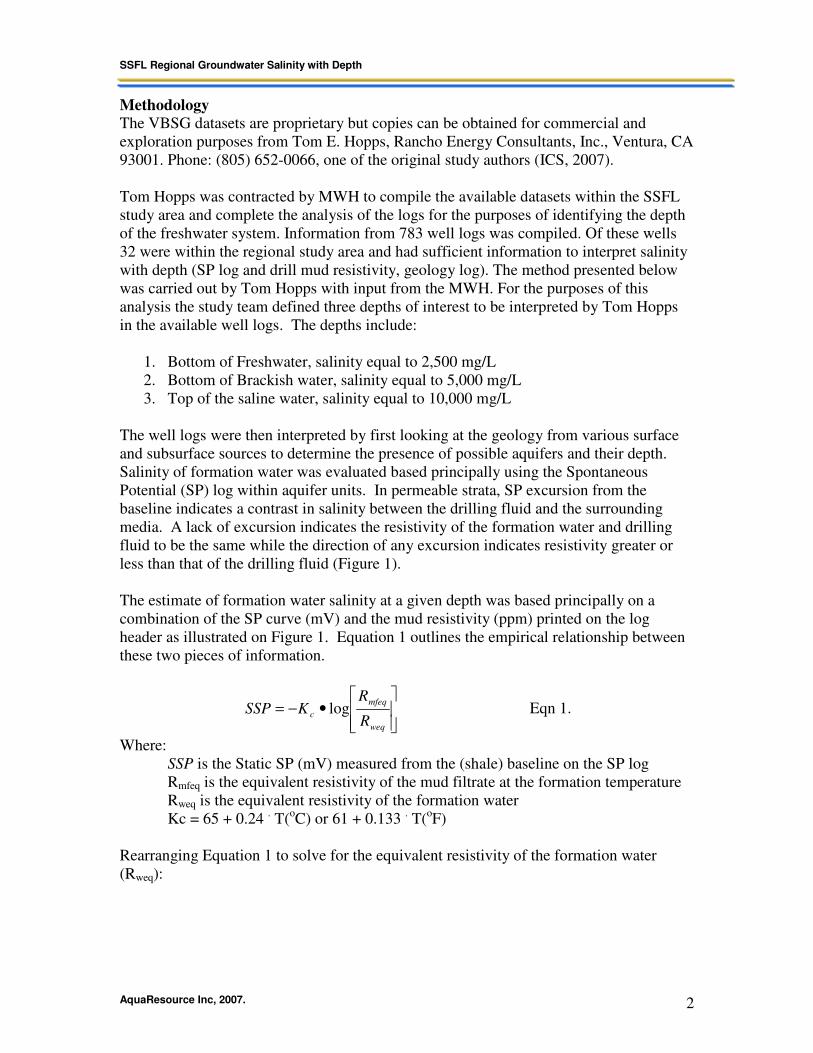
The estimate of formation water salinity at a given depth was based principally on a
combination of the SP curve (mV) and the mud resistivity (ppm) printed on the log
header as illustrated on Figure 1. Equation 1 outlines the empirical relationship between
these two pieces of information.
•−=
weq
mfeq
cR
RKSSP log Eqn 1.
Where:
SSP is the Static SP (mV) measured from the (shale) baseline on the SP log
Rmfeq is the equivalent resistivity of the mud filtrate at the formation temperature
Rweq is the equivalent resistivity of the formation water
Kc = 65 + 0.24 . T(
oC) or 61 + 0.133
. T(
oF)
Rearranging Equation 1 to solve for the equivalent resistivity of the formation water
(Rweq):
SSFL Regional Groundwater Salinity with Depth
AquaResource Inc, 2007. 3
−
=
cK
SSP
mfeq
weq
RR
10
Eqn. 2
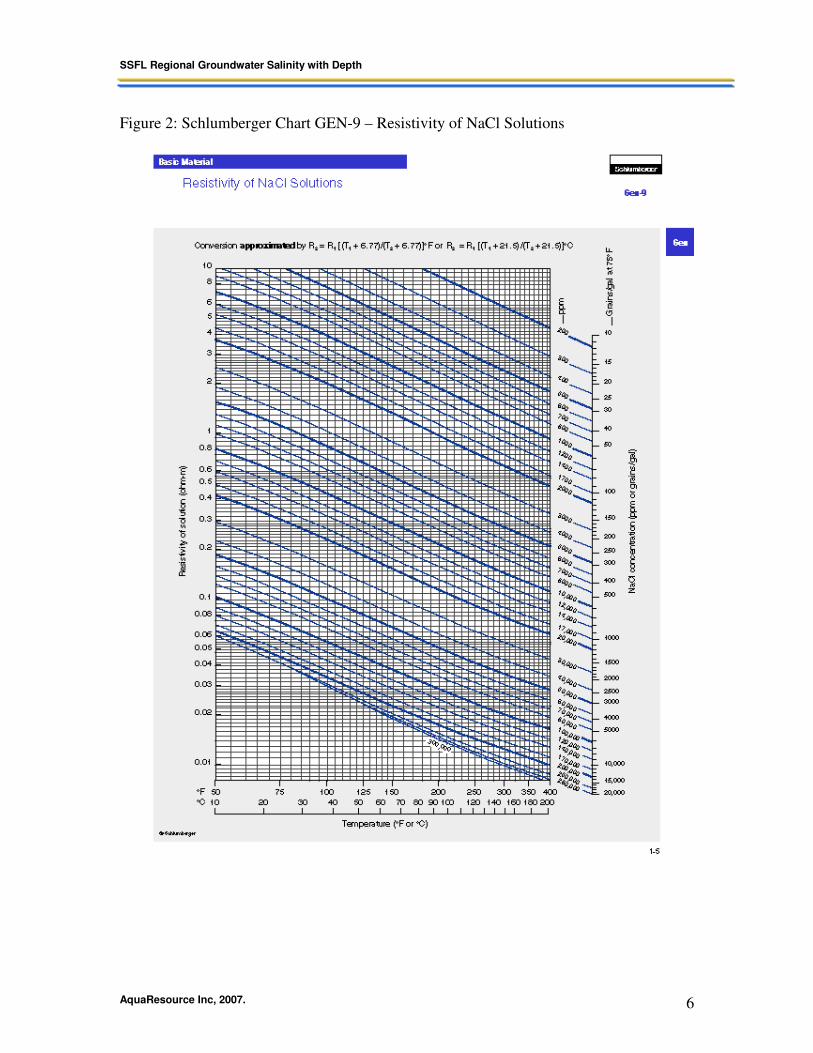
The measured mud filtrate (mf) resistivity noted on the log (e.g. Figure 1) is corrected to
the temperature of the formation (Rmfeq) water using the Schlumberger Chart Gen-9
(Figure 2) and Rmfeq= 0.85Rmf if mud filtrate is resistivity is greater than 0.1 at 75o F. If
the mud filtrate resistivity is less than 0.1 at 75o F then chart SP-2 is used to calculate
Rmfeq (Figure 3). The Rweq can then be converted to the formation water resistivity Rw
using Chart SP-2 (Figure 3) or a formation water salinity using Chart Gen-9 (Figure 2).
Each of the 32 logs was interpreted in this manner to identify the depth at which the
formation water salinity was equal to 2500, 5000 and 10000 ppm (mg/L).
Example Calculation using Equation 1 (from Henderson Petrophysics, 2007).
Well:
Formation:
Surface
Rmf :
Warthog - 1A
Olivier
0.268 Ohmm at 84.2 oF
Depth
(m)
SSP
(MV)
Temp
(o F)
K c Rmf
(Ohmm)
Rmfeq
(Ohmm)
Rweq
(Ohmm)
Rw
(Ohmm)
Salinity
(NaCl
Eq.)
940 -16 93 73.4 0.244 0.220 0.133 0.150 ~36000
Results:
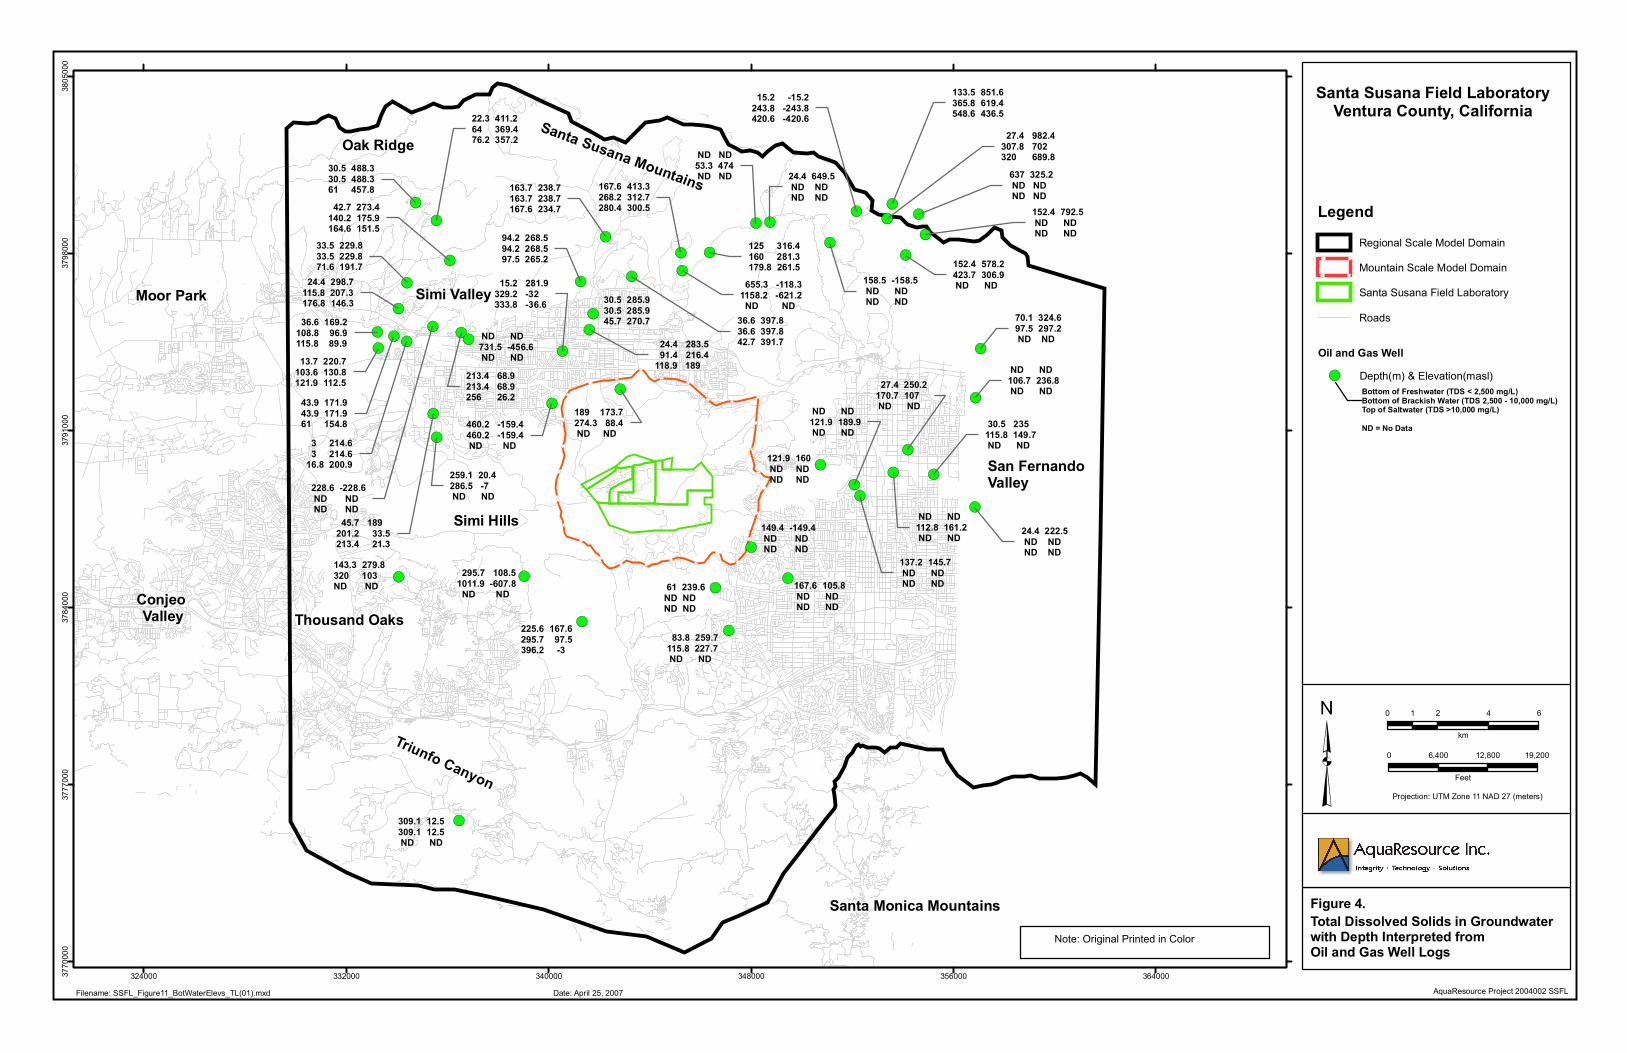
Figure 4 is a map of oil and gas well locations where salinity information was available.
This figure shows the approximate depth (and elevation) at which the formation water
has a salinity of 2,500 mg/L (bottom of freshwater), 5,000 mg/L (top of brackish water),
and 10,000 mg/L (top of saline water). Most of the interpreted wells are located in the
area north of the Simi Valley in the Santa Susana Oil Fields. Elsewhere wells are sparse
including the Simi Hills area reflecting the low petroleum yield of exploration wells
drilled in the formations underlying these areas. The Chatsworth Formation is not
considered an oil producing reservoir due to its low permeability and absence of
appropriate reservoir structure and therefore is penetrated by few wells.
For the 33 wells interpreted, salinity was observed to increase with depth. There were 24
wells that were deep enough to intersect saline water (10,000 ppm or greater). Eight of
the nine other wells are of sufficient depth to intersect brackish water (~5,000 ppm). The
depth to freshwater is shown to vary between 0 to 658 meters (0 to 2250 feet). On
average the depth of freshwater penetration is 128 meters (428 feet). The depth to
brackish water is shown to vary between 0 to 1159 meters (0 to 3800 feet) with an
average of about 257 meters (843 feet). The depth to saline water varies from 0 to greater
than 1159 meters (0 to 3800+ feet). The average depth to saline water is estimated to be
285 meters (935 feet).
SSFL Regional Groundwater Salinity with Depth
AquaResource Inc, 2007. 4
These maps provide and understanding of the general depth of fresh groundwater
circulation and can be used to guide assignment of the bottom boundary of the
groundwater model. However, insufficient data were available to map the base of the
freshwater system directly, or to determine the specific climatic, topographic, and
geologic controls on the depth of fresh water circulation. The range of depths
documented from the oil and gas logs do however provide reasonable bounds on the
depth of the freshwater flow system.
References
Frind, E. O., Simulation of long-term transient density-dependent transport in groundwater,
Adv. Water Resources., 5, 73–97, 1982.
Henderson Petrophysics. 2007. Calculating Formation Water Resistivity From the SP Log.
http://www.hendersonpetrophysics.com/RW_SP.html
Institute of Crustal Studies (ICS). 2007. Ventura Basin Study Group Maps and Cross-
sections. University of California at Santa Barbara.