100
I GROUP BUSINESS PLAN January 2018 1

I
GROUP BUSINESS PLAN January 2018
1

I
Section 1 Contents
2

Group Business Plan Presentation
Contents
Section 1 Contents
Section 2 Executive Summary
Section 3 Strategy
Section 4 Group Structure & Management
Section 5 Transformation & Cost Reduction
Section 6 Group P&L forecasts
Section 7 Group cash flow
Section 8 Group balance sheet
Section 9 Disposals
Section 10 Business priorities
Section 11 Business unit summaries
Section 12 Sensitivities & Opportunities
Section 13 Summary
Appendices
3

I
Section 2 Executive summary
4
Group Business Plan Presentation
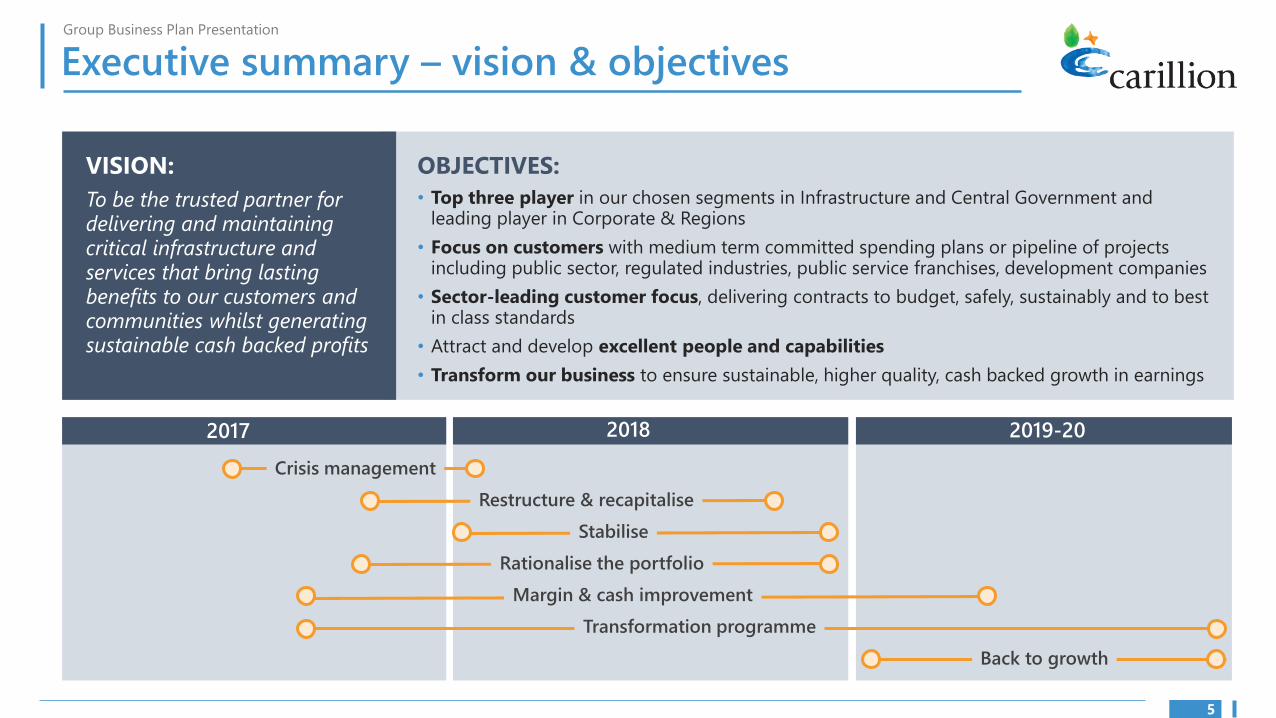
Executive summary – vision & objectives
OBJECTIVES:
• Top three player in our chosen segments in Infrastructure and Central Government and leading player in Corporate & Regions
• Focus on customers with medium term committed spending plans or pipeline of projects including public sector, regulated industries, public service franchises, development companies
• Sector-leading customer focus, delivering contracts to budget, safely, sustainably and to best in class standards
• Attract and develop excellent people and capabilities
• Transform our business to ensure sustainable, higher quality, cash backed growth in earnings
VISION:
To be the trusted partner for delivering and maintaining critical infrastructure and services that bring lasting benefits to our customers and communities whilst generating sustainable cash backed profits
5
2018 2019-202017
Transformation programme
Margin & cash improvement
Rationalise the portfolio
Stabilise
Restructure & recapitalise
Back to growth
Crisis management

Group Business Plan Presentation
Executive summary – playing to our strengths
Carillion has a great many strengths:
• Strong brand with leading market positions including in growth markets such as rail, roads and digital
• Deep, long term customer relationships, working as a trusted partner with high levels of repeat business
• Broad customer base with exposure to a mix of blue chip and government backed contracts
• Our greatest asset – our people: 45,000 people in the UK, Middle East and Canada
• Visibility with a £12.9bn order book and £28.8bn pipeline underpinning the outlook – 2018 revenue visibility 75% (2019 48%)
BUT
The Group had become too complex with an overly short term focus, weak operational risk management and too many distractions outside of our ‘core’
Our strategy is focused on simplification, removing distractions and clear actions to address our risk profile and rebuild Carillion into a strong and viable business. We believe that new leadership and a new structure will enable the Group to focus on its strengths in order to deliver higher quality, sustainable, cash backed earnings
6

Group Business Plan Presentation
Executive summary – our DNA & history
2017 Strategic review
Core markets defined 2014 Ask disposal
Rokstad acquisition completed Power transmission & UK healthcare FM sale
distribution capabilities agreement signed
2016 Canadian FM acquisition
1999 2008 Broadening and deepening
FM capabilities across
1996 Tarmac
Carillion formed
Demerged from
Tarmac
New support
services strategy
2002 Citex acquisition
Market leading capability
in support services
Alfred McAlpine acquisition
Support services capabilities in
technology and utilities sectors
2011
Canada 2012 Bouchier acquisition
Support services in Canada
Eaga acquisition acquires
Energy services capabilities Wimpey 2009
1903 Reclassified
Reclassified on LSE as support services business Tarmac founded 2006 2005Origins in PM and Mowlem acquisition
PME acquisition construction Support services capabilities in Market leading capability in private and non-regulated sectors
maintenance delivery management
Our history
• Over 200 years history of creating award-winning cultural, residential, commercial, community and infrastructure developments worldwide
• Roots in companies that became part of Tarmac Group (Tarmac Construction, Wimpey Construction, Cubitts and Mitchell Construction)
• 1999 – Tarmac Group demerger into Tarmac (building materials) and Carillion (support services and construction services)
• Since then, acquisitions have included Mowlem (2006), Alfred McAlpine (2008), Vanbots (2008) and Eaga (2011)
• Revenues have grown from £1.9bn to £4.7bn – Infrastructure has grown from £300m to >£750m; Support Services from £300m to >£1.3bn
7
Group Business Plan Presentation
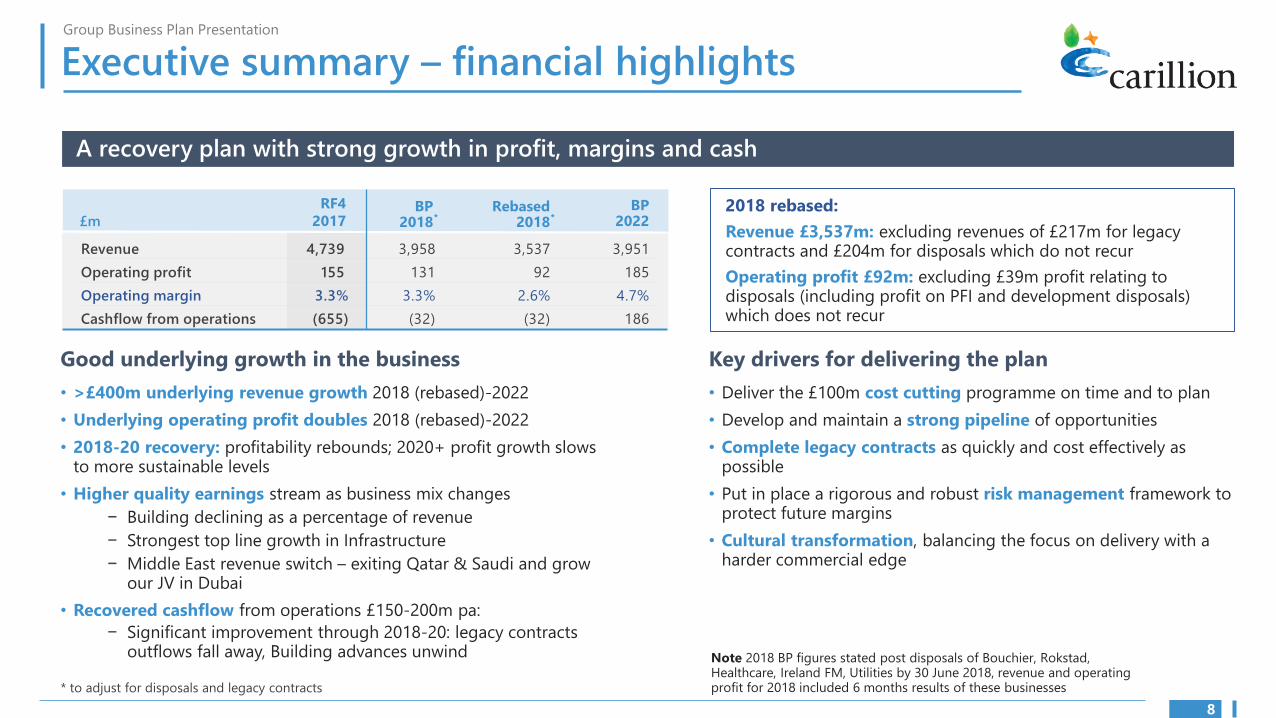
Executive summary – financial highlights
A recovery plan with strong growth in profit, margins and cash
Revenue
Operating profit
Operating margin
Cashflow from operations
£m
RF4
2017
4,739
155
3.3%
(655)
3,958
131
3.3%
(32)
3,537
92
2.6%
(32)
3,951
185
4.7%
186
BP 2022
BP 2018 *
Rebased 2018 *
Good underlying growth in the business
• >£400m underlying revenue growth 2018 (rebased)-2022
• Underlying operating profit doubles 2018 (rebased)-2022
• 2018-20 recovery: profitability rebounds; 2020+ profit growth slows to more sustainable levels
• Higher quality earnings stream as business mix changes
− Building declining as a percentage of revenue
− Strongest top line growth in Infrastructure
− Middle East revenue switch – exiting Qatar & Saudi and grow our JV in Dubai
• Recovered cashflow from operations £150-200m pa:
− Significant improvement through 2018-20: legacy contracts outflows fall away, Building advances unwind
* to adjust for disposals and legacy contracts
2018 rebased:
Revenue £3,537m: excluding revenues of £217m for legacy contracts and £204m for disposals which do not recur
Operating profit £92m: excluding £39m profit relating to disposals (including profit on PFI and development disposals) which does not recur
Key drivers for delivering the plan
• Deliver the £100m cost cutting programme on time and to plan
• Develop and maintain a strong pipeline of opportunities
• Complete legacy contracts as quickly and cost effectively as possible
• Put in place a rigorous and robust risk management framework to protect future margins
• Cultural transformation, balancing the focus on delivery with a harder commercial edge
Note 2018 BP figures stated post disposals of Bouchier, Rokstad, Healthcare, Ireland FM, Utilities by 30 June 2018, revenue and operating profit for 2018 included 6 months results of these businesses
8
Group Business Plan Presentation
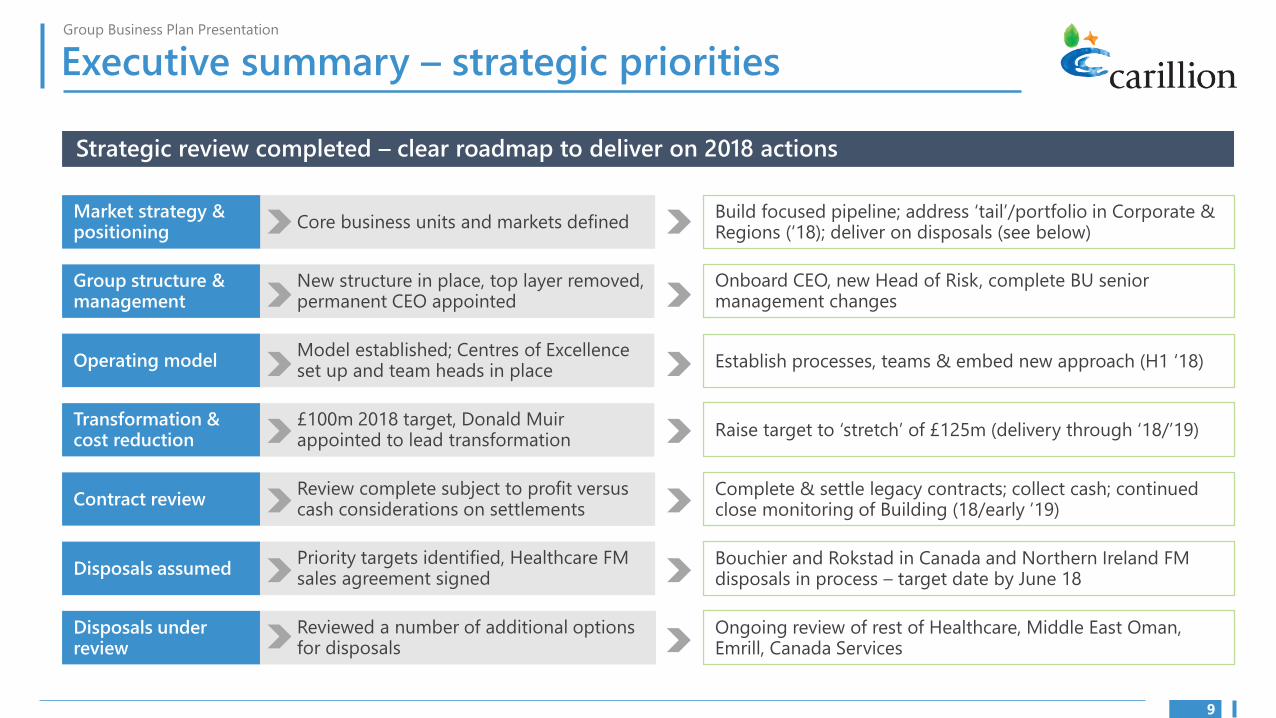
Executive summary – strategic priorities
Strategic review completed – clear roadmap to deliver on 2018 actions
Market strategy & positioning
Group structure & management
Operating model
Transformation & cost reduction
Contract review
Disposals assumed
Disposals under review
Core business units and markets defined
New structure in place, top layer removed, permanent CEO appointed
Model established; Centres of Excellence set up and team heads in place
£100m 2018 target, Donald Muir appointed to lead transformation
Review complete subject to profit versus cash considerations on settlements
Priority targets identified, Healthcare FM sales agreement signed
Build focused pipeline; address ‘tail’/portfolio in Corporate & Regions (‘18); deliver on disposals (see below)
Onboard CEO, new Head of Risk, complete BU senior management changes
Establish processes, teams & embed new approach (H1 ‘18)
Raise target to ‘stretch’ of £125m (delivery through ‘18/’19)
Complete & settle legacy contracts; collect cash; continued close monitoring of Building (18/early ’19)
Bouchier and Rokstad in Canada and Northern Ireland FM disposals in process – target date by June 18
Reviewed a number of additional options for disposals
Ongoing review of rest of Healthcare, Middle East Oman, Emrill, Canada Services
9

Group Business Plan Presentation
Executive summary – financial position
Current financial position
• The Group has written c£1.1bn off its balance sheet and seen net debt increase by c£850m in 2017 due to a significant number of material legacy contracts, delays in settlements and PFI transactions
• The Group is now materially over-leveraged and is unable to generate sufficient EBITDA going forward to fund the completion of legacy contracts and future financing, debt and pension obligations
As a result, the Group needs to financially restructure its balance sheet and raise new finance to create a stable platform for future growth
Group’s cash generation capabilities
Operating profit
EBITDA total
EBITDA excluding joint ventures
Other non-cash items
Working capital (outflow)/inflow
of which underlying working capital
of which non-recurring
JV dividends
Cash flow from operations
£m
RF4
2017
BUSINESS PLAN 2018-22
2018 2019 2020 2021 2022
155
187
154
4
(834)
(178)
(656)
21
(655)
131
158
119
(16)
(152)
28
(180)
17
(32)
150
178
137
7
(82)
29
(111)
21
83
174
202
168
5
(43)
(53)
10
23
153
179
207
171
5
6
10
(4)
13
195
185
213
176
5
(16)
(16)
-
21
186
2020 onwards: normalised cash generation
Legacy items drop out, cash conversion now >90%
2017 & 2018: significant working capital outflows
Heavily impacted by working capital outflows relating to legacy contracts. In 2017 outflows of £390m relate to top 20 provisioned contracts, £165m working capital unwind. Additional outflow from reduced volumes in Building and timing of claims in Canada.
2019: transition year
Profitability recovering, but outflows on legacy contracts remain albeit at a reduced level of c£111m*
* Underlying working capital includes advance payment unwind in Building (inc. Aspire)
10

I
Section 3 Strategy
11

Group Business Plan Presentation
Strategic priorities
Market strategy & positioning
• Business activity refocused to be UK-centric, focusing on key market segments and exiting non-core businesses
• Business units operationally restructured to align to future strategic market focus
Group structure & management/operating model
• Board, group executive and senior management team have been strengthened
• New organisation structure and operating model now in place
• Much greater focus and visibility on contract performance and risk – operational and commercial capability to be improved
Transformation & cost reduction
• New skills and capabilities are required – too much variability in quality of people management
• Addressing functional capability is critical – Finance, IT and Supply Chain; Finance transformation is a priority
• New incentive schemes designed to motivate people in the right way and drive accountability
• Embedding cultural change will take time but changes are already being made
Contract and asset review
• Contract review complete, culminating in a £1.1bn write off – robust commercial and financial risk management processes now in place. Focus on exiting / completing legacy contracts as cost effectively as possible
• Contract risk remains as legacy contracts complete and claims are settled during 2018/19. Cash versus profit trade offs may result in provision increases
• Review of fixed assets and goodwill ongoing – impairment will not impact EBITDA or cash
Disposals
• Key short term disposals identified and plans in place to implement during H1 2018, other potential disposals under review and will be concluded through restructure
12
Group Business Plan Presentation
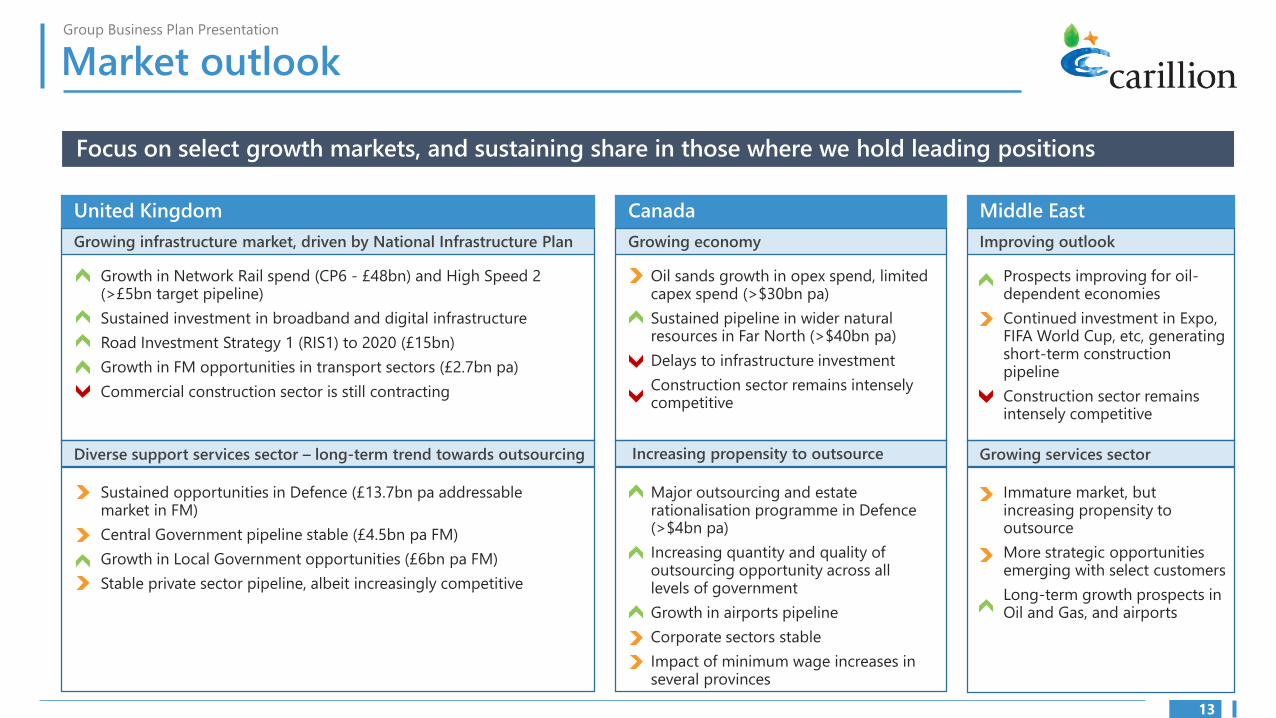
Market outlook
Focus on select growth markets, and sustaining share in those where we hold leading positions
United Kingdom Canada Middle East
Growing infrastructure market, driven by National Infrastructure Plan Growing economy Improving outlook
Growth in Network Rail spend (CP6 - £48bn) and High Speed 2 (>£5bn target pipeline)
Sustained investment in broadband and digital infrastructure
Road Investment Strategy 1 (RIS1) to 2020 (£15bn)
Growth in FM opportunities in transport sectors (£2.7bn pa)
Commercial construction sector is still contracting
Oil sands growth in opex spend, limited capex spend (>$30bn pa)
Sustained pipeline in wider natural resources in Far North (>$40bn pa)
Delays to infrastructure investment
Construction sector remains intensely competitive
Prospects improving for oil-dependent economies
Continued investment in Expo, FIFA World Cup, etc, generating short-term construction pipeline
Construction sector remains intensely competitive
Diverse support services sector – long-term trend towards outsourcing Increasing propensity to outsource Growing services sector
Sustained opportunities in Defence (£13.7bn pa addressable market in FM)
Central Government pipeline stable (£4.5bn pa FM)
Growth in Local Government opportunities (£6bn pa FM)
Stable private sector pipeline, albeit increasingly competitive
Major outsourcing and estate rationalisation programme in Defence (>$4bn pa)
Increasing quantity and quality of outsourcing opportunity across all levels of government
Growth in airports pipeline
Corporate sectors stable
Impact of minimum wage increases in several provinces
Immature market, but increasing propensity to outsource
More strategic opportunities emerging with select customers
Long-term growth prospects in Oil and Gas, and airports
13

Group Business Plan Presentation
Market strategy and positioning
Playing to our strengths – market facing priorities refocused around customers, contracts and geographies
End Customer
Geography
Portfolio size
Construction
FM
Integrated ‘Lifetime Services’
Hard and
Soft FM
Soft FM
Local Govt
Infrastructure
operator
Central Govt
Small / local Corporates, “one-off” customers
National /
Multinational
Corporates
Repeat and
negotiated work
Open book
partnering
Price-driven
procurement
Lump sum
Hard FM
2
1
3
5 4
6
Non-core
Current state
Future focus
1. Right clients: focus on repeat business and synergies/cross selling opportunities between construction and services
2. Do fewer things better – reduce distractions, certainty of delivery
3. Focus on where we can positively differentiate on core capabilities – hard and integrated FM
4. Exit non-core businesses
5. Right terms – only low risk procurement routes in construction
6. Right people – address capability/skills gap; leverage strength of our capabilities; focus on geographies where these are available
services
14

Group Business Plan Presentation
Strategy – playing to our strengths
Strong brand with market leading positions
• Top 2 supplier to Network Rail
• Market leader in smart motorways
• 1 of 3 suppliers on all 3 lots of the Crown Commercial Service framework
• Market leading position in maintaining and extending the UK’s telephone and data networks
Customer relationships
• High levels of repeat business – 89% of new & probable orders in support services with existing customers, 70% in construction*
Visibility
• Order book, pipeline and frameworks underpin the outlook
Our people
• Driven to deliver, known for our work ethic and customer focus
• Experience and knowledge embedded in the business
Health & Safety – Target Zero
• Targeting sector leadership – 57% accident reduction 2011-16
Sustainability
• Queen’s Award (2017) for our contribution to sustainable development and sector leadership
* 2016 order intake
TOTAL ORDER BOOK & PROBABLE ORDERS £12.9bn
£0.1bn £4.4bn OTHER/ CENTRAL GOVERNMENT
£12.9bn
Revenue PRIVATE FINANCE
Visibility £0.5bn
MENA
£0.4bn
AFC £3.8bn
CORPORATE & £2.0bn REGIONS CANADA
‘18 75%
‘19 48%
£1.0bn £0.8bn BUILDING INFRASTRUCTURE
PIPELINE £28.8bn
£m
35.2
Pipeline remains strong despite removal of opportunities worth c£10bn that were not considered to align with our new selectivity criteria
28.8
41.6 41.1 39.2 37.5
2012 2013 2014 2015 2016 2017
ON FRAMEWORKS WORTH
at least £21.5bn (conservative assumption)
• £2.6bn already delivered under these, £1.1bn in the order book
• Pipeline includes framework opportunities of only £4.5bn
15

Group Business Plan Presentation
Strategy – playing to our strengths
Our people are our greatest asset
Our people
• We employ 45,000 people worldwide, of which 19,500 are in the UK but they have not been consistently well led
• We create a welcoming and inclusive environment that allows us to attract, develop and retain excellent people to support the long term growth and success of our business. We continue to invest in talent:
− Leadership development & graduate programme – 150 graduates in live two-year programmes
− 33,500 individual learning interventions (including e-learning) in 2017 – e-learning 70% of learning using 5% of budget
− Flexible and agile working to attract and retain talent
• Underpinned by consistently high standards of ethics and integrity and our Values, more empowerment and autonomy to do the right thing coupled with culture change and a ‘right first time approach’ will transform our ability to deliver
Impact of Group financial challenges
• Despite challenging circumstances, senior leaders are fully engaged – especially those with clarity around their roles
• Retention arrangements in place for ‘must not lose’ individuals and those with scarce/highly transferrable skills in technical areas
• Leaders keeping close to their teams, loyalty remains strong – but uncertainty is a distraction, especially in non-core businesses
• Incentivisation – two new simplified schemes for senior leaders for 2018 designed to support delivery of the business plan
− Annual bonus – PBT, cash conversion, work winning and personal objectives (max 10% of individual opportunity)
− LTIP – measured against EPS, relative TSR vs peers and ROCE (equally weighted)
16

Group Business Plan Presentation
Strategy – playing to our strengths
Strong customer feedback
CEK have successfully
passed gateway 1…HS2
recognise and commend
the extent of engagement
and activity at this early
stage which bodes well
for the relationship
Carillion is a major supplier
...delivery performance is
strong and the relationship is
open, honest and constructive …We see
Carillion as a key part of our supply chain
going forward.
Commercial Director Network Rail
“
“ Commercial Director HS2
“
“
“ “The King’s Cross Central Limited Partnership has had a long and
successful working relationship with
Carillion…we can confirm we have
every intention of continuing this
relationship and have several
projects in the pipeline at King’s
Cross that we will actively engage
Carillion on in the
New Year
“ Carillion demonstrate time
and again a willingness to
review how they are doing
things, their cost profile and
their service quality. They’ve
set a very high standard for
other suppliers to follow.
“
“
…highly collaborative development of the
FM model to support the new Northern rail
franchise and its very successful mobilisation… In particular,
their design and deployment of the integrated FM Helpdesk
model, and their CAFM design ownership for the entire end
to end service, was the foundation upon which Carillion’s
service was built, and we’re delighted with the success and
performance of the service since launch.
“
“
Head of FM Arriva Northern
“Carillion is a major supplier
to the government with a
number of long term contracts…
We remain supportive of their ongoing
discussions with their stakeholders…
“
17

Group Business Plan Presentation
Strategy – root cause and solution
New approach to managing contracts throughout the lifecycle
Key themes and issues Contracts taken on with
high degree of uncertainty
around key assumptions
Actions
Increasing size and complexity of services
contracts, compounded by growth, not
matched by our capability
Risk transfer
Portfolio not balanced in terms of cash generation
Claims not managed or pursued in a timely and effective manner
New Head of Risk
• External appointment to be made Q1 2018
Increasingly stringent selectivity
• Revised criteria, with >£10bn removed from pipeline
Review quality of order book Success on construction
contracts dependent on
performance of others
not under our control
No focus on contract
demobilisations, leading
to cost overruns
Insufficient understanding of,
and adherence to, contract
requirements
74% 16% 10%
Amber risks: Red risks:
• Over 80% relates to • 50% AFC & MENA construction planned disposals • c25% relates to planned exits/disposals
• Remainder is contracts provisioned against
• Almost 50% relates to 2017/18 revenues
Centres of Excellence (appointed 4 new leaders)
• Work Winning – more rigorous approvals process; enforcement of new criteria; consistent group-wide bid process.
• Mobilisation / Demobilisation – central team to adopt consistent approach, review at bid stage, drive early demobilisation planning
• Operational excellence – standard operating procedures, tools and training, consistent approach to work planning and monitoring
• Contract management – rigorous focus on adherence to contract terms; senior contract management team to oversee performance, with specific responsibility around claims and risk
Ineffective change control – e.g.
design changes on construction
contracts agreed without
agreeing incremental costs
Poor planning and lack of effective contract
controls and monitoring leading to inconsistent
operational performance management
Lack of effective handover from bid to mobilisation to delivery, leading to lack of knowledge transfer
Lack of ownership of issues Geographic risk
18

Group Business Plan Presentation
Strategy – our selectivity criteria
New approach means we are bidding for better work
July Progress ACTIONS REPORT
• c15% of construction revenue in 2017 and expected to fall to zero by mid-2019
Exit of PPP construction
Exit construction in Egypt, Saudi Arabia & Qatar • L2 ‘live’ projects, expected completion by mid-2018
Construction – low risk procurement routes only • Pipeline cleansed - >£10bn removed, focus on low risk procurement routes; − Two Stage – Design & Build − Cost reimbursable
− Frameworks − Early Contractor Involvement – Target Cost
Bid/ no bid – examples of bids we have accepted or rejected under new selectivity criteria
Infrastructure Central Government Corporate & Regions Building International
HS2 two stage design & build, target cost
National Grid availability of delivery capability, not ‘core’
FDIS* – MoD target growth market, key client
BEIS** risk, culture fit with client, resource priorities (Hestia)
Abellio cross selling, target growth market
Lancashire CC cash profile, not ‘core’
Broad St/Moda Living key customer /repeat business
Univ. of Birmingham PPP construction
Oman hospitals two stage design & build, UK Export Finance
Cadillac Fairview cash profile
* FDIS: Future Defence Infrastructure Services **Department for Business, Energy & Industrial Strategy
19

Group Business Plan Presentation
Strategy – our new business segments
INFRASTRUCTURE
£976m 4.0 – 5.0% 2022 REVENUE MID-TERM MARGIN TARGET
WHAT WE DO
• A leading UK ‘Transport and Infrastructure’ contractor for new build and maintenance
• Top 2 supplier to Network Rail; top 3 supplier to Highways England for major projects; 1 of 4 JVs on HS2 Phase 1 construction
A business plan for growth, capitalising on leading market positions and the largest planned infrastructure investment in the UK across all transport areas since Victorian times
CORPORATE & REGIONS
£655m 6.5 – 7.5% 2022 REVENUE MID-TERM MARGIN TARGET
WHAT WE DO
• Support services for corporate customers and regional public authorities
• Carilliontelent (JV) a market leader; niche positions in fragmented markets elsewhere
Growth at Carilliontelent to drive positive mix shift, and good opportunities in transport. Focus on addressing the ‘tail’, core cities and cost cutting to drive margin improvement
GROUP
• Health & Safety
• Sustainability
• Technology
• Quality & Excellence
• Low cost shared services
BUILDING
£728m 1.5 – 2.5% 2022 REVENUE MID-TERM MARGIN TARGET
WHAT WE DO
• Construction for public and private sector customers
• Niche positions in fragmented markets
De-risked, more selective business pursuing projects under low risk procurement routes only. Focus on repeat business, sectors where we have proven track record and projects offering synergies with services
CENTRAL GOVERNMENT
£756m 4.5 – 5.5% 2022 REVENUE MID-TERM MARGIN TARGET
WHAT WE DO
• Support services for the MoD and other central government departments under the CCS framework
• One of only 3 companies appointed to all 3 lots of the CCS framework
A strategy to maintain existing MoD contracts while also diversifying to improve profitability; and to grow facilities management provision to central government departments through the CCS framework, replacing older contracts with higher margin wins
INTERNATIONAL
2022 REVENUE
£962m MID-TERM
CANADA: 4.5 – 5.5%
MARGIN TARGETS
AFC: 4.5 – 5.5%
MENA: 2.0 – 3.0%
WHAT WE DO
• Our construction and services businesses in Canada, the UAE (AFC) and MENA
Canada: a growth market with significant opportunity given positive macro outlook and relative immaturity of outsourcing
AFC: reducing reliance on Dubai/diversifying within the UAE
MENA: rebalancing to JVs (Alawi and Emrill) while exiting legacy projects; growing services and ensuring selectivity underpins everything we do
20

Group Business Plan Presentation
Strategy – positive mix shift
Positive mix shift towards segments with lower risk profile and good visibility
2017 revenue
8%
CANADA*
11%
AFC & MENA
By 2022:
Infrastructure, Central Government and Corporate & Regions ex disposals will have increased their share of Group revenue from 44% to 56%
2022 revenue
5%
CENTRAL GOVERNMENT OTHER
10%
CANADA 13%
CORPORATE & 12% REGIONS*
AFC & MENA
17% 17% INFRASTRUCTURE BUILDING
£4,739m
14%
20%
17%
OTHER & DISPOSALS
REVENUE
BUILDING
22%
OTHER & DISPOSALS
4%
CANADA*
7%
AFC & MENA
11%
£155m
OPERATING PROFIT
BUILDING
18%
CENTRAL GOVERNMENT
15%
CORPORATE & REGIONS
23%
INFRASTRUCTURE
£3,951m
REVENUE
2017 operating profit
By 2022:
Infrastructure, Central Government and Corporate & Regions ex disposals will have increased their share of underlying Group operating profit from 56% to 69%
2022 operating profit 1%21%
OTHER CENTRAL GOVERNMENT 12%
CANADA
12%
AFC & MENA
13% 6%CORPORATE &
BUILDING REGIONS*
22% 24% INFRASTRUCTURE INFRASTRUCTURE
21%
CENTRAL GOVERNMENT
24%
CORPORATE & REGIONS
£185m
OPERATING PROFIT
* Corporate & Regions and Canada figures exclude 5 core disposals
21

I
Section 4 Group Structure & Management
22
Group Business Plan Presentation
Overview of changes
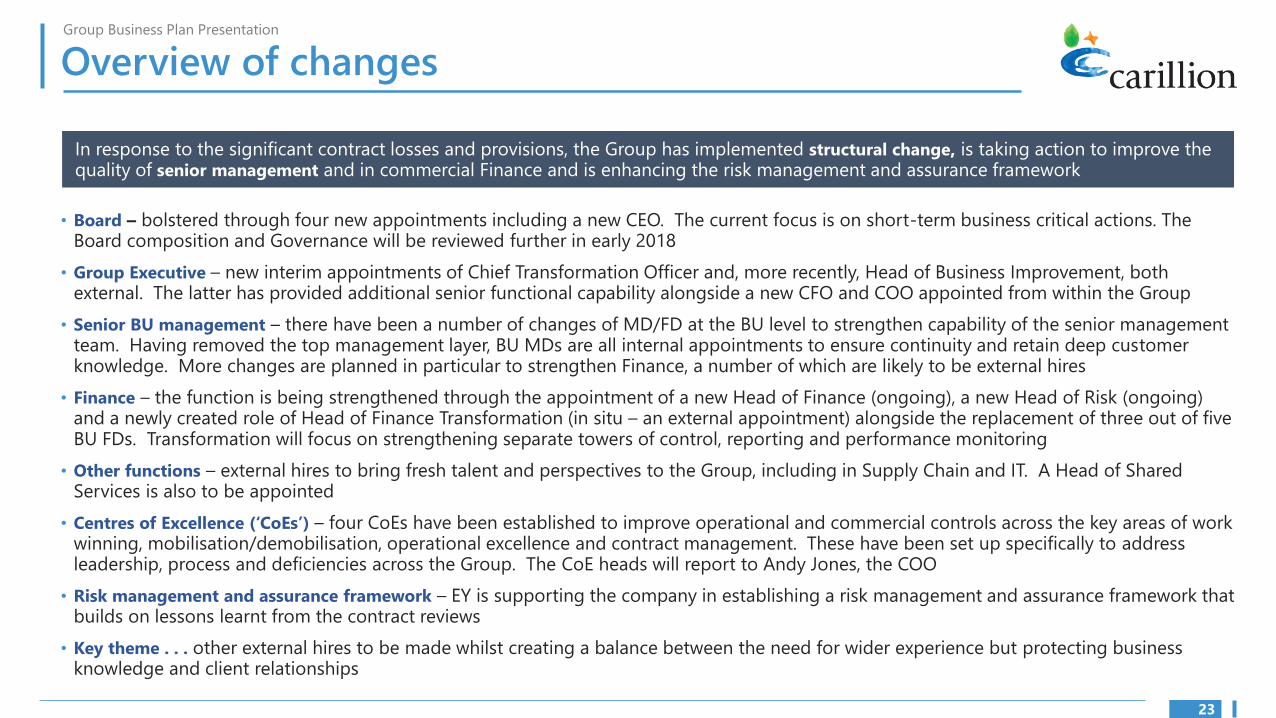
In response to the significant contract losses and provisions, the Group has implemented structural change, is taking action to improve the quality of senior management and in commercial Finance and is enhancing the risk management and assurance framework
• Board – bolstered through four new appointments including a new CEO. The current focus is on short-term business critical actions. The Board composition and Governance will be reviewed further in early 2018
• Group Executive – new interim appointments of Chief Transformation Officer and, more recently, Head of Business Improvement, both external. The latter has provided additional senior functional capability alongside a new CFO and COO appointed from within the Group
• Senior BU management – there have been a number of changes of MD/FD at the BU level to strengthen capability of the senior management team. Having removed the top management layer, BU MDs are all internal appointments to ensure continuity and retain deep customer knowledge. More changes are planned in particular to strengthen Finance, a number of which are likely to be external hires
• Finance – the function is being strengthened through the appointment of a new Head of Finance (ongoing), a new Head of Risk (ongoing) and a newly created role of Head of Finance Transformation (in situ – an external appointment) alongside the replacement of three out of five BU FDs. Transformation will focus on strengthening separate towers of control, reporting and performance monitoring
• Other functions – external hires to bring fresh talent and perspectives to the Group, including in Supply Chain and IT. A Head of Shared Services is also to be appointed
• Centres of Excellence (‘CoEs’) – four CoEs have been established to improve operational and commercial controls across the key areas of work winning, mobilisation/demobilisation, operational excellence and contract management. These have been set up specifically to address leadership, process and deficiencies across the Group. The CoE heads will report to Andy Jones, the COO
• Risk management and assurance framework – EY is supporting the company in establishing a risk management and assurance framework that builds on lessons learnt from the contract reviews
• Key theme . . . other external hires to be made whilst creating a balance between the need for wider experience but protecting business knowledge and client relationships
23

Group Business Plan Presentation
Board and management structure
Board refreshed – 4 new appointments including new CEO, Andrew Davies, from 22 January
Chairman
Philip Green
SID
Sally Morgan
Interim CEO
Keith Cochrane*
Audit Chair
Andrew Dougal*
Audit Chair designate
Justin Read
NED
Alan Lovell
NED
Alison Horner
GROUP EXECUTIVE
Shared services and Group Functions Finance, HR, ICT, IMS, Legal, Communications
Centres of Excellence:
• Work Winning
• Mobilisation/Demobilisation
• Operational Excellence
• Contract management
Key points to note
• Smaller, more effective Group Executive strengthened through new appointments
• MDs no longer sit on Group Executive but continue to report to CEO
• Centres of Excellence (‘CoEs’): critical part of new operating model; CoE heads report to COO and rank equally with MDs
COO CFO CHRO Legal & Co Sec
CTO**
CEO
Head of Bus. Improvement**
MD, Infrastructure (Mark Davies)
MD, Central Government (Richard Lumby)
MD, Corporate & Regions (Daniel Easthope)
MD, Building (Khalid Nawaz)
MD, International (Simon Buttery)
** CTO and Head of Business
Improvement are temporary roles
* Keith Cochrane and Andrew Dougal to
step down during 2018
24
I
Section 5 Transformation & Cost reduction
25
Group Business Plan Presentation
Transformation PMO
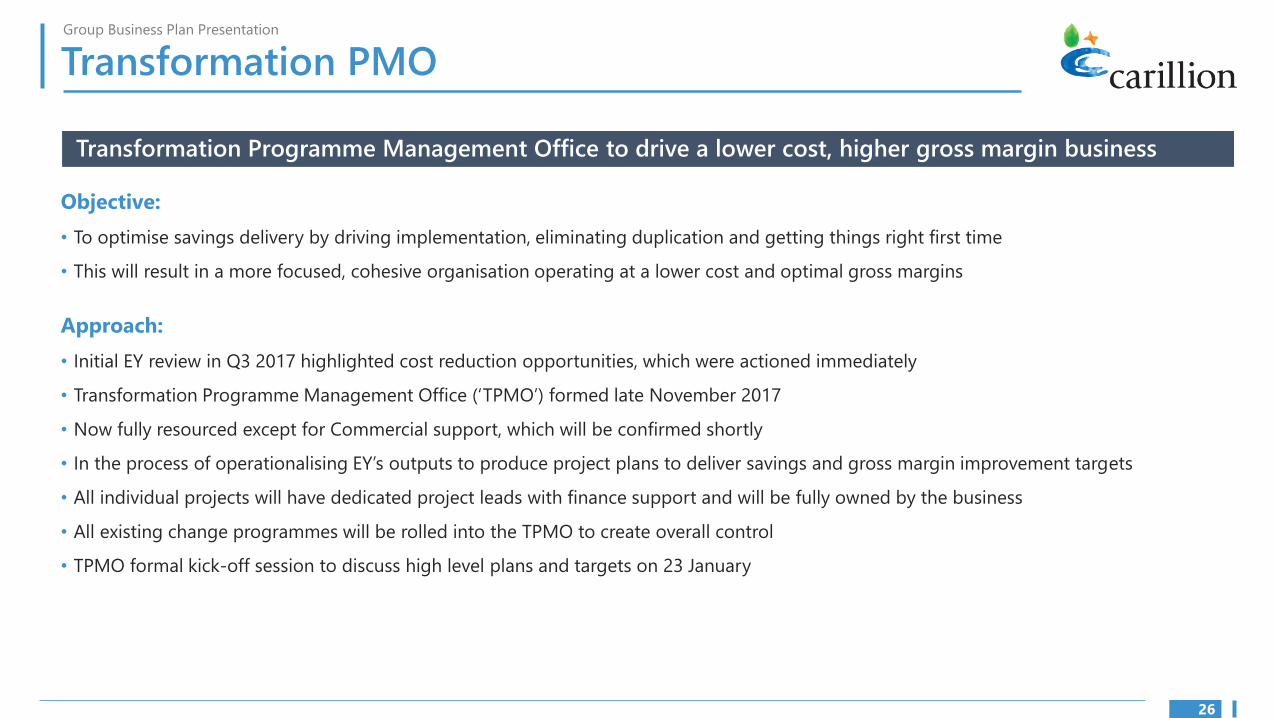
Transformation Programme Management Office to drive a lower cost, higher gross margin business
Objective:
• To optimise savings delivery by driving implementation, eliminating duplication and getting things right first time
• This will result in a more focused, cohesive organisation operating at a lower cost and optimal gross margins
Approach:
• Initial EY review in Q3 2017 highlighted cost reduction opportunities, which were actioned immediately
• Transformation Programme Management Office (‘TPMO’) formed late November 2017
• Now fully resourced except for Commercial support, which will be confirmed shortly
• In the process of operationalising EY’s outputs to produce project plans to deliver savings and gross margin improvement targets
• All individual projects will have dedicated project leads with finance support and will be fully owned by the business
• All existing change programmes will be rolled into the TPMO to create overall control
• TPMO formal kick-off session to discuss high level plans and targets on 23 January
26

Group Business Plan Presentation
Transformation programme structure
SEGMENTS CORPORATE FUNCTIONS
Supply Chain , Finance, HR, Communications, ICT, Legal
Infra-structure
Building Central Gov
Corp & Regions
A B C D E
Drive COEs and performance improvement
Cross organisational
change
3
4
5
6
7
8
9
10
11
Management restructuring & office services
Centres of Excellence:
- Work winning
- Mobilisation & demobilisation
- Operational excellence
- Contract management
1
2
Procurement consolidation & control/category
Property
IT optimisation and efficiency, including Data
Financial planning, budgeting and reporting
Process
Governance
Organisation and workforce planning
Transactional shared services
Terms and conditions
*Function plans must interface with segment plans
27
Investing in technology as a functional enabler

Group Business Plan Presentation
Cost savings – progress and cost benefit
£54m spend to deliver £100m of cost savings
2017 £10m CAPTURED IN YEAR
£27m EXIT RATE
2018 £77m CAPTURED IN YEAR
£100m TARGET EXIT RATE
£125m ‘STRETCH’ TARGET EXIT RATE
£54m restructuring cost* COST TO ACHIEVE
£22m 2017
£32m 2018
COST SAVINGS PLAN
£100m (derives from overhead & gross margin)
2018 EXIT RATE
PEOPLE COSTS
BUSINESS OVERHEAD REDUCTION
FUNCTIONAL OVERHEADS
SERVICE CONTRACT EFFICIENCY
THIRD PARTY SPEND
ADDITIONAL CHALLENGE
20%
7%
13%
20%
20%
20%
12 6 8 12 14
2
Cost savings breakdown
Costs to achieve £54m
£m
2018 TARGETS
£77m CAPTURED IN YEAR IN 2018
27£m 35 15
SECURED WIP TBO
£100m 2018 EXIT RATE
27£m 35 38
SECURED WIP TBO
28

I
Section 6 Group P&L forecasts
29

Group Business Plan Presentation
Summary financials
£m
Total revenue
Revenue growth
Operating profit
Operating margin
Group EBITDA
EBITDA excluding joint ventures
Group EBITDA post-IFRS 15
RF4
2017
4,739
-9%
155
3.3%
187
154
187
Rebased*
2018
3,537
-25%
92
2.6%
139
100
152
2018
3,958
-16%
131
3.3%
158
119
169
2019
3,808
-4%
150
3.9%
178
137
201
2020
3,842
1%
174
4.5%
202
168
223
2021
3,990
4%
179
4.5%
207
172
213
BUSINESS PLAN 2022
3,951
-1%
185
4.7%
213
176
219
*2018 rebased:
Revenue £3,537m: excluding revenues of £217m for legacy contracts and £204m for disposals which do not recur
Operating profit £92m: excluding £39m profit relating to disposals (including profit on PFI and development disposals) which does not recur
* Business plan prepared on a ‘business as usual’ basis regarding bank financing, bonding, EPF and leasing facilities; business plan also assumes that the disposals of UK
Healthcare (ie activities subject to transaction with Serco already announced), Rokstad, Bouchier, Northern Ireland and Utilities complete by 30/6/18
• Underlying revenue growth >£400m 2018-22 adjusting for non-recurring items
• Driven by growth in Infrastructure, Carilliontelent, Canada services
Revenue
Underlying growth masked by disposals and one-offs
• Adjusting 2018 for non-recurring items, operating profit doubles
• Key drivers: Infrastructure (growth); Central Government (higher margin wins); £100m cost savings by end 2018
Operating profit
Cost savings, mix shift and underlying growth drive recovery
• Mix a driver – smaller Building business; Infrastructure and Canada services growth
• Margin benefits from smaller overhead
Margin expansion
A higher margin, higher quality business
30
Group Business Plan Presentation
Key drivers for the business plan
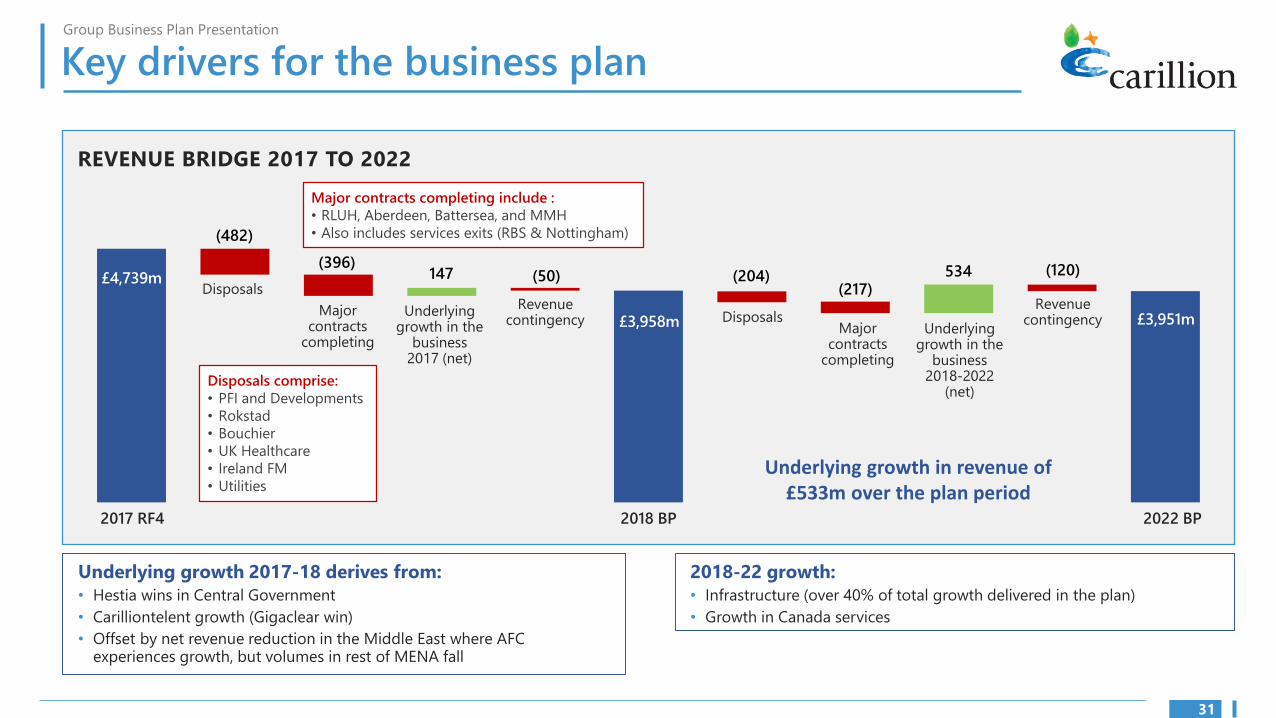
REVENUE BRIDGE 2017 TO 2022
(482)
Major contracts completing include :
• RLUH, Aberdeen, Battersea, and MMH
• Also includes services exits (RBS & Nottingham)
£4,739m (396)
534 (120) 147 (50) (204) Disposals
£3,958m
(217) Revenue Revenue Major Underlying Disposals contingency contingency contracts growth in the Major Underlying
completing business contracts growth in the 2017 (net) completing business
2018-2022Disposals comprise: (net)• PFI and Developments
• Rokstad
• Bouchier
• UK Healthcare
• Ireland FM Underlying growth in revenue of • Utilities £533m over the plan period
£3,951m
2017 RF4 2018 BP 2022 BP
Underlying growth 2017-18 derives from:
• Hestia wins in Central Government
• Carilliontelent growth (Gigaclear win)
• Offset by net revenue reduction in the Middle East where AFC experiences growth, but volumes in rest of MENA fall
2018-22 growth:
• Infrastructure (over 40% of total growth delivered in the plan)
• Growth in Canada services
31

Group Business Plan Presentation
Key drivers for the business plan
2022 BP
£97m
£185m
23
72
(25)
Cost reduction
2018
(17)
£131m
1715
67
(39)
2017 rebased
Contingency £(11)m
Bonus £(14)m
New work
Group cost (1-off)
Cost reduction
Disposals £(15)m & PFI
Developments £(24)m
Group cost
reversal
Contingency £(9)m
Bonus £(10)m
Work winning
& margin improvement
(6)
(19) 2017 RF4: £155m Gap to £97m: £32m non-recurring items, £20m contingency release, £6m exits and disposals
Other
OPERATING PROFIT BRIDGE 2017 TO 2022
2017 rebased to strip out one-offs:
2017 benefits from one-offs which distort the comparative:
• Non-recurring items £32m (sales & leaseback, tax credit, one-off rebates, insurance claims)
• Contingency release £20m
• Exits and disposals £6m
2018-22 growth:
Work winning drives an additional £35m of margin with additional contribution driven by:
• Growth in margins in Central Government - efficiencies in Hestia, replacement of housing and winning £100m pa on CCS contracts
• Improvement in margins in MENA
32

I
Section 7 Group cash flow
33
Group Business Plan Presentation
Operating cash flow 2017-2022
£m RF4
2017
122
32
0
4
(834)
21
(655)
(463%)
2018 2019 2020 2021 2022
BUSINESS PLAN
Underlying group operating profit
Depreciation
Profit on sale of PPP equity investments
Pension service & share option cost
Working capital
Joint venture dividends
Underlying cash flow from operations
Cash conversion
92
27
(21)
5
(152)
17
(32)
(26%)
109
28
2
5
(82)
21
83
58%
140
28
0
5
(43)
23
153
90%
144
28
0
5
6
13
195
111%
148
28
0
5
(16)
21
186
103%
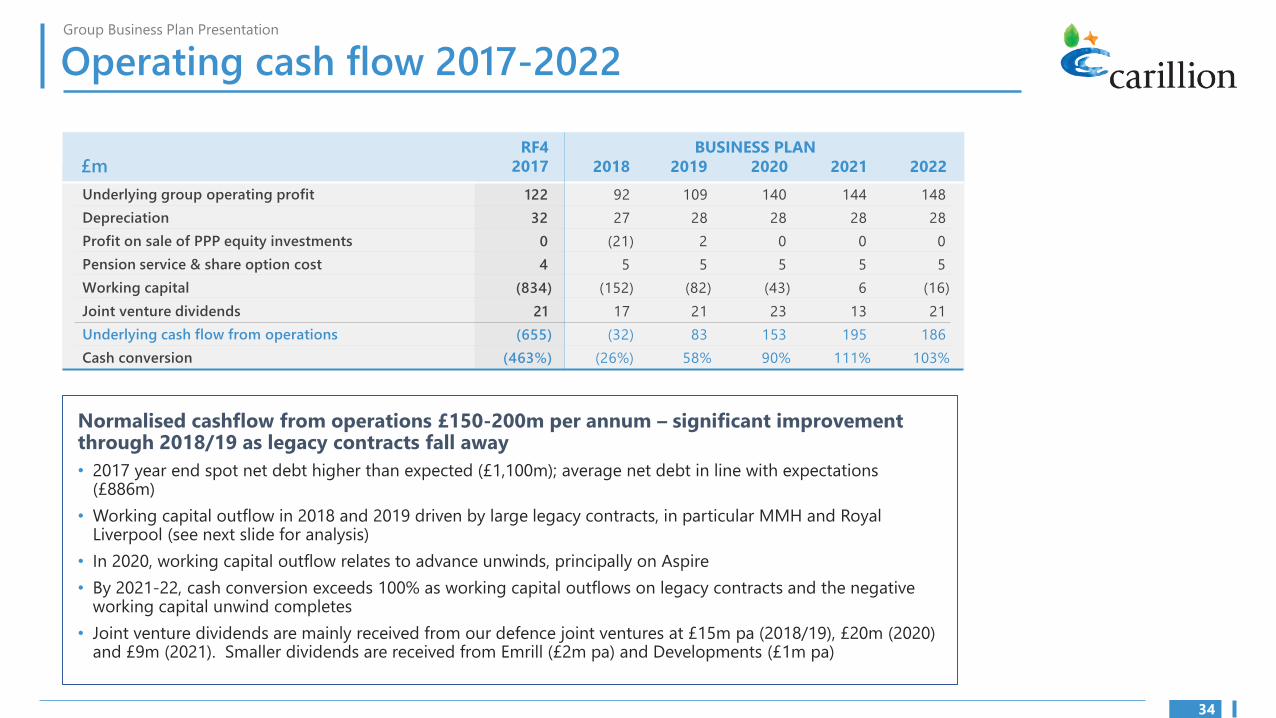
Normalised cashflow from operations £150-200m per annum – significant improvement through 2018/19 as legacy contracts fall away
• 2017 year end spot net debt higher than expected (£1,100m); average net debt in line with expectations (£886m)
• Working capital outflow in 2018 and 2019 driven by large legacy contracts, in particular MMH and Royal Liverpool (see next slide for analysis)
• In 2020, working capital outflow relates to advance unwinds, principally on Aspire
• By 2021-22, cash conversion exceeds 100% as working capital outflows on legacy contracts and the negative working capital unwind completes
• Joint venture dividends are mainly received from our defence joint ventures at £15m pa (2018/19), £20m (2020) and £9m (2021). Smaller dividends are received from Emrill (£2m pa) and Developments (£1m pa)
34

Group Business Plan Presentation
Contract provisions – cash impact
There is some risk attached to the 9 major contracts
Royal Liverpool: £24m net outflow; claims £43m (87% complete)
Key risks:
• Project completion date including commissioning
• Recovery of claims from 3rd parties (£34m)
Aberdeen: £26m net outflow; claims £40m (79% complete)
Key risks:
• Project completion date (May/June)
• Liquidated damages & lane occupation changes
• Recovery of Claim Value from Transport Scotland (£25m) by June 18
• Recovery from designers & insurance £15m by Dec 18
£m Q4 2017
(57)
(67)
20
(2)
(3)
-
(5)
(2)
-
(116)
5
(111)
2020
Total net
cashflow Claims
NET CASHFLOWS
MMH
Msheireb
Royal Liverpool
Aberdeen
Battersea
PF2 Schools
Ontario Roads
Al Dara
TTC
Top 9 contracts
Other top 20 contracts
TOTAL
(2)
(50)
(67)
(79)
(125)
(43)
(3)
(13)
11
(371)
(6)
(377)
2018
(58)
-
(36)
2
(17)
(11)
(12)
(15)
(22)
(169)
(11)
(180)
2019
(6)
-
-
-
-
-
-
-
-
(6)
16
10
(119)
(67)
(24)
(26)
(29)
(23)
(22)
(21)
6
(325)
10
(315)
33
97
43
40
16
5
-
-
28
262
MEMO
2017
2
-
(8)
(26)
(9)
(12)
(5)
(4)
28
(34)
(34)
MMH: £119m net outflow; claims £33m (47% complete)
• Project completion date (June ‘19) • Recovery of Aecom claim (£10m) by June ‘18
PF2 Schools: £23m net outflow; claims £5m (93% complete)
• Complete in most respects bar landscaping, some external works
• £5m claim for change and variations under negotiation with Education & Skills Agency
Msheireb: £67m net outflow; claims £97m (96% complete)
• Project completion date (Q2 ‘18) • Recovery of outstanding value for preliminaries
• Agreement to & payment of extension of time claims (£97m)
• Client holds an on demand performance bond (c£54m)
Ontario Roads: £22m net outflow
• Loss is being minimised by hand back of contracts to government
• Demobilisation, cost reduction and timing of handover are risks & opportunities
Al Dara: £21m net outflow (87% complete)
• Project completion date is on target
• Client holds an on demand performance bond
• Quality of work and subcontractor performance remains a risk
Battersea & TTC – have been settled
• TTC settled at a lower amount but this is expected to be offset by lower supplier payments
35
Group Business Plan Presentation
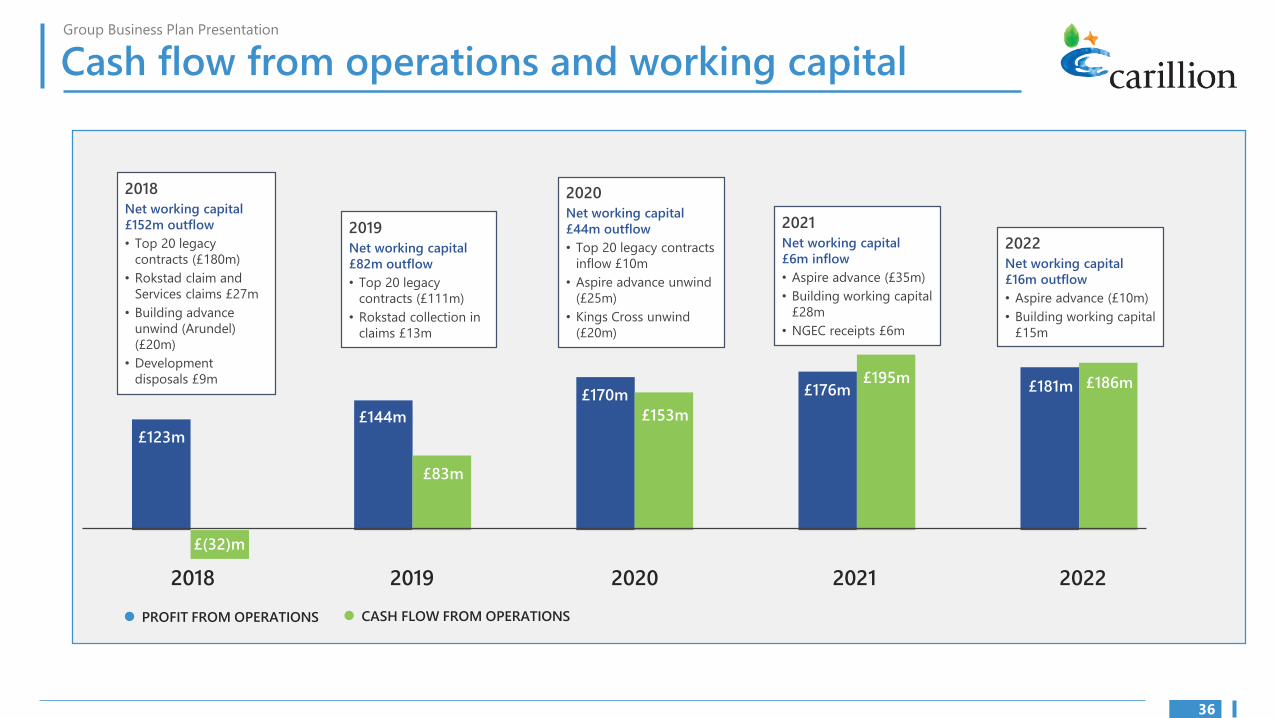
Cash flow from operations and working capital
£123m
2018 2019 2022
PROFIT FROM OPERATIONS CASH FLOW FROM OPERATIONS
2020 2021
£(32)m
£144m
£170m £176m £181m £195m £186m
£153m
£83m
2018
Net working capital
£152m outflow
• Top 20 legacy
contracts (£180m)
• Rokstad claim and
Services claims £27m
• Building advance
unwind (Arundel)
(£20m)
• Development
disposals £9m
2019
Net working capital
£82m outflow
• Top 20 legacy
contracts (£111m)
• Rokstad collection in
claims £13m
2020
Net working capital
£44m outflow
• Top 20 legacy contracts
inflow £10m
• Aspire advance unwind
(£25m)
• Kings Cross unwind
(£20m)
2021
Net working capital
£6m inflow
• Aspire advance (£35m)
• Building working capital
£28m
• NGEC receipts £6m
2022
Net working capital
£16m outflow
• Aspire advance (£10m)
• Building working capital
£15m
36

Group Business Plan Presentation
Non-operating cash flow 2017-2022
£m
Restructuring costs
Taxation
Net capex
Other including FX
Acquisitions & disposals
Dividends to shareholders & non-controlling interests
Total non-operating cash flow
Underlying cash flow from operations
Total cash flow
RF4
2017
(40)
(1)
(33)
(5)
4
(61)
(136)
(655)
(791)
2018
(84)
(8)
(27)
2
107
(1)
(11)
(32)
(43)
2019
(7)
(11)
(24)
-
7
(1)
(36)
83
47
2020
-
(10)
(26)
3
(9)
(1)
(43)
153
110
2021
-
(13)
(20)
-
-
(1)
(34)
195
161
2022
-
(16)
(10)
-
-
(1)
(27)
186
159
BUSINESS PLAN
Commentary
• Tax payments reflect increasing profits in the UK and a reduction in the amount of UK tax losses to offset against these
• Net capex spend mainly comprises ICT, Wipro spend and a significant capex project in services (‘Project Rio’) is under review but has been included at approx. £10m in 2019, 2020 and £7m in 2021. This is for integrated operating and CAFM system
• Acquisitions and disposals in 2017, 2018 and 2019 comprise
− PPP equity disposals of £84m in 2018 and £18m in 2019 partly offset by PPE investments of £42m in 2017
− Payments in relation to the Canadian services acquisitions - £10m in 2018 and £11m in 2019
− Strategic disposals with £76m proceeds in 2018
• Closing net debt (spot) at December 2017 is estimated at £1,101m
• Cash flow excludes all debt service costs, debt repayment and pension contributions over the course of the plan
37

Group Business Plan Presentation
Cash flow
The funding requirement peaks in September 2018 at c£360m, and in September 2019 at c£350m
Assumptions for funding requirement:
• Intra month peaking of c£100m
• Headroom of c£75m
• Sensitivities
• Disposal proceeds of c£76m excluded from funding requirement
EPF UTILISATION AS PER BUSINESS PLAN
£m
400
350
300 EPF
250 UK REVENUE
200
150
100
50
0
Other assumptions:
• EPF remains in place at a utilisation of c£320m during 2018
• Leasing facilities of c£2m per month available, including facility for 2017 assets
• Bonding facilities available in line with plan
• Dividend policy has not yet been determined
2017 2018 2019 2020 2021 2022
38

I
Section 8 Group balance sheet
39

Group Business Plan Presentation
Balance sheet 31 Dec 31 Dec 31 Dec 31 Dec 31 Dec 31 Dec
£m 2017 2018 2019 2020 2021 2022
Stock 44 42 41 42 43 43
Receivables 1,279 986 914 960 968 988
Payables 1,795 1,349 1,195 1,198 1,212 1,216
Net working capital (472) (321) (240) (196) (201) (185)
EPF UK included in payables 334 314 311 324 342 356
Normalised EPF creditors (45 days) (119) (112) (111) (116) (122) (127)
Advances (Aspire/Arundel) 90 70 70 45 10 -
Underlying working capital (167) (49) 30 57 29 43
% of revenue -3.5% -1.4% 0.8% 1.5% 0.7% 1.1%
Normalised working capital as legacy contract balances reduce:
• EPF remains in place at a utilisation of £320-350m
• Contract review completed, pressure on cash versus profit settlements
• Other asset review ongoing including review of fixed assets and goodwill – any impact will not affect EBITDA or cash
• Underlying working capital normalised from 2019 onwards, at c1% of revenue, following completion of legacy contracts.
Net liabilities at 31 December 2017 and 2018 of £500-600m will improve through the restructuring:
• A full balance sheet has not been presented as the restructuring proposal is still being analysed. Therefore, cashflows are presented as unlevered, with no pension contributions
• Restructuring will improve the net liabilities position, either through additional equity, debt for equity and any impact from reduced pensions liability
40

Group Business Plan Presentation
Contract review and provisions
Total contract provision increased in RF4 2017 from £1,045m to £1,105m
AS 30 SEPTEMBER 2017 NEW
£1,045m
£1,045m
£729m
£316m
200
845
Future Trade TOTAL costs receivables
£1,105m
£1,105m
£712m
£393m
SERVICES
CONSTRUCTION
215
890
Future Trade TOTAL costs receivables
INCREASE IN PROVISION
£60m
• More aggressive cash settlements (profit vs cash) (TTC, Battersea): £10m
• Further deteriorations on live projects and contingency for future risks including:
− Royal Liverpool £15m – delayed from December ’17 to April ‘18
− Aberdeen £15m – delayed from March to May ’18
− Canada contracts (Union, Bremner) £6m – additional legal costs
• Further re-evaluation of NOMS (National Offender Management Service – prisons services contract with MoJ) £11m
• Further scope for increase from cash versus profit settlements
41

I
Section 9 Disposals
42

Group Business Plan Presentation
Disposals timetable
Disposals in progress and assumed by 30 June 2018 Disposals under review
£m proceeds Timing 2018 2019 2020 2021 2022 Assumed EBITDA
• Remainder of UK Review of remaining contract Healthcare portfolio
Canada • Canada Services Ongoing review of offers
Rokstad 18 Q2 18 10 21 27 36 37 • MENA - Oman and Continued review of options for Bouchier 8 Q1 18 9 10 10 10 11
Emrill sale UK
• Canada Roads Sale process underway Salus 46 Q2 18 6 11 12 12 12
• Non Core area in Review of small contracts N. Ireland 13 Q1 18 1 3 3 4 5 Corporate & Regions
Utilities 1 Q1 18 - - - - -
Total disposals 86 26 45 52 62 65
Group EBITDA impact (including minority interest)
Group EBITDA – pre disposal 183 221 251 266 275
Adjust for disposal (26) (45) (52) (62) (65)
Contingency release 1 2 3 3 3
£m 2018 2019 2020 2021 2022
Group EBITDA – post disposal 158 178 202 207 213
43

I
Section 10 Business priorities
44

Group Business Plan Presentation
Business priorities
Top 10 priorities…
…for 2018
• Successfully restructure the debt of the Group
• Complete on the assumed disposals Rokstad, Bouchier, Healthcare, Ireland FM and Utilities
• Successfully adopt a more robust risk and governance framework ensure the centres of excellence support the business to achieve better outcomes in work winning, mobilisations, operational excellence and contract management
• Deliver successful mobilisations on Hestia (Central Government) and Gigaclear (Corporate and Regions), which drive significant revenue and growth in 2018
• Deliver cost savings of £100m by the end of 2018, targeting overhead reduction and contract margin improvement
• Achieve robust and sustainable profits which are built on underlying performance rather than one-offs
• Cash – collect on legacy claims and ensure underlying cash conversion of c100% within the BUs
• Implement an improved management incentive scheme which drives accountability and performance
…beyond 2018
• Deliver revenue growth in:
− Infrastructure of over £200m by 2022 from Rail, Roads and HS2 at gross margins of circa 8%
− Canada Services of over £110m by 2022 from defence, aviation, natural resources and healthcare at gross margins of circa 11%
• Revenue - key contract replacements and renewals in:
− Building - replacing Aspire Defence with a similar size (c.£100m per annum) project at a reduced margin of 5%
− Central Government - replacing NGEC with a similar size (c.£350m per annum) project at improved margins of 6%
45

I
Section 11 Business unit summaries
46
-
–
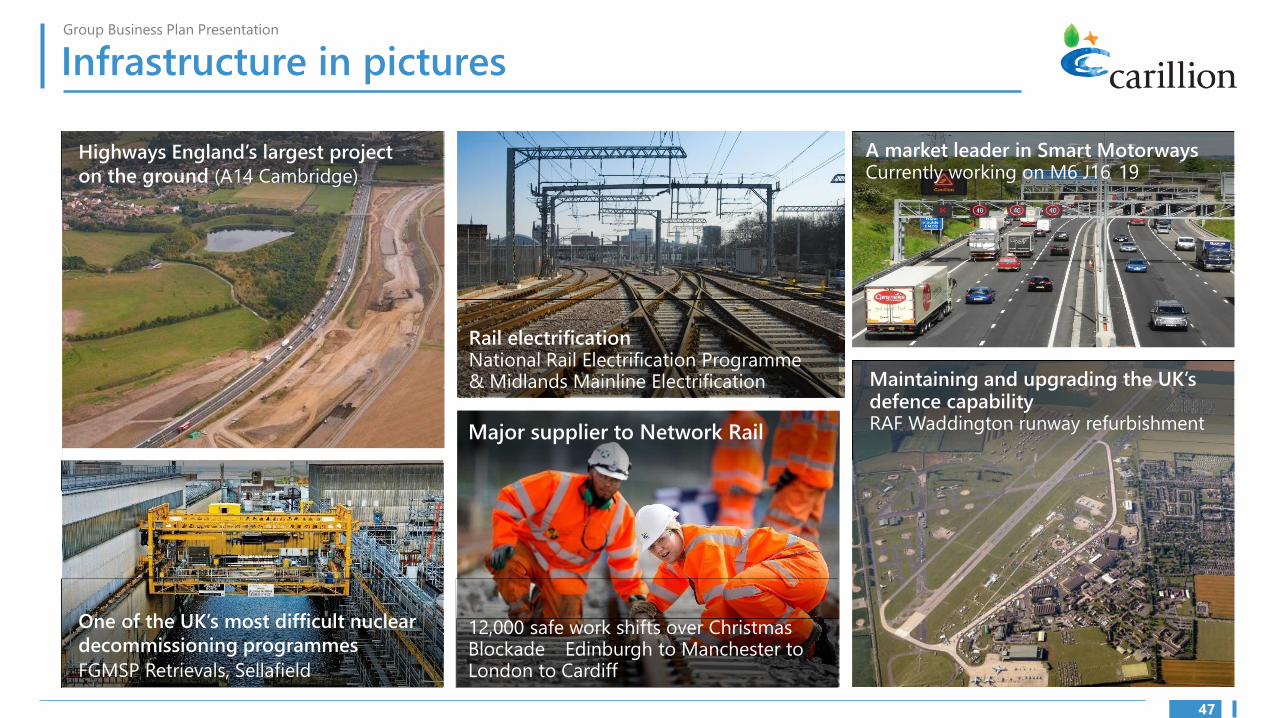
Rail electrification National Rail Electrification Programme & Midlands Mainline Electrification
Highways England’s largest project
on the ground (A14 Cambridge)
One of the UK’s most difficult nuclear
decommissioning programmes
FGMSP Retrievals, Sellafield
Major supplier to Network Rail
Group Business Plan Presentation
Infrastructure in pictures
47
A market leader in Smart Motorways Currently working on M6 J16 19
Maintaining and upgrading the UK’s defence capability RAF Waddington runway refurbishment
12,000 safe work shifts over Christmas Blockade Edinburgh to Manchester to London to Cardiff

Group Business Plan Presentation
Infrastructure – overview
What we do and business plan headlines
A leading UK ‘Transport and
Infrastructure’ contractor for
new build and maintenance
INFRASTRUCTURE
2018 KEY FINANCIALS WHAT WE DO
£770m REVENUE
£29m OPERATING PROFIT
KEY STATISTICS REVENUE SPLIT (2018)
Key customers:
• Network Rail
• Highways England
• HS2
• c2,250 employees
• 50+ contracts
• Frameworks: Network Rail,
Highways alliances
• Key JVs: AWPR, CEK, A14,
CPL, Smart Motorways,
Infrasig
RAIL 45%
CIVILS &
HIGHWAYS
42%
4.0-5.0% MID-TERM MARGIN TARGET
HS2 13%
A business plan for growth, capitalising on market leading positions. The opportunity is significant – the UK is delivering the largest infrastructure investment since Victorian times across all transport areas backed by the National Infrastructure Plan
Financial highlights
TOTAL REVENUE CAGR 5%
2018 2022
£770m £976m
OPERATING PROFIT CAGR 10%
2018 2022
£29m £46m
OPERATING MARGIN +100BPS
2018 2022
3.7% 4.7%
48

Group Business Plan Presentation
Infrastructure – strategy
Government committed to invest within Infrastructure to grow GDP
Rail
Outlook:
• Underpinned by Network Rail spend – CP6 £48bn vs £38bn for CP5
• Diversification – rail franchise market (c£9.4bn pa); we have key relationships with ToCs and fully integrated solutions
Market position: top 2 supplier to Network Rail by volume and leading by competence
Competitors: Costain, BAM, Amey
HS2 (CEK JV)
Outlook:
• C2/C3 contracts (c£1.4bn)
• Opportunities – JV to bid for Phase 1 rail systems (c£1.8bn) – only 3 credible bidders: Phase 2 Birmingham to Crewe (c£2bn)
Market position: 1 of 4 on Phase 1 construction
Competitors: BBV JV, SCS JV, Align JV, Alstom
Strategic Roads
Outlook:
• RIS 1 (2015-20): £15bn investment
• CDF 2 position secured, targeting top 3 on start assessment
• Significant spend profile issued by Highways England (‘HE’) will impact 2020 onwards
Market position: smart motorways market leader, A14 JV (HE’s largest project in delivery)
Competitors: Balfour Beatty, Costain, Skanska
Civils
Outlook:
• Targeting Local Authority and Welsh Government projects/regional frameworks
• Strong presence at Sellafield but reducing in 2018
• Growth in airfield/airport work
Market position: selective bidding approach
Competitors: Balfour Beatty, Costain, regional players
Strategic priorities
• Deliver HS2 – and win new work through CEK JV (Carillion, Eiffage, Kier)
• Balanced portfolio across core sectors of rail, roads, civil engineering
• Capitalise on strong market position in Rail and maintain share to ensure we capture growth under CP6
• Achieve top 3 position on Highways England start assessment to take advantage of RIS 1/RIS 2 forecast spend
• Targeting to be a ‘Framework Supplier’ to local authorities, delivering OJEU procured projects within England and Wales
• New build – focus on target cost, collaborative procurement
• Maintain JV partnerships to deliver more complex projects
49

‘20
Group Business Plan Presentation
Infrastructure – top line outlook
REVENUE BRIDGE 2017 TO 2022 83
2018: Revenues reduce slightly but stable in challenging times
• Visibility 90% (secured and probable)
• Lower Rail volumes (due to reduced Network Rail spend), AWPR ending
• Offset by HS2 (modest contribution – still in design phase) and Strategic Roads
2019 onwards: Identified growth in addressable markets
• Visibility 51% for 2019 (secured and probable)
• Rail growth as Network Rail spend picks up, especially once CP6 kicks in (Assume 1 in 3 win rate and no growth in secured forecast). Plus new franchise opportunities
• HS2 delivering significant revenues
• Strong growth in Strategic Roads – significant spend profile issued by Highways England, which will impact 2020 onwards. Modest view taken in business plan with upside opportunity (Assume 1 in 5 win rate)
• Civils – growth in airport / airfield work alongside new Sellafield decommissioning programme where we have competence and delivery capability alongside core LA frameworks
89 (61) 34 Roads, Civil
& other
£770m HS2 Rail
decline Net combined
£976m
Revenue visibility*
£831m
True ‘to gain’ is much lower than revenue visibility suggests – factoring in expected volumes from framework agreements, visibility would rise to c90% for 2018 and c50% for 2019
2017 RF4 2018 BP 2022 BP
‘18 55%
‘19 18%
Key contracts
• HS2 – NTP Phase 2 Nov 18
• A14 (H2 ‘20)
• NWEP (Phase 4/5 complete H2 ‘18)
• M6 SMP (M3, M20, M6)
• CPL (Continues into 2019)
• AWPR (ends June ’18)
* Work secured & probable
50
Group Business Plan Presentation
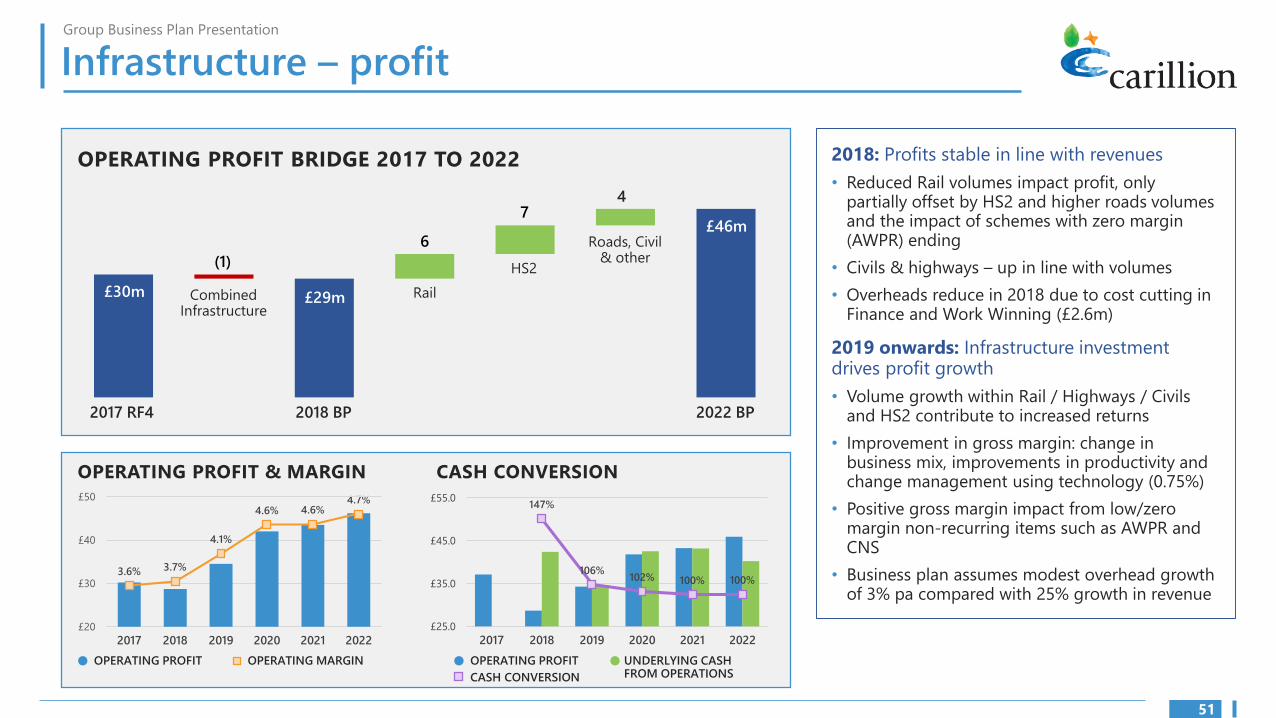
Infrastructure – profit
OPERATING PROFIT BRIDGE 2017 TO 2022
4 7
6 Roads, Civil & other (1) HS2
£30m Rail Infrastructure
Combined £29m
£46m
2017 RF4 2018 BP 2022 BP
OPERATING PROFIT & MARGIN CASH CONVERSION
£50 £55.0 4.7% 147% 4.6% 4.6%
£45.0 £40 4.1%
3.7% 3.6% £30 £35.0
£25.0 £20
106% 102% 100% 100%
2017 2018 2019 2020 2021 2022 2017 2018 2019 2020 2021 2022
OPERATING PROFIT OPERATING MARGIN OPERATING PROFIT UNDERLYING CASH FROM OPERATIONS CASH CONVERSION
2018: Profits stable in line with revenues
• Reduced Rail volumes impact profit, only partially offset by HS2 and higher roads volumes and the impact of schemes with zero margin (AWPR) ending
• Civils & highways – up in line with volumes
• Overheads reduce in 2018 due to cost cutting in Finance and Work Winning (£2.6m)
2019 onwards: Infrastructure investment drives profit growth
• Volume growth within Rail / Highways / Civils and HS2 contribute to increased returns
• Improvement in gross margin: change in business mix, improvements in productivity and change management using technology (0.75%)
• Positive gross margin impact from low/zero margin non-recurring items such as AWPR and CNS
• Business plan assumes modest overhead growth of 3% pa compared with 25% growth in revenue
51
Group Business Plan Presentation
Infrastructure – cash
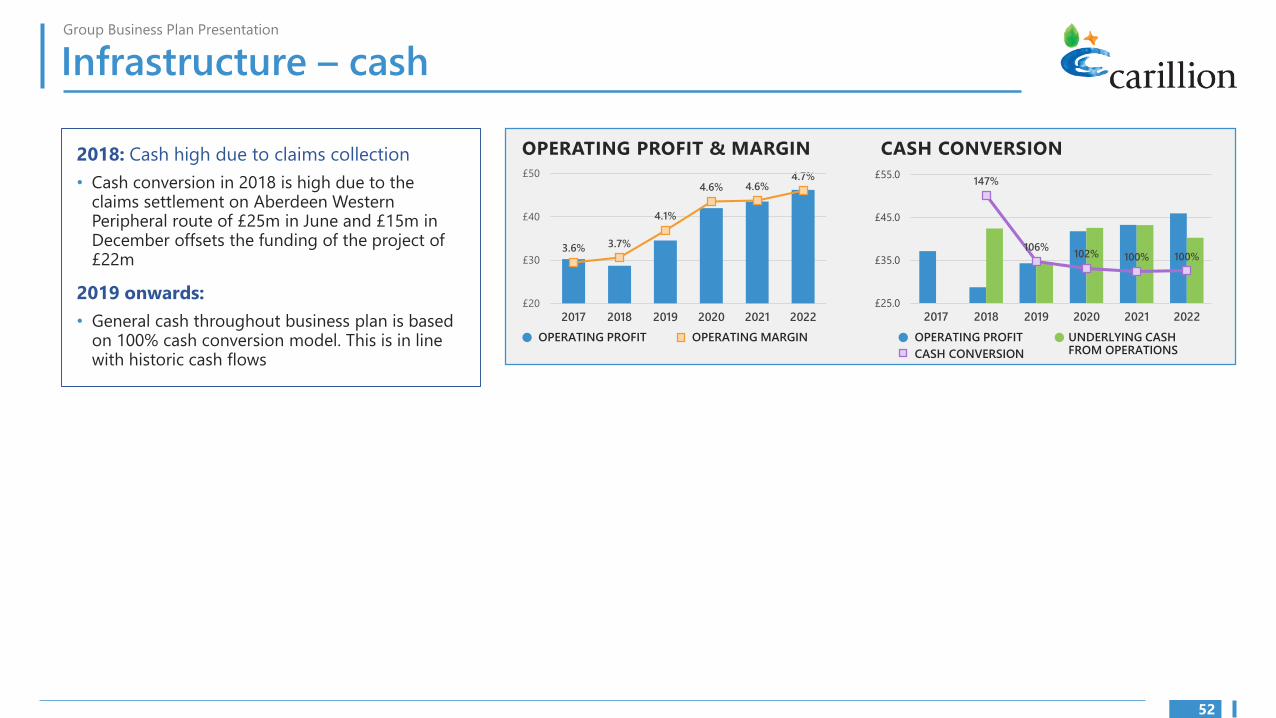
2018: Cash high due to claims collection
• Cash conversion in 2018 is high due to the claims settlement on Aberdeen Western Peripheral route of £25m in June and £15m in December offsets the funding of the project of £22m
2019 onwards:
• General cash throughout business plan is based on 100% cash conversion model. This is in line with historic cash flows
OPERATING PROFIT & MARGIN CASH CONVERSION
£50 £55.0 4.7% 147% 4.6% 4.6%
£45.0 £40 4.1%
3.7% 3.6% £30 £35.0
£25.0 £20
106% 102% 100% 100%
2017 2018 2019 2020 2021 2022 2017 2018 2019 2020 2021 2022
OPERATING PROFIT OPERATING MARGIN OPERATING PROFIT UNDERLYING CASH FROM OPERATIONS CASH CONVERSION
52

–
Group Business Plan Presentation
Central Government in pictures
53
GCHQ
Hestia CarillionAramark Aspire
Northwood
CarillionAmey
Aspire

Group Business Plan Presentation
Central Government – overview
What we do and business plan headlines
Support services for the
MoD and other central
government departments
2018 KEY FINANCIALS WHAT WE DO
£745m REVENUE
£19m OPERATING PROFIT
KEY STATISTICS REVENUE SPLIT (2018)
Key customers:
• MoD & DIO
• MoJ
• Home Office
• >4,000 employees
• <15 contracts (small, stable
number of larger contracts)
• Frameworks: CCS
• Key JVs: Aspire (KBR), NGEC
(Amey), Hestia (Aramark)
DEFENCE 82%
OTHER
CENTRAL
GOV
18%
4.5%-5.5% MID-TERM MARGIN TARGET
CENTRAL GOVERNMENT A strategy to maintain existing MoD contracts while also diversifying services to improve profitability; and to grow facilities management provision to central government departments through the CCS framework, replacing older contracts with higher margin wins
Financial highlights
TOTAL REVENUE CAGR -%
2018 2022
£745m £756m
OPERATING PROFIT CAGR 17%
2018 2022
£26m £41m
OPERATING MARGIN +290BPS
2018 2022
2.5% 5.4%
54
Group Business Plan Presentation
Central Government – strategy
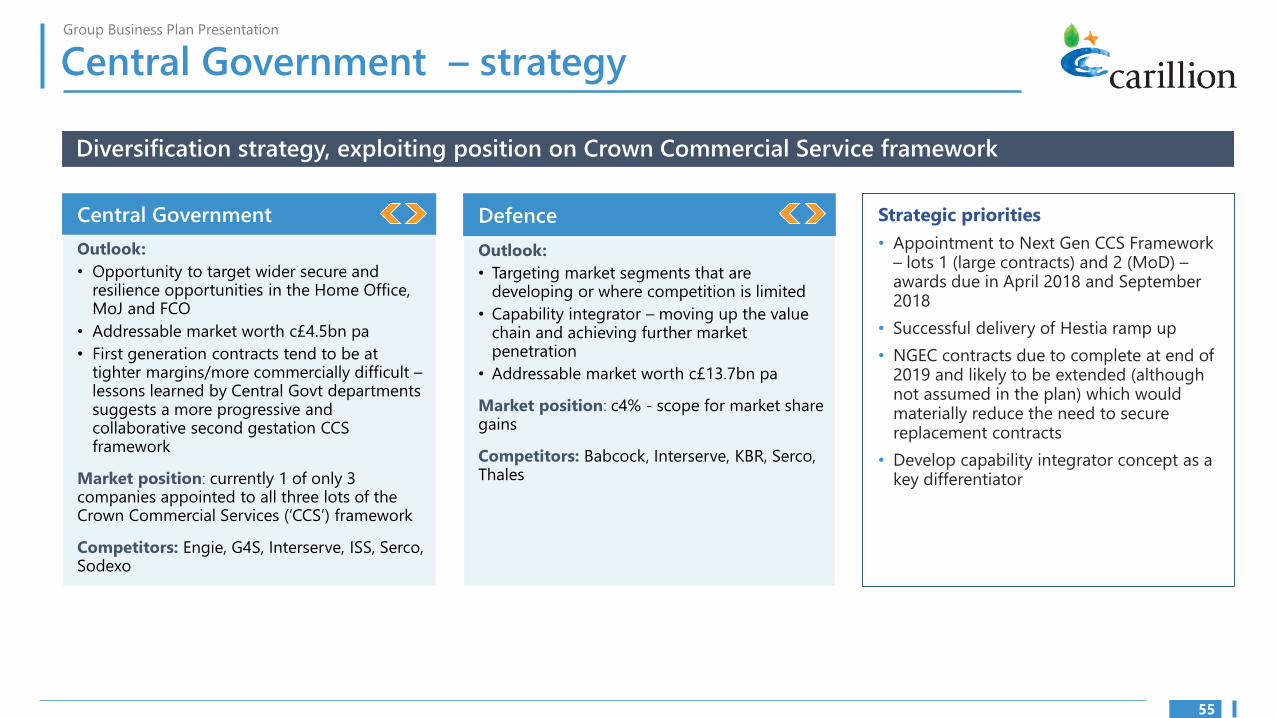
Diversification strategy, exploiting position on Crown Commercial Service framework
Central Government Defence
Outlook:
• Opportunity to target wider secure and resilience opportunities in the Home Office, MoJ and FCO
• Addressable market worth c£4.5bn pa
• First generation contracts tend to be at tighter margins/more commercially difficult – lessons learned by Central Govt departments suggests a more progressive and collaborative second gestation CCS framework
Market position: currently 1 of only 3 companies appointed to all three lots of the Crown Commercial Services (‘CCS’) framework
Competitors: Engie, G4S, Interserve, ISS, Serco, Sodexo
Outlook:
• Targeting market segments that are developing or where competition is limited
• Capability integrator – moving up the value chain and achieving further market penetration
• Addressable market worth c£13.7bn pa
Market position: c4% - scope for market share gains
Competitors: Babcock, Interserve, KBR, Serco, Thales
Strategic priorities
• Appointment to Next Gen CCS Framework – lots 1 (large contracts) and 2 (MoD) – awards due in April 2018 and September 2018
• Successful delivery of Hestia ramp up
• NGEC contracts due to complete at end of 2019 and likely to be extended (although not assumed in the plan) which would materially reduce the need to secure replacement contracts
• Develop capability integrator concept as a key differentiator
55

‘20
Group Business Plan Presentation
Central Government – top line outlook
REVENUE BRIDGE 2017 TO 2022
390 98 (23) (356)
£647m
£745m Ongoing contracts
Hestia & other
NGEC To gain
£756m
2018: Strong visibility on 15% top line growth
• Visibility 77%, rising to >95% factoring in variable work and retail sales (using current track record to project)
• Growth almost entirely driven by 2017 Hestia wins
2019 onwards: Significant work winning required
• Visibility 71% but drops sharply thereafter – business plan assumes NGEC volumes decline from mid-2019 onwards. This is a conservative assumption – it is likely NGEC will be extended
• Other ongoing contracts – declines largely driven by NOMS, partially offset by incremental revenues on Hestia, Aspire
• Securing place on CCS critical
• Strong pipeline (c£7bn) – assume 25% win rate, down from 50% historically:
‒ Diversification into more competitive markets
‒ Expansion of CCS framework (ie creating more competition)
2017 RF4 2018 BP 2022 BP
Revenue visibility* Key contracts
‘18 77%
‘19 71%
Visibility reflects only secured and probable • Aspire (‘41) work – ie they exclude retail sales (Hestia) and • NGEC (‘19) variable works. Based on track record,
• Northwood (’31) including these would increase 2018 visibility to >95% (c2% to gain, c20% NGEC projects on which there is visibility). For 2019, projects are expected to be c17% of revenue, leaving
• NOMS Prisons (’22)
• Hestia (‘23)
only 12% of revenue to gain)
* Work secured & probable
56

Group Business Plan Presentation
Central Government – profit & cash
OPERATING PROFIT BRIDGE 2017 TO 2022 26
£26m
8 (12) (13)
104 (8)
£19m Ongoing
contracts – NGEC To gain
Non- Hestia volumes & recurring performance Group Cost
2017 improvement provision reduction provisions
for NOMS & claims
£41m
2017 RF4 2018 BP 2022 BP
OPERATING PROFIT & MARGIN CASH CONVERSION 5.4% 151%£45 £55
4.0%
2.5%
3.2%
4.3% 4.7% 143%
£40 £45
£35
£30 £35
£25 £25
£20
£15 £15
88%
132%
98%
2017 2018 2019 2020 2021 2022 2017 2018 2019 2020 2021 2022
OPERATING PROFIT OPERATING MARGIN OPERATING PROFIT UNDERLYING CASH FROM OPERATIONS CASH CONVERSION
2018: Sharp drop in profitability
• 2017 one-off items drop out including £3m tax credit, £5m release of provisions for carbon trading scheme (all cases now settled) and £5m of claims relating to NGEC
• Hestia contributes an additional £4m
• 2017 benefits from a Group provision against a loss-making contract, NOMS (prisons)
• Cost reduction includes targeted improvement in NOMS contribution to a break even position
2019 onwards: Profit and margin recovery
• Strong margin gains post-2019 – higher quality pipeline
• Ongoing contracts – incremental volumes on Hestia, Aspire plus benefit of improved performance on NOMS
• Assume NGEC (contract c3% margin) drops out from mid-19 - conservative assumption. If extended, will be at higher margins due to extension terms and reduced depreciation charges. Could be £150m pa at 7% (£11m)
• New contracts in 2019 to 2022 assumed at higher margins (6-7%). These include £100m pa from CCS and £170m pa from alternate housing contract if NGEC is not extended
57

Group Business Plan Presentation
Central Government – cash
2018-2022:
• Cash conversion over 100% in most years, mainly due to amortisation of mobilisation costs on NGEC and NOMS and the improvement of WIP conversion in 2018
• Cash conversion in 2019 is lower than 100% due to the mobilisation of new work for H2 2019 and H1 2020
• All new work has a mobilisation period of 6 months and a mobilisation costs outflow of £1m has been included for each new contract win
• All current contracts (excl JVs) paid core fee in month of service (30 days ahead of terms)
• On JVs
– Dividends for Aspire JV are paid monthly based on profit less tax
– NGEC Housing – dividends paid half yearly
– NGEC Primes – management fees £1.8m pa; dividends paid half yearly; SW Soft Services paid in month
4.0%
2.5%
3.2%
4.3% 4.7%
88%
132%
98%
OPERATING PROFIT & MARGIN CASH CONVERSION 5.4% 151%£45 £55
143%
£40 £45
£35
£30 £35
£25 £25
£20
£15 £15
2017 2018 2019 2020 2021 2022 2017 2018 2019 2020 2021 2022
OPERATING PROFIT OPERATING MARGIN OPERATING PROFIT UNDERLYING CASH FROM OPERATIONS CASH CONVERSION
58

–
Group Business Plan Presentation
Corporate & Regions in pictures
Northern contract Manchester Victoria station
Heathrow
Carilliontelent/BT Openreach
Nationwide
CEC North (Arriva Rail North)
59

Group Business Plan Presentation
Corporate & regions – overview
What we do and business plan headlines
Support services for
corporate customers and
regional public authorities
2018 KEY FINANCIALS WHAT WE DO
£688m REVENUE
£42m OPERATING PROFIT
KEY STATISTICS REVENUE SPLIT (2018)
Key customers:
• BT Openreach, Gigaclear
• Tameside
• Nationwide, Centrica,
Heathrow
• c9,000 employees
• 80+ contracts (reducing
due to selectivity)
• Frameworks: CCS (future
opportunity 2018+)
• Key JVs: Carilliontelent
6.5-7.5% MID-TERM MARGIN TARGET
CARLLIONTELENT 55%
LOCAL
GOVT &
OTHER
27%
CORPORATE 18%
CORPORATE & REGIONS Diverging dynamics – growth at Carilliontelent to drive positive mix shift; opportunities for growth in transport; focus on addressing the ‘tail’, core cities and cost cutting to support margin elsewhere
Financial highlights
TOTAL REVENUE CAGR (1)%
2018 2022
£688m* £655m
OPERATING PROFIT CAGR 1%
2018 2022
£42m £45m
OPERATING MARGIN +70BPS
2018 2022
6.1% 6.8%
*2018: those contracts part of the announced healthcare disposal drop out from 30.6.18
60
Group Business Plan Presentation
Corporate & Regions – strategy
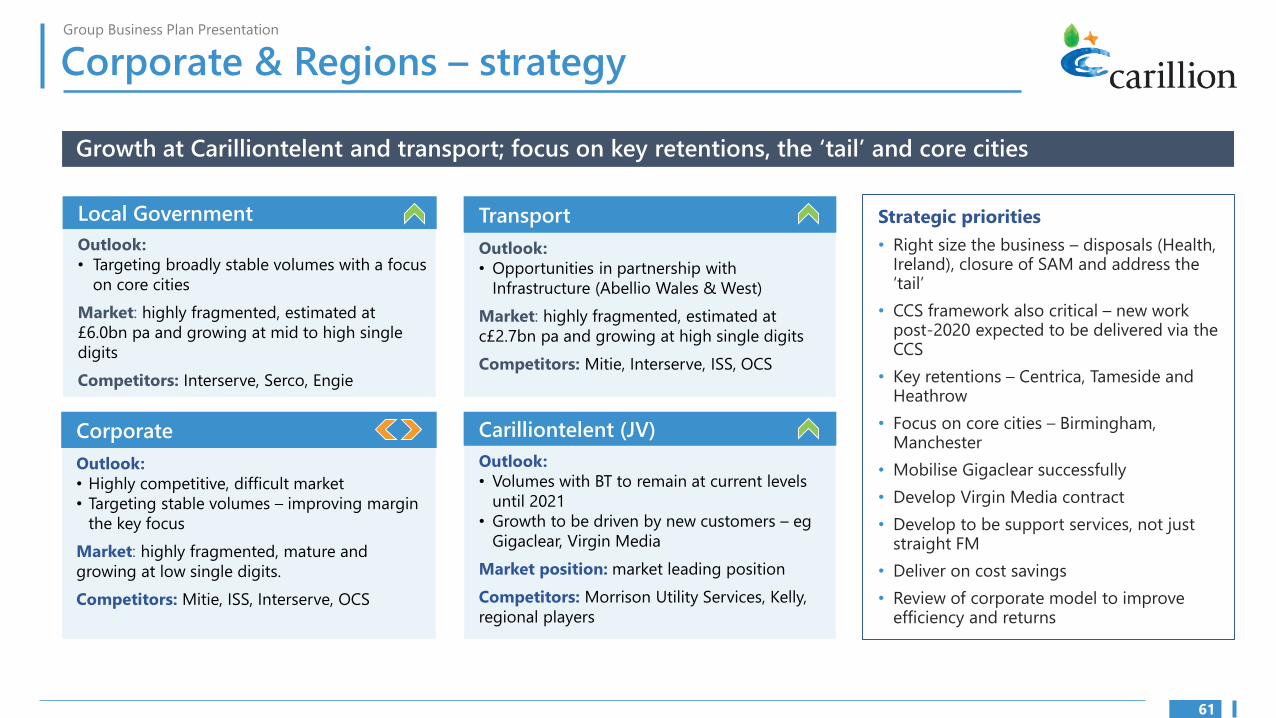
Growth at Carilliontelent and transport; focus on key retentions, the ‘tail’ and core cities
Local Government Transport
Outlook:
• Targeting broadly stable volumes with a focus
on core cities
Market: highly fragmented, estimated at
£6.0bn pa and growing at mid to high single
digits
Competitors: Interserve, Serco, Engie
Corporate
Outlook:
• Highly competitive, difficult market
• Targeting stable volumes – improving margin
the key focus
Market: highly fragmented, mature and
growing at low single digits.
Competitors: Mitie, ISS, Interserve, OCS
Outlook:
• Opportunities in partnership with
Infrastructure (Abellio Wales & West)
Market: highly fragmented, estimated at
c£2.7bn pa and growing at high single digits
Competitors: Mitie, Interserve, ISS, OCS
Carilliontelent (JV)
Outlook:
• Volumes with BT to remain at current levels
until 2021
• Growth to be driven by new customers – eg
Gigaclear, Virgin Media
Market position: market leading position
Competitors: Morrison Utility Services, Kelly,
regional players
Strategic priorities
• Right size the business – disposals (Health, Ireland), closure of SAM and address the ‘tail’
• CCS framework also critical – new work post-2020 expected to be delivered via the CCS
• Key retentions – Centrica, Tameside and Heathrow
• Focus on core cities – Birmingham, Manchester
• Mobilise Gigaclear successfully
• Develop Virgin Media contract
• Develop to be support services, not just straight FM
• Deliver on cost savings
• Review of corporate model to improve efficiency and returns
61
‘20
Group Business Plan Presentation
Corporate & Regions – top line outlook
REVENUE BRIDGE 2017 TO 2022
64 (64) (60)
£748m
16 (40) 51 (60) Other & Ctelent JV
Disposals contracts £688m Ctelent JV To gain Other & Disposals not contracts
retained, not exits retained,
exits
*2018: those contracts part of the announced healthcare disposal drop out from 30.6.18
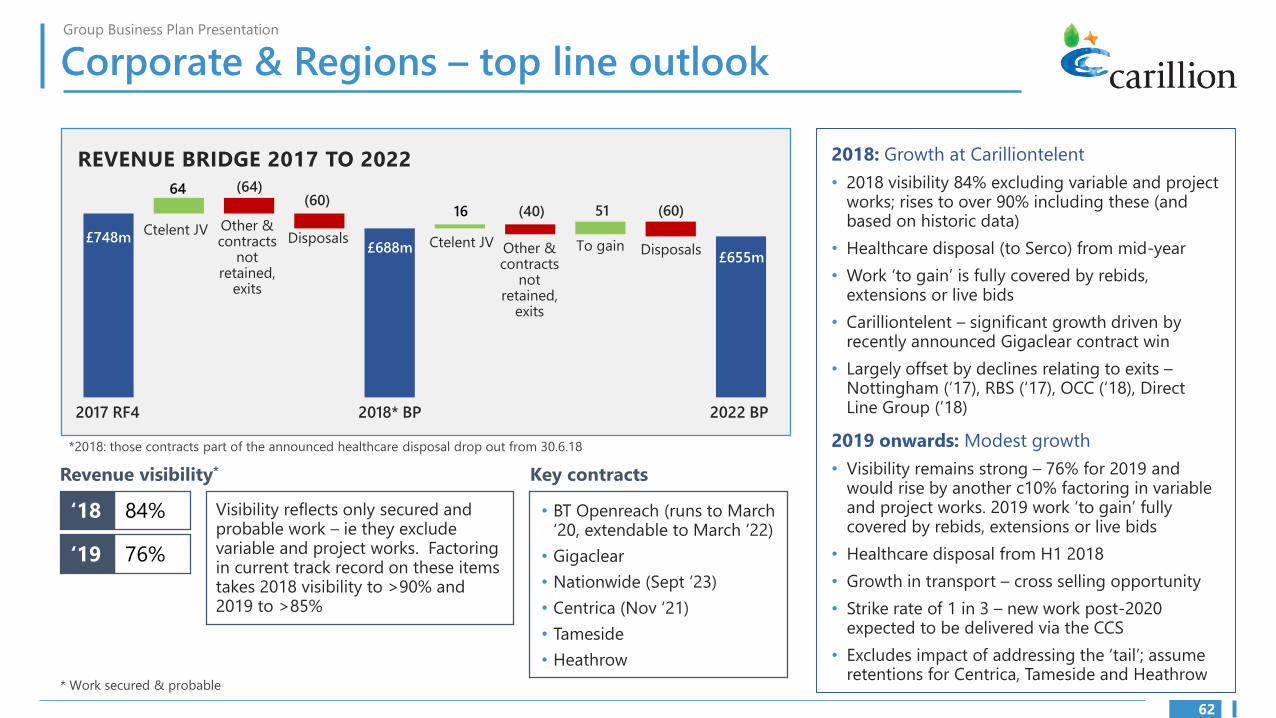
Revenue visibility*
Visibility reflects only secured and probable work – ie they exclude variable and project works. Factoring in current track record on these items takes 2018 visibility to >90% and 2019 to >85%
2018: Growth at Carilliontelent
• 2018 visibility 84% excluding variable and project works; rises to over 90% including these (and based on historic data)
• Healthcare disposal (to Serco) from mid-year
• Work ‘to gain’ is fully covered by rebids, extensions or live bids
• Carilliontelent – significant growth driven by recently announced Gigaclear contract win
• Largely offset by declines relating to exits – Nottingham (‘17), RBS (‘17), OCC (‘18), Direct Line Group (’18)
2019 onwards: Modest growth
• Visibility remains strong – 76% for 2019 and would rise by another c10% factoring in variable and project works. 2019 work ‘to gain’ fully covered by rebids, extensions or live bids
• Healthcare disposal from H1 2018
• Growth in transport – cross selling opportunity
• Strike rate of 1 in 3 – new work post-2020 expected to be delivered via the CCS
• Excludes impact of addressing the ‘tail’; assume retentions for Centrica, Tameside and Heathrow
• BT Openreach (runs to March ‘20, extendable to March ‘22)
• Gigaclear
• Nationwide (Sept ‘23)
• Centrica (Nov ‘21)
• Tameside
• Heathrow
Key contracts
£655m
2017 RF4 2018* BP 2022 BP
‘18 84%
‘19 76%
* Work secured & probable
62

Group Business Plan Presentation
Corporate & Regions – profit
OPERATING PROFIT BRIDGE 2017 TO 2022
13 (5)
£35m
(9) 3 (6) 24One-offs8 To gain
£42m
Cost Disposals Ctelent JVCost Disposals reduction
reduction & contract Ctelent JV
exits
2018: Significant step up in profitability
• Healthcare disposal a drag in H2 2018
• Underlying profit development reflects revenue with good growth at Carilliontelent
• Cost reduction a major contributor – both headcount and third party savings. Half relates to measures taken in 2017 making a full year contribution, the remainder to 2018 initiatives
2019 onwards: Continued steady progress
• Healthcare disposal drops out from H2 2018
• Margins to improve over the period as low margin contracts exited in 2017 and 2018 are replaced by higher margin Carilliontelent volumes and cost savings
• 2022 operating margin 6.8% vs mid-term target range 6.5-7.5%
£45m
2017 RF4 2018* BP 2022 BP
*2018: those contracts part of the announced healthcare disposal drop out from 30.6.18
OPERATING PROFIT & MARGIN CASH CONVERSION
£70 £807.7% 122% 7.6% 7.6% 7.7%
£70£60 6.4%
£60 £50
£50
£40 4.7% £40
£30 £30
£20 £20
96%
114%
99%
105%
2017 2018 2019 2020 2021 2022 2017 2018 2019 2020 2021 2022
OPERATING PROFIT OPERATING MARGIN OPERATING PROFIT UNDERLYING CASH FROM OPERATIONS CASH CONVERSION
63

Group Business Plan Presentation
Corporate & Regions – cash
2018:
• 2018 Telent EPF benefit partly offset by working capital increase for Gigaclear
• Working capital outflows on RBS of £7m and Portsmouth of £9m
2019 onwards:
• All contracts targeted to deliver cash-backed profits from 2018
96%
114%
99%
105%
OPERATING PROFIT & MARGIN CASH CONVERSION
£70 £807.7% 122% 7.6% 7.6% 7.7%
£70£60 6.4%
£60 £50
£50
£40 4.7% £40
£30 £30
£20£20
2017 2018 2019 2020 2021 2022 2017 2018 2019 2020 2021 2022
OPERATING PROFIT OPERATING MARGIN OPERATING PROFIT UNDERLYING CASH FROM OPERATIONS CASH CONVERSION
64

Group Business Plan Presentation
Building in pictures
65
101 Embankment, Manchester
Library of Birmingham
Gasholders, Kings Cross (Argent)
Anfield main stand, Liverpool FC
Aspire One Chamberlain Square, Birmingham
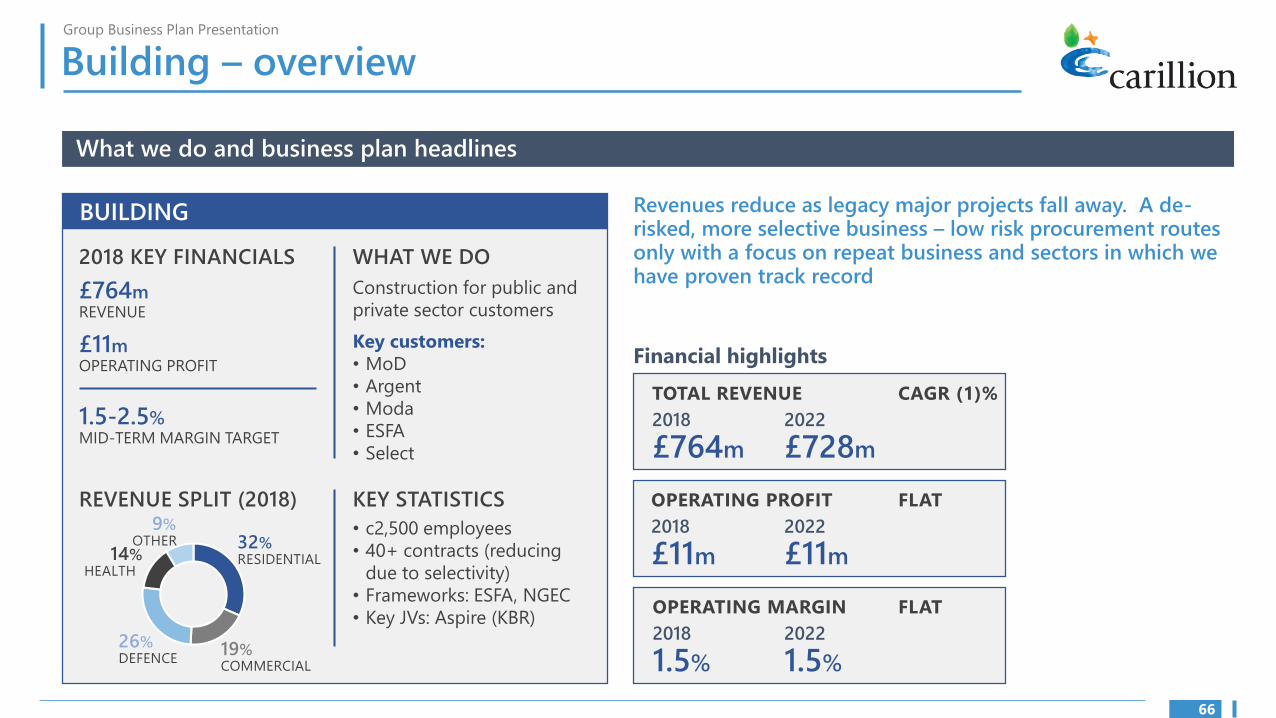
Group Business Plan Presentation
Building – overview
What we do and business plan headlines
Construction for public and
private sector customers
2018 KEY FINANCIALS WHAT WE DO
£764m REVENUE
£11m OPERATING PROFIT
KEY STATISTICS REVENUE SPLIT (2018)
Key customers:
• MoD
• Argent
• Moda
• ESFA
• Select
• c2,500 employees
• 40+ contracts (reducing
due to selectivity)
• Frameworks: ESFA, NGEC
• Key JVs: Aspire (KBR)
RESIDENTIAL 32%
HEALTH 14%
1.5-2.5% MID-TERM MARGIN TARGET
COMMERCIAL 19%
DEFENCE 26%
OTHER 9%
BUILDING Revenues reduce as legacy major projects fall away. A de-risked, more selective business – low risk procurement routes only with a focus on repeat business and sectors in which we have proven track record
Financial highlights
TOTAL REVENUE CAGR (1)%
2018 2022
£764m £728m
OPERATING PROFIT FLAT
2018 2022
£11m £11m
OPERATING MARGIN FLAT
2018 2022
1.5% 1.5%
66
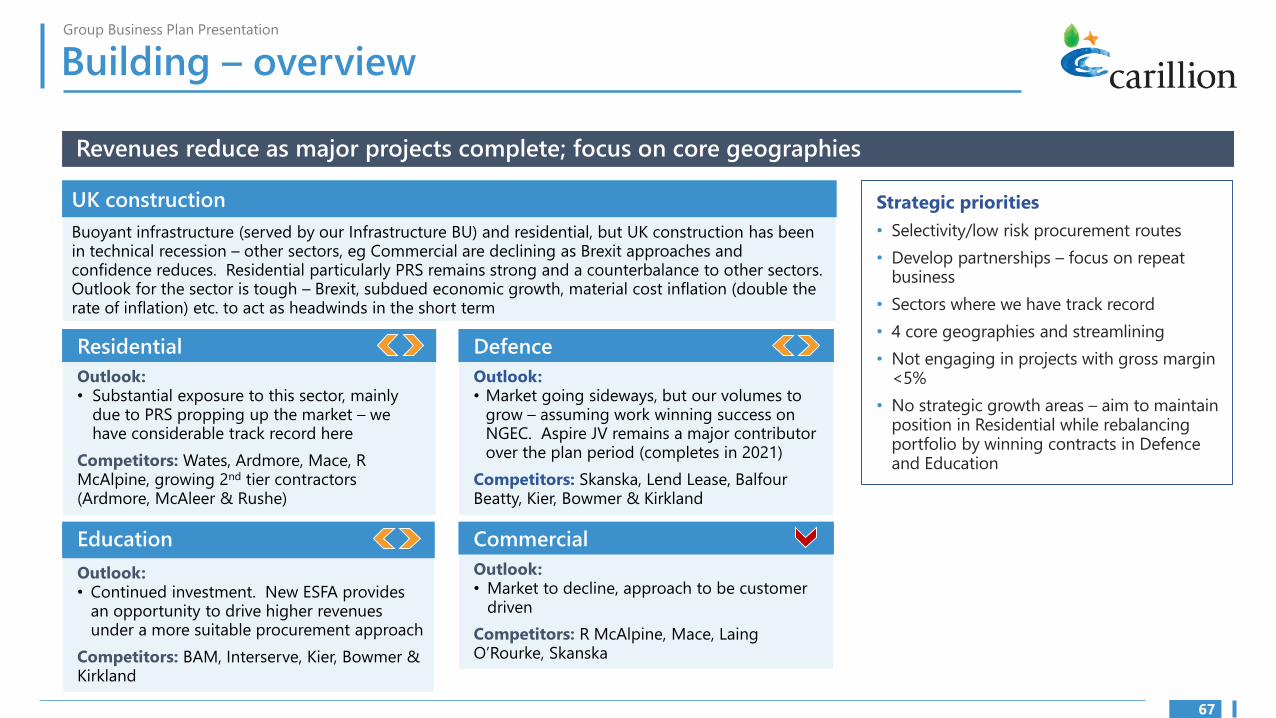
Group Business Plan Presentation
Building – overview
Revenues reduce as major projects complete; focus on core geographies
UK construction
Buoyant infrastructure (served by our Infrastructure BU) and residential, but UK construction has been in technical recession – other sectors, eg Commercial are declining as Brexit approaches and confidence reduces. Residential particularly PRS remains strong and a counterbalance to other sectors. Outlook for the sector is tough – Brexit, subdued economic growth, material cost inflation (double the rate of inflation) etc. to act as headwinds in the short term
Residential
Outlook: • Substantial exposure to this sector, mainly
due to PRS propping up the market – we have considerable track record here
Competitors: Wates, Ardmore, Mace, R McAlpine, growing 2nd tier contractors (Ardmore, McAleer & Rushe)
Defence
Outlook: • Market going sideways, but our volumes to
grow – assuming work winning success on NGEC. Aspire JV remains a major contributor over the plan period (completes in 2021)
Competitors: Skanska, Lend Lease, Balfour Beatty, Kier, Bowmer & Kirkland
Strategic priorities
• Selectivity/low risk procurement routes
• Develop partnerships – focus on repeat business
• Sectors where we have track record
• 4 core geographies and streamlining
• Not engaging in projects with gross margin <5%
• No strategic growth areas – aim to maintain position in Residential while rebalancing portfolio by winning contracts in Defence and Education
Education Commercial
Outlook: Outlook: • Market to decline, approach to be customer • Continued investment. New ESFA provides
driven an opportunity to drive higher revenues under a more suitable procurement approach Competitors: R McAlpine, Mace, Laing
O’Rourke, Skanska Competitors: BAM, Interserve, Kier, Bowmer & Kirkland
67

‘20
‘20
Group Business Plan Presentation
Building – top line outlook
REVENUE BRIDGE 2017 TO 2022
(187)
£937m 46 (32) (122)
£764m
100 (119) Legacy 105Uptick in Contracts
major Aspire ending Legacy Net to projects volumes partially major gain Aspire Newoffset by projects growth completing major
2021 defence project (to
gain)
£728m
2018: Legacy major projects reduce
• Visibility – 81% secured & probable
• Legacy major projects reduce
• A number of others with lower volumes (eg Triplets) also more than offset growth (Fallowfield, RAF Akrotiri) in the business
2019 onwards: Stabilising at a lower level
• As expected, visibility reduces significantly – 24% of 2019 revenue secured & probable. Will address through 2018 pipeline development
• Residential to support the BU, underpinned by position in PRS (forecast to be buoyant) – residential to rise from c30% of revenue to >half by 2022
• Commercial – steadily shrinks from >20% of revenue to <10% by 2020, resuming growth thereafter
• Assume strike rates decrease – less negotiated and more competitive opportunities
• Investing in Defence (NGEC runs to 2021) and Education (ESFA framework) as Aspire unwinds
2017 RF4 2018 BP 2022 BP
Revenue visibility* Key contracts
‘18 81%
‘19 24%
• MMH (June ‘19) • Aspire Army (H1 ‘21) • Angel Gardens
• Trinity Riverside
• RAF Croughton
• Recurring Customers include Moda, Select and Argent
* Work secured & probable
68

Group Business Plan Presentation
Building – profit
OPERATING PROFIT BRIDGE 2017 TO 2022
4 (5)
£15m
(5) Aspire
Non-2 (10) 5
recurring items
Volume Cost £11m
5 reduction reduction
New projects
Aspire New major 2017 RF4 2018 BP completing defence 2022 BP
2021 project (to gain)
£11m
1.6%
1.5%
1.8%
1.6% 1.5%
OPERATING PROFIT & MARGIN CASH CONVERSION
£15 £251.8% £0
£14 -249% 51%-£25 -55%
-£50£13 -278%
-£75
£12 -£100
-£125 £11
-£150 -1031%
£10 -£175
2017 2018 2019 2020 2021 2022 2017 2018 2019 2020 2021 2022
OPERATING PROFIT OPERATING MARGIN OPERATING PROFIT UNDERLYING CASH FROM OPERATIONS CASH CONVERSION
2018: Stabilising to core portfolio. Unwinding legacy projects and cash
• Focus on maintaining and building core building portfolio and serving core clients at 5% gross margin
• 2017 non-recurring items include £5m of rebates
• Uptick in Aspire volumes a positive
• Unwind of cash in advance on legacy contracts
• Rightsizing overhead base to re-sized business
2019 onwards: 5% gross margin, cash backed profits
• Targeting gross margins of 5%, with a focus on core capability projects secured via lower risk procurement – this is a lower gross margin than previously targeted, albeit new target should be more deliverable
• Focus on a core portfolio to ensure that we do not over extend business
• Aspire ends 2021 – working capital unwind; targeting one new major defence project to offset (eg Catterick, Salisbury Plain)
• Net margin at c. 1.5%, and mid term to grow to industry levels of 1.5-2.5% through focus on cost and managing out legacy issues
69
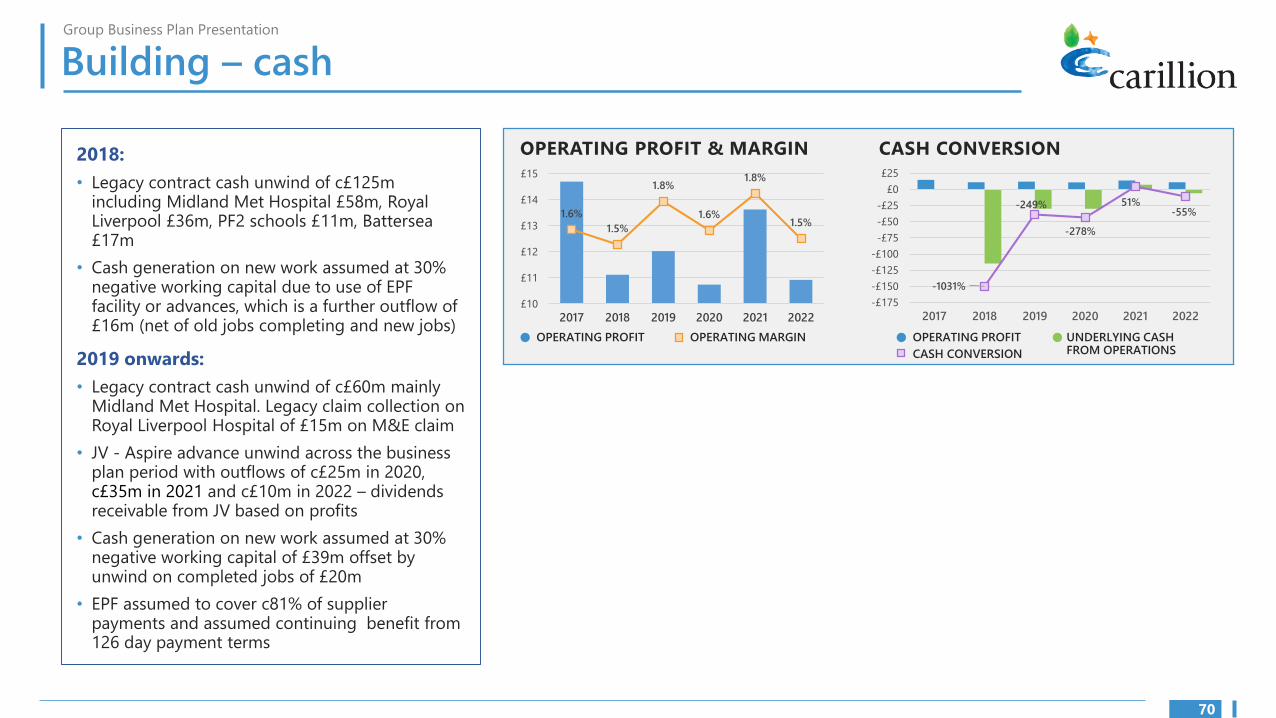
Group Business Plan Presentation
Building – cash
2018:
• Legacy contract cash unwind of c£125m including Midland Met Hospital £58m, Royal Liverpool £36m, PF2 schools £11m, Battersea £17m
• Cash generation on new work assumed at 30% negative working capital due to use of EPF facility or advances, which is a further outflow of £16m (net of old jobs completing and new jobs)
2019 onwards:
• Legacy contract cash unwind of c£60m mainly Midland Met Hospital. Legacy claim collection on Royal Liverpool Hospital of £15m on M&E claim
• JV - Aspire advance unwind across the business plan period with outflows of c£25m in 2020, c£35m in 2021 and c£10m in 2022 – dividends receivable from JV based on profits
• Cash generation on new work assumed at 30% negative working capital of £39m offset by unwind on completed jobs of £20m
• EPF assumed to cover c81% of supplier payments and assumed continuing benefit from 126 day payment terms
1.6%
1.5%
1.8%
1.6% 1.5%
OPERATING PROFIT & MARGIN CASH CONVERSION
£15 £251.8% £0
£14 -249% 51%-£25 -55%
-£50£13 -278%
-£75
£12 -£100
-£125 £11
-£150 -1031%
£10 -£175
2017 2018 2019 2020 2021 2022 2017 2018 2019 2020 2021 2022
OPERATING PROFIT OPERATING MARGIN OPERATING PROFIT UNDERLYING CASH FROM OPERATIONS CASH CONVERSION
70

Group Business Plan Presentation
International in pictures
Theme Districts at Expo 2020 Dubai
Royal Opera House
Toronto Pearson International Airport Forensic Services & Coroner’s Complex
Petawawa Defence Base
Petroleum Development Oman IFM
71

Group Business Plan Presentation
International – overview
Our international businesses in Canada and the Middle East
CANADA
REVENUE SPLIT (2018)
2018 KEY FINANCIALS
£447m REVENUE
£15m OPERATING PROFIT
SERVICES 58%
ROADS 29%
LEGACY (Const PPP)
13%
AFC
REVENUE SPLIT (2018)
2018 KEY FINANCIALS
£374m REVENUE
£21m OPERATING PROFIT
MENA
REVENUE SPLIT (2018)
2018 KEY FINANCIALS
£131m REVENUE
£(2)m OPERATING PROFIT
TOP 5
CONTRACTS
75%
OTHER 25%
QATAR 16%
ALAWI 46%
SAUDI 11%
EMRIL 27%
INTERNATIONAL
Canada remains a resilient economy with sustained and growing investment in our chosen sectors of defence, aviation, natural resources and healthcare. Pressure on government revenue plus the relative immaturity of the outsourced services sector represents a significant opportunity in a growth market
AFC developing its strategy ahead of the expected post-Expo reduction in construction opportunity
MENA rebalancing to Alawi and Emrill. Growth in the developing outsourced services sector. Revisit strategic options in 2018
72

Group Business Plan Presentation
Canada – overview
Growth in Services
TOTAL REVENUE CAGR - OPERATING PROFIT CAGR 8% OPERATING MARGIN +180BPS
2018 2022 2018 2022 2018 2022
£447m £446m £15m £23m 3.3% 5.1%
Services
Outlook:
• Immature outsourcing market growing at
c16% pa
• Good opportunities with sustainable
margins in aviation, defense & healthcare
• Oil sands remains competitive but starting to
see growth
• Wider natural resources sector more robust
Competitors: GDI, Compass, Aramark, Sodexo,
ATCO, ESS
Roads
Outlook:
• Stable market after several generations of
outsourcing
• Challenging contracts with limited growth
opportunities; changes in contracting models
Competitors: Miller, IMOS, Volker
Construction
Outlook:
• Legacy contracts – exit from construction
largely complete
Strategic priorities
Services:
• Immature market with growth opportunity
• Targeting a large number of small to medium wins
• Cross sell different services to existing clients (hard / soft FM)
• Key wins targeted in defence – robust pipeline
• Renewals (Business & Industry)
Roads:
• Deliver margin improvements, exit loss-making contracts
Construction
• Close out remaining legacy projects
73
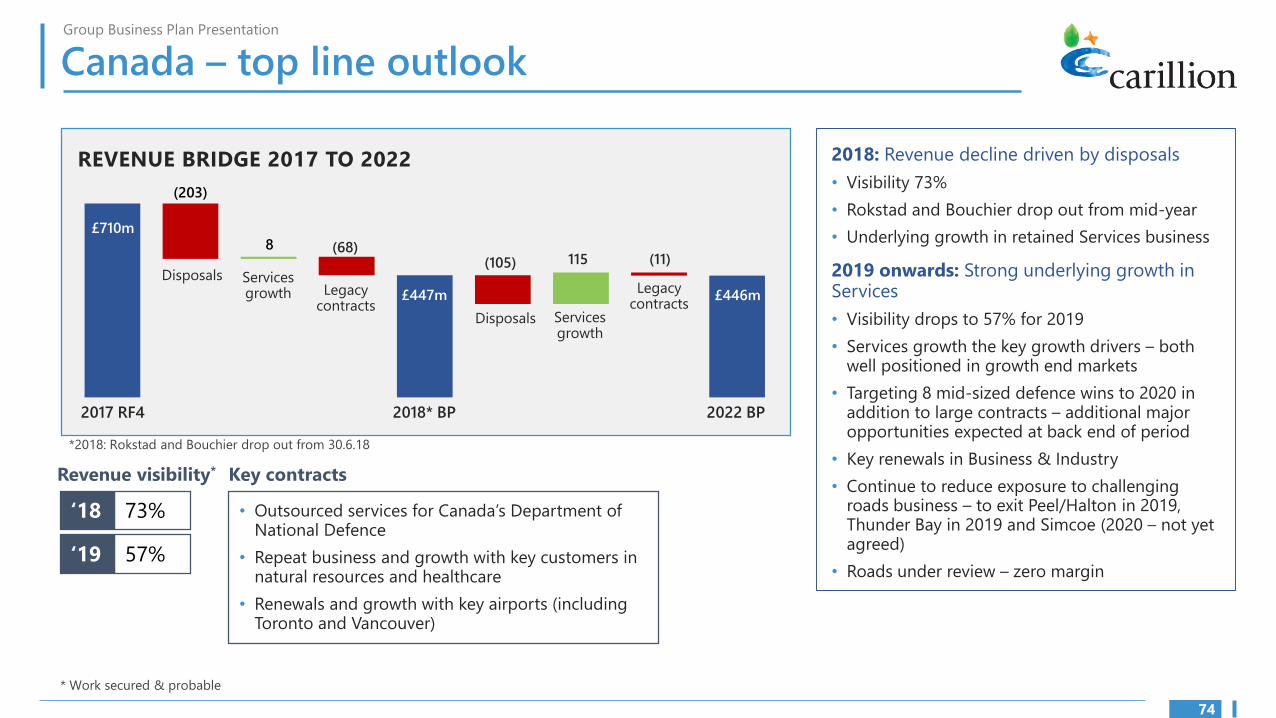
‘20
Group Business Plan Presentation
Canada – top line outlook
REVENUE BRIDGE 2017 TO 2022
(203)
£710m 8 (68)
115 (11) (105) Disposals Services
Legacy £447m Legacy growth contracts contracts
Disposals Services growth
2018: Revenue decline driven by disposals
• Visibility 73%
• Rokstad and Bouchier drop out from mid-year
• Underlying growth in retained Services business
2019 onwards: Strong underlying growth in Services
• Visibility drops to 57% for 2019
• Services growth the key growth drivers – both well positioned in growth end markets
• Targeting 8 mid-sized defence wins to 2020 in addition to large contracts – additional major opportunities expected at back end of period
• Key renewals in Business & Industry
• Continue to reduce exposure to challenging roads business – to exit Peel/Halton in 2019, Thunder Bay in 2019 and Simcoe (2020 – not yet agreed)
• Roads under review – zero margin
£446m
2017 RF4 2018* BP 2022 BP
*2018: Rokstad and Bouchier drop out from 30.6.18
Revenue visibility* Key contracts
‘18 73%
‘19 57%
• Outsourced services for Canada’s Department of National Defence
• Repeat business and growth with key customers in natural resources and healthcare
• Renewals and growth with key airports (including Toronto and Vancouver)
* Work secured & probable
74
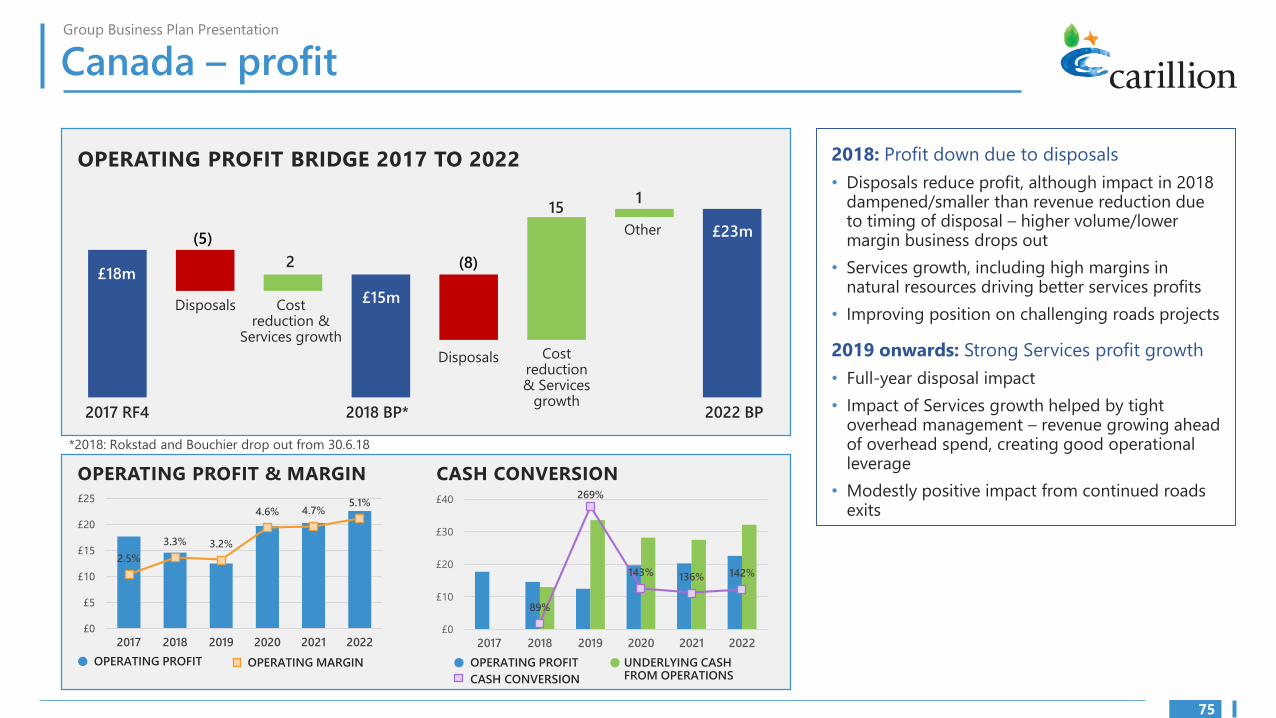
Group Business Plan Presentation
Canada – profit
OPERATING PROFIT BRIDGE 2017 TO 2022
1 15
Other (5)
£18m 2 (8)
Disposals Cost reduction &
Services growth Cost
£15m
Disposals reduction & Services
growth
£23m
2017 RF4 2018 BP* 2022 BP
*2018: Rokstad and Bouchier drop out from 30.6.18
OPERATING PROFIT & MARGIN CASH CONVERSION 269% £25 £405.1%
4.6% 4.7% £20
2.5%
£30 3.3% 3.2%
£15
£20 £10
£10£5
£0 £0
89%
143% 136% 142%
2017 2018 2019 2020 2021 2022 2017 2018 2019 2020 2021 2022
OPERATING PROFIT OPERATING MARGIN OPERATING PROFIT UNDERLYING CASH FROM OPERATIONS CASH CONVERSION
2018: Profit down due to disposals
• Disposals reduce profit, although impact in 2018 dampened/smaller than revenue reduction due to timing of disposal – higher volume/lower margin business drops out
• Services growth, including high margins in natural resources driving better services profits
• Improving position on challenging roads projects
2019 onwards: Strong Services profit growth
• Full-year disposal impact
• Impact of Services growth helped by tight overhead management – revenue growing ahead of overhead spend, creating good operational leverage
• Modestly positive impact from continued roads exits
75

Group Business Plan Presentation
Canada – cash
2018:
• Union Station and Bremner hold back and settlement in 2018 therefore no net impact
• Ontario Roads, Corporate Overhead and Legacy costs are reflected as outflows in line with the costs included in the model
• Arbitration for MLP assumed at end of 2018
2019 onwards:
• Ontario Roads, Corporate Overhead and Legacy costs are reflected as outflows in line with the costs included in the model
• Overarching assumption for Services – 100% cash backed profits through management of mobilization costs and contract negotiations
• 2019: cash conversion boosted by delayed recovery of Rokstad major project receipts
• Assume ability to continue to source operating leases for capital requirements
2.5%
89%
143% 136% 142%
OPERATING PROFIT & MARGIN CASH CONVERSION 269% £25 £405.1%
4.6% 4.7% £20
£30 3.3% 3.2%
£15
£20 £10
£10£5
£0 £0
2017 2018 2019 2020 2021 2022 2017 2018 2019 2020 2021 2022
OPERATING PROFIT OPERATING MARGIN OPERATING PROFIT UNDERLYING CASH FROM OPERATIONS CASH CONVERSION
76
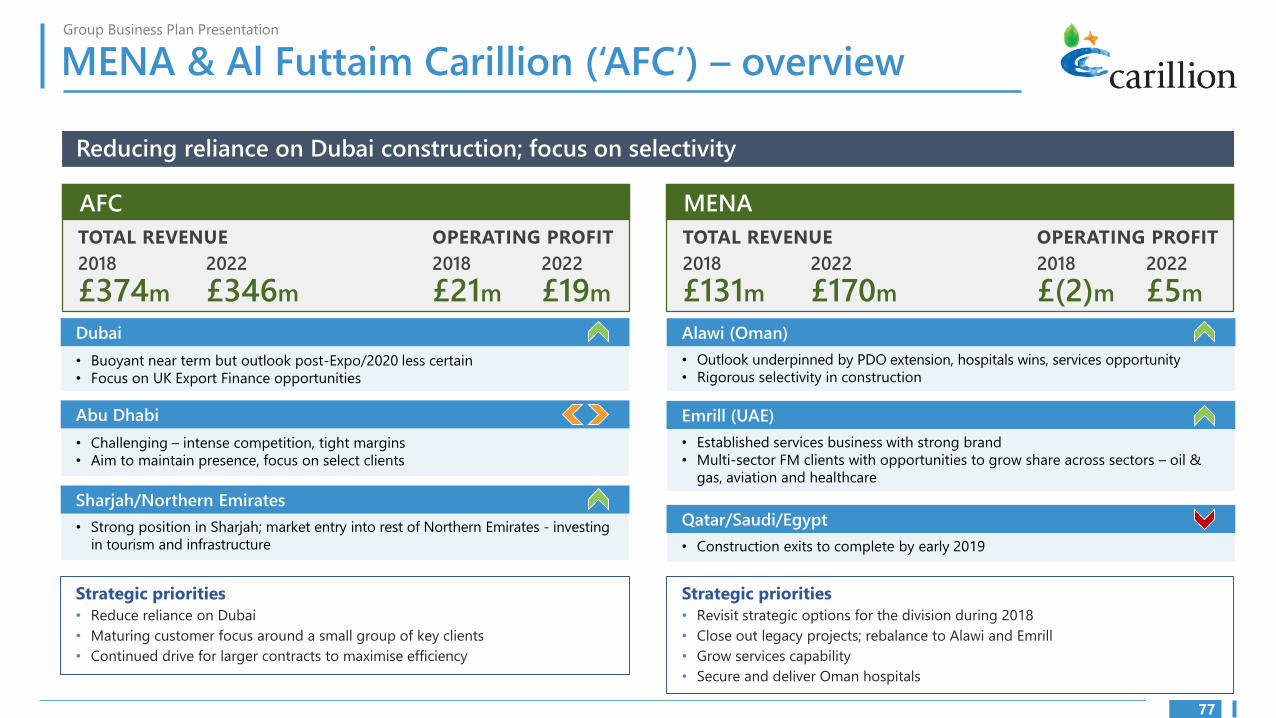
Group Business Plan Presentation
MENA & Al Futtaim Carillion (‘AFC’) – overview
Reducing reliance on Dubai construction; focus on selectivity
AFC
TOTAL REVENUE OPERATING PROFIT
2018 2022 2018 2022
£374m £346m £21m £19m
MENA
TOTAL REVENUE OPERATING PROFIT
2018 2022 2018 2022
£131m £170m £(2)m £5m
Dubai Alawi (Oman)
• Buoyant near term but outlook post-Expo/2020 less certain
• Focus on UK Export Finance opportunities
Abu Dhabi
• Challenging – intense competition, tight margins
• Aim to maintain presence, focus on select clients
Sharjah/Northern Emirates
• Strong position in Sharjah; market entry into rest of Northern Emirates - investing
in tourism and infrastructure
• Outlook underpinned by PDO extension, hospitals wins, services opportunity
• Rigorous selectivity in construction
Emrill (UAE)
• Established services business with strong brand
• Multi-sector FM clients with opportunities to grow share across sectors – oil &
gas, aviation and healthcare
Qatar/Saudi/Egypt
• Construction exits to complete by early 2019
Strategic priorities
• Reduce reliance on Dubai
• Maturing customer focus around a small group of key clients
• Continued drive for larger contracts to maximise efficiency
Strategic priorities
• Revisit strategic options for the division during 2018
• Close out legacy projects; rebalance to Alawi and Emrill
• Grow services capability
• Secure and deliver Oman hospitals
77
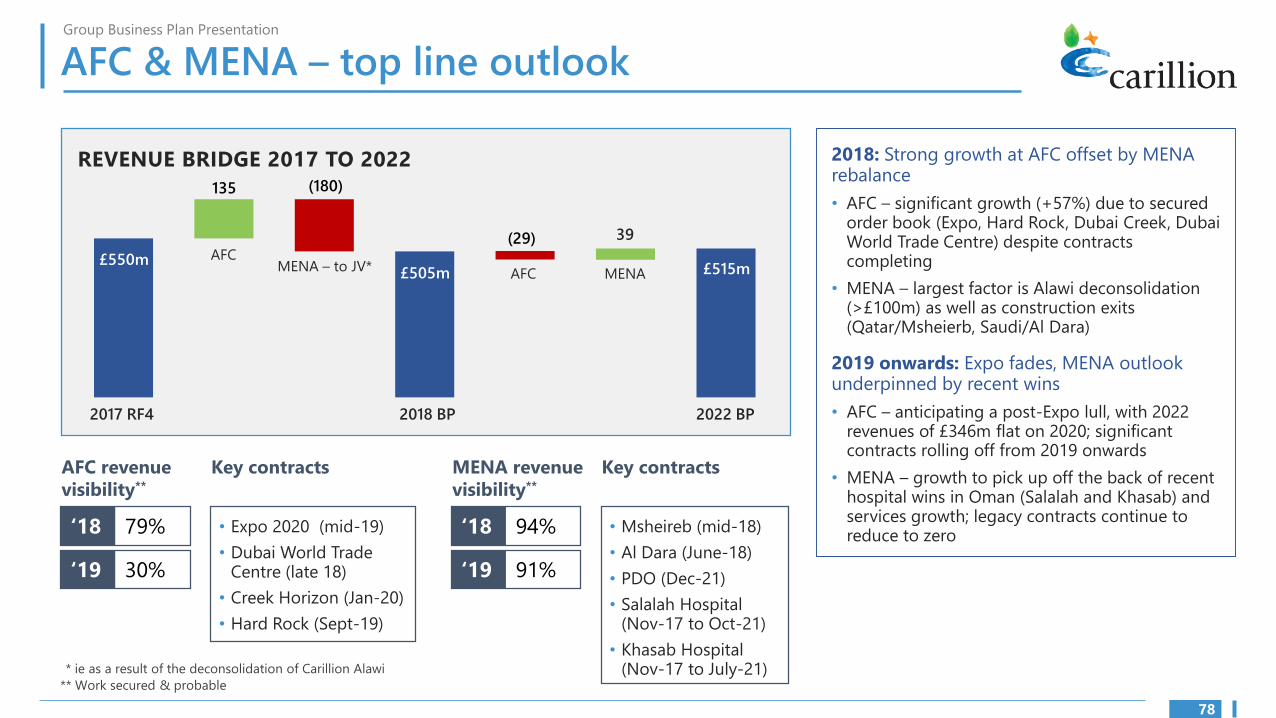
‘20
‘20
Group Business Plan Presentation
AFC & MENA – top line outlook
REVENUE BRIDGE 2017 TO 2022
135 (180)
£550m
39(29) AFC
MENA – to JV* £505m AFC MENA £515m
2017 RF4 2018 BP 2022 BP
AFC revenue Key contracts MENA revenue Key contracts
visibility** visibility**
‘18 79%
‘19 30%
• Expo 2020 (mid-19) ‘18 94%
‘19 91%
• Msheireb (mid-18)
• Dubai World Trade • Al Dara (June-18) Centre (late 18) • PDO (Dec-21)
2018: Strong growth at AFC offset by MENA rebalance
• AFC – significant growth (+57%) due to secured order book (Expo, Hard Rock, Dubai Creek, Dubai World Trade Centre) despite contracts completing
• MENA – largest factor is Alawi deconsolidation (>£100m) as well as construction exits (Qatar/Msheierb, Saudi/Al Dara)
2019 onwards: Expo fades, MENA outlook underpinned by recent wins
• AFC – anticipating a post-Expo lull, with 2022 revenues of £346m flat on 2020; significant contracts rolling off from 2019 onwards
• MENA – growth to pick up off the back of recent hospital wins in Oman (Salalah and Khasab) and services growth; legacy contracts continue to reduce to zero
• Creek Horizon (Jan-20) • Salalah Hospital • Hard Rock (Sept-19) (Nov-17 to Oct-21)
• Khasab Hospital * ie as a result of the deconsolidation of Carillion Alawi (Nov-17 to July-21)
** Work secured & probable
78

Group Business Plan Presentation
AFC & MENA – profit
OPERATING PROFIT BRIDGE 2017 TO 2022
£10m
14 (5) 7
(2)
MENA £19m
AFC MENA
AFC
£24m
2017 RF4 2018 BP 2022 BP
2018: Strong rebound at AFC drives profit
• AFC – operating profit rises to £21m (from £8m in 2017) off the back of significant revenue growth
• MENA – modest loss (£2m) for the year, driven by zero margin on large contracts completing (Msheireb, Al Dara, Kempinski)
2019 onwards: AFC stabilises, MENA picks up
• AFC – profits stabilise in line with volumes at c£19m
• MENA – steadily improves as new services contracts feed through to the bottom line and legacy contracts are closed out
OPERATING PROFIT & MARGIN CASH CONVERSION
OPERATING PROFIT (AFC) OPERATING MARGIN (AFC)
-2%
0%
2%
4%
6%
(£5)
£0
£5
£10
£15
£20
£25
2017 2018 2019 2020 2021 2022 -5000%
-4000%
-3000%
-2000%
-1000%
0%
1000%
-£60
-£40
-£20
£0
£20
£40
2017 2018 2019 2020 2021 2022
OPERATING PROFIT (MENA) OPERATING MARGIN (MENA)
OPERATING PROFIT (MENA)
UNDERLYING CASH FROM OPERATIONS (MENA)
CASH CONVERSION (MENA)
79

Group Business Plan Presentation
AFC & MENA – cash
2018:
• Assumed final settlement on Msheireb in August 2018 with a receipt of £39m and a 40% retention release of £11m offset by payments to the supply chain
• Outflow on Al Dara included of £14.9m in 2018
• Qatar assumes repayment of Alawi loan of £8m
• Emrill dividend to Group Services included at £1.6m in 2018
2019 onwards:
• Remaining 60% of Msheireb retention released in August 2019 and that this is paid out the subcontractor/supplier in 2019 with a total outflow of £67m
• Remaining £8m repayment of Alawi loan in Qatar included in 2019
• Emrill dividend assumed throughout plan period in line with profit generation at c£1.6m - £1.8m
• AFC dividend of £11.5m included in 2022
OPERATING PROFIT & MARGIN CASH CONVERSION
OPERATING PROFIT (AFC) OPERATING MARGIN (AFC)
-2%
0%
2%
4%
6%
(£5)
£0
£5
£10
£15
£20
£25
2017 2018 2019 2020 2021 2022 -5000%
-4000%
-3000%
-2000%
-1000%
0%
1000%
-£60
-£40
-£20
£0
£20
£40
2017 2018 2019 2020 2021 2022
OPERATING PROFIT (MENA) OPERATING MARGIN (MENA)
OPERATING PROFIT (AFC)
UNDERLYING CASH FROM OPERATIONS (AFC)
OPERATING PROFIT (MENA)
UNDERLYING CASH FROM OPERATIONS (MENA)
CASH CONVERSION (MENA)
80

I
Section 12 Sensitivities and opportunities
81
Group Business Plan Presentation
Sensitivities
Basis of analysis
• The Group has reviewed in detail the risks and opportunities in the Business Plan assumptions and carried out sensitivity analysis on the impact on EBITDA and underlying operating cash flow
• In performing this work, the Group has reviewed sales volumes, gross margin, pipeline, major contracts, large claim settlements and cost savings – a summary of the output is below
• It is considered highly unlikely that all of these risks and opportunities would materialise at the same time. Also, after the business is recapitalised, trading conditions should improve as confidence levels increase. For EBITDA and cashflow, we have therefore:
− Aggregated the downside sensitivities at 80% in FY18, reducing to 40% by December 2022
− Assumed upside sensitivities at 50% in FY18, increasing to 90% by 2022
• This tapering reflects more risk in the earlier years, reducing over time
82
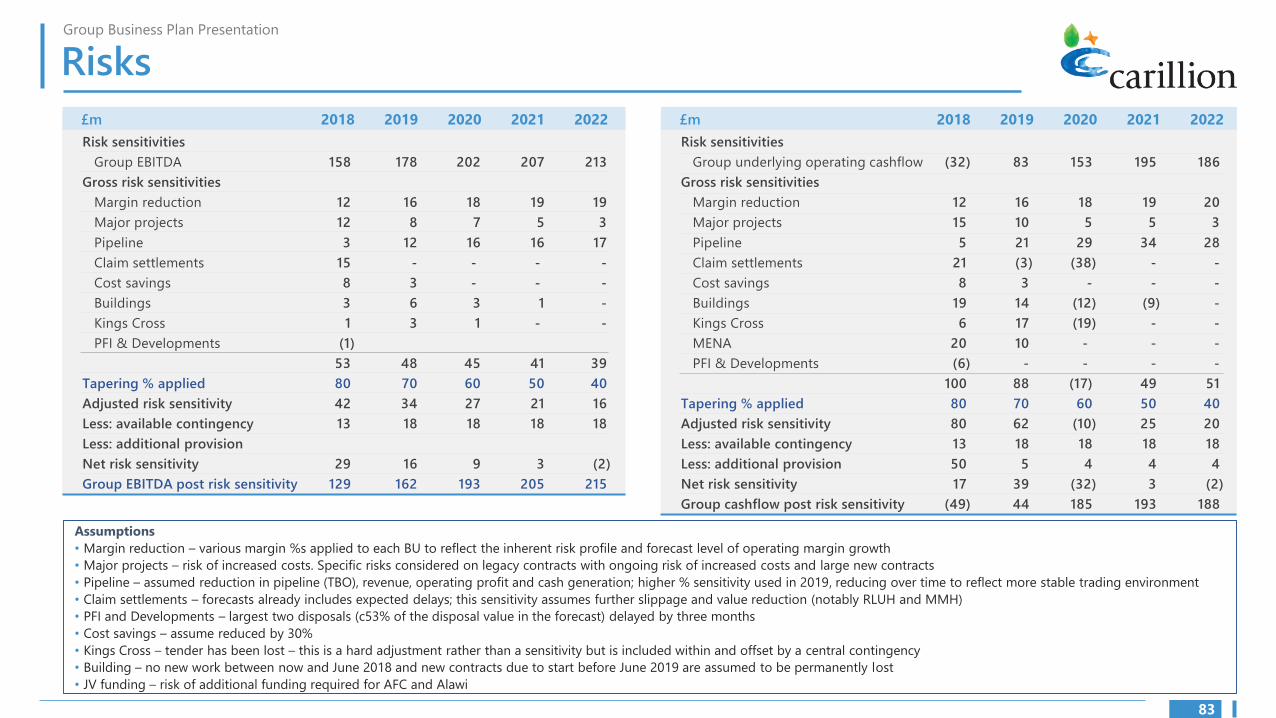
Group Business Plan Presentation
Risks
£m 2018 2019 2020 2021 2022
Risk sensitivities Risk sensitivities
Group EBITDA 158 178 202 207 213 Group underlying operating cashflow (32) 83 153 195 186
Gross risk sensitivities Gross risk sensitivities
Margin reduction 12 16 18 19 19 Margin reduction 12 16 18 19 20
Major projects 12 8 7 5 3 Major projects 15 10 5 5 3
Pipeline 3 12 16 16 17 Pipeline 5 21 29 34 28
Claim settlements 15 - - - - Claim settlements 21 (3) (38) - -
Cost savings 8 3 - - - Cost savings 8 3 - - -
Buildings 3 6 3 1 - Buildings 19 14 (12) (9) -
Kings Cross 1 3 1 - - Kings Cross 6 17 (19) - -
PFI & Developments (1) MENA 20 10 - - -
53 48 45 41 39 PFI & Developments (6) - - - -
Tapering % applied 80 70 60 50 40 100 88 (17) 49 51
Adjusted risk sensitivity 42 34 27 21 16 Tapering % applied 80 70 60 50 40
Less: available contingency 13 18 18 18 18 Adjusted risk sensitivity 80 62 (10) 25 20
Less: additional provision Less: available contingency 13 18 18 18 18
Net risk sensitivity 29 16 9 3 (2) Less: additional provision 50 5 4 4 4
Group EBITDA post risk sensitivity 129 162 193 205 215 Net risk sensitivity 17 39 (32) 3 (2)
Group cashflow post risk sensitivity (49) 44 185 193 188
£m 2018 2019 2020 2021 2022
Assumptions
• Margin reduction – various margin %s applied to each BU to reflect the inherent risk profile and forecast level of operating margin growth
• Major projects – risk of increased costs. Specific risks considered on legacy contracts with ongoing risk of increased costs and large new contracts
• Pipeline – assumed reduction in pipeline (TBO), revenue, operating profit and cash generation; higher % sensitivity used in 2019, reducing over time to reflect more stable trading environment
• Claim settlements – forecasts already includes expected delays; this sensitivity assumes further slippage and value reduction (notably RLUH and MMH)
• PFI and Developments – largest two disposals (c53% of the disposal value in the forecast) delayed by three months
• Cost savings – assume reduced by 30%
• Kings Cross – tender has been lost – this is a hard adjustment rather than a sensitivity but is included within and offset by a central contingency
• Building – no new work between now and June 2018 and new contracts due to start before June 2019 are assumed to be permanently lost
• JV funding – risk of additional funding required for AFC and Alawi
83

Group Business Plan Presentation
Opportunities £m 2018 2019 2020 2021 2022
Opportunities sensitivities Opportunities sensitivities
Group EBITDA 158 178 202 207 213 Group underlying operating cashflow (32) 83 153 195 186
Gross opportunities sensitivities Gross opportunities sensitivities
Buildings TBO pipeline - 2 3 3 4 Buildings TBO pipeline - 14 9 3 4
Infrastructure Aberdeen (AWPR) 7 - - - - Infrastructure Aberdeen (AWPR) 7 - - - -
Infrastructure rail volumes increased - 1 3 5 7 Infrastructure rail volumes increased - 1 3 5 7
Telent margin improvement 1 1 1 1 1 Telent margin improvement 1 1 1 1 1
Central Government TBO pipeline - 3 12 13 13 Central Government TBO pipeline - 3 12 13 13
Cost savings exceeded 15 25 25 25 25 Cost savings exceeded 15 25 25 25 25
Mshereib - 12 - - - Mshereib - 12 - - -
Buildings ERF facility utilisation - - - - - Buildings ERF facility utilisation 2 2 2 2 2
Other items 3 3 1 1 1 Other items 4 2 2 1 2
26 47 45 48 51 29 60 54 50 54
Tapering % applied 50 60 70 80 90 Tapering % applied 50 60 70 80 90
Adjusted opportunities sensitivity 13 28 32 38 46 Adjusted opportunities sensitivity 15 36 38 40 49
Group EBITDA post risk sensitivity 171 206 234 245 259 Group cashflow post risk sensitivity (17) 119 191 235 235
£m 2018 2019 2020 2021 2022
Assumptions
• Building TBO pipeline – revenues increase by 10% from 2019
• Infrastructure/AWPR – increased lane occupation and claim recovery (£2m recovery for lane occupation charges; £5m from claim against Transport Scotland
• Infrastructure/Rail – increased rail volumes, leveraging strong relationship with Network Rail to bid and win an additional £100m revenue at 7% margin from 2019 onwards
• Carilliontelent margin improvement – Gigaclear margin improves through contract efficiencies
• Central Government TBO pipeline – win rate increases to closer to historic rate (37.5% versus business plan of 25% and historic rate of 50%)
• Msheireb – 25-40% saving from sub contractor base as a result of final settlement in 2019
• Cost savings – strength target achieved, resulting in profit/cash upside of £15m in 2018, increasing to £25m thereafter
• Building – ERF utilisation – assume BU able to increase utilisation resulting in £2m benefit from 2018 onwards
84

I
Section 13 Summary
85

Group Business Plan Presentation
Summary
Our vision is to be the trusted partner for delivering and maintaining critical infrastructure and services that
bring lasting benefits to our customers and communities whilst generating sustainable cash backed profits
Our strengths Our priorities
• Strong brand with leading market positions including in growth markets such as rail, roads and digital
• Deep, long term customer relationships, working as a trusted partner with high levels of repeat business
• Broad customer base with exposure to a mix of blue chip and government backed contracts
• Our greatest asset – our people: 45,000 people in the UK, Middle East and Canada
• Revenue visibility with a £12.9bn order book and 2018 revenue visibility of 75% (2019 48%)
• Industry leadership in Health and Safety
• Successfully restructure the debt of the Group, and complete disposals
• More robust risk and governance framework ensure the centres of excellence support the business to achieve better outcomes
• Deliver successful mobilisations on Hestia and Gigaclear
• Deliver cost savings of £100m by the end of 2018
• Robust and sustainable profits built on underlying performance
• Cash – collect on legacy claims and underlying cash conversion of c100%
• Improved management incentive scheme which drives accountability
• Revenue growth, particularly in Infrastructure and Canada Services
• Key contract replacements and renewals, particularly in Building and Central Government
86
We will deliver a recovery plan with strong growth in profit, margins and cash

I
Appendix 1 Additional financial information
87

Group Business Plan Presentation
2017-2022 by BU
FY REVENUE FY OPERATING PROFIT FY OPERATING MARGIN %
Central Government
Corporate and Regions
Infrastructure
Building (inc CTS and TPS)
MENA
Al Futtaim JV
Canada
Developments
Private Finance
Group Services
Group Adjustments
TOTAL GROUP
£m 2017
RF4
646.7
748.1
831.3
937.0
310.8
238.7
709.8
53.8
220.3
121.8
(79.0)
BUSINESS
744.9
688.4
770.4
764.3
130.7
373.9
446.7
11.4
74.6
140.5
(188.0)
2018
PLAN
797.7
613.4
833.5
673.5
141.6
366.9
394.8
28.0
6.2
141.4
(189.1)
2019
760.3
607.7
919.2
687.3
153.5
345.7
423.7
19.2
6.2
143.3
(223.8)
2020
788.0
614.8
950.0
737.9
170.8
345.7
431.9
35.7
17.2
144.5
(246.3)
2021
755.8
655.0
975.8
727.6
169.7
345.7
446.2
23.2
31.9
147.9
(328.4)
2022
26.0
35.2
30.2
14.7
2.4
7.5
17.7
8.7
9.1
(12.2)
15.7
2017
RF4
19.0
41.7
28.7
11.1
(2.2)
21.0
14.6
0.7
22.9
(13.8)
(12.8)
BUSINESS
2018
25.5
44.0
34.5
12.0
1.2
18.5
12.5
0.9
(3.7)
(2.7)
6.9
PLAN
2019
32.7
42.3
42.0
10.7
2.9
18.7
19.7
0.5
(1.9)
0.3
5.8
2020
37.1
42.0
43.5
13.6
4.9
18.7
20.3
1.7
(1.9)
4.3
(5.2)
2021
40.7
44.8
46.2
10.9
4.8
18.7
22.6
2.1
(1.9)
1.8
(6.0)
2022
4.0%
4.7%
3.6%
1.6%
0.8%
3.1%
2.5%
-
-
-
-
2017
RF4
2.5%
6.1%
3.7%
1.5%
(1.7%)
5.6%
3.3%
-
-
-
-
BUSINESS
2018
3.2%
7.2%
4.1%
1.8%
0.9%
5.0%
3.2%
-
-
-
-
PLAN
2019
4.3%
7.0%
4.6%
1.6%
1.9%
5.4%
4.7%
-
-
-
-
2020
4.7%
6.8%
4.6%
1.8%
2.9%
5.4%
4.7%
-
-
-
-
2021
5.4%
6.8%
4.7%
1.5%
2.9%
5.4%
5.1%
-
-
-
-
2022
4,739.3 3,957.9 3,808.0 3,842.2 3,990.2 3,950.5 155.0 130.8 149.6 173.8 179.0 184.7 3.3% 3.3% 3.9% 4.5% 4.5% 4.7%
88
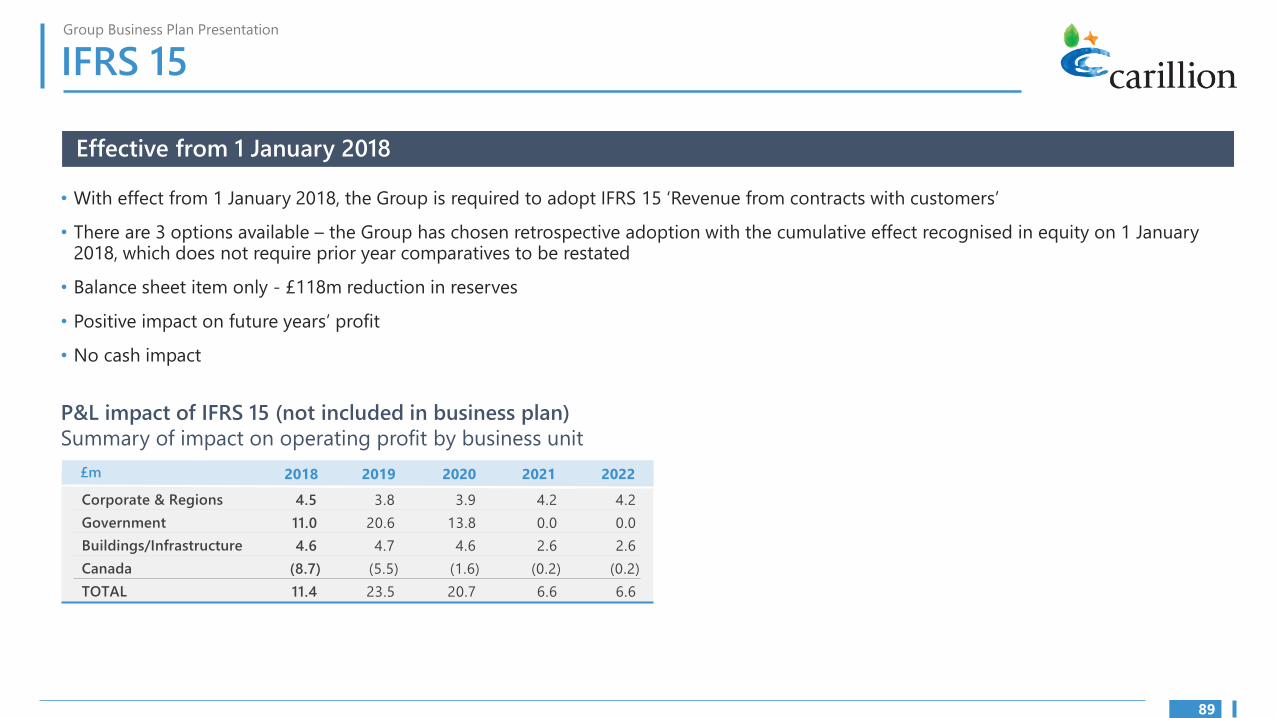
Group Business Plan Presentation
IFRS 15
Effective from 1 January 2018
• With effect from 1 January 2018, the Group is required to adopt IFRS 15 ‘Revenue from contracts with customers’
• There are 3 options available – the Group has chosen retrospective adoption with the cumulative effect recognised in equity on 1 January 2018, which does not require prior year comparatives to be restated
• Balance sheet item only - £118m reduction in reserves
• Positive impact on future years’ profit
• No cash impact
P&L impact of IFRS 15 (not included in business plan)
Summary of impact on operating profit by business unit
£m 2018 2019 2020 2021 2022
Corporate & Regions 4.5 3.8 3.9 4.2 4.2
Government 11.0 20.6 13.8 0.0 0.0
Buildings/Infrastructure 4.6 4.7 4.6 2.6 2.6
Canada (8.7) (5.5) (1.6) (0.2) (0.2)
TOTAL 11.4 23.5 20.7 6.6 6.6
89

Group Business Plan Presentation
Early Payment Facility
EPF UTILISATION AS PER BUSINESS PLAN
£m
EPF
UK REVENUE
0
50
100
150
200
250
300
350
400
2017 2018 2019 2020 2021 2022
• EPF to drop off in Building as volumes decline (and unwind of Battersea, Liverpool, Irish Schools) through end of 2017/early 2018
• To be broadly compensated by onboarding of additional suppliers in services, particularly Corporate & Regions
EPF - Building vs rest of Group Oct 2017 Dec 2017 Mar 2018 Jun 2018 Dec 2018 Dec 2019 Dec 2020 Dec 2021 Dec 2022
Building 252 214 180 176 172 157 162 175 186
Rest of Group 119 120 127 140 142 153 162 165 170
90

I
Appendix 2 Board and management
91

Group Business Plan Presentation
Board
Board refreshed – 4 appointments since July, Andrew Davies to join 22 January
Chairman
Philip Green
SID
Sally Morgan
Interim CEO
Keith Cochrane
New appointments
Andrew Davies - CEO Sally Morgan
• Chief Executive of Wates Group • Currently NED of Countryand NED of Chemring plc Properties plc
side
• Wates – hired for turnaround • Former NED at Dixons and growth; took revenues Carphone plc from £1bn to £1.5bn (over 3 • From 2001-05, director of years). Extensive earlier career government relations at at BAE Systems 10 Downing Street • Brings executive, strategic and
turnaround skills as well as experience of complex contracting in projects, support services and construction
Audit Chair
Andrew Dougal
Audit Chair designate
Justin Read
NED
Alan Lovell
NED
Alison Horner
Alan Lovell Justin Read
• Currently Chairman of the • Currently NED of Ibstock plc Consumer Council for Water and Grainger plc; Chairman of and Flowgroup plc Segro Pension Scheme
• Formerly CEO at Infinis, Costain Trustees Limited
Group, Jarvis plc • Formerly Group FD at Segro
• Extensive restructuring (2011-16), Group FD at
experience working with Speedy Hire (2008-11)
companies at times of financial stress and in turnaround
• Further executive appointments from the Group Executive to the Board to be considered in due course
• Keith Cochrane and Andrew Dougal will step down during 2018
92

Group Business Plan Presentation
Group Executive
Smaller, more effective Group Executive strengthened through new appointments
GROUP EXECUTIVE
COO CFO CHRO Director of Legal CTO*
Interim CEO
Head of Bus. Improvement*
* CTO and Head of Business
Improvement are
temporary roles
COO Andy Jones
• From 1 Oct 2017
• Latterly President & CEO, Carillion Canada
• Joined Carillion 2001 – earlier roles include MD, Carillion MENA
CFO Emma Mercer
• Appointed Sept 2017
• Joined Carillion in 2008 and has held several senior Finance roles
• Prior roles – FD, UK Construction and CFO & SVP Carillion Canada
CHRO Janet Dawson
• Appointed in 2013
• With the Group for 18 years
• Previously Head of Reward
Legal & Co Sec Richard Tapp
• In role since 2002
• Previously Company Secretary & Group Legal Adviser at Blue Circle Industries plc
CTO Lee Watson
• Appointed Sept 2017
• Temporary role
• EY partner (since 2008) on secondment
• Significant UK corporate restructuring and turnaround experience
Head of Business Improvement Donald Muir
• From Nov 2017
• Track record of driving change in organisations facing challenging circumstances (inc Cable & Wireless, NHS)
A simpler delayered organisation with greater line of sight accountability
93

Group Business Plan Presentation
Our Business Leaders
New Managing Directors – in role from October 2017
Infrastructure
Mark Davies
• Previously MD, Carillion Infrastructure
• Earlier career in the construction sector – joined McAlpine in 2004 (acquired by Carillion in 2008)
• Fellow of the Institute of Civil Engineers, Royal Institute of Chartered Surveyors and Chartered Management Institute
Central Government
Richard Lumby
• Has led Carillion’s defence and security portfolio since 2002, extended to MoJ, Home Office and the Cabinet Office with appointment to current role
• Chartered Civil Engineer
Corporate & Regions
Daniel Easthope
• Previously MD (from 2013) for CarillionAmey, our JV responsible for maintaining the vast majority of the UK’s defence estate
• Over 20 years experience in the facilities management and construction sectors
• Joined Tarmac in 1996
• BSc (Hons) Quantity Surveying
Building
Khalid Nawaz
• Previously FD for the Middle East and Carilliontelent.
• Joined Carillion in 2009, almost 10 years of construction experience
• Has worked across the Carillion business in the UK and Middle East.
• Chartered Accountant who spent his earlier career at Deloitte where he was a Director
International
Simon Buttery
• Latterly MD for Carillion’s Middle East & North Africa business and prior to this, President & Chief Executive of Carillion Canada
• Extensive experience in both the construction and support services sectors
• Chartered Construction Engineer
94

Group Business Plan Presentation
Our Centres of Excellence heads
New Centres of Excellence heads
Work winning
Peter Forsyth
• In role since October 2017
• Over 30 years in construction with 20 plus years in a work winning capacity covering UK and International bidding in construction and services environments
• Joined Wimpey in 1984 (which became part of Tarmac in 1996), and spent his earlier career in project management and technical services
Mobilisation/Demobilisation
Helen Jones
• In role since October 2017
• Chartered Engineer who has worked across every Carillion UK business unit over the last 15 years a number of Group services functions
• Proven track record in operational delivery, mobilisations, programme management and stakeholder engagement
Operational Excellence
Sam Barnes
• In role since December 2017
• New recruit following successful role leading transformation at Barratt Developments, Morgan Sindall and Travis Perkins
• Lean Six Sigma Master Black Belt, Certified Programme Manager and Change Practitioner
• 20 plus years experience in change and improvement.
Contract Management
Matthew Ashwell
• In role since October 2017
• 15 year qualified Construction and Engineering disputes lawyer with a background in private practice and in house for Carillion and Balfour Beatty
• Has also held senior Commercial Director and Operational roles most recently as Chief Operating Officer for the Middle East
• Brings a range of experience across our operating sectors and territories
95

I
Appendix 3 Centres of Excellence
96
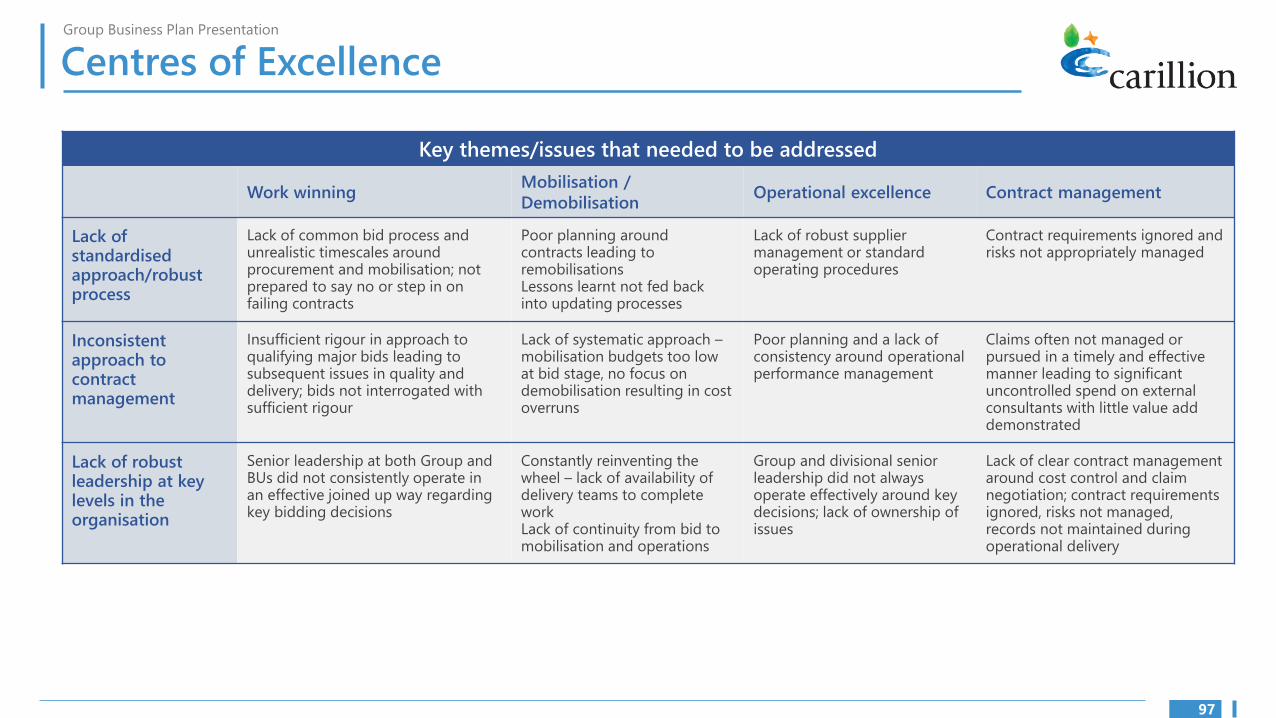
Group Business Plan Presentation
Centres of Excellence
Key themes/issues that needed to be addressed
Work winning Mobilisation /
Demobilisation Operational excellence Contract management
Lack of standardised approach/robust process
Lack of common bid process and unrealistic timescales around procurement and mobilisation; not prepared to say no or step in on failing contracts
Poor planning around contracts leading to remobilisations Lessons learnt not fed back into updating processes
Lack of robust supplier management or standard operating procedures
Contract requirements ignored and risks not appropriately managed
Inconsistent approach to contract management
Insufficient rigour in approach to qualifying major bids leading to subsequent issues in quality and delivery; bids not interrogated with sufficient rigour
Lack of systematic approach – mobilisation budgets too low at bid stage, no focus on demobilisation resulting in cost overruns
Poor planning and a lack of consistency around operational performance management
Claims often not managed or pursued in a timely and effective manner leading to significant uncontrolled spend on external consultants with little value add demonstrated
Lack of robust leadership at key levels in the organisation
Senior leadership at both Group and BUs did not consistently operate in an effective joined up way regarding key bidding decisions
Constantly reinventing the wheel – lack of availability of delivery teams to complete work Lack of continuity from bid to mobilisation and operations
Group and divisional senior leadership did not always operate effectively around key decisions; lack of ownership of issues
Lack of clear contract management around cost control and claim negotiation; contract requirements ignored, risks not managed, records not maintained during operational delivery
97

Group Business Plan Presentation
Centres of Excellence
98
Actions being taken to adopt lessons learnt
Work winning Mobilisation/
Demobilisation Operational excellence Contract management
Lack of standardised approach/robust process
Inconsistent approach to contract management
Lack of robust leadership at key levels in the organisation
New leaders in place
More stringent selectivity bidding criteria aligned to revised strategy, picking up previous points of failure eg resource availability
Major Projects Committee (MPC) approach to work winning being re-engineered to increase effectiveness; MPC refocused onto riskier opportunities – fewer things with more rigour; additional hurdle prior to contract signature to ensure all MPC sanctions discharged
Common bid process across the Group overseen by BU management teams
Peter Forsyth
Centralised team adopting a consistent approach and rigorously monitoring mobilisation to ensure mobilisation completes when project achieves its target operating model
Bid to mobilise transfer now much more robustly managed and controlled – facilitated handover sessions from bid to mobilisation to delivery to ensure information transfer Earlier focus on demobilisation to avoid cost overruns & cash lock up
Ensure mobilisation procedures fully addressed and scrutinised by the MPC – mobilisation decisions around people, plan and budget to be taken at bid stage
Helen Jones
Standard operating procedures in the process of being developed; training/systems being rolled out
Effective tools and training now refreshed and improved to include problem solving and root cause analysis training and Visual Management tools
Consistent approach to work planning and monitoring across the Group with evidence of Visual Management at site around Programme and Quality Plan
Sam Barnes
Rigorous focus on adherence to contract requirements and terms/conditions
Established senior contract management team to oversee performance; claims minimised through rigorous and consistent adherence to contract requirements; contemporaneous records to ensure claims are pursued from a position of strength
Contract management team will have specific responsibility around claims and risk environment
Matthew Ashwell
I
Appendix 4 Business Plan – approach & methodology
99
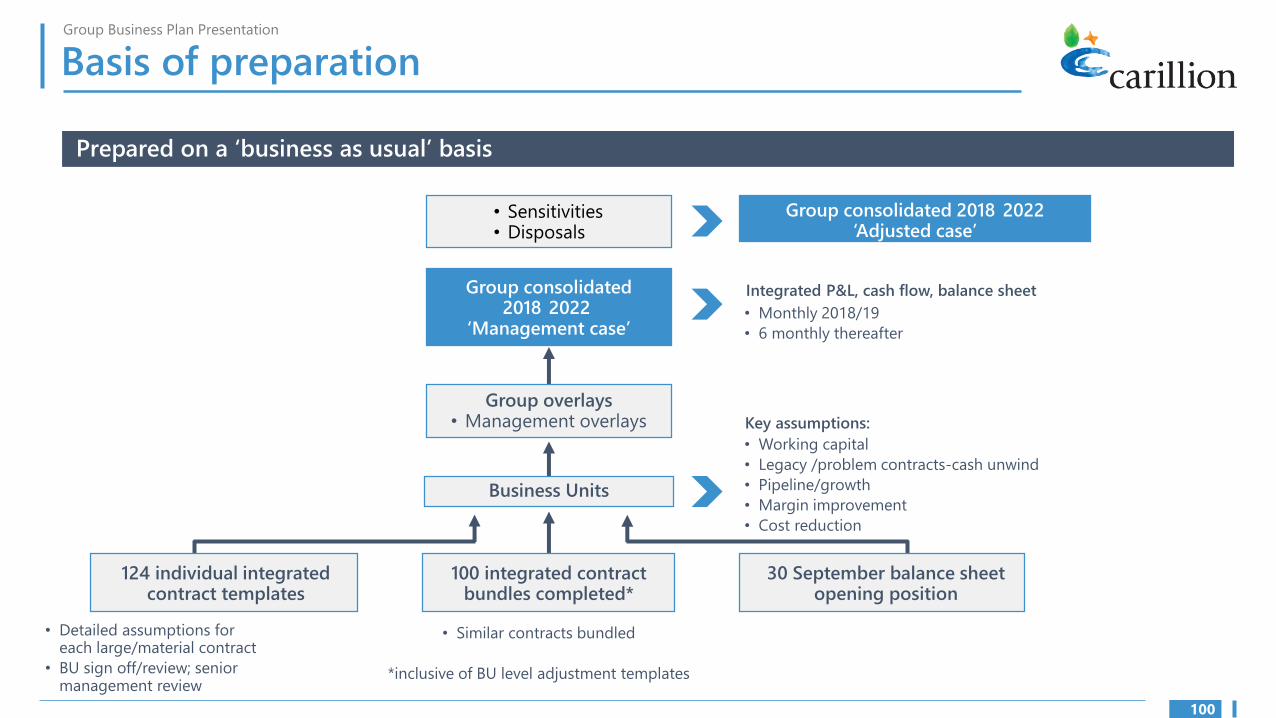
-
-
Group Business Plan Presentation
Basis of preparation
Prepared on a ‘business as usual’ basis
• Sensitivities • Disposals
Group consolidated 2018 2022 ‘Adjusted case’
Group consolidated 2018 2022
‘Management case’
Group overlays • Management overlays
Business Units
Integrated P&L, cash flow, balance sheet
• Monthly 2018/19
• 6 monthly thereafter
Key assumptions:
• Working capital
• Legacy /problem contracts-cash unwind
• Pipeline/growth
• Margin improvement
• Cost reduction
124 individual integrated contract templates
• Detailed assumptions for each large/material contract
• BU sign off/review; senior management review
100 integrated contract bundles completed*
30 September balance sheet opening position
• Similar contracts bundled
*inclusive of BU level adjustment templates
100


