50


A Full House of OpportunitiesA Full House of OpportunitiesA Full House of Opportunities
Fred WattFred WattGroup Finance DirectorGroup Finance Director

Slide 3
A Full House of Opportunities
What Does This Mean For RBS?
▮ Opportunities to:
– Grow income organically
– Improve efficiency
– Make acquisitions if they are value enhancing

Slide 4
A Full House of Opportunities
Not New for RBS
▮ Our goal has been and remains to generate superiorsustainable value for our shareholders
▮ To create value for our shareholders on a sustainablebasis you need to be able to grow income on a basisthat is:– Efficient
– Profitable
– Capable of repeating

Slide 5
A Full House of Opportunities
What Does This Mean For RBS?
▮ Opportunities to:
– Grow income organically
– Improve efficiency
– Make acquisitions if they are value enhancing

Slide 6
A Full House of Opportunities
Income Growth
▮ A key driver of sustainable value creation
▮ Consistent focus required

Slide 7
Income Growth
0 5 10 15 20
RBS
Bank of Scotland
Abbey National
HSBC
Standard Chartered
Halifax
Woolwich
Lloyds TSB
Barclays
NatWest
Alliance & Leicester
% paIncome excluding exceptional items
UK Banks Average Growth in Income 1992 – 1999

Slide 8
-10 -5 0 5 10 15 20
HSBC
RBS
HBOS
Barclays
Standard Chartered
Lloyds TSB
Alliance & Leicester
Abbey National
Income Growth
% pa
UK Banks Average Growth in Income 1999 – 2003
Income excluding exceptional itemsRBS includes NatWest on a pro forma basisHSBC including Household (not pro forma)
Slide 9
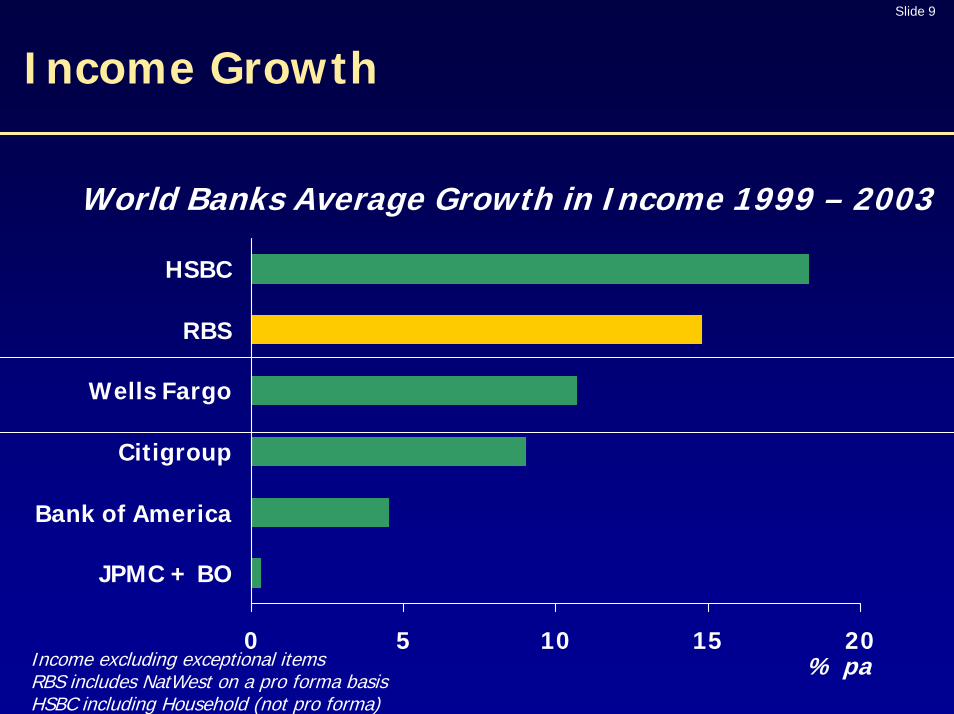
Income Growth
0 5 10 15 20
HSBC
RBS
Wells Fargo
Citigroup
Bank of America
JPMC + BO
World Banks Average Growth in Income 1999 – 2003
% paIncome excluding exceptional itemsRBS includes NatWest on a pro forma basisHSBC including Household (not pro forma)

Slide 10
Income Momentum
-20
0
20
40
60
80
100
1999 2000 2001 2002 2003
HSBC
RBS
Wells FargoCitigroup
Bank of America
World Banks Percentage Growth in Income from 1999%
Income excluding exceptional itemsRBS includes NatWest on a pro forma basisHSBC including Household (not pro forma)

Slide 11
Organic Income Growth
Key Attributes For RBS
▮ Multi-brand, multiple channel
▮ Single platform
▮ Large distribution capacity
▮ Low market shares
▮ Profitable new businesses
▮ Diversity of income
▮ Geographical options for growth
▮ A major contributor to RBS income growth

Slide 12
Multi-Brand, Multiple Channel

Slide 13
Multi-Brand, Multiple Channel
▮ Appeals to different customer groups
▮ Allows different product variants, pricing
▮ Gives flexibility for future
▮ Allows management flexibility

Slide 14
Single Platform
• Large Corporates - RBS• Mid Corporates and
Commercials-RBS/NW• Treasury - RBS• Greenwich Capital (US)• Lombard• Angel Trains• Specialist Businesses
• RBS Cards• NatWest Cards• RBS Advanta• Joint Ventures• DLFS• Lombard Direct• Direct Bank• Internet Platform
WealthManagement
MANUFACTURING
CUSTOMERSCUSTOMERS
CitizensRBSInsurance
RetailDirect
RBS CBFMNatWest UlsterBank
• Coutts• Adam• NatWest Offshore• RBSI
• Direct Line• Churchill• NIG• International
• Personal• Small Business• RSA
• Personal• Small Business• NW Life
• Ulster Bank• First Active• Personal• Business• Corporate
• Personal• Business• Commercial
Technology Operations Services
Slide 15
Single Platform
▮ Scale
▮ Specialisation
Enable us to
▮ Implement new technologies across the Group
▮ Deliver cost savings associated with acquisitions
▮ Economies of scale, benefits of specialisation
Slide 16
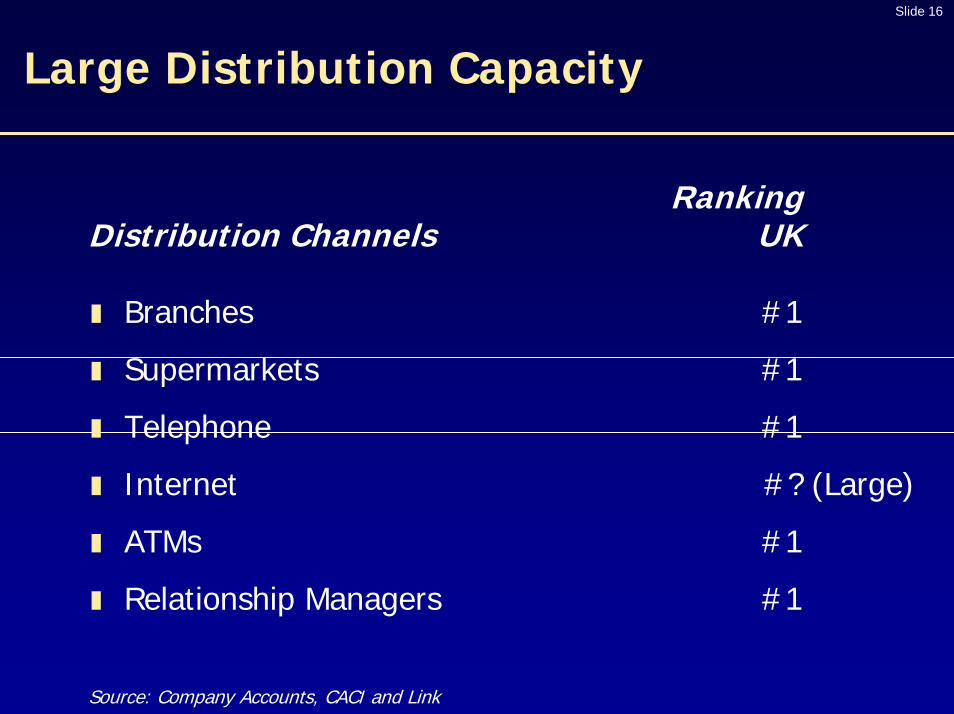
Large Distribution Capacity
RankingDistribution Channels UK
▮ Branches #1
▮ Supermarkets #1
▮ Telephone #1
▮ Internet #? (Large)
▮ ATMs #1
▮ Relationship Managers #1
Source: Company Accounts, CACI and Link

Slide 17
Low Market Shares
UK Market Shares Total RBS
Current accounts 20%Savings accounts 8%Personal loans 10%Mortgages 5%Credit cards 15%Life insurance 2%Motor insurance 16%Home insurance 13%Small business relationships 29%Corporate lead relationships 32%Source: NOP 2003, NFO 2003, RBS estimates

Slide 18
Profitable New Businesses
Examples of UK Financial Commenced Profit/(Loss)Services New Entrants 2003Scottish Widows Bank 1995 £17mGoldfish 1996 (£30m)The One Account 1997 £23mSainsbury’s Bank 1997 £22mTesco Personal Finance (RBS JV) 1997 £173mEgg 1998 (£34m)Standard Life Bank 1998 £5mDirect Line Rescue 1998 £31mMarbles 1999 not reportedSmile 1999 not reportedCahoot 2000 (£15m)Intelligent Finance 2000 (£53m)Zurich Bank 2001-03 Closed Mar 03Profit/(loss) before exceptional items

Slide 19
Diversity of Income
Overseas21%
Corporate Banking36%
RBS Income 2003
UK Personal27%
Insurance16%

Slide 20
Diversity of Income
Net Interest Income 43%
Non-Interest Income 57%
Deposits20%
Assets23%
RBS Income Mix 2003

Slide 21
Diversity of Income
Net Interest Income% of Total Income
2003
Personal deposits 11%
Personal lending 12%
Business deposits 9%
Business lending 11%
Net interest income to total income 43%

Slide 22
Diversity of Income
▮ Not too dependent on personal lending
UK Non- % of TotalUK Income 2003
Consumer finance 7% 1% 8%
Mortgages 3% 1% 4%
Personal lending 10% 2% 12%

Slide 23
Diversity of Income
Non-Interest Income % of Total Income
2003
Net fees and commissions 23%– Money transmission and lending 12%– Cards related 4%– Other 7%
General insurance premium income 16%
Dealing profits (before associated costs) 9%
Other operating income 9%
Non-interest income to total income 57%

Slide 24
Diversity of Income
RBS Profit Before Tax 2003
Rest of World 2%
UK 74%
Europe 5%
US 19%

Slide 25
Geographical Options for GrowthContinental Europe
Spain• CBFM• RBS Insurance (JV)• 65 employees
France• CBFM• 240 employees
Belgium• Retail Direct• 70 employees
Netherlands• Retail Direct• 180 employees
Germany• CBFM• Retail Direct• RBS Insurance• 755 employees
Switzerland• Wealth Management• 730 employees
Italy• CBFM• RBS Insurance• 750 employees
United Kingdom• CBFM for
European customers
Austria• Retail Direct• 2 employees
Gibraltar• Wealth Management• 130 employees
Greece• CBFM• 70 employees
Sweden• CBFM• 30 employees
2003 Income: £0.6bn Customers: 3.6m Employees: 3,020

Slide 26
Geographical Options for GrowthContinental Europe
Income 2003 2002 Change£m £m %
Corporate Banking andFinancial Markets 182 128 +42%
RBS Insurance 160 85 +88%
Wealth Management 105 85 +24%
Retail Direct 84 55 +53%
Central items 23 22
Continental Europe 554 375 +48%

Slide 27
Geographical Options for GrowthUnited States
Greenwich• CBFM• 680 employees
Mid Atlantic• Citizens• 5,300 employees
New England• Citizens,
Retail Direct• 9,310 employees
New York• CBFM for US customers• 375 employees
2003 Income: £2.9bn Customers: 3.7m Employees: 15,660

Slide 28
Geographical Options for GrowthUnited States
Income 2003 2002 Change$m $m %
Citizens 2,984 2,578 +16%
Corporate Banking andFinancial Markets 1,581 1,276 +24%
United States 4,565 3,854 +18%

Slide 29
Organic GrowthA Major Contributor
RBS Income Growth
Pro forma 1999 2003 Change over 4 Yrs£m £m £m %
Total income 11,065 19,229 8,164 +74%
Components of Income Growth £m % Total
NatWest transaction benefits 872 11%
Other acquisitions 1,865 23%
Organic growth 5,427 66%
Total 8,164 100%

Slide 30
A Full House of Opportunities
What Does This Mean For RBS?
▮ Opportunities to:
– Grow income organically
– Improve efficiency
– Make acquisitions if they are value enhancing

Slide 31
40
45
50
55
60
HSBC RBS Barclays HBOS Lloyds TSB99 00 0102 03 99 00 0102 03 99 00 0102 03 99 00 0102 03 99 00 0102 03
Cost:income ratios as reported by banks, or based on income and costs reported by banksHSBC including HouseholdRBS: netting operating lease depreciation against rental income
Cost:Income Ratio 1999-2003%
Improve Efficiency

Slide 32
40
45
50
55
60
65
Citigroup HSBC Bank ofAmerica
Wells Fargo RBS
Cost:Income Ratio 1999-2003%
99 00 0102 03 99 00 0102 03 99 00 0102 03 99 00 0102 03 99 00 0102 03
Cost:income ratios as reported by banks, or based on income and costs reported by banksHSBC including HouseholdRBS: netting operating lease depreciation against rental income
Improve Efficiency

Slide 33
Improve Efficiency
Outlook
▮ Group-wide programme of initiatives
▮ Managed like NatWest integration
▮ No ‘below the line’ costs
▮ Three year programme 2003 – 2005

Slide 34
Improve Efficiency
Outlook
2003 Break-even
2004 Spend accelerates, but good payback
2005 Completion achieved, benefits in full flow
2006 Full annualised benefits delivered
▮ On current business mix, planned initiatives would takecost:income ratio below 40%

Slide 35
A Full House of Opportunities
What Does This Mean For RBS?
▮ Opportunities to:
– Grow income organically
– Improve efficiency
– Make acquisitions if they are value enhancing

Slide 36
Able to Make Good Acquisitions
▮ Expect to generate surplus capital
▮ Don’t need to make acquisitions
▮ Geographic options for acquisitions
▮ Track record of making good acquisitions
▮ Track record of successful integration of acquisitions
▮ Delivery of cost savings and revenue benefits

Slide 37
Acquisitions 2003-2004
Completed Acquisition Division Consideration (m)2003Jan Commonwealth Bancorp Citizens $450Jun Nordisk Renting CBFM €104Jul Port Financial Corporation Citizens $285Jul Santander Direkt Bank Retail Direct €486Sep Churchill Insurance Group Direct Line £1,100Oct Community Bancorp Citizens $116Nov Bank von Ernst Wealth Mgt Swfr 500
2004Jan Roxborough Manayunk Bank Citizens $136Jan First Active Ulster Bank €887Feb People’s Bank (credit cards) Retail Direct $360May* Charter One Citizens $10,500* Announced, not completed

Slide 38
2003 Major Acquisitions
▮ RBS Insurance including Churchill– #2 general insurer in UK
– #1 in motor, #2 in home
– Two leading direct retail brands
– Added broker channel, stronger in partnerships
▮ Ulster Bank including First Active– Strong #3 bank in Ireland, #1 in Northern Ireland
– Strong in mortgages as well as banking products
– Complementary brands, branch networks
– Leverage Group resources in CBFM and manufacturing

Slide 39
Acquisition of Charter One
▮ Logical geographic extension with significanttransaction benefits
▮ Significant increase in scale
▮ Opportunities for organic growth
▮ Options for future acquisitions
▮ Top 10 bank in US
▮ 25% of RBS profit before tax from US

Slide 40
Logical Geographic Extension
PA
New York
Virginia
West Virginia
Michigan
IllinoisIndiana
Maine
Ohio
VT
MD
MACT
NJ
DE
NH
RI
New YorkMichigan
Vermont
PhiladelphiaPittsburgh
Boston
Indiana
Illinois
Ohio

Slide 41
Significant Increase in Scale
Charter One Citizens Increase
▮ Customers (000s)
– Personal 1,719 2,462 +70%
– Business 98 233 +42%
▮ Branches
– Traditional 456 615 +74%
– Supermarket 160 258 +62%
▮ ATMs 988 1,661 +59%
▮ Employees 7,843 15,779 +50%
Statistics at 31 March 2004

Slide 42
Opportunities for Organic Growth
000s Households
New EnglandRhode Island 424
Massachusetts 2,506
Connecticut 1,339
New Hampshire 501
Mid AtlanticPennsylvania 4,854
000s Households
Mid WestOhio 4,536
Illinois 4,692
Michigan 3,886
Indiana 2,399
North EastUpstate New York 1,658
Vermont 248Source: SNL Datasource as at 30 June 2003

Slide 43
Opportunities for Organic Growth
000s SmallBusinesses
New EnglandRhode Island 21
Massachusetts 128
Connecticut 67
New Hampshire 27
Mid AtlanticPennsylvania 204
000s SmallBusinesses
Mid WestOhio 180
Illinois 217
Michigan 166
Indiana 98
North EastUpstate New York 86
Vermont 16Source: SNL Datasource as at 30 June 2003, US Small Business Association
Slide 44
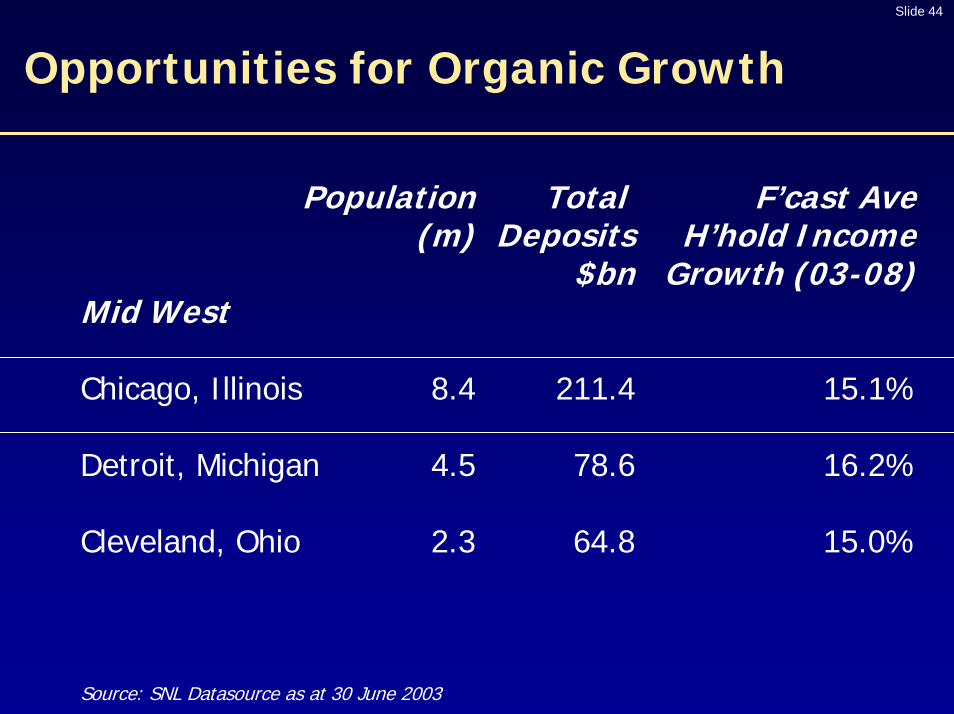
Opportunities for Organic Growth
Population Total F’cast Ave(m) Deposits H’hold Income
$bn Growth (03-08)Mid West
Chicago, Illinois 8.4 211.4 15.1%
Detroit, Michigan 4.5 78.6 16.2%
Cleveland, Ohio 2.3 64.8 15.0%
Source: SNL Datasource as at 30 June 2003
Slide 45
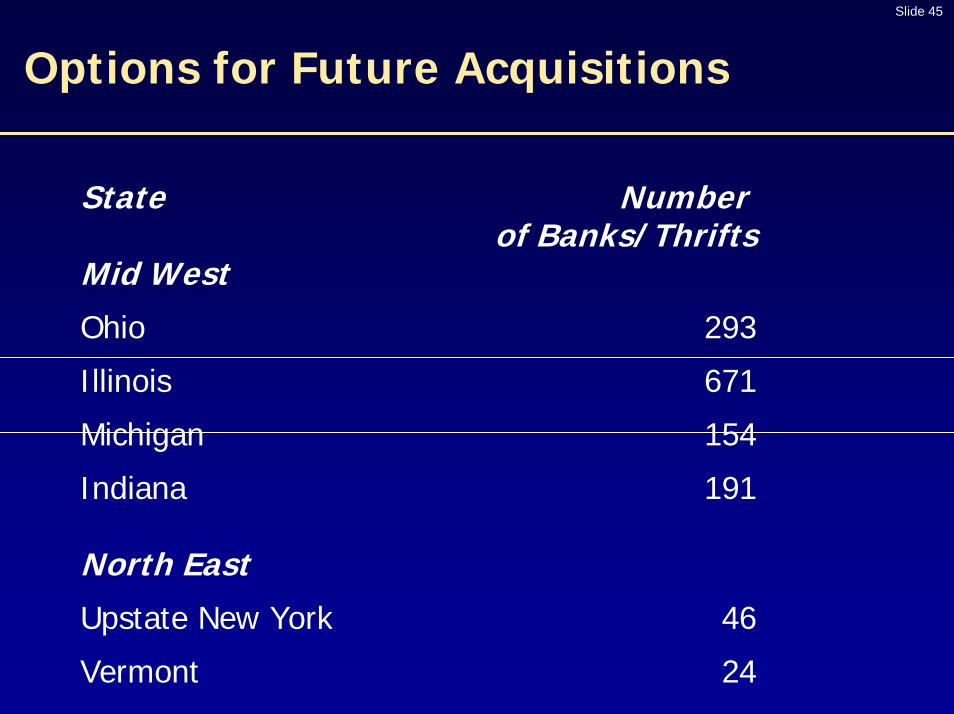
Options for Future Acquisitions
State Numberof Banks/Thrifts
Mid West
Ohio 293
Illinois 671
Michigan 154
Indiana 191
North East
Upstate New York 46
Vermont 24

Slide 46
Top 10 Bank in US
Deposits $bn1. Bank of America 5752. JP Morgan Chase + Bank One (pending) 5033. Citigroup 4994. Wells Fargo 2485. Wachovia 2326. US Bancorp 1197. SunTrust Banks + National Commerce Financial (pending) 978. Pro forma Citizens + Charter One 878. HSBC North America 869. National City + Provident Financial (pending) 77
10. BB&T 6411. Citizens 6012. Fifth Third Bancorp 5513. Regions Financial + Union Planters (pending) 5414. ABN Amro North America 5315. KeyCorp 5016. PNC 4817. Comerica 4318. UnionBanCal 3919. SouthTrust 3620. M&T Bank 33
US commercial banks, US GAAP deposits, 31 March 2004Source: SNL DataSource

Slide 47
25% of RBS Profit Before Tax from US
RBS Profit Before Tax After Charter One
Europe 5% Rest of World 2%
UK 68%
US 25%

Slide 48
A Full House of Opportunities
What Does This Mean For RBS?
▮ Organic income growth– Multi-brand, multiple channel– Single platform– Large distribution capacity– Low market shares– Profitable new businesses– Diversity of income– Geographical options for growth– A major contributor to RBS income growth
▮ Improve efficiency
▮ Able to make good acquisitions


Certain statements made in this presentation are forward looking statements. Such statementsare based on current expectations and are subject to a number of risks and uncertainties thatcould cause actual results and performance to differ materially from any expected future resultsor performance, express or implied, by the forward looking statements. Factors that mightcause forward looking statements to differ materially from actual results include, among otherthings, regulatory and economic factors. RBS assumes no responsibility to update any of theforward looking statements contained herein.
The information and statements contained in this presentation do not constitute a public offerunder any applicable legislation or an offer to sell or solicitation of an offer to buy any securitiesor financial instruments or any advice or recommendation with respect to such securities orother financial instruments either in the United States or elsewhere; nor does this presentationconstitute a solicitation to vote in favour of the proposed transaction. The RBS Ordinary Shareshave not been and will not be registered under the U.S. Securities Act of 1933 (“the SecuritiesAct”) and may not be offered or sold in the United States unless they are registered with theU.S. Securities and Exchange Commission or pursuant to an exemption from the registrationrequirements of the Securities Act. There will be no public offering of the RBS Ordinary Sharesin the United States.


