94 Statement of Directors’ Responsibilities 95 Independent Auditor’s UK Report 99 Independent Auditor’s US Report 100 Group Financial Statements 100 Group income statement 101 Group statement of comprehensive income 102 Group statement of changes in equity 105 Group statement of financial position 106 Group statement of cash flows 107 Accounting policies 114 Notes to the Group Financial Statements Book ‘Guest Journey’ – Step three • The Book phase of the ‘Guest Journey’ involves guests actually making a reservation. • They can do this using a variety of methods; both direct (through digital and voice) and indirect (through online travel intermediaries, and business and leisure travel agents). IHG Annual Report and Form 20-F 2014 92 Group Financial Statements
Transcript
94 Statement of Directors’ Responsibilities 95 Independent Auditor’s UK Report 99 Independent Auditor’s US Report100 Group Financial Statements 100 Group income statement 101 Group statement of comprehensive income 102 Group statement of changes in equity 105 Group statement of financial position 106 Group statement of cash flows 107 Accounting policies 114 Notes to the Group Financial Statements
Book
‘Guest Journey’ – Step three • The Book phase of the ‘Guest Journey’
involves guests actually making a reservation.
• They can do this using a variety of methods; both direct (through digital and voice) and indirect (through online travel intermediaries, and business and leisure travel agents).
IHG Annual Report and Form 20-F 2014
92
Group Financial Statements
STRATEG
IC REP
OR
TG
OVER
NAN
CE
GR
OU
P FIN
AN
CIA
L STATEMEN
TSPAR
ENT C
OM
PANY
FINAN
CIAL STATEM
ENTS
ADD
ITION
AL IN
FOR
MATIO
N
93
Financial Statements and accounting recordsThe Directors are required to prepare financial statements for the Company and the Group at the end of each financial year in accordance with all applicable laws and regulations. Under company law the Directors must not approve the Financial Statements unless they are satisfied that they give a true and fair view of the state of affairs of the Group and the profit or loss of the Group for that period. In preparing these Financial Statements, the Directors are required to:
• select suitable accounting policies and apply them consistently;• make judgements and accounting estimates that are
reasonable;• state whether the Consolidated Financial Statements have
been prepared in accordance with International Financial Reporting Standards (IFRS) as issued by the International Accounting Standards Board (IASB), for use in the EU and Article 4 of the EU IAS Regulation;
• state for the Company Financial Statements whether applicable UK accounting standards have been followed; and
• prepare the Financial Statements on the going concern basis unless it is inappropriate to presume that the Company and the Group will continue in business.
The Directors have responsibility for ensuring that the Group keeps proper accounting records which disclose with reasonable accuracy the financial position of the Group and the Company to enable them to ensure that the Financial Statements comply with the Companies Act 2006 and, as regards the Consolidated Financial Statements, Article 4 of the EU IAS Regulation. The Directors are also responsible for the system of internal control, for safeguarding the assets of the Company and the Group, and taking reasonable steps to prevent and detect fraud and other irregularities.
Disclosure and Transparency RulesThe Board confirms that to the best of its knowledge:
• the Financial Statements have been prepared in accordance with IFRS as issued by the IASB and IFRS as adopted by the EU, give a true and fair view of the assets, liabilities, financial position and profit and loss of the Group taken as a whole; and
• the Annual Report, including the Strategic Report, includes a fair review of the development and performance of the business and the position of the Group taken as a whole, together with a description of the principal risks and uncertainties that it faces.
UK Corporate Governance CodeHaving taken advice from the Audit Committee, the Board considers that this Annual Report and Form 20-F, taken as a whole is fair, balanced and understandable and that it provides the information necessary for shareholders to assess the Company’s performance, business model and strategy.
Disclosure of information to AuditorThe Directors who held office as at the date of approval of this report confirm that they have taken steps to make themselves aware of relevant audit information (as defined by Section 418(3) of the Companies Act 2006). None of the Directors are aware of any relevant audit information which has not been disclosed to the Company’s Auditor.
Management’s report on internal control over financial reportingManagement is responsible for establishing and maintaining adequate internal control over financial reporting for the Group, as defined in Rule 13a-15(f) and 15d-15(f) under the Securities Exchange Act of 1934 as a process designed to provide reasonable assurance regarding the reliability of financial reporting and the preparation of financial statements for external purposes in accordance with IFRS. The Group’s internal control over financial reporting includes policies and procedures that:
• pertain to the maintenance of records that, in reasonable detail, accurately and fairly reflect the Group’s transactions and dispositions of assets;
• are designed to provide reasonable assurance that transactions are recorded as necessary to permit the preparation of the Financial Statements in accordance with IFRS as issued by the IASB and the IFRS adopted by the EU, and that receipts and expenditure are being made only in accordance with authorisation of management and the Directors of the Company; and
• provide reasonable assurance regarding prevention or timely detection of unauthorised acquisition, use or disposition of the Group’s assets that could have a material effect on the Financial Statements.
Any internal control framework has inherent limitations and internal control over financial reporting may not prevent or detect misstatements. Also, projections of any evaluation of effectiveness to future periods are subject to the risk that controls may become inadequate because of changes in conditions or the degree of compliance with the policies or procedures may deteriorate.
Management has undertaken an assessment of the effectiveness of the Group’s internal control over financial reporting at 31 December 2014 based on criteria established in the Internal Control-Integrated Framework issued by the Committee of Sponsoring Organizations of the Treadway Commission (2013 Framework) (the COSO criteria). Based on this assessment, management has concluded that as at 31 December 2014 the Group’s internal control over financial reporting was effective.
During the period covered by this document the Group transitioned from the 1992 to the 2013 Internal Control-Integrated Framework criteria issued by COSO. There were no other changes in the Group’s internal control over financial reporting that have materially affected or are reasonably likely to materially affect the effectiveness of the internal controls over financial reporting.
The Group’s internal control over financial reporting at 31 December 2014, together with the Group’s Consolidated Financial Statements, were audited by Ernst & Young LLP, an independent registered public accounting firm. Their report on internal control over financial reporting can be found on page 99.
For and on behalf of the Board
Richard Solomons Paul Edgecliffe-Johnson Chief Executive Officer Chief Financial Officer16 February 2015 16 February 2015
IHG Annual Report and Form 20-F 2014
94
Statement of Directors’ Responsibilities
Our application of materiality For the purposes of determining whether the accounts are free from material error, we define materiality as the magnitude of an omission or misstatement that, individually or in the aggregate, in light of the surrounding circumstances, could reasonably be expected to influence the economic decisions of the users of the financial statements. In assessing whether errors are material, either individually or in aggregate, we consider qualitative as well as quantitative factors.
Based on our professional judgement, we determined materiality for the financial statements as a whole to be $28m (2013 $27m).
How we determined materiality:
Independent Auditor Report to the members of InterContinental Hotels Group PLC
Opinion on financial statementsIn our opinion:
• the Financial Statements give a true and fair view of the state of the Group’s and of the parent company’s affairs as at 31 December 2014 and of the Group’s profit for the year then ended;
• the Group Financial Statements have been properly prepared in accordance with International Financial Reporting Standards (IFRSs) as adopted by the European Union;
• the Parent Company Financial Statements have been properly prepared in accordance with United Kingdom Generally Accepted Accounting Practice; and
• the Financial Statements have been prepared in accordance with the requirements of the Companies Act 2006 and, as regards the Group Financial Statements, Article 4 of the IAS Regulation.
What we have auditedWe have audited the Financial Statements of InterContinental Hotels Group PLC (the Group and IHG) for the year ended 31 December 2014 which comprise the:Group Company
Group income statement Parent company balance sheet
Group statement of comprehensive income related notes 1 to 10
Group statement of changes in equityGroup statement of financial positionGroup statement of cash flowsrelated notes 1 to 34
The financial reporting framework that has been applied in the preparation of the Group Financial Statements is applicable law and IFRSs as adopted by the European Union. The financial reporting framework that has been applied in the preparation of the Parent Company Financial Statements is applicable law and United Kingdom Accounting Standards (United Kingdom Generally Accepted Accounting Practice).
Overview of our audit approach
Materiality • Overall Group materiality of $28m which represents 5% of profit before tax adjusted for pre-tax exceptional items.
Audit scope • We performed an audit of the complete financial information of 21 components and audit procedures on specific balances for a further 11 components.
• The reporting components where we performed full or specific audit procedures accounted for 77% of revenue and 86% of profit before tax adjusted for pre-tax exceptional items.
Areas of focus
• Accounting for the hotel assessments collected as part of the revenue cycle and the allocation of expenditures related to the marketing, advertising and loyalty point programmes (the System Fund).
• The valuation of the future redemption of IHG Rewards Club points liability.
• Recognition of deferred tax assets relating to losses.• Capitalisation of software assets and carrying value
of legacy systems. • Disposal of the 80% interest in the InterContinental
New York Barclay hotel.
Rationale for basisWe believe that profit before tax adjusted for pre-tax exceptional items provides us with a consistent year on year basis for determining materiality and is the most relevant performance measure to the stakeholders of the entity. Detailed audit procedures are performed on material exceptional items.
On the basis of our risk assessment, together with our assessment of the Group’s overall control environment, our judgement was that overall performance materiality (i.e., our tolerance for misstatement in an individual account or balance) for the Group should be 75% (2013 75%) of planning materiality, namely $21m (2013 $20m). Our objective in adopting this approach was to ensure that total uncorrected and undetected audit differences in all accounts did not exceed our materiality level.
We agreed with the Audit Committee that we would report to the Committee all audit differences in excess of $1.4m (2013 $1.4m), as well as differences below that threshold that, in our view, warranted reporting on qualitative grounds.
Scope of the audit of the financial statementsAn audit involves obtaining evidence about the amounts and disclosures in the financial statements sufficient to give reasonable assurance that the financial statements are free from material misstatement, whether caused by fraud or error. This includes an assessment of: whether the accounting policies are appropriate to the Group’s and the parent company’s circumstances and have been consistently applied and adequately disclosed; the reasonableness of significant accounting estimates made by the Directors; and the overall presentation of the financial statements. In addition, we read all the financial and non-financial information in the Annual Report and Form 20-F 2014 to identify material inconsistencies with the audited Financial Statements and to identify any information that is apparently materially incorrect based on, or materially inconsistent with, the knowledge acquired by us in the course of performing the audit. If we become aware of any apparent material misstatements or inconsistencies we consider the implications for our report.
Adjust for pre-tax exceptional income of $29m to determine adjusted profit before taxAdjustment
Take 5% of the adjusted profit before taxMateriality
Profit before tax $600mStarting basis
STRATEG
IC REP
OR
TG
OVER
NAN
CE
GR
OU
P FIN
AN
CIA
L STATEMEN
TSPAR
ENT C
OM
PANY
FINAN
CIAL STATEM
ENTS
ADD
ITION
AL IN
FOR
MATIO
N
95
Independent Auditor’s UK Report
The scope of our audit Following our assessment of the risk of material misstatement to the Group Financial Statements, we selected 32 components which represent the principal business units within the Group. 21 of these components were subject to a full audit and 11 were subject to a specific scope audit where the extent of audit work was based on our assessment of the risks of material misstatement and the materiality of the component’s business operations relative to the Group. The audit scope of these components may not have included testing of all significant accounts of the location but will have contributed to the coverage of significant accounts tested for the Group. The four Group audit significant risks in relation to System Fund, IHG Rewards Club points liability, capitalisation and carrying value of capitalised software assets, and deferred tax asset recognition were subject to full scope audit procedures.
For the remaining components not subject to full or specific scope audits, we performed other procedures to test or assess that there were no significant risks of material misstatement in these components in relation to the Group Financial Statements. The components subject to full audit or specific audit procedures account for 77% of Group revenue and 86% of the Group’s profit before tax before pre-tax exceptional items.
Audit work at the individual components is undertaken based on a percentage of our total performance materiality. The performance materiality set for each component is based on the relative size of the component and our view of the risk of misstatement at that
component. In the current year the range of performance materiality allocated to components was $1m to $21m. The upper end of the range was allocated to those components which reflected 100% of a single line item within the Group statement of financial position or the related notes.
The Group audit team directs the component teams at all stages of the audit. The audit engagement partner, or her designate, visited with the key locations in the Americas and IHG’s global accounting centre in India during planning, interim and at year end. In addition, the audit engagement partner visited Greater China, including the Group’s owned hotel in Hong Kong.
These visits involved discussing the audit strategy and any issues arising from our work, reviewing key workpapers, as well as meeting local management.
This, together with additional procedures performed at the Group level, gave us the evidence we needed for our opinion on the Financial Statements as a whole.
Our assessment of risk of material misstatementWe identified the following risks of material misstatement which had the greatest effect on the audit strategy; the allocation of resources in the audit; and directing the efforts of the engagement team, including the more senior members of the team. This is not a complete list of all the risks identified in our audit.
Area of focus How our audit addressed the area of focus References
Accounting for the hotel assessments collected as part of the revenue cycle and the allocation of expenditures related to the marketing, advertising and loyalty point programmes (the System Fund)
As outlined in the Strategic Report on page 49, the System Fund (the Fund) is a key part of the Group’s business model.
For the year ended 31 December 2014, and as detailed in Note 32, the Fund has assessment fees and contributions of $1,271m and expenses of $1,485m. These amounts are not included in IHG’s income statement.
We focus on this area because there is a risk that the hotel assessments could be included in IHG’s reported revenue, which would overstate IHG’s revenues; or that Group costs are incorrectly charged to the Fund, improperly reducing IHG’s expenses and leading to a misstatement of IHG’s income statement.
We have tested internal financial controls over the calculation of hotel assessments, charges to the Fund, allocation of expenses (in addition to those over the Group’s procurement process), related IT systems, and exclusion from IHG’s ledgers.
For a sample of hotel assessments and expenses recorded in the Fund, we agreed that they are supported by appropriate documentation and, based on our inspection of that supporting documentation, we have made an independent assessment of whether the hotel assessments and contributions and expenses relate to the Fund.
Given the accounting treatment adopted for the Fund is a key judgement; we have considered the appropriateness of the related disclosures provided in the Group Financial Statements.
Refer to page 49 (Strategic Report), page 67 (Audit Committee Report), page 112 (Critical accounting policies and the use of estimates and judgements), and page 152 (notes).
IHG Annual Report and Form 20-F 2014
96
continuedIndependent Auditor’s UK Report
Area of focus How our audit addressed the area of focus References
The valuation of the future redemption of IHG Rewards Club points liability
We focused on this area due to the size of the liability, ($725m at 31 December 2014), and its sensitivity, in particular, to the breakage estimate (as defined on page 113).
We tested the effectiveness of internal financial controls, including IT controls, over the liability valuation process, including controls over validation of the completeness and accuracy of data provided to IHG’s external actuarial adviser and management’s internal review process of the inputs and the overall estimate of the rewards point liability.
For the three key inputs into the liability valuation we undertook the following audit procedures:
(1) Outstanding loyalty points at 31 December 2014We tested controls over the complete and accurate recording of points data and tested the roll forward of the points balance to 31 December 2014, and traced to underlying records.
(2) The outstanding points redemption ratio (breakage)We engaged our own actuarial specialists to assist us in challenging and evaluating the appropriateness of the methodology, data and assumptions applied by management in determining key redemption ratio/breakage assumption for member’s outstanding loyalty points at the balance sheet date.
In addition to testing the integrity and accuracy of the company’s model, we developed our own model to form an independent view on an acceptable range for the redemption ratio and assess the reasonableness of key assumptions applied by management in valuing the liability.
(3) Redeemed point cost (‘RPC’) We undertook substantive and analytical procedures to validate the RPC to be applied to the liability calculation.
Refer to page 67 (Audit Committee Report), page 113 (Critical accounting policies and the use of estimates and judgements), and page 152 (notes).
Recognition of deferred tax assets relating to losses
We focused on this area due to:• the judgement and estimates
required to determine the level of future taxable profits that support recognition; and
• the size of the recognised and unrecognised deferred tax assets relating to losses at the balance sheet date, $154m and $256m, respectively.
We challenged and applied professional scepticism to management’s rationale for the re-assessment of forecast models and considered the appropriateness of management’s assumptions and estimates in relation to the likelihood of generating suitable future profits to support the recognition of deferred tax assets.
We evaluated the historical accuracy of forecasting and the integrity of the forecast models and as a result of these procedures, we formed our own view on the Group’s capacity to obtain effective relief for tax losses and other assets over the forecast period.
In particular, we considered the interaction between the recognition of tax losses in the UK and overseas jurisdictions to ensure consistency, since these are both impacted by the application of the UK controlled foreign company legislation.
Refer to page 67 (Audit Committee Report), page 113 (Critical accounting policies and the use of estimates and judgements), and pages 122 to 124 (notes).
(New in 2014) Capitalisation of software assets and carrying value of legacy systems
Our audit approach and assessment of key areas of audit focus changes in response to circumstances affecting the Group. Given the Group’s continued development of the technology environment and the size of the capitalised software balance ($264m as at 31 December 2014), we have focused on this area in 2014.
Software projects can have complex development cycles, often over many phases, spanning two to three years, or more. New technology also brings a risk of impairment of legacy systems.
We tested the internal controls over the approval, acquisition and development of new software and the controls surrounding the capitalisation and determination of the useful lives of newly capitalised software assets and remaining useful lives for legacy software.
We obtained a listing of new projects initiated in the year, and agreed a sample to underlying documentation to test they had been reviewed and approved in line with the Group’s delegation of authority.
We assessed that the costs capitalised were in compliance with the requirements of IAS 38 ‘Intangible Assets’.
We undertook tests of details by vouching specific expenditures to supporting documentation to validate a sample of software additions in the year.
We performed a detailed assessment of capitalised software to evaluate the remaining useful lives remain appropriate given the evolution of the technology environment.
Refer to page 22 (Strategic Report), page 67 (Audit Committee Report), page 113 (Critical accounting policies and the use of estimates and judgements), and page 129 (notes).
STRATEG
IC REP
OR
TG
OVER
NAN
CE
GR
OU
P FIN
AN
CIA
L STATEMEN
TSPAR
ENT C
OM
PANY
FINAN
CIAL STATEM
ENTS
ADD
ITION
AL IN
FOR
MATIO
N
97
Changes from the prior yearIn the prior year we also considered the purchase of a qualifying insurance policy by the UK defined benefit pension scheme to be a key area of audit focus. This is no longer applicable in the current year.
Respective responsibilities of Directors and auditorAs explained more fully in the Statement of Directors’ Responsibilities set out on page 94, the Directors are responsible for the preparation of the Financial Statements and for being satisfied that they give a true and fair view. Our responsibility is to audit and express an opinion on the Financial Statements in accordance with applicable law and International Standards on Auditing (ISAs) (UK and Ireland). Those standards require us to comply with the Auditing Practices Board’s Ethical Standards for Auditors.
This report is made solely to the Company’s members, as a body, in accordance with Chapter 3 of Part 16 of the Companies Act 2006. Our audit work has been undertaken so that we might state to the Company’s members those matters we are required to state to them in an auditor’s report and for no other purpose. To the fullest extent permitted by law, we do not accept or assume responsibility to anyone other than the Company and the Company’s members as a body, for our audit work, for this report, or for the opinions we have formed.
Opinion on other matters prescribed by the Companies Act 2006In our opinion:
• the part of the Directors’ Remuneration Report to be audited has been properly prepared in accordance with the Companies Act 2006; and
• the information given in the Strategic Report and the Directors’ Report for the financial year for which the Financial Statements are prepared is consistent with the Financial Statements.
Matters on which we are required to report by exceptionWe have nothing to report in respect of the following:
Under the ISAs (UK and Ireland), we are required to report to you if, in our opinion, information in the Annual Report is:
• materially inconsistent with the information in the audited Financial Statements; or
• apparently materially incorrect based on, or materially inconsistent with, our knowledge of the Group acquired in the course of performing our audit; or
• is otherwise misleading.
In particular, we are required to consider whether we have identified any inconsistencies between our knowledge acquired during the audit and the Directors’ statement that they consider the Annual Report is fair, balanced and understandable and whether the Annual Report appropriately discloses those matters that we communicated to the Audit Committee which we consider should have been disclosed.
Under the Companies Act 2006 we are required to report to you if, in our opinion:
• adequate accounting records have not been kept by the parent company, or returns adequate for our audit have not been received from branches not visited by us; or
• the Parent Company Financial Statements and the part of the Directors’ Remuneration Report to be audited are not in agreement with the accounting records and returns; or
• certain disclosures of Directors’ remuneration specified by law are not made; or
• we have not received all the information and explanations we require for our audit.
Under the Listing Rules we are required to review:
• the Directors’ statement, set out on page 75, in relation to going concern; and
• the part of the Corporate Governance statement relating to the company’s compliance with the nine provisions of the UK Corporate Governance Code specified for our review.
Alison Duncan (Senior statutory auditor)for and on behalf of Ernst & Young LLP, Statutory Auditor London16 February 2015
In addition to the risks identified as part of our audit planning, the Group undertook the following material non-routine transaction in the year which affected the allocation of resources and the direction of our audit efforts and for which our audit response was as follows:
Area of focus How our audit addressed the area of focus References
Disposal of the 80% interest in the InterContinental New York Barclay hotel
We focused on this area due to the complexity of the transaction. In particular, we focused on:• the Group’s remaining equity
interest in the related entity;• the calculation of the fair
value attributed to the hotel management agreement; and
• IHG’s contractual commitments to the joint venture.
We evaluated all key contracts in relation to the sale, including the sale and purchase agreement and the related hotel management agreements, to ensure that de-recognition of the hotel was appropriate.
As part of our assessment, we concluded IHG no longer controls the operations of the hotel; however, given the remaining equity interest and IHG’s representation on the Board of Directors of the joint venture entity, IHG has significant influence over the entity, and equity accounts for its investment.
We agreed the calculation of the accounting gain recognised on disposal, including the fair value attributed to the hotel management agreement. We challenged the appropriateness of the assumptions applied to the discounted cash flow models used in determining the valuation of the management contract.
Given the size and nature of the disposal gain, we considered the appropriateness of its classification as an exceptional item in line with the Group’s accounting policy for such items as set out on page 112.
Refer to page 67 (Audit Committee Report), and pages 121 and 127 (notes).
IHG Annual Report and Form 20-F 2014
98
continuedIndependent Auditor’s UK Report
Report of independent registered public accounting firm on internal control over financial reportingTo the Board of Directors and Shareholders of InterContinental Hotels Group PLC.
We have audited InterContinental Hotels Group PLC’s internal control over financial reporting as of 31 December 2014, based on criteria established in Internal Control-Integrated Framework issued by the Committee of Sponsoring Organizations of the Treadway Commission (2013 Framework) (the COSO criteria). InterContinental Hotels Group PLC’s management is responsible for maintaining effective internal control over financial reporting, and for its assessment of the effectiveness of internal control over financial reporting included in the Annual Report and Form 20-F 2014. Our responsibility is to express an opinion on the Group’s internal control over financial reporting based on our audit.
We conducted our audit in accordance with the standards of the Public Company Accounting Oversight Board (United States). Those standards require that we plan and perform the audit to obtain reasonable assurance about whether effective internal control over financial reporting was maintained in all material respects. Our audit included obtaining an understanding of internal control over financial reporting, assessing the risk that a material weakness exists, testing and evaluating the design and operating effectiveness of internal control based on the assessed risk, and performing such other procedures as we considered necessary in the circumstances. We believe that our audit provides a reasonable basis for our opinion.
A company’s internal control over financial reporting is a process designed to provide reasonable assurance regarding the reliability of financial reporting and the preparation of financial statements for external purposes in accordance with generally accepted accounting principles. A company’s internal control over financial reporting includes those policies and procedures that (1) pertain to the maintenance of records that, in reasonable detail, accurately and fairly reflect the transactions and dispositions of the assets of the company; (2) provide reasonable assurance that transactions are recorded as necessary to permit preparation of financial statements in accordance with generally accepted accounting principles, and that receipts and expenditures of the company are being made only in accordance with authorisations of management and directors of the company; and (3) provide reasonable assurance regarding prevention or timely detection of unauthorised acquisition, use, or disposition of the company’s assets that could have a material effect on the financial statements.
Because of its inherent limitations, internal control over financial reporting may not prevent or detect misstatements. Also, projections of any evaluation of effectiveness to future periods are subject to the risk that controls may become inadequate because of changes in conditions, or that the degree of compliance with the policies or procedures may deteriorate.
In our opinion, InterContinental Hotels Group PLC maintained, in all material respects, effective internal control over financial reporting as of 31 December 2014, based on the COSO criteria.
We also have audited, in accordance with the standards of the Public Company Accounting Oversight Board (United States), the accompanying Group statement of financial position of InterContinental Hotels Group PLC as of 31 December 2014 and 2013, and the related Group income statement, Group statement of comprehensive income, Group statement of changes in equity and Group statement of cash flows for each of the three years in
the period ended 31 December 2014, and our report dated 16 February 2015 expressed an unqualified opinion thereon.
ERNST & YOUNG LLPLondon, England16 February 2015
Report of independent registered public accounting firmTo the Board of Directors and Shareholders of InterContinental Hotels Group PLC.
We have audited the accompanying Group statement of financial position of InterContinental Hotels Group PLC as of 31 December 2014 and 2013, and the related Group income statement, Group statement of comprehensive income, Group statement of changes in equity and Group statement of cash flows for each of the three years in the period ended 31 December 2014. These Financial Statements are the responsibility of the Group’s management. Our responsibility is to express an opinion on these Financial Statements based on our audits.
We conducted our audits in accordance with the standards of the Public Company Accounting Oversight Board (United States). Those standards require that we plan and perform the audit to obtain reasonable assurance about whether the financial statements are free of material misstatement. An audit includes examining, on a test basis, evidence supporting the amounts and disclosures in the financial statements. An audit also includes assessing the accounting principles used and significant estimates made by management, as well as evaluating the overall financial statement presentation. We believe that our audits provide a reasonable basis for our opinion.
In our opinion, the Financial Statements referred to above present fairly, in all material respects, the consolidated financial position of InterContinental Hotels Group PLC at 31 December 2014 and 2013, and the consolidated results of its operations and its cash flows for each of the three years in the period ended 31 December 2014, in conformity with International Financial Reporting Standards as issued by the International Accounting Standards Board.
We also have audited, in accordance with the standards of the Public Company Accounting Oversight Board (United States), InterContinental Hotels Group PLC’s internal control over financial reporting as of 31 December 2014, based on criteria established in Internal Control-Integrated Framework issued by the Committee of Sponsoring Organizations of the Treadway Commission (2013 Framework), and our report dated 16 February 2015 expressed an unqualified opinion thereon.
ERNST & YOUNG LLPLondon, England16 February 2015
Notes:1. The maintenance and integrity of the InterContinental Hotels Group PLC
website is the responsibility of the Directors; the work carried out by the auditors does not involve consideration of these matters and, accordingly, the auditors accept no responsibility for any changes that may have occurred to the Financial Statements since they were initially presented on the website.
2. Legislation in the United Kingdom governing the preparation and dissemination of financial statements may differ from legislation in other jurisdictions.
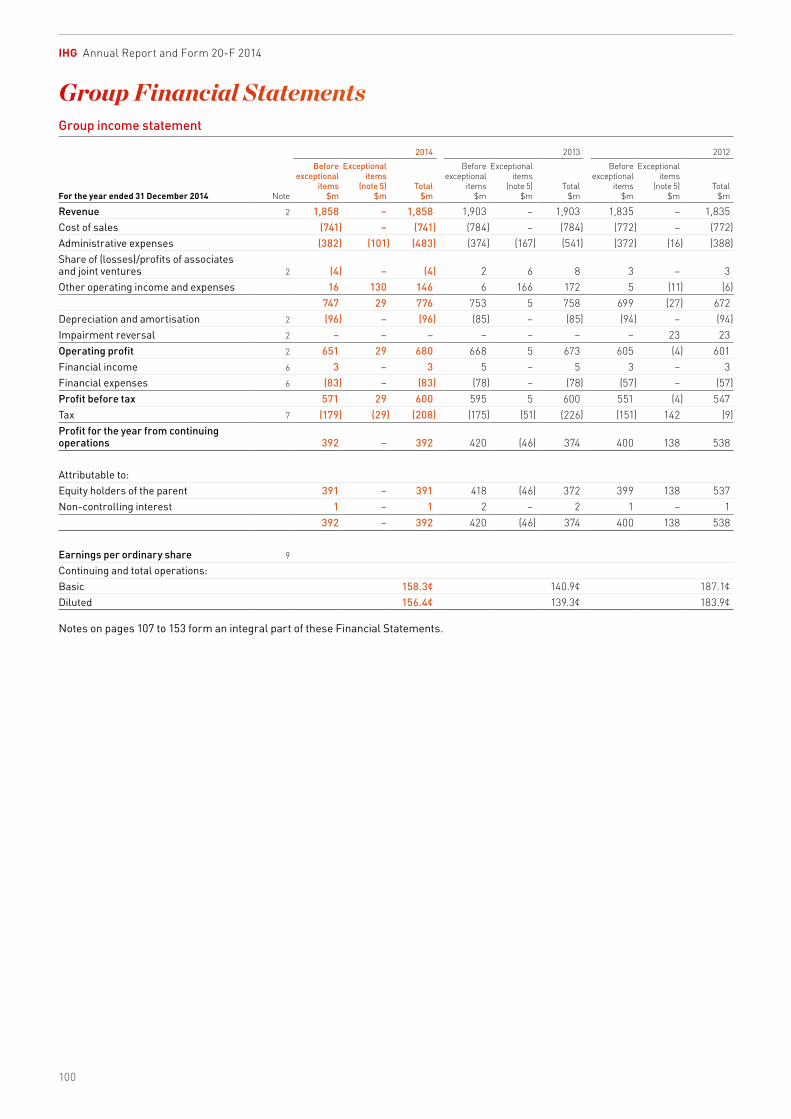
Continuing and total operations:Basic 158.3¢ 140.9¢ 187.1¢Diluted 156.4¢ 139.3¢ 183.9¢
Notes on pages 107 to 153 form an integral part of these Financial Statements.
IHG Annual Report and Form 20-F 2014
100
Group Financial Statements
Group statement of comprehensive income
For the year ended 31 December 20142014
$m2013
$m2012
$m
Profit for the year 392 374 538Other comprehensive incomeItems that may be subsequently reclassified to profit or loss:
Gains on valuation of available-for-sale financial assets, net of related tax charge of $1m (2013 $nil, 2012 $nil) 11 28 1Losses relating to cash flow hedges reclassified to financial expenses – – 1Exchange gains/(losses) on retranslation of foreign operations, net of related tax credit of $1m (2013 $2m, 2012 $3m) 42 (35) 24Exchange losses reclassified to profit on hotel disposal – 46 –
53 39 26Items that will not be reclassified to profit or loss:
Re-measurement (losses)/gains on defined benefit plans, net of related tax credit of $7m (2013 charge of $20m, 2012 credit of $5m) (18) 20 (10)Tax related to pension contributions 2 – 18
(16) 20 8Total other comprehensive income for the year 37 59 34Total comprehensive income for the year 429 433 572
Attributable to:Equity holders of the parent 428 433 571Non-controlling interest 1 – 1
429 433 572
Notes on pages 107 to 153 form an integral part of these Financial Statements.
STRATEG
IC REP
OR
TG
OVER
NAN
CE
GR
OU
P FIN
AN
CIA
L STATEMEN
TSPAR
ENT C
OM
PANY
FINAN
CIAL STATEM
ENTS
ADD
ITION
AL IN
FOR
MATIO
N
101
Group statement of changes in equity
Equity share
capital$m
Capital redemption
reserve$m
Shares held by
employee share trusts
$m
Other reserves
$m
Unrealised gains and
losses reserve
$m
Currency translation
reserve$m
Retained earnings
$m
IHG share- holders’
equity$m
Non-controlling
interest$m
Total equity
$m
At 1 January 2014 189 12 (38) (2,906) 100 227 2,334 (82) 8 (74)Profit for the year – – – – – – 391 391 1 392Other comprehensive income:Items that may be subsequently reclassified to profit or loss:
Gains on valuation of available-for-sale financial assets – – – – 11 – – 11 – 11Exchange differences on retranslation of foreign operations – – – – – 42 – 42 – 42
– – – – 11 42 – 53 – 53Items that will not be reclassified to profit or loss:
Re-measurement losses on defined benefit plans – – – – – – (18) (18) – (18)Tax related to pension contributions – – – – – – 2 2 – 2
– – – – – – (16) (16) – (16)Total other comprehensive income – – – – 11 42 (16) 37 – 37Total comprehensive income for the year – – – – 11 42 375 428 1 429Repurchase of shares – – – – – – (110) (110) – (110)Transaction costs relating to shareholder returns – – – – – – (1) (1) – (1)Purchase of own shares by employee share trusts – – (58) – – – – (58) – (58)Release of own shares by employee share trusts – – 60 – – – (60) – – –Equity-settled share-based cost – – – – – – 28 28 – 28Tax related to share schemes – – – – – – 12 12 – 12Equity dividends paid – – – – – – (942) (942) (1) (943)Exchange adjustments (11) – 1 10 – – – – – –At 31 December 2014 178 12 (35) (2,896) 111 269 1,636 (725) 8 (717)
All items above are shown net of tax.
Notes on pages 107 to 153 form an integral part of these Financial Statements.
IHG Annual Report and Form 20-F 2014
102
continuedGroup Financial Statements
Group statement of changes in equity continued
Equity share
capital$m
Capital redemption
reserve$m
Shares held by
employee share trusts
$m
Other reserves
$m
Unrealised gains and
losses reserve
$m
Currency translation
reserve$m
Retained earnings
$m
IHG share- holders’
equity$m
Non- controlling
interest$m
Total equity
$m
At 1 January 2013 179 11 (48) (2,901) 72 214 2,781 308 9 317Profit for the year – – – – – – 372 372 2 374Other comprehensive income:Items that may be subsequently reclassified to profit or loss:
Gains on valuation of available-for-sale financial assets – – – – 28 – – 28 – 28Exchange differences on retranslation of foreign operations – – – – – (33) – (33) (2) (35)Exchange losses reclassified to profit on hotel disposal – – – – – 46 – 46 – 46
– – – – 28 13 – 41 (2) 39Items that will not be reclassified to profit or loss:
Re-measurement gains on defined benefit plans – – – – – – 20 20 – 20
– – – – – – 20 20 – 20Total other comprehensive income – – – – 28 13 20 61 (2) 59Total comprehensive income for the year – – – – 28 13 392 433 – 433Issue of ordinary shares 5 – – – – – – 5 – 5Repurchase of shares – – – – – – (283) (283) – (283)Purchase of own shares by employee share trusts – – (53) – – – – (53) – (53)Release of own shares by employee share trusts – – 64 – – – (61) 3 – 3Equity-settled share-based cost – – – – – – 27 27 – 27Tax related to share schemes – – – – – – 11 11 – 11Equity dividends paid – – – – – – (533) (533) (1) (534)Exchange adjustments 5 1 (1) (5) – – – – – –At 31 December 2013 189 12 (38) (2,906) 100 227 2,334 (82) 8 (74)
All items above are shown net of tax.
Notes on pages 107 to 153 form an integral part of these Financial Statements.
STRATEG
IC REP
OR
TG
OVER
NAN
CE
GR
OU
P FIN
AN
CIA
L STATEMEN
TSPAR
ENT C
OM
PANY
FINAN
CIAL STATEM
ENTS
ADD
ITION
AL IN
FOR
MATIO
N
103
Group statement of changes in equity continued
Equity share
capital$m
Capital redemption
reserve$m
Shares held by
employee share trusts
$m
Other reserves
$m
Unrealised gains and
losses reserve
$m
Currency translation
reserve$m
Retained earnings
$m
IHG share- holders’
equity$m
Non- controlling
interest$m
Total equity
$m
At 1 January 2012 162 10 (27) (2,893) 71 189 3,035 547 8 555Profit for the year – – – – – – 537 537 1 538Other comprehensive income:Items that may be subsequently reclassified to profit or loss:
Gains on valuation of available-for-sale financial assets – – – – 1 – – 1 – 1Losses reclassified to financial expenses on cash flow hedges – – – – 1 – – 1 – 1Exchange differences on retranslation of foreign operations – – – – (1) 25 – 24 – 24
– – – – 1 25 – 26 – 26Items that will not be reclassified to profit or loss:
Re-measurement losses on defined benefit plans – – – – – – (10) (10) – (10)Tax related to pension contributions – – – – – – 18 18 – 18
– – – – – – 8 8 – 8Total other comprehensive income – – – – 1 25 8 34 – 34Total comprehensive income for the year – – – – 1 25 545 571 1 572Issue of ordinary shares 10 – – – – – – 10 – 10Repurchase of shares (1) – – – – – (106) (107) – (107)Transfer to capital redemption reserve – 1 – – – – (1) – – –Transaction costs relating to shareholder returns – – – – – – (2) (2) – (2)Purchase of own shares by employee share trusts – – (84) – – – – (84) – (84)Release of own shares by employee share trusts – – 63 – – – (63) – – –Equity-settled share-based cost – – – – – – 27 27 – 27Tax related to share schemes – – – – – – 20 20 – 20Equity dividends paid – – – – – – (679) (679) – (679)Share of reserve in equity accounted investment – – – – – – 5 5 – 5Exchange adjustments 8 – – (8) – – – – – –At 31 December 2012 179 11 (48) (2,901) 72 214 2,781 308 9 317
All items above are shown net of tax.
Notes on pages 107 to 153 form an integral part of these Financial Statements.
IHG Annual Report and Form 20-F 2014
104
continuedGroup Financial Statements
Group statement of financial position
31 December 2014 Note2014
$m
2013(restated1)
$m
2012(restated1)
$m
ASSETSProperty, plant and equipment 10 741 1,169 1,056Goodwill 12 74 80 93Intangible assets 13 569 438 354Investment in associates and joint ventures 14 116 85 84Trade and other receivables 16 3 – –Retirement benefit assets 25 8 7 99Other financial assets 15 252 236 155Non-current tax receivable 34 16 24Deferred tax assets 7 87 108 204Total non-current assets 1,884 2,139 2,069Inventories 3 4 4Trade and other receivables 16 448 423 422Current tax receivable 4 12 31Derivative financial instruments 22 2 1 2Other financial assets 15 5 12 6Cash and cash equivalents 17 162 248 387Total current assets 624 700 852Assets classified as held for sale 11 310 228 534Total assets 2 2,818 3,067 3,455LIABILITIESLoans and other borrowings 21 (126) (130) (208)Trade and other payables 18 (769) (748) (709)Provisions 19 (1) (3) (1)Current tax payable (47) (47) (54)Total current liabilities (943) (928) (972)Loans and other borrowings 21 (1,569) (1,269) (1,242)Derivative financial instruments 22 – (11) (19)Retirement benefit obligations 25 (146) (184) (187)Trade and other payables 18 (627) (574) (563)Provisions 19 (9) – (1)Deferred tax liabilities 7 (147) (175) (93)Total non-current liabilities (2,498) (2,213) (2,105)Liabilities classified as held for sale 11 (94) – (61)Total liabilities 2 (3,535) (3,141) (3,138)Net (liabilities)/assets (717) (74) 317EQUITYEquity share capital 27 178 189 179Capital redemption reserve 27 12 12 11Shares held by employee share trusts 27 (35) (38) (48)Other reserves 27 (2,896) (2,906) (2,901)Unrealised gains and losses reserve 27 111 100 72Currency translation reserve 27 269 227 214Retained earnings 1,636 2,334 2,781IHG shareholders’ equity (725) (82) 308Non-controlling interest 27 8 8 9Total equity (717) (74) 317
1 Restated for the adoption of ‘Offsetting Financial Assets and Financial Liabilities’ (Amendments to IAS 32), see page 107.
Signed on behalf of the Board
Paul Edgecliffe-Johnson16 February 2015
Notes on pages 107 to 153 form an integral part of these Financial Statements.
Operating cash flow before movements in working capital 774 782 719Increase in trade and other receivables (18) (9) (50)Net change in loyalty programme liability and System Fund surplus 32 58 61 57Increase in other trade and other payables 61 8 26Utilisation of provisions 19 (2) (3) (12)Retirement benefit contributions, net of costs (6) (18) (95)Cash flows relating to exceptional operating items (114) (33) (6)Cash flow from operations 753 788 639Interest paid (76) (74) (50)Interest received 2 2 2Tax paid on operating activities 7 (136) (92) (119)Net cash from operating activities 543 624 472Cash flow from investing activitiesPurchase of property, plant and equipment (84) (159) (44)Purchase of intangible assets (162) (86) (84)Investment in other financial assets (5) (154) (2)Investment in associates and joint ventures (15) (10) (3)Loan advances to associates and joint ventures (3) – –Capitalised interest paid (2) – –Disposal of hotel assets, net of costs 11 345 460 4Proceeds from other financial assets 49 109 4Distribution from associate on sale of hotel – 17 –Proceeds from other associates and joint ventures – 3 –Tax paid on disposals 7 – (5) (3)Net cash from investing activities 123 175 (128)Cash flow from financing activitiesProceeds from the issue of share capital – 5 10Purchase of own shares (110) (283) (107)Purchase of own shares by employee share trusts (68) (44) (84)Dividends paid to shareholders 8 (942) (533) (679)Dividend paid to non-controlling interests (1) (1) –Transaction costs relating to shareholder returns (1) – (2)Issue of long-term bonds – – 632Increase/(decrease) in other borrowings 382 (1) (99)Close-out of currency swaps 4 – –Net cash from financing activities (736) (857) (329)Net movement in cash and cash equivalents in the year (70) (58) 15Cash and cash equivalents at beginning of the year 17 134 195 182Exchange rate effects (9) (3) (2)Cash and cash equivalents at end of the year 17 55 134 195
Notes on pages 107 to 153 form an integral part of these Financial Statements.
IHG Annual Report and Form 20-F 2014
106
continuedGroup Financial Statements
General informationThis document constitutes the Annual Report and Financial Statements in accordance with UK Listing Rules requirements and the Annual Report on Form 20-F in accordance with the US Securities Exchange Act of 1934. Prior to 2013 the Group issued separate documents.
The Consolidated Financial Statements of InterContinental Hotels Group PLC (the Group or IHG) for the year ended 31 December 2014 were authorised for issue in accordance with a resolution of the Directors on 16 February 2015. InterContinental Hotels Group PLC (the Company) is incorporated and domiciled in Great Britain and registered in England and Wales.
Changes in accounting policiesWith effect from 1 January 2014, the Group has adopted ‘Offsetting Financial Assets and Financial Liabilities’ (Amendments to IAS 32). The amendments clarify that to offset financial assets and financial liabilities, the Group’s right of offset must be legally enforceable in the normal course of business, in the event of default, and in the event of insolvency or bankruptcy of the Group and all of the counterparties. Following a detailed review of the Group’s cash pooling arrangements which have previously been presented net within cash and cash equivalents (see note 17), management have determined that the right of offset is not enforceable in all of the above circumstances. As a result, the overdrafts within the cash pools are now presented as current loans and other borrowings. The amendments to IAS 32 are applicable retrospectively, requiring the restatement of prior year comparatives and the presentation of a third statement of financial position as at 31 December 2012 as required by IAS 1 ‘Presentation of Financial Statements’. The adoption of the amendments to IAS 32 increases cash and cash equivalents and current loans and other borrowings by $107m in 2014 (2013 $114m, 2012 $192m) but has no impact on the net financial position of the Group nor the reporting of net debt. Cash and cash equivalents presented in the Group statement of cash flows continue to be presented net of overdrafts as permitted by IAS 7 ‘Statement of Cash Flows’.
In addition, with effect from 1 January 2014, the Group has adopted Amendment to IAS 36 ‘Impairment of Assets – Recoverable Amount Disclosures for Non-Financial Assets’, Amendment to IAS 39 ‘Novation of Derivatives and Continuation of Hedge Accounting’ and IFRIC 21 ‘Levies’. The adoption of these amendments to standards and interpretations has had no material impact on the Group’s financial performance or position and there has been no requirement to restate prior year comparatives.
Summary of significant accounting policies
Basis of preparationThe Consolidated Financial Statements of IHG have been prepared on a going concern basis and under the historical cost convention, except for available-for-sale equity securities and derivatives which are measured at fair value. The Consolidated Financial Statements have been prepared in accordance with International Financial Reporting Standards (IFRSs) as issued by the IASB and in accordance with IFRS as adopted by the European Union (EU) and as applied in accordance with the provisions of the Companies Act 2006. IFRS as adopted by the EU differs in certain respects from IFRS as issued by the IASB. However, the differences have no impact on the Consolidated Financial Statements for the years presented.
Presentational currencyThe Consolidated Financial Statements are presented in millions of US dollars following a management decision to change the reporting currency from sterling during 2008. The change was made to reflect the profile of the Group’s revenue and operating profit which are primarily generated in US dollars or US dollar-linked currencies.
The currency translation reserve was set to nil at 1 January 2004 on transition to IFRS and this reserve is presented on the basis that the Group has reported in US dollars since this date. Equity share capital, the capital redemption reserve and shares held by employee share trusts are translated into US dollars at the rates of exchange on the last day of the period; the resultant exchange differences are recorded in other reserves.
The functional currency of the parent company remains sterling since this is a non-trading holding company located in the United Kingdom that has sterling denominated share capital and whose primary activity is the payment and receipt of sterling dividends and of interest on sterling denominated external borrowings and inter-company balances.
Basis of consolidationThe Consolidated Financial Statements comprise the Financial Statements of the parent company and entities controlled by the Group. Control exists when the Group has:
• power over an investee (i.e. existing rights that give it the current ability to direct the relevant activities of the investee);
• exposure, or rights, to variable returns from its involvement with the investee; and
• the ability to use its power over the investee to affect its returns.
All intra-group balances and transactions are eliminated on consolidation.
The assets, liabilities and results of those businesses acquired or disposed of are consolidated for the period during which they were under the Group’s control.
The Group operates a deferred compensation plan in the US which allows certain employees to make additional provision for retirement, through the deferral of salary with matching company contributions. Employees can draw down on the plan in certain limited circumstances during employment. The assets of the plan are held in a company-owned trust which is not consolidated as the relevant activity of the trust, being the investment of the funds in the trust, is directed by the participating employees of the plan and the company has no exposure to the gains and losses resulting from those investment decisions. The assets of the trust are held solely for the benefit of the participating employees and to pay plan expenses, other than in the case of a company insolvency in which case they can be claimed by the general creditors of the company. At 31 December 2014, the trust had assets with a fair value of $148m (2013 $135m).
STRATEG
IC REP
OR
TG
OVER
NAN
CE
GR
OU
P FIN
AN
CIA
L STATEMEN
TSPAR
ENT C
OM
PANY
FINAN
CIAL STATEM
ENTS
ADD
ITION
AL IN
FOR
MATIO
N
107
Accounting policies
Foreign currenciesTransactions in foreign currencies are translated to functional currency at the exchange rates ruling on the dates of the transactions. Monetary assets and liabilities denominated in foreign currencies are retranslated to the functional currency at the relevant rates of exchange ruling on the last day of the period. Foreign exchange differences arising on translation are recognised in the income statement except on foreign currency borrowings that provide a hedge against a net investment in a foreign operation. These are taken directly to the currency translation reserve until the disposal of the net investment, at which time they are recycled against the gain or loss on disposal.
The assets and liabilities of foreign operations, including goodwill, are translated into US dollars at the relevant rates of exchange ruling on the last day of the period. The revenues and expenses of foreign operations are translated into US dollars at average rates of exchange for the period. The exchange differences arising on the retranslation are taken directly to the currency translation reserve. On disposal of a foreign operation, the cumulative amount recognised in the currency translation reserve relating to that particular foreign operation is recycled against the gain or loss on disposal.
Property, plant and equipmentProperty, plant and equipment are stated at cost less depreciation and any impairment.
Repairs and maintenance costs are expensed as incurred.
Land is not depreciated. All other property, plant and equipment are depreciated to a residual value over their estimated useful lives, namely:
• buildings – lesser of 50 years and unexpired term of lease; and• fixtures, fittings and equipment – three to 25 years.
All depreciation is charged on a straight-line basis. Residual value is re-assessed annually.
Property, plant and equipment are tested for impairment when events or changes in circumstances indicate that the carrying value may not be recoverable. Assets that do not generate independent cash flows are combined into cash-generating units. If carrying values exceed their estimated recoverable amount, the assets or cash-generating units are written down to the recoverable amount. Recoverable amount is the greater of fair value less costs of disposal and value in use. Value in use is assessed based on estimated future cash flows discounted to their present value using a pre-tax discount rate that reflects current market assessments of the time value of money and the risks specific to the asset. Impairment losses, and any subsequent reversals, are recognised in the income statement.
On adoption of IFRS, the Group retained previous revaluations of property, plant and equipment which are included at deemed cost as permitted by IFRS 1 ‘First-time Adoption of International Financial Reporting Standards’.
GoodwillGoodwill arises on consolidation and is recorded at cost, being the excess of the cost of acquisition over the fair value at the date of acquisition of the Group’s share of identifiable assets, liabilities and contingent liabilities. Transaction costs are expensed and are not included in the cost of acquisition. Following initial recognition, goodwill is measured at cost less any accumulated impairment losses.
Goodwill is tested for impairment at least annually by comparing carrying values of cash-generating units with their recoverable amounts. Impairment losses cannot be subsequently reversed.
Intangible assetsSoftware Acquired and internally developed software are capitalised on the basis of the costs incurred to acquire and bring to use the specific software. Costs are amortised over estimated useful lives of three to five years on a straight-line basis.
Internally generated development costs are expensed unless forecast revenues exceed attributable forecast development costs, in which case they are capitalised and amortised over the estimated useful life of the asset.
Management contracts When assets are sold and a purchaser enters into a franchise or management contract with the Group, the Group capitalises as part of the gain or loss on disposal an estimate of the fair value of the contract entered into. The value of management contracts is amortised on a straight-line basis over the life of the contract including any extension periods at IHG’s option up to a maximum of 50 years.
Other intangible assets Amounts paid to hotel owners to secure management contracts and franchise agreements are capitalised and amortised on a straight-line basis over their estimated useful lives up to a maximum of 50 years. In prior years this has been determined to be the shorter of the contracted period and 10 years. Following a detailed review in early 2014 and based on the Group’s experience of the actual contractual periods secured by these payments, the estimate of useful life has been re-assessed to comprise the full contract term, which is also consistent with the stated policy of other companies in the hotel industry. This revision to the estimate of expected useful lives has been applied prospectively in accordance with IAS 38 and results in the following (decrease)/increase in the original amortisation profile of assets capitalised at 1 January 2014: 2014 $(5)m, 2015 $(5)m, 2016 $(4)m, 2017 $(3)m, 2018 and after $17m in total.
Intangible assets are reviewed for impairment when events or changes in circumstances indicate that the carrying value may not be recoverable.
IHG Annual Report and Form 20-F 2014
108
continuedAccounting policies
Borrowing costsBorrowing costs attributable to the acquisition or construction of property, plant and equipment or in respect of software projects that necessarily take a substantial period of time to prepare for their intended use, or sale, are capitalised as part of the asset cost. Borrowing costs consist of interest and other costs that an entity incurs in connection with the borrowing of funds. All borrowing costs relating to projects commencing before 1 January 2009 were expensed.
Associates and joint venturesAn associate is an entity over which the Group has significant influence. Significant influence is the power to participate in the financial and operating policy decisions of the entity, but is not control or joint control over those policies.
A joint venture exists when two or more parties have joint control over, and rights to the net assets of, the venture. Joint control is the contractually agreed sharing of control which only exists when decisions about the relevant activities require the unanimous consent of the parties sharing control.
Associates and joint ventures are accounted for using the equity method unless the associate or joint venture is classified as held for sale. Under the equity method, the Group’s investment is recorded at cost adjusted by the Group’s share of post-acquisition profits and losses and other movements in the investee’s reserves. When the Group’s share of losses exceeds its interest in an associate or joint venture, the Group’s carrying amount is reduced to $nil and recognition of further losses is discontinued except to the extent that the Group has incurred legal or constructive obligations or made payments on behalf of an associate or joint venture.
Financial assetsThe Group classifies its financial assets into one of the two following categories: loans and receivables or available-for-sale financial assets. Management determines the classification of financial assets on initial recognition and they are subsequently held at amortised cost (loans and receivables) or fair value (available-for-sale financial assets). Interest on loans and receivables is calculated using the effective interest rate method and is recognised in the income statement as interest income. Changes in fair values of available-for-sale financial assets are recorded directly in equity within the unrealised gains and losses reserve. On disposal, the accumulated fair value adjustments recognised in equity are recycled to the income statement. Dividends from available-for-sale financial assets are recognised in the income statement as other operating income and expenses.
Financial assets are assessed for impairment at each period-end date. In the case of an equity investment classified as available-for-sale, a significant or prolonged decline in fair value below cost is evidence that the asset is impaired. If an available-for-sale financial asset is impaired, the difference between original cost and fair value is transferred from equity to the income statement to the extent of any cumulative loss recorded in equity, with any excess charged directly to the income statement. Subsequent impairment reversals relating to previously impaired equity instruments are recorded in equity.
Trade receivablesTrade receivables are recorded at their original amount less provision for impairment. It is the Group’s policy to provide for 100% of the previous month’s aged receivables balances which are more than 180 days past due. Adjustments to the policy may be made due to specific or exceptional circumstances. The carrying amount of the receivable is reduced through the use of a provision account and movements in the provision are recognised in the income statement within cost of sales. When a previously provided trade receivable is uncollectable, it is written off against the provision.
Cash and cash equivalentsCash comprises cash in hand and demand deposits.
Cash equivalents are short-term highly liquid investments with an original maturity of three months or less that are readily convertible to known amounts of cash and subject to insignificant risk of changes in value.
In the statement of cash flows, cash and cash equivalents are shown net of short-term overdrafts which are repayable on demand and form an integral part of the Group’s cash management.
Assets held for saleAssets and liabilities are classified as held for sale when their carrying amount will be recovered principally through a sale transaction rather than continuing use and a sale is highly probable and expected to complete within one year. For a sale to be highly probable, management need to be committed to a plan to sell the asset and the asset must be actively marketed for sale at a price that is reasonable in relation to its current fair value.
Assets designated as held for sale are held at the lower of carrying amount at designation and fair value less costs to sell.
Depreciation is not charged against property, plant and equipment classified as held for sale.
Financial liabilities Financial liabilities are measured at amortised cost using the effective interest rate method. A financial liability is derecognised when the obligation under the liability expires, is discharged or is cancelled.
Offsetting of financial assets and financial liabilitiesFinancial assets and financial liabilities are offset and the net amount is reported in the Group statement of financial position if there is a currently enforceable legal right to offset the recognised amounts and there is an intention to settle on a net basis or to realise the assets and settle the liabilities simultaneously. To meet this criteria, the right of set-off must not be contingent on a future event and must be legally enforceable in all of the following circumstances: the normal course of business, the event of default and the event of insolvency or bankruptcy of the Group and all of the counterparties.
STRATEG
IC REP
OR
TG
OVER
NAN
CE
GR
OU
P FIN
AN
CIA
L STATEMEN
TSPAR
ENT C
OM
PANY
FINAN
CIAL STATEM
ENTS
ADD
ITION
AL IN
FOR
MATIO
N
109
Trade payablesTrade payables are non-interest-bearing and are stated at their nominal value.
Bank and other borrowings Bank and other borrowings are initially recognised at the fair value of the consideration received less directly attributable transaction costs. They are subsequently measured at amortised cost. Finance charges, including the transaction costs and any discount or premium on issue, are recognised in the income statement using the effective interest rate method.
Borrowings are classified as non-current when the repayment date is more than 12 months from the period-end date or where they are drawn on a facility with more than 12 months to expiry.
Derivative financial instruments and hedgingDerivatives are initially recognised and subsequently re-measured at fair value. The method of recognising the re-measurement depends on whether the derivative is designated as a hedging instrument, and if so, the nature of the item being hedged.
Changes in the fair value of derivatives designated as cash flow hedges are recorded in other comprehensive income and the unrealised gains and losses reserve to the extent that the hedges are effective. When the hedged item is recognised, the cumulative gains and losses on the related hedging instrument are reclassified to the income statement.
Changes in the fair value of derivatives designated as net investment hedges are recorded in other comprehensive income and the currency translation reserve to the extent that the hedges are effective. The cumulative gains and losses remain in equity until a foreign operation is sold, at which point they are reclassified to the income statement.
Changes in the fair value of derivatives which have either not been designated as hedging instruments or relate to the ineffective portion of hedges are recognised immediately in the income statement.
Documentation outlining the measurement and effectiveness of any hedging arrangements is maintained throughout the life of the hedge relationship.
Interest arising from currency derivatives and interest rate swaps is recorded in either financial income or expenses over the term of the agreement, unless the accounting treatment for the hedging relationship requires the interest to be taken to reserves.
Self insuranceLiabilities in respect of self insured risks include projected settlements for known and incurred but not reported claims. Projected settlements are estimated based on historical trends and actuarial data.
ProvisionsProvisions are recognised when the Group has a present obligation as a result of a past event, it is probable that a payment will be made and a reliable estimate of the amount payable can be made. If the effect of the time value of money is material, the provision is discounted using a current pre-tax discount rate that reflects the risks specific to the liability.
An onerous contract provision is recognised when the unavoidable costs of meeting the obligations under a contract exceed the economic benefits expected to be received under it.
In respect of litigation, provision is made when management consider it probable that payment may occur even though the defence of the related claim may still be ongoing through the court process.
TaxesCurrent tax Current income tax assets and liabilities for the current and prior periods are measured at the amount expected to be recovered from or paid to the tax authorities including interest. The tax rates and tax laws used to compute the amount are those that are enacted or substantively enacted at the end of the reporting period.
Deferred tax Deferred tax assets and liabilities are recognised in respect of temporary differences between the tax base and carrying value of assets and liabilities including accelerated capital allowances, unrelieved tax losses, unremitted profits from subsidiaries, gains rolled over into replacement assets, gains on previously revalued properties and other short-term temporary differences.
Deferred tax assets are recognised to the extent that it is regarded as probable that the deductible temporary differences can be realised. The recoverability of all deferred tax assets is re-assessed at the end of each reporting period.
Deferred tax is calculated at the tax rates that are expected to apply in the periods in which the asset or liability will be settled, based on rates enacted or substantively enacted at the end of the reporting period.
Retirement benefitsDefined contribution plans Payments to defined contribution schemes are charged to the income statement as they fall due.
Defined benefit plansPlan assets, including qualifying insurance policies, are measured at fair value and plan liabilities are measured on an actuarial basis, using the projected unit credit method and discounting at an interest rate equivalent to the current rate of return on a high-quality corporate bond of equivalent currency and term to the plan liabilities. The difference between the value of plan assets and liabilities at the period-end date is the amount of surplus or deficit recorded in the statement of financial position as an asset or liability. An asset is recognised when the employer has an unconditional right to use the surplus at some point during the life of the plan or on its wind-up. If a refund would be subject to a tax other than income tax, as is the case in the UK, the asset is recorded at the amount net of the tax. A liability is also recorded for any such tax that would be payable in respect of funding commitments based on the accounting assumption that the related payments increase the asset.
IHG Annual Report and Form 20-F 2014
110
continuedAccounting policies
The service cost of providing pension benefits to employees, together with the net interest expense or income for the year, is charged to the income statement within ‘administration expenses’. Net interest is calculated by applying the discount rate to the net defined benefit asset or liability, after any asset restriction. Past service costs and gains, which are the change in the present value of the defined benefit obligation for employee service in prior periods resulting from plan amendments, are recognised immediately the plan amendment occurs. Settlement gains and losses, being the difference between the settlement cost and the present value of the defined benefit obligations being settled, are recognised when the settlement occurs.
Re-measurements comprise actuarial gains and losses, the return on plan assets (excluding amounts included in net interest) and changes in the amount of any asset restrictions. Actuarial gains and losses may result from: differences between the actuarial assumptions underlying the plan liabilities and actual experience during the year or changes in the actuarial assumptions used in the valuation of the plan liabilities. Re-measurement gains and losses, and taxation thereon, are recognised in other comprehensive income and are not reclassified to profit or loss in subsequent periods.
Actuarial valuations are normally carried out every three years and are updated for material transactions and other material changes in circumstances (including changes in market prices and interest rates) up to the end of the reporting period.
Revenue recognitionRevenue arises from the sale of goods and provision of services where these activities give rise to economic benefits received and receivable by the Group on its own account and result in increases in equity.
Revenue is derived from the following sources: franchise fees; management fees; owned and leased properties and other revenues which are ancillary to the Group’s operations, including technology fee income.
Revenue is recorded (excluding VAT and similar taxes) net of discounts. The following is a description of the composition of revenues of the Group:
Franchise fees – received in connection with the licence of the Group’s brand names, usually under long-term contracts with the hotel owner. The Group charges franchise royalty fees as a percentage of rooms revenue. Revenue is recognised when the fee is earned in accordance with the terms of the contract.
Management fees – earned from hotels managed by the Group, usually under long-term contracts with the hotel owner. Management fees include a base fee, generally a percentage of hotel revenue, which is recognised when earned in accordance with the terms of the contract and an incentive fee, generally based on the hotel’s profitability or cash flows and recognised when the related performance criteria are met under the terms of the contract.
Owned and leased – primarily derived from hotel operations, including the rental of rooms and food and beverage sales from owned and leased hotels operated under the Group’s brand names. Revenue is recognised when rooms are occupied and food and beverages are sold.
Franchise fees and management fees include liquidated damages received from the early termination of contracts.
Other revenues are recognised when earned in accordance with the terms of the contract.
Government grantsGovernment grants are recognised in the period to which they relate when there is reasonable assurance that the grant will be received and that the Group will comply with the attached conditions. Government grants are recognised within other operating income and expenses in the Group income statement.
Share-based paymentsThe cost of equity-settled transactions with employees is measured by reference to fair value at the date at which the right to the shares is granted. Fair value is determined by an external valuer using option pricing models.
The cost of equity-settled transactions is recognised, together with a corresponding increase in equity, over the period in which any performance or service conditions are fulfilled, ending on the date on which the relevant employees become fully entitled to the award (vesting date).
The income statement charge for a period represents the movement in cumulative expense recognised at the beginning and end of that period. No expense is recognised for awards that do not ultimately vest, except for awards where vesting is conditional upon a market or non-vesting condition, which are treated as vesting irrespective of whether or not the market or non-vesting condition is satisfied, provided that all other performance and/or service conditions are satisfied.
LeasesOperating lease rentals are charged to the income statement on a straight-line basis over the term of the lease.
Assets held under finance leases, which transfer to the Group substantially all the risks and benefits incidental to ownership of the leased item, are capitalised at the inception of the lease, with a corresponding liability being recognised for the fair value of the leased asset or, if lower, the present value of the minimum lease payments. Lease payments are apportioned between the reduction of the lease liability and finance charges in the income statement so as to achieve a constant rate of interest on the remaining balance of the liability. Assets held under finance leases are depreciated over the shorter of the estimated useful life of the asset and the lease term.
Disposal of non-current assetsThe Group recognises sales proceeds and any related gain or loss on disposal on completion of the sales process. In determining whether the gain or loss should be recorded, the Group considers whether it:
• has a continuing managerial involvement to the degree associated with asset ownership;
• has transferred the significant risks and rewards associated with asset ownership; and
• can reliably measure and will actually receive the proceeds.
STRATEG
IC REP
OR
TG
OVER
NAN
CE
GR
OU
P FIN
AN
CIA
L STATEMEN
TSPAR
ENT C
OM
PANY
FINAN
CIAL STATEM
ENTS
ADD
ITION
AL IN
FOR
MATIO
N
111
Fair value measurementThe Group measures available-for-sale equity securities and derivatives at fair value on a recurring basis and other assets when impaired by reference to fair value less costs of disposal. Additionally, the fair value of other financial assets and liabilities require disclosure.
Fair value is the price that would be received to sell an asset or paid to transfer a liability in an orderly transaction between market participants. Fair value is measured by reference to the principal market for the asset or liability assuming that market participants act in their economic best interests.
The fair value of a non-financial asset assumes the asset is used in its highest and best use, either through continuing ownership or by selling it.
The Group uses valuation techniques that maximise the use of relevant observable inputs using the following valuation hierarchy:
Level 1: quoted (unadjusted) prices in active markets for identical assets or liabilities.
Level 2: other techniques for which all inputs which have a significant effect on the recorded fair value are observable, either directly or indirectly.
Level 3: techniques which use inputs which have a significant effect on the recorded fair value that are not based on observable market data.
Further disclosures on the particular valuation techniques used by the Group are provided in note 23.
For impairment testing purposes and where significant assets (such as property) are valued by reference to fair value less costs of disposal, an external valuation will normally be obtained using professional valuers who have appropriate market knowledge, reputation and independence.
Exceptional itemsThe Group discloses certain financial information both including and excluding exceptional items. The presentation of information excluding exceptional items allows a better understanding of the underlying trading performance of the Group and provides consistency with the Group’s internal management reporting. Exceptional items are identified by virtue of either their size or nature so as to facilitate comparison with prior periods and to assess underlying trends in financial performance. Exceptional items can include, but are not restricted to, gains and losses on the disposal of assets, impairment charges and reversals, restructuring costs and the release of tax provisions.
Treasury sharesOwn shares repurchased by the Company and not cancelled (treasury shares) are recognised at cost and deducted from retained earnings. If reissued, any excess of consideration over carrying amount is recognised in the share premium reserve.
Critical accounting policies and the use of judgements, estimates and assumptionsIn determining and applying the Group’s accounting policies, management are required to make judgements, estimates and assumptions. An accounting policy is considered to be critical if its selection or application could materially affect the reported amounts of assets and liabilities, disclosure of contingent assets and liabilities at the date of the financial statements and the reported amounts of revenues and expenses during the reporting period. Management consider accounting for the System Fund to be a critical judgement and that critical estimates and assumptions are used in impairment testing and for measuring the loyalty programme liability, tax assets and liabilities, and litigation provisions, as discussed in further detail below. Estimates and assumptions are evaluated by management using historical experience and other factors believed to be reasonable based on current circumstances. Actual results could differ under different policies, judgements, estimates and assumptions or due to unforeseen circumstances.
System Fund – in addition to management or franchise fees, hotels within the IHG System pay cash assessments and contributions which are collected by IHG for specific use within the System Fund (the Fund). The Fund also receives proceeds from the sale of IHG Rewards Club points. IHG exerts significant influence over the operation of the Fund, however the Fund is managed for the benefit of hotels in the System with the objective of driving revenues for the hotels. The Fund is used to pay for marketing, the IHG Rewards Club loyalty programme and the global reservation system. The Fund is planned to operate at breakeven with any short-term timing surplus or deficit carried in the Group statement of financial position within working capital.
As all Fund income is designated for specific purposes and does not result in a profit or loss for the Group, the revenue recognition criteria as outlined in the accounting policy above are not met and therefore the income and expenses of the Fund are not included in the Group income statement.
The assets and liabilities relating to the Fund are included in the appropriate headings in the Group statement of financial position as the related legal, but not beneficial, rights and obligations rest with the Group. These assets and liabilities include the IHG Rewards Club liability, short-term timing surpluses and deficits and any receivables and payables related to the Fund.
The cash flows relating to the Fund are reported within ‘cash flow from operations’ in the Group statement of cash flows due to the close interrelationship between the Fund and the trading operations of the Group.
Further information on the Fund is included in note 32.
IHG Annual Report and Form 20-F 2014
112
continuedAccounting policies
Loyalty programme – the hotel loyalty programme, IHG Rewards Club, enables members to earn points, funded through hotel assessments, during each qualifying stay at an IHG branded hotel and redeem points at a later date for free accommodation or other benefits. The future redemption liability is calculated by multiplying the number of points expected to be redeemed by the redemption cost per point. On an annual basis the Group engages an external actuary who uses statistical formulas to assist in the estimate of the number of points that will never be redeemed (‘breakage’). Actuarial gains and losses on the future redemption liability are borne by the System Fund and any resulting changes in the liability would correspondingly adjust the amount of short-term timing surpluses and deficits held in the Group statement of financial position. The future redemption liability, which is included in trade and other payables, was $725m at 31 December 2014. Based on the conditions existing at the balance sheet date, a 1% decrease in the breakage estimate would increase this liability by approximately $7m.
Impairment testing – intangible assets, property, plant and equipment are tested for impairment when events or circumstances indicate that their carrying value may not be recoverable. Goodwill is subject to an impairment test on an annual basis or more frequently if there are indicators of impairment. Assets that do not generate independent cash flows are combined into cash-generating units.
The impairment testing of individual assets or cash-generating units requires an assessment of the recoverable amount of the asset or cash-generating unit. If the carrying value of the asset or cash-generating unit exceeds its estimated recoverable amount, the asset or cash-generating unit is written down to its recoverable amount. Recoverable amount is the greater of fair value less costs of disposal and value in use. Value in use is assessed based on estimated future cash flows discounted to their present value using a pre-tax discount rate that is based on the Group’s weighted average cost of capital adjusted to reflect the risks specific to the business model and territory of the cash-generating unit or asset being tested. The outcome of such an assessment is subjective, and the result sensitive to the assumed future cash flows to be generated by the cash-generating units or assets and discount rates applied in calculating the value in use.
At 31 December 2014, the Group had intangible assets of $569m and property, plant and equipment of $741m, none of which were subject to an impairment charge during the year. In respect of those assets requiring an impairment test and depending on how recoverable amount was assessed, a 10% reduction in fair value or estimated future cash flows would have resulted in an impairment loss of $7m.
Information on impairment testing of goodwill, which had a net book value of $74m at 31 December 2014, is included in note 12.
Income taxes – deferred tax assets are recognised to the extent that it is regarded as probable that deductible temporary differences can be realised. The Group estimates deferred tax assets and liabilities based on current tax laws and rates, and in certain cases, business plans, including management’s expectations regarding the manner and timing of recovery of the related assets. Changes in these estimates may affect the amount of deferred tax liabilities or the valuation of deferred tax assets and therefore the tax charge in the income statement.
Provisions for tax liabilities require judgements on the interpretation of tax legislation, developments in case law and the potential outcomes of tax audits and appeals which may be subject to significant uncertainty. Therefore the actual results may vary from expectations resulting in adjustments to provisions, the valuation of deferred tax assets, cash tax settlements, and therefore the tax charge in the income statement.
Exceptional tax charges and credits arose in 2013 and 2012 as explained in note 7.
Litigation – from time to time, the Group is subject to legal proceedings the ultimate outcome of each being always subject to many uncertainties inherent in litigation. A provision for litigation is made when it is considered probable that a payment will be made and the amount of the loss can be reasonably estimated. Significant judgement is made when evaluating, amongst other factors, the probability of unfavourable outcome and the ability to make a reasonable estimate of the amount of potential loss. Litigation provisions are reviewed at each accounting period and revisions made for changes in facts and circumstances.
New standards issued but not effectiveThe new and amended accounting standards discussed below are those which are expected to be relevant to the Group’s financial statements.
From 1 January 2015, the Group will apply the amendments to existing standards arising from the 2010-2012 and 2011-2013 annual improvements cycles.
From 1 January 2016, the Group will apply Amendments to IAS 16 and IAS 38 ‘Clarification of Acceptable Methods of Depreciation and Amortisation’ and Amendments to IFRS 11 ‘Accounting for Acquisition of Interests in Joint Operations’.
The above amendments are not expected to have a material impact on the Group’s reported performance or financial position.
IFRS 15 ‘Revenue from Contracts with Customers’ introduces a new five-step approach to measuring and recognising revenue and is effective from 1 January 2017.
IFRS 9 ‘Financial Instruments’ was issued as a final standard in July 2014 and is effective from 1 January 2018. The standard introduces new requirements for classification and measurement of financial assets and financial liabilities, impairment and hedge accounting.
The Group is currently assessing the impacts of IFRS 15 and IFRS 9 and plans to adopt both standards on the required effective dates.
Reportable segments’ operating profit 651Exceptional operating items (note 5) 29Operating profit 680Net finance costs (80)Profit before tax 600Tax (208)Profit for the year 392
All items above relate to continuing operations.
1. Exchange rates
The results of operations have been translated into US dollars at the average rates of exchange for the year. In the case of sterling, the translation rate is $1=£0.61 (2013 $1=£0.64, 2012 $1=£0.63). In the case of the euro, the translation rate is $1=€0.75 (2013 $1=€0.75, 2012 $1=€0.78).
2. Segmental information
The management of the Group’s operations, excluding Central functions, is organised within four geographical regions:
• Americas;• Europe;• Asia, Middle East and Africa (AMEA); and • Greater China.
These, together with Central functions, comprise the Group’s five reportable segments. No operating segments have been aggregated to form these reportable segments.
Central functions include costs of global functions including technology, sales and marketing, finance, human resources and corporate services; central revenue arises principally from technology fee income. Central liabilities include the loyalty
Assets and liabilities have been translated into US dollars at the rates of exchange on the last day of the year. In the case of sterling, the translation rate is $1=£0.64 (2013 $1=£0.60, 2012 $1=£0.62). In the case of the euro, the translation rate is $1=€0.82 (2013 $1=€0.73, 2012 $1=€0.76).
programme liability and the cumulative short-term System Fund surplus.
Each of the geographical regions derives its revenues from either franchising, managing or owning hotels and additional segmental disclosures are provided accordingly.
Management monitors the operating results of the geographical regions and Central functions separately for the purpose of making decisions about resource allocation and performance assessment. Segmental performance is evaluated based on operating profit or loss and is measured consistently with operating profit or loss in the Consolidated Financial Statements, excluding exceptional items. Group financing activities and income taxes are managed on a group basis and are not allocated to reportable segments.
Notes to the Group Financial Statements
IHG Annual Report and Form 20-F 2014
114
2. Segmental information continued
31 December 2014Americas
$mEurope
$mAMEA
$m
Greater China
$mCentral
$mGroup
$m
Assets and liabilitiesSegment assets 919 316 244 394 346 2,219Assets classified as held for sale – 310 – – – 310
Reportable segments’ operating profit 605Exceptional operating items (note 5) (4)Operating profit 601Net finance costs (54)Profit before tax 547Tax (9)Profit for the year 538
All items above relate to continuing operations.
Year ended 31 December 2012Americas
$mEurope
$mAMEA
$m
Greater China
$mCentral
$mGroup
$m
Other segmental information
Capital expenditure 25 19 6 7 76 133Non-cash items:
Depreciation and amortisation1 20 23 14 15 22 94Reversal of previously recorded impairment (23) – – – – (23)Write-off of software – – – – 18 18Demerger liability released – – – – (9) (9)Share-based payments cost – – – – 22 22Share of profits of associates and joint ventures – – (3) – – (3)
1 Included in the $94m of depreciation and amortisation is $31m relating to administrative expenses and $63m relating to cost of sales.
continuedNotes to the Group Financial Statements
IHG Annual Report and Form 20-F 2014
118
2. Segmental information continued
Geographical information
Year ended31 December
2014$m
Year ended31 December
2013$m
Year ended31 December
2012$m
RevenueUnited Kingdom 75 90 152United States 786 843 769People’s Republic of China (including Hong Kong) 254 247 238Rest of World 743 723 676
1,858 1,903 1,835
For the purposes of the above table, hotel revenue is determined according to the location of the hotel and other revenue is attributed to the country of origin. In addition to the United Kingdom, revenue relating to an individual country is separately disclosed when it represents 10% or more of total revenue.
31 December2014
$m
31 December2013
$m
Non-current assetsUnited Kingdom 136 131United States 811 705France – 342People’s Republic of China (including Hong Kong) 318 326Rest of World 238 268
1,503 1,772
For the purposes of the above table, non-current assets comprise property, plant and equipment, goodwill, intangible assets, investments in associates and joint ventures and trade and other receivables. In addition to the United Kingdom, non-current assets relating to an individual country are separately disclosed when they represent 10% or more of total non-current assets, as defined above.
STRATEG
IC REP
OR
TG
OVER
NAN
CE
GR
OU
P FIN
AN
CIA
L STATEMEN
TSPAR
ENT C
OM
PANY
FINAN
CIAL STATEM
ENTS
ADD
ITION
AL IN
FOR
MATIO
N
119
3. Staff costs and Directors’ emoluments
2014$m
2013 $m
2012$m
StaffCosts:
Wages and salaries 577 580 547Social security costs 42 41 44Pension and other post-retirement benefits:
Average number of employees, including part-time employees:Americas 2,191 2,548 2,552Europe 1,557 1,602 1,866Asia, Middle East and Africa 1,451 1,545 1,195Greater China 1,092 1,083 1,051Central 1,506 1,401 1,317
7,797 8,179 7,981
The costs of the above employees are borne by IHG. Of these, 92% were employed on a full-time basis and 8% were employed on a part-time basis.
In addition to the above, the Group has employees who work directly on behalf of the System Fund and whose costs are borne by the Fund as disclosed in note 32. In line with IHG’s business model, IHG also employs 602 (2013 578, 2012 587) General Managers who work in the managed hotels and whose total costs of $142m (2013 $135m, 2012 $132m) are borne by those hotels and, in the US predominantly, there are 11,848 (2013 10,834, 2012 11,053) other hotel workers in the managed hotels who have contracts or letters of service with IHG whose total costs of $449m (2013 $383m, 2012 $437m) are borne by those hotels.
2014$m
2013$m
2012$m
Directors’ emolumentsBase salaries, fees, performance payments and benefits¹ 9.0 8.5 9.7Pension benefits under defined contribution plans 0.2 0.4 0.2
¹ Excludes ICETUS cash-out payment of £9.4m (see Directors’ Remuneration Report, page 85).
More detailed information on the emoluments, pensions, option holdings and shareholdings for each Director is shown in the Directors’ Remuneration Report on pages 76 to 91.
4. Auditor’s remuneration paid to Ernst & Young LLP
2014$m
2013$m
2012$m
Audit of the Financial Statements 2.4 2.0 2.8Audit of subsidiaries 2.0 1.4 1.5Audit-related assurance services 0.2 0.5 1.0Other assurance services 0.9 1.2 1.4Tax compliance 0.2 0.2 0.3Tax advisory 0.3 0.4 0.2Other non-audit services not covered by the above 0.1 0.1 –
6.1 5.8 7.2
Audit fees in respect of the pension scheme were not material.
Venezuelan currency loss a (14) – –Pension settlement cost b (6) (147) –Reorganisation costs c (29) – (16)UK portfolio restructuring d (45) – –Kimpton acquisition costs e (7) – –Litigation f – (10) –Loyalty programme rebranding costs g – (10) –
(101) (167) (16)Share of profits of associates and joint ventures:
Share of gain on disposal of a hotel (note 14) – 6 –
Other operating income and expenses:Gain/(loss) on disposal of hotels (note 11) 130 166 (2)Write-off of software h – – (18)Demerger liability released i – – 9
130 166 (11)
Reversals of previously recorded impairment:Property, plant and equipment j – – 23
– – 2329 5 (4)
TaxTax on exceptional operating items k (29) (6) 1Exceptional tax l – (45) 141
(29) (51) 142
All items above relate to continuing operations.
The above items are treated as exceptional by reason of their size or nature, as further described on page 112.a Relates to the introduction of the SICAD II exchange rate on 24 March 2014 and its adoption by the Group. Of the three exchange rate mechanisms that currently
exist in Venezuela, SICAD II is the most accessible to the Group for converting its bolivar earnings into US dollars. The exceptional loss arises from the one-off re-measurement of the Group’s bolivar assets and liabilities from the ‘official’ exchange rate ($1=6.3 VEF) to the SICAD II exchange rate (approximately $1=50 VEF). The Group has used the SICAD II exchange rate for translating the results of its Venezuelan operations since 1 April 2014.
b In 2014, results from a partial cash-out of the UK unfunded pension arrangements and, in 2013, resulted from a buy-in (and subsequent buy-out in 2014) of the Group’s UK funded defined benefit obligations with the insurer, Rothesay Life. See note 25 for further details.
c In 2014, relates primarily to costs incurred in introducing a new HR operating model across the business to provide enhanced management information and more efficient processes, and to implement more efficient processes and procedures in the Group’s Global Technology infrastructure to help mitigate future cost increases. In 2012, arose from a reorganisation of the Group’s support functions together with a restructuring within the AMEA region.
d Relates to the costs of securing a restructuring of the UK hotel portfolio which will result in the transfer of 61 managed hotels to franchise contracts.e Relates to acquisition transaction costs incurred in the period to 31 December 2014 on the acquisition of Kimpton, which completed on 16 January 2015
(see note 33).f Related to an agreed settlement in respect of a lawsuit filed against the Group in the Greater China region.g Related to costs incurred in support of the worldwide rebranding of IHG Rewards Club that was announced 1 July 2013.h Software disposals in 2012 included an exceptional write-off of $18m resulting from a re-assessment of the ongoing value of elements of the technology
infrastructure.i Resulted from a release of a liability no longer required which arose on the demerger of the Group from Six Continents PLC.j In 2012, a previously recorded impairment charge relating to a North American hotel was reversed in full following a re-assessment of its recoverable amount,
based on the market value of the hotel as determined by an independent professional property valuer.k In 2014, the charge comprises $56m relating to the disposal of an 80.1% interest in the InterContinental New York Barclay offset by a credit of $27m relating
to a restructuring of the UK hotel portfolio and other reorganisation costs.l In 2013, comprised a deferred tax charge of $63m consequent on the disposal of the InterContinental London Park Lane hotel, together with charges and credits
of $38m and $19m respectively from associated restructurings (including intra-group dividends) and refinancings, offset by the recognition of $37m of previously unrecognised tax credits. In 2012, represented the recognition of $104m of deferred tax assets, principally relating to pre-existing overseas tax losses, whose value had become more certain as a result of a change in law and the resolution of prior period tax matters, together with the associated release of $37m of provisions.
STRATEG
IC REP
OR
TG
OVER
NAN
CE
GR
OU
P FIN
AN
CIA
L STATEMEN
TSPAR
ENT C
OM
PANY
FINAN
CIAL STATEM
ENTS
ADD
ITION
AL IN
FOR
MATIO
N
121
6. Finance costs
2014$m
2013$m
2012$m
Financial incomeInterest income on deposits 2 4 2Unwinding of discount on other financial assets 1 1 1
3 5 3Financial expensesInterest expense on borrowings 66 59 37Interest rate swaps fair value transferred from equity – – 1Finance charge payable under finance leases 19 19 19Capitalised interest (2) – –
83 78 57
Interest income and expense relate to financial assets and liabilities held at amortised cost, calculated using the effective interest rate method.
Included within interest expense is $2m (2013 $2m, 2012 $2m) payable to the IHG Rewards Club loyalty programme relating to interest on the accumulated balance of cash received in advance of the redemption of points awarded.
The rate used for capitalisation of interest was 4.4%.
7. Tax
Tax on profit Note2014
$m2013
$m2012
$m
Income taxUK corporation tax at 21.50% (2013 23.25%, 2012 24.50%):
Current period 5 62 21Benefit of tax reliefs on which no deferred tax previously recognised a – (49) –Adjustments in respect of prior periods b 2 – (34)
7 13 (13)Foreign tax: c
Current period 156 184 170Benefit of tax reliefs on which no deferred tax previously recognised (2) (42) (31)Adjustments in respect of prior periods b (26) (17) (27)
128 125 112Total current tax 135 138 99Deferred tax:
Origination and reversal of temporary differences 68 122 7Changes in tax rates 2 (1) (2)Adjustments to estimated recoverable deferred tax assets 1 (39) (105)Adjustments in respect of prior periods 2 6 10
Total deferred tax 73 88 (90)Total income tax charge for the year 208 226 9
Further analysed as tax relating to:Profit before exceptional items 179 175 151Exceptional items:
All items above relate to continuing operations.a In 2013, included $45m in respect of the utilisation of unrecognised capital losses against the gain on disposal of the InterContinental London Park Lane hotel.b In 2012, included $37m of exceptional credits included within exceptional tax (see note 5) together with other releases relating to tax matters which have been
settled or in respect of which the relevant statutory limitation period has expired.c Represents corporate income taxes on profit taxable in foreign jurisdictions, a significant proportion of which relates to the Group’s US subsidiaries.
continuedNotes to the Group Financial Statements
IHG Annual Report and Form 20-F 2014
122
7. Tax continued
Total1 Before exceptional items2
2014%
2013 %
2012%
2014%
2013%
2012%
Reconciliation of tax charge, including gain on disposal of assetsUK corporation tax at standard rate 21.5 23.3 24.5 21.5 23.3 24.5Non-deductible expenditure and non-taxable income 4.9 16.6 2.0 1.0 1.9 1.0Non-recoverable withholding taxes 0.4 1.2 2.0 0.4 1.2 2.0Net effect of different rates of tax in overseas businesses 11.5 11.6 7.7 12.8 11.9 7.8Effect of changes in tax rates 0.3 (0.1) (0.3) 0.1 (0.1) (0.1)Benefit of tax reliefs on which no deferred tax previously recognised (0.4) (15.0) (5.6) (0.3) (1.1) (5.6)Effect of adjustments to estimated recoverable deferred tax assets 0.2 (6.4) (19.4) (0.2) (4.9) (0.2)Adjustment to tax charge in respect of prior periods (3.7) (2.2) (9.8) (3.9) (2.1) (2.5)Deferred tax provision on unremitted earnings – 10.5 – – – –Other – (1.8) 0.4 – (0.6) 0.5
34.7 37.7 1.5 31.4 29.5 27.4
1 Calculated in relation to total profits including exceptional items.2 Calculated in relation to profits excluding exceptional items.
Tax paidTotal net tax paid during the year of $136m (2013 $97m, 2012 $122m) comprises $136m (2013 $92m, 2012 $119m) paid in respect of operating activities and $nil (2013 $5m, 2012 $3m) paid in respect of investing activities.
Tax paid represents an effective rate of 23% (2013 16%, 2012 22%) on total profits and is lower than the effective income statement tax rate of 31% (2013 29%, 2012 27%) primarily due to the impact of deferred taxes (including the realisation of assets such as tax losses), the receipt of refunds in respect of prior years and provisions for tax for which no payment of tax has currently been made.
Corporation tax liabilities did not arise in 2014 in the UK and are not expected to arise for a number of years thereafter due to expenses and associated tax losses attributable principally to employment matters, in particular additional shortfall contributions made to the UK pension plan in the years 2007 to 2013.
Deferred tax
Property, plant and
equipment $m
Deferred gains on
loan notes $m
Deferred gains on
investments$m
Losses $m
Employee benefits
$m
Intangible assets
$m
Undistributed earnings of
subsidiaries$m
Other short-term temporary
differences1 $m
Total $m
At 1 January 2013 236 114 – (215) (63) 33 – (155) (50)Income statement 1 (8) – 20 2 2 63 8 88Statement of comprehensive income – – – – 24 – – – 24Statement of changes in equity – – – – – – – 4 4Exchange and other adjustments 3 1 – 9 – (1) 3 (14) 1At 31 December 2013 240 107 – (186) (37) 34 66 (157) 67Income statement (55) – 108 17 3 22 (19) (3) 73Statement of comprehensive income – – – – (8) – – 1 (7)Statement of changes in equity – – – – – – – (3) (3)Exchange and other adjustments (11) (2) – 15 1 (4) (3) – (4)At 31 December 2014 174 105 108 (154) (41) 52 44 (162) 126
1 Primarily relates to provisions, accruals, amortisation and share-based payments.
2014
$m2013
$m
Analysed as:Deferred tax assets (87) (108)Deferred tax liabilities 147 175Liabilities held for sale 66 –
126 67
Deferred gains on loan notes includes $55m (2013 $55m) which is expected to fall due for payment in 2016.
The deferred tax asset recognised in respect of losses of $154m (2013 $186m) includes $50m (2013 $53m) in respect of capital losses available to be utilised against the realisation of capital gains which are recognised as a deferred tax liability and $104m (2013 $133m) in respect of revenue tax losses. Deferred tax assets of $20m (2013 $17m) are recognised in relation to legal entities which suffered a tax loss in the current or preceding period. These assets are recognised based upon future taxable profit forecasts for the entities concerned. Deferred gains on investments represent taxable gains which would crystallise upon a sale of a related joint venture, associate or other equity investment. The balance relates to the Barclay associate described in note 14.
STRATEG
IC REP
OR
TG
OVER
NAN
CE
GR
OU
P FIN
AN
CIA
L STATEMEN
TSPAR
ENT C
OM
PANY
FINAN
CIAL STATEM
ENTS
ADD
ITION
AL IN
FOR
MATIO
N
123
7. Tax continued
The Group has unrecognised deferred tax assets as follows:2014
1 These may be carried forward indefinitely other than $11m which expires after two years, $1m which expires after six years, $8m which expires after seven years, $1m which expires after eight years and $2m which expires after nine years (2013 $12m which expires after three years and $1m which expires after seven years, $1m which expires after eight years and $9m which expires after nine years).
2 Primarily relates to provisions, accruals, amortisation and share-based payments.
These assets have not been recognised as the Group does not currently anticipate being able to offset these against future profits or gains in order to realise any economic benefit in the foreseeable future. However, future benefits may arise as a result of resolving tax uncertainties, or as a consequence of case law and legislative developments which make the value of the assets more certain.
The Group has provided deferred tax in relation to temporary differences associated with post-acquisition undistributed earnings of subsidiaries only to the extent that it is either probable that it will reverse in the foreseeable future or where the Group cannot control the timing of the reversal. The remaining unprovided liability that would arise on the reversal of these temporary differences is not expected to exceed $10m (2013 $10m).
Tax risks, policies and governanceInformation concerning the Group’s tax governance can be found in the Taxation section of the Strategic Report on page 49.
8. Dividends and shareholder returns
2014cents per
share
2013cents per
share
2012cents per
share2014
$m2013
$m2012
$m
Paid during the year:Final (declared for previous year) 47.0 43.0 39.0 122 115 113Interim 25.0 23.0 21.0 57 63 61Special (note 27) 293.0 133.0 172.0 763 355 505
365.0 199.0 232.0 942 533 679
Proposed (not recognised as a liability at 31 December):Final 52.0 47.0 43.0 122 121 115
The final dividend of 33.8p (52.0¢ converted at the closing exchange rate on 13 February 2015) is proposed for approval at the Annual General Meeting (AGM) on 8 May 2015 and is payable on the shares in issue at 7 April 2015.
Under the $500m share repurchase programme announced 7 August 2012, in the year to 31 December 2014, 3.4m (2013 9.8m, 2012 4.1m) shares were repurchased for a consideration of $110m (2013 $283m, 2012 $107m), increasing the total amount repurchased to $500m. Of the 3.4m (2013 9.8m, 2012 4.1m) shares repurchased in 2014, 2.7m (2013 9.8m, 2012 nil) are held as treasury shares and 0.7m (2013 nil, 2012 4.1m) were cancelled. The cost of treasury shares has been deducted from retained earnings.
On 2 May 2014, the Company announced a $750m return to shareholders by way of a special dividend and share consolidation. On 30 June 2014, shareholders approved the share consolidation at a General Meeting of the Company on the basis of 12 new ordinary shares of 15265/329p per share for every 13 existing ordinary shares of 14194/329p each, which became effective on 1 July 2014. The special dividend of 293.0¢ per share was paid to shareholders on 14 July 2014.
continuedNotes to the Group Financial Statements
IHG Annual Report and Form 20-F 2014
124
9. Earnings per ordinary share
Basic earnings per ordinary share is calculated by dividing the profit for the year available for IHG equity holders by the weighted average number of ordinary shares, excluding investment in own shares, in issue during the year.
Diluted earnings per ordinary share is calculated by adjusting basic earnings per ordinary share to reflect the notional exercise of the weighted average number of dilutive ordinary share awards outstanding during the year.
Adjusted earnings per ordinary share is disclosed in order to show performance undistorted by exceptional items, to give a more meaningful comparison of the Group’s performance.
Continuing and total operations 2014 2013 2012
Basic earnings per ordinary shareProfit available for equity holders ($m) 391 372 537Basic weighted average number of ordinary shares (millions) 247 264 287Basic earnings per ordinary share (cents) 158.3 140.9 187.1Diluted earnings per ordinary shareProfit available for equity holders ($m) 391 372 537Diluted weighted average number of ordinary shares (millions) 250 267 292Diluted earnings per ordinary share (cents) 156.4 139.3 183.9Adjusted earnings per ordinary shareProfit available for equity holders ($m) 391 372 537Adjusting items (note 5):
Adjusted earnings ($m) 391 418 399Basic weighted average number of ordinary shares (millions) 247 264 287Adjusted earnings per ordinary share (cents) 158.3 158.3 139.0Adjusted diluted earnings per ordinary shareAdjusted earnings ($m) 391 418 399Diluted weighted average number of ordinary shares (millions) 250 267 292Adjusted diluted earnings per ordinary share (cents) 156.4 156.6 136.6
2014millions
2013millions
2012millions
Diluted weighted average number of ordinary shares is calculated as:Basic weighted average number of ordinary shares 247 264 287Dilutive potential ordinary shares 3 3 5
250 267 292
STRATEG
IC REP
OR
TG
OVER
NAN
CE
GR
OU
P FIN
AN
CIA
L STATEMEN
TSPAR
ENT C
OM
PANY
FINAN
CIAL STATEM
ENTS
ADD
ITION
AL IN
FOR
MATIO
N
125
10. Property, plant and equipment
Land andbuildings
$m
Fixtures, fittings and equipment
$mTotal
$m
CostAt 1 January 2013 995 824 1,819Additions 96 54 150Disposals (2) (8) (10)Exchange and other adjustments 12 1 13At 31 December 2013 1,101 871 1,972Additions 27 52 79Transfers to non-current assets classified as held for sale (276) (171) (447)Disposals (144) (61) (205)Exchange and other adjustments (8) (20) (28)At 31 December 2014 700 671 1,371Depreciation and impairmentAt 1 January 2013 (146) (617) (763)Provided (11) (35) (46)System Fund expense – (4) (4)Disposals 2 8 10Exchange and other adjustments (1) 1 –At 31 December 2013 (156) (647) (803)Provided (11) (32) (43)System Fund expense – (4) (4)Transfers to non-current assets classified as held for sale 8 107 115Disposals 37 58 95Exchange and other adjustments – 10 10At 31 December 2014 (122) (508) (630)Net book valueAt 31 December 2014 578 163 741At 31 December 2013 945 224 1,169At 1 January 2013 849 207 1,056
The Group’s property, plant and equipment mainly comprises hotels, but also offices, throughout the world. In addition to the hotels included above, there was one hotel (2013 one hotel) classified as held for sale at 31 December 2014 (see note 11). Including the hotels classified as held for sale, 75% (2013 81%) of the net book value relates to the three (2013 four) largest owned and leased hotels (in terms of net book value) of a total of 10 hotels (2013 12 hotels), nine of which are open (2013 nine open). At 31 December 2014, there was one hotel (2013 three hotels) with a net book value of $36m (2013 $70m) which is under construction, not yet in use and therefore not being depreciated.
The carrying value of property, plant and equipment held under finance leases at 31 December 2014 was $186m (2013 $187m).
Including assets classified as held for sale, 40% (2013 55%) of hotel properties by net book value were directly owned, with 22% (2013 39%) held under leases having a term of 50 years or longer.
All impairment charges and reversals are included within impairment on the face of the Group income statement.
There are no charges over the Group’s property, plant and equipment.
The table below analyses the net book value of the Group’s property, plant and equipment by operating segment at 31 December 2014:
Americas$m
Europe$m
AMEA$m
Greater China
$mCentral
$mTotal
$m
Land and buildings 302 – 7 254 15 578Fixtures, fittings and equipment 40 – 11 44 68 163
342 – 18 298 83 741
continuedNotes to the Group Financial Statements
IHG Annual Report and Form 20-F 2014
126
11. Assets sold and held for sale
Assets sold Principal disposals during the year ended 31 December 2014 were the sale of the InterContinental Mark Hopkins San Francisco on 27 March 2014 and the disposal of an 80.1% interest in the InterContinental New York Barclay on 31 March 2014. The Group’s 19.9% retained interest is accounted for as an associate as described in note 14. Both transactions took place in the Americas region.
During the year ended 31 December 2013, the Group sold one hotel in the Europe region, the InterContinental London Park Lane.
During the year ended 31 December 2012, the Group sold an interest in a hotel in the Europe region.
2014$m
2013$m
2012$m
ConsiderationCurrent year disposals:
Cash consideration, net of costs paid 345 460 4Other financial assets¹ 52 – –Intangible assets – management contracts 50 40 –Investment in associate 22 – –
469 500 4Net assets disposed:
Property, plant and equipment (110) – (6)Non-current assets held for sale (228) (294) –Other financial asset (5) – –Net current liabilities 4 6 –
(339) (288) (6)Exchange losses recycled from currency translation reserve – (46) –Gain/(loss) on disposal of hotels from continuing operations 130 166 (2)
Net cash inflowCurrent year disposals:
Cash consideration, net of costs paid 345 460 4Distribution from associate on sale of hotel – 17 –Tax – (5) –
Prior year disposals:Tax – – (3)
345 472 1
¹ Includes $27m deferred consideration subsequently received and included within Proceeds from other financial assets in the Group statement of cash flows.
Assets held for saleOne hotel, the InterContinental Paris – Le Grand, met the held for sale criteria of IFRS 5 at 31 December 2014. More information can be found in the performance section of the Strategic Report on page 34. One hotel, the InterContinental New York Barclay, was held for sale at 31 December 2013.
2014$m
2013$m
Assets and liabilities held for saleAssets classified as held for sale:
Property, plant and equipment 306 228Other assets 4 –
CostAt 1 January 221 234Exchange adjustments (6) (13)At 31 December 215 221Impairment At 1 January and 31 December (141) (141)Net book valueAt 31 December 74 80At 1 January 80 93
Goodwill arising on business combinations that occurred before 1 January 2005 was not restated on adoption of IFRS as permitted by IFRS 1.
All cumulative impairment losses relate to the Americas managed cash-generating unit (CGU).
Goodwill has been allocated to CGUs for impairment testing as follows:
Asia, Middle East and Africa (AMEA) goodwillThe Group tests goodwill for impairment annually, or more frequently if there are any indications that an impairment may have arisen. The recoverable amounts of the CGUs are determined from value in use calculations. These calculations use pre-tax cash flow forecasts derived from the most recent financial budgets and strategic plans approved by management covering a five-year period using growth rates based on management’s past experience and industry growth forecasts.
At 31 December 2014, the recoverable amount of the CGU has been assessed based on the approved budget for 2015 and strategic plans covering a five-year period, a perpetual growth rate of 3.5% (2013 3.5%) and a discount rate of 13.7% (2013 15.5%). The perpetual growth rates do not exceed the average long-term growth rates for the relevant markets. Pre-tax discount rates are used to discount the cash flows based on the Group’s weighted average cost of capital adjusted to reflect the risks specific to the business model and territory of the CGU being tested.
Impairment was not required at either 31 December 2014 or 31 December 2013 and management have determined that the carrying value of the CGU would only exceed its recoverable amount in the event of highly unlikely changes in the key assumptions.
continuedNotes to the Group Financial Statements
IHG Annual Report and Form 20-F 2014
128
13. Intangible assets
Software$m
Managementcontracts
$m
Otherintangibles
$mTotal
$m
CostAt 1 January 2013 325 235 151 711Additions 79 40 16 135Disposals (8) – (7) (15)Exchange and other adjustments (1) 2 (1) –At 31 December 2013 395 277 159 831Additions 108 50 55 213Disposals (31) – (5) (36)Exchange and other adjustments (1) (17) (2) (20)At 31 December 2014 471 310 207 988Amortisation and impairmentAt 1 January 2013 (163) (126) (68) (357)Provided (21) (7) (11) (39)System Fund expense (12) – – (12)Disposals 8 – 7 15Exchange and other adjustments (1) 2 (1) –At 31 December 2013 (189) (131) (73) (393)Provided (33) (9) (11) (53)System Fund expense (15) – – (15)Disposals 31 – 4 35Exchange and other adjustments (1) 6 2 7At 31 December 2014 (207) (134) (78) (419)Net book valueAt 31 December 2014 264 176 129 569At 31 December 2013 206 146 86 438At 1 January 2013 162 109 83 354
Substantially all software additions are internally developed.
Additions to management contracts relate to contract values recognised as part of the proceeds for hotels sold (see note 11).
The weighted average remaining amortisation period for management contracts is 30 years (2013 24 years).
STRATEG
IC REP
OR
TG
OVER
NAN
CE
GR
OU
P FIN
AN
CIA
L STATEMEN
TSPAR
ENT C
OM
PANY
FINAN
CIAL STATEM
ENTS
ADD
ITION
AL IN
FOR
MATIO
N
129
14. Investment in associates and joint ventures
Associates$m
Joint ventures
$mTotal
$m
CostAt 1 January 2013 59 28 87Additions 8 2 10Capital returns – (3) (3)Share of profits 2 – 2Dividends (5) – (5)Exchange and other adjustments (3) – (3)At 31 December 2013 61 27 88Initial retained interest in Barclay associate (note 11) 22 – 22Additions 15 – 15Share of (losses)/profits (4) – (4)Dividends (2) – (2)At 31 December 2014 92 27 119ImpairmentAt 1 January 2013, 31 December 2013 and 31 December 2014 (3) – (3)Net book valueAt 31 December 2014 89 27 116At 31 December 2013 58 27 85At 1 January 2013 56 28 84
Barclay associateThe Group held one material associate investment at 31 December 2014, a 19.9% interest in 111 East 48th Street Holdings, LLC (‘the Barclay associate’) which owns the InterContinental New York Barclay, a hotel managed by the Group. The investment is classified as an associate and equity accounted as the Group has the ability to exercise significant influence through its involvement in the redevelopment of the hotel and certain decision rights.
Summarised financial information in respect of the Barclay associate is set out below:31 December
Revenue 24Loss for the period (26)Group’s share of loss for the period (19.9%) (5)
The Barclay associate classification was effective 31 March 2014.
Other associates and joint venturesThe summarised aggregated financial information for individually immaterial associates and joint ventures is set out below. These are mainly investments in entities that own hotels which the Group manages.
The exceptional profit in 2013 arose on the sale of a hotel owned by an associate investment that was classified as held for sale at 31 December 2012. Following completion of the sale, the Group received a $17m cash distribution from the associate, being the Group’s share of the net disposal proceeds.
Trade deposits and loans 43 20Restricted funds 21 40Bank accounts pledged as security 49 52
113 112Total other financial assets 257 248
Analysed as:Current 5 12Non-current 252 236
257 248
Equity securities available-for-sale are measured at fair value (see note 23) and loans and receivables are held at amortised cost.
Equity securities available-for-sale were denominated in the following currencies: US dollars $94m (2013 $84m), Hong Kong dollars $34m (2013 $27m) and other currencies $16m (2013 $25m). Unlisted equity shares are mainly investments in entities that own hotels which the Group manages. Dividend income from available-for-sale equity securities of $10m (2013 $6m) is reported as other operating income and expenses in the Group income statement.
Trade deposits and loans include a deposit of $37m made in 2011 to a hotel owner in connection with the renegotiation of a management contract. The deposit is non-interest-bearing and repayable at the end of the management contract, and is therefore held at its discounted value of $13m (2013 $12m); the discount unwinds to the income statement within financial income over the period to repayment.
Restricted funds include cash held in bank accounts which is pledged as collateral to insurance companies for risks retained by the Group and other amounts held in escrow.
The bank accounts pledged as security (£31m) are subject to a charge in favour of the members of the UK unfunded pension arrangement (see note 25).
The movement in the provision for impairment of other financial assets during the year is as follows:2014
$m2013
$m
At 1 January (25) (26)Amounts written off – 1Exchange and other adjustments (3) –At 31 December (28) (25)
The provision is used to record impairment losses unless the Group is satisfied that no recovery of the amount is possible; at that point the amount considered irrecoverable is either written off directly to the income statement or, if previously provided, against the financial asset with no impact on the income statement.
Trade and other receivables are designated as loans and receivables and are held at amortised cost.
Trade receivables are non-interest-bearing and are generally on payment terms of up to 30 days. The fair value of trade and other receivables approximates their carrying value.
The maximum exposure to credit risk for trade and other receivables, excluding prepayments, at the end of the reporting period by geographic region is:
2014$m
2013$m
Americas 221 193Europe 76 78Asia, Middle East and Africa 53 53Greater China 38 34
388 358
The ageing of trade and other receivables, excluding prepayments, at the end of the reporting period is:
2014 2013
Gross$m
Provision$m
Net$m
Gross$m
Provision$m
Net$m
Not past due 275 – 275 236 – 236Past due 1 to 30 days 57 (3) 54 66 (4) 62Past due 31 to 180 days 57 (3) 54 57 (3) 54Past due more than 180 days 46 (41) 5 42 (36) 6
435 (47) 388 401 (43) 358
The credit risk relating to balances not past due is not deemed to be significant.
The movement in the provision for impairment of trade and other receivables during the year is as follows:2014
$m2013
$m2012
$m
At 1 January (43) (47) (46)Provided (22) (18) (18)Amounts written back 9 14 10Amounts written off 9 8 7At 31 December (47) (43) (47)
continuedNotes to the Group Financial Statements
IHG Annual Report and Form 20-F 2014
132
17. Cash and cash equivalents
2014$m
2013(restated1)
$m
2012(restated1)
$m
Cash at bank and in hand 157 177 249Short-term deposits 5 71 138
162 248 387
1 Restated for the adoption of ‘Offsetting Financial Assets and Financial Liabilities’ (Amendments to IAS 32), see page 107.
Cash at bank and in hand includes bank balances of $108m (2013 $114m, 2012 $194m) which are matched by bank overdrafts of $107m (2013 $114m, 2012 $192m) under the Group’s cash pooling arrangements. Under these arrangements, each pool contains a number of bank accounts with the same financial institution and the Group pays interest on net overdraft balances within each pool. The cash pools are used for day-to-day cash management purposes and are managed as closely as possible to a zero balance on a net basis for each pool. Overseas subsidiaries are typically in a cash positive position with the matching overdrafts held by the Group’s central treasury company in the UK.
For the purposes of the Group statement of cash flows, cash and cash equivalents comprise the following:
2014$m
2013(restated1)
$m
2012(restated1)
$m
Cash at bank and in hand 157 177 249Short-term deposits 5 71 138
1 Restated for the adoption of ‘Offsetting Financial Assets and Financial Liabilities’ (Amendments to IAS 32), see page 107.
Short-term deposits are highly liquid investments with an original maturity of three months or less.
Cash and cash equivalents includes $4m (2013 $12m, 2012 $7m) that is not available for use by the Group due to local exchange controls in Venezuela and Argentina.
STRATEG
IC REP
OR
TG
OVER
NAN
CE
GR
OU
P FIN
AN
CIA
L STATEMEN
TSPAR
ENT C
OM
PANY
FINAN
CIAL STATEM
ENTS
ADD
ITION
AL IN
FOR
MATIO
N
133
18. Trade and other payables
2014$m
2013$m
CurrentTrade payables 88 97Other tax and social security payable 49 32Other payables 317 335Accruals 315 284
769 748
Non-currentOther payables 627 574
Trade payables are non-interest-bearing and are normally settled within an average of 45 days.
Other payables include $725m (2013 $649m) relating to the future redemption liability of the Group’s loyalty programme, of which $132m (2013 $120m) is classified as current and $593m (2013 $529m) as non-current.
19. Provisions
Onerous management
contracts $m
Litigation $m
Total $m
At 1 January 2013 2 – 2Provided – 4 4Utilised (1) (2) (3)At 31 December 2013 1 2 3Provided – 9 9Utilised (1) (1) (2)At 31 December 2014 – 10 10
2014$m
2013$m
Analysed as:Current 1 3Non-current 9 –
10 3
The onerous management contracts provision relates to the unavoidable net cash outflows that are expected to be incurred under performance guarantees associated with certain management contracts.
Litigation during 2014 relates to actions brought against the Group in the Americas region relating to System Fund activity and, during 2013, largely relates to the Greater China region.
continuedNotes to the Group Financial Statements
IHG Annual Report and Form 20-F 2014
134
20. Financial risk management
OverviewThe Group’s treasury policy is to manage financial risks that arise in relation to underlying business needs. The activities of the treasury function are carried out in accordance with Board approved policies and are subject to regular audit. The treasury function does not operate as a profit centre.
The treasury function seeks to reduce the financial risks faced by the Group and manages liquidity to meet all foreseeable cash needs. Treasury activities may include money market investments, spot and forward foreign exchange instruments, currency swaps, interest rate swaps and forward rate agreements. One of the primary objectives of the Group’s treasury risk management policy is to mitigate the adverse impact of movements in interest rates and foreign exchange rates.
Market risk exposureThe US dollar is the predominant currency of the Group’s revenue and cash flows. Movements in foreign exchange rates can affect the Group’s reported profit, net assets and interest cover. To hedge translation exposure, wherever possible, the Group matches the currency of its debt (either directly or via derivatives) to the currency of its net assets, whilst maximising the amount of US dollars borrowed to reflect the predominant trading currency.
From time to time, foreign exchange transaction exposure is managed by the forward purchase or sale of foreign currencies. Most significant exposures of the Group are in currencies that are freely convertible.
A general strengthening of the US dollar (specifically a five cent fall in the sterling: US dollar rate) would increase the Group’s profit before tax by an estimated $4.5m (2013 $4.1m, 2012 $2.8m) and increase net assets by an estimated $29.1m (2013 $16.0m, 2012 $1.8m). Similarly, a five cent fall in the euro:US dollar rate would reduce the Group’s profit before tax by an estimated $2.2m (2013 $2.6m, 2012 $2.3m) and decrease net assets by an estimated $10.9m (2013 $14.8m, 2012 $16.1m).
Interest rate exposure is managed, using interest rate swaps if appropriate, within set parameters depending on the term of the debt, with a minimum fixed proportion of 25% of borrowings for each major currency. No interest rate swaps were used during 2013 or 2014. Based on the year-end net debt position plus the $400m bilateral term loan drawn in 2015 to finance the Kimpton acquisition (see note 21), a one percentage point rise in US dollar interest rates would increase the annual net interest charge by $6.7m. A similar rise in euro interest rates would increase the annual net interest charge by approximately $0.9m, and a similar rise in sterling interest rates would reduce the annual net interest charge by approximately $0.7m. 100% of borrowings in major currencies were fixed rate debt at 31 December 2013.
Liquidity risk exposureThe treasury function ensures that the Group has access to sufficient funds to allow the implementation of the strategy set by the Board. Medium and long-term borrowing requirements are met through the $1.07bn Syndicated Facility which expires in November 2016, through the £250m 6% bonds that are repayable on 9 December 2016 and through the £400m 3.875% bonds repayable on 28 November 2022. The bonds were issued under the Group’s £750m Medium Term Notes programme. Short-term borrowing requirements are met from drawings under bilateral bank facilities.
The Syndicated Facility contains two financial covenants: interest cover and net debt divided by earnings before interest, tax, depreciation and amortisation (EBITDA). The Group has been in compliance with all of the financial covenants in its loan documents throughout the year, none of which is expected to present a material restriction on funding in the near future.
At the year end, the Group had cash of $162m which is predominantly held in short-term deposits and cash funds which allow daily withdrawals of cash. The Group also had overdrafts of $107m as part of cash pooling arrangements (see note 17). Most of the Group’s funds are held in the UK or US, although $4m (2013 $12m) is held in countries where repatriation is restricted as a result of foreign exchange regulations.
The Group had net liabilities of $717m at 31 December 2014 reflecting that its brands, in accordance with accounting standards, are not recorded on the balance sheet.
STRATEG
IC REP
OR
TG
OVER
NAN
CE
GR
OU
P FIN
AN
CIA
L STATEMEN
TSPAR
ENT C
OM
PANY
FINAN
CIAL STATEM
ENTS
ADD
ITION
AL IN
FOR
MATIO
N
135
20. Financial risk management continued
Credit risk exposureCredit risk on treasury transactions is minimised by operating a policy on the investment of surplus cash that generally restricts counterparties to those with an A credit rating or better or those providing adequate security. In order to manage the Group’s credit risk exposure, the treasury function sets counterparty exposure limits using metrics including credit ratings, the relative placing of credit default swap pricings, Tier 1 capital and share price volatility of the relevant counterparty.
The Group trades only with recognised, creditworthy third parties. It is the Group’s policy that all customers who wish to trade on credit terms are subject to credit verification procedures.
In respect of credit risk arising from financial assets, the Group’s exposure to credit risk arises from default of the counterparty, with a maximum exposure equal to the carrying amount of these instruments.
Capital risk managementThe Group manages its capital to ensure that it will be able to continue as a going concern. The capital structure consists of net debt, issued share capital and reserves totalling $808m at 31 December 2014 (2013 $1,071m). The structure is managed to maintain an investment grade credit rating, to provide ongoing returns to shareholders and to service debt obligations, whilst maintaining maximum operational flexibility. A key characteristic of IHG’s managed and franchised business model is that it is highly cash generative, with a high return on capital employed. Surplus cash is either reinvested in the business, used to repay debt or returned to shareholders. The Group’s debt is monitored on the basis of a cash flow leverage ratio, being net debt divided by EBITDA, with the objective of maintaining an investment grade credit rating.
HedgingInterest rate risk The Group hedges its interest rate risk by ensuring that interest flows are fixed on at least 25% of its borrowings in major currencies. If required, the Group uses interest rate swaps to manage the exposure although none were held during 2013 or 2014. The Group designates interest rate swaps as cash flow hedges.
Foreign currency risk The Group is exposed to foreign currency risk on income streams denominated in foreign currencies. From time to time, the Group hedges a portion of forecast foreign currency income by taking out forward exchange contracts. The designated risk is the spot foreign exchange risk. There were no such contracts in place at either 31 December 2014 or 31 December 2013.
Hedge of net investment in foreign operations The Group designates its foreign currency bank borrowings and currency derivatives as net investment hedges of foreign operations. The designated risk is the spot foreign exchange risk for loans and short dated derivatives. The interest on these financial instruments is taken through financial income or expense.
At 31 December 2014, the Group held no currency swaps (2013 $415m) and short dated foreign exchange swaps with principals of €220m (2013 €75m) and $31m (2013 $100m) (see note 22 for further details). The maximum amount of foreign exchange derivatives held during the year as net investment hedges and measured at calendar quarter ends were currency swaps with a principal of $415m (2013 $415m) and short dated foreign exchange swaps with principals of €220m (2013 €75m) and $165m (2013 $310m).
Hedge effectiveness is measured at calendar quarter ends. No ineffectiveness arose in respect of either the Group’s cash flow or net investment hedges during the current or prior year.
continuedNotes to the Group Financial Statements
IHG Annual Report and Form 20-F 2014
136
20. Financial risk management continued
Liquidity riskThe following are the undiscounted contractual cash flows of financial liabilities, including interest payments:
Less than 1 year
$m
Between 1 and 2 years
$m
Between 2 and 5 years
$m
More than 5 years
$mTotal
$m
31 December 2014Non-derivative financial liabilities:
1 Restated for the adoption of ‘Offsetting Financial Assets and Financial Liabilities’ (Amendments to IAS 32), see page 107.
Trade and other payables includes the cash flows relating to the future redemption liability of the Group’s loyalty programme. The repayment profile has been determined by actuaries based on expected redemption profiles and could in reality be different from expectations.
Credit riskThe carrying amount of financial assets represents the maximum exposure to credit risk.
2014$m
2013(restated1)
$m
Cash and cash equivalents 162 248Equity securities available-for-sale 144 136Derivative financial instruments 2 1Loans and receivables:
Other financial assets 113 112Trade and other receivables, excluding prepayments 388 358
809 855
1 Restated for the adoption of ‘Offsetting Financial Assets and Financial Liabilities’ (Amendments to IAS 32), see page 107.
Denominated in the following currencies:Sterling 20 1,008 1,028 17 1,066 1,083US dollars 87 470 557 96 199 295Euros 12 91 103 11 – 11Other 7 – 7 6 4 10
126 1,569 1,695 130 1,269 1,399
1 Restated for the adoption of ‘Offsetting Financial Assets and Financial Liabilities’ (Amendments to IAS 32), see page 107.
Bank overdraftsBank overdrafts are matched by equivalent amounts of cash and cash equivalents under the Group’s cash pooling arrangements (see note 17 for further details).
Unsecured bank loansUnsecured bank loans are borrowings under the Group’s Syndicated Facility. Amounts are classified as non-current when the facilities have more than 12 months to expiry. A variable rate of interest is payable on amounts drawn under the facility, which was 1.2% at 31 December 2014.
Secured bank loanThe secured bank loan relates to a New Zealand dollar mortgage which is secured on the related hotel property. $3m is repayable by instalments (2013 $4m).
Finance lease obligations Finance lease obligations, which relate to the 99-year lease (of which 91 years remain) on the InterContinental Boston, are payable as follows:
2014 2013
Minimum lease
payments $m
Present value of
payments $m
Minimum lease
payments $m
Present value of
payments $m
Less than one year 16 16 16 16Between one and five years 64 48 64 48More than five years 3,284 154 3,300 151
The Group has the option to extend the term of the lease for two additional 20-year terms. Payments under the lease step up at regular intervals over the lease term. Interest is payable on the obligation at a fixed rate of 9.7%.
£250m 6% bonds 2016The 6% fixed interest sterling bonds were issued on 9 December 2009 and are repayable in full on 9 December 2016. Interest is payable annually on 9 December in each year commencing 9 December 2010 to the maturity date. The bonds were initially priced at 99.465% of face value and are unsecured. Currency swaps were transacted at the same time the bonds were issued in order to swap the proceeds and interest flows into US dollars and were subsequently closed out during 2014 (see note 22 for further details).
£400m 3.875% bonds 2022The 3.875% fixed interest sterling bonds were issued on 28 November 2012 and are repayable on 28 November 2022. Interest is payable annually on 28 November in each year commencing 28 November 2013 to the maturity date. The bonds were initially priced at 98.787% of face value and are unsecured.
Unutilised facilities expire:Within one year 62 80After two but before five years 709 1,070
771 1,150
Utilised facilities are calculated based on actual drawings and may not agree to the carrying value of loans held at amortised cost.
Kimpton acquisitionSubsequent to the year end, a $400m bilateral term loan was drawn down to finance the acquisition of Kimpton (see note 33). The loan has a term of six months plus two six-month extension periods. A variable rate of interest is payable on the loan which has identical covenants to the Syndicated Facility.
Derivatives are recorded at their fair values as set out in note 23.
Currency swapsAt 31 December 2014, the Group held no currency swaps. The currency swaps held at 31 December 2013 (with a principal of $415m) were transacted at the same time as the £250m 6% bonds were issued in December 2009 in order to swap the bonds’ proceeds and interest flows into US dollars. Under the terms of the swaps, $415m was borrowed and £250m deposited for seven years at a fixed exchange rate of £1=$1.66. The currency swaps were closed out in full during 2014 due to a reduction in the value of assets available for net investment hedging with $4m received as consideration on close of out the swaps. The interest expense and principal on the £250m 6% bonds are now subject to currency fluctuations. At 31 December 2013, the fair value of the currency swap comprised two components: $2m relating to the repayment of the underlying principal and $9m relating to interest payments. The element relating to the underlying principal was disclosed as a component of net debt in 2013 (see note 24). The currency swaps were designated as net investment hedges.
Forward foreign exchange contractsAt 31 December 2014, the Group held short dated foreign exchange swaps with total principal values of €220m (2013 €75m) and $31m (2013 $100m). The swaps are used to manage sterling surplus cash and reduce euro and US dollar borrowings whilst maintaining operational flexibility. The foreign exchange swaps have been designated as net investment hedges.
STRATEG
IC REP
OR
TG
OVER
NAN
CE
GR
OU
P FIN
AN
CIA
L STATEMEN
TSPAR
ENT C
OM
PANY
FINAN
CIAL STATEM
ENTS
ADD
ITION
AL IN
FOR
MATIO
N
139
23. Fair value measurement
Fair valuesThe following table compares carrying amounts and fair values of the Group’s financial assets and liabilities:
20142013
(restated¹)
Note
Carrying value
$m
Fair value
$m
Carrying value
$m
Fair value
$m
Financial assetsCash and cash equivalents 17 162 162 248 248Equity securities available-for-sale2 15 144 144 136 136Loans and receivables:
Other financial assets 15 113 113 112 112Trade and other financial receivables, excluding prepayments 16 388 388 358 358
1 Restated for the adoption of ‘Offsetting Financial Assets and Financial Liabilities’ (Amendments to IAS 32), see page 107.2 Financial assets and liabilities which are measured at fair value.
There are no other assets or liabilities measured at fair value on a recurring or non-recurring basis, or for which fair value is disclosed.
The fair value of cash and cash equivalents and bank overdrafts approximates book value due to the short maturity of the investments and deposits, and the fair value of other financial assets approximates book value based on prevailing market rates. The fair value of the secured and unsecured bank loans approximates book value as interest rates reset to market rates on a frequent basis. The fair value of trade and other receivables, trade and other payables and current provisions approximates to their carrying value, including the future redemption liability of the Group’s loyalty programme.
Fair value hierarchyThe following table provides the fair value measurement hierarchy of the above assets and liabilities, other than those with carrying amounts which are reasonable approximations of their fair values:
Level 1: quoted (unadjusted) prices in active markets for identical assets or liabilities.Level 2: other techniques for which all inputs which have a significant effect on fair value are observable, either directly or indirectly.Level 3: techniques which use inputs which have a significant effect on the recorded fair value that are not based on observable market data.
There were no transfers between Level 1 and Level 2 fair value measurements during the year and no transfers into and out of Level 3.
continuedNotes to the Group Financial Statements
IHG Annual Report and Form 20-F 2014
140
23. Fair value measurement continued
The fair value of quoted equity shares and the bonds is based on their quoted market price.
Derivatives are fair valued using discounted future cash flows, taking into consideration exchange rates prevailing on the last day of the reporting period and interest rates from observable swap curves. As the Group’s derivatives are not cash collaterised, a valuation adjustment is made for credit risk, being counterparty risks in respect of derivative assets and own credit risks in respect of derivative liabilities. At 31 December 2013, the interest rates used to fair value the currency swaps ranged from 1.4% to 2.5%, depending on the currency and the term of the derivative contract.
Finance lease obligations relate to the lease of the InterContinental Boston and are fair valued by discounting the future cash flows payable under the loan, which are fixed, at a risk adjusted long-term interest rate. The interest rate used to discount the cash flows at 31 December 2014 was 7.4% (2013 8.4%).
Unquoted equity shares are fair valued using the International Private Equity and Venture Capital Valuation Guidelines either by applying an average price-earnings (P/E) ratio for a competitor group to the earnings generated by the investment or by reference to share of net assets if the investment is currently loss-making or a recent property valuation is available. The average P/E ratio for the year was 24.0 and a non-marketability factor of 30% is applied. A 10% increase in the average P/E ratio would result in a $3m increase (2013 $5m) in the fair value of the investments and a 10% decrease in the average P/E ratio would result in a $3m decrease (2013 $5m) in the fair value of the investments. A 10% increase in net assets would result in a $7m increase (2013 $5m) in the fair value of the investments and a 10% decrease in net assets would result in a $7m decrease (2013 $5m) in the fair value of the investments.
The following table reconciles the movements in the fair values of investments classified as Level 3 during the year:2014
$m2013
$m
At 1 January 127 94Additions 5 8Repaid (8) –Valuation gains recognised in other comprehensive income 7 25Exchange and other adjustments (3) –At 31 December 128 127
24. Net debt
2014$m
2013(restated1)
$m
Cash and cash equivalents 162 248Loans and other borrowings – current (126) (130) – non-current (1,569) (1,269)Derivatives hedging debt values (note 22) – (2)Net debt (1,533) (1,153)
Movement in net debtNet decrease in cash and cash equivalents, net of overdrafts (70) (58)Add back cash flows in respect of other components of net debt:
(Increase)/decrease in other borrowings (382) 1Close-out of currency swaps (4) –
Increase in net debt arising from cash flows (456) (57)Non-cash movements:
Finance lease obligations (3) (3)Exchange and other adjustments 79 (19)
Increase in net debt (380) (79)Net debt at beginning of the year (1,153) (1,074)Net debt at end of the year (1,533) (1,153)
1 Restated for the adoption of ‘Offsetting Financial Assets and Financial Liabilities’ (Amendments to IAS 32), see page 107.
In 2013, net debt included the exchange element of the fair value of currency swaps that fixed the value of the Group’s £250m 6% bonds at $415m. An equal and opposite exchange adjustment on the retranslation of the £250m 6% bonds was included in non-current loans and other borrowings. The currency swaps were closed out in 2014 (see note 22).
STRATEG
IC REP
OR
TG
OVER
NAN
CE
GR
OU
P FIN
AN
CIA
L STATEMEN
TSPAR
ENT C
OM
PANY
FINAN
CIAL STATEM
ENTS
ADD
ITION
AL IN
FOR
MATIO
N
141
25. Retirement benefits
UKHistorically UK retirement and death in service benefits have been provided for eligible employees in the UK principally by the InterContinental Hotels UK Pension Plan, which has both defined benefit and defined contribution sections. The defined benefit section was subject to a buy-in transaction on 15 August 2013 whereby the assets of the plan were invested in a bulk purchase annuity policy with the insurer Rothesay Life under which the benefits payable to defined benefit members became fully insured. On 31 October 2014, the plan completed the move to a full buy-out of the defined benefit section, following which Rothesay Life has become fully and directly responsible for the pension obligations. On completion of the buy-out, the defined benefit assets (comprising the Rothesay Life insurance policy) and matching defined benefit liabilities were derecognised from the Group statement of financial position. The buy-out transaction also triggered the return to the Company of the £3m that remained in the IHG Funding Trust.
On 6 August 2014, members of the defined contribution section of the plan were transferred to a new mirror plan, the IHG UK Defined Contribution Pension Plan. Existing and new employees who are eligible for pension benefits in the UK, including those who have been auto-enrolled since 1 September 2013, are provided with defined contribution arrangements under this plan; benefits are based on each individual member’s personal account.
Both plans are HM Revenue & Customs registered and governed by a Trustee Board which comprises a combination of independent and company nominated trustees, assisted by professional advisers as and when required. The overall operation of the plans is subject to the oversight of The Pensions Regulator. The Trustee Board is currently in the process of winding-up the InterContinental Hotels UK Pension Plan.
In addition to the above, additional benefits are provided to members of an unfunded pension arrangement who were affected by lifetime or annual allowances under the former defined benefit arrangements. Accrual under this arrangement ceased with effect from 1 July 2013. In March 2014, the Company made an offer to each member to cash-out their pension entitlement by means of a one-off lump sum cash payment. Members had until 30 June 2014 to accept the offer with the Company reserving the right to revoke any acceptances up to the date of payment. In the event, cash payments totalling £27m were made to the accepting members on 28 July 2014 (with an additional £7m deferred for payment until 2015), thereby extinguishing approximately 70% of the unfunded pension obligations. A charge over certain ring-fenced bank accounts totalling £31m at 31 December 2014 (see note 15) is currently held as security on behalf of the remaining members of the unfunded arrangement.
US and otherThe Group also maintains the following US-based defined benefit plans; the funded Inter-Continental Hotels Pension Plan, unfunded Inter-Continental Hotels Non-qualified Pension Plans and unfunded Inter-Continental Hotels Corporation Postretirement Medical, Dental, Vision and Death Benefit Plan. All plans are closed to new members. In respect of the funded plan, an Investment Committee has responsibility for the oversight and management of the plan’s assets, which are held in a separate trust. The Committee comprises senior company employees and is assisted by professional advisers as and when required. The company currently makes contributions that equal or exceed the minimum funding amounts required by the Employee Retirement Income and Security Act of 1974 (‘ERISA’). The investment objective is to achieve full funding over time by following a specified ‘glide path approach’ which results in a progressive switching from return seeking assets to liability-matching assets as the funded status of the plan increases. During the year, the funded status reached 85% which triggered a further de-risking of the investment portfolio.
The Group also operates a number of smaller pension schemes outside the UK, the most significant of which is a defined contribution scheme in the US; there is no material difference between the pension costs of, and contributions to, these schemes.
In respect of the defined benefit plans, the amounts recognised in the Group income statement, in administrative expenses, are:
The settlement cost in 2014 results from the partial cash-out of the UK unfunded pension arrangements and comprises transaction and related social security costs of $9m, offset by the $3m difference between the accounting value of the liabilities extinguished and the amount of the committed cash-out payments. In 2014, related cash payments of $53m are included in cash flows relating to exceptional operating items in the Group statement of cash flows.
The settlement cost in 2013 resulted from the buy-in transaction described on the previous page and comprised a past service cost of $5m relating to additional benefits secured by the transaction, the $137m difference between the cost of the insurance policy and the accounting value of the liabilities secured and transaction costs of $5m. As the policy was structured to enable the plan to move to a buy-out and the intention was to proceed on that basis, the buy-in transaction was accounted for as a settlement with the loss arising recorded in the income statement. The full buy-out was completed on 31 October 2014.
Re-measurement gains and losses recognised in the Group statement of comprehensive income are:
2014 2013 2012
Plan assets
$m
Planobligations
$mTotal
$m
Plan assets
$m
Plan obligations
$mTotal
$m
Plan assets
$m
Plan obligations
$mTotal
$m
Return on plan assets (excluding amounts included in interest) 88 – 88 2 – 2 22 – 22Actuarial gains and losses arising from changes in:
Change in asset restriction (excluding amounts included in interest) (1) – (1) 89 – 89 (23) – (23)Other comprehensive income 87 (112) (25) 91 (51) 40 (1) (14) (15)
The assets and liabilities of the schemes and the amounts recognised in the Group statement of financial position are:
Pension plans
UK US and otherPost-employment
benefits Total
2014 $m
2013 $m
2014 $m
2013 $m
2014 $m
2013 $m
2014 $m
2013 $m
Retirement benefit assetsFair value of plan assets 8 582 16 17 – – 24 599Present value of benefit obligations – (577) (13) (13) – – (13) (590)Surplus in schemes 8 5 3 4 – – 11 9Asset restriction (3) (2) – – – – (3) (2)Total retirement benefit assets 5 3 3 4 – – 8 7
Retirement benefit obligationsFair value of plan assets – – 151 142 – – 151 142Present value of benefit obligations (31) (82) (242) (220) (24) (24) (297) (326)Total retirement benefit obligations (31) (82) (91) (78) (24) (24) (146) (184)
Total fair value of plan assets 8 582 167 159 – – 175 741Total present value of benefit obligations (31) (659) (255) (233) (24) (24) (310) (916)
The ‘US and other’ surplus of $3m (2013 $4m) relates to a defined benefit pension scheme in Hong Kong. Included within the ‘US and other’ deficit is $1m (2013 $2m) relating to a defined benefit pension plan in the Netherlands.
STRATEG
IC REP
OR
TG
OVER
NAN
CE
GR
OU
P FIN
AN
CIA
L STATEMEN
TSPAR
ENT C
OM
PANY
FINAN
CIAL STATEM
ENTS
ADD
ITION
AL IN
FOR
MATIO
N
143
25. Retirement benefits continued
AssumptionsThe principal financial assumptions used by the actuaries to determine the benefit obligations are:
Pre 65 (ultimate rate reached in 2021) 8.0 8.5 9.0Post 65 (ultimate rate reached in 2024) 12.5 17.5 11.8
Ultimate rate that the cost trend rate trends to 5.0 5.2 5.0
Mortality is the most significant demographic assumption. The current assumptions for the UK are based on the S1NA tables with long cohort projections and a 1.25% per annum underpin to future mortality improvements with age rated down by three years for pensioners and non-pensioners. In the US, the current assumptions are based on the RP-2014 Employee/Healthy Annuitant Generationally Projected with Scale MP-2014 mortality tables.
In both territories, the assumptions have been revised during the year to reflect increased life expectancy at retirement age as follows:
Pension plans
UK US
2014 Years
2013 Years
2012 Years
2014 Years
2013 Years
2012 Years
Current pensioners at 651 – male 26 24 24 22 21 19 – female 29 27 27 24 23 21Future pensioners at 652 – male 28 27 27 23 22 21 – female 31 30 30 25 25 22
1 Relates to assumptions based on longevity (in years) following retirement at the end of the reporting period.2 Relates to assumptions based on longevity (in years) relating to an employee retiring in 2034.
The assumptions allow for expected increases in longevity.
SensitivitiesChanges in assumptions used for determining retirement benefit costs and obligations may have a material impact on the income statement and the statement of financial position. The key assumptions are the pension increases, discount rate, the rate of inflation and the assumed mortality rate. The sensitivity analysis below is based on extrapolating reasonable changes in these assumptions, using year-end conditions and assuming no interdependency between the assumptions.
A one percentage point increase in assumed healthcare costs trend rate would increase the accumulated post-employment benefit obligations as at 31 December 2014 by $2.4m (2013 $2.8m, 2012 $2.6m) and a one percentage point decrease would decrease the obligations by $2.2m (2013 $2.3m, 2012 $2.3m).
Unquoted investmentsQualifying insurance policy – 577 11 10Cash and other 8 5 2 5
8 582 167 159
In accordance with accounting standards, the fair value of a qualifying insurance policy is deemed to be the present value of the pension obligations secured by that policy.
The asset restriction relates to tax that would be deducted at source in respect of a refund of a surplus taking into account amounts payable under funding commitments. As a result of the buy-in transaction, substantially all of the asset restriction was released through other comprehensive income during 2013.
Pension plans
UK US and otherPost-employment
benefits Total
Estimated future benefit payments2014
$m2013
$m2014
$m2013
$m2014
$m2013
$m2014
$m2013
$m
Within one year – 19 15 14 1 1 16 34Between one and five years 2 84 58 57 5 5 65 146After five years 11 123 78 76 7 7 96 206
Annual Performance Plan Under the IHG Annual Performance Plan (APP), formerly the Annual Bonus Plan (ABP), eligible employees (including Executive Directors) can receive all or part of their bonus in the form of deferred shares. The deferred shares are released on the third anniversary of the award date. Under the terms of awards that are referred to in this note, a fixed percentage of the award is made in the form of shares with no voluntary deferral and no matching shares. Awards under the APP are conditional on the participants remaining in the employment of a participating company or leaving for a qualifying reason as per the plan rules. The award of deferred shares under the APP is at the discretion of the Remuneration Committee.
The number of shares is calculated by dividing a specific percentage of the participant’s annual performance-related award by the middle market quoted prices on the three consecutive dealing days immediately preceding the date of grant. A number of executives participated in the APP during the year and conditional rights over 305,345 (2013 318,911, 2012 340,924) shares were awarded to participants. New plan rules for the APP were approved by shareholders at the Annual General Meeting on 2 May 2014, and will apply to awards made in respect of the 2015 subsequent and financial years. The new plan rules contain substantially the same terms as the existing plan rules.
Long Term Incentive Plan The Long Term Incentive Plan (LTIP) allows Executive Directors and eligible employees to receive share awards, subject to the achievement of performance conditions, set by the Remuneration Committee, which are normally measured over a three-year period. More detailed information on performance measures is shown in the Directors’ Remuneration Report on pages 76 to 91. Awards are normally made annually and, except in exceptional circumstances, will not exceed three times salary for Executive Directors and four times salary in the case of other eligible employees. During the year, conditional rights over 2,171,390 (2013 2,227,293, 2012 2,698,714) shares were awarded to employees under the plan. The plan provides for the grant of ‘nil cost options’ to participants as an alternative to conditional share awards. New plan rules for the LTIP were approved by shareholders at the Annual General Meeting on 2 May 2014, and will apply to awards made in respect of the 2015-17 and subsequent LTIP cycles. The new plan rules contain substantially the same terms as the existing rules; one minor change is to limit the maximum award to three times salary for all employees.
Executive Share Option PlanThe plan was not operated during 2014 and no options were granted in the year under the plan, neither will any further options be granted under the plan. All options have now been exercised.
continuedNotes to the Group Financial Statements
IHG Annual Report and Form 20-F 2014
146
26. Share-based payments continued
The Group recognised a cost of $21m (2013 $22m, 2012 $22m) in operating profit related to equity-settled share-based payment transactions during the year, net of amounts borne by the System Fund.
The aggregate consideration in respect of ordinary shares issued under option schemes during the year was $nil (2013 $5m, 2012 $10m).
The following table sets forth awards and options granted during 2014:
APP LTIP
Number of shares awarded in 2014 305,345 2,171,390
The Group uses separate option pricing models and assumptions depending on the plan. The following tables set out information about awards granted in 2014, 2013 and 2012:
1 The expected volatility was determined by calculating the historical volatility of the Company’s share price corresponding to the expected life of the share award.
STRATEG
IC REP
OR
TG
OVER
NAN
CE
GR
OU
P FIN
AN
CIA
L STATEMEN
TSPAR
ENT C
OM
PANY
FINAN
CIAL STATEM
ENTS
ADD
ITION
AL IN
FOR
MATIO
N
147
26. Share-based payments continued
Movements in the awards and options outstanding under the schemes are as follows:APP
Number of shares
thousands
LTIP Number of
shares thousands
Outstanding at 1 January 2012 950 9,030Granted 341 2,699Vested (643) (2,621)Share capital consolidation (18) –Lapsed or cancelled (8) (1,948)Outstanding at 31 December 2012 622 7,160Granted 319 2,227Vested (72) (2,206)Lapsed or cancelled (29) (406)Outstanding at 31 December 2013 840 6,775Granted 305 2,171Vested (310) (1,447)Share capital consolidation (38) –Lapsed or cancelled (29) (1,379)Outstanding at 31 December 2014 768 6,120
Fair value of awards granted during the year2014 3,134.6¢ 1,202.1¢2013 2,873.4¢ 1,127.9¢2012 2,199.8¢ 792.5¢
Weighted average remaining contract life (years)At 31 December 2014 1.1 1.1At 31 December 2013 1.1 1.1At 31 December 2012 1.6 1.2
The above awards do not vest until the performance and service conditions have been met.
Number of shares
thousands
Range of option prices
pence
Weighted average
option price pence
Executive Share Option PlanOutstanding at 1 January 2012 2,170 308.5–619.8 497.0Exercised (1,365) 308.5–619.8 492.8Lapsed or cancelled (107) 434.2 434.2Outstanding at 31 December 2012 698 438.0–619.8 514.8Exercised (638) 438.0–619.8 512.3Outstanding at 31 December 2013 60 494.2–619.8 541.3Exercised (60) 494.2–619.8 541.3Outstanding at 31 December 2014 – n/a –
Options exercisableAt 31 December 2014 – n/a n/aAt 31 December 2013 60 494.2–619.8 541.3At 31 December 2012 698 438.0–619.8 514.8
The weighted average share price at the date of exercise for share options vested during the year was 1,966.5p. The closing share price on 31 December 2014 was 2,595.0p and the range during the year was 1,866.0p to 2,710.0p per share.
continuedNotes to the Group Financial Statements
IHG Annual Report and Form 20-F 2014
148
27. Equity
Equity share capital
Number of shares
millions
Nominal value
$m
Share premium
$m
Equity share
capital $m
Allotted, called up and fully paidAt 1 January 2012 (ordinary shares of 1329⁄47p each) 290 61 101 162Share capital consolidation (19) – – –Issued on exercise of share options 1 1 9 10Repurchased and cancelled under repurchase programme (4) (1) – (1)Exchange adjustments – 2 6 8At 31 December 2012 (ordinary shares of 14194⁄329p each) 268 63 116 179Issued on exercise of share options 1 – 5 5Exchange adjustments – 2 3 5At 31 December 2013 (ordinary shares of 14194⁄329p each) 269 65 124 189Share capital consolidation (20) – – –Repurchased and cancelled under repurchase programme (1) – – –Exchange adjustments – (4) (7) (11)At 31 December 2014 (ordinary shares of 15265⁄329p each) 248 61 117 178
The Company was incorporated and registered in England and Wales with registered number 5134420 on 21 May 2004 as a limited company under the Companies Act 1985 with the name Hackremco (No. 2154) Limited. On 24 March 2005 Hackremco (No. 2154) Limited changed its name to New InterContinental Hotels Group Limited. On 27 April 2005 New InterContinental Hotels Group Limited re-registered as a public limited company and changed its name to New InterContinental Hotels Group PLC. On 27 June 2005 New InterContinental Hotels Group PLC changed its name to InterContinental Hotels Group PLC.
On 7 August 2012, the Company announced a $1bn return of funds to shareholders comprising a $500m special dividend with share consolidation and a $500m share repurchase programme. The share consolidation was approved on 8 October 2012 at a General Meeting (GM) of the Company and became effective on 9 October 2012 on the basis of 14 new ordinary shares of 14194⁄329p each for every 15 existing ordinary shares of 1329⁄47p each. The special dividend of 172.0¢ per share was paid to shareholders on 22 October 2012 at a total cost of $505m. Under the authority granted by shareholders at the GM on 8 October 2012, the share repurchase programme commenced. In the year to 31 December 2014, 3.4m (2013 9.8m, 2012 4.1m) shares were repurchased for a consideration of $110m (2013 $283m, 2012 $107m), increasing the total amount repurchased to $500m and completing the programme. Of the 3.4m (2013 9.8m, 2012 4.1m) shares repurchased in 2014, 2.7m (2013 9.8m, 2012 nil) are held as treasury shares and 0.7m (2013 nil, 2012 4.1m) were cancelled. The cost of treasury shares has been deducted from retained earnings.
The authority given to the Company at the GM held on 30 June 2014 to purchase its own shares was still valid at 31 December 2014. A resolution to renew the authority will be put to shareholders at the Annual General Meeting on 8 May 2015.
On 6 August 2013, the Company announced a special dividend of 133.0¢ per share amounting to $355m which was paid to shareholders on 4 October 2013.
On 2 May 2014, the Company announced a $750m return to shareholders by way of a special dividend and share consolidation. On 30 June 2014, shareholders approved the share consolidation at a GM of the Company on the basis of 12 new ordinary shares of 15265/329p per share for every 13 existing ordinary shares of 14194/329p each, which became effective on 1 July 2014. The special dividend of 293.0¢ per share was paid to shareholders on 14 July 2014, at a total cost of $763m.
As a result of the 2014 share consolidation, the number of shares held in treasury reduced from 12.5m to 11.5m.
The balance classified as equity share capital includes the total net proceeds (both nominal value and share premium) on issue of the Company’s equity share capital, comprising 15265/329p shares. The share premium reserve represents the amount of proceeds received for shares in excess of their nominal value.
The Company no longer has an authorised share capital.
STRATEG
IC REP
OR
TG
OVER
NAN
CE
GR
OU
P FIN
AN
CIA
L STATEMEN
TSPAR
ENT C
OM
PANY
FINAN
CIAL STATEM
ENTS
ADD
ITION
AL IN
FOR
MATIO
N
149
27. Equity continued
The nature and purpose of the other reserves shown in the Group statement of changes in equity on pages 102 to 104 of the Financial Statements is as follows:
Capital redemption reserveThis reserve maintains the nominal value of the equity share capital of the Company when shares are repurchased or cancelled.
Shares held by employee share trustsComprises $34.5m (2013 $37.6m, 2012 $48.0m) in respect of 0.9m (2013 1.2m, 2012 1.8m) InterContinental Hotels Group PLC ordinary shares held by employee share trusts, with a market value at 31 December 2014 of $38.2m (2013 $39.8m, 2012 $50.1m).
Other reservesComprises the merger and revaluation reserves previously recognised under UK GAAP, together with the reserve arising as a consequence of the Group’s capital reorganisation in June 2005. Following the change in presentational currency to the US dollar in 2008 (see page 107), this reserve also includes exchange differences arising on the retranslation to period-end exchange rates of equity share capital, the capital redemption reserve and shares held by employee share trusts.
Unrealised gains and losses reserveThis reserve records movements in the fair value of available-for-sale financial assets and the effective portion of the cumulative net change in the fair value of the cash flow hedging instruments related to hedged transactions that have not yet occurred.
Currency translation reserveThis reserve records the movement in exchange differences arising from the translation of foreign operations and exchange differences on foreign currency borrowings and derivative instruments that provide a hedge against net investments in foreign operations. On adoption of IFRS, cumulative exchange differences were deemed to be $nil as permitted by IFRS 1.
The fair value of derivative instruments designated as hedges of net investments in foreign operations outstanding at 31 December 2014 was a $2m net asset (2013 $10m net liability, 2012 $17m net liability).
The currency translation reserve includes a cumulative loss of $3m relating to assets classified as held for sale.
Treasury sharesAt 31 December 2014, 11.5m shares (2013 9.8m, 2012 nil) with a nominal value of $2.8m (2013 $2.4m, 2012 $nil) were held as treasury shares at cost and deducted from retained earnings.
Non-controlling interestA non-controlling interest is equity in a subsidiary of the Group not attributable, directly or indirectly, to the Group. Non-controlling interests are not material to the Group.
continuedNotes to the Group Financial Statements
IHG Annual Report and Form 20-F 2014
150
28. Operating leases
During the year ended 31 December 2014, $72m (2013 $67m, 2012 $64m) was recognised as an expense in the Group income statement in respect of operating leases, net of amounts borne directly by the System Fund. The expense includes contingent rents of $27m (2013 $24m, 2012 $19m). $4m (2013 $4m, 2012 $4m) was recognised as income from sub-leases.
Future minimum lease payments under non-cancellable operating leases are as follows:2014
$m2013
$m
Due within one year 40 42One to two years 34 33Two to three years 28 29Three to four years 27 23Four to five years 20 23More than five years 200 202
349 352
In addition, in certain circumstances the Group is committed to making additional lease payments that are contingent on the performance of the hotels that are being leased.
The average remaining term of these leases, which generally contain renewal options, is approximately 17 years (2013 18 years). No material restrictions or guarantees exist in the Group’s lease obligations.
Total future minimum rentals expected to be received under non-cancellable sub-leases are $8m (2013 $10m).
29. Capital and other commitments
2014 $m
2013 $m
Contracts placed for expenditure not provided for in the Group Financial Statements:Property, plant and equipment 70 70Intangible assets 47 13
117 83
The Group has also committed to invest in a number of its associates, with an estimated outstanding commitment of $89m at 31 December 2014 (2013 $20m) based on current forecasts.
30. Contingencies and guarantees
At 31 December 2014, the Group had no contingent liabilities (2013 $nil).
In limited cases, the Group may provide performance guarantees to third-party hotel owners to secure management contracts. At 31 December 2014, the amount provided in the Financial Statements was $2m (2013 $6m) and the maximum unprovided exposure under such guarantees was $29m (2013 $48m).
At 31 December 2014, the Group had outstanding letters of credit of $40m (2013 $41m) mainly relating to self insurance programmes.
The Group may guarantee loans made to facilitate third-party ownership of hotels in which the Group has an equity interest. At 31 December 2014, there were guarantees of $20m in place (2013 $20m).
From time to time, the Group is subject to legal proceedings the ultimate outcome of each being always subject to many uncertainties inherent in litigation. In particular, the Group is currently subject to a claim by Pan American Life Insurance Company, a Competition and Markets Authority enquiry in the UK and a class action lawsuit in the US (see ‘Legal proceedings’ on page 170). The Group has also given warranties in respect of the disposal of certain of its former subsidiaries. It is the view of the Directors that, other than to the extent that liabilities have been provided for in these Financial Statements, it is not possible to quantify any loss to which these proceedings or claims under these warranties may give rise, however, as at the date of reporting, the Group does not believe that the outcome of these matters will have a material effect on the Group’s financial position.
1 Excludes ICETUS cash-out payment of £9.4m (see Directors’ Remuneration Report, page 85).
There were no other transactions with key management personnel during the years ended 31 December 2014, 2013 or 2012.
Key management personnel comprises the Board and Executive Committee.
Related party disclosures for associates and joint ventures are as follows:
Associates Joint ventures Total
2014$m
2013$m
2012$m
2014$m
2013$m
2012$m
2014$m
2013$m
2012$m
Revenue from associates and joint ventures 4 4 5 – – – 4 4 5Loans to associates 3 – – – – – 3 – –Other amounts owed by associates and joint ventures 11 2 2 – – – 11 2 2
In addition, loans both to and from the Barclay associate of $237m are offset in accordance with the provisions of IAS 32 and presented net in the Group statement of financial position. Interest payable and receivable under the loans is equivalent (average interest rate of 1.8% in 2014) and presented net in the Group income statement.
32. System Fund
The Group operates a System Fund (the Fund) to collect and administer assessments and contributions from hotel owners for specific use in marketing, the IHG Rewards Club loyalty programme and the global reservation system. The Fund and loyalty programme are accounted for in accordance with the accounting policies set out on page 112 of the Financial Statements.
The following information is relevant to the operation of the Fund:2014
$m2013
$m2012
$m
Income1:Assessment fees and contributions received from hotels 1,271 1,154 1,106Proceeds from sale of IHG Rewards Club points 196 153 144
Key elements of expenditure1:Marketing 267 245 250IHG Rewards Club 296 219 250Payroll costs 267 239 221
Net (deficit)/surplus for the year1 (18) 35 12Interest payable to the Fund 2 2 2
1 Not included in the Group income statement in accordance with the Group’s accounting policies.
The payroll costs above relate to 4,975 (2013 4,615, 2012 4,431) employees whose costs are borne by the Fund.
The following liabilities relating to the Fund are included in the Group statement of financial position:2014
The net change in the loyalty programme liability and Fund surplus contributed an inflow of $58m (2013 $61m, 2012 $57m) to the Group’s cash flow from operations.
continuedNotes to the Group Financial Statements
IHG Annual Report and Form 20-F 2014
152
33. Events after the reporting period
On 16 January 2015, the Group completed the acquisition of Kimpton Hotel & Restaurant Group, LLC (‘Kimpton’), an unlisted company based in the US, for $430m paid in cash. Kimpton is the world’s largest independent boutique hotel operator which, together with IHG’s Hotel Indigo and EVEN brands, creates a leading boutique and lifestyle hotel business.
The assets and liabilities acquired largely comprise intangible assets, being the Kimpton brand and management contracts, deferred tax assets and goodwill. Due to the close proximity of the acquisition date to the date of these financial statements, the initial accounting for the business combination is incomplete and the Group is unable to provide a quantification of the fair values of these assets. The fair value exercise is ongoing and it is expected that the Group will include an acquisition balance sheet with its interim results for 2015.
Acquisition transaction costs of $7m were incurred in the year to 31 December 2014 (see note 5).
If the acquisition had taken place on 1 January 2014, it is estimated that Group revenue and Group EBITDA for the year ended 31 December 2014 would have been $37m and $20m higher respectively.
34. Principal operating subsidiary undertakings
InterContinental Hotels Group PLC was the beneficial owner of all of the equity share capital, indirectly through subsidiary undertakings, of the following companies during the year:
Six Continents Limited1
IHG Hotels Limited1
Six Continents Hotels, Inc.2
Inter-Continental Hotels Corporation2
InterContinental Hotels Group Resources, Inc.2
InterContinental Hong Kong Limited3
Société Nouvelle du Grand Hotel SA4
The companies listed above include those which principally affect the amount of profit and assets of the Group.1 Incorporated in Great Britain and registered in England and Wales.2 Incorporated in the US.3 Incorporated in Hong Kong.4 Incorporated in France.