92
Group Investment Report June 30, 2013 Group Retirement Solutions
Group Investment ReportJune 30, 2013
Group Retirement Solutions

Table of ContentsPAGE
Fund Managers 3
Asset Classes 4
Investment Styles 5
Investment Platform - Style Grid 6
Volatility Rating Overview 8
Rates of Return Overview 10
How to Read Fund Descriptions 12
Funds Available
Asset Allocation 14
Guaranteed Interest Accounts and Money Market 20
Fixed Income 24
Balanced 32
Canadian Equity 44
U.S. Equity 64
International/Global Equity 75
Specialty 87
i-Watch® 89
3
The following is a list of our partner fund managers and where you can findmore information on them:
AllianceBernstein Investmentswww.alliancebernstein.com
Beutel Goodmanwww.beutel-can.com
BlackRock, Inc. ("BlackRock") www.blackrock.com
CI Investmentswww.ci.com
CIBC Global Asset Managementwww.cibc.ca
Connor, Clark & Lunn Financial Groupwww.cclgroup.com
Dimensional Fund Advisors (DFA)www.dimensional.com
Fidelity Investments Canada ULCwww.fidelity.ca
Foyston Gordon Payne Investment Counsel (FGP)www.foyston.com
Franklin Templeton Investmentswww.franklintempleton.ca
Genus Capital Managementwww.genuscap.com
Greystone Managed Investmentswww.greystone.ca
Guardian Capital LPwww.guardiancapital.com
Invesco www.invescotrimark.com
Jarislowsky Fraser Limited www.jfl.ca
JPMorgan Asset Managementwww.jpmorgan.com
Leith Wheeler Investment Counsel Ltd.www.leithwheeler.com
Manulife Asset Managementwww.manulifeam.com
Mawer Investment Management Ltd.www.mawer.com
MFS Mclean Budden www.mcleanbudden.com
Montrusco Bolton Investments www.montruscobolton.com
Phillips, Hager & North Investment Management Ltd.www.phn.com
Pictet Asset Management (PAM) www.pictet.com
Scheer Rowlett & Associates InvestmentManagement (SRA) www.cclgroup.com/scheerrowlett
Sprucegrove Investment Management
T. Rowe Pricehttp://corporate.troweprice.com
Wellington Managementwww.wellington.com
Fund Managers

4
Asset Classes
ASSET ALLOCATION: A fund that invests in a diverse
range of asset classes, investor styles and fund
managers with the goal of maximizing expected return
while minimizing volatility for each investor profile.
GUARANTEED INTEREST ACCOUNT: A fund that earns
a fixed interest rate from the date of deposit until the date
of maturity. The interest rate is determined on the date of
deposit and does not change.
MONEY MARKET: A fund that invests in short-term
securities.
FIXED INCOME: A fund that invests in fixed income
securities that pay interest, such as corporate and
government bonds. The interest rate earned is more
commonly referred to as a ‘coupon rate’ and is
expressed as a percentage.
BALANCED: A fund that invests primarily in a combination
of common and preferred stock, bonds and short-term
securities. A typical balanced fund concentrates on capital
preservation and growth while mitigating risk.
CANADIAN LARGE CAP EQUITY: A fund that invests
primarily in shares of companies incorporated in Canada.
While the fund may hold some shares of small companies,
it invests primarily in medium-to-large companies listed on
Canadian stock exchanges.
CANADIAN SMALL/MID CAP EQUITY: A fund that
invests primarily in shares of small and medium
companies incorporated in Canada.
U.S. LARGE CAP EQUITY: A fund that invests primarily in
shares of companies incorporated in the U.S. While the
fund may hold some shares of small companies, the fund
invests primarily in medium-to-large companies.
INTERNATIONAL EQUITY: A fund that invests primarily in
shares of companies incorporated outside North America.
GLOBAL EQUITY: A fund that invests in shares of
companies incorporated in one of the following three
geographic regions – Asia, Europe and the Americas.
SPECIALTY: A fund that invests primarily in the
securities of a particular industry, sector, type of security
or geographic region. Due to their limited diversification,
they are considered highly aggressive and their value
may sharply rise and fall over time.
Each asset class is represented by a different colour. The fund pages in this Group Investment Reportand on Manulife’s website are colour-coded to reflect the asset class they represent.

5
ACTIVELY MANAGED FUND: A fund that attempts to
out-perform the applicable benchmark by deviating from the
benchmark weights in securities, sectors, countries and/or
asset classes.
BLEND INVESTMENT STYLE: An investment style that uses
more than one style (e.g. a combination of growth and value
investment styles).
BOTTOM UP: A management style that selects companies
based on their own characteristics, regardless of the industry
or region in which they operate.
CORE INVESTMENT STYLE: An investment style that
typically maintains similar industry weights as the relevant
index and tries to add incremental value through security
selection.
GROWTH INVESTMENT STYLE: An investment style that
purchases securities with a greater than average growth
potential. A key characteristic of a growth stock is a high
Price to Earnings (P/E) ratio.
INDEX FUND: A fund in which the investment manager
tries to replicate the performance of the benchmark. This
can be accomplished by purchasing a proportionate weight
of every security in the benchmark, or by purchasing
alternate securities/vehicles to be used as proxies for
securities in the benchmark.
INTEREST RATE ANTICIPATION INVESTMENT STYLE:
An investment style that adjusts the duration of the fixed
income portfolio based on forecasted movements in the
interest rate.
VALUE INVESTMENT STYLE: An investment style that
purchases securities with market prices cheaper than their
corresponding price from a valuation model. Value securities
typically have assets, cash flows and earnings selling at a
discount relative to the market.
YIELD CURVE FORECASTING INVESTMENT STYLE
(YIELD ENHANCEMENT): An investment style that forecasts
the change in relationship between yield to maturity and
term to maturity and positions the portfolio accordingly.
Investment Styles

Investment Platform – Style Grid
6
Actively Managed
ASSET ALLOCATION2001 Manulife Conservative Asset Allocation Fund 2002 Manulife Moderate Asset Allocation Fund 2003 Manulife Balanced Asset Allocation Fund 2004 Manulife Growth Asset Allocation Fund 2005 Manulife Aggressive Asset Allocation Fund
Short-Term
MONEY MARKET 3132 Manulife Canadian Money Market Fund (MAM)3191 Manulife Daily High Interest Fund
Rate Anticipation Yield Enhancement
FIXED INCOME 4141 Manulife Fidelity Canadian Bond Fund 4161 Manulife MFS MB Fixed Income Fund 4162 Manulife MFS MB Long Term Fixed Income Fund 4192 Manulife Fixed Income Plus Fund (AllianceBernstein)4271 Manulife PH&N Bond Fund
Value Core/Blend
BALANCED 5132 Manulife MMF Monthly High Income Fund5181 Manulife Trimark Income Growth Fund 5301 Manulife Leith Wheeler Diversified Pooled Fund 5631 Manulife Beutel Goodman Balanced Fund
5011 Manulife Balanced Fund5141 Manulife Fidelity Canadian Asset Allocation Fund5232 Manulife CI Harbour Growth & Income Fund5241 Manulife Jarislowsky Fraser Balanced Fund (RPO) 5271 Manulife PH&N Balanced Pension Trust Fund 5291 Manulife GEM Balanced Fund
CANADIAN LARGE CAP EQUITY
7131 Manulife Canadian Large Cap Value Equity Fund (MAM)7181 Manulife Trimark Canadian Fund7601 Manulife Scheer Rowlett Canadian Equity Fund7631 Manulife Beutel Goodman Canadian Equity Fund
7011 Manulife Canadian Equity Fund7141 Manulife Fidelity Canadian Large Cap Fund7142 Manulife Pyramis Canadian Core Equity Fund7143 Manulife Fidelity True North Fund7144 Manulife Fidelity Canadian Disciplined Fund 7231 Manulife CI Harbour Fund 7241 Manulife Jarislowsky Fraser Canadian Equity Fund 7272 Manulife PH&N Canadian Equity Fund
CANADIAN SMALL CAPEQUITY
7381 Manulife FGP Small Cap Canadian Equity Fund
U.S. LARGE CAP EQUITY
8231 Manulife CI American Value Fund 8631 Manulife Beutel Goodman American Equity Fund
8132 Manulife Asset Management U.S. Large Cap Core Fund 8142 Manulife Fidelity Growth America Fund 8451 Manulife Mawer U.S. Equity Fund8683 Manulife MFS U.S. Equity Core Fund
INTERNATIONAL EQUITY
8192 Manulife International Equity Fund (Templeton) 8361 Manulife Sprucegrove International Equity Fund
8011 Manulife EAFE Plus Equity Fund (Pictet)8452 Manulife Mawer World Investment Fund
GLOBAL EQUITY 8181 Manulife Trimark Fund 8362 Manulife Sprucegrove Global Equity Fund8501 Manulife Templeton Global Stock Trust Fund
8141 Manulife Fidelity Global Fund8431 Manulife JPMorgan Global Intrepid Fund (RPO)
SPECIALTY 8581 Manulife Pyramis Global Real Estate Fund

7
ASSET ALLOCATION
MONEY MARKET
Sector Trading Index
FIXED INCOME 4131 Manulife Canadian Bond Fund (MAM) 4191 Manulife Asset Management Canadian Bond Index Fund
Growth Index
BALANCED 5481 Manulife Greystone Balanced Fund
CANADIAN LARGE CAP EQUITY
7121 Manulife Asset Management Canadian Large Cap Growth Fund7293 Manulife Guardian Canadian Growth Equity Fund7313 Manulife CC&L Group Canadian Q Growth Fund7481 Manulife Greystone Canadian Equity Fund
7132 Manulife Asset Management Canadian Equity Index Fund
CANADIAN SMALL CAPEQUITY
7122 Manulife MMF Growth Opportunities Fund
U.S. LARGE CAP EQUITY
8143 Manulife Fidelity American Disciplined Equity Fund8196 Manulife U.S. Diversified Growth Equity Fund (Wellington)
8131 Manulife Asset Management U.S. Equity Index Fund8322 Manulife BlackRock U.S. Equity Index Fund (RPO)
INTERNATIONAL EQUITY
8321 Manulife BlackRock International Equity Index Fund
GLOBAL EQUITY 8684 Manulife MFS Global Growth Equity Fund
SPECIALTY

ASSET ALLOCATION
MONEY MARKET
FIXED INCOME
BALANCED CANADIAN LARGE CAP EQUITY
A S S E T
2002
1231
U.S. LARGE CAP EQUITY
8131 M
an
ulife
Ass
et
Man
ag
em
en
t U
.S. Eq
uit
y In
dex F
un
d
8132 M
an
ulife
Ass
et
Man
ag
em
en
t U
.S. La
rge C
ap
Co
re F
un
d
8181 M
an
ulife
Tri
mark
Fu
nd
8684 M
an
ulife
MFS
Glo
bal G
row
th E
qu
ity F
un
d
8141 M
an
ulife
Fid
elity
Glo
bal Fu
nd
7141 M
an
uli
fe F
ideli
ty C
an
ad
ian
Larg
e C
ap
Fu
nd
7132 M
an
ulife
MA
M C
an
ad
ian
Eq
uit
y In
dex F
un
d
7011 M
an
ulife
Can
ad
ian
Eq
uit
y F
un
d
7131 C
an
ad
ian
Larg
e C
ap
Valu
e E
qu
ity F
un
d (
MA
M)
7143 M
an
ulife
Fid
elity
Tru
e N
ort
h F
un
d
7272 M
an
ulife
PH
&N
Can
ad
ian
Eq
uit
y F
un
d
7181 M
an
ulife
Tri
mark
Can
ad
ian
Fu
nd
5241 M
an
ulife
Jari
slo
wsk
y F
rase
r B
ala
nce
d F
un
d
5181 M
an
ulife
Tri
mark
In
com
e G
row
th F
un
d
5132 M
an
ulife
MM
F M
on
thly
Hig
h In
com
e F
un
d
5291 M
an
ulife
GEM
Bala
nce
d F
un
d
5301 M
an
ulife
Leit
h W
heele
r D
ivers
ifie
d P
oo
led
Fu
nd
5011 M
an
ulife
Bala
nce
d F
un
d
5271 M
an
ulife
PH
&N
Bala
nce
d P
en
sio
n T
rust
Fu
nd
4191 M
an
ulife
MA
M C
an
ad
ian
Bo
nd
In
dex F
un
d
4131 C
an
ad
ian
Bo
nd
Fu
nd
(M
AM
)
4161 M
an
ulife
MFS
MB
Fix
ed
In
com
e F
un
d
4271 M
an
ulife
PH
&N
Bo
nd
Fu
nd
4141 M
an
ulife
Fid
eli
ty C
an
ad
ian
Bo
nd
Fu
nd
4162 M
an
ulife
McL
ean
Bu
dd
en
Lo
ng
Term
Fix
ed
In
com
e F
un
d
4192 M
an
ulife
Fix
ed
In
com
e P
lus
Fun
d (
Allia
nce
Bern
stein
)
2001 M
an
ulife
Co
nse
rvati
ve A
sset
All
oca
tio
n F
un
d
2002 M
an
uli
fe M
od
era
te A
sset
All
oca
tio
n F
un
d
2003 M
an
uli
fe B
ala
nce
d A
sset
All
oca
tio
n F
un
d
2005 M
an
ulife
Ag
gre
ssiv
e A
sset
Allo
cati
on
Fu
nd
2004 M
an
uli
fe G
row
th A
sset
All
oca
tio
n F
un
d
SPECIALTY
Vo
lati
lity
Met
erLO
W 1
HIG
H 2
5
5481 M
an
ulife
Gre
yst
on
e B
ala
nce
d F
un
d
5141 M
an
ulife
Fid
elity
Can
ad
ian
Ass
et
Allo
cati
on
7481 M
an
ulife
Gre
yst
on
e C
an
ad
ian
Eq
uit
y F
un
d
7601 M
an
ulife
Sch
eer
Ro
wle
tt C
an
ad
ian
Eq
uit
y F
un
d
7381 M
an
ulife
FG
P S
mall C
ap
Can
ad
ian
Eq
uit
y F
un
d
8322 M
an
ulife
Bla
ckR
ock
U.S
. Eq
uit
y In
dex F
un
d
Vol
atili
ty M
eter
LOW
1H
IGH
25
510
1520
25
8501 M
an
ulife
Tem
ple
ton
Glo
bal Sto
ck T
rust
Fu
nd
3132 C
an
ad
ian
Mo
ney M
ark
et
Fun
d (
MA
M)
3191 M
an
ulife
Daily H
igh
In
tere
st F
un
d
8
431 M
an
ulife
JPM
org
an
Glo
bal In
trep
id F
un
d
8142 M
an
uli
fe F
ideli
ty G
row
th A
meri
ca F
un
d
7122 M
an
ulife
MM
F G
row
th O
pp
ort
un
itie
s Fu
nd
8321 M
an
ulife
Bla
ckR
ock
In
tern
ati
on
al Eq
uit
y In
dex F
un
d
8192 M
an
ulife
In
tern
ati
on
al Eq
uit
y F
un
d (
Tem
ple
ton
)
8011 M
an
ulife
EA
FE P
lus
Eq
uit
y F
un
d (
Pic
tet)
8196 M
an
ulife
U.S
. D
ivers
ifie
d G
row
th E
qu
ity F
un
d (
Wellin
gto
n)
8581 M
an
ulife
Pyra
mis
Glo
bal R
eal Est
ate
Fu
nd
5631 M
an
ulife
Beu
tel G
oo
dm
an
Bala
nce
d F
un
d
5232 M
an
ulife
CI H
arb
ou
r G
row
th &
In
com
e F
un
d
7231 M
an
ulife
CI H
arb
ou
r Fu
nd
7631 M
an
ulife
Beu
tel G
oo
dm
an
Can
ad
ian
Eq
uit
y F
un
d
7293 M
an
ulife
Gu
ard
ian
Can
ad
ian
Gro
wth
Eq
uit
y F
un
d
7313 M
an
ulife
CC
&L
Gro
up
Can
ad
ian
Q G
row
th F
un
d
7144 M
an
ulife
Fid
elity
Can
ad
ian
Dis
cip
lin
ed
Eq
uit
y F
un
d
7142 M
an
ulife
Pyra
mis
Can
ad
ian
Co
re E
qu
ity F
un
d
8231 M
an
ulife
CI A
meri
can
Valu
e F
un
d
8683 M
an
ulife
MFS
U.S
. Eq
uit
y C
ore
Fu
nd
8451 M
an
ulife
Maw
er
U.S
. Eq
uit
y F
un
d
8631 M
an
ulife
Beu
tel G
oo
dm
an
Am
eri
can
Eq
uit
y F
un
d
8361 M
an
ulife
Sp
ruce
gro
ve In
tern
ati
on
al Eq
uit
y F
un
d
8452 M
an
ulife
Maw
er
Wo
rld
In
vest
men
t Fu
nd
8362 M
an
ulife
Sp
ruce
gro
ve G
lob
al Eq
uit
y F
un
d
7121 M
an
ulife
MM
F C
an
ad
ian
Eq
uit
y F
un
d
7241 M
an
ulife
Jari
slo
wsk
y F
rase
r C
an
ad
ian
Eq
uit
y F
un
d
8143 M
an
ulife
Fid
elity
Am
eri
can
Dis
cip
lin
ed
Eq
uit
y F
un
d
8
Volatility Rating Overview
ASSET ALLOCATION
MONEY MARKET
FIXED INCOME
BALANCED CANADIAN LARGE CAP EQUITY
CANADIANSMALL\ MID CAP EQUITY
GLOBAL EQUITY
INTERNATIONAL EQUITY
A S S E T C
L A S S
2002
1231
U.S. LARGE CAP EQUITY
8131 M
an
ulife
Ass
et
Man
ag
em
en
t U
.S. Eq
uit
y In
dex F
un
d
8132 M
an
ulife
Ass
et
Man
ag
em
en
t U
.S. La
rge C
ap
Co
re F
un
d
8181 M
an
ulife
Tri
mark
Fu
nd
8684 M
an
ulife
MFS
Glo
bal G
row
th E
qu
ity F
un
d
8141 M
an
ulife
Fid
elity
Glo
bal Fu
nd
7141 M
an
uli
fe F
ideli
ty C
an
ad
ian
Larg
e C
ap
Fu
nd
7132 M
an
ulife
MA
M C
an
ad
ian
Eq
uit
y In
dex F
un
d
7011 M
an
ulife
Can
ad
ian
Eq
uit
y F
un
d
7131 C
an
ad
ian
Larg
e C
ap
Valu
e E
qu
ity F
un
d (
MA
M)
7143 M
an
ulife
Fid
elity
Tru
e N
ort
h F
un
d
7272 M
an
ulife
PH
&N
Can
ad
ian
Eq
uit
y F
un
d
7181 M
an
ulife
Tri
mark
Can
ad
ian
Fu
nd
5241 M
an
ulife
Jari
slo
wsk
y F
rase
r B
ala
nce
d F
un
d
5181 M
an
ulife
Tri
mark
In
com
e G
row
th F
un
d
5132 M
an
ulife
MM
F M
on
thly
Hig
h In
com
e F
un
d
5291 M
an
ulife
GEM
Bala
nce
d F
un
d
5301 M
an
ulife
Leit
h W
heele
r D
ivers
ifie
d P
oo
led
Fu
nd
5011 M
an
ulife
Bala
nce
d F
un
d
5271 M
an
ulife
PH
&N
Bala
nce
d P
en
sio
n T
rust
Fu
nd
4191 M
an
ulife
MA
M C
an
ad
ian
Bo
nd
In
dex F
un
d
4131 C
an
ad
ian
Bo
nd
Fu
nd
(M
AM
)
4161 M
an
ulife
MFS
MB
Fix
ed
In
com
e F
un
d
4271 M
an
ulife
PH
&N
Bo
nd
Fu
nd
4141 M
an
ulife
Fid
eli
ty C
an
ad
ian
Bo
nd
Fu
nd
4162 M
an
ulife
McL
ean
Bu
dd
en
Lo
ng
Term
Fix
ed
In
com
e F
un
d
4192 M
an
ulife
Fix
ed
In
com
e P
lus
Fun
d (
Allia
nce
Bern
stein
)
2001 M
an
ulife
Co
nse
rvati
ve A
sset
All
oca
tio
n F
un
d
2002 M
an
uli
fe M
od
era
te A
sset
All
oca
tio
n F
un
d
2003 M
an
uli
fe B
ala
nce
d A
sset
All
oca
tio
n F
un
d
2005 M
an
ulife
Ag
gre
ssiv
e A
sset
Allo
cati
on
Fu
nd
2004 M
an
uli
fe G
row
th A
sset
All
oca
tio
n F
un
d
SPECIALTY
Vo
lati
lity
Met
erLO
W 1
HIG
H 2
5
5481 M
an
ulife
Gre
yst
on
e B
ala
nce
d F
un
d
5141 M
an
ulife
Fid
elity
Can
ad
ian
Ass
et
Allo
cati
on
7481 M
an
ulife
Gre
yst
on
e C
an
ad
ian
Eq
uit
y F
un
d
7601 M
an
ulife
Sch
eer
Ro
wle
tt C
an
ad
ian
Eq
uit
y F
un
d
7381 M
an
ulife
FG
P S
mall C
ap
Can
ad
ian
Eq
uit
y F
un
d
8322 M
an
ulife
Bla
ckR
ock
U.S
. Eq
uit
y In
dex F
un
d
Vol
atili
ty M
eter
LOW
1H
IGH
25
510
1520
25
8501 M
an
ulife
Tem
ple
ton
Glo
bal Sto
ck T
rust
Fu
nd
3132 C
an
ad
ian
Mo
ney M
ark
et
Fun
d (
MA
M)
3191 M
an
ulife
Daily H
igh
In
tere
st F
un
d
8
431 M
an
ulife
JPM
org
an
Glo
bal In
trep
id F
un
d
8142 M
an
uli
fe F
ideli
ty G
row
th A
meri
ca F
un
d
7122 M
an
ulife
MM
F G
row
th O
pp
ort
un
itie
s Fu
nd
8321 M
an
ulife
Bla
ckR
ock
In
tern
ati
on
al Eq
uit
y In
dex F
un
d
8192 M
an
ulife
In
tern
ati
on
al Eq
uit
y F
un
d (
Tem
ple
ton
)
8011 M
an
ulife
EA
FE P
lus
Eq
uit
y F
un
d (
Pic
tet)
8196 M
an
ulife
U.S
. D
ivers
ifie
d G
row
th E
qu
ity F
un
d (
Wellin
gto
n)
8581 M
an
ulife
Pyra
mis
Glo
bal R
eal Est
ate
Fu
nd
5631 M
an
ulife
Beu
tel G
oo
dm
an
Bala
nce
d F
un
d
5232 M
an
ulife
CI H
arb
ou
r G
row
th &
In
com
e F
un
d
7231 M
an
ulife
CI H
arb
ou
r Fu
nd
7631 M
an
ulife
Beu
tel G
oo
dm
an
Can
ad
ian
Eq
uit
y F
un
d
7293 M
an
ulife
Gu
ard
ian
Can
ad
ian
Gro
wth
Eq
uit
y F
un
d
7313 M
an
ulife
CC
&L
Gro
up
Can
ad
ian
Q G
row
th F
un
d
7144 M
an
ulife
Fid
elity
Can
ad
ian
Dis
cip
lin
ed
Eq
uit
y F
un
d
7142 M
an
ulife
Pyra
mis
Can
ad
ian
Co
re E
qu
ity F
un
d
8231 M
an
ulife
CI A
meri
can
Valu
e F
un
d
8683 M
an
ulife
MFS
U.S
. Eq
uit
y C
ore
Fu
nd
8451 M
an
ulife
Maw
er
U.S
. Eq
uit
y F
un
d
8631 M
an
ulife
Beu
tel G
oo
dm
an
Am
eri
can
Eq
uit
y F
un
d
8361 M
an
ulife
Sp
ruce
gro
ve In
tern
ati
on
al Eq
uit
y F
un
d
8452 M
an
ulife
Maw
er
Wo
rld
In
vest
men
t Fu
nd
8362 M
an
ulife
Sp
ruce
gro
ve G
lob
al Eq
uit
y F
un
d
7121 M
an
ulife
MM
F C
an
ad
ian
Eq
uit
y F
un
d
7241 M
an
ulife
Jari
slo
wsk
y F
rase
r C
an
ad
ian
Eq
uit
y F
un
d
8143 M
an
ulife
Fid
elity
Am
eri
can
Dis
cip
lin
ed
Eq
uit
y F
un
d
The triangle represents the fund's rating on the volatility meter.

9
ASSET ALLOCATION
MONEY MARKET
FIXED INCOME
BALANCED CANADIAN LARGE CAP EQUITY
CANADIANSMALL\ MID CAP EQUITY
GLOBAL EQUITY
INTERNATIONAL EQUITY
A S S E T C
L A S S
2002
1231
U.S. LARGE CAP EQUITY
8131 M
an
ulife
Ass
et
Man
ag
em
en
t U
.S. Eq
uit
y In
dex F
un
d
8132 M
an
ulife
Ass
et
Man
ag
em
en
t U
.S. La
rge C
ap
Co
re F
un
d
8181 M
an
ulife
Tri
mark
Fu
nd
8684 M
an
ulife
MFS
Glo
bal G
row
th E
qu
ity F
un
d
8141 M
an
ulife
Fid
elity
Glo
bal Fu
nd
7141 M
an
uli
fe F
ideli
ty C
an
ad
ian
Larg
e C
ap
Fu
nd
7132 M
an
ulife
MA
M C
an
ad
ian
Eq
uit
y In
dex F
un
d
7011 M
an
ulife
Can
ad
ian
Eq
uit
y F
un
d
7131 C
an
ad
ian
Larg
e C
ap
Valu
e E
qu
ity F
un
d (
MA
M)
7143 M
an
ulife
Fid
elity
Tru
e N
ort
h F
un
d
7272 M
an
ulife
PH
&N
Can
ad
ian
Eq
uit
y F
un
d
7181 M
an
ulife
Tri
mark
Can
ad
ian
Fu
nd
5241 M
an
ulife
Jari
slo
wsk
y F
rase
r B
ala
nce
d F
un
d
5181 M
an
ulife
Tri
mark
In
com
e G
row
th F
un
d
5132 M
an
ulife
MM
F M
on
thly
Hig
h In
com
e F
un
d
5291 M
an
ulife
GEM
Bala
nce
d F
un
d
5301 M
an
ulife
Leit
h W
heele
r D
ivers
ifie
d P
oo
led
Fu
nd
5011 M
an
ulife
Bala
nce
d F
un
d
5271 M
an
ulife
PH
&N
Bala
nce
d P
en
sio
n T
rust
Fu
nd
4191 M
an
ulife
MA
M C
an
ad
ian
Bo
nd
In
dex F
un
d
4131 C
an
ad
ian
Bo
nd
Fu
nd
(M
AM
)
4161 M
an
ulife
MFS
MB
Fix
ed
In
com
e F
un
d
4271 M
an
ulife
PH
&N
Bo
nd
Fu
nd
4141 M
an
ulife
Fid
eli
ty C
an
ad
ian
Bo
nd
Fu
nd
4162 M
an
ulife
McL
ean
Bu
dd
en
Lo
ng
Term
Fix
ed
In
com
e F
un
d
4192 M
an
ulife
Fix
ed
In
com
e P
lus
Fun
d (
Allia
nce
Bern
stein
)
2001 M
an
ulife
Co
nse
rvati
ve A
sset
All
oca
tio
n F
un
d
2002 M
an
uli
fe M
od
era
te A
sset
All
oca
tio
n F
un
d
2003 M
an
uli
fe B
ala
nce
d A
sset
All
oca
tio
n F
un
d
2005 M
an
ulife
Ag
gre
ssiv
e A
sset
Allo
cati
on
Fu
nd
2004 M
an
uli
fe G
row
th A
sset
All
oca
tio
n F
un
d
SPECIALTY
Vo
lati
lity
Met
erLO
W 1
HIG
H 2
5
5481 M
an
ulife
Gre
yst
on
e B
ala
nce
d F
un
d
5141 M
an
ulife
Fid
elity
Can
ad
ian
Ass
et
Allo
cati
on
7481 M
an
ulife
Gre
yst
on
e C
an
ad
ian
Eq
uit
y F
un
d
7601 M
an
ulife
Sch
eer
Ro
wle
tt C
an
ad
ian
Eq
uit
y F
un
d
7381 M
an
ulife
FG
P S
mall C
ap
Can
ad
ian
Eq
uit
y F
un
d
8322 M
an
ulife
Bla
ckR
ock
U.S
. Eq
uit
y In
dex F
un
d
Vol
atili
ty M
eter
LOW
1H
IGH
25
510
1520
25
8501 M
an
ulife
Tem
ple
ton
Glo
bal Sto
ck T
rust
Fu
nd
3132 C
an
ad
ian
Mo
ney M
ark
et
Fun
d (
MA
M)
3191 M
an
ulife
Daily H
igh
In
tere
st F
un
d
8
431 M
an
ulife
JPM
org
an
Glo
bal In
trep
id F
un
d
8142 M
an
uli
fe F
ideli
ty G
row
th A
meri
ca F
un
d
7122 M
an
ulife
MM
F G
row
th O
pp
ort
un
itie
s Fu
nd
8321 M
an
ulife
Bla
ckR
ock
In
tern
ati
on
al Eq
uit
y In
dex F
un
d
8192 M
an
ulife
In
tern
ati
on
al Eq
uit
y F
un
d (
Tem
ple
ton
)
8011 M
an
ulife
EA
FE P
lus
Eq
uit
y F
un
d (
Pic
tet)
8196 M
an
ulife
U.S
. D
ivers
ifie
d G
row
th E
qu
ity F
un
d (
Wellin
gto
n)
8581 M
an
ulife
Pyra
mis
Glo
bal R
eal Est
ate
Fu
nd
5631 M
an
ulife
Beu
tel G
oo
dm
an
Bala
nce
d F
un
d
5232 M
an
ulife
CI H
arb
ou
r G
row
th &
In
com
e F
un
d
7231 M
an
ulife
CI H
arb
ou
r Fu
nd
7631 M
an
ulife
Beu
tel G
oo
dm
an
Can
ad
ian
Eq
uit
y F
un
d
7293 M
an
ulife
Gu
ard
ian
Can
ad
ian
Gro
wth
Eq
uit
y F
un
d
7313 M
an
ulife
CC
&L
Gro
up
Can
ad
ian
Q G
row
th F
un
d
7144 M
an
ulife
Fid
elity
Can
ad
ian
Dis
cip
lin
ed
Eq
uit
y F
un
d
7142 M
an
ulife
Pyra
mis
Can
ad
ian
Co
re E
qu
ity F
un
d
8231 M
an
ulife
CI A
meri
can
Valu
e F
un
d
8683 M
an
ulife
MFS
U.S
. Eq
uit
y C
ore
Fu
nd
8451 M
an
ulife
Maw
er
U.S
. Eq
uit
y F
un
d
8631 M
an
ulife
Beu
tel G
oo
dm
an
Am
eri
can
Eq
uit
y F
un
d
8361 M
an
ulife
Sp
ruce
gro
ve In
tern
ati
on
al Eq
uit
y F
un
d
8452 M
an
ulife
Maw
er
Wo
rld
In
vest
men
t Fu
nd
8362 M
an
ulife
Sp
ruce
gro
ve G
lob
al Eq
uit
y F
un
d
7121 M
an
ulife
MM
F C
an
ad
ian
Eq
uit
y F
un
d
7241 M
an
ulife
Jari
slo
wsk
y F
rase
r C
an
ad
ian
Eq
uit
y F
un
d
8143 M
an
ulife
Fid
elity
Am
eri
can
Dis
cip
lin
ed
Eq
uit
y F
un
d
The
vol
atili
ty r
atin
g is
bas
ed o
n th
e st
anda
rd d
evia
tion
of
mon
thly
ret
urns
of
the
fund
or
unde
rlyi
ng f
und
over
a t
hree
-yea
r pe
riod
as
of J
une
30, 2
013.
Fun
d vo
lati
lity
is b
ased
on t
he s
tand
ard
devi
atio
n of
mon
thly
ret
urns
ove
r a
thre
e-ye
ar p
erio
d. F
unds
in o
pera
tion
for
less
tha
n th
ree
year
s ar
e ra
ted
usin
g th
e lo
nges
t ti
me
peri
od a
vaila
ble.
For
a f
und
and
unde
rlyi
ng f
und
whe
re r
etur
n hi
stor
y is
less
tha
n on
e ye
ar, n
o vo
lati
lity
rati
ng w
ill a
ppea
r. S
tand
ard
devi
atio
n is
a m
easu
re o
f ri
sk a
nd in
dica
tes
the
degr
ee t
o w
hich
the
fund
’s va
lue
has
fluct
uate
d. A
fun
d w
ith
high
vol
atili
ty h
as e
xper
ienc
ed m
ore
vari
abili
ty in
mon
th-t
o-m
onth
ret
urns
tha
n a
fund
wit
h lo
w v
olat
ility
.

10
Rates of Return Overview
Gross rates of return (%) as of June 30, 2013. Gross rates of return reflect performance before fees are deducted.
FundCode Fund name
Year todate2
ANNUALIZED RETURN
1Year
2Year
3Year
4Year
5Year
10Year
ANNUAL RETURN 1
2013 2012 2011 2010 2009Page
number
ASSET ALLOCATION2001 Manulife Conservative Asset Allocation Fund 0.6 4.5 4.9 5.6 6.0 4.9 5.6 4.5 5.2 7.1 7.4 0.4 15
2002 Manulife Moderate Asset Allocation Fund 2.2 7.6 5.1 6.7 7.0 4.6 6.3 7.6 2.5 10.0 8.1 -4.8 16
2003 Manulife Balanced Asset Allocation Fund 3.8 10.8 5.2 8.3 8.5 4.6 7.0 10.8 -0.2 14.7 9.4 -9.8 17
2004 Manulife Growth Asset Allocation Fund 5.4 13.9 4.9 8.7 9.0 3.3 7.2 13.9 -3.3 16.7 10.0 -16.9 18
2005 Manulife Aggressive Asset Allocation Fund 6.7 16.4 4.5 9.8 10.0 2.6 7.7 16.4 -6.2 21.1 10.8 -22.5 19
MONEY MARKET3132 Manulife Canadian Money Market Fund (MAM) 0.7 1.3 1.3 1.3 1.2 1.5 2.5 1.3 1.4 1.3 0.8 2.5 22
3191 Manulife Daily High Interest Fund 0.8 1.7 1.7 1.7 1.5 1.7 n/a 1.7 1.8 1.5 1.0 2.4 23
DEX 91-Day Treasury Bill Index 0.5 1.0 1.0 1.0 0.8 1.0 2.2 1.0 1.0 0.9 0.3 2.0
FIXED INCOME4131 Manulife Canadian Bond Fund (MAM) -1.7 0.5 4.7 4.8 5.7 6.1 5.6 0.5 9.1 5.0 8.3 7.7 30
4141 Manulife Fidelity Canadian Bond Fund -1.6 0.4 5.0 5.1 5.9 6.2 5.8 0.4 9.9 5.1 8.6 7.2 25
4161 Manulife MFS McLean Budden Fixed Income Fund -1.4 0.9 4.8 4.7 5.4 5.9 5.4 0.9 8.9 4.4 7.5 8.0 26
4162 Manulife MFS Mclean Budden Long-Term Fixed Income Fund -4.4 -1.7 7.5 7.2 8.4 7.9 7.3 -1.7 17.4 6.8 12.0 5.8 27
4191 Manulife MAM Canadian Bond Index Fund -1.7 -0.1 4.6 4.6 5.1 5.5 5.3 -0.1 9.5 4.6 6.7 7.0 31
4192 Manulife Fixed Income Plus Fund (AllianceBernstein) -2.1 0.2 4.5 5.2 6.9 6.0 n/a 0.2 9.0 6.6 12.1 2.4 28
4271 Manulife PH&N Bond Fund -1.4 0.6 4.6 4.8 5.8 6.1 5.7 0.6 8.7 5.2 9.0 7.1 29
DEX Universe Bond Index -1.7 -0.2 4.6 4.6 5.2 5.5 5.3 -0.2 9.5 4.7 6.9 7.0
BALANCED5011 Manulife Balanced Fund 4.9 10.7 6.3 9.1 9.1 5.6 7.5 10.7 2.1 14.7 9.0 -7.2 37
5132 Manulife MMF Monthly High Income Fund3 8.2 14.2 9.5 10.4 11.2 6.7 9.6 14.2 5.0 12.3 13.4 -9.3 33
5141 Manulife Fidelity Canadian Asset Allocation Fund 2.2 7.3 2.1 6.1 6.7 3.0 8.4 7.3 -2.8 14.5 8.4 -10.6 38
5181 Manulife Trimark Income Growth Fund 9.4 14.9 7.8 10.1 9.7 6.3 6.9 14.9 1.2 14.8 8.6 -6.5 34
5232 Manulife CI Harbour Growth & Income Fund 4.3 9.0 2.4 7.0 6.7 2.8 8.1 9.0 -3.8 16.7 6.0 -11.4 39
5241 Manulife Jarislowsky Fraser Balanced Fund 7.2 14.1 8.3 9.9 8.8 5.5 6.7 14.1 2.8 13.1 5.5 -6.5 40
5271 Manulife PH&N Balanced Pension Trust Fund 3.7 9.8 4.1 7.1 7.1 3.8 6.0 9.8 -1.4 13.3 7.3 -8.7 41
5291 Manulife GEM Balanced Fund 3.2 8.0 4.6 7.5 7.2 3.4 n/a 8.0 1.8 13.4 6.3 -10.6 42
5301 Manulife Leith Wheeler Diversified Pooled Fund 6.4 12.4 7.2 9.9 9.9 5.7 7.7 12.4 2.2 15.4 10.2 -9.9 35
5481 Manulife Greystone Balanced Fund 4.3 9.6 3.3 7.1 7.0 2.4 6.6 9.6 -2.7 15.1 6.9 -14.3 43
5631 Manulife Beutel Goodman Balanced Fund 5.6 13.3 7.1 9.5 8.9 6.2 7.7 13.3 1.1 14.4 6.9 -4.3 36
Balanced Benchmark4 2.2 7.5 3.7 6.6 6.7 3.1 6.4 7.5 0.0 12.7 7.0 -10.3
1 The rates of return that a fund earned over a specific 12-month period. As an example: a one-year annual return as at July 2010 would measure performance from . August 1, 2009 to July 30, 2010.
2 Year to date (YTD) rates of return are not annualized.3 The Manulife MMF Monthly High Income's primary objective is to provide investors with a steady flow of monthly income and capital growth. The fund invests in a variety
of equity securities, fixed income securities and income trusts.4 Comprised of 35% S&P/TSX Composite Index, 35% DEX Universe Bond Index (Total Return), 10% S&P 500 Index ($C), 10% MSCI EAFE Index ($C), and 10% DEX 91-Day T-bills.
5 nagement Canadian Large Cap Growth.
For the Manulife Segregated Fund, performance prior to this date was derived from the Manulife Mutual Funds Canadian Equity.
Manulife Return: These numbers represent the gross rates of return of the Manulife fund.
Additional Historical Information: In order to provide historic gross rates of return information, we have included the returns for each of the respective underlying funds.

11
The investment management fees (IMFs) you pay appear on the secure member website at www.manulife.ca/GRO.
FundCode Fund name
Year todate2
ANNUALIZED RETURN
1Year
2Year
3Year
4Year
5Year
10Year
ANNUAL RETURN 1
2013 2012 2011 2010 2009Page
number
CANADIAN LARGE CAP EQUITY7011 Manulife Canadian Equity Fund 1.8 10.2 -1.5 4.9 6.4 -1.7 8.6 10.2 -12.0 19.0 11.3 -28.6 49
7121 Manulife Asset Management Canadian Large Cap Growth Fund5 4.5 9.1 -1.3 5.3 5.5 -3.5 7.4 9.1 -10.7 19.7 6.4 -32.5 57
7131 Manulife Canadian Large Cap Value Equity Fund (MAM) 4.7 20.9 4.8 7.6 9.1 2.9 9.3 20.9 -9.2 13.3 13.8 -18.6 45
7132 Manulife MAM Canadian Equity Index Fund -0.9 7.9 -1.6 5.4 7.0 -0.4 8.5 7.9 -10.3 20.9 11.9 -25.2 61
7141 Manulife Fidelity Canadian Large Cap Fund 21.2 26.6 17.7 22.0 20.2 10.0 15.8 26.6 9.5 31.1 15.0 -22.9 50
7142 Manulife Pyramis Canadian Core Equity Fund 3.0 11.1 0.7 6.7 8.1 0.5 10.0 11.1 -8.8 20.1 12.5 -25.0 51
7143 Manulife Fidelity True North Fund 9.8 18.7 6.6 10.8 10.5 1.9 11.0 18.7 -4.3 19.6 9.7 -26.5 52
7144 Manulife Fidelity Canadian Disciplined Equity Fund 3.4 12.9 0.4 7.6 9.2 0.8 10.5 12.9 -10.7 23.5 14.0 -26.5 53
7181 Manulife Trimark Canadian Fund 7.5 18.1 6.0 11.6 11.9 6.6 7.5 18.1 -4.9 23.7 12.7 -12.0 46
7231 Manulife CI Harbour Fund 4.3 10.6 3.1 8.7 8.4 3.2 10.3 10.6 -3.9 20.8 7.4 -15.0 54
7241 Manulife Jarislowsky Fraser Canadian Equity Fund 7.7 18.2 4.5 9.1 8.4 2.6 10.1 18.2 -7.7 19.1 6.2 -17.6 55
7272 Manulife PH&N Canadian Equity Fund 3.2 13.2 0.4 6.7 7.0 0.4 7.9 13.2 -11.0 20.5 7.7 -22.0 56
7293 Manulife Guardian Canadian Growth Equity Fund 6.2 14.6 1.6 7.5 9.7 2.4 10.7 14.6 -9.3 20.3 16.5 -22.1 58
7313 Manulife CC&L Group Canadian Q Growth Fund 5.0 16.4 3.9 10.0 10.8 1.7 11.4 16.4 -7.6 23.3 13.5 -28.1 59
7481 Manulife Greystone Canadian Equity Fund 3.0 11.0 -2.7 4.4 6.4 -3.0 7.9 11.0 -14.6 20.2 12.5 -33.1 60
7601 Manulife Scheer Rowlett Canadian Equity Fund -1.9 9.1 -1.4 5.0 7.0 -1.1 9.1 9.1 -10.9 19.1 13.1 -27.7 47
7631 Manulife Beutel Goodman Canadian Equity Fund 7.4 18.6 5.7 10.5 10.7 5.5 10.1 18.6 -5.8 20.8 10.5 -12.8 48
S&P/TSX Composite Index -0.8 7.9 -1.6 5.4 7.0 -0.6 8.4 7.9 -10.3 20.9 12.0 -25.8
CANADIAN SMALL TO MID CAP EQUITY7122 Manulife MMF Growth Opportunities Fund 3.0 10.1 -2.7 5.1 12.1 2.2 10.7 10.1 -14.0 22.7 36.0 -29.6 63
7381 Manulife FGP Small Cap Canadian Equity Fund 9.0 17.2 6.5 12.5 17.1 6.1 12.6 17.2 -3.2 25.6 31.8 -28.3 62
BMO Nesbitt Burns Small Cap Index -6.3 2.1 -7.3 4.1 1.9 1.7 8.9 2.1 -15.8 31.1 39.1 -30.5
U.S. LARGE CAP EQUITY8131 Manulife MAM U.S. Equity Index Fund 20.4 24.3 17.5 17.8 14.2 7.4 4.2 24.3 11.0 18.5 4.1 -15.8 73
8132 Manulife MAM U.S. Large Cap Core Fund 18.6 27.6 18.5 19.2 15.0 7.8 5.3 27.6 10.0 20.8 3.3 -16.7 67
8142 Manulife Fidelity Growth America Fund 17.8 22.5 13.9 15.7 12.6 5.5 3.3 22.5 5.9 19.5 3.8 -18.9 68
8143 Manulife Fidelity American Disciplined Equity Fund 18.8 23.5 14.4 16.0 12.8 5.1 6.5 23.5 5.9 19.3 3.6 -20.5 71
8196 Manulife U.S. Diversified Growth Equity Fund (Wellington) 19.7 19.9 13.3 16.3 13.9 6.9 n/a 19.9 7.1 22.4 7.1 -16.9 72
8231 Manulife CI American Value Fund 21.6 24.1 15.9 16.6 12.6 6.3 7.1 24.1 8.3 20.3 1.3 -15.3 65
8322 Manulife BlackRock U.S. Equity Index Fund 20.5 24.7 17.9 18.2 14.6 7.9 n/a 24.7 11.4 18.7 4.7 -15.2 74
8451 Manulife Mawer U.S. Equity Fund 20.8 28.8 19.1 18.2 13.6 8.6 5.8 28.8 10.1 16.2 1.0 -9.5 69
8631 Manulife Beutel Goodman American Equity Fund 24.5 33.1 20.9 19.3 15.8 10.5 7.7 33.1 9.9 16.5 6.1 -8.7 66
8683 Manulife MFS U.S. Equity Core Fund 19.4 27.9 16.1 15.9 11.8 6.1 4.8 27.9 5.5 15.5 0.3 -14.1 70
S&P 500 Index ($ Cdn) 20.3 24.6 17.7 8.1 14.5 7.7 4.6 24.6 11.3 18.8 4.4 -15.8
INTERNATIONAL EQUITY8011 Manulife EAFE Plus Equity Fund (Pictet) 11.3 26.0 8.2 13.1 9.3 1.4 4.1 26.0 -7.0 23.3 -1.2 -24.9 78
8192 Manulife International Equity Fund (Templeton) 9.6 25.8 5.9 10.6 7.4 1.3 5.5 25.8 -10.8 20.6 -1.7 -20.0 76
8321 Manulife BlackRock International Equity Index Fund 10.5 22.9 5.9 10.0 6.6 0.3 5.1 22.9 -8.8 18.7 -3.0 -21.3 80
8361 Manulife Sprucegrove International Equity Fund 8.0 18.7 6.5 10.2 9.4 3.3 6.6 18.7 -4.4 17.9 7.2 -17.9 77
8452 Manulife Mawer World Investment Fund 7.0 21.5 8.4 13.9 11.6 4.9 9.1 21.5 -3.3 25.7 4.9 -18.0 79
MSCI EAFE Index ($ Cdn) 10.4 22.9 6.1 10.2 6.8 0.5 5.4 22.9 -8.5 19.0 -3.0 -21.2
GLOBAL EQUITY8141 Manulife Fidelity Global Fund 12.0 21.3 8.4 12.2 9.4 2.7 4.5 21.3 -3.3 20.2 1.4 -20.3 84
8181 Manulife Trimark Fund 13.1 22.2 14.7 15.4 12.7 4.9 5.8 22.2 7.6 16.7 4.9 -21.3 81
8362 Manulife Sprucegrove Global Equity Fund 15.2 21.8 10.7 12.1 11.2 5.3 5.4 21.8 0.7 14.9 8.1 -15.4 82
8431 Manulife JPMorgan Global Intrepid Fund 14.4 24.4 9.3 13.5 10.4 3.5 n/a 24.4 -4.0 22.4 1.7 -20.1 85
8501 Manulife Templeton Global Stock Trust Fund 18.1 37.8 11.4 13.6 10.1 4.3 6.3 37.8 -9.9 18.1 0.1 -15.8 83
8684 Manulife MFS Global Growth Equity Fund 11.2 21.8 6.1 12.9 12.1 4.0 7.1 21.8 -7.5 27.9 9.7 -23.0 86
MSCI World Index ($ Cdn) 14.9 23.0 11.5 14.0 10.6 4.0 5.1 23.0 1.0 19.3 1.1 -19.0
SPECIALTY8581 Manulife Pyramis Global Real Estate Fund 7.3 17.9 12.7 15.3 15.9 4.8 n/a 17.9 7.8 20.6 17.8 -30.0 88
FTSE EPRA/NAREIT Global Real Estate ($ Cdn) 8.5 18.3 13.1 15.7 15.4 5.4 n/a 18.3 8.1 21.1 14.4 -26.6

12
How to Read Fund Descriptions
Fund code Each fund is named using a unique code. Identify aspecific fund using its fund code when you select orchange funds.
Asset class The types of investments (such as Canadian Equity,International Equity, Fixed Income) that account for themajority of the fund’s holdings. Funds are colour-coded byasset class.
Please note: Funds classified as “Balanced” hold similarportions of equity and fixed income investments.
Volatility meter The volatility meter is a scale – ranging from low to high –that illustrates the amount that a fund's value is likely tofluctuate. Fund volatility is based on the standarddeviation of monthly returns over a three-year period.Funds in operation for less than three years are ratedusing the longest time period available. For a fund and
3
2
1
underlying fund where return history is less than one year,no volatility rating will appear. The current volatility meteruses a 25-point volatility scale.
How the underlying fund is invested The pie chart shows the types of investments in the
underlying fund and the percentage of the overall
portfolio they represent.
Top holdings The individual investments in the underlying fund that
comprise the largest percentage of the overall portfolio.
This is determined using the percentage weighting of the
fund’s net market value.
Primary investment processFund managers use a number of approaches to determine
the asset allocation of a fund and to select the individual
securities it will hold. These are the most common
approaches:
• Fundamental Bottom-up – This approach considers
the investment merits of individual companies. The
sector allocation of a fund managed in this way will be
determined by the individual stocks held in the fund.
• Quantitative – This technique applies complexmathematical research and statistical models along with
measurement and research to identify attractive
investments.
• Index – An indexed portfolio is constructed to mimicthe performance of a specific market index. This
approach is also known as passive investing.
• Multi-manager – A multi-manager fund is directed bymore than one investment manager and often
combines different investment styles or asset classes.
Equity style and capitalizationThis chart displays the primary equity investment style(such as value or growth) the fund manager uses to selectsecurities as well as the ‘market capitalization’ of securitiesin the fund. Market capitalization is a term used to definethe total market value of a particular company’soutstanding shares. In the context of an investment fund,this term refers to the size of the companies whose stocksare held in the fund. This term only applies to funds withequity – or stock – holdings.
7
6
5
4
Volatility meter
Based on 3 year standard deviation of the Fund
Low (1) High (25)
7
BALANCED Code 5181
Manulife Trimark Income Growth Fund
Cash 10.30%
United States Equity 18.66%
International Equity 2.54%
Canadian Equity 45.52%
Bond 22.98%
How the underlying fund is invested
Top holdings within the underlying Fund(As at June 30, 2013)
Brookfield Asset Management 3.87%
Canadian Natural Resources 3.50%
Zimmer Holdings 3.30%
Manulife Financial 3.28%
TD Bank 3.05%
Power Corp of Canada 3.03%
EnCana Corp. 2.97%
Thomson Reuters 2.91%
Bank of Nova Scotia 2.80%
Fairfax Financial Holdings 2.78%
Primary investment processFundamental, Bottom−up
Equity style and capitalization
Source: Manulife Investment Management Services
Fixed income style
Source: Manulife Investment Management Services
Value Core/Blend Growth
Large
Medium
Small
All Cap
RateAnticipation
YieldEnhancement
SectorTrading
Note: All rates of return are shown before investment management fees or taxeshave been deducted.
The rate of return is used only to illustrate the effects of the compound growthrate and is not intended to reflect the future values or returns in the Fund.
UNDERLYING FUND −> Trimark Income Growth−SCObjective The Trimark Income Growth Fund seeks to generate capital growth andincome over the long term. The Fund invests primarily in Canadian equities, fixed−income securities of Canadian issuers, both government and corporate, and foreignequities and fixed−income securities.
Managed by Invesco Canada Ltd.
Fund managers Anthony Imbesi, CFA, BComm, Gary Lew, CFA, MBA, Alfred Samson,CFA, Alan Mannik, CFA, MBA, Clayton Zacharias, CFA, CA and Mark Uptigrove
Inception date September 1987Total assets $330.1 million
Historical gross returnsGross rates of return are shown before investment management fees have beendeducted. The solid area represents the gross returns of the Manulife Fund since itsinception in October 1997.
* Only full calendar year returns are shown.
Overall past performanceThis graph shows how a $10,000 investment in this fund would have changed in value over time, based on grossreturns.
* For illustration purposes only. Includes mutual/pooled fund performance as indicated. Actual fund performance couldbe expected to vary.
Annual compound returns (As at June 30, 2013)
This table shows the historical annual compound total return of the Fund compared withthe composite benchmark, as outlined in the Rate of return expectation below.
1−year 2−year 3−year 5−yearSince
inception
Manulifeinception
date
MLI Trimark Income Growth 14.92% 7.83% 10.11% 6.27% 7.17% Oct 1997
Blend: Trimark IncomeGrowth
8.26% 4.06% 7.17% 3.13% −
Rate of return expectation Over the long term, the Fund is expected to outperform a benchmark comprised of:
· 35% S&P/TSX Total Return Index· 35% DEX Universe Bond Index· 25% MSCI World Index · 5% DEX 91 Day T−bill Index
Source: The Globe and Mail Inc.
17
18
19
20
16
15
14
9
131211
10
123
4
5
6
7
8

13
Fixed Income StyleThis chart shows the different approaches a manager usesto select fixed income holdings within the portfolio.
Underlying fund Market-based investment options available to group plansare usually fund-on-fund investments which invest inexisting pooled funds or mutual funds. These are knownas the underlying funds. When a contribution is made to aManulife fund, it’s used to purchase units of thecorresponding underlying fund. For example, contributionsto the Manulife Trimark Income Growth Fund purchaseunits of the Trimark Income Growth Fund.
Each Manulife fund may hold a small cash component,and the underlying fund may do the same. A fund-on-fund strategy seeks to produce similar returns to theunderlying fund within the Manulife fund.
Objective The fund’s primary investment goal(s) as determined bythe fund manager.
Managed by This names the investment management firm whooversees the fund.
Fund managers The name of the lead fund manager(s) accountable forinvestment decisions in the underlying fund.
Inception date The date the underlying fund was first available forpurchase.
Total assets The total market value of all assets invested in theunderlying fund on a specific date.
Historical gross returns The performance of the fund over a specified period.Performance histories are shown for illustrative purposes;they are not a guarantee of future performance. Unitvalues fluctuate with the market value of the underlyingfund’s assets. Gross rates of return mean the investmentperformance of the fund before investment managementfees (IMFs) and taxes are deducted (Goods and ServicesTax/Harmonized Sales Tax).
15
14
9
8
13
12
11
10
An individual who invests in the fund earns a net returnafter fees. Management fees vary by firm and by plan.Returns shown here represent results for the Manulifefund and/or its underlying fund.
Year by year returns This shows the one-year return of the fund during eachyear illustrated in the accompanying graph.
Overall past performance This graph shows how a $10,000 investment in the fundchanged in value over a specified period, and the value ofthat investment at the end of the period. It also comparesthe value of that investment with the value of the sameinvestment in a related, broadly-based index.
Annual compound returns Returns for a specified period expressed as an annualizedrate.
Manulife inception date The first full month the fund was available to ManulifeGroup Retirement Solutions plans.
Rate of return expectation The benchmark whose performance the fund managerexpects to meet or exceed over the long term. Investmentsheld in this benchmark are indicative of the investmentsheld in the fund.
16
17
20
19
18

14
Asset Allocation
Asset Allocation funds are portfolios of underlying funds diversified by fund manager, asset class and investor style. Asset
Allocation funds are designed to make investing convenient. They provide fund participants with a balance of capital growth
and preservation consistent with five investor styles ranging from conservative to aggressive. Asset Allocation funds diversify by
investing in a number of underlying funds so plan members do not need to manage these portfolios.
Manulife offers five actively managed Asset Allocation funds. The actively managed funds strive to out-perform a variety of
benchmark index composites.
The funds are re-balanced periodically to maintain their respective long-term target asset mixes which ensures each fund’s
underlying composition fulfills its objectives.
FUND PAGE
CODE NUMBER
Actively Managed
Manulife Conservative Asset Allocation Fund 2001 15
Manulife Moderate Asset Allocation Fund 2002 16
Manulife Balanced Asset Allocation Fund 2003 17
Manulife Growth Asset Allocation Fund 2004 18
Manulife Aggressive Asset Allocation Fund 2005 19

Volatility meter
Based on 3 year standard deviation of the Fund
Low (1) High (25)
2
ASSET ALLOCATION Code 2001
Manulife Conservative Asset Allocation Fund
Fixed Income 68.00%
Canadian Equity 12.00%
International Equity 4.20%
Mortgage 12.00%
U.S. Equity 3.80%
How the fund is invested
Top Target Allocation of the FundMLI Cdn Bond (MAM) 20.00%MLI Fixed Income Plus (AB) 16.00%MLI Cdn Universe Bond (CIBC) 12.00%MLI Mortgage Backed Fund (MAM) 12.00%MAM Cdn Bond Index Pooled Fund 10.00%MAM Strategic Income Pooled 10.00%MLI Canadian Equity Value (SR) 3.20%MLI Cdn Large Cap Value Eq (MAM) 3.20%MLI Canadian Equity (Greystone ) 2.30%MLI Pure Canadian Equity Grw (MAM) 2.30%MLI U.S. Div Grwth Eq (Wellington) 1.70%MLI U.S. Large Cap Val (T. Rowe) 1.70%MAM EAFE Equity Index Pooled 1.20%MAM Canadian Equity Index Pooled 1.00%MLI Emerging Market Value (DFA) 1.00%MLI World Investment (Mawer) 1.00%MLI International Eq (Templeton) 1.00%MAM US Equity Index Pooled Fund 0.40%
Primary investment processMulti−manager
Equity style and capitalization
Source: Manulife Investment Management Services
Fixed income style
Source: Manulife Investment Management Services
Value Core/Blend Growth
Large
Medium
Small
All Cap
RateAnticipation
YieldEnhancement
SectorTrading
Note: All rates of return are shown before investment management fees or taxeshave been deducted.
The rate of return is used only to illustrate the effects of the compound growthrate and is not intended to reflect the future values or returns in the Fund.
Objective The Manulife Conservative Asset Allocation Fund is managed to provide ahigh level of current income and capital preservation with some consideration given togrowth of capital. This fund is diversified by asset class and investment styles with theobjective of achieving superior risk−adjusted returns over the long term. The Fund willgenerally maintain 80% of its investments in fixed income funds and 20% in equityfunds, though each segment may vary up to 10% from time to time.
Managed by Manulife Financial
Fund managers Various (please refer to Top Target Allocation of the Fund on this page)
Inception date February 1999 Total assets $511.2 million
Historical gross returnsGross rates of return are shown before investment management fees have beendeducted. The solid area represents the gross returns of the Manulife Fund since itsinception in February 1999.
* Only full calendar year returns are shown.
Overall past performanceThis graph shows how a $10,000 investment in this fund would have changed in value over time, based on grossreturns.
* For illustration purposes only. Includes mutual/pooled fund performance as indicated. Actual fund performance couldbe expected to vary.
Annual compound returns (As at June 30, 2013)
This table shows the historical annual compound total return of the Fund compared withthe composite benchmark, as outlined in the Rate of return expectation below.
1−year 2−year 3−year 5−yearSince
inception
Manulifeinception
date
MLI Conservative AssetAllocation
4.51% 4.85% 5.59% 4.89% 5.45% Feb 1999
Blend: MLI ConservativeAsset Allocation
2.76% 3.96% 5.00% 4.25% −
Rate of return expectation Over the long term, the Fund attempts to outperform a benchmark portfolio that is comprised of thefollowing:
· 65% DEX Universe Bond Total Return Index· 15% DEX 91−Day T−bill Total Return Index· 12% S&P/TSX Total Return Index· 4% S&P 500 Total Return Index ($Cdn)· 4% MSCI EAFE Total Return Index ($Cdn)
Effective May 1, 2010, assets in this fund reflect GRS assets exclusively. Performance data for periodsbeginning after May 1, 2010 will reflect detail strictly for the GRS fund. Data for periods that beganprior to May 1 will continue to reflect detail for the combined fund.
Source: The Globe and Mail Inc.
15

Volatility meter
Based on 3 year standard deviation of the Fund
Low (1) High (25)
4
ASSET ALLOCATION Code 2002
Manulife Moderate Asset Allocation Fund
International Equity 8.60%
Real Estate 2.00%
U.S. Equity 7.50%
Mortgage 10.00%
Fixed Income 50.00%
Canadian Equity 21.90%
How the fund is invested
Top Target Allocation of the FundMLI Cdn Bond (MAM) 18.30%MAM Strategic Income Pooled 10.00%MLI Mortgage Backed Fund (MAM) 10.00%MLI Fixed Income Plus (AB) 9.40%MLI Cdn Universe Bond (CIBC) 8.40%MLI Canadian Equity Value (SR) 5.50%MLI Cdn Large Cap Value Eq (MAM) 5.50%MLI Canadian Equity (Greystone ) 4.20%MLI Pure Canadian Equity Grw (MAM) 4.20%MAM Cdn Bond Index Pooled Fund 3.90%MLI International Eq (Templeton) 2.60%MLI World Investment (Mawer) 2.60%MLI U.S. Large Cap Val (T. Rowe) 2.60%MLI U.S. Div Grwth Eq (Wellington) 2.60%MAM US Equity Index Pooled Fund 2.30%MLI Canadian Real Estate Investment 2.00%MLI Emerging Market Value (DFA) 2.00%MAM Canadian Equity Index Pooled 1.50%MAM EAFE Equity Index Pooled 1.40%MLI Canadian Small Cap Value (FGP) 0.50%
Primary investment processMulti−manager
Equity style and capitalization
Source: Manulife Investment Management Services
Fixed income style
Source: Manulife Investment Management Services
Value Core/Blend Growth
Large
Medium
Small
All Cap
RateAnticipation
YieldEnhancement
SectorTrading
Note: All rates of return are shown before investment management fees or taxeshave been deducted.
The rate of return is used only to illustrate the effects of the compound growthrate and is not intended to reflect the future values or returns in the Fund.
Objective The Manulife Moderate Asset Allocation Fund is managed to provide abalance between current income and growth of capital with a greater emphasis onincome and capital preservation. This fund is diversified by asset class and investmentstyles with the objective of achieving superior risk−adjusted returns over the long term.The Fund will generally maintain 60% of its investments in fixed income funds and 40%in equity funds, though each segment may vary up to 10% from time to time.
Managed by Manulife Financial
Fund managers Various (please refer to Top Target Allocation of the Fund on this page)
Inception date February 1999 Total assets $466.2 million
Historical gross returnsGross rates of return are shown before investment management fees have beendeducted. The solid area represents the gross returns of the Manulife Fund since itsinception in February 1999.
* Only full calendar year returns are shown.
Overall past performanceThis graph shows how a $10,000 investment in this fund would have changed in value over time, based on grossreturns.
* For illustration purposes only. Includes mutual/pooled fund performance as indicated. Actual fund performance couldbe expected to vary.
Annual compound returns (As at June 30, 2013)
This table shows the historical annual compound total return of the Fund compared withthe composite benchmark, as outlined in the Rate of return expectation below.
1−year 2−year 3−year 5−yearSince
inception
Manulifeinception
date
MLI Moderate AssetAllocation
7.64% 5.06% 6.69% 4.55% 5.60% Feb 1999
Blend: MLI Moderate AssetAllocation
5.42% 4.41% 6.49% 4.24% −
Rate of return expectation Over the long term, the Fund attempts to outperform a benchmark portfolio that is comprised of thefollowing:
· 60% DEX Universe Bond Total Return Index· 24% S&P/TSX Total Return Index· 8% S&P 500 Total Return Index ($ Cdn)· 8% MSCI EAFE Total Return Index ($ Cdn)
Effective May 1, 2010, assets in this fund reflect GRS assets exclusively. Performance data for periodsbeginning after May 1, 2010 will reflect detail strictly for the GRS fund. Data for periods that beganprior to May 1 will continue to reflect detail for the combined fund.
Source: The Globe and Mail Inc.
16

Volatility meter
Based on 3 year standard deviation of the Fund
Low (1) High (25)
6
ASSET ALLOCATION Code 2003
Manulife Balanced Asset Allocation Fund
U.S. Equity 11.40%
International Equity 12.50%
Mortgage 6.00%
Real Estate 3.50%
Fixed Income 34.00%
Canadian Equity 32.60%
How the fund is invested
Top Target Allocation of the FundMLI Cdn Bond (MAM) 10.50%MAM Strategic Income Pooled 10.00%MLI Canadian Equity Value (SR) 7.50%MLI Cdn Large Cap Value Eq (MAM) 7.50%MLI Canadian Equity (Greystone ) 6.20%MLI Pure Canadian Equity Grw (MAM) 6.20%MLI Mortgage Backed Fund (MAM) 6.00%MLI Fixed Income Plus (AB) 5.50%MLI Cdn Universe Bond (CIBC) 5.00%MLI U.S. Div Grwth Eq (Wellington) 4.20%MLI U.S. Large Cap Val (T. Rowe) 4.20%MLI International Eq (Templeton) 3.80%MLI World Investment (Mawer) 3.80%MLI Canadian Real Estate Investment 3.50%MAM Cdn Bond Index Pooled Fund 3.00%MAM US Equity Index Pooled Fund 3.00%MLI Emerging Market Value (DFA) 3.00%MAM Canadian Equity Index Pooled 2.00%MAM EAFE Equity Index Pooled 1.90%MLI Canadian Small Cap Value (FGP) 1.60%
Primary investment processMulti−manager
Equity style and capitalization
Source: Manulife Investment Management Services
Fixed income style
Source: Manulife Investment Management Services
Value Core/Blend Growth
Large
Medium
Small
All Cap
RateAnticipation
YieldEnhancement
SectorTrading
Note: All rates of return are shown before investment management fees or taxeshave been deducted.
The rate of return is used only to illustrate the effects of the compound growthrate and is not intended to reflect the future values or returns in the Fund.
Objective The Manulife Balanced Asset Allocation Fund is managed to provide abalance between growth of capital and current income with a greater emphasis ongrowth of capital. This fund is diversified by asset class and investment styles with theobjective of achieving superior risk−adjusted returns over the long term. The Fund willgenerally maintain 60% of its investments in equity funds and 40% in fixed incomefunds, though each segment may vary up to 10% from time to time.
Managed by Manulife Financial
Fund managers Various (please refer to Top Target Allocation of the Fund on this page)
Inception date February 1999 Total assets $2,391.5 million
Historical gross returnsGross rates of return are shown before investment management fees have beendeducted. The solid area represents the gross returns of the Manulife Fund since itsinception in February 1999.
* Only full calendar year returns are shown.
Overall past performanceThis graph shows how a $10,000 investment in this fund would have changed in value over time, based on grossreturns.
* For illustration purposes only. Includes mutual/pooled fund performance as indicated. Actual fund performance couldbe expected to vary.
Annual compound returns (As at June 30, 2013)
This table shows the historical annual compound total return of the Fund compared withthe composite benchmark, as outlined in the Rate of return expectation below.
1−year 2−year 3−year 5−yearSince
inception
Manulifeinception
date
MLI Balanced AssetAllocation
10.79% 5.16% 8.25% 4.60% 6.06% Feb 1999
Blend: MLI Balanced AssetAllocation
8.31% 4.25% 7.37% 3.46% −
Rate of return expectation Over the long term, the Fund attempts to outperform a benchmark portfolio that is comprised of thefollowing:
· 40% DEX Universe Bond Total Return Index· 36% S&P/TSX Total Return Index· 12% S&P 500 Total Return Index ($ Cdn)· 12% MSCI EAFE Total Return Index ($ Cdn)
Effective May 1, 2010, assets in this fund reflect GRS assets exclusively. Performance data for periodsbeginning after May 1, 2010 will reflect detail strictly for the GRS fund. Data for periods that beganprior to May 1 will continue to reflect detail for the combined fund.
Source: The Globe and Mail Inc.
17

Volatility meter
Based on 3 year standard deviation of the Fund
Low (1) High (25)
8
ASSET ALLOCATION Code 2004
Manulife Growth Asset Allocation Fund
U.S. Equity 15.00%
Mortgage 3.00%
Real Estate 3.50%
International Equity 17.00%
Fixed Income 17.10%
Canadian Equity 44.40%
How the fund is invested
Top Target Allocation of the FundMAM Strategic Income Pooled 10.00%MLI Canadian Equity Value (SR) 9.60%MLI Cdn Large Cap Value Eq (MAM) 9.60%MLI Canadian Equity (Greystone ) 8.30%MLI Pure Canadian Equity Grw (MAM) 8.30%MLI U.S. Div Grwth Eq (Wellington) 6.10%MLI U.S. Large Cap Val (T. Rowe) 6.10%MLI International Eq (Templeton) 5.30%MLI World Investment (Mawer) 5.30%MLI Emerging Market Value (DFA) 4.00%MLI Canadian Real Estate Investment 3.50%MLI Canadian Small Cap Value (FGP) 3.00%MLI Cdn Bond (MAM) 3.00%MLI Cdn Growth Opportunities (MAM) 3.00%MLI Mortgage Backed Fund (MAM) 3.00%MAM US Equity Index Pooled Fund 2.80%MAM Canadian Equity Index Pooled 2.60%MAM EAFE Equity Index Pooled 2.40%MLI Fixed Income Plus (AB) 1.60%MLI Cdn Universe Bond (CIBC) 1.40%
Primary investment processMulti−manager
Equity style and capitalization
Source: Manulife Investment Management Services
Fixed income style
Source: Manulife Investment Management Services
Value Core/Blend Growth
Large
Medium
Small
All Cap
RateAnticipation
YieldEnhancement
SectorTrading
Note: All rates of return are shown before investment management fees or taxeshave been deducted.
The rate of return is used only to illustrate the effects of the compound growthrate and is not intended to reflect the future values or returns in the Fund.
Objective The Manulife Growth Asset Allocation Fund is managed to provide long−term growth of capital with some consideration given to current income. This fund isdiversified by asset class and investment styles with the objective of achieving superiorrisk−adjusted returns over the long term. The Fund will generally maintain 80% of itsinvestments in equity funds and 20% in fixed income funds though each segment mayvary up to 10% from time to time.
Managed by Manulife Financial
Fund managers Various (please refer to Top Target Allocation of the Fund on this page)
Inception date February 1999 Total assets $978.3 million
Historical gross returnsGross rates of return are shown before investment management fees have beendeducted. The solid area represents the gross returns of the Manulife Fund since itsinception in February 1999.
* Only full calendar year returns are shown.
Overall past performanceThis graph shows how a $10,000 investment in this fund would have changed in value over time, based on grossreturns.
* For illustration purposes only. Includes mutual/pooled fund performance as indicated. Actual fund performance couldbe expected to vary.
Annual compound returns (As at June 30, 2013)
This table shows the historical annual compound total return of the Fund compared withthe composite benchmark, as outlined in the Rate of return expectation below.
1−year 2−year 3−year 5−yearSince
inception
Manulifeinception
date
MLI Growth AssetAllocation
13.89% 4.92% 8.70% 3.28% 6.23% Feb 1999
Blend: MLI Growth AssetAllocation
11.23% 4.03% 8.20% 2.60% −
Rate of return expectation Over the long term, the Fund attempts to outperform a benchmark portfolio that is comprised of thefollowing:
· 48% S&P/TSX Total Return Index· 20% DEX Universe Bond Total Return Index· 16% S&P 500 Total Return Index ($ Cdn)· 16% MSCI EAFE Total Return Index ($ Cdn)
Effective May 1, 2010, assets in this fund reflect GRS assets exclusively. Performance data for periodsbeginning after May 1, 2010 will reflect detail strictly for the GRS fund. Data for periods that beganprior to May 1 will continue to reflect detail for the combined fund.
Source: The Globe and Mail Inc.
18

Volatility meter
Based on 3 year standard deviation of the Fund
Low (1) High (25)
11
ASSET ALLOCATION Code 2005
Manulife Aggressive Asset Allocation Fund
Canadian Equity 54.90%
U.S. Equity 18.50%
Real Estate 5.00%
International Equity 21.60%
How the fund is invested
Top Target Allocation of the FundMLI Canadian Equity Value (SR) 11.70%MLI Cdn Large Cap Value Eq (MAM) 11.70%MLI Canadian Equity (Greystone ) 9.70%MLI Pure Canadian Equity Grw (MAM) 9.70%MLI U.S. Div Grwth Eq (Wellington) 7.80%MLI U.S. Large Cap Val (T. Rowe) 7.70%MLI International Eq (Templeton) 6.70%MLI World Investment (Mawer) 6.70%MLI Canadian Real Estate Investment 5.00%MLI Emerging Market Value (DFA) 5.00%MLI Canadian Small Cap Value (FGP) 4.50%MLI Cdn Growth Opportunities (MAM) 4.50%MAM EAFE Equity Index Pooled 3.20%MAM Canadian Equity Index Pooled 3.10%MAM US Equity Index Pooled Fund 3.00%
Primary investment processMulti−manager
Equity style and capitalization
Source: Manulife Investment Management Services
Value Core/Blend Growth
Large
Medium
Small
All Cap
Note: All rates of return are shown before investment management fees or taxeshave been deducted.
The rate of return is used only to illustrate the effects of the compound growthrate and is not intended to reflect the future values or returns in the Fund.
Objective The Manulife Aggressive Asset Allocation Fund is managed to provide long−term growth of capital with no consideration given to current income. This fund isdiversified by asset class and investment styles with the objective of achieving superiorrisk−adjusted returns over the long term. This fund will generally maintain 100% of itsinvestments in equity funds though each segment may vary up to 10% from time to time.
Managed by Manulife Financial
Fund managers Various (please refer to Top Target Allocation of the Fund on this page)
Inception date February 1999 Total assets $507.3 million
Historical gross returnsGross rates of return are shown before investment management fees have beendeducted. The solid area represents the gross returns of the Manulife Fund since itsinception in February 1999.
* Only full calendar year returns are shown.
Overall past performanceThis graph shows how a $10,000 investment in this fund would have changed in value over time, based on grossreturns.
* For illustration purposes only. Includes mutual/pooled fund performance as indicated. Actual fund performance couldbe expected to vary.
Annual compound returns (As at June 30, 2013)
This table shows the historical annual compound total return of the Fund compared withthe composite benchmark, as outlined in the Rate of return expectation below.
1−year 2−year 3−year 5−yearSince
inception
Manulifeinception
date
MLI Aggressive AssetAllocation
16.41% 4.48% 9.75% 2.57% 6.61% Feb 1999
Blend: MLI Aggressive AssetAllocation
14.20% 3.74% 8.99% 1.65% −
Rate of return expectation Over the long term, the Fund attempts to outperform a benchmark portfolio that is comprised of thefollowing:
· 60% S&P/TSX Total Return Index· 20% S&P 500 Total Return Index ($ Cdn)· 20% MSCI EAFE Total Return Index ($ Cdn)
Effective May 1, 2010, assets in this fund reflect GRS assets exclusively. Performance data for periodsbeginning after May 1, 2010 will reflect detail strictly for the GRS fund. Data for periods that beganprior to May 1 will continue to reflect detail for the combined fund.
Source: The Globe and Mail Inc.
Code 2004
19

20
Guaranteed Interest Accountsand Money Market
Guaranteed Interest Accounts (GIAs)
Similar to Guaranteed Investment Certificates (GICs) offered by banks and trust companies, these accounts guarantee an
interest rate from the date of contribution until maturity. At maturity, original investments and interest earned will reinvest for
the same term unless you provide Manulife with different instructions.
When contributions are invested in these accounts, they earn the current interest rate at the time of the deposit. That interest
is credited to the account monthly and is compounded annually. Each contribution made to a GIA accumulates for the term
selected at the guaranteed rate in effect on the date Manulife’s head office receives the contribution. The GIA operates on a
compound interest basis which means the guaranteed interest rate applies to both principal and accumulated interest.
Manulife offers GIAs for these terms: daily interest, 1-year, 2-year, 3-year, 4-year, 5-year and 10-year.
Money Market Funds
Money Market funds invest in high-quality, short-term fixed income securities. By investing in fixed income securities, these
funds are essentially making a short-term loan to a government or corporation and earning interest on its principal. Money
Market funds are typically managed to maintain liquidity, protect the initial investment and provide a moderate level of income.
These funds are ideal for investors who want to preserve capital, who are saving for the short term or who want to maintain a
cash reserve and are comfortable only with the very lowest levels of volatility.
FUND PAGE
CODE NUMBER
Guaranteed Interest Accounts andMoney Market Funds
Manulife Daily Interest Account 1000 21
Manulife Guaranteed Interest Accounts 1001, 1002, 1003, 1004, 1005, 1010 21
Manulife Canadian Money Market Fund (MAM) 3132 22
Manulife Daily High Interest Fund 3191 23

21
HOW THE DAILY INTEREST ACCOUNT WORKS
Similar to a daily interest account at a bank or trust company, this account earns interestdaily at the current rate for that account. While Manulife always guarantees the principaland interest, the interest rate may change at any time.
Contributions begin earning interest when received by Manulife Financial's head office.As Manulife Financial receives contributions, those funds begin to earn interest at a ratesimilar to a bank savings account.
HOW THE DAILY INTEREST ACCOUNT IS PROTECTED
Manulife Financial is a member of Assuris. With Assuris, consumers may be entitled toprotection against the loss of their savings and retirement incomes if a member financialinstitution becomes insolvent. You can call Assuris at 1-866-878-1225 for details aboutmaximum coverage guarantees.
Volatility and risk
This account is backed by the general assets of ManulifeFinancial. It has the lowest risk and lowest volatility, butearns the lowest rate of interest over the long term.Consider this account as a short-term holding accountwhile you decide on your long-term investment strategy.Once you have determined your investment strategy, youcan transfer your funds at any time.
Manulife Daily Interest Accounts
Code 1000GUARANTEED INTEREST ACCOUNTSVOLATILITY METER
WHAT THESE ACCOUNTS OFFER
• Guaranteed returns when held to maturity • Principal and interest backed by the assets of Manulife Financial• Choice of 1, 2, 3, 4, 5 and 10-year terms
Investment codes respectively (1001, 1002, 1003, 1004, 1005, 1010)
HOW THE GUARANTEED INTEREST ACCOUNT IS PROTECTED
Manulife Financial is a member of Assuris. With Assuris, consumers may be entitled toprotection against the loss of their savings and retirement incomes if a member financialinstitution becomes insolvent. You can call Assuris at 1-866-878-1225 for details aboutmaximum coverage guarantees.
Volatility and risk
These accounts offer good returns and excellent investmentsecurity. Consider these accounts if you are an investor whoneeds guaranteed security for your investment and cancommit to investments for a fixed period of time. There isno volatility associated with the return in this account andthere is minimal risk as this is a guaranteed investmentbacked by the general assets of Manulife Financial.
Manulife Guaranteed Interest Accounts
Codes 1001, 1002, 1003, 1004, 1005, 1010GUARANTEED INTEREST ACCOUNTSVOLATILITY METER
Sources : Manulife Financial

Volatility meter
Based on 3 year standard deviation of the Fund
Low (1) High (25)
0
MONEY MARKET Code 3132
Manulife Canadian Money Market Fund (MAM)
Cash 85.39%
Other 0.11%
Bond 14.50%
How the underlying fund is invested
Top holdings within the underlying Fund(As at June 30, 2013)
Gov’t of Canada, January 2014 13.59%
Gov’t of Canada, May 2014 8.71%
Gov’t of Canada, February 2014 6.57%
CIBC, 2.15%, January 2015 6.31%
Gov’t of Canada, April 2014 6.23%
Bank of Nova Scotia, September 2013 3.77%
Royal Bank of Canada, 1.42%, September 2013 3.77%
Bank of Montreal, October 2013 3.77%
Gov’t of Canada, 0.00%, June 2014 3.73%
Province of Ontario, April 2014 3.36%
Fixed income style
Source: Manulife Investment Management Services
RateAnticipation
YieldEnhancement
SectorTrading
Note: All rates of return are shown before investment management fees or taxeshave been deducted.
The rate of return is used only to illustrate the effects of the compound growthrate and is not intended to reflect the future values or returns in the Fund.
UNDERLYING FUND −> MLI Cdn Money Market (MAM)Objective The Manulife Canadian Money Market Fund is managed to achieve aconsistent level of interest income while attempting to preserve capital and maintainingliquidity. This fund invests primarily in money market securities guaranteed by theGovernment of Canada, its provinces or municipalities, corporations and chartered banks.
Managed by Manulife Asset Management Limited
Fund managers Faisal Rahman, CFA and Maralyn Kobayashi
Inception date January 1999Total assets $793.5 million
Historical gross returnsGross rates of return are shown before investment management fees have beendeducted. The solid area represents the gross returns of the Manulife Fund since itsinception in July 2002.
* Only full calendar year returns are shown.
Overall past performanceThis graph shows how a $10,000 investment in this fund would have changed in value over time, based on grossreturns.
* For illustration purposes only. Includes mutual/pooled fund performance as indicated. Actual fund performance couldbe expected to vary.
Annual compound returns (As at June 30, 2013)
This table shows the historical annual compound total return of the Fund compared withthe DEX 91 Day Treasury Bill Index.
1−year 2−year 3−year 5−yearSince
inception
Manulifeinception
date
MLI Canadian MoneyMarket (MAM)
1.31% 1.33% 1.32% 1.45% 2.52% Jul 2002
DEX 91 Day Treasury BillIndex
1.00% 0.98% 0.95% 1.03% −
Rate of return expectation The Fund is expected to outperform the DEX 91 Day T−Bills.
Source: The Globe and Mail Inc.22
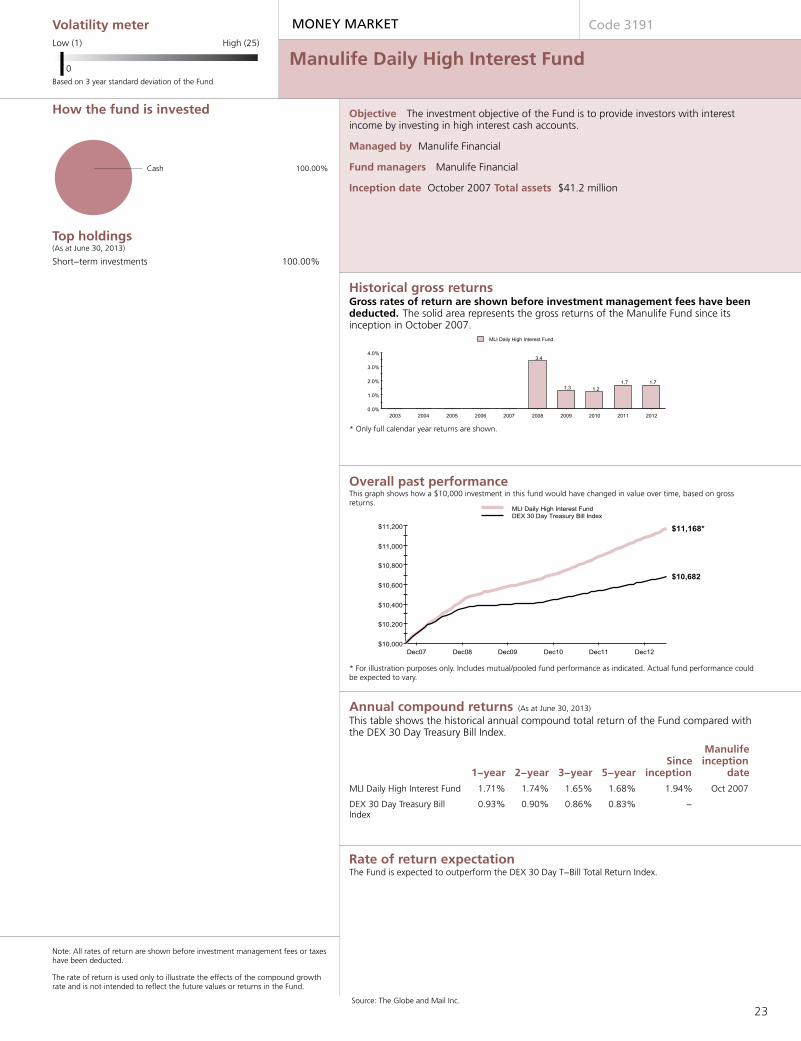
Volatility meter
Based on 3 year standard deviation of the Fund
Low (1) High (25)
0
MONEY MARKET Code 3191
Manulife Daily High Interest Fund
Cash 100.00%
How the fund is invested
Top holdings(As at June 30, 2013)
Short−term investments 100.00%
Note: All rates of return are shown before investment management fees or taxeshave been deducted.
The rate of return is used only to illustrate the effects of the compound growthrate and is not intended to reflect the future values or returns in the Fund.
Objective The investment objective of the Fund is to provide investors with interestincome by investing in high interest cash accounts.
Managed by Manulife Financial
Fund managers Manulife Financial
Inception date October 2007Total assets $41.2 million
Historical gross returnsGross rates of return are shown before investment management fees have beendeducted. The solid area represents the gross returns of the Manulife Fund since itsinception in October 2007.
* Only full calendar year returns are shown.
Overall past performanceThis graph shows how a $10,000 investment in this fund would have changed in value over time, based on grossreturns.
* For illustration purposes only. Includes mutual/pooled fund performance as indicated. Actual fund performance couldbe expected to vary.
Annual compound returns (As at June 30, 2013)
This table shows the historical annual compound total return of the Fund compared withthe DEX 30 Day Treasury Bill Index.
1−year 2−year 3−year 5−yearSince
inception
Manulifeinception
date
MLI Daily High Interest Fund 1.71% 1.74% 1.65% 1.68% 1.94% Oct 2007
DEX 30 Day Treasury BillIndex
0.93% 0.90% 0.86% 0.83% −
Rate of return expectation The Fund is expected to outperform the DEX 30 Day T−Bill Total Return Index.
Source: The Globe and Mail Inc.
23

24
Fixed Income
Fixed Income funds invest in debt securities issued by corporations, as well as federal, provincial and municipal governments. By
investing in bonds, the fund earns a specified amount of interest based on the coupon rate (interest rate) on the bonds. These
funds are exposed to risks relating to the issuers’ ability to repay the debt at maturity plus changes in interest rates.
Fixed Income funds are appropriate for investors who have less tolerance for volatility and would like to emphasize preservation of
capital.
FUND PAGE
CODE NUMBER
Yield Enhancement
Manulife Fidelity Canadian Bond Fund 4141 25
Manulife MFS McLean Budden Fixed Income Fund 4161 26
Manulife MFS McLean Budden Long-Term Fixed Income Fund 4162 27
Manulife Fixed Income Plus Fund (AllianceBernstein) 4192 28
Manulife PH&N Bond Fund 4271 29
Sector Trading
Manulife Canadian Bond Fund (MAM) 4131 30
Index
Manulife Asset Management Canadian Bond Index Fund 4191 31
24

Volatility meter
Based on 3 year standard deviation of the Fund
Low (1) High (25)
3
FIXED INCOME Code 4141
Manulife Fidelity Canadian Bond Fund
Other 4.84%
Federal Bonds 20.29%
Municipal Bonds 3.34%
Corporate Debentures 49.72%
Provincial Bonds 21.81%
How the underlying fund is invested
Top holdings within the underlying Fund(As at June 30, 2013)
Gov’t of Canada, 4.00%, June 2041 4.15%
Province of Ontario, 2.85%, June 2023 3.26%
Canada Housing Trust, 2.05%, June 2017 2.32%
Province of Quebec, 5.00%, December 2041 1.96%
Gov’t of Canada, 3.75%, June 2019 1.77%
Province of Ontario, 4.20%, June 2020 1.72%
Canada Housing Trust, 2.65%, March 2022 1.69%
Gov’t of Canada, 1.00%, August 2016 1.56%
Gov’t of Canada, 1.50%, September 2017 1.55%
Canada Housing Trust, 2.35%, September 2023 1.51%
Fixed income style
Source: Manulife Investment Management Services
RateAnticipation
YieldEnhancement
SectorTrading
Note: All rates of return are shown before investment management fees or taxeshave been deducted.
The rate of return is used only to illustrate the effects of the compound growthrate and is not intended to reflect the future values or returns in the Fund.
UNDERLYING FUND −> Fidelity Canadian Bond−AObjective The Fidelity Canadian Bond Fund aims to provide a steady flow of income. Itinvests primarily in Canadian fixed income securities.
Managed by Fidelity Investments Canada ULC
Fund managers Brian Miron, BCom, CFA and Catriona Martin, CFA
Inception date February 1988Total assets $269.1 million
Historical gross returnsGross rates of return are shown before investment management fees have beendeducted. The solid area represents the gross returns of the Manulife Fund since itsinception in July 1997.
* Only full calendar year returns are shown.
Overall past performanceThis graph shows how a $10,000 investment in this fund would have changed in value over time, based on grossreturns.
* For illustration purposes only. Includes mutual/pooled fund performance as indicated. Actual fund performance couldbe expected to vary.
Annual compound returns (As at June 30, 2013)
This table shows the historical annual compound total return of the Fund compared withthe DEX Universe Bond Total Return Index.
1−year 2−year 3−year 5−yearSince
inception
Manulifeinception
date
MLI Fidelity Canadian Bond 0.39% 5.03% 5.05% 6.18% 6.46% Jul 1997
DEX Universe Bond TotalReturn Index
−0.17% 4.55% 4.59% 5.53% −
Rate of return expectation The Fund seeks to achieve returns comparable to, or better than, the DEX Universe Bond Total ReturnIndex.
Source: The Globe and Mail Inc.
25

Volatility meter
Based on 3 year standard deviation of the Fund
Low (1) High (25)
3
FIXED INCOME Code 4161
Manulife MFS McLean Budden Fixed Income Fund
Municipal Bonds 0.74%
Provincial Bonds 25.57%
Other 1.84%
Corporate Debentures 39.58%
Federal Bonds 32.27%
How the underlying fund is invested
Top holdings within the underlying Fund(As at June 30, 2013)
Canada Housing Trust, 2.45%, December 2015 5.76%Gov’t of Canada, 3.25%, June 2021 5.02%Gov’t of Canada, 3.00%, December 2015 4.34%Gov’t of Canada, 1.50%, June 2023 3.93%Province of Ontario, 4.70%, June 2037 3.69%Gov’t of Canada, 1.50%, September 2017 3.58%Province of Ontario, 5.60%, June 2035 3.41%Province of Ontario, 4.40%, March 2016 2.96%Canada Housing Trust, 3.75%, March 2020 2.71%Province of Quebec, 5.00%, December 2038 2.32%Gov’t of Canada, 3.50%, December 2045 2.30%Province of British Columbia, 4.95%, June 2040 2.24%Province of Ontario, 3.15%, June 2022 1.90%Canada Housing Trust, 2.40%, December 2022 1.81%Province of Ontario, 4.20%, March 2018 1.78%
Fixed income style
Source: Manulife Investment Management Services
RateAnticipation
YieldEnhancement
SectorTrading
Note: All rates of return are shown before investment management fees or taxeshave been deducted.
The rate of return is used only to illustrate the effects of the compound growthrate and is not intended to reflect the future values or returns in the Fund.
UNDERLYING FUND −> MFS MB Fixed IncomeObjective The Fund is managed to provide a moderate real rate of return, throughincome and capital gains, by investing in a diversified portfolio of primarily Canadiandollar debt and from time−to−time U.S. debt. The Fund will only invest in investmentgrade debt. Returns in excess of income will be gained through active duration, yieldcurve and sector management.
Managed by MFS McLean Budden Limited
Fund managers Paul Marcogliese, B.Math, CFA and Peter Kotsopoulos, BA, CFA
Inception date January 1981Total assets $2,437.3 million
Historical gross returnsGross rates of return are shown before investment management fees have beendeducted. The solid area represents the gross returns of the Manulife Fund since itsinception in July 1997.
* Only full calendar year returns are shown.
Overall past performanceThis graph shows how a $10,000 investment in this fund would have changed in value over time, based on grossreturns.
* For illustration purposes only. Includes mutual/pooled fund performance as indicated. Actual fund performance couldbe expected to vary.
Annual compound returns (As at June 30, 2013)
This table shows the historical annual compound total return of the Fund compared withthe DEX Universe Bond Total Return Index.
1−year 2−year 3−year 5−yearSince
inception
Manulifeinception
date
MLI MFS MB Fixed Income 0.90% 4.81% 4.68% 5.89% 6.22% Jul 1997
DEX Universe Bond TotalReturn Index
−0.17% 4.55% 4.59% 5.53% −
Rate of return expectation The Fund strives to outperform the DEX Universe Bond Index over a moving four−year period.
Source: The Globe and Mail Inc.
26

Code 4161 Volatility meter
Based on 3 year standard deviation of the Fund
Low (1) High (25)
6
FIXED INCOME Code 4162
Manulife MFS McLean Budden Long Term FixedIncome
Other 1.45%
Federal Bonds 17.99%
Municipal Bonds 2.40%
Corporate Debentures 39.84%
Provincial Bonds 38.32%
How the underlying fund is invested
Top holdings within the underlying Fund(As at June 30, 2013)
Gov’t of Canada, 3.50%, December 2045 5.96%Province of Quebec, 5.00%, December 2038 4.98%Province of Manitoba, 5.70%, March 2037 4.73%Province of Ontario, 4.70%, June 2037 4.30%Province of Ontario, 5.60%, June 2035 3.92%Province of British Columbia, 4.95%, June 2040 3.92%Gov’t of Canada, 5.75%, June 2033 3.78%Province of Ontario, 3.45%, June 2045 3.51%Province of Ontario, 6.50%, March 2029 3.27%Gov’t of Canada, 0.00%, June 2033 2.82%General Electric Capital Can., 5.73%, October 2037 2.80%Canada Housing Trust, 3.75%, March 2020 2.64%Province of Quebec, 4.25%, December 2043 2.49%TransCanada Pipelines, 8.05%, February 2039 2.34%Royal Bank of Canada, 4.93%, July 2025 2.33%
Fixed income style
Source: Manulife Investment Management Services
RateAnticipation
YieldEnhancement
SectorTrading
Note: All rates of return are shown before investment management fees or taxeshave been deducted.
The rate of return is used only to illustrate the effects of the compound growthrate and is not intended to reflect the future values or returns in the Fund.
UNDERLYING FUND −> MFS MB Long Term Fixed IncomeObjective The Fund is managed to provide a moderate real rate of return, throughincome and capital gains, by investing in a diversified portfolio of primarily Canadiandollar debt and from time−to−time U.S. debt. The Fund will only invest in investmentgrade debt. Returns in excess of income will be gained through active duration, yieldcurve and sector management.
Managed by MFS McLean Budden Limited
Fund managers Paul Marcogliese, B.Math, CFA and Peter Kotsopoulos, BA, CFA
Inception date January 1998Total assets $419.5 million
Historical gross returnsGross rates of return are shown before investment management fees have beendeducted. The solid area represents the gross returns of the Manulife Fund since itsinception in January 2005. To provide further historical information, the shaded arearepresents the returns of the underlying fund for the period before the start date of theManulife Fund.
* Only full calendar year returns are shown.
Overall past performanceThis graph shows how a $10,000 investment in this fund would have changed in value over time, based on grossreturns.
* For illustration purposes only. Includes mutual/pooled fund performance as indicated. Actual fund performance couldbe expected to vary.
Annual compound returns (As at June 30, 2013)
This table shows the historical annual compound total return of the Fund compared withthe DEX Long Term Bond Total Return.
1−year 2−year 3−year 5−yearSince
inception
Manulifeinception
date
MLI MFS MB Long TermFixed Income
−1.65% 7.46% 7.23% 7.89% 6.56% Jan 2005
DEX Long Term Bond TotalReturn
−2.91% 7.41% 7.27% 7.44% −
Rate of return expectation The Fund strives to outperform the DEX Long Term Bond Index over moving four−year periods.
Source: The Globe and Mail Inc.
27

Volatility meter
Based on 3 year standard deviation of the Fund
Low (1) High (25)
3
FIXED INCOME Code 4192
Manulife Fixed Income Plus Fund (AllianceBernstein)
Municipal Bonds 5.54%
Provincial Bonds 17.43%
Other 7.93%
Federal Bonds 35.37%
Corporate Debentures 33.73%
How the underlying fund is invested
Top holdings within the underlying Fund(As at June 30, 2013)
Gov’t of Canada, 3.50%, June 2020 12.14%
Gov’t of Canada, 2.75%, June 2022 5.04%
Canada Housing Trust, 4.10%, December 2018 4.73%
Gov’t of Canada, 4.00%, June 2041 3.73%
Province of Quebec, 3.50%, December 2022 3.50%
Province of Ontario, 3.15%, June 2022 2.98%
B.C. Municipal Finance, 4.15%, June 2021 1.98%
Province of Ontario, 3.50%, June 2043 1.82%
Canada Housing Trust, 2.35%, September 2023 1.80%
Canada Housing Trust, 3.15%, June 2015 1.75%
Fixed income style
Source: Manulife Investment Management Services
RateAnticipation
YieldEnhancement
SectorTrading
Note: All rates of return are shown before investment management fees or taxeshave been deducted.
The rate of return is used only to illustrate the effects of the compound growthrate and is not intended to reflect the future values or returns in the Fund.
UNDERLYING FUND −> Manulife Fixed Income Plus (AB)Objective The Manulife Fixed Income Plus Fund seeks to provide interest income andlong−term capital preservation by investing in Canadian and Global fixed incomesecurities.
Managed by AllianceBernstein Investment Management
Fund managers AllianceBernstein − Mgmt. Team
Inception date June 2007Total assets $375.1 million
Historical gross returnsGross rates of return are shown before investment management fees have beendeducted. The solid area represents the gross returns of the Manulife fund since itsinception in June 2007.
* Only full calendar year returns are shown.
Overall past performanceThis graph shows how a $10,000 investment in this fund would have changed in value over time, based on grossreturns.
* For illustration purposes only. Includes mutual/pooled fund performance as indicated. Actual fund performance couldbe expected to vary.
Annual compound returns (As at June 30, 2013)
This table shows the historical annual compound total return of the Fund compared withthe DEX Universe Bond Total Return Index.
1−year 2−year 3−year 5−yearSince
inception
Manulifeinception
date
MLI Fixed Income Plus (AB) 0.20% 4.52% 5.20% 5.96% 5.92% Jun 2007
DEX Universe Bond TotalReturn Index
−0.17% 4.55% 4.59% 5.53% −
Rate of return expectation Exceed the performance of the DEX Universe Bond Index by 1.0% over a rolling three year period.
Source: The Globe and Mail Inc.28

Volatility meter
Based on 3 year standard deviation of the Fund
Low (1) High (25)
3
FIXED INCOME Code 4271
Manulife PH&N Bond Fund
Other 7.70%
Municipal Bonds 0.09%
Mortgage Backed 0.70%
Federal Bonds 16.75%
Provincial Bonds 29.54%
Corporate Debentures 45.22%
How the underlying fund is invested
Top holdings within the underlying Fund(As at June 30, 2013)
Province of Ontario, 7.60%, June 2027 5.47%
Province of Ontario, 5.60%, June 2035 3.62%
Province of Ontario, 3.15%, June 2022 2.52%
Canada Housing Trust, 1.70%, December 2017 2.35%
Province of Ontario, 4.60%, June 2039 2.22%
Canada Housing Trust, 2.40%, December 2022 2.06%
Canada Housing Trust, 1.75%, June 2018 2.00%
Province of Ontario, 2.85%, June 2023 1.81%
Gov’t of Canada, 1.25%, March 2018 1.79%
Canada Housing Trust, 3.80%, June 2021 1.55%
Fixed income style
Source: Manulife Investment Management Services
RateAnticipation
YieldEnhancement
SectorTrading
Note: All rates of return are shown before investment management fees or taxeshave been deducted.
The rate of return is used only to illustrate the effects of the compound growthrate and is not intended to reflect the future values or returns in the Fund.
UNDERLYING FUND −> PH&N Bond−OObjective The PH&N Bond Fund is managed to provide stability of capital and generateinterest income by investing primarily in a well−diversified portfolio of fixed incomesecurities issued by Canadian governments and corporations
Managed by Phillips, Hager & North Inv Mgmt
Fund managers Phillips, Hager & North − Mgmt. Team
Inception date November 1970Total assets $7,847.2 million
Historical gross returnsGross rates of return are shown before investment management fees have beendeducted. The solid area represents the gross returns of the Manulife Fund since itsinception in January 2003.
* Only full calendar year returns are shown.
Overall past performanceThis graph shows how a $10,000 investment in this fund would have changed in value over time, based on grossreturns.
* For illustration purposes only. Includes mutual/pooled fund performance as indicated. Actual fund performance couldbe expected to vary.
Annual compound returns (As at June 30, 2013)
This table shows the historical annual compound total return of the Fund compared withthe DEX Universe Bond Total Return Index.
1−year 2−year 3−year 5−yearSince
inception
Manulifeinception
date
MLI PH&N Bond 0.58% 4.57% 4.79% 6.08% 5.91% Jan 2003
DEX Universe Bond TotalReturn Index
−0.17% 4.55% 4.59% 5.53% −
Rate of return expectation The Fund seeks to outperform the DEX Universe Bond Index by 0.50% per annum over a market cyclebefore management fees.
Source: The Globe and Mail Inc.29

Volatility meter
Based on 3 year standard deviation of the Fund
Low (1) High (25)
3
FIXED INCOME Code 4131
Manulife Canadian Bond Fund (MAM)
Federal Bonds 7.92%
Other 11.20%
Municipal Bonds 4.24%
Provincial Bonds 33.43%
Corporate Debentures 43.21%
How the underlying fund is invested
Top holdings within the underlying Fund(As at June 30, 2013)
Province of Ontario, 2.10%, September 2018 4.22%
Province of Ontario, 4.20%, June 2020 2.88%
CDP Financial, 4.60%, July 2020 2.54%
Province of Ontario, 3.15%, June 2022 2.35%
Province of Quebec, 4.50%, December 2018 2.33%
Province of Alberta, 1.60%, June 2018 2.21%
Gov’t of Canada, 4.00%, June 2041 2.06%
Province of British Columbia, 4.30%, June 2042 1.87%
Province of British Columbia, 4.10%, December 2019 1.64%
Cadillac Fairview, 3.24%, January 2016 1.59%
Fixed income style
Source: Manulife Investment Management Services
RateAnticipation
YieldEnhancement
SectorTrading
Note: All rates of return are shown before investment management fees or taxeshave been deducted.
The rate of return is used only to illustrate the effects of the compound growthrate and is not intended to reflect the future values or returns in the Fund.
UNDERLYING FUND −> MLI Cdn Bond (MAM)Objective The Manulife Canadian Bond Fund is managed to maximize stable, long−term growth through a combination of income and capital appreciation. This fundinvests primarily in securities guaranteed by the Government of Canada, its provinces ormunicipalities, corporations and chartered banks.
Managed by Manulife Asset Management Limited
Fund managers Hosen Marjaee, CFA and Terry Carr, CFA
Inception date January 1999Total assets $818.8 million
Historical gross returnsGross rates of return are shown before investment management fees have beendeducted. The solid area represents the gross returns of the Manulife Fund since itsinception in September 1998.
* Only full calendar year returns are shown.
Overall past performanceThis graph shows how a $10,000 investment in this fund would have changed in value over time, based on grossreturns.
* For illustration purposes only. Includes mutual/pooled fund performance as indicated. Actual fund performance couldbe expected to vary.
Annual compound returns (As at June 30, 2013)
This table shows the historical annual compound total return of the Fund compared withthe DEX Universe Bond Total Return Index.
1−year 2−year 3−year 5−yearSince
inception
Manulifeinception
date
MLI Canadian Bond (MAM) 0.50% 4.72% 4.82% 6.08% 5.95% Sep 1998
DEX Universe Bond TotalReturn Index
−0.17% 4.55% 4.59% 5.53% −
Rate of return expectation Over the long term, the Fund is expected to outperform the DEX Universe Bond Total Return Index.
Source: The Globe and Mail Inc.
30

Volatility meter
Based on 3 year standard deviation of the Fund
Low (1) High (25)
3
FIXED INCOME Code 4191
Manulife Asset Management Canadian Bond IndexFund
Other 0.01%
Corporate Debentures 29.08%
Municipal Bonds 1.68%
Federal Bonds 39.68%
Provincial Bonds 29.55%
How the underlying fund is invested
Top holdings within the underlying Fund(As at June 30, 2013)
Gov’t of Canada, 1.00%, November 2014 2.85%
Gov’t of Canada, 2.25%, August 2014 2.46%
Gov’t of Canada, 4.00%, June 2017 2.13%
Gov’t of Canada, 3.75%, June 2019 1.88%
Gov’t of Canada, 4.25%, June 2018 1.82%
Canada Housing Trust, 2.75%, June 2016 1.45%
Gov’t of Canada, 8.00%, June 2023 1.44%
Gov’t of Canada, 5.00%, June 2037 1.35%
Gov’t of Canada, 4.00%, June 2041 1.35%
Gov’t of Canada, 5.75%, June 2033 1.29%
Primary investment processIndex
Note: All rates of return are shown before investment management fees or taxeshave been deducted.
The rate of return is used only to illustrate the effects of the compound growthrate and is not intended to reflect the future values or returns in the Fund.
UNDERLYING FUND −> MAM Cdn Bond Index Pld FundObjective The MAM Canadian Bond Index Pooled Fund is managed to provide a rate ofreturn based on the performance of the DEX Universe Bond Index. This fund seeks toearn returns that replicate, as closely as possible, the DEX Universe Bond Index. This is apassively managed fund. To achieve its investment objective, the Fund will invest directlyin bonds and may use derivative instruments in order to replicate the securities of the DEXUniverse Bond Index.
Managed by Manulife Asset Management Limited
Fund managers Terry Carr, CFA, Andrew Gretzinger, CFA and Hosen Marjaee, CFA
Inception date April 1999Total assets $967.3 million
Historical gross returnsGross rates of return are shown before investment management fees have beendeducted. The solid area represents the gross returns of the Manulife Fund since itsinception in October 2001.
* Only full calendar year returns are shown.
Overall past performanceThis graph shows how a $10,000 investment in this fund would have changed in value over time, based on grossreturns.
* For illustration purposes only. Includes mutual/pooled fund performance as indicated. Actual fund performance couldbe expected to vary.
Annual compound returns (As at June 30, 2013)
This table shows the historical annual compound total return of the Fund compared withthe DEX Universe Bond Total Return Index.
1−year 2−year 3−year 5−yearSince
inception
Manulifeinception
date
MLI MAM Canadian BondIndex
−0.14% 4.57% 4.59% 5.49% 5.72% Oct 2001
DEX Universe Bond TotalReturn Index
−0.17% 4.55% 4.59% 5.53% −
Rate of return expectation Over the long term, the Fund is expected to track the performance of the DEX Universe Bond TotalReturn Index.
Source: The Globe and Mail Inc.
31

Balanced
Balanced funds typically aim to provide investors with a combination of capital growth and income. Balanced funds accomplish
this by investing in a blend of equity and fixed income securities. Balanced fund managers typically set a long-term target for
the mix of bonds and equities in the fund and may make moderate changes to the mix to reflect their outlook on which asset
class represents the best opportunity.
Balanced funds are ideal for investors who seek a diversified portfolio with an average level of volatility and who do not want
to manage the mix of asset classes on their own. Balanced funds are appropriate for investors who are looking for a mix of
growth and income over the long term and are comfortable with some short-term volatility in their investment returns.
FUND PAGE
CODE NUMBER
Value
Manulife MMF Monthly High Income Fund 5132 33
Manulife Trimark Income Growth Fund 5181 34
Manulife Leith Wheeler Diversified Pooled Fund (RPO) 5301 35
Manulife Beutel Goodman Balanced Fund 5631 36
Core/Blend
Manulife Balanced Fund 5011 37
Manulife Fidelity Canadian Asset Allocation 5141 38
Manulife CI Harbour Growth & Income 5232 39
Manulife Jarislowsky Fraser Balanced Fund (RPO) 5241 40
Manulife PH&N Balanced Pension Trust Fund 5271 41
Manulife GEM Balanced Fund 5291 42
Growth
Manulife Greystone Balanced Fund 5481 43
32

Volatility meter
Based on 3 year standard deviation of the Fund
Low (1) High (25)
4
BALANCED Code 5132
Manulife MMF Monthly High Income Fund
Cash 17.93%
Bond 23.23%
International Equity 0.01%
Canadian Equity 31.19%
United States Equity 27.64%
How the underlying fund is invested
Top holdings within the underlying Fund(As at June 30, 2013)
Manulife Money Fund 7.56%
CIBC 4.11%
IBM Corp. 3.67%
Gov’t of Canada, October 2013 3.61%
Rogers Communications 3.46%
Procter & Gamble 3.26%
Shoppers Drug Mart 3.06%
Pepsico Inc. 2.86%
Norfolk Southern 2.60%
Microsoft 2.57%
Primary investment processFundamental, Bottom−up
Equity style and capitalization
Source: Manulife Investment Management Services
Fixed income style
Source: Manulife Investment Management Services
Value Core/Blend Growth
Large
Medium
Small
All Cap
RateAnticipation
YieldEnhancement
SectorTrading
Note: All rates of return are shown before investment management fees or taxeshave been deducted.
The rate of return is used only to illustrate the effects of the compound growthrate and is not intended to reflect the future values or returns in the Fund.
UNDERLYING FUND −> Manulife Monthly High Income FundObjective The MMF Monthly High Income Fund seeks to provide investors with asteady flow of monthly income and capital growth through investments in Canadian fixedincome and large cap securities. The Fund may also invest in units or royalty trusts andreal estate investment trusts.
Managed by Manulife Asset Management Limited
Fund managers Alan Wicks, CFA, Jonathan Popper, CIM and Conrad Dabiet, CFA
Inception date September 1997Total assets $6,708.8 million
Historical gross returnsGross rates of return are shown before investment management fees have beendeducted. The solid area represents the gross returns of the Manulife Fund since itsinception in December 2004. To provide further historical information, the shaded arearepresents the returns of the underlying fund for the period before the start date of theManulife Fund.
* Only full calendar year returns are shown.
Overall past performanceThis graph shows how a $10,000 investment in this fund would have changed in value over time, based on grossreturns.
* For illustration purposes only. Includes mutual/pooled fund performance as indicated. Actual fund performance couldbe expected to vary.
Annual compound returns (As at June 30, 2013)
This table shows the historical annual compound total return of the Fund compared withthe composite benchmark, as outlined in the Rate of return expectation below.
1−year 2−year 3−year 5−yearSince
inception
Manulifeinception
date
MLI MMF Monthly HighIncome
14.21% 9.52% 10.44% 6.73% 7.71% Dec 2004
Blend: MMF Monthly HighIncome
4.67% 1.03% 5.25% 2.23% −
Rate of return expectation Over the long term, the Fund is expected to outperform a benchmark portfolio that is comprised of:
· 60% S&P/TSX Total Return Index· 40% DEX Universe Bond Total Return Index
Source: The Globe and Mail Inc. 33

Volatility meter
Based on 3 year standard deviation of the Fund
Low (1) High (25)
7
BALANCED Code 5181
Manulife Trimark Income Growth Fund
Cash 10.30%
United States Equity 18.66%
International Equity 2.54%
Canadian Equity 45.52%
Bond 22.98%
How the underlying fund is invested
Top holdings within the underlying Fund(As at June 30, 2013)
Brookfield Asset Management 3.87%
Canadian Natural Resources 3.50%
Zimmer Holdings 3.30%
Manulife Financial 3.28%
TD Bank 3.05%
Power Corp of Canada 3.03%
EnCana Corp. 2.97%
Thomson Reuters 2.91%
Bank of Nova Scotia 2.80%
Fairfax Financial Holdings 2.78%
Primary investment processFundamental, Bottom−up
Equity style and capitalization
Source: Manulife Investment Management Services
Fixed income style
Source: Manulife Investment Management Services
Value Core/Blend Growth
Large
Medium
Small
All Cap
RateAnticipation
YieldEnhancement
SectorTrading
Note: All rates of return are shown before investment management fees or taxeshave been deducted.
The rate of return is used only to illustrate the effects of the compound growthrate and is not intended to reflect the future values or returns in the Fund.
UNDERLYING FUND −> Trimark Income Growth−SCObjective The Trimark Income Growth Fund seeks to generate capital growth andincome over the long term. The Fund invests primarily in Canadian equities, fixed−income securities of Canadian issuers, both government and corporate, and foreignequities and fixed−income securities.
Managed by Invesco Canada Ltd.
Fund managers Anthony Imbesi, CFA, BComm, Gary Lew, CFA, MBA, Alfred Samson,CFA, Alan Mannik, CFA, MBA, Clayton Zacharias, CFA, CA and Mark Uptigrove
Inception date September 1987Total assets $330.1 million
Historical gross returnsGross rates of return are shown before investment management fees have beendeducted. The solid area represents the gross returns of the Manulife Fund since itsinception in October 1997.
* Only full calendar year returns are shown.
Overall past performanceThis graph shows how a $10,000 investment in this fund would have changed in value over time, based on grossreturns.
* For illustration purposes only. Includes mutual/pooled fund performance as indicated. Actual fund performance couldbe expected to vary.
Annual compound returns (As at June 30, 2013)
This table shows the historical annual compound total return of the Fund compared withthe composite benchmark, as outlined in the Rate of return expectation below.
1−year 2−year 3−year 5−yearSince
inception
Manulifeinception
date
MLI Trimark Income Growth 14.92% 7.83% 10.11% 6.27% 7.17% Oct 1997
Blend: Trimark IncomeGrowth
8.26% 4.06% 7.17% 3.13% −
Rate of return expectation Over the long term, the Fund is expected to outperform a benchmark comprised of:
· 35% S&P/TSX Total Return Index· 35% DEX Universe Bond Index· 25% MSCI World Index · 5% DEX 91 Day T−bill Index
Source: The Globe and Mail Inc.
34

Volatility meter
Based on 3 year standard deviation of the Fund
Low (1) High (25)
5
BALANCED Code 5301
Manulife Leith Wheeler Diversified Pooled Fund(Registered Plans Only)
United States Equity 9.31%
International Equity 17.65%
Cash 3.23%
Canadian Equity 35.27%
Bond 34.54%
How the underlying fund is invested
Top holdings within the underlying Fund(As at June 30, 2013)
Leith Wheeler International Pool−A 18.12%
TD Bank 2.63%
Royal Bank of Canada 2.28%
Bank of Nova Scotia 2.24%
Saputo Inc. 2.06%
Canadian National Railway 2.04%
Canadian Natural Resources 1.64%
Brookfield Infrastructure LP 1.30%
Canadian Tire Corporation 1.29%
Province of Quebec, 4.25%, December 2021 1.27%
Primary investment processFundamental, Bottom−up
Equity style and capitalization
Source: Manulife Investment Management Services
Fixed income style
Source: Manulife Investment Management Services
Value Core/Blend Growth
Large
Medium
Small
All Cap
RateAnticipation
YieldEnhancement
SectorTrading
Note: All rates of return are shown before investment management fees or taxeshave been deducted.
The rate of return is used only to illustrate the effects of the compound growthrate and is not intended to reflect the future values or returns in the Fund.
UNDERLYING FUND −> Leith Wheeler Diversified PoolObjective The Leith Wheeler Diversified Pooled Fund seeks to provide investors with arelatively stable, superior long−term rate of return through a balanced portfolio ofcommon shares and fixed income securities.
Managed by Leith Wheeler Inv Counsel Ltd.
Fund managers Neil Watson
Inception date February 2001Total assets $657.0 million
Historical gross returnsGross rates of return are shown before investment management fees have beendeducted. The solid area represents the gross returns of the Manulife Fund since itsinception in October 2003. To provide further historical information, the shaded arearepresents the returns of the underlying fund for the period before the start date of theManulife Fund.
* Only full calendar year returns are shown.
Overall past performanceThis graph shows how a $10,000 investment in this fund would have changed in value over time, based on grossreturns.
* For illustration purposes only. Includes mutual/pooled fund performance as indicated. Actual fund performance couldbe expected to vary.
Annual compound returns (As at June 30, 2013)
This table shows the historical annual compound total return of the Fund compared withthe composite benchmark, as outlined in the Rate of return expectation below.
1−year 2−year 3−year 5−yearSince
inception
Manulifeinception
date
MLI Leith WheelerDiversified
12.42% 7.20% 9.85% 5.65% 7.34% Oct 2003
Blend: MLI Leith WheelerDiversified
8.80% 4.47% 7.30% 3.07% −
Rate of return expectation The fund’s performance is benchmarked against a blend of:
· 35% DEX Universe Bond Index· 30% S&P/TSX Total Return Index · 15% S&P 500 Index ($ Cdn)· 15% MSCI EAFE Index ($ Cdn) · 5% DEX 91 Day T−bill Index
Source: The Globe and Mail Inc.
35

Volatility meter
Based on 3 year standard deviation of the Fund
Low (1) High (25)
6
BALANCED Code 5631
Manulife Beutel Goodman Balanced Fund
United States Equity 15.45%
International Equity 17.07%
Cash 6.70%
Bond 28.14%
Canadian Equity 32.64%
How the underlying fund is invested
Top holdings within the underlying Fund(As at June 30, 2013)
Canada Housing Trust, 2.75%, December 2014 4.53%
Gov’t of Canada, 2.00%, December 2014 2.97%
TD Bank 2.58%
Gov’t of Canada, 2.25%, August 2014 2.34%
Bank of Nova Scotia 2.23%
Canada Housing Trust, 3.15%, June 2015 2.22%
Beutel Goodman Small Cap−D 2.17%
Royal Bank of Canada 1.96%
Magna International 1.66%
TELUS Corp. 1.39%
Primary investment processFundamental, Bottom−up
Equity style and capitalization
Source: Manulife Investment Management Services
Fixed income style
Source: Manulife Investment Management Services
Value Core/Blend Growth
Large
Medium
Small
All Cap
RateAnticipation
YieldEnhancement
SectorTrading
Note: All rates of return are shown before investment management fees or taxeshave been deducted.
The rate of return is used only to illustrate the effects of the compound growthrate and is not intended to reflect the future values or returns in the Fund.
UNDERLYING FUND −> Beutel Goodman Balanced−DObjective This Fund seeks to enhance long−term capital value by investing in cash andcash equivalents, fixed income securities and Canadian, U.S. and international equitysecurities.
Managed by Beutel Goodman & Company Ltd.
Fund managers Bruce Corneil and Mark Thomson, CFA, MFA
Inception date December 1990Total assets $2,788.0 million
Historical gross returnsGross rates of return are shown before investment management fees have beendeducted. The solid area represents the gross returns of the Manulife Fund since itsinception in September 2009. To provide historical information, the shaded arearepresents the returns of the underlying fund for the period before the start date of theManulife Fund.
* Only full calendar year returns are shown.
Overall past performanceThis graph shows how a $10,000 investment in this fund would have changed in value over time, based on grossreturns.
* For illustration purposes only. Includes mutual/pooled fund performance as indicated. Actual fund performance couldbe expected to vary.
Annual compound returns (As at June 30, 2013)
This table shows the historical annual compound total return of the Fund compared withthe composite benchmark, as outlined in the Rate of return expectation below.
1−year 2−year 3−year 5−yearSince
inception
Manulifeinception
date
MLI Beutel GoodmanBalanced
13.34% 7.06% 9.45% − 7.60% Sep 2009
Blend: MLI Beutel GoodmanBalanced
7.94% 4.36% 7.08% 3.39% −
Rate of return expectation Over the long term, the Fund strives to outperform a benchmark comprised of the following:
40% DEX Universe Bond Index30% S&P/ TSX Composite Index13% MSCI EAFE ($Cdn)12% S&P 500 ($Cdn) 5% DEX 91−Day T−Bill Rate
Source: The Globe and Mail Inc.36

Code 5631 Volatility meter
Based on 3 year standard deviation of the Fund
Low (1) High (25)
5
BALANCED Code 5011
Manulife Balanced Fund
International Equity 9.67%
United States Equity 9.72%
Cash 5.67%
Other 0.66%
Bond 39.93%
Canadian Equity 34.35%
How the underlying fund is invested
Top holdings within the underlying Fund(As at June 30, 2013)
MLI Canadian Bond (CIBC) 32.98%
MLI Canadian Balanced (JF) 32.43%
MLI Canadian Equity (Mawer) 13.20%
MLI US Equity (Wellington) 10.24%
MLI International Eq (Templeton) 10.08%
MLI Q Core Canadian Eq (CC&L) 0.26%
Primary investment processMulti−manager
Equity style and capitalization
Source: Manulife Investment Management Services
Fixed income style
Source: Manulife Investment Management Services
Value Core/Blend Growth
Large
Medium
Small
All Cap
RateAnticipation
YieldEnhancement
SectorTrading
Note: All rates of return are shown before investment management fees or taxeshave been deducted.
The rate of return is used only to illustrate the effects of the compound growthrate and is not intended to reflect the future values or returns in the Fund.
UNDERLYING FUND −> MLI Balanced (Pension)Objective Investing in a combination of stocks, bonds and short−term securities, thisfund participates in a variety of markets with asset mix decisions left to an investmentprofessional.
Managed by Manulife Financial
Fund managers CIBC Global Asset Management − Mgmt.Team, Jarislowsky Fraser −Mgmt. Team, Wellington Management Co. − Mgmt. Team, Mawer Investment − MgmtTeam and Franklin Templeton − Mgmt. Team
Inception date September 1986Total assets $1,148.6 million
Historical gross returnsGross rates of return are shown before investment management fees have beendeducted. The solid area represents the gross returns of the Manulife Fund since itsinception in September 1986.
* Only full calendar year returns are shown.
Overall past performanceThis graph shows how a $10,000 investment in this fund would have changed in value over time, based on grossreturns.
* For illustration purposes only. Includes mutual/pooled fund performance as indicated. Actual fund performance couldbe expected to vary.
Annual compound returns (As at June 30, 2013)
This table shows the historical annual compound total return of the Fund compared withthe composite benchmark, as outlined in the Rate of return expectation below.
1−year 2−year 3−year 5−yearSince
inception
Manulifeinception
date
MLI Balanced 10.71% 6.33% 9.06% 5.60% 8.61% Sep 1986
Blend: MLI Balanced 6.01% 3.39% 6.25% 3.29% −
Rate of return expectation Over the long term, the Fund strives to outperform a benchmark comprised of the following:
· 45% DEX Universe Bond Index· 35% S&P/TSX Total Return Index· 15% MSCI World ($ Cdn)· 5% DEX 91 Day T−Bills
Source: The Globe and Mail Inc.37

Volatility meter
Based on 3 year standard deviation of the Fund
Low (1) High (25)
6
BALANCED Code 5141
Manulife Fidelity Canadian Asset Allocation
Cash 11.52%
International Equity 21.23%
United States Equity 10.76%
Other 6.29%
Canadian Equity 22.18%
Bond 28.02%
How the underlying fund is invested
Top holdings within the underlying Fund(As at June 30, 2013)
DERIVATIVES 6.15%
TD Bank 3.61%
SPDR S&P 500 E.T.F. 2.97%
Fidelity Conv Securities Inv Trust 2.97%
Royal Bank of Canada 2.85%
Bank of Nova Scotia 2.58%
Enbridge Inc. 1.94%
Shoppers Drug Mart 1.45%
Brookfield Asset Management 1.29%
Manulife Financial 1.25%
Primary investment processMulti−manager
Equity style and capitalization
Source: Manulife Investment Management Services
Fixed income style
Source: Manulife Investment Management Services
Value Core/Blend Growth
Large
Medium
Small
All Cap
RateAnticipation
YieldEnhancement
SectorTrading
Note: All rates of return are shown before investment management fees or taxeshave been deducted.
The rate of return is used only to illustrate the effects of the compound growthrate and is not intended to reflect the future values or returns in the Fund.
UNDERLYING FUND −> Fidelity Canadian Asset Alloc.−OObjective The fund aims to achieve total investment returns by investing in Canadianequity securities, fixed income securities and money market instruments. The fund’sneutral asset allocation is 65% equities, 30% fixed income securities and 5% moneymarket instruments.
Managed by Fidelity Investments Canada ULC
Fund managers Brian Miron, BCom, CFA, Derek Young, MBA, CFA, Joe Overdevest,Geoff Stein, MBA, CFA, Hugo Lavallée, Darren Lekkerkerker, MBA, CFA, Don Newman,CFA and Catriona Martin, CFA
Inception date December 1994Total assets $887.8 million
Historical gross returnsGross rates of return are shown before investment management fees have beendeducted. The solid area represents the gross returns of the Manulife Fund since itsinception in March 2009. To provide further historical information, the shaded arearepresents the returns of the underlying fund for the period before the start date of theManulife Fund.
* Only full calendar year returns are shown.
Overall past performanceThis graph shows how a $10,000 investment in this fund would have changed in value over time, based on grossreturns.
* For illustration purposes only. Includes mutual/pooled fund performance as indicated. Actual fund performance couldbe expected to vary.
Annual compound returns (As at June 30, 2013)
This table shows the historical annual compound total return of the Fund compared withthe composite benchmark, as outlined in the Rate of return expectation below.
1−year 2−year 3−year 5−yearSince
inception
Manulifeinception
date
MLI Fidelity Canadian AA 7.27% 2.13% 6.08% − 9.87% Mar 2009
Blend: MLI Fidelity CanadianAA
5.13% 0.53% 5.09% 1.69% −
Rate of return expectation Over a rolling four−year basis, the Fund is expected to outperform a benchmark composed of thefollowing:
· 65% S&P/TSX Capped Composite· 30% DEX Universe Bond Index· 5% DEX 91−Day T−Bill Index
Source: The Globe and Mail Inc.
38

Volatility meter
Based on 3 year standard deviation of the Fund
Low (1) High (25)
9
BALANCED Code 5232
Manulife CI Harbour Growth & Income Fund
International Equity 7.84%
Cash 18.46%
Bond 5.28%
Canadian Equity 46.13%
United States Equity 22.31%
How the underlying fund is invested
Top holdings within the underlying Fund(As at June 30, 2013)
Microsoft −
Suncor Energy −
CIBC −
George Weston −
Canadian National Railway −
Intact Financial −
Bank of New York Mellon −
Intel −
Discover Financial Services −
Bank of Nova Scotia −
Primary investment processFundamental, Bottom−up
Equity style and capitalization
Source: Manulife Investment Management Services
Fixed income style
Source: Manulife Investment Management Services
Value Core/Blend Growth
Large
Medium
Small
All Cap
RateAnticipation
YieldEnhancement
SectorTrading
Note: All rates of return are shown before investment management fees or taxeshave been deducted.
The rate of return is used only to illustrate the effects of the compound growthrate and is not intended to reflect the future values or returns in the Fund.
UNDERLYING FUND −> CI Harbour Growth & IncomeObjective The CI Harbour Growth & Income Fund is managed to obtain long−termtotal return through a prudent balance of income and capital appreciation. The Fundinvests primarily in equity and equity−related securities of mid− to large−capitalizationCanadian companies and fixed income securities issued by Canadian governments andcompanies.
Managed by CI Investments Inc.
Fund managers Stephen Jenkins and Gerald Coleman
Inception date June 1997Total assets $2,506.5 million
Historical gross returnsGross rates of return are shown before investment management fees have beendeducted. The solid area represents the gross returns of the Manulife Fund since itsinception in January 2005. To provide further historical information, the shaded arearepresents the returns of the underlying fund for the period before the start date of theManulife Fund.
* Only full calendar year returns are shown.
Overall past performanceThis graph shows how a $10,000 investment in this fund would have changed in value over time, based on grossreturns.
* For illustration purposes only. Includes mutual/pooled fund performance as indicated. Actual fund performance couldbe expected to vary.
Annual compound returns (As at June 30, 2013)
This table shows the historical annual compound total return of the Fund compared withthe composite benchmark, as outlined in the Rate of return expectation below.
1−year 2−year 3−year 5−yearSince
inception
Manulifeinception
date
MLI CI Harbour Growth &Income
8.96% 2.40% 6.97% 2.84% 6.72% Jan 2005
Blend: 60% S&P/TSX, 40%DEX Universe
4.67% 1.03% 5.25% 2.23% −
Rate of return expectation Over the long term, this fund is expected to outperform a benchmark comprised of the following:
· 60% S&P/TSX Total Return Index· 40% DEX Universe Bond Total Return Index
Source: The Globe and Mail Inc.
39

Volatility meter
Based on 3 year standard deviation of the Fund
Low (1) High (25)
5
BALANCED Code 5241
Manulife Jarislowsky Fraser Balanced Fund(Registered Plans Only)
International Equity 15.40%
United States Equity 18.70%
Cash 5.90%
Canadian Equity 29.80%
Bond 30.20%
How the underlying fund is invested
Top holdings within the underlying Fund(As at June 30, 2013)
TD Bank 2.40%
Royal Bank of Canada 2.00%
Bank of Nova Scotia 1.90%
Province of Ontario, 3.15%, June 2022 1.60%
Suncor Energy 1.30%
Gov’t of Canada, 5.75%, June 2029 1.20%
Metro Inc. 1.20%
Cenovus Energy 1.20%
Canada Housing Trust, 1.64%, September 2014 1.10%
Canadian National Railway 1.10%
Primary investment processFundamental, Bottom−up
Equity style and capitalization
Source: Manulife Investment Management Services
Fixed income style
Source: Manulife Investment Management Services
Value Core/Blend Growth
Large
Medium
Small
All Cap
RateAnticipation
YieldEnhancement
SectorTrading
Note: All rates of return are shown before investment management fees or taxeshave been deducted.
The rate of return is used only to illustrate the effects of the compound growthrate and is not intended to reflect the future values or returns in the Fund.
UNDERLYING FUND −> JF BalancedObjective The Jarislowsky Fraser Balanced Fund is a diversified portfolio consisting offixed income assets, North American equities and International equities. It seeks to addvalue through longer−term asset mix positioning and stock selection rather than short−term trading. The portfolio’s volatility is kept to a minimum by implementing onlyincremental asset mix changes and buying large cap, blue−chip equity holdings and highquality, non−cyclical bonds.
Managed by Jarislowsky Fraser Ltd.
Fund managers Jarislowsky Fraser − Mgmt. Team
Inception date April 1997Total assets $2,147.2 million
Historical gross returnsGross rates of return are shown before investment management fees have beendeducted. The solid area represents the gross returns of the Manulife Fund since itsinception in October 2001.
* Only full calendar year returns are shown.
Overall past performanceThis graph shows how a $10,000 investment in this fund would have changed in value over time, based on grossreturns.
* For illustration purposes only. Includes mutual/pooled fund performance as indicated. Actual fund performance couldbe expected to vary.
Annual compound returns (As at June 30, 2013)
This table shows the historical annual compound total return of the Fund compared withthe composite benchmark, as outlined in the Rate of return expectation below.
1−year 2−year 3−year 5−yearSince
inception
Manulifeinception
date
MLI JF Balanced 14.11% 8.31% 9.88% 5.52% 6.31% Oct 2001
Blend: MLI JF Balanced 8.01% 4.38% 7.06% 3.38% −
Rate of return expectation Benchmark changed as at January 1, 2007. Over the long term, this fund is expected to outperform abenchmark comprised of the following:
· 39.0% DEX Universe Bond Index· 30.0% S&P/TSX Total Return Index· 12.5% S&P 500 Index ($ Cdn)· 12.5% MSCI EAFE Index ($ Cdn)· 6.0% DEX 91 Day TBill Index
Source: The Globe and Mail Inc.40

Volatility meter
Based on 3 year standard deviation of the Fund
Low (1) High (25)
6
BALANCED Code 5271
Manulife PH&N Balanced Pension Trust Fund
International Equity 12.28%
United States Equity 13.13%
Cash 9.05%
Bond 31.27%
Canadian Equity 34.27%
How the underlying fund is invested
Top holdings within the underlying Fund(As at June 30, 2013)
PH&N Canadian Equity−D 34.56%
PH&N Bond−D 33.88%
PH&N U.S. Equity−D 13.87%
PH&N Overseas Equ Pension Trust−A 12.13%
RBC Institutional Cash 5.13%
National Bank of Canada, 1.00%, July 2013 0.27%
CIBC, July 2013 0.16%
Primary investment processFundamental, Bottom−up
Equity style and capitalization
Source: Manulife Investment Management Services
Fixed income style
Source: Manulife Investment Management Services
Value Core/Blend Growth
Large
Medium
Small
All Cap
RateAnticipation
YieldEnhancement
SectorTrading
Note: All rates of return are shown before investment management fees or taxeshave been deducted.
The rate of return is used only to illustrate the effects of the compound growthrate and is not intended to reflect the future values or returns in the Fund.
UNDERLYING FUND −> PH&N Balanced Pension Trust−OObjective The PH&N Balanced Pension Trust Fund is managed to provide long−termcapital growth and income by investing primarily in a well−diversified, balanced portfolioof Canadian common stocks, bonds and money market securities. This fund also holds aportion of its assets in foreign common stock.
Managed by Phillips, Hager & North Inv Mgmt
Fund managers Phillips, Hager & North − Mgmt. Team
Inception date August 2001Total assets $866.0 million
Historical gross returnsGross rates of return are shown before investment management fees have beendeducted. The solid area represents the gross returns of the Manulife Fund since itsinception in November 2003. To provide further historical information, the shaded arearepresents the returns of the underlying fund for the period before the start date of theManulife Fund.
* Only full calendar year returns are shown.
Overall past performanceThis graph shows how a $10,000 investment in this fund would have changed in value over time, based on grossreturns.
* For illustration purposes only. Includes mutual/pooled fund performance as indicated. Actual fund performance couldbe expected to vary.
Annual compound returns (As at June 30, 2013)
This table shows the historical annual compound total return of the Fund compared withthe composite benchmark, as outlined in the Rate of return expectation below.
1−year 2−year 3−year 5−yearSince
inception
Manulifeinception
date
MLI PH&N BalancedPension Trust
9.80% 4.05% 7.05% 3.75% 5.67% Nov 2003
Blend: MLI PH&N BalancedPension Trust
8.25% 4.05% 7.16% 3.12% −
Rate of return expectation Over the long term, the Fund is expected to outperform a benchmark comprised of:
· 35% S&P/TSX Total Return Index· 35% DEX Universe Bond Index· 25% MSCI World Index − ex Cdn · 5% DEX 30 day T−Bill Index
Source: The Globe and Mail Inc.
Code 5241
41

Volatility meter
Based on 1 year standard deviation of the Fund
Low (1) High (25)
3
BALANCED Code 5291
Manulife GEM Balanced Fund
International Equity 11.51%
United States Equity 15.76%
Cash 1.63%
Other 0.26%
Bond 33.06%
Canadian Equity 37.77%
How the underlying fund is invested
Top holdings within the underlying Fund(As at June 30, 2013)
GEM Canadian Equity Pool 38.52%
GEM Fixed Income Pool 33.61%
GEM Global Equity Pooled 27.86%
Primary investment processFundamental, Bottom−up
Equity style and capitalization
Source: Manulife Investment Management Services
Fixed income style
Source: Manulife Investment Management Services
Value Core/Blend Growth
Large
Medium
Small
All Cap
RateAnticipation
YieldEnhancement
SectorTrading
Note: All rates of return are shown before investment management fees or taxeshave been deducted.
The rate of return is used only to illustrate the effects of the compound growthrate and is not intended to reflect the future values or returns in the Fund.
UNDERLYING FUND −> GEM BalancedObjective The Fund is managed to achieve a balance between long−term growth ofcapital and reasonable income through diversified investments in equity or equity−relatedsecurities and in fixed−income securities, either long term or short term. The Fund followsa Socially Responsible Investment (SRI) mandate and engagement with corporatemanagement conducted in partnership by Northwest & Ethical Investments L.P. ("NEILP")the operator of The Ethical Funds of Canada.
Managed by Guardian Ethical Management
Fund managers Ted Macklin, BComm, CFA, Sri Iyer and Peter Hargrove, CFA, BComm
Inception date February 2006Total assets $46.9 million
Historical gross returnsGross rates of return are shown before investment management fees have beendeducted. The shaded area represents the returns of the underlying fund for the periodbefore the start date of the Manulife Fund.
* Only full calendar year returns are shown.
Overall past performanceThis graph shows how a $10,000 investment in this fund would have changed in value over time, based on grossreturns.
* For illustration purposes only. Includes mutual/pooled fund performance as indicated. Actual fund performance couldbe expected to vary.
Annual compound returns (As at June 30, 2013)
This table shows the historical annual compound total return of the Fund compared withthe Globe Canadian Neutral Balanced Peer Index.
1−year 2−year 3−year 5−yearSince
inception
Manulifeinception
date
MLI GEM Balanced 8.03% − − − 8.61% May 2012
Globe Cdn Neutral BalancedPeer Index
6.85% 2.73% 5.46% 2.25% −
Rate of return expectation Over the long term, the Fund is expected to outperform its benchmark + 0.1% (annualized) overmoving four−year periods.
Source: The Globe and Mail Inc.
42

Volatility meter
Based on 3 year standard deviation of the Fund
Low (1) High (25)
6
BALANCED Code 5481
Manulife Greystone Balanced Fund
International Equity 12.90%
United States Equity 13.23%
Cash 4.34%
Bond 32.73%
Canadian Equity 36.80%
How the underlying fund is invested
Top holdings within the underlying Fund(As at June 30, 2013)
Gov’t of Canada, 1.50%, September 2017 2.76%
TD Bank 2.76%
Royal Bank of Canada 2.68%
Bank of Nova Scotia 2.25%
Suncor Energy 1.87%
Canadian National Railway 1.77%
Manulife Financial 1.57%
Enbridge Inc. 1.45%
Gov’t of Canada, August 2013 1.31%
Magna International 1.26%
Primary investment processFundamental, Bottom−up
Equity style and capitalization
Source: Manulife Investment Management Services
Fixed income style
Source: Manulife Investment Management Services
Value Core/Blend Growth
Large
Medium
Small
All Cap
RateAnticipation
YieldEnhancement
SectorTrading
Note: All rates of return are shown before investment management fees or taxeshave been deducted.
The rate of return is used only to illustrate the effects of the compound growthrate and is not intended to reflect the future values or returns in the Fund.
UNDERLYING FUND −> Greystone BalancedObjective The Greystone Balanced Fund seeks superior long−term total returns (currentincome and capital appreciation) by investing in a balanced portfolio of equity and fixedincome asset classes, including foreign equities.
Managed by Greystone Managed Investments Inc.
Fund managers Greystone Mgd. Invest. − Mgmt. Team
Inception date January 1993Total assets $788.1 million
Historical gross returnsGross rates of return are before investment management fees have beendeducted. The solid area represents the gross returns of the Manulife fund since itsinception in March 2007. To provide further historical information, the shaded arearepresents the returns of the underlying fund for the period before the start date of theManulife fund.
* Only full calendar year returns are shown.
Overall past performanceThis graph shows how a $10,000 investment in this fund would have changed in value over time, based on grossreturns.
* For illustration purposes only. Includes mutual/pooled fund performance as indicated. Actual fund performance couldbe expected to vary.
Annual compound returns (As at June 30, 2013)
This table shows the historical annual compound total return of the Fund compared withthe composite benchmark, as outlined in the Rate of return expectation below.
1−year 2−year 3−year 5−yearSince
inception
Manulifeinception
date
MLI Greystone Balanced 9.60% 3.25% 7.07% 2.36% 2.41% Mar 2007
Blend: MLI GreystoneBalanced
8.41% 4.23% 7.29% 3.28% −
Rate of return expectation Over the long term, this fund is expected to outperform a benchmark comprised of the following:
· 37.0% DEX Universe Bond Index· 35.0% S&P/TSX Composite Index· 12.5% S&P 500 Index ($ Cdn)· 12.5% MSCI EAFE Index ($ Cdn)· 3.0% DEX 91−Day T−Bill Index
Source: The Globe and Mail Inc.
Code 5291
43

Canadian Equity Canadian Equity funds typically aim to achieve long-term capital growth by investing in a diversified portfolio of shares issuedby Canadian companies. Some Canadian Equity funds invest a portion of their assets in shares of foreign companies. A sharerepresents an ownership stake in a company; therefore, how the Fund performs depends on the success of the companyholdings within the Fund. The Fund’s performance can also be affected by factors such as currency exchange rates andeconomic and political trends.
Canadian Large Cap Equity funds are ideal for investors who have a long-term focus, prefer to invest in Canadian companiesand are generally seeking a lower degree of volatility.
Canadian Small/Mid Cap Equity funds are suitable for investors who have a long-term focus, prefer to invest in Canadiancompanies and are comfortable accepting a higher degree of volatility.
FUND PAGECODE NUMBER
Canadian Large Cap Equity
ValueManulife Canadian Large Cap Value Equity Fund (MAM) 7131 45
Manulife Trimark Canadian Fund 7181 46
Manulife Scheer Rowlett Canadian Equity Fund 7601 47
Manulife Beutel Goodman Canadian Equity Fund 7631 48
Core/BlendManulife Canadian Equity Fund 7011 49
Manulife Fidelity Canadian Large Cap Fund 7141 50
Manulife Pyramis Canadian Core Equity Fund 7142 51
Manulife Fidelity True North Fund 7143 52
Manulife Fidelity Canadian Disciplined Fund 7144 53
Manulife CI Harbour Fund 7231 54
Manulife Jarislowsky Fraser Canadian Equity Fund 7241 55
Manulife PH&N Canadian Equity Fund 7272 56
GrowthManulife Asset Management Canadian Large Cap Growth Fund 7121 57
Manulife Guardian Canadian Growth Equity Fund 7293 58
Manulife CC&L Group Canadian Q Growth Fund 7313 59
Manulife Greystone Canadian Equity Fund 7481 60
IndexManulife Asset Management Canadian Equity Index Fund 7132 61
Canadian Small/Mid Cap Equity
ValueManulife FGP Small Cap Canadian Equity Fund 7381 62
GrowthManulife MMF Growth Opportunities Fund 7122 63
44

Volatility meter
Based on 3 year standard deviation of the Fund
Low (1) High (25)
12
CANADIAN LARGE CAP EQUITY Code 7131
Manulife Canadian Large Cap Value Equity Fund(MAM)
Industrials 6.51%
Consumer Staples 7.99%
Consumer Discretionary 14.65%
Other 15.18%
Cash 11.37%
Materials 8.14%
Financials 19.43%Energy 16.73%
How the underlying fund is invested
Top holdings within the underlying Fund(As at June 30, 2013)
Imperial Oil 7.76%
Rogers Communications 5.97%
Suncor Energy 5.87%
Canadian Tire Corporation 5.18%
CIBC 4.46%
Barrick Gold Corp. 3.87%
Metro Inc. 3.25%
ATCO Ltd. 3.13%
IGM Financial 2.83%
Power Corp of Canada 2.82%
Primary investment processFundamental, Bottom−up
Equity style and capitalization
Source: Manulife Investment Management Services
Value Core/Blend Growth
Large
Medium
Small
All Cap
Note: All rates of return are shown before investment management fees or taxeshave been deducted.
The rate of return is used only to illustrate the effects of the compound growthrate and is not intended to reflect the future values or returns in the Fund.
UNDERLYING FUND −> MLI Cdn Large Cap Value Eq (MAM)Objective The Manulife Canadian Large Cap Value Equity Fund (MAM) is managed toachieve long−term capital growth. The Fund invests primarily in high−quality large capCanadian Equities including income trusts and convertible instruments.
Managed by Manulife Asset Management Limited
Fund managers Alan Wicks, CFA, Conrad Dabiet, CFA and Jonathan Popper, CIM
Inception date January 1999Total assets $665.0 million
Historical gross returnsGross rates of return are shown before investment management fees have beendeducted. The solid area represents the gross returns of the Manulife Fund since itsinception in July 1997. The underlying fund was changed on September 30, 2002 fromthe Elliott & Page Pooled Canadian Equity Fund to the Manulife Canadian Large CapValue Equity Fund.
* Only full calendar year returns are shown.
Overall past performanceThis graph shows how a $10,000 investment in this fund would have changed in value over time, based on grossreturns.
* For illustration purposes only. Includes mutual/pooled fund performance as indicated. Actual fund performance couldbe expected to vary.
Annual compound returns (As at June 30, 2013)
This table shows the historical annual compound total return of the Fund compared withthe S&P/TSX Total Return.
1−year 2−year 3−year 5−yearSince
inception
Manulifeinception
date
MLI Cdn Large Cap ValueEqu (MAM)
20.94% 4.77% 7.55% 2.86% 5.78% Jul 1997
S&P/TSX Total Return 7.90% −1.60% 5.39% −0.53% −
Rate of return expectation Over the long term, the Fund is expected to outperform the S&P/TSX Composite Total Return Index.
Source: The Globe and Mail Inc. 45

Volatility meter
Based on 3 year standard deviation of the Fund
Low (1) High (25)
13
CANADIAN LARGE CAP EQUITY Code 7181
Manulife Trimark Canadian Fund
Cash 1.27%
Other 7.90%
Materials 12.60%
Industrials 9.75%
Information Technology 10.68%
Consumer Discretionary 12.94%
Financials 18.01%Energy 26.85%
How the underlying fund is invested
Top holdings within the underlying Fund(As at June 30, 2013)
MacDonald Dettwiler & Assoc. 5.35%
TD Bank 4.79%
Trinidad Drilling 4.65%
Bonavista Energy Corp. 4.40%
Manulife Financial 4.29%
Toromont Industries 3.98%
Enerflex Ltd. 3.79%
Thomson Reuters 3.61%
Legg Mason 3.59%
Nobel Biocare Holding AG 3.33%
Primary investment processFundamental, Bottom−up
Equity style and capitalization
Source: Manulife Investment Management Services
Value Core/Blend Growth
Large
Medium
Small
All Cap
Note: All rates of return are shown before investment management fees or taxeshave been deducted.
The rate of return is used only to illustrate the effects of the compound growthrate and is not intended to reflect the future values or returns in the Fund.
UNDERLYING FUND −> Trimark Canadian−SCObjective The Trimark Canadian Fund seeks to provide strong capital growth with ahigh degree of reliability over the long term; it invests primarily in common shares ofCanadian companies.
Managed by Invesco Canada Ltd.
Fund managers Ian Hardacre, CFA, MBA, Jason Whiting, CFA, Alan Mannik, CFA, MBAand Eric Menke
Inception date September 1981Total assets $427.5 million
Historical gross returnsGross rates of return are shown before investment management fees have beendeducted. The solid area represents the gross returns of the Manulife Fund since itsinception in October 1997.
* Only full calendar year returns are shown.
Overall past performanceThis graph shows how a $10,000 investment in this fund would have changed in value over time, based on grossreturns.
* For illustration purposes only. Includes mutual/pooled fund performance as indicated. Actual fund performance couldbe expected to vary.
Annual compound returns (As at June 30, 2013)
This table shows the historical annual compound total return of the Fund compared withthe composite benchmark, as outlined in the Rate of return expectation below.
1−year 2−year 3−year 5−yearSince
inception
Manulifeinception
date
MLI Trimark Canadian 18.10% 6.00% 11.60% 6.63% 6.44% Oct 1997
Blend: Trimark Canadian 13.04% 2.88% 8.41% 1.16% −
Rate of return expectation Over the long term, the Fund is expected to outperform a benchmark comprised of:
· 65% S&P/TSX Total Return Index· 35% MSCI World Index
Source: The Globe and Mail Inc.
46

Volatility meter
Based on 3 year standard deviation of the Fund
Low (1) High (25)
12
CANADIAN LARGE CAP EQUITY Code 7601
Manulife Scheer Rowlett Canadian Equity Fund
Consumer Discretionary 7.23%
Other 2.89%
Cash 0.78%
Industrials 4.44%
Telecommunication Services 5.87%
Materials 17.16%
Energy 22.99%Financials 38.64%
How the underlying fund is invested
Top holdings within the underlying Fund(As at June 30, 2013)
TD Bank 9.83%
Bank of Nova Scotia 8.74%
Royal Bank of Canada 8.03%
Suncor Energy 7.43%
CIBC 6.55%
Canadian Natural Resources 5.13%
Canadian National Railway 4.34%
Potash Corp. of Saskatchewan 4.27%
Magna International 3.78%
Cenovus Energy 3.30%
Primary investment processFundamental, Bottom−up
Equity style and capitalization
Source: Manulife Investment Management Services
Value Core/Blend Growth
Large
Medium
Small
All Cap
Note: All rates of return are shown before investment management fees or taxeshave been deducted.
The rate of return is used only to illustrate the effects of the compound growthrate and is not intended to reflect the future values or returns in the Fund.
UNDERLYING FUND −> Scheer Rowlett Canadian EquityObjective The Fund seeks to maximize long−term total return while protecting thecapital value of the fund from major market fluctuations.
Managed by Scheer Rowlett & Associates
Fund managers Lloyd Rowlett, Scott Merriman and Rob Dionne
Inception date December 1995Total assets $1,367.8 million
Historical gross returnsGross rates of return are shown before investment management fees have beendeducted. The solid area represents the gross returns of the Manulife Fund since itsinception in June 2008. To provide further historical information, the shaded arearepresents the returns of the underlying fund for the period before the start date of theManulife Fund.
* Only full calendar year returns are shown.
Overall past performanceThis graph shows how a $10,000 investment in this fund would have changed in value over time, based on grossreturns.
* For illustration purposes only. Includes mutual/pooled fund performance as indicated. Actual fund performance couldbe expected to vary.
Annual compound returns (As at June 30, 2013)
This table shows the historical annual compound total return of the Fund compared withthe S&P/TSX Total Return.
1−year 2−year 3−year 5−yearSince
inception
Manulifeinception
date
MLI Scheer RowlettCanadian Equity
9.08% −1.40% 5.02% −1.10% −1.14% Jun 2008
S&P/TSX Total Return 7.90% −1.60% 5.39% −0.53% −
Rate of return expectation The Fund is expected to outperform the S&P/TSX Composite Total Return Index by 2% over four yearrolling periods.
Source: The Globe and Mail Inc.
Code 7181
47

Volatility meter
Based on 3 year standard deviation of the Fund
Low (1) High (25)
10
CANADIAN LARGE CAP EQUITY Code 7631
Manulife Beutel Goodman Canadian Equity Fund
Industrials 9.93%
Other 7.43%
Cash 3.07%
Consumer Staples 7.39%
Telecommunication Services 7.99%
Consumer Discretionary 13.59%
Energy 14.82%Financials 35.78%
How the underlying fund is invested
Top holdings within the underlying Fund(As at June 30, 2013)
TD Bank 7.73%
Bank of Nova Scotia 6.66%
Beutel Goodman Small Cap−D 6.41%
Royal Bank of Canada 5.91%
Magna International 4.94%
TELUS Corp. 4.23%
Great−West Lifeco 4.13%
Manulife Financial 4.05%
CIBC 3.97%
Canadian Natural Resources 3.96%
Primary investment processFundamental, Bottom−up
Equity style and capitalization
Source: Manulife Investment Management Services
Value Core/Blend Growth
Large
Medium
Small
All Cap
Note: All rates of return are shown before investment management fees or taxeshave been deducted.
The rate of return is used only to illustrate the effects of the compound growthrate and is not intended to reflect the future values or returns in the Fund.
UNDERLYING FUND −> Beutel Goodman Canadian Equity−IObjective This Fund seeks long−term capital appreciation primarily through investmentsin common shares and other equity securities of established Canadian issuers.
Managed by Beutel Goodman & Company Ltd.
Fund managers Mark Thomson, CFA, MFA, Pat Palozzi and James W. Black, CA, CFA
Inception date August 2001Total assets $3,724.7 million
Historical gross returnsGross rates of return are shown before investment management fees have beendeducted. The solid area represents the gross returns of the Manulife Fund since itsinception in September 2009. To provide historical information, the shaded arearepresents the returns of the underlying fund for the period before the start date of theManulife Fund.
* Only full calendar year returns are shown.
Overall past performanceThis graph shows how a $10,000 investment in this fund would have changed in value over time, based on grossreturns.
* For illustration purposes only. Includes mutual/pooled fund performance as indicated. Actual fund performance couldbe expected to vary.
Annual compound returns (As at June 30, 2013)
This table shows the historical annual compound total return of the Fund compared withthe S&P/TSX Total Return.
1−year 2−year 3−year 5−yearSince
inception
Manulifeinception
date
MLI Beutel GoodmanCanadian Equity
18.60% 5.72% 10.52% − 9.29% Sep 2009
S&P/TSX Total Return 7.90% −1.60% 5.39% −0.53% −
Rate of return expectation Over the long term, the Fund strives to outperform the S&P/TSX Composite Total Return Index.
Source: The Globe and Mail Inc.48

Code 7631 Volatility meter
Based on 3 year standard deviation of the Fund
Low (1) High (25)
11
CANADIAN LARGE CAP EQUITY Code 7011
Manulife Canadian Equity Fund
Materials 11.67%
Consumer Staples 4.37%
Cash 1.06%
Consumer Discretionary 6.98%
Industrials 8.77%
Other 12.24%
Energy 21.24%Financials 33.67%
How the underlying fund is invested
Top holdings within the underlying Fund(As at June 30, 2013)
MLI Q Core Canadian Eq (CC&L) 39.53%
MLI Canadian Equity (Greystone) 24.09%
MLI Canadian Equity (Genus) 19.39%
MLI Canadian Equity (Mawer) 12.06%
MLI Canadian Small Cap (Bolton) 4.87%
Primary investment processFundamental, Bottom−up
Equity style and capitalization
Source: Manulife Investment Management Services
Value Core/Blend Growth
Large
Medium
Small
All Cap
Note: All rates of return are shown before investment management fees or taxeshave been deducted.
The rate of return is used only to illustrate the effects of the compound growthrate and is not intended to reflect the future values or returns in the Fund.
UNDERLYING FUND −> Manulife Canadian Equity (Pensions)Objective Managed by team of Canada’s top money managers, the Fund providesinvestors with a portfolio that is diversified by both the stocks it holds and its multiplemanagers’ investment styles.
Managed by Manulife Financial
Fund managers Montrusco Bolton Inc. − Mgmt. Team, Genus Capital Management −Mgmt. Team, Greystone Mgd. Invest. − Mgmt. Team, Connor, Clark & Lunn − Mgmt.Team and Mawer Investment − Mgmt Team
Inception date January 1980Total assets $184.1 million
Historical gross returnsGross rates of return are shown before investment management fees have beendeducted. The solid area represents the gross returns of the Manulife Fund since itsinception in January 1980.
* Only full calendar year returns are shown.
Overall past performanceThis graph shows how a $10,000 investment in this fund would have changed in value over time, based on grossreturns.
* For illustration purposes only. Includes mutual/pooled fund performance as indicated. Actual fund performance couldbe expected to vary.
Annual compound returns (As at June 30, 2013)
This table shows the historical annual compound total return of the Fund compared withthe S&P/TSX Total Return.
1−year 2−year 3−year 5−yearSince
inception
Manulifeinception
date
MLI Canadian Equity 10.24% −1.52% 4.88% −1.72% 9.98% Jan 1980
S&P/TSX Total Return 7.90% −1.60% 5.39% −0.53% −
Rate of return expectation Over the long term, this Fund strives to outperform the S&P TSX Total Return Index.
Source: The Globe and Mail Inc.49

Volatility meter CANADIAN LARGE CAP EQUITY Code 7141
Manulife Fidelity Canadian Large Cap Fund
How the underlying fund is invested
Top holdings within the underlying Fund
Primary investment process
Equity style and capitalizationValue Core/Blend Growth
Large
Medium
Small
All Cap
Fidelity Canadian Large Cap−AObjective
Managed by
Fund managers
Inception date Total assets
Historical gross returnsGross rates of return are shown before investment management fees have beendeducted.
Overall past performance
Annual compound returns
1−year 2−year 3−year 5−yearSince
inception
Manulifeinception
date
Rate of return expectation
50

Volatility meter
Based on 3 year standard deviation of the underlying fund
Low (1) High (25)
10
CANADIAN LARGE CAP EQUITY Code 7142
Manulife Pyramis Canadian Core Equity Fund
Materials 11.05%
Consumer Staples 5.14%
Cash 5.06%
Industrials 5.23%
Consumer Discretionary 5.53%
Other 12.11%
Energy 23.13%Financials 32.75%
How the underlying fund is invested
Top holdings within the underlying Fund(As at June 30, 2013)
TD Bank 6.72%
Royal Bank of Canada 6.28%
Enbridge Inc. 4.51%
Canadian National Railway 3.93%
Valeant Pharmaceuticals Intl. 3.83%
Potash Corp. of Saskatchewan 3.50%
Cenovus Energy 3.18%
Bank of Montreal 2.98%
Manulife Financial 2.95%
Suncor Energy 2.79%
Primary investment processFundamental, Bottom−up
Equity style and capitalization
Source: Manulife Investment Management Services
Value Core/Blend Growth
Large
Medium
Small
All Cap
Note: All rates of return are shown before investment management fees or taxeshave been deducted.
The rate of return is used only to illustrate the effects of the compound growthrate and is not intended to reflect the future values or returns in the Fund.
UNDERLYING FUND −> Pyramis Canadian Core EquityObjective The portfolio’s investment objective is to seek long−term capital appreciationby investing in a diversified portfolio of Canadian equities. The Canadian Core strategyuses a bottom up, fundamental approach designed to deliver the Pyramis Canadianequity research team’s best ideas within a riskcontrolled, sector−neutral portfoliostructure.
Managed by Fidelity Investments Canada ULC
Fund managers Andrew Marchese, MBA, BSc
Inception date August 2002Total assets $1,385.5 million
Historical gross returnsGross rates of return are shown before investment management fees have beendeducted. The solid area represents the gross returns of the Manulife Fund since itsinception in September 2010. To provide further historical information, the shaded arearepresents the returns of the underlying fund for the period before the start date of theManulife Fund.
* Only full calendar year returns are shown.
Overall past performanceThis graph shows how a $10,000 investment in this fund would have changed in value over time, based on grossreturns.
* For illustration purposes only. Includes mutual/pooled fund performance as indicated. Actual fund performance couldbe expected to vary.
Annual compound returns (As at June 30, 2013)
This table shows the historical annual compound total return of the Fund compared withthe S&P/TSX Total Return.
1−year 2−year 3−year 5−yearSince
inception
Manulifeinception
date
MLI Pyramis Canadian CoreEquity
11.09% 0.64% − − 4.97% Sep 2010
S&P/TSX Total Return 7.90% −1.60% 5.39% −0.53% −
Rate of return expectation The Fund aims to outperform the S&P/TSX Capped Composite Index by 200 bps over a full marketcycle.
Source: The Globe and Mail Inc.
51

Volatility meter
Based on 3 year standard deviation of the Fund
Low (1) High (25)
9
CANADIAN LARGE CAP EQUITY Code 7143
Manulife Fidelity True North Fund
Consumer Discretionary 6.74%
Industrials 8.89%
Consumer Staples 11.99%
Cash 10.64%
Information Technology 11.66%
Other 12.06%
Energy 15.90%Financials 22.12%
How the underlying fund is invested
Top holdings within the underlying Fund(As at June 30, 2013)
TD Bank 7.20%
Alimentation Couche−Tard 4.03%
Shoppers Drug Mart 3.85%
Royal Bank of Canada 3.70%
Canadian National Railway 3.06%
CGI Group 2.97%
Manulife Financial 2.97%
Suncor Energy 2.83%
Power Corp of Canada 2.62%
Enbridge Inc. 2.56%
Note: All rates of return are shown before investment management fees or taxeshave been deducted.
The rate of return is used only to illustrate the effects of the compound growthrate and is not intended to reflect the future values or returns in the Fund.
UNDERLYING FUND −> Fidelity True North−AObjective The Fund aims to achieve long term capital growth by investing primarily inCanadian equity securities.
Managed by Fidelity Investments Canada ULC
Fund managers Maxime Lemieux
Inception date September 1996Total assets $289.5 million
Historical gross returnsGross rates of return are shown before investment management fees have beendeducted. The solid area represents the gross returns of the Manulife Fund since itsinception in March 2009. To provide further historical information, the shaded arearepresents the returns of the underlying fund for the period before the start date of theManulife Fund.
* Only full calendar year returns are shown.
Overall past performanceThis graph shows how a $10,000 investment in this fund would have changed in value over time, based on grossreturns.
* For illustration purposes only. Includes mutual/pooled fund performance as indicated. Actual fund performance couldbe expected to vary.
Annual compound returns (As at June 30, 2013)
This table shows the historical annual compound total return of the Fund compared withthe S&P/TSX Capped Composite Total Return Index.
1−year 2−year 3−year 5−yearSince
inception
Manulifeinception
date
MLI Fidelity True North Fund 18.65% 6.58% 10.75% − 14.23% Mar 2009
S&P/TSX CappedComposite Total Return
7.90% −1.60% 5.39% −0.53% −
Rate of return expectation Over the long term, the Fund aims to outperform the S&P/TSX Capped Composite Index.
Source: The Globe and Mail Inc.52

Volatility meter
Based on 3 year standard deviation of the Fund
Low (1) High (25)
11
CANADIAN LARGE CAP EQUITY Code 7144
Manulife Fidelity Canadian Disciplined Equity
Cash 2.40%
Telecommunication Services 5.13%
Other 9.47%
Consumer Discretionary 5.67%
Industrials 8.52%
Materials 10.24%
Energy 23.85%Financials 34.72%
How the underlying fund is invested
Top holdings within the underlying Fund(As at June 30, 2013)
TD Bank 8.73%
Royal Bank of Canada 8.17%
Potash Corp. of Saskatchewan 3.37%
Canadian Natural Resources 3.25%
Manulife Financial 2.88%
Enbridge Inc. 2.82%
Cenovus Energy 2.77%
National Bank of Canada 2.76%
Valeant Pharmaceuticals Intl. 2.70%
TransCanada Corp. 2.55%
Primary investment processFundamental, Bottom−up
Equity style and capitalization
Source: Manulife Investment Management Services
Value Core/Blend Growth
Large
Medium
Small
All Cap
Note: All rates of return are shown before investment management fees or taxeshave been deducted.
The rate of return is used only to illustrate the effects of the compound growthrate and is not intended to reflect the future values or returns in the Fund.
UNDERLYING FUND −> Fidelity Cdn Disciplined Equity−OObjective The Fund aims to achieve long term capital growth by investing primarily inCanadian equity securities.
Managed by Fidelity Investments Canada ULC
Fund managers Andrew Marchese, MBA, BSc
Inception date September 1998Total assets $258.6 million
Historical gross returnsGross rates of return are shown before investment management fees have beendeducted. The solid area represents the gross returns of the Manulife Fund since itsinception in March 2009. To provide further historical information, the shaded arearepresents the returns of the underlying fund for the period before the start date of theManulife Fund.
* Only full calendar year returns are shown.
Overall past performanceThis graph shows how a $10,000 investment in this fund would have changed in value over time, based on grossreturns.
* For illustration purposes only. Includes mutual/pooled fund performance as indicated. Actual fund performance couldbe expected to vary.
Annual compound returns (As at June 30, 2013)
This table shows the historical annual compound total return of the Fund compared withthe S&P/TSX Capped Composite Total Return Index.
1−year 2−year 3−year 5−yearSince
inception
Manulifeinception
date
MLI Fidelity Cdn DisciplinedEq
12.94% 0.41% 7.59% − 13.62% Mar 2009
S&P/TSX CappedComposite Total Return
7.90% −1.60% 5.39% −0.53% −
Rate of return expectation Over the long term, the Fund aims to outperform the S&P/TSX Capped Composite Index.
Source: The Globe and Mail Inc.53

Volatility meter
Based on 3 year standard deviation of the underlying fund
Low (1) High (25)
11
CANADIAN LARGE CAP EQUITY Code 7231
Manulife CI Harbour Fund
Industrials 6.28%
Consumer Staples 7.91%
Materials 10.58%
Other 8.07%
Information Technology 9.75%
Cash 12.18%
Energy 19.91%Financials 25.32%
How the underlying fund is invested
Top holdings within the underlying Fund(As at June 30, 2013)
Suncor Energy −
Microsoft −
CIBC −
Bank of Nova Scotia −
Bank of New York Mellon −
Occidental Petroleum −
Diageo PLC −
Canadian National Railway −
George Weston −
Discover Financial Services −
Primary investment processFundamental, Bottom−up
Equity style and capitalization
Source: Manulife Investment Management Services
Value Core/Blend Growth
Large
Medium
Small
All Cap
Note: All rates of return are shown before investment management fees or taxeshave been deducted.
The rate of return is used only to illustrate the effects of the compound growthrate and is not intended to reflect the future values or returns in the Fund.
UNDERLYING FUND −> CI Harbour−IObjective The CI Harbour Fund is managed to obtain maximum long−term capitalgrowth. The Fund invests primarily in equity and equity−related securities of high−quality,large and mid−capitalization Canadian companies that the portfolio advisor believes havegood potential for future growth.
Managed by CI Investments Inc.
Fund managers Stephen Jenkins and Gerald Coleman
Inception date June 1997Total assets $3,163.5 million
Historical gross returnsGross rates of return are shown before investment management fees have beendeducted. The solid area represents the gross returns of the Manulife Fund since itsinception in September 2010. To provide further historical information, the shaded arearepresents the returns of the underlying fund for the period before the start date of theManulife Fund.
* Only full calendar year returns are shown.
Overall past performanceThis graph shows how a $10,000 investment in this fund would have changed in value over time, based on grossreturns.
* For illustration purposes only. Includes mutual/pooled fund performance as indicated. Actual fund performance couldbe expected to vary.
Annual compound returns (As at June 30, 2013)
This table shows the historical annual compound total return of the Fund compared withthe S&P/TSX Total Return.
1−year 2−year 3−year 5−yearSince
inception
Manulifeinception
date
MLI CI Harbour 10.61% 3.10% − − 8.37% Sep 2010
S&P/TSX Total Return 7.90% −1.60% 5.39% −0.53% −
Rate of return expectation Over the long term, the Fund is expected to outperform the S&P/TSX Total Return Index.
Source: The Globe and Mail Inc.
54

Volatility meter
Based on 3 year standard deviation of the Fund
Low (1) High (25)
9
CANADIAN LARGE CAP EQUITY Code 7241
Manulife Jarislowsky Fraser Canadian Equity Fund
Cash 3.20%
Other sectors 7.80%
Other 8.90%
Industrials 8.10%
Consumer Discretionary 9.30%
Consumer Staples 11.00%
Energy 23.40%Financials 28.30%
How the underlying fund is invested
Top holdings within the underlying Fund(As at June 30, 2013)
TD Bank 7.80%
Royal Bank of Canada 6.40%
Bank of Nova Scotia 6.30%
Suncor Energy 4.30%
Metro Inc. 4.00%
Cenovus Energy 3.80%
Canadian National Railway 3.70%
Potash Corp. of Saskatchewan 3.60%
SNC−Lavalin Group 3.40%
Enbridge Inc. 3.20%
Primary investment processFundamental, Bottom−up
Equity style and capitalization
Source: Manulife Investment Management Services
Value Core/Blend Growth
Large
Medium
Small
All Cap
Note: All rates of return are shown before investment management fees or taxeshave been deducted.
The rate of return is used only to illustrate the effects of the compound growthrate and is not intended to reflect the future values or returns in the Fund.
UNDERLYING FUND −> JF Canadian EquityObjective Jarislowsky Fraser’s equity style emphasizes buying long−term growth at areasonable price. Internal resources are primarily relied on to generate investment ideas.Each year, the investment professionals contact and interview more than 200 Canadiancompanies. The portfolio focuses on industry leaders with strong balance sheets andcash flow as well as depth and quality at the management level.
Managed by Jarislowsky Fraser Ltd.
Fund managers Jarislowsky Fraser − Mgmt. Team
Inception date April 1997Total assets $5,236.1 million
Historical gross returnsGross rates of return are shown before investment management fees have beendeducted. The solid area represents the gross returns of the Manulife Fund since itsinception in October 2001.
* Only full calendar year returns are shown.
Overall past performanceThis graph shows how a $10,000 investment in this fund would have changed in value over time, based on grossreturns.
* For illustration purposes only. Includes mutual/pooled fund performance as indicated. Actual fund performance couldbe expected to vary.
Annual compound returns (As at June 30, 2013)
This table shows the historical annual compound total return of the Fund compared withthe S&P/TSX Total Return.
1−year 2−year 3−year 5−yearSince
inception
Manulifeinception
date
MLI JF Canadian Equity 18.20% 4.48% 9.13% 2.61% 9.79% Oct 2001
S&P/TSX Total Return 7.90% −1.60% 5.39% −0.53% −
Rate of return expectation Over the long term, this fund is expected to outperform the S&P/TSX Total Return Index.
Source: The Globe and Mail Inc.
55

Volatility meter
Based on 3 year standard deviation of the Fund
Low (1) High (25)
11
CANADIAN LARGE CAP EQUITY Code 7272
Manulife PH&N Canadian Equity Fund
Cash 0.80%
Information Technology 4.36%
Consumer Discretionary 8.46%
Industrials 7.12%
Other 8.09%
Materials 11.56%
Energy 25.57%Financials 34.04%
How the underlying fund is invested
Top holdings within the underlying Fund(As at June 30, 2013)
PH&N Small Float 16.92%
TD Bank 7.68%
Royal Bank of Canada 6.67%
Bank of Nova Scotia 5.65%
Suncor Energy 3.68%
Canadian Natural Resources 3.50%
TransCanada Corp. 3.35%
Canadian National Railway 3.09%
Cenovus Energy 2.95%
Enbridge Inc. 2.72%
Primary investment processFundamental, Bottom−up
Equity style and capitalization
Source: Manulife Investment Management Services
Value Core/Blend Growth
Large
Medium
Small
All Cap
Note: All rates of return are shown before investment management fees or taxeshave been deducted.
The rate of return is used only to illustrate the effects of the compound growthrate and is not intended to reflect the future values or returns in the Fund.
UNDERLYING FUND −> PH&N Canadian Equity−DObjective The PH&N Canadian Equity Fund is managed to provide significant long−term capital appreciation through investment in equity securities of Canadiancorporations.
Managed by Phillips, Hager & North Inv Mgmt
Fund managers Phillips, Hager & North − Mgmt. Team
Inception date May 1971Total assets $495.1 million
Historical gross returnsGross rates of return are shown before investment management fees have beendeducted. The solid area represents the gross returns of the Manulife Fund since itsinception in January 2006. To provide further historical information, the shaded arearepresents the returns of the underlying fund for the period before the start date of theManulife Fund.
* Only full calendar year returns are shown.
Overall past performanceThis graph shows how a $10,000 investment in this fund would have changed in value over time, based on grossreturns.
* For illustration purposes only. Includes mutual/pooled fund performance as indicated. Actual fund performance couldbe expected to vary.
Annual compound returns (As at June 30, 2013)
This table shows the historical annual compound total return of the Fund compared withthe S&P/TSX Capped Composite Total Return Index.
1−year 2−year 3−year 5−yearSince
inception
Manulifeinception
date
MLI PH&N Canadian Equity 13.20% 0.40% 6.69% 0.42% 3.57% Jan 2006
S&P/TSX CappedComposite Total Return
7.90% −1.60% 5.39% −0.53% −
Rate of return expectation The Fund seeks to outperform the S&P/TSX Capped Composite Index by 1.50% per annum over amarket cycle before management fees.
Source: The Globe and Mail Inc.
56

Volatility meter
Based on 3 year standard deviation of the Fund
Low (1) High (25)
11
CANADIAN LARGE CAP EQUITY Code 7121
Manulife Asset Management Canadian Large CapGrowth Fund
Cash 3.26%
Industrials 9.47%
Materials 9.72%
Consumer Staples 6.83%
Consumer Discretionary 9.56%
Other 9.78%
Energy 19.35%Financials 32.03%
How the underlying fund is invested
Top holdings within the underlying Fund(As at June 30, 2013)
TD Bank 6.90%
Royal Bank of Canada 6.58%
Bank of Nova Scotia 5.76%
Canadian National Railway 5.01%
Suncor Energy 4.33%
Alimentation Couche−Tard 3.78%
Brookfield Asset Management 3.46%
Canadian Natural Resources 3.41%
Magna International 3.38%
Potash Corp. of Saskatchewan 3.15%
Primary investment processFundamental, Bottom−up
Equity style and capitalization
Source: Manulife Investment Management Services
Value Core/Blend Growth
Large
Medium
Small
All Cap
Note: All rates of return are shown before investment management fees or taxeshave been deducted.
The rate of return is used only to illustrate the effects of the compound growthrate and is not intended to reflect the future values or returns in the Fund.
UNDERLYING FUND −> MAM Canadian Large Cap Growth PoolObjective The MMF Canadian Equity Fund seeks to provide long−term capital growth.The Fund invests primarily in equity securities of large, established Canadian companiesand Canadian securities that offer potential for capital growth.
Managed by Manulife Asset Management Limited
Fund managers Shauna Sexsmith, CFA
Inception date August 2006Total assets $81.4 million
Historical gross returnsGross rates of return are shown before investment management fees have beendeducted. The solid area represents the gross returns of the Manulife Fund since itsinception in August 1997. Underlying fund was changed on May 21, 2004 from theElliott & Page Blue Chip Fund to the Elliott & Page Canadian Equity Fund.
* Only full calendar year returns are shown.
Overall past performanceThis graph shows how a $10,000 investment in this fund would have changed in value over time, based on grossreturns.
* For illustration purposes only. Includes mutual/pooled fund performance as indicated. Actual fund performance couldbe expected to vary.
Annual compound returns (As at June 30, 2013)
This table shows the historical annual compound total return of the Fund compared withthe S&P/TSX Total Return.
1−year 2−year 3−year 5−yearSince
inception
Manulifeinception
date
ML MAM Canadian LargeCap Growth
9.09% −1.30% 5.25% −3.48% 6.62% Aug 1997
S&P/TSX Total Return 7.90% −1.60% 5.39% −0.53% −
Rate of return expectation Over the long term, the Fund is expected to outperform the S&P/TSX Total Return Index.
Source: The Globe and Mail Inc.
57

Volatility meter
Based on 3 year standard deviation of the underlying fund
Low (1) High (25)
11
CANADIAN LARGE CAP EQUITY Code 7293
Manulife Guardian Canadian Growth Equity Fund
Consumer Discretionary 13.97%
Information Technology 6.17%
Other 10.72%
Consumer Staples 7.32%
Energy 20.34%
Materials 14.51%Financials 27.66%
Cash −0.69%
How the underlying fund is invested
Top holdings within the underlying Fund(As at June 30, 2013)
Royal Bank of Canada 6.20%
TD Bank 5.85%
Bank of Nova Scotia 5.45%
FUND 3.67%
Canadian Natural Resources 3.65%
Magna International 3.30%
Alimentation Couche−Tard 3.13%
Canadian National Railway 3.13%
Manulife Financial 3.08%
Potash Corp. of Saskatchewan 3.06%
Primary investment processFundamental, Bottom−up
Equity style and capitalization
Source: Manulife Investment Management Services
Value Core/Blend Growth
Large
Medium
Small
All Cap
Note: All rates of return are shown before investment management fees or taxeshave been deducted.
The rate of return is used only to illustrate the effects of the compound growthrate and is not intended to reflect the future values or returns in the Fund.
UNDERLYING FUND −> Guardian Canadian Growth FundObjective The Fund is managed to achieve long−term growth of capital primarilythrough the investment in the Canadian equities with a growth orientation that arereasonably priced. The Fund may invest up to 10% of its market value in individualforeign equities that have either significant business operations in Canada or are listed onthe TSX.
Managed by Guardian Capital LP.
Fund managers Gary Chapman, CFA, MBA, BSc
Inception date August 1986Total assets $239.3 million
Historical gross returnsGross rates of return are shown before investment management fees have beendeducted. The shaded area represents the returns of the underlying fund for the periodbefore the start date of the Manulife Fund.
* Only full calendar year returns are shown.
Overall past performanceThis graph shows how a $10,000 investment in this fund would have changed in value over time, based on grossreturns.
* For illustration purposes only. Includes mutual/pooled fund performance as indicated. Actual fund performance couldbe expected to vary.
Annual compound returns (As at June 30, 2013)
This table shows the historical annual compound total return of the Fund compared withthe S&P/TSX Total Return.
1−year 2−year 3−year 5−yearSince
inception
Manulifeinception
date
MLI Guardian Cdn GrowthEquity
14.55% − − − 14.50% May 2012
S&P/TSX Total Return 7.90% −1.60% 5.39% −0.53% −
Rate of return expectation Over the long term, the Fund is expected to outperform the S&P/TSX Composite Index + 0.2%(annualized) over moving four−year periods.
Source: The Globe and Mail Inc.58

Volatility meter
Based on 3 year standard deviation of the underlying fund
Low (1) High (25)
>25
CANADIAN LARGE CAP EQUITY Code 7313
Manulife CC&L Group Canadian Q Growth Fund
Cash 0.67%
Other 10.39%
Consumer Discretionary 11.11%
Information Technology 5.30%
Materials 10.39%
Industrials 13.05%
Energy 17.23%Financials 31.86%
How the underlying fund is invested
Top holdings within the underlying Fund(As at June 30, 2013)
Royal Bank of Canada 7.09%
Bank of Nova Scotia 3.92%
Canadian National Railway 3.84%
Canadian Pacific Railway 3.73%
TD Bank 3.68%
Valeant Pharmaceuticals Intl. 3.42%
Manulife Financial 2.62%
Sun Life Financial Inc. 2.29%
Catamaran Corp. 2.27%
Enbridge Inc. 2.23%
Primary investment processQuantitative
Equity style and capitalization
Source: Manulife Investment Management Services
Value Core/Blend Growth
Large
Medium
Small
All Cap
Note: All rates of return are shown before investment management fees or taxeshave been deducted.
The rate of return is used only to illustrate the effects of the compound growthrate and is not intended to reflect the future values or returns in the Fund.
UNDERLYING FUND −> CC&L Group Canadian Q Growth FundObjective The CC&L Group Canadian Q Growth Fund is Managed to maximize long−term total return relative to the S&P/TSX Composite Index through prudent selection ofinvestments using a disciplined, risk−controlled quantitative investment approach.
Managed by Connor, Clark & Lunn Investment Management Ltd.
Fund managers Connor, Clark & Lunn − Mgmt. Team
Inception date January 2001Total assets $1,023.4 million
Historical gross returnsGross rates of return are shown before investment management fees have beendeducted. The shaded area represents the returns of a similarly managed fund for theperiod before the start date of the Manulife Fund.
* Only full calendar year returns are shown.
Overall past performanceThis graph shows how a $10,000 investment in this fund would have changed in value over time, based on grossreturns.
* For illustration purposes only. Includes mutual/pooled fund performance as indicated. Actual fund performance couldbe expected to vary.
Annual compound returns (As at June 30, 2013)
This table shows the historical annual compound total return of the Fund compared withthe S&P/TSX Total Return.
1−year 2−year 3−year 5−yearSince
inception
Manulifeinception
date
MLI CC&L Group Cdn QGrowth
16.41% − − − 9.84% May 2012
S&P/TSX Total Return 7.90% −1.60% 5.39% −0.53% −
Rate of return expectation Over the long term, the Fund is expected to outperform the S&P/TSX Composite Index by 2.0 % overmoving four−year periods.
Source: The Globe and Mail Inc.59

Volatility meter
Based on 3 year standard deviation of the Fund
Low (1) High (25)
12
CANADIAN LARGE CAP EQUITY Code 7481
Manulife Greystone Canadian Equity Fund
Cash 1.07%
Consumer Staples 6.85%
Other 9.94%
Industrials 7.45%
Consumer Discretionary 9.21%
Materials 10.87%
Energy 22.81%Financials 31.80%
How the underlying fund is invested
Top holdings within the underlying Fund(As at June 30, 2013)
TD Bank 7.62%
Royal Bank of Canada 7.33%
Bank of Nova Scotia 5.88%
Suncor Energy 5.07%
Canadian National Railway 4.84%
Manulife Financial 4.43%
Enbridge Inc. 3.89%
Magna International 3.75%
Alimentation Couche−Tard 3.14%
Valeant Pharmaceuticals Intl. 2.89%
Primary investment processFundamental, Bottom−up
Equity style and capitalization
Source: Manulife Investment Management Services
Value Core/Blend Growth
Large
Medium
Small
All Cap
Note: All rates of return are shown before investment management fees or taxeshave been deducted.
The rate of return is used only to illustrate the effects of the compound growthrate and is not intended to reflect the future values or returns in the Fund.
UNDERLYING FUND −> Greystone Canadian EquityObjective The Greystone Canadian Equity Fund seeks superior long−term capitalappreciation by investing in the equity securities of Canadian companies.
Managed by Greystone Managed Investments Inc.
Fund managers Greystone Mgd. Invest. − Mgmt. Team
Inception date March 1996Total assets $1,649.9 million
Historical gross returnsGross rates of return are before investment management fees have beendeducted. The solid area represents the gross returns of the Manulife fund since itsinception in March 2007. To provide further historical information, the shaded arearepresents the returns of the underlying fund for the period before the start date of theManulife fund.
* Only full calendar year returns are shown.
Overall past performanceThis graph shows how a $10,000 investment in this fund would have changed in value over time, based on grossreturns.
* For illustration purposes only. Includes mutual/pooled fund performance as indicated. Actual fund performance couldbe expected to vary.
Annual compound returns (As at June 30, 2013)
This table shows the historical annual compound total return of the Fund compared withthe S&P/TSX Capped Composite Total Return Index.
1−year 2−year 3−year 5−yearSince
inception
Manulifeinception
date
MLI Greystone CanadianEquity
10.96% −2.67% 4.43% −3.03% −0.65% Mar 2007
S&P/TSX CappedComposite Total Return
7.90% −1.60% 5.39% −0.53% −
Rate of return expectation The gross rate of return over a full economic cycle is expected to exceed the S&P/TSX CompositeIndex.
Source: The Globe and Mail Inc.60

Volatility meter
Based on 3 year standard deviation of the Fund
Low (1) High (25)
11
CANADIAN LARGE CAP EQUITY Code 7132
Manulife Asset Management Canadian Equity IndexFund
Cash 3.89%
Telecommunication Services 4.94%
Other 8.90%
Consumer Discretionary 5.55%
Industrials 6.94%
Materials 12.70%
Energy 23.81%Financials 33.27%
How the underlying fund is invested
Top holdings within the underlying Fund(As at June 30, 2013)
Royal Bank of Canada 5.73%
TD Bank 5.05%
Bank of Nova Scotia 4.36%
Suncor Energy 3.02%
Canadian National Railway 2.81%
Bank of Montreal 2.56%
Enbridge Inc. 2.36%
Potash Corp. of Saskatchewan 2.25%
BCE Inc. 2.17%
Canadian Natural Resources 2.09%
Primary investment processIndex
Equity style and capitalization
Source: Manulife Investment Management Services
Value Core/Blend Growth
Large
Medium
Small
All Cap
Note: All rates of return are shown before investment management fees or taxeshave been deducted.
The rate of return is used only to illustrate the effects of the compound growthrate and is not intended to reflect the future values or returns in the Fund.
UNDERLYING FUND −> MAM Cdn Eq Index Pooled FundObjective The MAM Canadian Equity Index Pooled Fund seeks to track the total returnof the S&P/ TSX Composite Index through investments primarily in common stocks,Income Trusts Royalty trusts, REITS of Canadian issuers which are listed on the S&P/ TSXComposite Index. This is a passively managed fund.
Managed by Manulife Asset Management Limited
Fund managers Carson Jen and Ashikhusein Shahpurwala
Inception date January 1998Total assets $565.2 million
Historical gross returnsGross rates of return are shown before investment management fees have beendeducted. The solid area represents the gross returns of the Manulife Fund since itsinception in January 1998.
* Only full calendar year returns are shown.
Overall past performanceThis graph shows how a $10,000 investment in this fund would have changed in value over time, based on grossreturns.
* For illustration purposes only. Includes mutual/pooled fund performance as indicated. Actual fund performance couldbe expected to vary.
Annual compound returns (As at June 30, 2013)
This table shows the historical annual compound total return of the Fund compared withthe S&P/TSX Total Return.
1−year 2−year 3−year 5−yearSince
inception
Manulifeinception
date
MLI MAM Canadian EquityIndex
7.89% −1.64% 5.37% −0.42% 6.39% Jan 1998
S&P/TSX Total Return 7.90% −1.60% 5.39% −0.53% −
Rate of return expectation Over the long term, the Fund is expected to track the performance of the S&P/TSX Total Return Index.
Source: The Globe and Mail Inc.61

Volatility meter
Based on 3 year standard deviation of the Fund
Low (1) High (25)
13
CANADIAN SMALL/MID CAP EQUITY Code 7381
Manulife FGP Small Cap Canadian Equity Fund
Cash 3.99%
Other 7.98%
Financials 15.94%
Consumer Discretionary 16.03%
Materials 10.56%
Consumer Staples 8.54%
Energy 16.99%Industrials 19.97%
How the underlying fund is invested
Top holdings within the underlying Fund(As at June 30, 2013)
FGP Short Term Investment Fund 4.39%Transcontinental Inc. 4.35%Savanna Energy Services 3.91%Algoma Central 3.72%Equitable Group 3.68%E−L Financial Corporation 3.55%Akita Drilling 3.51%Canfor Pulp Products 3.50%Total Energy Services 3.31%Molson Coors Brewing 3.28%PHX Energy Services 3.23%Uranium Participation 3.11%Calfrac Well Services 3.02%Cascades Inc. 2.96%Uni−Select Inc. 2.85%Sherritt International 2.76%Rocky Mountain Dealerships 2.76%Dorel Industries 2.56%Calian Technologies 2.47%Glacier Media 2.36%
Primary investment processFundamental, Bottom−up
Equity style and capitalization
Source: Manulife Investment Management Services
Value Core/Blend Growth
Large
Medium
Small
All Cap
Note: All rates of return are shown before investment management fees or taxeshave been deducted.
The rate of return is used only to illustrate the effects of the compound growthrate and is not intended to reflect the future values or returns in the Fund.
UNDERLYING FUND −> FGP Small Cap Canadian EquityObjective The FGP Small Cap Canadian Equity Fund aims to generate an attractive totalinvestment return through long−term capital growth as well as dividend and otherincome. To achieve this, the Fund will invest in a diversified mix of Canadian equitysecurities.
Managed by Foyston, Gordon and Payne, Inc.
Fund managers Bryan Pilsworth, CFA, MBA
Inception date June 2002Total assets $314.8 million
Historical gross returnsGross rates of return are shown before investment management fees have beendeducted. The solid area represents the gross returns of the Manulife Fund since itsinception in June 2008. To provide further historical information, the shaded arearepresents the returns of the underlying fund for the period before the start date of theManulife Fund.
* Only full calendar year returns are shown.
Overall past performanceThis graph shows how a $10,000 investment in this fund would have changed in value over time, based on grossreturns.
* For illustration purposes only. Includes mutual/pooled fund performance as indicated. Actual fund performance couldbe expected to vary.
Annual compound returns (As at June 30, 2013)
This table shows the historical annual compound total return of the Fund compared withthe BMO Nesbitt Burns Canadian Small Cap Index.
1−year 2−year 3−year 5−yearSince
inception
Manulifeinception
date
MLI FGP Small Cap CdnEquity
17.17% 6.48% 12.52% 6.13% 6.08% Jun 2008
BMO Nesbitt Burns CdnSmall Cap Index
2.12% −7.25% 4.09% 1.74% −
Rate of return expectation The Fund is expected to exceed the return of the BMO Nesbitt Burns Canadian Small Cap Index overfour to five year periods.
Source: The Globe and Mail Inc.62

Volatility meter
Based on 3 year standard deviation of the Fund
Low (1) High (25)
16
CANADIAN SMALL/MID CAP EQUITY Code 7122
Manulife MMF Growth Opportunities Fund
Cash 2.64%
Other 7.77%
Financials 9.85%
Information Technology 8.83%
Consumer Discretionary 13.74%
Materials 16.42%
Energy 19.59%Industrials 21.16%
How the underlying fund is invested
Top holdings within the underlying Fund(As at June 30, 2013)
Black Diamond Group 3.92%
Linamar Corp. 3.69%
Gran Tierra Energy 2.95%
Stella−Jones Inc. 2.81%
ShawCor Ltd. 2.37%
Tourmaline Oil 2.32%
Bombardier Inc. 2.32%
Richelieu Hardware 2.25%
Celestica Inc. 2.24%
CCL Industries 2.17%
Primary investment processFundamental, Bottom−up
Equity style and capitalization
Source: Manulife Investment Management Services
Value Core/Blend Growth
Large
Medium
Small
All Cap
Note: All rates of return are shown before investment management fees or taxeshave been deducted.
The rate of return is used only to illustrate the effects of the compound growthrate and is not intended to reflect the future values or returns in the Fund.
UNDERLYING FUND −> Manulife Growth Opportunities FundObjective The MMF Growth Opportunities Fund seeks to provide long−term capitalgrowth by investing primarily in high quality securities and convertible instruments ofsmall and mid−cap Canadian companies.
Managed by Manulife Asset Management Limited
Fund managers Ted Whitehead, CFA and Luciano Orengo, CFA
Inception date November 1998Total assets $462.7 million
Historical gross returnsGross rates of return are shown before investment management fees have beendeducted. The solid area represents the gross returns of the Manulife Fund since itsinception in August 1997. The underlying fund was changed on June 1, 2003 from theElliott & Page Emerging Growth Fund to the Elliott & Page Growth Opportunities Fund.
* Only full calendar year returns are shown.
Overall past performanceThis graph shows how a $10,000 investment in this fund would have changed in value over time, based on grossreturns.
* For illustration purposes only. Includes mutual/pooled fund performance as indicated. Actual fund performance couldbe expected to vary.
Annual compound returns (As at June 30, 2013)
This table shows the historical annual compound total return of the Fund compared withthe BMO Nesbitt Burns Canadian Small Cap Index.
1−year 2−year 3−year 5−yearSince
inception
Manulifeinception
date
MLI MMF GrowthOpportunities
10.08% −2.70% 5.13% 2.15% 6.87% Aug 1997
BMO Nesbitt Burns CdnSmall Cap Index
2.12% −7.25% 4.09% 1.74% −
Rate of return expectation Over the long term, the Fund is expected to outperform the BMO Nesbitt Burns Canadian Small CapIndex.
Source: The Globe and Mail Inc.63

64
U.S. Equity
U.S. Equity funds are a form of foreign equity and invest in shares of U.S. companies.
These types of funds typically aim to achieve long-term capital growth by investing in shares of companies based in the United
States. A share represents an ownership stake in the company; therefore, how the Fund performs depends on the success of the
company holdings within the Fund. The Fund’s performance can also be affected by such factors as currency exchange rates and
economic and political trends.
These funds are ideal for investors who have a long-term focus, want to include U.S. holdings in their portfolios, and are
comfortable with a higher-than-average level of volatility.
U.S. Equity funds can vary greatly depending on such factors as the size and types of companies in which they invest and the
selection criteria used by the fund manager.
FUND PAGE
CODE NUMBER
U.S. Large Cap Equity
ValueManulife CI American Value Fund 8231 65
Manulife Beutel Goodman American Equity Fund 8631 66
Core/BlendManulife Asset Management U.S. Large Cap Core Fund 8132 67
Manulife Fidelity Growth America Fund 8142 68
Manulife Mawer U.S. Equity Fund 8451 69
Manulife MFS U.S. Equity Core Fund 8683 70
GrowthManulife Fidelity American Disciplined Equity 8143 71
Manulife U.S. Diversified Growth Equity Fund (Wellington) 8196 72
IndexManulife Asset Management U.S. Equity Index Fund 8131 73
Manulife BlackRock U.S. Equity Index Fund (RPO) 8322 74

Volatility meter
Based on 3 year standard deviation of the underlying fund
Low (1) High (25)
9
U.S. LARGE CAP EQUITY Code 8231
Manulife CI American Value Fund
Cash 3.67%
Energy 8.66%
Health Care 12.10%
Industrials 8.67%
Consumer Discretionary 13.73%
Other 17.10%
Information Technology 17.17%Financials 18.90%
How the underlying fund is invested
Top holdings within the underlying Fund(As at June 30, 2013)
Microsoft 3.46%
Boeing Co. 2.82%
Blackrock Inc. 2.74%
Apple 2.53%
Exxon Mobil 2.49%
Visa Inc. 2.37%
UnitedHealth Group 2.25%
Oracle Corp. 2.25%
DaVita HealthCare Partners 2.24%
Danaher Corp. 2.22%
Primary investment processFundamental, Bottom−up
Equity style and capitalization
Source: Manulife Investment Management Services
Value Core/Blend Growth
Large
Medium
Small
All Cap
Note: All rates of return are shown before investment management fees or taxeshave been deducted.
The rate of return is used only to illustrate the effects of the compound growthrate and is not intended to reflect the future values or returns in the Fund.
UNDERLYING FUND −> CI American Value−IObjective The CI American Value Fund is managed to achieve long−term capitalgrowth by investing primarily in a broadly diversified portfolio of American equitysecurities.
Managed by CI Investments Inc.
Fund managers William Priest and David Pearl
Inception date May 1957Total assets $240.2 million
Historical gross returnsGross rates of return are shown before investment management fees have beendeducted. The solid area represents the gross returns of the Manulife Fund since itsinception in September 2010. To provide further historical information, the shaded arearepresents the returns of the underlying fund for the period before the start date of theManulife Fund.
* Only full calendar year returns are shown.
Overall past performanceThis graph shows how a $10,000 investment in this fund would have changed in value over time, based on grossreturns.
* For illustration purposes only. Includes mutual/pooled fund performance as indicated. Actual fund performance couldbe expected to vary.
Annual compound returns (As at June 30, 2013)
This table shows the historical annual compound total return of the Fund compared withthe S&P 500 Composite Total Return Index ($ Cdn).
1−year 2−year 3−year 5−yearSince
inception
Manulifeinception
date
MLI CI American Value 24.11% 15.92% − − 16.88% Sep 2010
S&P 500 Composite TotalReturn Idx($Cdn)
24.59% 17.74% 18.10% 7.69% −
Rate of return expectation Over the long term, the Fund is expected to outperform the S&P 500 Total Return Index ($ Cdn).
Source: The Globe and Mail Inc.
65

Volatility meter U.S. LARGE CAP EQUITY Code 8631
Manulife Beutel Goodman American Equity Fund
How the underlying fund is invested
Top holdings within the underlying Fund
Primary investment process
Equity style and capitalizationValue Core/Blend Growth
Large
Medium
Small
All Cap
Beutel Goodman American Equity−IObjective
Managed by
Fund managers
Inception date Total assets
Historical gross returnsGross rates of return are shown before investment management fees have beendeducted.
Overall past performance
Annual compound returns
1−year 2−year 3−year 5−yearSince
inception
Manulifeinception
date
Rate of return expectation
66

Code 8631 Volatility meter
Based on 3 year standard deviation of the Fund
Low (1) High (25)
10
U.S. LARGE CAP EQUITY Code 8132
Manulife Asset Management U.S. Large Cap Core Fund
Cash 2.79%
Consumer Staples 6.15%
Health Care 7.24%
Other 7.18%
Energy 11.09%
Consumer Discretionary 12.61%
Information Technology 25.86%Financials 27.08%
How the underlying fund is invested
Top holdings within the underlying Fund(As at June 30, 2013)
JP Morgan Chase & Co. 5.32%
Amazon.com 5.16%
Apple 4.63%
Qualcomm 4.39%
Bank of America 4.29%
Lowes Companies 3.53%
Google 3.53%
Goldman Sachs 3.40%
Cisco Systems 3.24%
Intel 3.14%
Primary investment processQuantitative
Equity style and capitalization
Source: Manulife Investment Management Services
Value Core/Blend Growth
Large
Medium
Small
All Cap
Note: All rates of return are shown before investment management fees or taxeshave been deducted.
The rate of return is used only to illustrate the effects of the compound growthrate and is not intended to reflect the future values or returns in the Fund.
UNDERLYING FUND −> MAM US Large Cap Core Pooled FundObjective The MAM US Large Cap Core Pooled Fund seeks long−term capital growthby investing primarily in large cap U.S. securities with the potential for long−term growthof capital. The fund may also invest in mid−capitalization companies.
Managed by Manulife Asset Management Limited
Fund managers Sandy Sanders, CFA and Walter McCormick, CFA
Inception date January 1998Total assets $50.8 million
Historical gross returnsGross rates of return are shown before investment management fees have beendeducted. The solid area represents the gross returns of the Manulife Fund since itsinception in September 1998.
* Only full calendar year returns are shown.
Overall past performanceThis graph shows how a $10,000 investment in this fund would have changed in value over time, based on grossreturns.
* For illustration purposes only. Includes mutual/pooled fund performance as indicated. Actual fund performance couldbe expected to vary.
Annual compound returns (As at June 30, 2013)
This table shows the historical annual compound total return of the Fund compared withthe S&P 500 Composite Total Return Index ($ Cdn).
1−year 2−year 3−year 5−yearSince
inception
Manulifeinception
date
MLI MAM U.S. Large CapCore
27.59% 18.45% 19.22% 7.83% 2.94% Sep 1998
S&P 500 Composite TotalReturn Idx($Cdn)
24.59% 17.74% 18.10% 7.69% −
Rate of return expectation Over the long term, the Fund is expected to outperform the S&P 500 Total Return Index ($ Cdn).
Source: The Globe and Mail Inc.
67

Volatility meter
Based on 3 year standard deviation of the Fund
Low (1) High (25)
10
U.S. LARGE CAP EQUITY Code 8142
Manulife Fidelity Growth America Fund
Cash 3.29%
Energy 9.13%
Information Technology 11.46%
Industrials 11.16%
Other 11.53%
Financials 15.70%
Health Care 17.82%Consumer Discretionary 19.91%
How the underlying fund is invested
Top holdings within the underlying Fund(As at June 30, 2013)
Google 5.04%
Citigroup 4.95%
Cabot Oil & Gas 4.86%
Visa Inc. 4.80%
Bank of America 3.71%
Biogen IDEC 3.50%
Onyx Pharmaceuticals 3.41%
Pioneer Natural Resources 3.40%
Gap Inc. 2.98%
Home Depot 2.93%
Primary investment processFundamental, Bottom−up
Equity style and capitalization
Source: Manulife Investment Management Services
Value Core/Blend Growth
Large
Medium
Small
All Cap
Note: All rates of return are shown before investment management fees or taxeshave been deducted.
The rate of return is used only to illustrate the effects of the compound growthrate and is not intended to reflect the future values or returns in the Fund.
UNDERLYING FUND −> Fidelity U.S. Focused Stock−AObjective The Fidelity Growth America Fund aims to achieve long−term capital growth.It invests primarily in equity securities of U.S. companies.
Managed by Fidelity Investments Canada ULC
Fund managers Steve DuFour
Inception date September 1990Total assets $217.9 million
Historical gross returnsGross rates of return are shown before investment management fees have beendeducted. The solid area represents the gross returns of the Manulife Fund since itsinception in July 1997.
* Only full calendar year returns are shown.
Overall past performanceThis graph shows how a $10,000 investment in this fund would have changed in value over time, based on grossreturns.
* For illustration purposes only. Includes mutual/pooled fund performance as indicated. Actual fund performance couldbe expected to vary.
Annual compound returns (As at June 30, 2013)
This table shows the historical annual compound total return of the Fund compared withthe S&P 500 Composite Total Return Index ($ Cdn).
1−year 2−year 3−year 5−yearSince
inception
Manulifeinception
date
MLI Fidelity Growth America 22.48% 13.90% 15.73% 5.46% 2.61% Jul 1997
S&P 500 Composite TotalReturn Idx($Cdn)
24.59% 17.74% 18.10% 7.69% −
Rate of return expectation The Fund seeks to achieve returns comparable to, or better than, the S&P 500 Total Return Index($ Cdn).
Source: The Globe and Mail Inc.
68

Volatility meter
Based on 3 year standard deviation of the underlying fund
Low (1) High (25)
9
U.S. LARGE CAP EQUITY Code 8451
Manulife Mawer U.S. Equity Fund
Cash 6.30%
Consumer Staples 8.65%
Other 11.93%
Health Care 9.88%
Industrials 11.17%
Information Technology 14.00%
Consumer Discretionary 14.81%Financials 23.26%
How the underlying fund is invested
Top holdings within the underlying Fund(As at June 30, 2013)
Gov’t of Canada, July 2013 3.78%
AmTrust Financial Services 3.72%
Wells Fargo & Co. 3.63%
Becton Dickinson 3.60%
Google 3.31%
JP Morgan Chase & Co. 3.30%
Exxon Mobil 3.25%
Chevron Corp. 3.24%
IBM Corp. 3.15%
Oracle Corp. 3.03%
Primary investment processFundamental, Bottom−up
Equity style and capitalization
Source: Manulife Investment Management Services
Value Core/Blend Growth
Large
Medium
Small
All Cap
Note: All rates of return are shown before investment management fees or taxeshave been deducted.
The rate of return is used only to illustrate the effects of the compound growthrate and is not intended to reflect the future values or returns in the Fund.
UNDERLYING FUND −> Mawer U.S. Equity−OObjective The objective of the Mawer U.S. Equity Fund is to invest for above−averagelong−term rates of return from both capital gains and dividend income from commonshares of U.S. companies. Treasury bills or short−term investments, not exceeding threeyears to maturity, may also be used from time to time.
Managed by Mawer Investment Management Ltd.
Fund managers Grayson Witcher, CFA
Inception date December 1992Total assets $91.6 million
Historical gross returnsGross rates of return are shown before investment management fees have beendeducted. The solid area represents the gross returns of the Manulife Fund since itsinception in September 2010. To provide historical information, the shaded arearepresents the returns of the underlying fund for the period before the start date of theManulife Fund.
* Only full calendar year returns are shown.
Overall past performanceThis graph shows how a $10,000 investment in this fund would have changed in value over time, based on grossreturns.
* For illustration purposes only. Includes mutual/pooled fund performance as indicated. Actual fund performance couldbe expected to vary.
Annual compound returns (As at June 30, 2013)
This table shows the historical annual compound total return of the Fund compared withthe S&P 500 Composite Total Return Index ($ Cdn).
1−year 2−year 3−year 5−yearSince
inception
Manulifeinception
date
MLI Mawer U.S. Equity 28.84% 19.09% − − 19.22% Sep 2010
S&P 500 Composite TotalReturn Idx($Cdn)
24.59% 17.74% 18.10% 7.69% −
Rate of return expectation The performance benchmark is the S&P 500 Index (C$). The performance goal is to exceed the S&P500 Index by at least 2% over 4−year moving time periods.
Source: The Globe and Mail Inc.
Code 8142
69

Volatility meter
Based on 3 year standard deviation of the underlying fund
Low (1) High (25)
9
U.S. LARGE CAP EQUITY Code 8683
Manulife MFS U.S. Equity Core Fund
Cash 1.72%
Consumer Staples 10.11%
Consumer Discretionary 12.45%
Health Care 11.88%
Other 14.78%
Financials 15.54%
Information Technology 16.11%Industrials 17.41%
How the underlying fund is invested
Top holdings within the underlying Fund(As at June 30, 2013)
JP Morgan Chase & Co. 2.88%Danaher Corp. 2.66%Johnson & Johnson 2.44%Pfizer 2.44%Apple 2.27%Google 2.26%Exxon Mobil 2.24%Procter & Gamble 2.15%Walt Disney 2.01%Visa Inc. 1.99%Wells Fargo & Co. 1.98%EMC Corp. 1.94%ACE Ltd. 1.84%Honeywell International 1.84%American Express 1.79%
Primary investment processFundamental, Bottom−up
Equity style and capitalization
Source: Manulife Investment Management Services
Value Core/Blend Growth
Large
Medium
Small
All Cap
Note: All rates of return are shown before investment management fees or taxeshave been deducted.
The rate of return is used only to illustrate the effects of the compound growthrate and is not intended to reflect the future values or returns in the Fund.
UNDERLYING FUND −> MFS MB U.S. Equity CoreObjective The Fund seeks to provide capital appreciation through an actively managed,diversified portfolio of primarily US companies, purchased at reasonable prices, is themost effective means of delivering consistent, long−term outperformance on a risk−adjusted basis.
Managed by MFS McLean Budden Limited
Fund managers MFS McLean Budden − Mgmt. Team
Inception date August 1983Total assets $162.5 million
Historical gross returnsGross rates of return are shown before investment management fees have beendeducted. The shaded area represents the returns of the underlying fund for the periodbefore the start date of the Manulife Fund.
* Only full calendar year returns are shown.
Overall past performanceThis graph shows how a $10,000 investment in this fund would have changed in value over time, based on grossreturns.
* For illustration purposes only. Includes mutual/pooled fund performance as indicated. Actual fund performance couldbe expected to vary.
Annual compound returns (As at June 30, 2013)
This table shows the historical annual compound total return of the Fund compared withthe S&P 500 Index ($ Cdn) (net dividends).
1−year 2−year 3−year 5−yearSince
inception
Manulifeinception
date
MLI MFS U.S. Equity Core − − − − 0.00% Jun 2013
S&P 500 Index ($ Cdn) (netdividends)
23.96% 17.16% 17.48% 7.04% −
Rate of return expectation The Fund strives to outperform the S&P 500 Index (Net Dividends Reinvested) over a full market cycle,typically defined as three to five years.
Source: The Globe and Mail Inc.
70

Volatility meter
Based on 3 year standard deviation of the Fund
Low (1) High (25)
10
U.S. LARGE CAP EQUITY Code 8143
Manulife Fidelity American Disciplined Equity
Cash 1.22%
Consumer Staples 9.05%
Consumer Discretionary 15.98%
Industrials 9.11%
Health Care 11.51%
Financials 16.55%
Information Technology 17.38%Other 19.20%
How the underlying fund is invested
Top holdings within the underlying Fund(As at June 30, 2013)
Apple 3.47%
Exxon Mobil 3.41%
CVS Caremark 2.98%
JP Morgan Chase & Co. 2.61%
Microsoft 2.61%
Procter & Gamble 2.34%
Pepsico Inc. 1.84%
Citigroup 1.70%
Twenty First Century Fox, Inc. 1.67%
INVESCO Inc. 1.64%
Note: All rates of return are shown before investment management fees or taxeshave been deducted.
The rate of return is used only to illustrate the effects of the compound growthrate and is not intended to reflect the future values or returns in the Fund.
UNDERLYING FUND −> Fidelity Amer Disciplined Equity−AObjective The Fund aims to achieve long term capital growth by investing primarily inU.S. equity securities.
Managed by Fidelity Investments Canada ULC
Fund managers Young Chin
Inception date July 2002Total assets $53.4 million
Historical gross returnsGross rates of return are shown before investment management fees have beendeducted. The solid area represents the gross returns of the Manulife Fund since itsinception in March 2009. To provide further historical information, the shaded arearepresents the returns of the underlying fund for the period before the start date of theManulife Fund.
* Only full calendar year returns are shown.
Overall past performanceThis graph shows how a $10,000 investment in this fund would have changed in value over time, based on grossreturns.
* For illustration purposes only. Includes mutual/pooled fund performance as indicated. Actual fund performance couldbe expected to vary.
Annual compound returns (As at June 30, 2013)
This table shows the historical annual compound total return of the Fund compared withthe S&P 500 Composite Total Return Index ($ Cdn).
1−year 2−year 3−year 5−yearSince
inception
Manulifeinception
date
MLI Fidelity American Disci.Eq
23.49% 14.36% 15.98% − 13.67% Mar 2009
S&P 500 Composite TotalReturn Idx($Cdn)
24.59% 17.74% 18.10% 7.69% −
Rate of return expectation The Fund is expected to outperform the S&P 500 Total Return Index ($ Cdn).
Source: The Globe and Mail Inc.
71
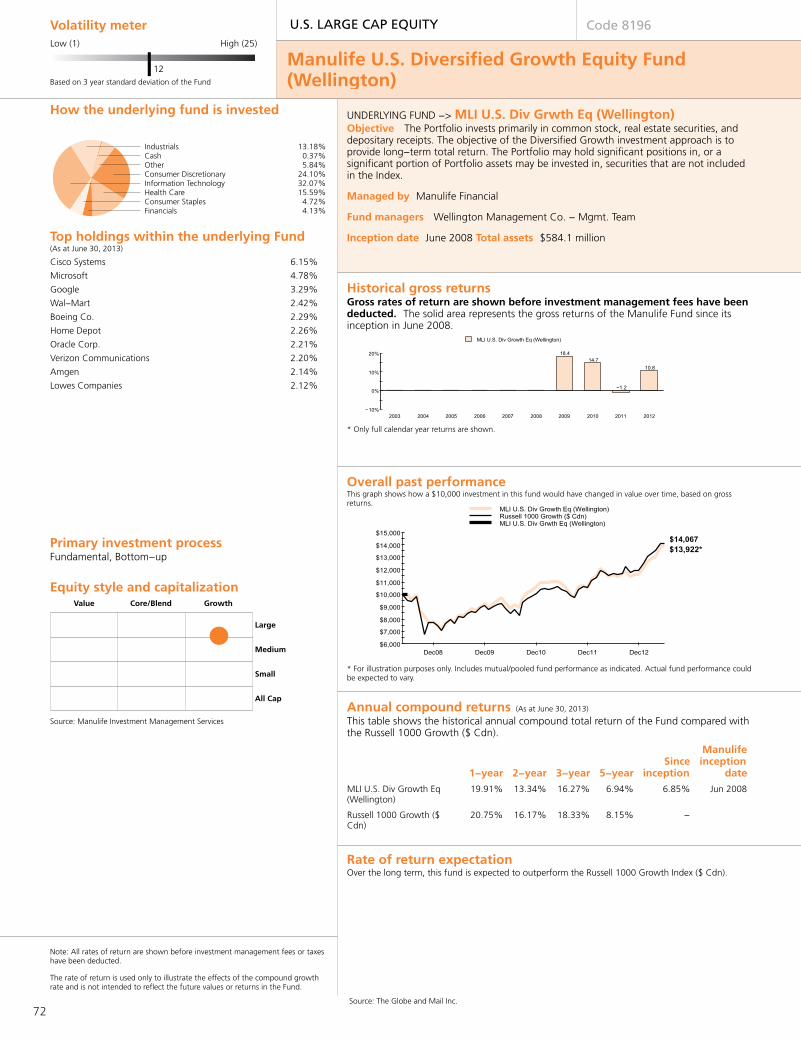
Volatility meter
Based on 3 year standard deviation of the Fund
Low (1) High (25)
12
U.S. LARGE CAP EQUITY Code 8196
Manulife U.S. Diversified Growth Equity Fund(Wellington)
Industrials 13.18%
Financials 4.13%
Cash 0.37%
Consumer Staples 4.72%
Other 5.84%
Health Care 15.59%
Consumer Discretionary 24.10%Information Technology 32.07%
How the underlying fund is invested
Top holdings within the underlying Fund(As at June 30, 2013)
Cisco Systems 6.15%
Microsoft 4.78%
Google 3.29%
Wal−Mart 2.42%
Boeing Co. 2.29%
Home Depot 2.26%
Oracle Corp. 2.21%
Verizon Communications 2.20%
Amgen 2.14%
Lowes Companies 2.12%
Primary investment processFundamental, Bottom−up
Equity style and capitalization
Source: Manulife Investment Management Services
Value Core/Blend Growth
Large
Medium
Small
All Cap
Note: All rates of return are shown before investment management fees or taxeshave been deducted.
The rate of return is used only to illustrate the effects of the compound growthrate and is not intended to reflect the future values or returns in the Fund.
UNDERLYING FUND −> MLI U.S. Div Grwth Eq (Wellington)Objective The Portfolio invests primarily in common stock, real estate securities, anddepositary receipts. The objective of the Diversified Growth investment approach is toprovide long−term total return. The Portfolio may hold significant positions in, or asignificant portion of Portfolio assets may be invested in, securities that are not includedin the Index.
Managed by Manulife Financial
Fund managers Wellington Management Co. − Mgmt. Team
Inception date June 2008Total assets $584.1 million
Historical gross returnsGross rates of return are shown before investment management fees have beendeducted. The solid area represents the gross returns of the Manulife Fund since itsinception in June 2008.
* Only full calendar year returns are shown.
Overall past performanceThis graph shows how a $10,000 investment in this fund would have changed in value over time, based on grossreturns.
* For illustration purposes only. Includes mutual/pooled fund performance as indicated. Actual fund performance couldbe expected to vary.
Annual compound returns (As at June 30, 2013)
This table shows the historical annual compound total return of the Fund compared withthe Russell 1000 Growth ($ Cdn).
1−year 2−year 3−year 5−yearSince
inception
Manulifeinception
date
MLI U.S. Div Growth Eq(Wellington)
19.91% 13.34% 16.27% 6.94% 6.85% Jun 2008
Russell 1000 Growth ($Cdn)
20.75% 16.17% 18.33% 8.15% −
Rate of return expectation Over the long term, this fund is expected to outperform the Russell 1000 Growth Index ($ Cdn).
Source: The Globe and Mail Inc.
72

Volatility meter
Based on 3 year standard deviation of the Fund
Low (1) High (25)
8
U.S. LARGE CAP EQUITY Code 8131
Manulife Asset Management U.S. Equity Index Fund
Cash 4.24%
Energy 9.87%
Health Care 11.89%
Industrials 10.55%
Consumer Discretionary 13.56%
Information Technology 15.78%
Financials 16.03%Other 18.08%
How the underlying fund is invested
Top holdings within the underlying Fund(As at June 30, 2013)
Exxon Mobil 2.69%
Apple 2.49%
Microsoft 1.74%
Johnson & Johnson 1.61%
General Electric 1.60%
Google 1.58%
Chevron Corp. 1.54%
Procter & Gamble 1.41%
Berkshire Hathaway 1.37%
Wells Fargo & Co. 1.36%
Primary investment processIndex
Equity style and capitalization
Source: Manulife Investment Management Services
Value Core/Blend Growth
Large
Medium
Small
All Cap
Note: All rates of return are shown before investment management fees or taxeshave been deducted.
The rate of return is used only to illustrate the effects of the compound growthrate and is not intended to reflect the future values or returns in the Fund.
UNDERLYING FUND −> MAM US Equity Index Pooled FundObjective The Fund aims to achieve investment results that approximate the totalreturn of the S&P 500 Stock Index. To achieve its investment objective, the Fund willinvest directly in common shares and may use derivative instruments such as futures inorder to replicate the returns of the S&P 500 Stock Index. The Fund may also invest aportion of its funds in cash. This is a passively managed fund.
Managed by Manulife Asset Management Limited
Fund managers Carson Jen and Ashikhusein Shahpurwala
Inception date January 1998Total assets $334.0 million
Historical gross returnsGross rates of return are shown before investment management fees have beendeducted. The solid area represents the gross returns of the Manulife Fund since itsinception in January 1998.
* Only full calendar year returns are shown.
Overall past performanceThis graph shows how a $10,000 investment in this fund would have changed in value over time, based on grossreturns.
* For illustration purposes only. Includes mutual/pooled fund performance as indicated. Actual fund performance couldbe expected to vary.
Annual compound returns (As at June 30, 2013)
This table shows the historical annual compound total return of the Fund compared withthe S&P 500 Net of 15% Tax ($ Cdn).
1−year 2−year 3−year 5−yearSince
inception
Manulifeinception
date
MLI MAM U.S. Equity Index 24.32% 17.46% 17.79% 7.44% 2.95% Jan 1998
S&P 500 Net of 15% Tax 24.39% 17.42% 17.80% 7.37% −
Rate of return expectation Over the long term, the Fund is expected to track the performance of the S&P 500 Total Return Index($ Cdn).
Source: The Globe and Mail Inc.
73

Volatility meter
Based on 3 year standard deviation of the Fund
Low (1) High (25)
8
U.S. LARGE CAP EQUITY Code 8322
Manulife BlackRock U.S. Equity Index Fund(Registered Plans Only)
Cash 0.18%
Energy 10.23%
Health Care 12.41%
Industrials 11.00%
Consumer Discretionary 14.13%
Information Technology 16.45%
Financials 16.77%Other 18.83%
How the underlying fund is invested
Top holdings within the underlying Fund(As at June 30, 2013)
Exxon Mobil 2.80%
Apple 2.59%
Microsoft 1.81%
Johnson & Johnson 1.68%
General Electric 1.67%
Google 1.65%
Chevron Corp. 1.60%
Procter & Gamble 1.47%
Berkshire Hathaway 1.42%
Wells Fargo & Co. 1.42%
Primary investment processIndex
Equity style and capitalization
Source: Manulife Investment Management Services
Value Core/Blend Growth
Large
Medium
Small
All Cap
Note: All rates of return are shown before investment management fees or taxeshave been deducted.
The rate of return is used only to illustrate the effects of the compound growthrate and is not intended to reflect the future values or returns in the Fund.
UNDERLYING FUND −> BlackRock CDN US Eq Idx Non−Tax DObjective The BlackRock U.S. Equity Index Fund seeks to achieve investment resultsthat approximate the total return of the S&P 500 Index. To provide broad diversificationand closely track the S&P 500 Index, the Fund invests very close to the actual indexweights for each security in the index.
Managed by BlackRock Asset Management Canada Limited
Fund managers Ed Corallo, Shaun Ong, CFA, Marsha Jong, CFA and Jennifer Hsui, CFA
Inception date December 1998Total assets $4,127.7 million
Historical gross returnsGross rates of return are shown before investment management fees have beendeducted. The solid area represents the gross returns of the Manulife fund since itsinception in October 2006. To provide further historical information, the shaded arearepresents the returns of the underlying fund for the period before the start date of theManulife fund.
* Only full calendar year returns are shown.
Overall past performanceThis graph shows how a $10,000 investment in this fund would have changed in value over time, based on grossreturns.
* For illustration purposes only. Includes mutual/pooled fund performance as indicated. Actual fund performance couldbe expected to vary.
Annual compound returns (As at June 30, 2013)
This table shows the historical annual compound total return of the Fund compared withthe S&P 500 Composite Total Return Index ($ Cdn).
1−year 2−year 3−year 5−yearSince
inception
Manulifeinception
date
MLI BR U.S. Equity Index 24.73% 17.86% 18.15% 7.92% 4.18% Oct 2006
S&P 500 Composite TotalReturn Idx($Cdn)
24.59% 17.74% 18.10% 7.69% −
Rate of return expectation Over the long term, the Fund is expected to track the performance of the S&P 500 Total Return Index($ Cdn).
Source: The Globe and Mail Inc.
74
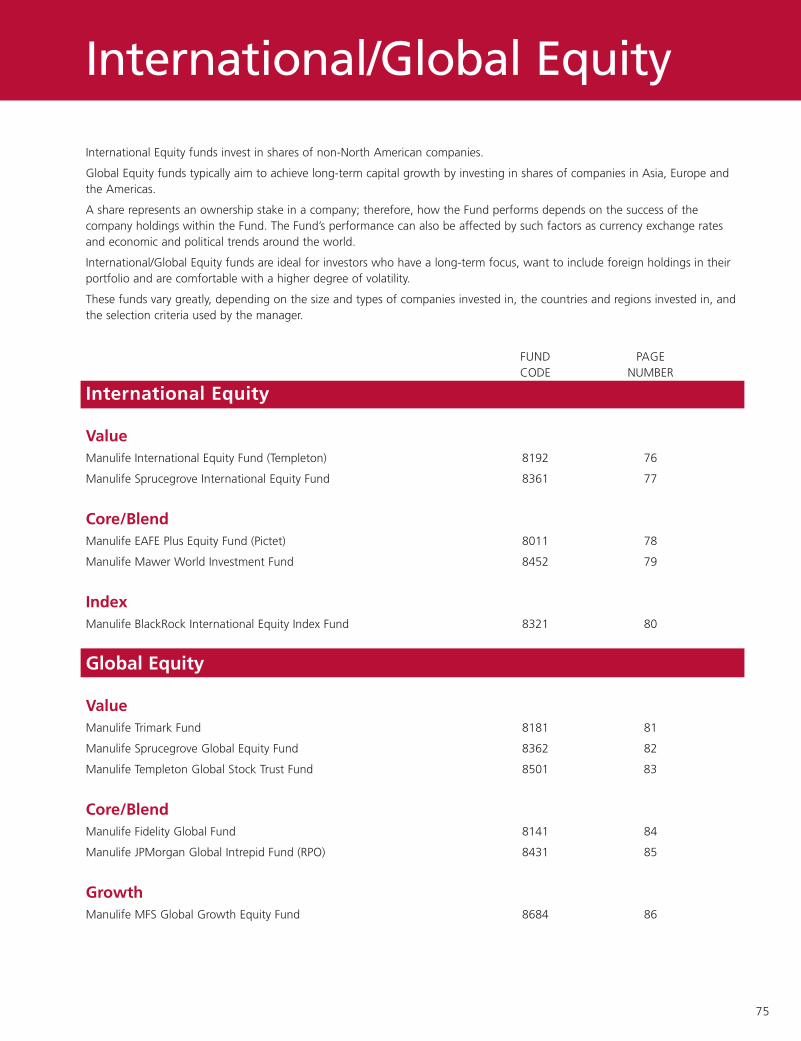
75
International/Global Equity
International Equity funds invest in shares of non-North American companies.
Global Equity funds typically aim to achieve long-term capital growth by investing in shares of companies in Asia, Europe andthe Americas.
A share represents an ownership stake in a company; therefore, how the Fund performs depends on the success of thecompany holdings within the Fund. The Fund’s performance can also be affected by such factors as currency exchange ratesand economic and political trends around the world.
International/Global Equity funds are ideal for investors who have a long-term focus, want to include foreign holdings in theirportfolio and are comfortable with a higher degree of volatility.
These funds vary greatly, depending on the size and types of companies invested in, the countries and regions invested in, andthe selection criteria used by the manager.
FUND PAGECODE NUMBER
International Equity
ValueManulife International Equity Fund (Templeton) 8192 76
Manulife Sprucegrove International Equity Fund 8361 77
Core/BlendManulife EAFE Plus Equity Fund (Pictet) 8011 78
Manulife Mawer World Investment Fund 8452 79
IndexManulife BlackRock International Equity Index Fund 8321 80
Global Equity
ValueManulife Trimark Fund 8181 81
Manulife Sprucegrove Global Equity Fund 8362 82
Manulife Templeton Global Stock Trust Fund 8501 83
Core/BlendManulife Fidelity Global Fund 8141 84
Manulife JPMorgan Global Intrepid Fund (RPO) 8431 85
GrowthManulife MFS Global Growth Equity Fund 8684 86
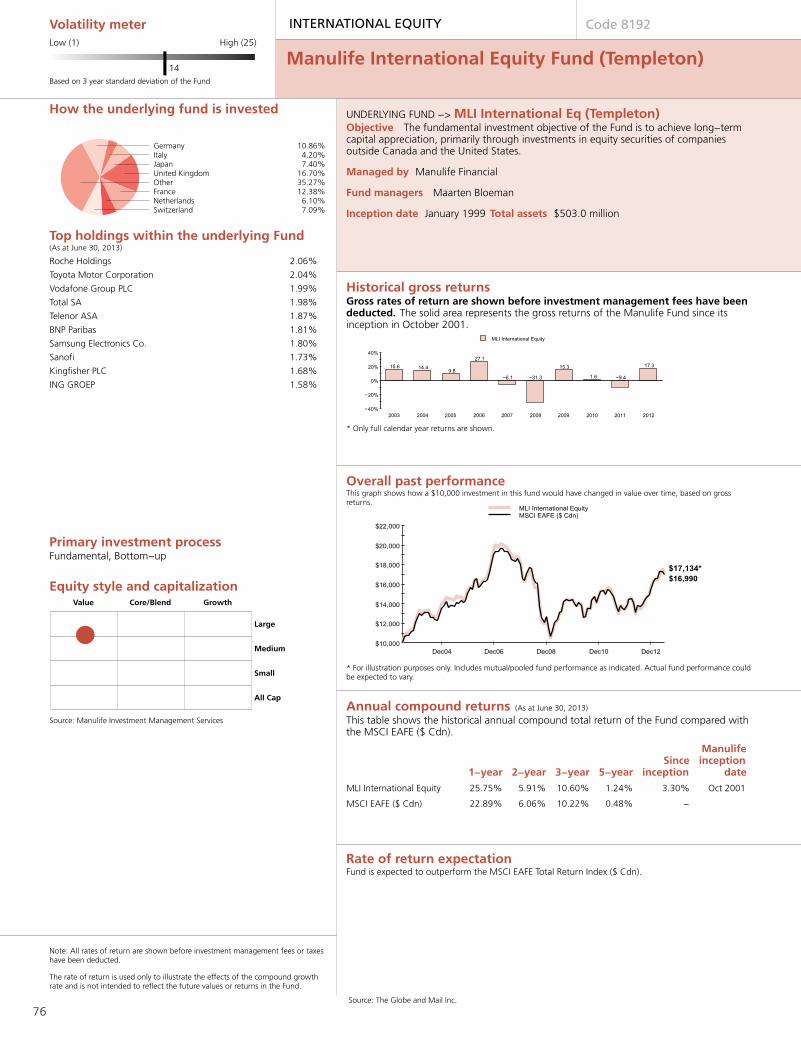
Volatility meter
Based on 3 year standard deviation of the Fund
Low (1) High (25)
14
INTERNATIONAL EQUITY Code 8192
Manulife International Equity Fund (Templeton)
Germany 10.86%
Switzerland 7.09%
Italy 4.20%
Netherlands 6.10%
Japan 7.40%
France 12.38%
United Kingdom 16.70%Other 35.27%
How the underlying fund is invested
Top holdings within the underlying Fund(As at June 30, 2013)
Roche Holdings 2.06%
Toyota Motor Corporation 2.04%
Vodafone Group PLC 1.99%
Total SA 1.98%
Telenor ASA 1.87%
BNP Paribas 1.81%
Samsung Electronics Co. 1.80%
Sanofi 1.73%
Kingfisher PLC 1.68%
ING GROEP 1.58%
Primary investment processFundamental, Bottom−up
Equity style and capitalization
Source: Manulife Investment Management Services
Value Core/Blend Growth
Large
Medium
Small
All Cap
Note: All rates of return are shown before investment management fees or taxeshave been deducted.
The rate of return is used only to illustrate the effects of the compound growthrate and is not intended to reflect the future values or returns in the Fund.
UNDERLYING FUND −> MLI International Eq (Templeton)Objective The fundamental investment objective of the Fund is to achieve long−termcapital appreciation, primarily through investments in equity securities of companiesoutside Canada and the United States.
Managed by Manulife Financial
Fund managers Maarten Bloeman
Inception date January 1999Total assets $503.0 million
Historical gross returnsGross rates of return are shown before investment management fees have beendeducted. The solid area represents the gross returns of the Manulife Fund since itsinception in October 2001.
* Only full calendar year returns are shown.
Overall past performanceThis graph shows how a $10,000 investment in this fund would have changed in value over time, based on grossreturns.
* For illustration purposes only. Includes mutual/pooled fund performance as indicated. Actual fund performance couldbe expected to vary.
Annual compound returns (As at June 30, 2013)
This table shows the historical annual compound total return of the Fund compared withthe MSCI EAFE ($ Cdn).
1−year 2−year 3−year 5−yearSince
inception
Manulifeinception
date
MLI International Equity 25.75% 5.91% 10.60% 1.24% 3.30% Oct 2001
MSCI EAFE ($ Cdn) 22.89% 6.06% 10.22% 0.48% −
Rate of return expectation Fund is expected to outperform the MSCI EAFE Total Return Index ($ Cdn).
Source: The Globe and Mail Inc.
76

Volatility meter
Based on 3 year standard deviation of the Fund
Low (1) High (25)
10
INTERNATIONAL EQUITY Code 8361
Manulife Sprucegrove International Equity Fund
Ireland 4.50%
Netherlands 4.90%
Switzerland 12.60%
Hong Kong 5.90%
Singapore 6.40%
United Kingdom 19.00%
Japan 19.00%Other 27.70%
How the underlying fund is invested
Top holdings within the underlying Fund(As at June 30, 2013)
Novartis AG 4.50%
HSBC Holdings PLC 3.20%
Royal Dutch Shell PLC 2.50%
CRH PLC 2.30%
Total SA 2.30%
Nestle S.A. 2.20%
Samsung Electronics Co. 2.20%
Tesco PLC 2.10%
Bayerische Motoren Werke AG 2.10%
Adidas Ag−Adr 2.00%
Primary investment processFundamental, Bottom−up
Equity style and capitalization
Source: Manulife Investment Management Services
Value Core/Blend Growth
Large
Medium
Small
All Cap
Note: All rates of return are shown before investment management fees or taxeshave been deducted.
The rate of return is used only to illustrate the effects of the compound growthrate and is not intended to reflect the future values or returns in the Fund.
UNDERLYING FUND −> Sprucegrove International EquityObjective The objective of the Fund is to provide clients with above average investmentperformance and superior service over the long−term. The strategy employs a valueapproach to the management of equities. It emphasizes long−term investment and itfocuses on the selection of individual securities using a bottom−up, research drivenapproach. Country and sector exposures are a residual of this stock selection process.
Managed by Sprucegrove Investment Management
Fund managers Shirley Woo, CFA
Inception date May 1985Total assets $5,637.0 million
Historical gross returnsGross rates of return are shown before investment management fees have beendeducted. The solid area represents the gross returns of the Manulife Fund since itsinception in September 2005. To provide further historical information, the shaded arearepresents the returns of the underlying fund for the period before the start date of theManulife Fund.
* Only full calendar year returns are shown.
Overall past performanceThis graph shows how a $10,000 investment in this fund would have changed in value over time, based on grossreturns.
* For illustration purposes only. Includes mutual/pooled fund performance as indicated. Actual fund performance couldbe expected to vary.
Annual compound returns (As at June 30, 2013)
This table shows the historical annual compound total return of the Fund compared withthe MSCI EAFE ($ Cdn).
1−year 2−year 3−year 5−yearSince
inception
Manulifeinception
date
MLI SprucegroveInternational Eqty
18.68% 6.53% 10.19% 3.33% 3.65% Sep 2005
MSCI EAFE ($ Cdn) 22.89% 6.06% 10.22% 0.48% −
Rate of return expectation The Fund is expected to provide an above average investment over a full business cycle comparedwith the MSCI EAFE Index.
Source: The Globe and Mail Inc.
77

Volatility meter
Based on 3 year standard deviation of the Fund
Low (1) High (25)
14
INTERNATIONAL EQUITY Code 8011
Manulife EAFE Plus Equity Fund (Pictet)
Italy 4.27%
Hong Kong 4.95%
Switzerland 11.30%
Australia 5.10%
Germany 7.43%
United Kingdom 18.77%
Japan 20.67%Other 27.51%
How the underlying fund is invested
Top holdings within the underlying Fund(As at June 30, 2013)
HSBC Holdings PLC 2.88%
Nestle SA 2.82%
Roche Holdings 2.69%
Galp Energia SGPS 2.64%
BG Group PLC 2.43%
Ericsson ADS 2.36%
Bayer Ag Sponsored Adr 2.31%
Societe Genl Fr 2.21%
Vodafone Group PLC 2.21%
Japan Tobacco Inc. 2.16%
Primary investment processFundamental, Bottom−up
Equity style and capitalization
Source: Manulife Investment Management Services
Value Core/Blend Growth
Large
Medium
Small
All Cap
Note: All rates of return are shown before investment management fees or taxeshave been deducted.
The rate of return is used only to illustrate the effects of the compound growthrate and is not intended to reflect the future values or returns in the Fund.
UNDERLYING FUND −> Manulife EAFE Plus Equity (Pictet)Objective Long−term growth is achieved by investing in a diversified mix of stocksaround the world. Emphasis is placed on adding returns without risk.
Managed by Manulife Financial
Fund managers Pictet Asset Mgmt − Mgmt Team
Inception date September 2001Total assets $52.3 million
Historical gross returnsGross rates of return are shown before investment management fees have beendeducted. The solid area represents the gross returns of the Manulife Fund since itsinception in September 2001.
* Only full calendar year returns are shown.
Overall past performanceThis graph shows how a $10,000 investment in this fund would have changed in value over time, based on grossreturns.
* For illustration purposes only. Includes mutual/pooled fund performance as indicated. Actual fund performance couldbe expected to vary.
Annual compound returns (As at June 30, 2013)
This table shows the historical annual compound total return of the Fund compared withthe MSCI EAFE ($ Cdn).
1−year 2−year 3−year 5−yearSince
inception
Manulifeinception
date
MLI EAFE Plus Equity (Pictet) 25.95% 8.24% 13.05% 1.40% 1.20% Sep 2001
MSCI EAFE ($ Cdn) 22.89% 6.06% 10.22% 0.48% −
Rate of return expectation Over the long term, the Fund strives to outperform the MSCI EAFE ($ Cdn) Index.
Source: The Globe and Mail Inc.
78

Volatility meter
Based on 3 year standard deviation of the underlying fund
Low (1) High (25)
12
INTERNATIONAL EQUITY Code 8452
Manulife Mawer World Investment Fund
Australia 3.82%
Netherlands 4.61%
Germany 7.39%
Japan 5.07%
Switzerland 5.72%
Sweden 7.99%
United Kingdom 31.82%Other 33.58%
How the underlying fund is invested
Top holdings within the underlying Fund(As at June 30, 2013)
Roche Holdings 3.44%
Rolls−Royce Group PLC 2.70%
Jardine Matheson Holdings 2.65%
Reckitt Benckiser Group PLC 2.65%
BASF AG 2.59%
Kerry Group Plc 2.53%
DBS Group Holdings Ltd. 2.50%
Gazit−Globe 2.31%
Deutsche Boerse AG 2.29%
Meda AB 2.28%
Primary investment processFundamental, Bottom−up
Equity style and capitalization
Source: Manulife Investment Management Services
Value Core/Blend Growth
Large
Medium
Small
All Cap
Note: All rates of return are shown before investment management fees or taxeshave been deducted.
The rate of return is used only to illustrate the effects of the compound growthrate and is not intended to reflect the future values or returns in the Fund.
UNDERLYING FUND −> Mawer World Investment−OObjective The Mawer World Investment is managed for above−average long termreturns in the securities of non−North American companies.
Managed by Mawer Investment Management Ltd.
Fund managers Jim Hall, CFA, MBA, BA and David Ragan, CFA
Inception date November 1987Total assets $390.9 million
Historical gross returnsGross rates of return are shown before investment management fees have beendeducted. The solid area represents the gross returns of the Manulife Fund since itsinception in September 2010. To provide historical information, the shaded arearepresents the returns of the underlying fund for the period before the start date of theManulife Fund.
* Only full calendar year returns are shown.
Overall past performanceThis graph shows how a $10,000 investment in this fund would have changed in value over time, based on grossreturns.
* For illustration purposes only. Includes mutual/pooled fund performance as indicated. Actual fund performance couldbe expected to vary.
Annual compound returns (As at June 30, 2013)
This table shows the historical annual compound total return of the Fund compared withthe MSCI EAFE ($ Cdn).
1−year 2−year 3−year 5−yearSince
inception
Manulifeinception
date
MLI Mawer WorldInvestment
21.48% 8.37% − − 11.67% Sep 2010
MSCI EAFE ($ Cdn) 22.89% 6.06% 10.22% 0.48% −
Rate of return expectation The performance goal is to exceed the MSCI EAFE Index by at least 2% over 4−year moving timeperiods.
Source: The Globe and Mail Inc.
79

Volatility meter
Based on 3 year standard deviation of the Fund
Low (1) High (25)
12
INTERNATIONAL EQUITY Code 8321
Manulife BlackRock International Equity Index Fund
Switzerland 9.07%
Australia 7.88%
Sweden 3.05%
Germany 8.51%
France 9.17%
Other 18.90%
United Kingdom 21.25%Japan 22.17%
How the underlying fund is invested
Top holdings within the underlying Fund(As at June 30, 2013)
Nestle S.A. 1.84%
HSBC Holdings PLC 1.66%
Roche Holdings 1.52%
Toyota Motor Corporation 1.45%
Novartis AG 1.42%
Vodafone Group PLC 1.21%
BP PLC 1.15%
Sanofi 1.07%
GlaxoSmithKline PLC 1.07%
Royal Dutch Shell PLC 1.05%
Primary investment processIndex
Equity style and capitalization
Source: Manulife Investment Management Services
Value Core/Blend Growth
Large
Medium
Small
All Cap
Note: All rates of return are shown before investment management fees or taxeshave been deducted.
The rate of return is used only to illustrate the effects of the compound growthrate and is not intended to reflect the future values or returns in the Fund.
UNDERLYING FUND −> BlackRock CDN MSCI EAFE Equity IdxObjective The BlackRock Daily EAFE Equity Index Fund’s objective is to match thereturns of the MSCI EAFE Index (total return, net of withholding taxes) as closely aspossible. BlackRock uses an indexing approach, where they own assets to match thoseof the index, in about the same names, weights, sectors, and countries.
Managed by BlackRock Asset Management Canada Limited
Fund managers Ed Corallo, Joselle Duncan, CFA, Tim Wong, CFA and Creighton Jue,CFA
Inception date April 1999Total assets $2,213.8 million
Historical gross returnsGross rates of return are shown before investment management fees have beendeducted. The solid area represents the gross returns of the Manulife Fund since itsinception in November 2003. To provide further historical information, the shaded arearepresents the returns of the underlying fund for the period before the start date of theManulife Fund.
* Only full calendar year returns are shown.
Overall past performanceThis graph shows how a $10,000 investment in this fund would have changed in value over time, based on grossreturns.
* For illustration purposes only. Includes mutual/pooled fund performance as indicated. Actual fund performance couldbe expected to vary.
Annual compound returns (As at June 30, 2013)
This table shows the historical annual compound total return of the Fund compared withthe MSCI EAFE ($ Cdn).
1−year 2−year 3−year 5−yearSince
inception
Manulifeinception
date
MLI BR Intl Equity Index 22.91% 5.86% 9.98% 0.33% 3.94% Nov 2003
MSCI EAFE ($ Cdn) 22.89% 6.06% 10.22% 0.48% −
Rate of return expectation Over the long term, this fund is expected to track the return and risk profile of the MSCI EAFE Index(total return, net of withholding taxes).
Source: The Globe and Mail Inc.
80
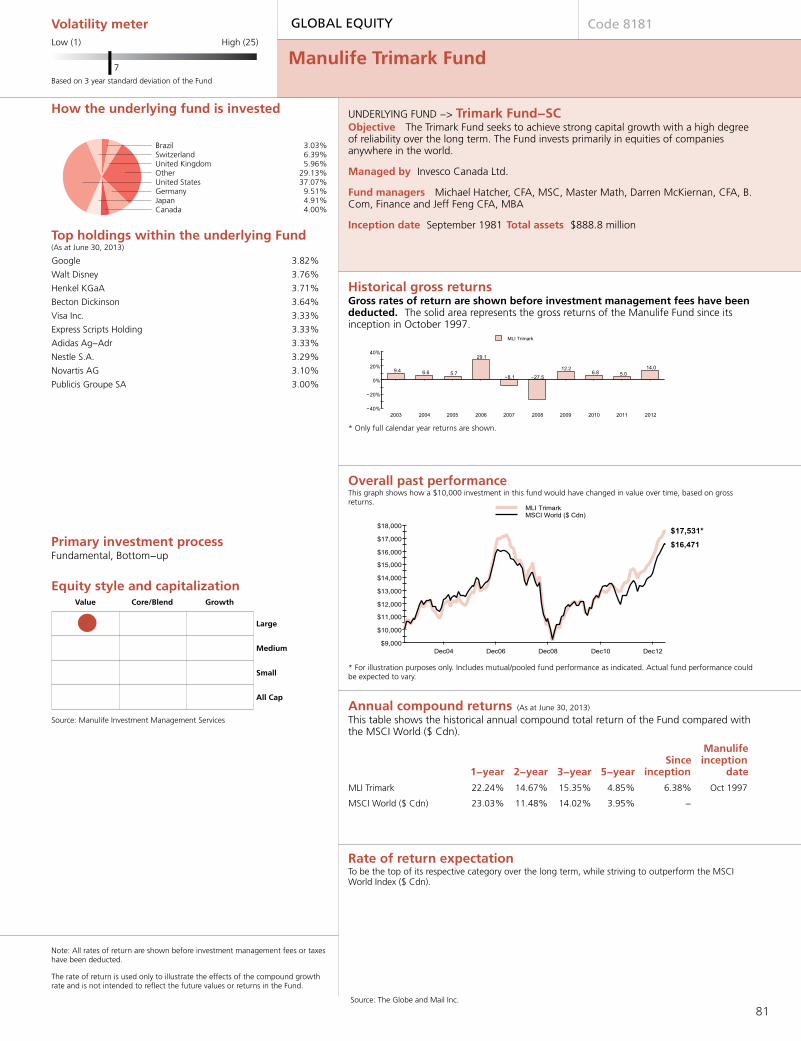
Volatility meter
Based on 3 year standard deviation of the Fund
Low (1) High (25)
7
GLOBAL EQUITY Code 8181
Manulife Trimark Fund
Brazil 3.03%
Canada 4.00%
Switzerland 6.39%
Japan 4.91%
United Kingdom 5.96%
Germany 9.51%
Other 29.13%United States 37.07%
How the underlying fund is invested
Top holdings within the underlying Fund(As at June 30, 2013)
Google 3.82%
Walt Disney 3.76%
Henkel KGaA 3.71%
Becton Dickinson 3.64%
Visa Inc. 3.33%
Express Scripts Holding 3.33%
Adidas Ag−Adr 3.33%
Nestle S.A. 3.29%
Novartis AG 3.10%
Publicis Groupe SA 3.00%
Primary investment processFundamental, Bottom−up
Equity style and capitalization
Source: Manulife Investment Management Services
Value Core/Blend Growth
Large
Medium
Small
All Cap
Note: All rates of return are shown before investment management fees or taxeshave been deducted.
The rate of return is used only to illustrate the effects of the compound growthrate and is not intended to reflect the future values or returns in the Fund.
UNDERLYING FUND −> Trimark Fund−SCObjective The Trimark Fund seeks to achieve strong capital growth with a high degreeof reliability over the long term. The Fund invests primarily in equities of companiesanywhere in the world.
Managed by Invesco Canada Ltd.
Fund managers Michael Hatcher, CFA, MSC, Master Math, Darren McKiernan, CFA, B.Com, Finance and Jeff Feng CFA, MBA
Inception date September 1981Total assets $888.8 million
Historical gross returnsGross rates of return are shown before investment management fees have beendeducted. The solid area represents the gross returns of the Manulife Fund since itsinception in October 1997.
* Only full calendar year returns are shown.
Overall past performanceThis graph shows how a $10,000 investment in this fund would have changed in value over time, based on grossreturns.
* For illustration purposes only. Includes mutual/pooled fund performance as indicated. Actual fund performance couldbe expected to vary.
Annual compound returns (As at June 30, 2013)
This table shows the historical annual compound total return of the Fund compared withthe MSCI World ($ Cdn).
1−year 2−year 3−year 5−yearSince
inception
Manulifeinception
date
MLI Trimark 22.24% 14.67% 15.35% 4.85% 6.38% Oct 1997
MSCI World ($ Cdn) 23.03% 11.48% 14.02% 3.95% −
Rate of return expectation To be the top of its respective category over the long term, while striving to outperform the MSCIWorld Index ($ Cdn).
Source: The Globe and Mail Inc.
81

Volatility meter
Based on 3 year standard deviation of the Fund
Low (1) High (25)
8
GLOBAL EQUITY Code 8362
Manulife Sprucegrove Global Equity Fund
United Kingdom 8.40%
Singapore 3.50%
Hong Kong 2.70%
Netherlands 3.10%
Switzerland 6.90%
Japan 8.90%
United States 46.80%Other 19.70%
How the underlying fund is invested
Top holdings within the underlying Fund(As at June 30, 2013)
Markel Corp. 3.40%
Wells Fargo & Co. 2.70%
3M Co. 2.50%
Novartis AG 2.40%
Merck & Company 2.20%
Berkshire Hathaway 2.10%
Procter & Gamble 2.10%
Pfizer 2.00%
Johnson & Johnson 2.00%
Microsoft 1.80%
Primary investment processFundamental, Bottom−up
Equity style and capitalization
Source: Manulife Investment Management Services
Value Core/Blend Growth
Large
Medium
Small
All Cap
Note: All rates of return are shown before investment management fees or taxeshave been deducted.
The rate of return is used only to illustrate the effects of the compound growthrate and is not intended to reflect the future values or returns in the Fund.
UNDERLYING FUND −> Sprucegrove Global PooledObjective The Sprucegrove Global Equity Fund objective is to create a portfolio ofinternational (including U.S.) stocks that overall have characteristics superior to thebenchmark MSCI World Index. Sprucegrove emphasizes long term investment and itfocuses on the selection of individual common stocks using a bottom−up, research drivenapproach.
Managed by Sprucegrove Investment Management
Fund managers Shirley Woo, CFA, Peter Ellement, CFA, Craig Merrigan, CFA and ErikParnoja, CFA
Inception date June 1995Total assets $994.4 million
Historical gross returnsGross rates of return are shown before investment management fees have beendeducted. The solid area represents the gross returns of the Manulife fund since itsinception in June 2009. To provide historical information, the shaded area represents thereturns of the underlying fund for the period before the start date of the Manulife Fund.
* Only full calendar year returns are shown.
Overall past performanceThis graph shows how a $10,000 investment in this fund would have changed in value over time, based on grossreturns.
* For illustration purposes only. Includes mutual/pooled fund performance as indicated. Actual fund performance couldbe expected to vary.
Annual compound returns (As at June 30, 2013)
This table shows the historical annual compound total return of the Fund compared withthe MSCI World ($ Cdn).
1−year 2−year 3−year 5−yearSince
inception
Manulifeinception
date
MLI Sprucegrove GlobalEquity
21.76% 10.73% 12.10% − 11.93% Jun 2009
MSCI World ($ Cdn) 23.03% 11.48% 14.02% 3.95% −
Rate of return expectation Over the long term, this fund is expected to outperform the MSCI World Index ($ Cdn).
Source: The Globe and Mail Inc.
82

Volatility meter
Based on 3 year standard deviation of the Fund
Low (1) High (25)
14
GLOBAL EQUITY Code 8501
Manulife Templeton Global Stock Trust Fund
France 7.64%
Switzerland 6.11%
Netherlands 3.84%
Japan 5.94%
Germany 6.72%
United Kingdom 10.59%
Other 19.88%United States 39.28%
How the underlying fund is invested
Top holdings within the underlying Fund(As at June 30, 2013)
Citigroup 1.85%
Morgan Stanley 1.84%
JP Morgan Chase & Co. 1.62%
Cisco Systems 1.58%
Gilead Sciences 1.57%
Toyota Motor Corporation 1.56%
Intl Cons Airlines 1.54%
CRH ORD 1.52%
Bayer Ag Sponsored Adr 1.50%
Microsoft 1.50%
Primary investment processFundamental, Bottom−up
Equity style and capitalization
Source: Manulife Investment Management Services
Value Core/Blend Growth
Large
Medium
Small
All Cap
Note: All rates of return are shown before investment management fees or taxeshave been deducted.
The rate of return is used only to illustrate the effects of the compound growthrate and is not intended to reflect the future values or returns in the Fund.
UNDERLYING FUND −> Templeton Global Stock TrustObjective The investment objective of the fund is to achieve long−term capital growththrough a flexible policy of investment primarily in equity securities of companies listed onstock exchanges of any nation other than Canada. Equity investments are selected on anissuer−by−issuer basis and may include investments in emerging markets. In normalmarket conditions, issuers are selected from a cross−section of countries, regions andindustries.
Managed by Franklin Templeton Investments
Fund managers Katherine Owen, CFA
Inception date September 1997Total assets $360.3 million
Historical gross returnsGross rates of return are shown before investment management fees have beendeducted. The solid area represents the gross returns of the Manulife Fund since itsinception in October 2007. To provide further historical information, the shaded arearepresents the returns of the underlying fund for the period before the start date of theManulife Fund.
* Only full calendar year returns are shown.
Overall past performanceThis graph shows how a $10,000 investment in this fund would have changed in value over time, based on grossreturns.
* For illustration purposes only. Includes mutual/pooled fund performance as indicated. Actual fund performance couldbe expected to vary.
Annual compound returns (As at June 30, 2013)
This table shows the historical annual compound total return of the Fund compared withthe MSCI World ($ Cdn).
1−year 2−year 3−year 5−yearSince
inception
Manulifeinception
date
MLI Templeton Global StkTrs
37.79% 11.42% 13.60% 4.32% 1.16% Oct 2007
MSCI World ($ Cdn) 23.03% 11.48% 14.02% 3.95% −
Rate of return expectation Over the long term, this fund is expected to outperform the MSCI World Index ($ Cdn).
Source: The Globe and Mail Inc.83

Volatility meter
Based on 3 year standard deviation of the Fund
Low (1) High (25)
10
GLOBAL EQUITY Code 8141
Manulife Fidelity Global Fund
United Kingdom 7.14%
Switzerland 2.93%
Australia 2.35%
France 2.72%
Canada 4.48%
Japan 8.11%
Other 22.09%United States 50.18%
How the underlying fund is invested
Top holdings within the underlying Fund(As at June 30, 2013)
Apple 3.46%
Google 3.21%
Philip Morris International 2.03%
Home Depot 1.97%
Gilead Sciences 1.91%
Pepsico Inc. 1.86%
Qualcomm 1.86%
Oracle Corp. 1.69%
TJX Companies 1.46%
Ashland Inc. 1.39%
Primary investment processFundamental, Bottom−up
Equity style and capitalization
Source: Manulife Investment Management Services
Value Core/Blend Growth
Large
Medium
Small
All Cap
Note: All rates of return are shown before investment management fees or taxeshave been deducted.
The rate of return is used only to illustrate the effects of the compound growthrate and is not intended to reflect the future values or returns in the Fund.
UNDERLYING FUND −> Fidelity Global−AObjective The Fidelity Global Fund aims to achieve long−term capital growth. It investsprimarily in equity securities of companies anywhere in the world.
Managed by Fidelity Investments Canada ULC
Fund managers Michael Strong, Joe Overdevest, Stephen Balter, Christopher Galizioand Matthew Van Vlack
Inception date November 1987Total assets $35.7 million
Historical gross returnsGross rates of return are shown before investment management fees have beendeducted. The solid area represents the gross returns of the Manulife Fund since itsinception in July 1997.
* Only full calendar year returns are shown.
Overall past performanceThis graph shows how a $10,000 investment in this fund would have changed in value over time, based on grossreturns.
* For illustration purposes only. Includes mutual/pooled fund performance as indicated. Actual fund performance couldbe expected to vary.
Annual compound returns (As at June 30, 2013)
This table shows the historical annual compound total return of the Fund compared withthe MSCI World ($ Cdn).
1−year 2−year 3−year 5−yearSince
inception
Manulifeinception
date
MLI Fidelity Global 21.33% 8.35% 12.17% 2.66% 3.60% Jul 1997
MSCI World ($ Cdn) 23.03% 11.48% 14.02% 3.95% −
Rate of return expectation The Fund seeks to achieve returns comparable to, or better than, the MSCI AC World ($Cdn) Index.
Source: The Globe and Mail Inc.84

Volatility meter
Based on 3 year standard deviation of the Fund
Low (1) High (25)
11
GLOBAL EQUITY Code 8431
Manulife JPMorgan Global Intrepid Fund (RegisteredPlans Only)
Japan 8.73%
Germany 4.04%
Netherlands 2.32%
France 3.98%
Switzerland 6.63%
United Kingdom 11.23%
Other 12.87%United States 50.20%
How the underlying fund is invested
Top holdings within the underlying Fund(As at June 30, 2013)
Google 1.45%
Chevron Corp. 1.41%
Microsoft 1.41%
Johnson & Johnson 1.23%
Pfizer 1.18%
Wells Fargo & Co. 1.16%
Royal Dutch Shell PLC 1.15%
Citigroup 1.06%
Roche Holdings 1.01%
Merck & Company 0.98%
Primary investment processFundamental, Bottom−up
Equity style and capitalization
Source: Manulife Investment Management Services
Value Core/Blend Growth
Large
Medium
Small
All Cap
Note: All rates of return are shown before investment management fees or taxeshave been deducted.
The rate of return is used only to illustrate the effects of the compound growthrate and is not intended to reflect the future values or returns in the Fund.
UNDERLYING FUND −> JPMorgan Global Intrepid FundObjective The Global Intrepid − Canada non−Taxable Fund is a core fund which aimsto hold the best of growth and value stocks across global stock markets and marketcapitalisation segments.
Managed by JPMorgan Asset Management
Fund managers Sandeep Bhargava
Inception date December 2005Total assets $1,853.0 million
Historical gross returnsGross rates of return are shown before investment management fees have beendeducted. The solid area represents the gross returns of the Manulife Fund since itsinception in November 2007. To provide further historical information, the shaded arearepresents the returns of the underlying fund for the period before the start date of theManulife fund.
* Only full calendar year returns are shown.
Overall past performanceThis graph shows how a $10,000 investment in this fund would have changed in value over time, based on grossreturns.
* For illustration purposes only. Includes mutual/pooled fund performance as indicated. Actual fund performance couldbe expected to vary.
Annual compound returns (As at June 30, 2013)
This table shows the historical annual compound total return of the Fund compared withthe MSCI World ($ Cdn).
1−year 2−year 3−year 5−yearSince
inception
Manulifeinception
date
MLI JPMorgan Gl Intrepid 24.37% 9.29% 13.49% 3.51% 1.31% Nov 2007
MSCI World ($ Cdn) 23.03% 11.48% 14.02% 3.95% −
Rate of return expectation The Fund aims to outperform the MSCI World NDR Index ($ Cdn) by 4 % per annum over a marketcycle.
Source: The Globe and Mail Inc.85

Volatility meter
Based on 3 year standard deviation of the underlying fund
Low (1) High (25)
12
GLOBAL EQUITY Code 8684
Manulife MFS Global Growth Equity Fund
United Kingdom 11.00%
Germany 4.02%
Netherlands 2.06%
Brazil 3.55%
Switzerland 6.46%
France 11.50%
Other 14.18%United States 47.23%
How the underlying fund is invested
Top holdings within the underlying Fund(As at June 30, 2013)
Danone Group 2.83%LVMH Moet Hennessy Louis Vuitt 2.79%Google 2.40%Pernod Ricard 2.22%Danaher Corp. 2.17%Compass Group PLC 2.03%Schlumberger Ltd. 2.02%United Technologies 1.99%Procter & Gamble 1.84%Colgate Palmolive 1.80%EMC Corp. 1.72%Visa Inc. 1.67%Kuehne & Nagel International 1.63%Reckitt Benckiser Group 1.62%Accenture plc 1.62%
Primary investment processFundamental, Bottom−up
Equity style and capitalization
Source: Manulife Investment Management Services
Value Core/Blend Growth
Large
Medium
Small
All Cap
Note: All rates of return are shown before investment management fees or taxeshave been deducted.
The rate of return is used only to illustrate the effects of the compound growthrate and is not intended to reflect the future values or returns in the Fund.
UNDERLYING FUND −> Manulife MFS McLean Budden Global GrowthEquity FundObjective The Fund seeks long−term capital appreciation by investing principally instocks of companies worldwide that have higher sustainable earnings growth and returnsthan their industry, improving fundamentals, and whose stock valuations do not fullyreflect their long−term growth prospects.
Managed by MFS McLean Budden Limited
Fund managers Jeffrey C. Constantino, CFA, CPA and David Antonelli, MBA, CPA
Inception date July 1997Total assets $385.5 million
Historical gross returnsGross rates of return are shown before investment management fees have beendeducted. The shaded area represents the returns of the underlying fund for the periodbefore the start date of the Manulife Fund.
* Only full calendar year returns are shown.
Overall past performanceThis graph shows how a $10,000 investment in this fund would have changed in value over time, based on grossreturns.
* For illustration purposes only. Includes mutual/pooled fund performance as indicated. Actual fund performance couldbe expected to vary.
Annual compound returns (As at June 30, 2013)
This table shows the historical annual compound total return of the Fund compared withthe MSCI All Country World Growth Index (Net Dividends Reinvested).
1−year 2−year 3−year 5−yearSince
inception
Manulifeinception
date
MLI MFS Global GrowthEquity
− − − − 0.00% Jun 2013
MSCI ACWI Growth ($Cdn) (Net Dividends)
19.14% 9.24% 12.73% 2.93% −
Rate of return expectation The Fund strives to outperform the MSCI All Country World Growth Index (Net Dividends Reinvested)over a full market cycle, typically defined as three to five years.
Source: The Globe and Mail Inc.86

87
Specialty
Specialty funds focus on a specific industry or sector of the economy. Some Specialty funds invest in shares of foreign
companies. A share represents an ownership stake in a company; therefore, how the Fund performs depends on the success of
the companies the fund holds. A fund’s performance can also be affected by factors such as currency exchange rates and
economic and political trends.
Specialty funds are designed for investors who have a long-term focus and are comfortable with a high degree of volatility.
They are also designed for investors who want to further diversify their portfolio and concentrate on a specific investment
segment at the same time.
One type of specialty fund is a Real Estate fund. These funds invest primarily in shares of companies that operate in the real
estate industry, such as mortgage lenders and real estate investment trusts, and generally do not hold real estate directly.
Since the holdings of Specialty funds have a narrow focus, these funds entail more risk. Due to their volatility, investors should
exercise discretion when deciding the portion of their overall portfolio to invest in Specialty funds.
FUND PAGE
CODE NUMBER
Core/Blend
Manulife Pyramis Global Real Estate Fund 8581 88

Volatility meter
Based on 3 year standard deviation of the Fund
Low (1) High (25)
12
SPECIALTY Code 8581
Manulife Pyramis Global Real Estate Fund
Other 8.44%
United Kingdom 5.70%
Canada 2.75%
Singapore 5.44%
Australia 7.76%
Hong Kong 8.95%
Japan 14.38%United States 46.58%
How the underlying fund is invested
Top holdings within the underlying Fund(As at June 30, 2013)
Simon Property Group 5.71%
Public Storage 4.90%
Sun Hung Kai Properties Limite 4.31%
Mitsui Fudosan Company 4.25%
Ventas Inc. 3.91%
Westfield Group 3.75%
Mitsubishi Estate Company 3.50%
Host Hotels & Resorts 3.49%
Unibail−Rodamco 2.68%
Prologis, Inc. 2.50%
Primary investment processFundamental, Bottom−up
Equity style and capitalization
Source: Manulife Investment Management Services
Value Core/Blend Growth
Large
Medium
Small
All Cap
Note: All rates of return are shown before investment management fees or taxeshave been deducted.
The rate of return is used only to illustrate the effects of the compound growthrate and is not intended to reflect the future values or returns in the Fund.
UNDERLYING FUND −> Fidelity Global Real Estate−OObjective The Fund aims to achieve a high total investment return by investing insecurities of companies anywhere in the world that participate in the real estate industry.
Managed by Fidelity Investments Canada ULC
Fund managers Steven J. Buller
Inception date May 2006Total assets $17.0 million
Historical gross returnsGross rates of return are shown before investment management fees have beendeducted. The solid area represents the gross returns of the Manulife fund since itsinception in June 2008. To provide further historical information, the shaded arearepresents the returns of the underlying fund for the period before the start date of theManulife Fund.
* Only full calendar year returns are shown.
Overall past performanceThis graph shows how a $10,000 investment in this fund would have changed in value over time, based on grossreturns.
* For illustration purposes only. Includes mutual/pooled fund performance as indicated. Actual fund performance couldbe expected to vary.
Annual compound returns (As at June 30, 2013)
This table shows the historical annual compound total return of the Fund compared withthe FTSE EPRA/NAREIT Global Real Estate.
1−year 2−year 3−year 5−yearSince
inception
Manulifeinception
date
MLI Pyramis Global RealEstate
17.85% 12.71% 15.28% 4.78% 4.61% Jun 2008
FTSE EPRA/NAREIT GlobalReal Estate
18.25% 13.07% 15.70% 5.41% −
Rate of return expectation The Fund aims to outperform the FTSE EPRA/NAREIT Developed Index over a full market cycle.
Source: The Globe and Mail Inc.88

i-Watch®
The philosophy
The Investment Management Services (IMS) team focuses on quality, not quantity. They believe past performance is not an accurate indicator of future performance, but ratherhigh-quality investment firms who adhere to documentedinvestment policies and procedures are more likely to deliversuperior results over time. It is their job to monitor the fundmanagers on Manulife's platform so investors don’t have to.They understand how important it is for Manulife Financial’sstakeholders to have sufficient information to make prudentinvestment decisions. This is why i-Watch® exists.
Investment Management Services
One of Manulife Financial’s core competencies is providinginvestment management services in the countries in whichwe operate, including the U.S., Canada, Hong Kong, Japanand other Asian countries. In Canada, the IMS team iscomprised of analysts and industry professionals whosecredentials match professionals in the most respectedinvestment consulting firms.
By operating objectively and independently of any businessunits, the IMS team ensures fund partners meet strictrequirements for fund management. Given that moneymanagement is a global concern, team members oftenconsult with their Manulife counterparts throughout theworld. Fund partners adhere to the same best practicesparticularly when IMS is selecting or monitoring investmentfunds representing non-North American mandates.
i-Watch®
Fund selection
Funds available through Manulife Financial are screened andselected using a strict process. Performance is one screeningcriterion, but is not the most important determinant of futurereturns. In IMS’ view, the consideration of an investment firm’squalitative aspects, together with its quantitative aspects, is abetter indicator of the fund’s long-term viability.
Reflecting this viewpoint, Manulife Financial’s selection processincludes an in-depth review of factors that determine theunderlying quality of the fund manager. IMS emphasizes theirqualitative review in the decision-making process and screens forthe following qualities:
• The stability of the organization, including successionplanning and adherence to a code of ethics
• The depth, quality and overall experience level of the peoplemanaging the assets
• A clearly defined investment process that has been appliedconsistently over time
• A record of performance that compares favourably toappropriate benchmarks and peer managers
• Risk characteristics that are in line with investment mandates
The IMS team is made up of independent professionals who get‘behind the numbers’ by visiting and interviewing fundmanagers on a regular basis, probing issues in a way that canonly come from years of experience.
Ongoing monitoring process
While the selection process is important, the ongoing monitoringprocess is what makes i-Watch unique. Once an investment fundis selected, the IMS team continues to apply the same level ofanalysis used to select the fund manager originally. With regularonsite due diligence meetings, the IMS team conducts ongoingsystematic reviews of every fund available through ManulifeFinancial. The due diligence review includes a comprehensiveexamination of the evolving characteristics of the fund and face-to-face meetings with the fund manager.
Manulife Financial believes in forming long-term relationshipswith our manager partners. If a fund fails to live up to itsmandate, we will work with the fund manager to addressspecific concerns. If these additional steps fail to address ourexpectations, the fund manager will be replaced or the mandatewill be capped. The choice of actions is based on minimizing anydisruption to investors.
i-Watch, and the i-Watch logo are trademarks of The Manufacturers Life Insurance Company and are used by it, and by its affiliates under license.
89

90
Your Notes:


Available 24 hours a day, 7 days a week at www.manulife.ca/GRO
Manulife, Manulife Financial, the Manulife Financial For Your Future logo, the Block Design, the Four Cubes Design, and strong reliable trustworthy forward-thinking are trademarks of The Manufacturers Life Insurance Company and are used by it, and by its affiliates under license.
GP0083E 06/2013
You need your customer number and your personal identification number (PIN) to access this service. If you
need a PIN, or have forgotten it, call toll-free 1-888-727-7766 and press '0' to speak with a Customer Service
Representative.
A secure website designed to help you.


