TABLE OF CONTENTS INTRODUCTION .......................................................................................................................... 3 PROJECT GOVERNANCE ........................................................................................................... 3 TERMINOLOGY ........................................................................................................................... 4 SCOPE OF STUDY ........................................................................................................................ 5 GUIDING CONCEPTS .................................................................................................................. 7
Intended Uses ............................................................................................................................ 7 Model Contract ......................................................................................................................... 7
DATA VALIDATION.................................................................................................................... 8 ASO Claims .............................................................................................................................. 8 Other Validation Activities ....................................................................................................... 9
DATA CHARACTERISTICS ........................................................................................................ 9 Claims Counts ........................................................................................................................... 9 Age and Gender ...................................................................................................................... 10 Concentration .......................................................................................................................... 10 Definition of Disability ........................................................................................................... 11 Benefit Duration ...................................................................................................................... 11 Elimination Period .................................................................................................................. 11 Year of Incidence .................................................................................................................... 11 Termination Status .................................................................................................................. 12 Provincial Distribution ............................................................................................................ 12 Monthly Benefit ...................................................................................................................... 14
TABLE CONSTRUCTION .......................................................................................................... 14 Basis for Construction ............................................................................................................. 14 Graduation ............................................................................................................................... 15 Testing the Graduation ............................................................................................................ 16 Table Structure ........................................................................................................................ 16
COMPARISONS TO OTHER TABLES ..................................................................................... 17 Methodologies ......................................................................................................................... 17 CIA 1988–1997 ....................................................................................................................... 18 GLTD1987 .............................................................................................................................. 21 Krieger .................................................................................................................................... 23 Canadian Life Tables .............................................................................................................. 25
Methodology ........................................................................................................................... 32 Province .................................................................................................................................. 33 Benefit Amount ....................................................................................................................... 34 Year of Experience ................................................................................................................. 34 Cause of Disability .................................................................................................................. 34 Carrier ..................................................................................................................................... 36
CAVEATS .................................................................................................................................... 36 CONCLUSIONS AND RECOMMENDATIONS ....................................................................... 37
Study October 2011
3
INTRODUCTION
This study of termination experience under Canadian group long-term disability (LTD) policies was conducted by the Canadian Institute of Actuaries (CIA) through the Group Life & Health Experience Subcommittee (GLHS) of the Research Committee.
The most recently published graduated tables reflect the experience of the 1988–1997 period.
This project was initiated to produce tables based on more recent experience. The specific objectives were to provide:
• Termination rates (separately by death and recovery) by gender, age at disability (by age bands) and duration since disability, as well as an analysis of variations by region;
• A comparison of experience for claimants receiving Canada/Québec Pension Plan benefits to claimants not receiving these benefits; and
• An analytic comparison to the previous study.
The CIA retained Fraser Group and Denis Garand & Associates to act as the study managers. Their mandate was to:
• Collect and validate data submissions;
• Analyse the merged data;
• Produce termination tables using accepted actuarial methods;
• Prepare appropriate documentation including this study.
The initial data request for the study was issued in May 2009 with a data deadline of August 31, 2009. The initial data collection was actually completed by December 2009.
During the data validation process, a number of carriers provided supplemental data submissions to address certain deficiencies. In one case, it was necessary for the carrier to provide a completely new submission. The final merging of all validated data submissions was completed by the end of November 2010.
PROJECT GOVERNANCE
Chair of the Research Committee: Marc-André Belzil.
Former co-chairs of the Research Committee who were involved in the development of this study: Marc-André Melançon and Cathy Shum-Adams.
Members of the Group Life & Health Subcommittee: Peter Douglas—Chair, Donald Blue, Isabelle Bouchard, Erin Crump, Alain Dagneault, Réjean Dion, Ron Hoskins, Candice Hung, Micheline Lafond, Cindy Lau, Stella-Ann Ménard, Wayne Morris, Debra Shelley and Michel Simard.
Former subcommittee members, not currently on the subcommittee, who were involved in the development of this study: Joel Cornberg, Nathalie Laporte and Stéphane Levert.
Study October 2011
4
Insurance Companies Contributing Data
• Assumption Mutual Life Insurance; • Blue Cross Life Insurance Company of Canada; • Co-operators Life Insurance; • Desjardins Financial Security Life Assurance; • Empire Life Insurance; • Equitable Life Insurance; • Great-West Life Assurance; • Industrial Alliance Insurance and Financial Services; • La Capitale Insurance and Financial Services; • Manulife Financial; • Pacific Blue Cross (BC Life); • RBC Life Insurance; • SSQ Life Insurance; • Standard Life Assurance; • Sun Life Assurance; and • Wawanesa Life Insurance.
These 16 companies represent approximately 99% of the Canadian market for group long-term disability insurance during the study period.
Project Team
The CIA retained Fraser Group and Denis Garand & Associates to act as the study managers.
The project leaders were Ken Fraser and Denis Garand.
The project team also included Donna Swiderek, who worked on the data validation, and John Wipf, who handled the computation of exposures and terminations from the database, developed the analytical tables and assisted in the testing of the graduation.
Finally, the project team was fortunate to have the assistance of Peter Muirhead, who played a major role in the production of the earlier CIA LTD termination studies. Peter developed the graduation methods used in this project.
Special Thanks
A special note of thanks is offered to Michel Montambeault and the Office of the Chief Actuary in the Office of the Superintendent of Financial Institutions Canada for providing the CPP termination table for comparison purposes.
TERMINOLOGY
This section discusses a number of key terms used throughout this study.
ASO means Administrative Services Only, referring to arrangements where insurance companies administer benefit programs but do not assume any financial liability for the benefits which are self-insured by the plan sponsor (employer).
LTD means long-term disability insurance. In this study, it exclusively refers to coverage provided on a group basis. This is discussed in greater detail in the next section, SCOPE OF STUDY.
Study October 2011
5
Any Occ and Own Occ refer to the definitions of disability being used in the LTD contract. Own Occ defines disability as the inability of the claimant to perform the essential duties of his own occupation while Any Occ defines disability as the inability of the claimant to perform the duties of any occupation for which the employee is qualified by training, education or experience. Change in Definition (CiD) refers to the provision in most LTD contracts that shifts the definition of disability from Own Occ to the more stringent Any Occ basis after an initial period of disability (often two years). Thus, an individual may qualify for disability benefits for a certain period of time and then be ineligible for benefits even though there has been no change in the medical or vocational evidence.
Exposure has its usual actuarial sense and refers to claims which are active and thus ‘exposed’ to a contingent termination event. In this study, exposure quantities are expressed in ‘life-years’1
Subcommittee refers to the Group Life & Health Experience Subcommittee of the Research Committee of the Canadian Institute of Actuaries.
where a life-year represents a disability claim active for 12 months. Exposure is quantified as the number of claims (rather than amount of benefit). As discussed in the study, the quantum used in the computation of exposure may be months, years or fractions thereof.
Termination refers to any contingent event which terminates an otherwise active claim. Thus, a claim which ends due to the attainment of a maximum benefit period (e.g., age 65) is not a termination. In this study, termination is used to include both mortality and recovery (see below).
Mortality refers to terminations which result from the death of the claimant. There is a subtle but important difference between the use in this study and elsewhere. In most actuarial studies, a mortality event in a given period means the insured person has died in that period. That is not necessarily so in the case of LTD terminations. In contracts which have survivor benefits, the claim will continue to be active for several months after the claimant has died. Thus, mortality should be interpreted to mean that the claim has terminated AND the reason for termination is death (two separate and not necessarily contemporary events). Recovery is used in this study to refer to any termination which is not due to mortality. While this includes the plain language meaning (i.e., claimants have made a medical recovery from their injury or illness and have returned to work), recovery in this study also includes any situation where a claim was terminated by an insurance company (other than for death). Notably, this includes change in definition scenarios where the claimant no longer qualifies under a more stringent definition of disability. It would also include situations where claimants abandon a claim by not submitting required information and situations where the insurance company determines that the evidence does not support the continued payment of benefits.
Study database refers to the entire set of claims data which was accepted into the study. For various technical reasons, most analysis including construction of the termination tables actually used subsets of this database. In most cases, however, any exclusions were negligible.
SCOPE OF STUDY This section sets out the conceptual framework for the study.
1 Other disability termination studies have used ‘life-months’ as a measure of exposure.
Study October 2011
6
Policyholders
• Only Canadian employer–employee groups, insured and ASO2
o This includes:
.
Trade association or multiple-employer business; and Union welfare trust cases.
o To be excluded are: Creditors business; Affinity group business; and Groups covering non-Canadian employees.
Coverage Provisions
• Exclude policies with benefits payable for two or five years3
• Definition of disability, Own Occupation or Any Occupation.
. Include benefits payable for 10 or more years and benefits payable to a defined age (usually 65).
Reportable Claims All claims with a date of disability prior to December 31, 2008 and that were ‘in payment’ for any period between January 1, 2004 and December 31, 2008.
A claim is ‘in payment’ during a period if the claim has been approved by the carrier and the claimant is entitled to receive a payment in respect of disability during that period of time. This definition includes situations:
• Where the actual payment is reduced to zero because of integration with other benefits; and
• Where payments are withheld to offset earlier overpayments. Recurrent Claims
Where a claim is ‘recurrent’ as defined in the policy, several periods of disability may be considered as a single claim. Typically, the policy will require that the periods of disability are from the same cause and are not separated by more than six months’ return to work.
The study protocols required that such recurrent claims should be reported as a single claim record using the original date of disability and the most recent termination date.
On the other hand, if an individual had several periods of disability that are not defined as “recurrent” (e.g., different causes), then a separate claim record was to be submitted for each claim.
Claims under Partial or Residual Benefits
The data collection instructions were to include claimants if they initially satisfied an Any Occ or Own Occ definition of total disability.
2 Although the conceptual framework for the study included ASO business, methodological considerations
ultimately led to the exclusion of ASO claims. See DATA VALIDATION. 3 Notwithstanding this element in the Data Request, policies with two or five year benefits were included in the
Study Database but exposure was terminated one year prior to benefit termination as described in TABLE CONSTRUCTION on page 15.
Study October 2011
7
GUIDING CONCEPTS Intended Uses The construction of a table from raw data requires decisions on a large number of practical issues and often there is some tension among competing technical objectives. For this reason, it is useful to articulate the intended uses which guided the project team.
These uses are identified as:
• Valuation by insurance companies of Canadian LTD open claim liabilities in financial statements;
• Calculation by insurance companies of claim liabilities in the experience-rated accounting for specific policyholders;
• Use by insurance companies in the development of manual rates for group LTD benefits; and
• Valuation by self-funded plan sponsors of Canadian LTD open claim liabilities in financial statements.4
It is appropriate to acknowledge that the table may also be used in other contexts which were not explicitly addressed in the project.
In particular, we note that the mortality rates provided here might be useful in the pricing and reserving of a group life waiver provision where the definition of disability follows the provisions of a group LTD contract. We have no reason to dissuade users from this effort but do caution that this use was not in the formal mandate of the study.
Model Contract We believe users should be able to interpret the published tables as the expected value of an identifiable real world scenario. Specifically this requires that table values should not represent averages of a bimodal distribution.
We have therefore articulated a model scenario for which the table can be considered an optimal fit. The elements of this model include:
• Employee benefits plan; • Canadian employees; • Groups of varying size; • High levels of enrolment; • Guaranteed issue with excess underwritten; • Elimination periods of four to six months; • Benefits payable to age 65; • High replacement ratios but less than 100%;
4 However, as noted elsewhere in the report, claims from self-funded (ASO) cases were not used in the development of the tables.
Study October 2011
8
• Two-year own occupation definition of disability; • Industry-standard provisions for recurrent disability, all sources limits, rehab, etc.;
and • Industry-standard claim management practices such as early intervention.
Due to the filtering of claims accepted into the study, we also need to specify that claim management in this model scenario does not include the practice of lump sum settlements.
Users are therefore alerted to the need to consider adjustments if they face a situation that is widely variant from the model scenario; for instance, long waiting periods or variant contract provisions.
This is not to suggest that all exposure within the study was fully consistent with the model plan design, but the project team took care to manage exposure to avoid skews from the model. For instance, while we included exposure on plans with benefits to age 60, we only used the exposure up to age 59 so as to avoid anomalies associated with the last few months of benefit.
The major practical area of concern was the definition of disability. The difference between Own Occ and Any Occ benefits is significant, as evidenced by the obvious spikes in the raw data for terminations at months 24 and 28 and other periods.
Up to month 24, the evidence is solid that virtually all of the underlying experience is on Own Occ. Beyond 30 months, we know that Any Occ is the prevailing industry standard.
However, there were additional spikes at 36 and 48 months reflecting groups with 12- and 24-month waiting periods followed by two years’ Own Occ coverage.
The project team was successful in locating and removing a small number of groups which accounted for the bulk of the additional terminations at 48 months. However, it is important to note that the data still contain a small number of claims with a non-standard change of definition. These occur at almost every duration from 30 to 60 months. We have relied on the graduation process to deal with these minor distortions.
DATA VALIDATION
ASO Claims
Claims from administrative services only (ASO) contracts were included in the initial study design and in the data collection. However, the subcommittee ultimately decided to exclude ASO claims from the study.
While it would have been useful to explore variances between insured and ASO business, it would have been difficult to generalize from the available data for two reasons:
• The available exposure was limited; and • The majority of the exposure came from one carrier.
As well, it was considered inappropriate to publish even speculative conclusions which might tend to reveal proprietary data from an individual contributor.
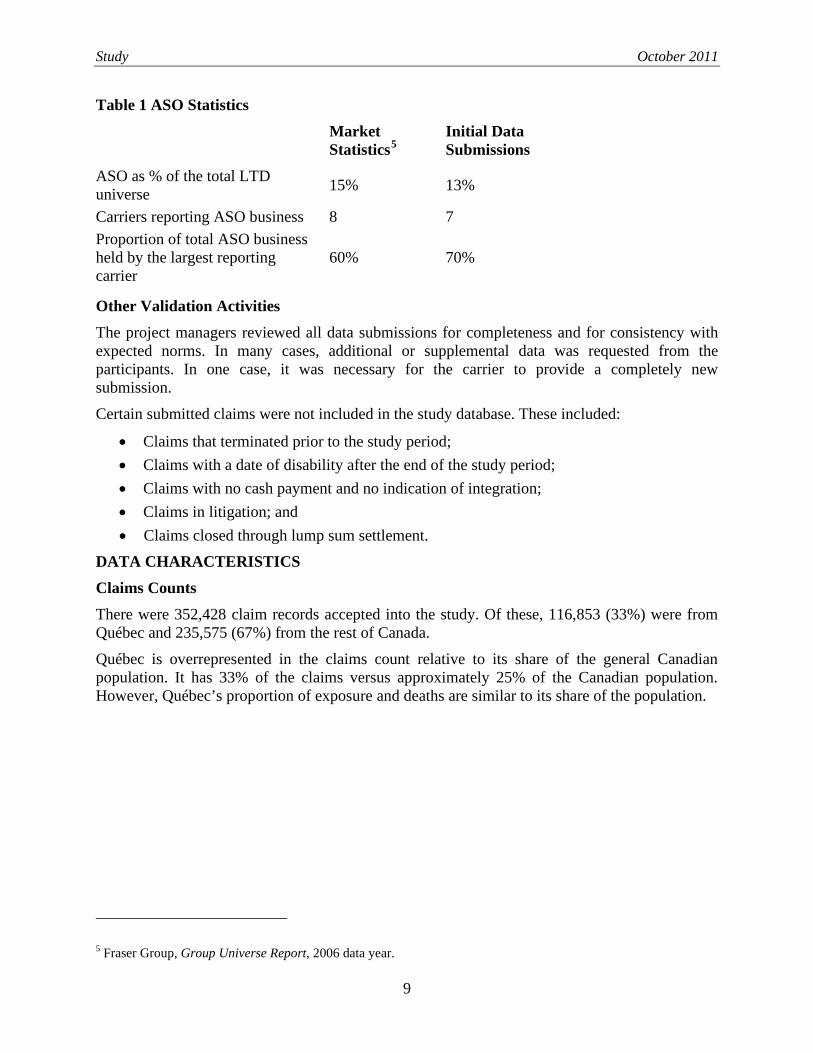
The significant skew in the marketplace is shown in the table below. The skew was amplified in the study database because one significant carrier did not include ASO claims in their submission.
Study October 2011
9
Table 1 ASO Statistics Market
Statistics5Initial Data Submissions
ASO as % of the total LTD universe 15% 13%
Carriers reporting ASO business 8 7 Proportion of total ASO business held by the largest reporting carrier
60% 70%
Other Validation Activities The project managers reviewed all data submissions for completeness and for consistency with expected norms. In many cases, additional or supplemental data was requested from the participants. In one case, it was necessary for the carrier to provide a completely new submission.
Certain submitted claims were not included in the study database. These included:
• Claims that terminated prior to the study period; • Claims with a date of disability after the end of the study period; • Claims with no cash payment and no indication of integration; • Claims in litigation; and • Claims closed through lump sum settlement.
DATA CHARACTERISTICS Claims Counts There were 352,428 claim records accepted into the study. Of these, 116,853 (33%) were from Québec and 235,575 (67%) from the rest of Canada.
Québec is overrepresented in the claims count relative to its share of the general Canadian population. It has 33% of the claims versus approximately 25% of the Canadian population. However, Québec’s proportion of exposure and deaths are similar to its share of the population.
5 Fraser Group, Group Universe Report, 2006 data year.
Age and Gender The average age at disability for the entire study was 46.2 years old (45.2 for females and 47.2 for males). Québec claimants were slightly younger than non-Québec claimants.
Table 3 Average Age by Gender and Region Québec Non-Québec Total Male 46.5 47.6 47.2 Female 44.3 45.7 45.2 Overall 45.4 46.6 46.2
Table 4 Gender Distribution by Region Québec Non-Québec Total Female 51% 53% 52% Male 49% 47% 48%
The table below shows the average age at disability for claimants who became disabled during the study period. It indicates an increasing age trend among new claimants.
Table 5 Average Age of New Claims by Year of Incidence Year Male Female Overall
2004 47.0 45.1 46.0
2005 47.1 45.2 46.1
2006 47.5 45.6 46.5
2007 47.8 45.9 46.8
2008 47.7 45.8 46.7
Concentration The largest single data contribution accounted for 26% of the claims. The smallest was significantly less than 1%.
The top three carriers accounted for 69% of the claims in the study. The largest eight carriers (50% of the participant group) accounted for 92% of the submitted claims.
Study October 2011
11
Definition of Disability Approximately 95.5% of the claims were under an initial Own Occ definition with the balance being Any Occ. This is an estimate based on information available in 79% of the data. Not all carriers were able to provide this data element.
Benefit Duration Benefit duration To Age 65 accounted for 97.2% of the claims. To Age 60 accounted for 1.0% of the claims. The remaining 1.8% was scattered over a wide range of values, none of which exceeded 0.1% of the total.
Elimination Period The distribution of elimination periods is shown in the following table. The most common elimination period was four months (47%) followed by six months (22%). Table 6 Distribution of Claimants by Elimination Period Elimination Period (days)
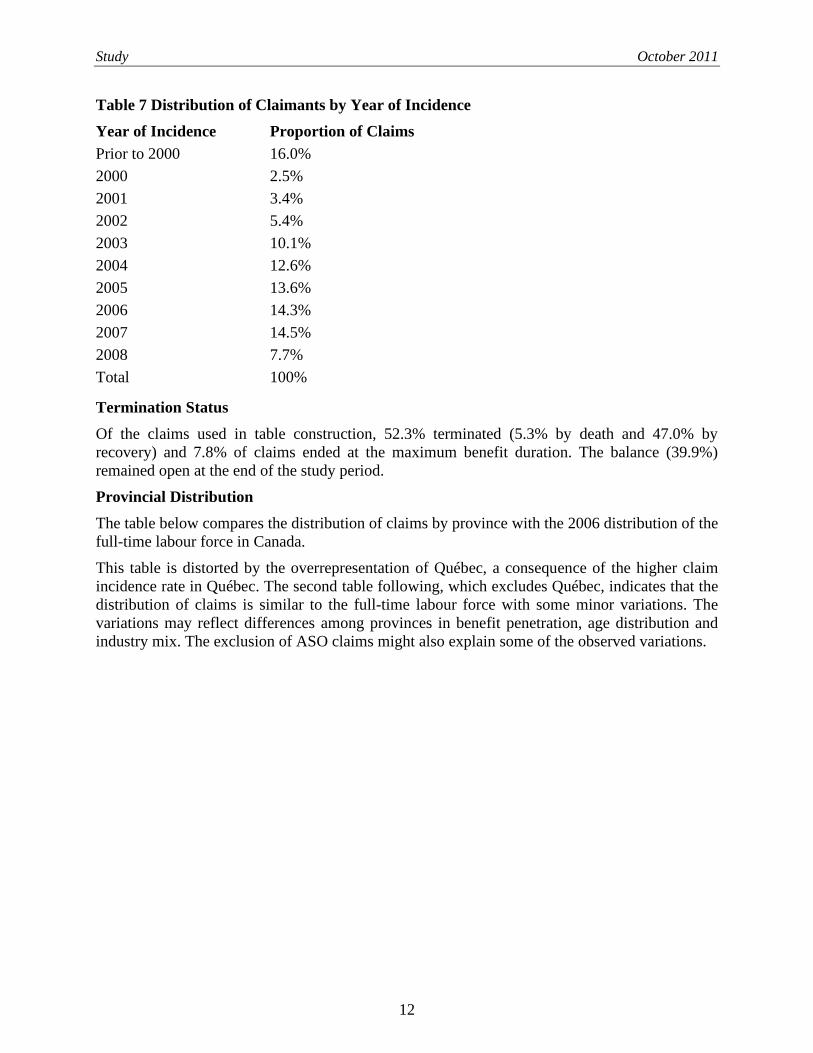
Year of Incidence The following table presents the distribution of claims used for the tables by year of incidence.
Study October 2011
12
Table 7 Distribution of Claimants by Year of Incidence Year of Incidence Proportion of Claims Prior to 2000 16.0% 2000 2.5% 2001 3.4% 2002 5.4% 2003 10.1% 2004 12.6% 2005 13.6% 2006 14.3% 2007 14.5% 2008 7.7% Total 100%
Termination Status Of the claims used in table construction, 52.3% terminated (5.3% by death and 47.0% by recovery) and 7.8% of claims ended at the maximum benefit duration. The balance (39.9%) remained open at the end of the study period.
Provincial Distribution The table below compares the distribution of claims by province with the 2006 distribution of the full-time labour force in Canada.
This table is distorted by the overrepresentation of Québec, a consequence of the higher claim incidence rate in Québec. The second table following, which excludes Québec, indicates that the distribution of claims is similar to the full-time labour force with some minor variations. The variations may reflect differences among provinces in benefit penetration, age distribution and industry mix. The exclusion of ASO claims might also explain some of the observed variations.
Study October 2011
13
Table 8 Distribution of Claims by Province compared to Full-time Employment Province Distribution
of Claims Full-time
Employed Canadians*
Newfoundland and Labrador
1.5% 1.5%
Prince Edward Island
0.4% 0.4%
Nova Scotia 3.0% 2.9%
New Brunswick 3.2% 2.4%
Québec 33.2% 24.6%
Ontario 34.7% 40.1%
Manitoba 3.2% 3.6%
Saskatchewan 2.3% 2.8%
Alberta 9.3% 9.5%
British Columbia 9.2% 12.1%
Total 100.0% 100.0%
*Statistics Canada, 2006 data.
Table 9 Distribution of Claims by Province compared to Full-time Employment (Excluding Québec) Province Distribution
of Claims Full-time
Employed Canadians
Newfoundland and Labrador
2.3% 2.0%
Prince Edward Island
0.6% 0.5%
Nova Scotia 4.6% 3.9%
New Brunswick 4.8% 3.2%
Québec
Ontario 51.9% 53.3%
Manitoba 4.8% 4.8%
Saskatchewan 3.4% 3.7%
Alberta 13.9% 12.6%
British Columbia 13.8% 16.1%
Total 100.0% 100.0%
Study October 2011
14
Monthly Benefit
The distribution of insured monthly benefit (before integration) in the claim file is shown below.
Table 10 Distribution of Claims by Gross Monthly Benefit
Gross Monthly Benefit Percent of Claims 0 but less than $500 2.6%
$500 but less than $1,000 7.4%
$1,000 but less than $1,500 18.0%
$1,500 but less than $2,000 24.4%
$2,000 but less than $2,500 18.7%
$2,500 but less than $3,000 12.3%
$3,000 but less than $3,500 6.6%
$3,500 but less than $4,000 4.0%
$4,000 but less than $4,500 2.2%
$4,500 but less than $5,000 1.2%
$5,000 but less than $5,500 0.6%
All others 0.9%
No data 1.1%
TABLE CONSTRUCTION
Basis for Construction
• The source data consisted of the combined data from all contributors after the remediation efforts described earlier in this study.
• Claims generally contributed to exposure from the first day of benefit. • Claims with an Own Occ definition and elimination periods of more than two years (from
599 to 1,856 days) were excluded from the exposure until 61 months after the date of disability. The purpose was to eliminate the change in definition bumps around 48 months and 60 months. While the number of claims involved was quite small, they were concentrated by region and gender so it was considered prudent to exclude the early exposure.
• For insured benefit durations other than to age 65, exposure was credited only until the earlier of 12 months before benefit termination or age 65. For instance, for benefit duration to age 60, exposure beyond age 59 was dropped. A similar approach was used with fixed-term benefits, such as 10 years. Observation was terminated 12 months prior to benefit termination unless the maximum duration would be age 65 or more.
• Any Occ claims, although a small fraction of the claims, were included in the exposure from the end of the elimination period.
Study October 2011
15
• Exposure was computed for each month for the first five years (60 months) and for each year thereafter.
• For terminating claims (death or recovery), a full period of exposure (month or year) was credited for the period in which the termination occurred.
• For other claims, exposure was terminated abruptly at end points and the appropriate fractional period of exposure was credited. These end points include the end of the study period, the limiting age (e.g., age 65) or termination of exposure for methodological reasons. The latter category includes claims where the benefit duration was not to age 65. Exposure for these claims was credited to the earlier of one year before benefit termination or age 65.
• Similarly, a fraction of an exposure period was credited when a claim incurred prior to the beginning of the study period entered the study period on January 1, 2004.
• Crude termination rates were computed for five-year age brackets by dividing claim terminations in the observation period by the exposure credited for the period.
• The first age band (central age 22) is based on data from individuals aged 24 or less. • Age is based on age last birthday.
Graduation The rates in the published tables have been smoothed for presentation. The general approach was to smooth the crude rates by duration and by age during the first 10 years of disability. After 10 years of disability, terminations and deaths were no longer assumed to be related to the duration of disability but only to attained age.
Tables for the first 10 years of disability were determined separately for Québec Males, Québec Females, Non-Québec Males and Non-Québec Females. After 10 years of disability tables were separated only for Males and Females.
In the graduation, rates were smoothed between the select period (first 10 years of disability) and the ultimate period (beyond 10 years of disability).
The graduation process found parameters that minimized the ‘squared errors’ (square of the difference between expected and actual numbers).
The basic graduation approach was to fit a mix of exponential curves to the data. The approach used a combination of two exponential curves recognizing that LTD claims are a mix of relatively long-term claims and relatively shorter disability claims.
The graduation model also assumed the existence of a separate decrement related to the change in definition from Own Occ to Any Occ (CiD). The model assumed there was a CiD rate applicable at various CiD points. The actual assumption used was that the data was a mix of CiD occurring at 24, 27, 28, 30 and 36 months. The effect of this component was to isolate the ‘excess’6
During the graduation it was noticed that terminations are much lower in the first two months after the elimination period. Since in most applications of the table the claimant data is beyond
terminations due to change of definition.
6 Excess, that is, over normal terminations due to death, return to work or declination of claim for reasons other than
change of definition.
Study October 2011
16
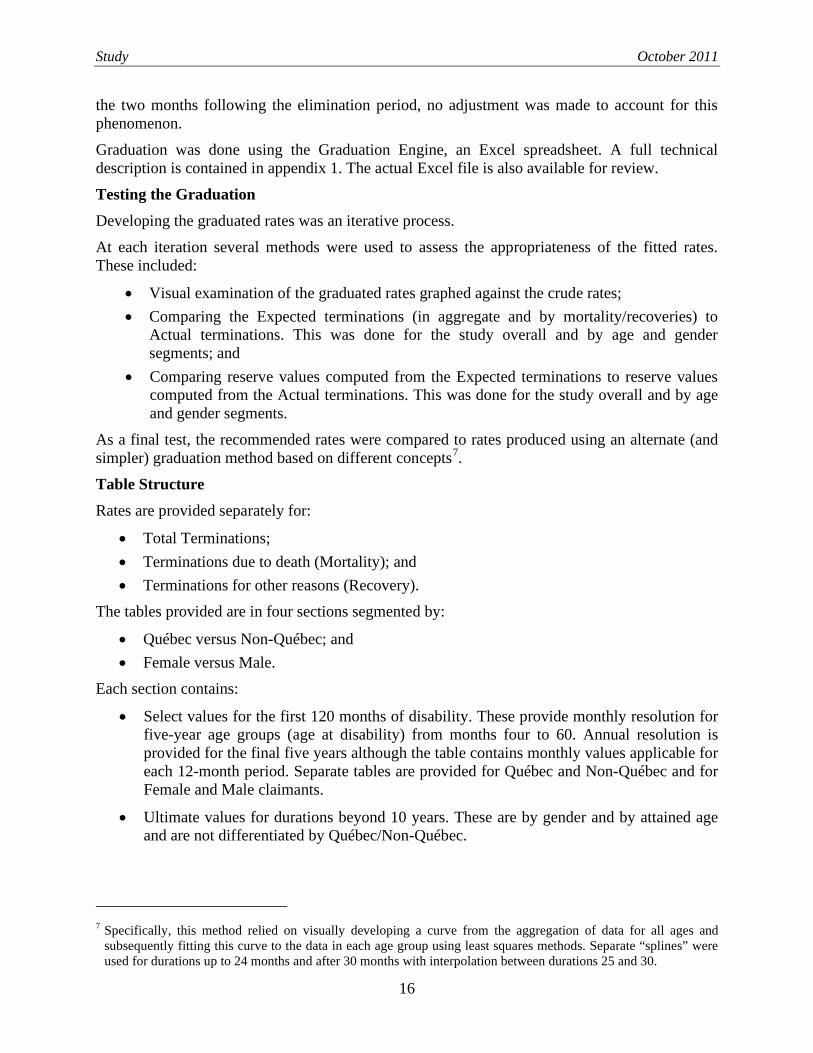
the two months following the elimination period, no adjustment was made to account for this phenomenon.
Graduation was done using the Graduation Engine, an Excel spreadsheet. A full technical description is contained in appendix 1. The actual Excel file is also available for review.
Testing the Graduation Developing the graduated rates was an iterative process.
At each iteration several methods were used to assess the appropriateness of the fitted rates. These included:
• Visual examination of the graduated rates graphed against the crude rates; • Comparing the Expected terminations (in aggregate and by mortality/recoveries) to
Actual terminations. This was done for the study overall and by age and gender segments; and
• Comparing reserve values computed from the Expected terminations to reserve values computed from the Actual terminations. This was done for the study overall and by age and gender segments.
As a final test, the recommended rates were compared to rates produced using an alternate (and simpler) graduation method based on different concepts7
Table Structure .
Rates are provided separately for:
• Total Terminations; • Terminations due to death (Mortality); and • Terminations for other reasons (Recovery).
The tables provided are in four sections segmented by:
• Québec versus Non-Québec; and • Female versus Male.
Each section contains:
• Select values for the first 120 months of disability. These provide monthly resolution for five-year age groups (age at disability) from months four to 60. Annual resolution is provided for the final five years although the table contains monthly values applicable for each 12-month period. Separate tables are provided for Québec and Non-Québec and for Female and Male claimants.
• Ultimate values for durations beyond 10 years. These are by gender and by attained age and are not differentiated by Québec/Non-Québec.
7 Specifically, this method relied on visually developing a curve from the aggregation of data for all ages and
subsequently fitting this curve to the data in each age group using least squares methods. Separate “splines” were used for durations up to 24 months and after 30 months with interpolation between durations 25 and 30.
Study October 2011
17
Each table section also includes adjustment values to account for the excess terminations at the Change in Definition point. For most applications, this adjustment would be added to the ‘base’ rates to produce a working table.
The final tables are provided in a separate document, the Tables Supplement, available in Excel format. COMPARISONS TO OTHER TABLES This section presents comparisons of the termination rates developed in this study with those published in other tables.
Comparisons are made with two tables designed for the valuation of LTD benefits:
• Study on Canadian Group Long-term Disability Termination Experience (1988–1997). Canadian Institute of Actuaries, 2010.
• Group Long-Term Disability (GLTD) Valuation Tables. Society of Actuaries, 1987. The mortality experience of the study database is also compared with:
• 1970 Intercompany Life Waiver Mortality table (the Krieger table); and • Life Tables, Canada, Provinces and Territories 2000–2002, Statistics Canada.
Methodologies Two different approaches were used in these comparisons.
To compare the two previous LTD valuation tables, a ratio of survival function values was used. The survival function value (in the context of disability claims termination rates) indicates for a given duration what proportion of the originally disabled claimants is still active8
• Survival function value for the table in this study; and
.
For the comparisons in the following section, the reported ratios consist of:
• Survival function value for the table in the earlier study. A ratio less than 100% indicates that the new table has lower survival rates (i.e., higher termination rates) than the comparison table and vice versa.
8 For example, if the termination rate in duration 1 is 0.10 and in duration 2 is 0.20, then the value of the survival function at the end of duration 1 is 0.90 (1.00–0.10) and at the end of duration 2 is 0.72 (1.00–0.10)(1.00–0.20).
Study October 2011
18
For the CIA 1988–1997 table, the survival functions are developed separately for mortality and recovery. In each case, the value of the function at a given duration represents the proportion of the initial population which would be still active if mortality or recovery were the only decrement.
For comparisons involving mortality rather than termination tables, an actual to expected analysis was used. These comparisons use the actual mortality experience from the study database versus the expected mortality from the indicated table.
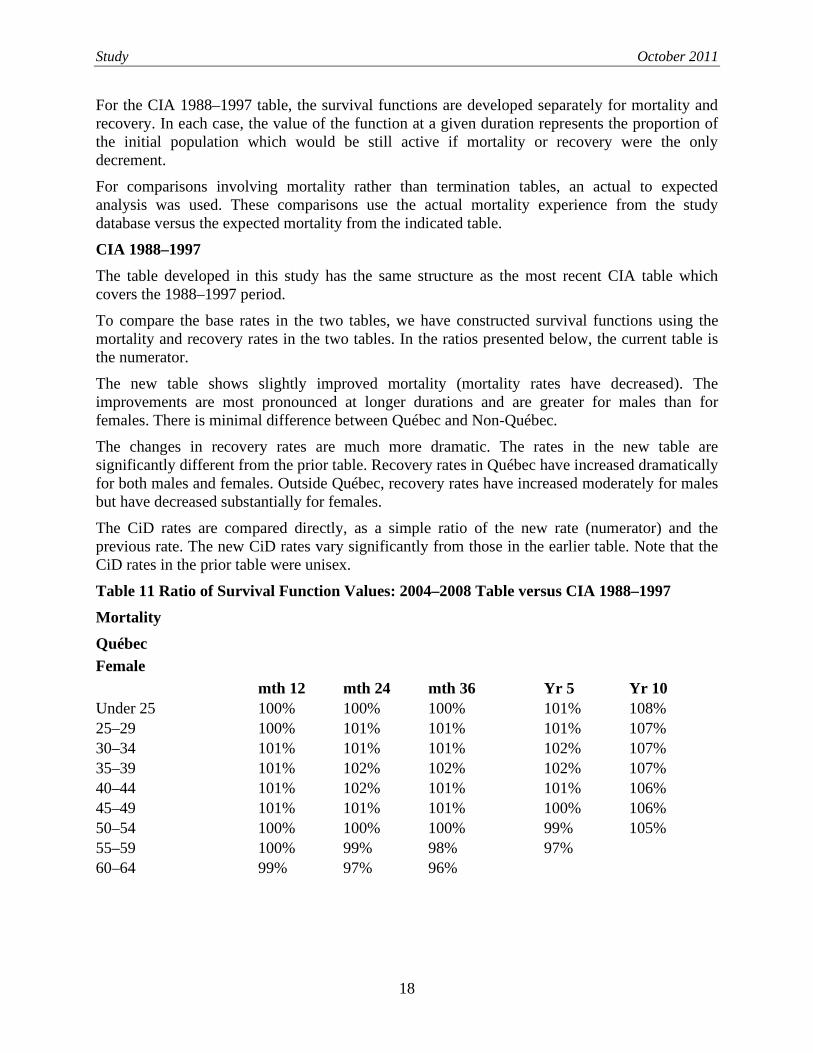
CIA 1988–1997 The table developed in this study has the same structure as the most recent CIA table which covers the 1988–1997 period.
To compare the base rates in the two tables, we have constructed survival functions using the mortality and recovery rates in the two tables. In the ratios presented below, the current table is the numerator.
The new table shows slightly improved mortality (mortality rates have decreased). The improvements are most pronounced at longer durations and are greater for males than for females. There is minimal difference between Québec and Non-Québec.
The changes in recovery rates are much more dramatic. The rates in the new table are significantly different from the prior table. Recovery rates in Québec have increased dramatically for both males and females. Outside Québec, recovery rates have increased moderately for males but have decreased substantially for females.
The CiD rates are compared directly, as a simple ratio of the new rate (numerator) and the previous rate. The new CiD rates vary significantly from those in the earlier table. Note that the CiD rates in the prior table were unisex.
Table 11 Ratio of Survival Function Values: 2004–2008 Table versus CIA 1988–1997 Mortality Québec Female
Table 13 Ratio of Change in Definition Rates: 2004–2008 Table versus CIA 1988–1997
Duration
Female
Male
Québec Non-Québec Québec Non-Québec
Under 25
59% 75%
91% 145% 25–29
77% 74%
71% 140%
30–34
95% 73%
58% 134% 35–39
111% 72%
49% 128%
40–44
124% 71%
43% 122% 45–49
132% 68%
39% 114%
50–54
132% 65%
37% 104% 55–59
122% 59%
37% 91%
60–64
102% 51%
37% 67%
GLTD1987 The GLTD table was published by the Society of Actuaries in 1987 based on U.S. and Canadian experience prior to 19809
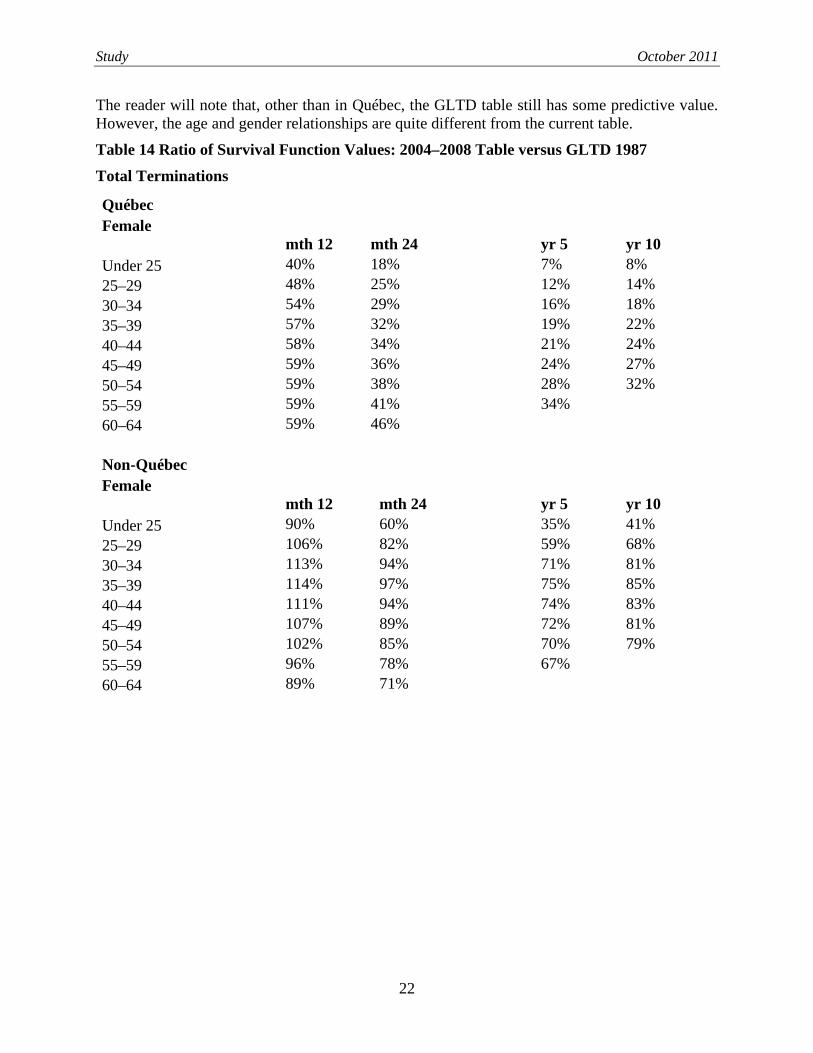
The GLTD table does not provide separate mortality and recovery values so the comparison is based on the rates for total terminations. It should also be noted that the GLTD table does not provide an explicit adjustment for the change of definition.
. Despite its age, this table still plays a role as a base table in the pricing and valuation of Canadian LTD policies.
The GLTD table does not differentiate between Québec and Non-Québec.
10
9 See Transactions of the Society Of Actuaries 1987: Vol. 39. 10 The GLTD table is based on predominantly U.S. experience prior to 1980. The table was built in three sections using different experience data to develop rates up to 24 months, 24 to 120 months and longer durations. Terminations due to change of definition are implicitly included in the table.
As in the previous section, the comparison uses the ratio of survival function values. The new table produced in this study is the numerator.
This comparison uses the base values from the GLTD table without margins for valuation.
Study October 2011
22
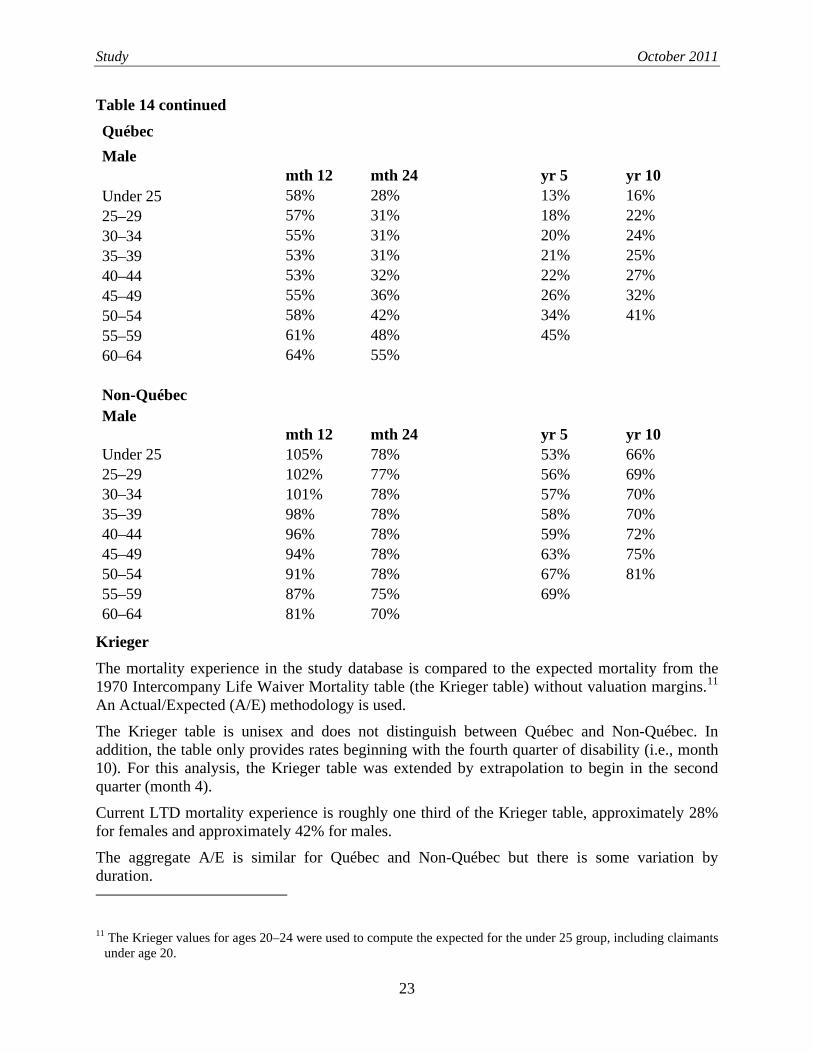
The reader will note that, other than in Québec, the GLTD table still has some predictive value. However, the age and gender relationships are quite different from the current table.
Table 14 Ratio of Survival Function Values: 2004–2008 Table versus GLTD 1987 Total Terminations
Krieger The mortality experience in the study database is compared to the expected mortality from the 1970 Intercompany Life Waiver Mortality table (the Krieger table) without valuation margins.11
The aggregate A/E is similar for Québec and Non-Québec but there is some variation by duration.
An Actual/Expected (A/E) methodology is used.
The Krieger table is unisex and does not distinguish between Québec and Non-Québec. In addition, the table only provides rates beginning with the fourth quarter of disability (i.e., month 10). For this analysis, the Krieger table was extended by extrapolation to begin in the second quarter (month 4).
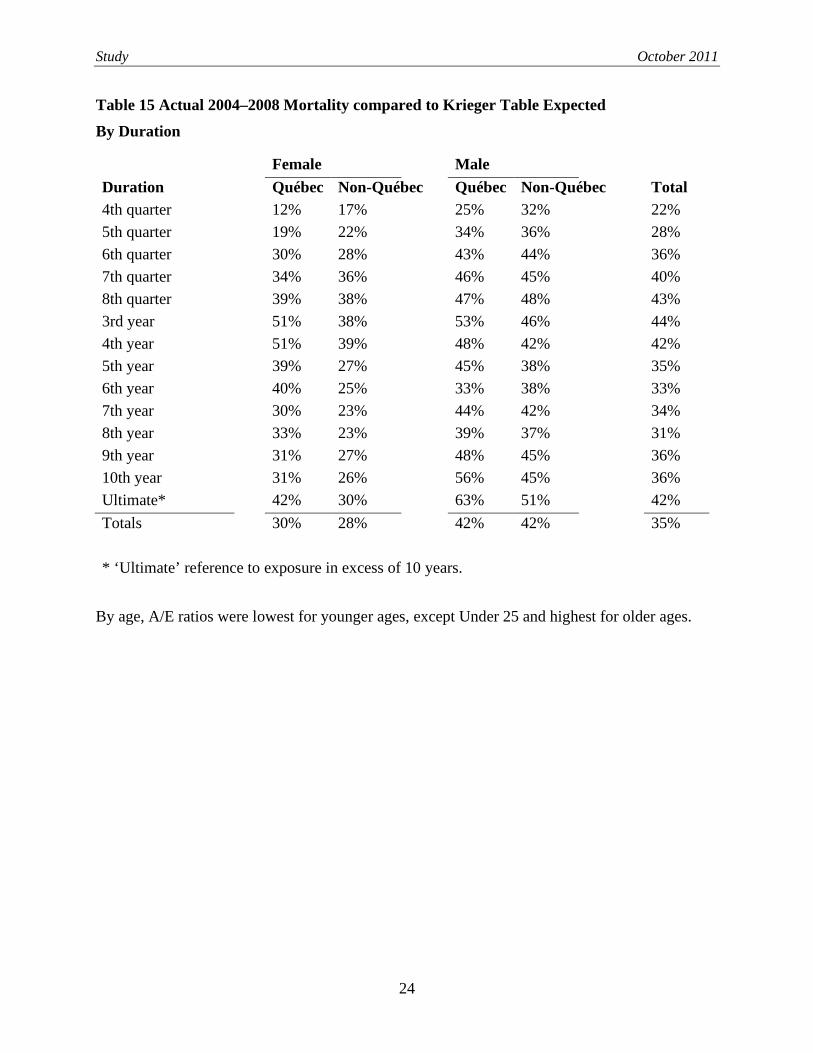
Current LTD mortality experience is roughly one third of the Krieger table, approximately 28% for females and approximately 42% for males.
11 The Krieger values for ages 20–24 were used to compute the expected for the under 25 group, including claimants under age 20.
Study October 2011
24
Table 15 Actual 2004–2008 Mortality compared to Krieger Table Expected By Duration
Duration
Female
Male
Québec Non-Québec Québec Non-Québec Total
4th quarter
12% 17%
25% 32%
22% 5th quarter
19% 22%
34% 36%
28%
6th quarter
30% 28%
43% 44%
36% 7th quarter
34% 36%
46% 45%
40%
8th quarter
39% 38%
47% 48%
43% 3rd year
51% 38%
53% 46%
44%
4th year
51% 39%
48% 42%
42% 5th year
39% 27%
45% 38%
35%
6th year
40% 25%
33% 38%
33% 7th year
30% 23%
44% 42%
34%
8th year
33% 23%
39% 37%
31% 9th year
31% 27%
48% 45%
36%
10th year
31% 26%
56% 45%
36% Ultimate*
42% 30%
63% 51%
42%
Totals
30% 28%
42% 42%
35% * ‘Ultimate’ reference to exposure in excess of 10 years.
By age, A/E ratios were lowest for younger ages, except Under 25 and highest for older ages.
Study October 2011
25
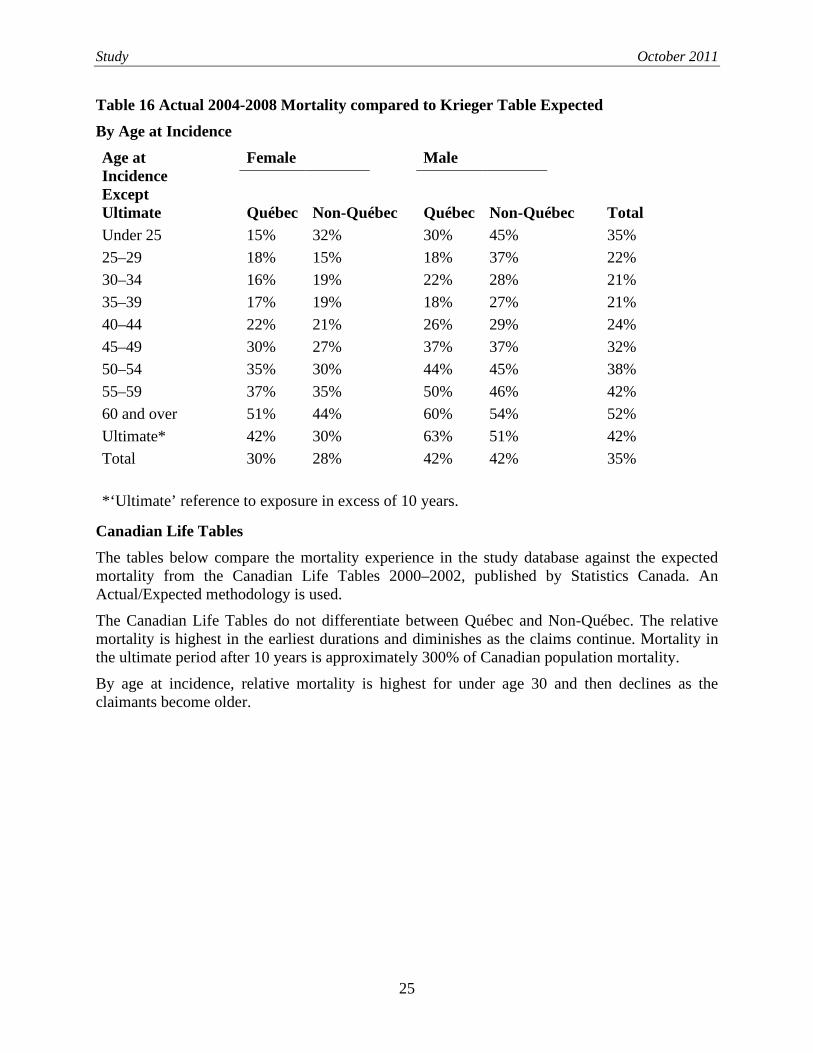
Table 16 Actual 2004-2008 Mortality compared to Krieger Table Expected By Age at Incidence Age at Incidence Except Ultimate
Female
Male
Québec Non-Québec Québec Non-Québec Total
Under 25
15% 32%
30% 45%
35% 25–29
18% 15%
18% 37%
22%
30–34
16% 19%
22% 28%
21% 35–39
17% 19%
18% 27%
21%
40–44
22% 21%
26% 29%
24% 45–49
30% 27%
37% 37%
32%
50–54
35% 30%
44% 45%
38% 55–59
37% 35%
50% 46%
42%
60 and over
51% 44%
60% 54%
52% Ultimate*
42% 30%
63% 51%
42%
Total
30% 28%
42% 42%
35%
*‘Ultimate’ reference to exposure in excess of 10 years.
Canadian Life Tables The tables below compare the mortality experience in the study database against the expected mortality from the Canadian Life Tables 2000–2002, published by Statistics Canada. An Actual/Expected methodology is used.
The Canadian Life Tables do not differentiate between Québec and Non-Québec. The relative mortality is highest in the earliest durations and diminishes as the claims continue. Mortality in the ultimate period after 10 years is approximately 300% of Canadian population mortality.
By age at incidence, relative mortality is highest for under age 30 and then declines as the claimants become older.
Study October 2011
26
Table 17 Actual 2004–2008 Mortality compared to Canadian Life Tables By Duration
Duration
Female Male Québec Non-Québec Québec Non-Québec Total
1st year 1,226% 1,479% 1,083% 1,424% 1,349% 2nd year 1,526% 1,422% 1,073% 1,060% 1,196% 3rd year 1,398% 1,008% 710% 643% 797% 4th year 1,084% 816% 496% 470% 602% 5th year 749% 530% 433% 397% 459% 6th year 701% 446% 302% 367% 406% 7th year 459% 359% 371% 360% 370% 8th year 451% 316% 297% 285% 311% 9th year 397% 338% 340% 320% 335% 10th year 354% 299% 367% 299% 314% over 10 years
406% 296% 355% 295% 313%
Totals 819% 704% 617% 592% 647%
Table 18 Actual 2004–2008 Mortality compared to Canadian Life Tables By Age at Incidence
CPP/QPP Most LTD plans integrate benefits with the Canada Pension and Québec Pension Plans (CPP/QPP).
Because of coding issues, data from two large carriers representing approximately 30% of the data had to be excluded from the analyses presented in this section. With this exclusion, there were 79,237 claims approved for CPP/QPP (16,068 for Québec and 63,169 for Non-Québec).
Study October 2011
27
Within this subset of claims with CPP/QPP approval, there were 4,712 recoveries and 7,950 deaths for a total of 12,662 terminations. This compares with nearly 190,000 terminations in the study database.
Two analyses relating to CPP/QPP approvals have been done in order to answer the following questions:
1. How do the CPP/QPP claimants who are also insured for group LTD compare to the total universe of CPP/QPP claimants?
2. How many LTD claims will ultimately be approved for CPP/QPP?
To answer the first question, an Actual/Expected analysis was done using the expected terminations rates developed by the CPP actuary based on CPP disability experience over the period 1999 to 2008. Only LTD claimants who have been approved for benefits under the Canada or Québec Pension Plans are used in this analysis.
The CPP table was used for both Québec and the Non-Québec. The results are presented below. As expected, termination rates for LTD claimants with CPP/QPP were generally higher than the CPP expected values (140% overall). However, mortality was also higher than the CPP expected value (119%).
The detailed results for total terminations are presented below.
Table 19 Actual 2004–2008 Terminations compared to Canada Pension Plan By Age at Incidence Québec Female
Age 1st yr 2nd yr 3rd yr 4th yr 5th yr Ultimate Total Under 25 inadequate data 25–29 0% 97% 419% 125% 193% 28% 73% 30–34 101% 177% 166% 266% 0% 89% 104% 35–39 136% 127% 103% 171% 203% 109% 120% 40–44 134% 185% 231% 203% 139% 160% 170% 45–49 182% 188% 142% 131% 140% 141% 150% 50–54 86% 201% 228% 239% 169% 197% 191% 55–59 122% 109% 189% 168% 125% 207% 148% 60 plus 105% 163% 179% 88% 214% 0% 143%
All Ages 121% 161% 191% 178% 148% 138% 150%
Study October 2011
28
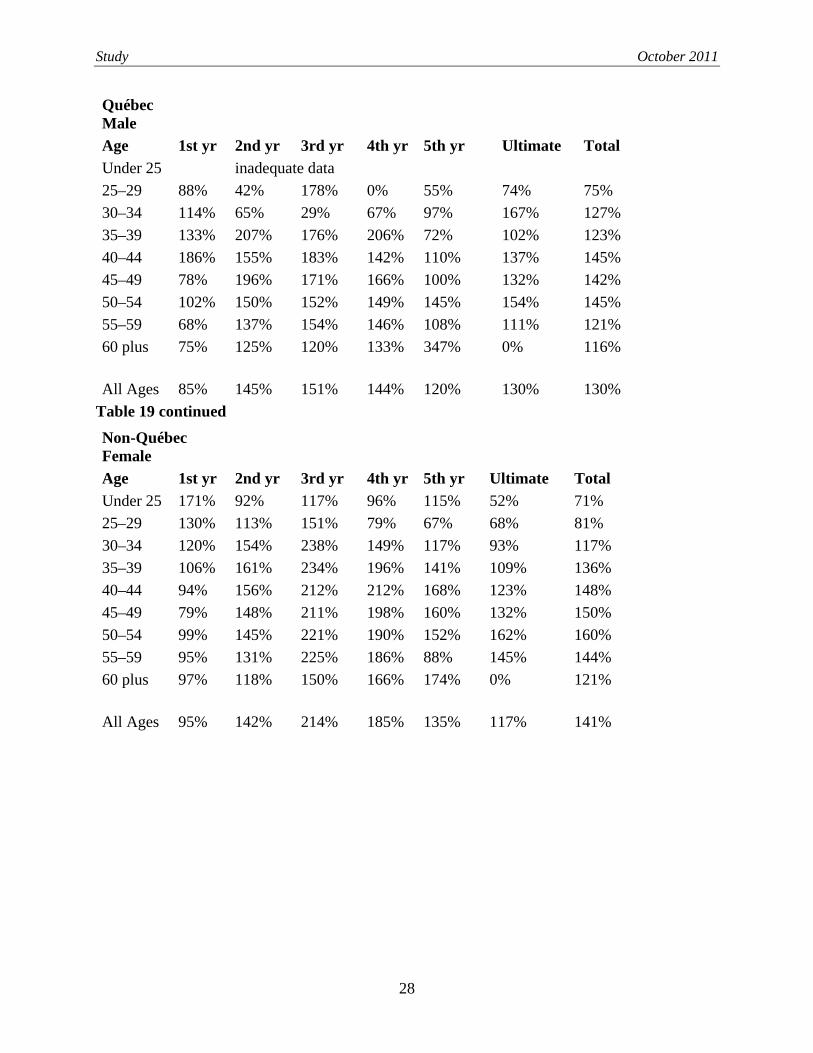
Québec Male
Age 1st yr 2nd yr 3rd yr 4th yr 5th yr Ultimate Total Under 25 inadequate data 25–29 88% 42% 178% 0% 55% 74% 75% 30–34 114% 65% 29% 67% 97% 167% 127% 35–39 133% 207% 176% 206% 72% 102% 123% 40–44 186% 155% 183% 142% 110% 137% 145% 45–49 78% 196% 171% 166% 100% 132% 142% 50–54 102% 150% 152% 149% 145% 154% 145% 55–59 68% 137% 154% 146% 108% 111% 121% 60 plus 75% 125% 120% 133% 347% 0% 116%
All Ages 85% 145% 151% 144% 120% 130% 130% Table 19 continued Non-Québec Female
Age 1st yr 2nd yr 3rd yr 4th yr 5th yr Ultimate Total Under 25 171% 92% 117% 96% 115% 52% 71% 25–29 130% 113% 151% 79% 67% 68% 81% 30–34 120% 154% 238% 149% 117% 93% 117% 35–39 106% 161% 234% 196% 141% 109% 136% 40–44 94% 156% 212% 212% 168% 123% 148% 45–49 79% 148% 211% 198% 160% 132% 150% 50–54 99% 145% 221% 190% 152% 162% 160% 55–59 95% 131% 225% 186% 88% 145% 144% 60 plus 97% 118% 150% 166% 174% 0% 121%
All Ages 95% 142% 214% 185% 135% 117% 141%
Study October 2011
29
Non-Québec Male
Age 1st yr 2nd yr 3rd yr 4th yr 5th yr Ultimate Total Under 25 54% 141% 132% 59% 82% 37% 59% 25–29 68% 183% 167% 241% 52% 97% 122% 30–34 139% 199% 182% 150% 107% 146% 152% 35–39 146% 139% 196% 148% 120% 145% 148% 40–44 119% 143% 229% 197% 143% 148% 157% 45–49 107% 150% 192% 144% 116% 163% 153% 50–54 99% 142% 175% 156% 136% 154% 145% 55–59 89% 132% 167% 125% 97% 127% 124% 60 plus 101% 120% 147% 94% 169% 0% 117%
All Ages 100% 139% 179% 147% 118% 145% 140%
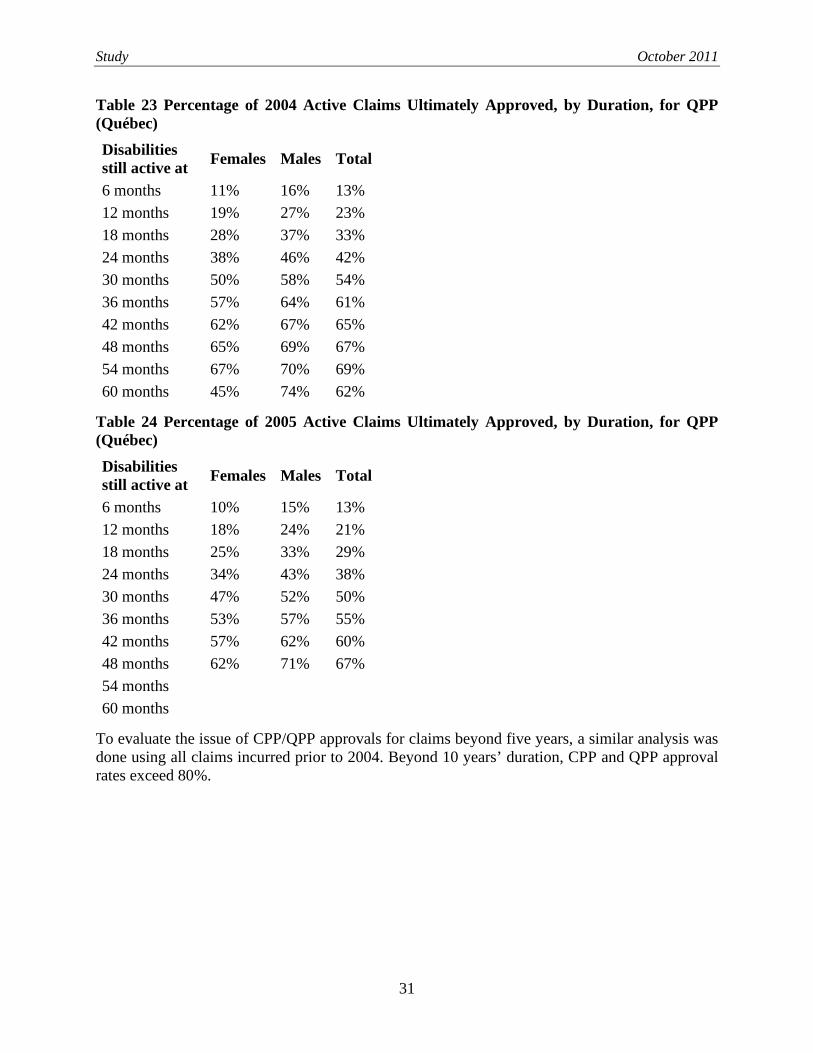
To examine the question of what is the ultimate likelihood that an LTD claim will receive CPP/QPP approval, an analysis was done using only claims incurred in 2004. These claims were then followed for up to five years until the end of the study period at December 2008. Due to coding issues, data from two large carriers representing approximately 30% of the data had to be excluded from this analysis. The following table indicates the number of records used in this analysis and those still active towards the end of the study period.
Table 20 Number of Initial and Surviving Claims in 2004 Cohort Number of Active Records CPP QPP At Date of Disability 20,801 10,340 At 48 months 5,977 1,225 At 60 months 494 97
As a sensitivity test, the cohort from 2005 was also analysed. The results from both cohorts are reasonably consistent for the first 48 months.
The analysis was done separately for Québec and Non-Québec.12
The tables below should be interpreted with care. It must be remembered that the study database does not capture the date of CPP approval or the date when the approval was recorded on the claim file. Because this is a retrospective analysis, we now have information that would not have been known in the early days of the claim. Thus, the percentage of CPP/QPP approvals reported for disabilities lasting six months, for instance, does not indicate how many claims will be approved at six months. It means how many will ultimately be approved.
13
12 The assumption is made that claimants in Québec are covered by QPP while other claimants are covered by CPP.
13 ‘Ultimately’ means until data was extracted for submission to this study and is thus limited to the subsequent four or five years of observation in many cases or somewhat longer for some portions of the data.
Study October 2011
30
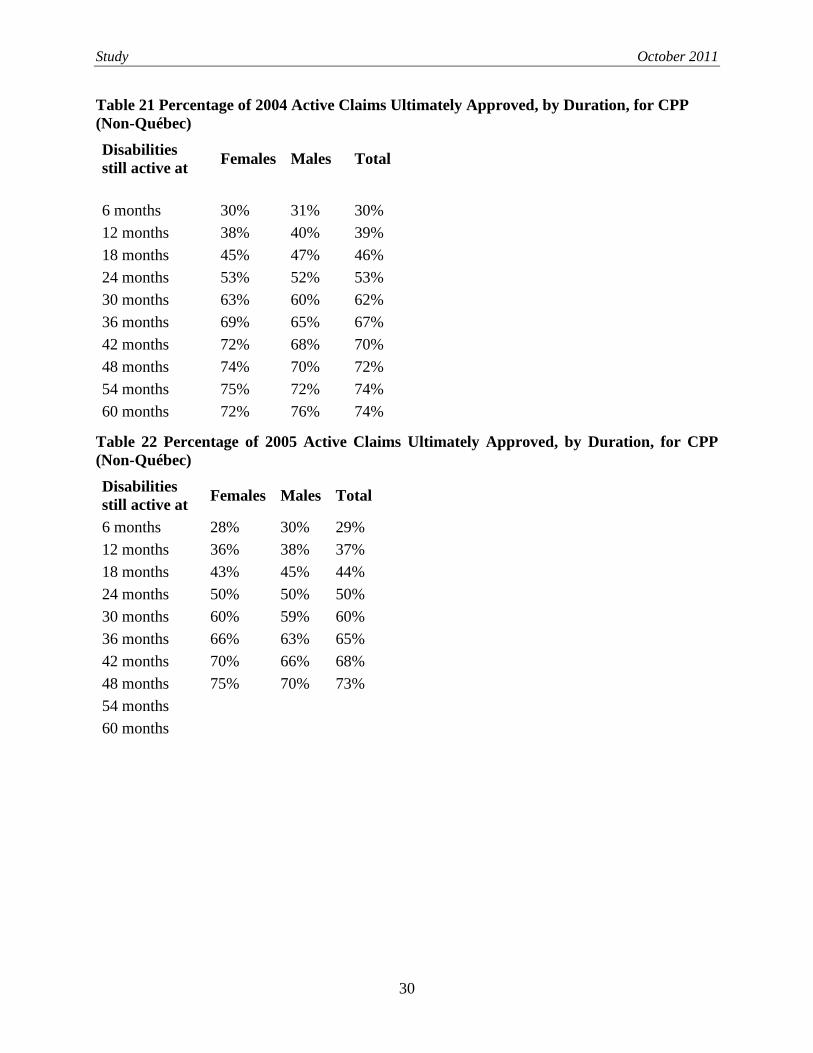
Table 21 Percentage of 2004 Active Claims Ultimately Approved, by Duration, for CPP (Non-Québec) Disabilities still active at Females Males Total
Table 26 Percentage of Pre-2004 Active Claims Ultimately Approved, by Duration, for QPP (Québec) Disabilities still active at Females Males Total
60 months 78% 76% 77%
72 months 80% 77% 79%
84 months 81% 78% 80%
96 months 82% 78% 80%
108 months 83% 78% 81%
120 months 83% 77% 81%
>120 months 84% 82% 83%
VARIATIONS This section of the study provides Actual/Expected ratios in termination behaviour along dimensions not accounted for in the structure of the tables, i.e., other than age, gender and Québec/Non-Québec.
Methodology The termination tables published in this study consist of base tables plus an adjustment to account for the excess terminations due to Change of Definition (CiD).
To compute expected terminations for a portfolio of claims would, in theory, require the application of the base table rates in each duration with the additional CiD value being applied in the duration where definition of disability changed.
In actuality, this theory-based approach was not possible because not all records in the database contained reliable information on the Change of Definition point.
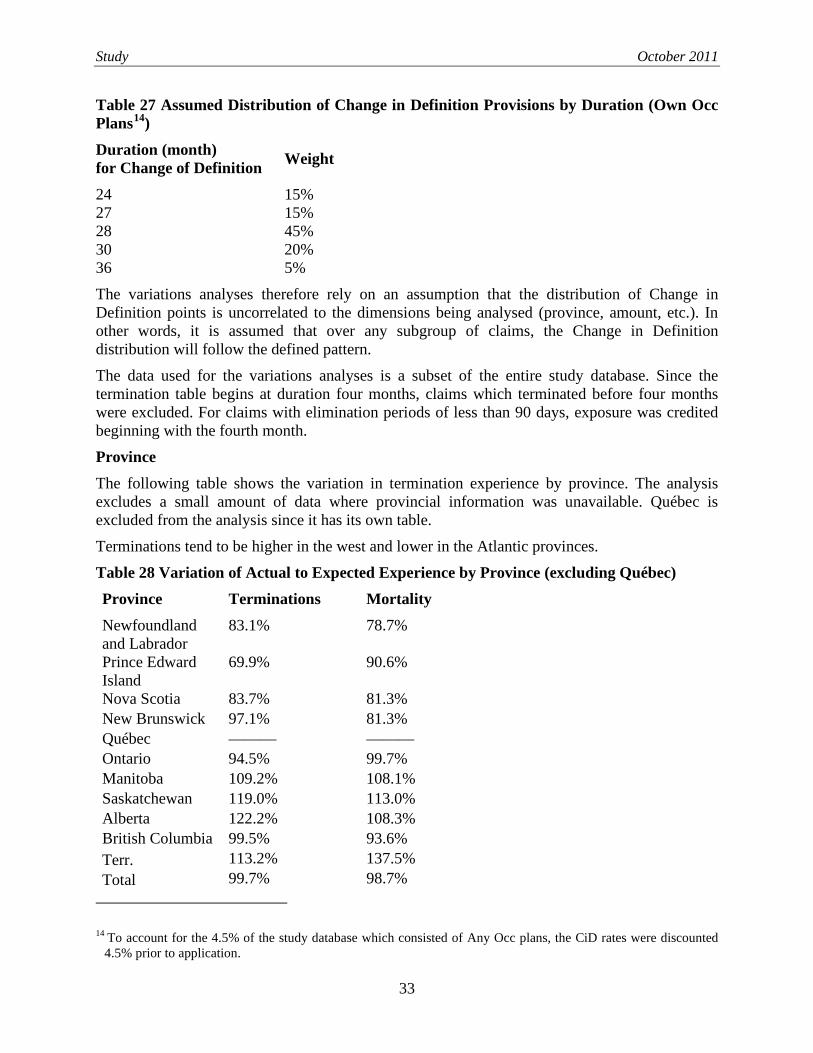
To circumvent this problem, we constructed a composite table to compute the expected terminations for the analyses in this section. The composite table is the weighted average of a small number of representative Change of Definition durations. These durations and their weights are presented below. The weights were determined from observation of the data.
Study October 2011
33
Table 27 Assumed Distribution of Change in Definition Provisions by Duration (Own Occ Plans14
Duration (month) for Change of Definition
)
Weight
24 15% 27 15% 28 45% 30 20% 36 5%
The variations analyses therefore rely on an assumption that the distribution of Change in Definition points is uncorrelated to the dimensions being analysed (province, amount, etc.). In other words, it is assumed that over any subgroup of claims, the Change in Definition distribution will follow the defined pattern.
The data used for the variations analyses is a subset of the entire study database. Since the termination table begins at duration four months, claims which terminated before four months were excluded. For claims with elimination periods of less than 90 days, exposure was credited beginning with the fourth month.
Province The following table shows the variation in termination experience by province. The analysis excludes a small amount of data where provincial information was unavailable. Québec is excluded from the analysis since it has its own table.
Terminations tend to be higher in the west and lower in the Atlantic provinces.
Table 28 Variation of Actual to Expected Experience by Province (excluding Québec) Province Terminations Mortality Newfoundland and Labrador
83.1% 78.7%
Prince Edward Island
69.9% 90.6%
Nova Scotia 83.7% 81.3% New Brunswick 97.1% 81.3% Québec ——— ——— Ontario 94.5% 99.7% Manitoba 109.2% 108.1% Saskatchewan 119.0% 113.0% Alberta 122.2% 108.3% British Columbia 99.5% 93.6% Terr. 113.2% 137.5% Total 99.7% 98.7%
14 To account for the 4.5% of the study database which consisted of Any Occ plans, the CiD rates were discounted 4.5% prior to application.
Study October 2011
34
Benefit Amount The Actual to Expected experience by the amount of monthly benefit is presented below. The following table excludes approximately 1% of the database where the amount of monthly benefit was not available.
Table 29 Variation of Actual to Expected Experience by Gross Monthly Benefit Gross Monthly Benefit Terminations Mortality Under $500 123.2% 85.8% 500 to 999 101.3% 103.3% 1,000 to 1,499 99.3% 102.3% 1,500 to 1,999 100.4% 97.0% 2,000 to 2,499 99.0% 97.5% 2,500 to 2,999 96.7% 97.2% 3,000 to 3,499 97.9% 98.2% 3,500 to 3,999 96.9% 99.8% 4,000 to 5,999 95.7% 112.9% 6,000 to 7,999 96.9% 126.6% 8,000 and over 94.0% 139.1% Unknown 145.1% 87.9% Total 99.6% 100.1%
Year of Experience The following table shows the variation in termination experience by study year. Total terminations appear to be improving. The trend in the mortality component is indeterminate.
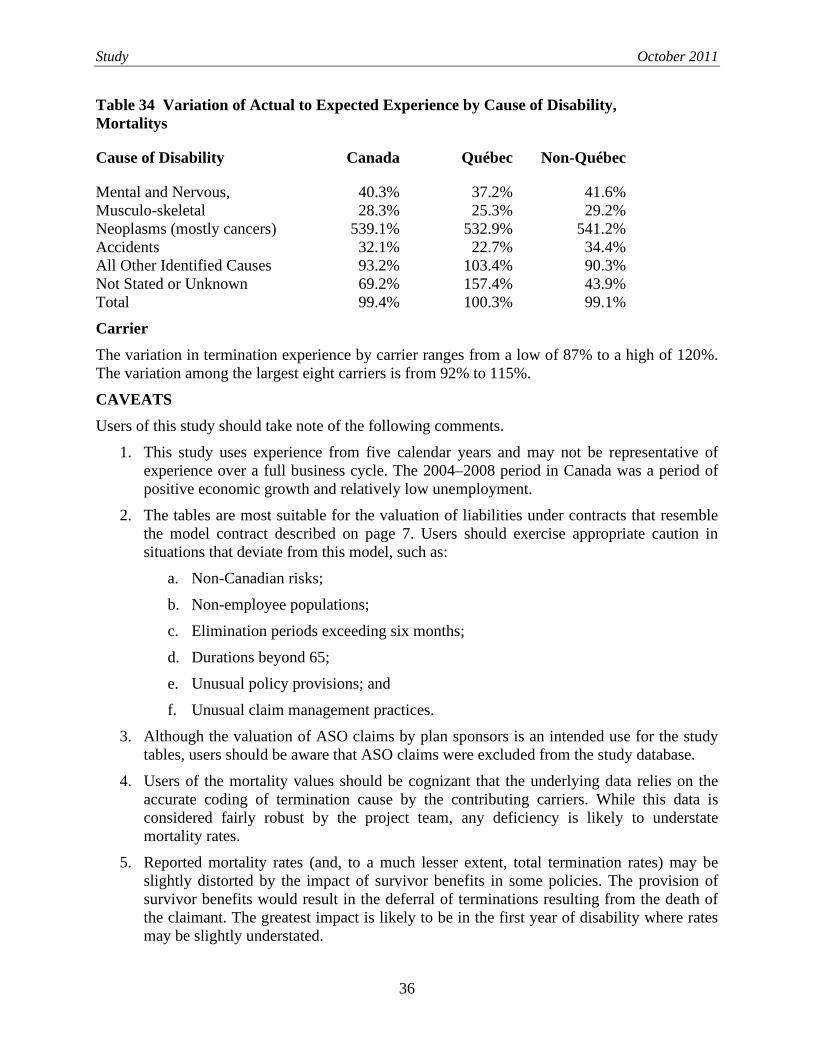
Table 30 Variation of Actual to Expected Experience by Study Year Study Year Terminations Mortality 2004 97.6% 98.8% 2005 97.0% 95.5% 2006 98.5% 99.8% 2007 102.2% 102.6% 2008 104.3% 99.8% Total 100.0% 99.4% Cause of Disability This analysis looks at the termination experience for major causes of disability. The first two tables show the distribution of claims in the study database. Québec constitutes 33% of the total database but the proportion ranges from 26% to 42% depending on cause.
Study October 2011
35
Table 31 Distribution of Claims by Cause of Disability Cause of Disability Number of
Claims Percent of Claims
Mental and Nervous 126,057 36% Musculo-skeletal 75,892 22% Neoplasms (mostly cancers) 37,792 11% Accidents 31,546 9% All Other Identified Causes 65,838 19% Not Stated or Unknown 12,249 4% Total 349,374 100%
Table 32 Distribution of Claims by Cause of Disability, Quebec and Non-Quebec
Cause of Disability Québec Non-Québec
Mental and Nervous, 46% 31% Musculo-skeletal 20% 23% Neoplasms (mostly cancers) 9% 12% Accidents 7% 10% All Other Identified Causes 15% 21% Not Stated or Unknown 3% 4% Total 100% 100%
The A/E values are shown in the following two tables.
Table 33 Variation of Actual to Expected Experience by Cause of Disability, Total Terminations
Cause of Disability Canada Québec Non-Québec Mental and Nervous, 92.1% 104.4% 80.8% Musculo-skeletal 92.4% 91.5% 92.9% Neoplasms (mostly cancers) 128.3% 92.7% 149.6% Accidents 118.8% 107.7% 124.8% All Other Identified Causes 100.8% 96.2% 102.9% Not Stated or Unknown 99.0% 113.3% 91.3% Total 100.0% 100.0% 100.0%
Study October 2011
36
Table 34 Variation of Actual to Expected Experience by Cause of Disability, Mortalitys
Cause of Disability Canada Québec Non-Québec
Mental and Nervous, 40.3% 37.2% 41.6% Musculo-skeletal 28.3% 25.3% 29.2% Neoplasms (mostly cancers) 539.1% 532.9% 541.2% Accidents 32.1% 22.7% 34.4% All Other Identified Causes 93.2% 103.4% 90.3% Not Stated or Unknown 69.2% 157.4% 43.9% Total 99.4% 100.3% 99.1%
Carrier The variation in termination experience by carrier ranges from a low of 87% to a high of 120%. The variation among the largest eight carriers is from 92% to 115%. CAVEATS Users of this study should take note of the following comments.
1. This study uses experience from five calendar years and may not be representative of experience over a full business cycle. The 2004–2008 period in Canada was a period of positive economic growth and relatively low unemployment.
2. The tables are most suitable for the valuation of liabilities under contracts that resemble the model contract described on page 7. Users should exercise appropriate caution in situations that deviate from this model, such as:
a. Non-Canadian risks;
b. Non-employee populations;
c. Elimination periods exceeding six months;
d. Durations beyond 65;
e. Unusual policy provisions; and
f. Unusual claim management practices.
3. Although the valuation of ASO claims by plan sponsors is an intended use for the study tables, users should be aware that ASO claims were excluded from the study database.
4. Users of the mortality values should be cognizant that the underlying data relies on the accurate coding of termination cause by the contributing carriers. While this data is considered fairly robust by the project team, any deficiency is likely to understate mortality rates.
5. Reported mortality rates (and, to a much lesser extent, total termination rates) may be slightly distorted by the impact of survivor benefits in some policies. The provision of survivor benefits would result in the deferral of terminations resulting from the death of the claimant. The greatest impact is likely to be in the first year of disability where rates may be slightly understated.
Study October 2011
37
6. The variations analyses assume that the Change in Definition points are evenly distributed throughout the study database and are not correlated with any of the dimensions being studied.
CONCLUSIONS AND RECOMMENDATIONS 1. The termination tables developed in this study are derived from experience of virtually
the entire Canadian market in the 2004 to 2008 period (ASO cases being the only major exclusion).
2. The termination rates developed in this study compared to those in the earlier CIA 1988–1997 study indicate the following shifts:
a. Total termination rates (base rates before adjustments for change in definition) are significantly different from the prior table. Recovery rates in Québec have increased dramatically for both males and females. Outside Québec, recovery rates have increased moderately for males but have decreased substantially for females; and
b. There has been a slight overall decrease in mortality rates.
c. The adjustments for Change in Definition vary significantly from those in the earlier table.
3. Termination rates appeared to be increasing over the five-year period of the study. However, it is not possible to relate this observation to possible changes in the incidence rate of new claims.
4. Given the changes observed relative to earlier studies and even over the course of this study, it is recommended that this study be updated in the near future. It is suggested that Actual to Expected analyses be done on a three-year cycle beginning with the 2008–2011 period. A project to replace the table developed in this project should be considered after several cycles if these studies indicate that the table no longer represents the structure of the evolving experience.
5. The following recommendations are offered with respect to the planning of future studies:
a. No major revisions to the Data Request are required;
b. Consideration should be given to capturing information on survivor benefits and assessing their impact on the reporting of mortality terminations; and
c. The various tables required for the final study and for testing purposes should be fully defined prior to programming the data processing routines.