Page 1
U.P.B. Sci. Bull., Series C, Vol. 81, Iss. 2, 2019 ISSN 2286-3540
GROUPED B-SPLINE WINDOWS FOR IMPROVED POWER
SPECTRAL DENSITY ESTIMATION
Lucian STANCIU1, Valentin STANCIU2
The reduction of the spectral leakage into the side-lobe of a window function
is to obtain a more gradual window, with the same length, which generates a
lowering of the side lobes amplitude. The usual windows can control these
characteristics by using one parameter. To reduce the spectral leakage, a window
function in the time domain is used to shape that decrease more gradually toward
zero. We propose to use grouped B-spline functions to obtain window functions, with
increased order of continuity. The power spectral density estimation is optimized by
using three control parameters.
Keywords: spline windows, spectral analysis, frequency leakage, smooth
functions, optimal window
1. Introduction
The power spectral estimation implies the determination of the power
spectral density (PSD) for different frequency components contained in a signal,
by using a finite-length sequence. The windowing of the input signal determines
different spectral characteristics from the original continuous-time signal. The
behavior due to the windowing is described in the terms of loss of resolution and
leakage. It is important the choice of the window to have a good precision for the
estimated PSD. We can minimize the spectral leakage [1], [2] by increasing
the order of continuity at the boundary of observation windows. The classical
window functions can control the resolution or prominent side-lobes by one
parameter. A comprehensive comparison of the windows is made based on the
computed performance parameters. Windows are weighting functions applied to
the finite observation data to reduce the spectral leakage. No window function is
perfect for the parameters listed [3], [4], [5].
We propose to use the grouped B-spline windows, with three control
parameters to solve better this trade-off problem. The proposed windows ensure a
high order of continuity in time that has a strong impact on the spectrum of the
signal and permits a trade-off between time and frequency resolution.
1 Prof., Dept. of Telecommunications, University POLITEHNICA of Bucharest, Romania, e-mail:
lucians@comm,pub.ro 2 PhD student, University POLITEHNICA of Bucharest, Romania, e-mail: [email protected]
Page 2
142 Lucian Stanciu, Valentin Stanciu
2. Power spectral density estimation
The PSD is defined by the Fourier transform for the autocorrelation
function )(krx of the sequence x(n)
−=
−=
k
jkx
jx ekreP )()( (1)
It is impossible to use an infinite length signal in practice therefore, will take the
Fourier transform of the autocorrelation estimate results in an estimate of the
PSD, which is known as the periodogram
−
+−=
−==
1
1
)()(ˆ)(
N
Nk
jkx
jjper ekrePeP (2)
where 2N-1 is the length of the signal window. It is more convenient to write the
periodogram directly by using the windowed signal, which is in turn equal to the
N point DFT of x(n) 22
1
0
)()(1
)(1
)(ˆ)(
−=
−−
=
− ===
n
njR
N
n
njjjper enxnf
Nenx
NeReP (3)
In (3) fR(n) is a rectangular window defined by:
−
=otherwise 0,
10 ,1)(
Nnnf R (4)
In practice, the periodogram will get samples of the spectral estimate using
a DFT as )(ˆ /2 NkjeP . The estimated PSD corresponds to a periodic convolution
between the theoretical PSD and the spectrum of a rectangular window with the
length of N samples. The finite record length causes a distortion of the estimated
spectrum, involving leakage and resolution loss due to windowing [6], [7].
Therefore, we can say that the periodogram method generates the PSD estimate of
the given signal.
3. Spectral analysis using grouped B-spline windows
We are interested to use B-spline functions for PSD estimation. There exist
an explicit expression for the centered B-spline function of order k:
)2
1()
2
1(
!
)1()(
1
0
1 jk
xujk
xCk
xB kk
j
jk
j
k −+
+−+
+−
=+
=
+ (5)
where u(x) is the unit step function.
Also a recurrence relation can be used:
kxBxk
xBxk
xB kkk /)]2
1()
2
1()
2
1()
2
1[()( 11 −−
++++
+= −− (6)
A B-spline of higher order is defined iteratively by convolution:
Page 3
Grouped B-spline windows for improved power spectral density estimation 143
)(*)()( 01 xBxBxB kk −= (7)
Where:
=otherwise 0,
(-1/2,1/2) x,1)(0 xB (8)
The uniform B-spline function of degree k is obtained by using (5). The
Fourier transform of )(xBk is given by
1
2/
)2/sin()(
+
=
k
kBF
(9)
We are interested to achieve an increased frequency resolution, by
grouping three B-spline functions: one of order k and two of order m:
)()()()( 1 gaxbBxaBgaxbBxBB mkmkm +++−= (10)
where a, 1a , b and g are real coefficients.
Figs. 1 and 2 illustrate the dependence of the grouped ninth order B-splines
on the parameters a and a1, respectively. Fig. 1 shows the grouped ninth order B-
splines for different values of a. The parameters g and 1a were fixed at g = 0.263,
a1=2.475.
Fig. 2 shows the dependence of the grouped ninth order B-spline on the
parameter a1. The parameters g and a were fixed at g = 0.263, a=2.45. We can see
that the parameters a and 1a give a fine control for an optimum window.
-1.5 -1 -0.5 0 0.5 1 1.50
0.2
0.4
0.6
0.8
1
1.2
x-normalized variable
Am
plitu
de
Grouped ninth order B-spline
al=2.45, ga=0.263, al1=2.475
al=2.1, ga=0.263, al1=2.475
al=2.7, ga=0.263, al1=2.475
Fig. 1. Grouped ninth order B-spline for different values of a (a = al); g=0.263 (g=ga); a1=2.475
(a1 = al1)
Page 4
144 Lucian Stanciu, Valentin Stanciu
-1.5 -1 -0.5 0 0.5 1 1.50
0.2
0.4
0.6
0.8
1
1.2
x-normalized variable
Am
plitu
de
Grouped ninth order B-spline
al=2.45, ga=0.263, al1=2.475
al=2.45, ga=0.263, al1=2.9
al=2.45, ga=0.263, al1=2.1
Fig. 2. Grouped ninth order B-spline for different values of a1 (a1= al1);
a =2.45 (a = al); g=0.263. (g=ga)
Generally, we use the unitary value 1)0( =kmBB and the expression for b is:
)()(
)0(1
gBgB
Bb
mm
k
+−
−= (11)
The detailed relation for )(xBBkm is:
++
+−
+
++−−+
++−
−−
−+++
−−
+−++
+−
++−+
=
otherwise 0,
2
1m2
2
1for ),(
2
1
2
1m2for ),()(
2
1m2
2
1m2for
),()()(
2
1m2
2
1for ),()(
2
1
2
1m2for ),(
)(
1
11
1
11
1
a
gx
a
kgaxbB
a
kx
a
ggaxbBxaB
a
gx
a
g
gaxbBxaBgaxbB
a
gx
a
kxaBgaxbB
a
kx
a
ggaxbB
xBB
m
mk
mkm
km
m
km (12)
The Fourier transform of the grouped B-spline functions fromx(10),iis :
1
1
1
1
1
)2/(
))2/(sin(1)cos(
)2/(
))2/(sin(2)(
++
+
=
km
ka
a
ag
a
a
a
bBG
(13)
Page 5
Grouped B-spline windows for improved power spectral density estimation 145
To generate grouped B-spline windows, the function given in (12) is
uniformly sampled with N samples in the interval xϵ[-p,p), where p is
a
gp
2
1m2 ++= . So we will obtain a discrete causal window for 0, 1n N= − .
4. Performance comparison of the grouped B-spline windows
We describe various basic parameters of the windows that are useful in
choosing an efficient window. Equivalent noise bandwidth is:
2
2
)(
)(
=
n
n
nTf
nTf
(14)
Fig. 3. Spectrum of the signal (18) using the optimum ninth order grouped B-spline window
(a=2.45, g=0.263, a1=2.475).
Fig. 4. Spectrum of the signal (18) using the optimum tenth order grouped B-spline window
(a=2.455, g=0.261, a1=2.477).
Page 6
146 Lucian Stanciu, Valentin Stanciu
0 0.02 0.04 0.06 0.08 0.1 0.12 0.14 0.16 0.18 0.2-140
-120
-100
-80
-60
-40
-20
0
Normalized frequency
Am
plitu
de [
dB]
Grouped B-spline windows
Seventh order
Eighth order
Ninth order
Tenth order
Fig. 5. Frequency response for the optimum seventh, eighth, ninth and tenth order grouped B-
spline windows (N=100).
Table 1
Optimum parameters for grouped B-spline windows.
Type 1a a g
Gr.
Spl.7
2.37 2.35 0.312
Gr.
Spl.8
2.674 2.65 0.282
Gr.
Spl.9
2.475 2.45 0.263
Gr.
Spl.10
2.477 2.455 0.261
Table 2
Relevant figures of merit for grouped B-spline windows.
Type η G ɛmax[%] SL [dB]
Gr. Spl.7 2.6503 0.2691 -0.0536 -0.4781
Gr. Spl.8 2.8889 0.2467 -0.0453 -0.4029
Gr. Spl.9 2.5549 0.2787 -0.0577 -0.5159
Gr. Spl.10 2.4483 0.2907 -0.0627 -0.5625
Rectangle 1 1 0.5703 3.92
Triangle 1.33 0.5 0.233 1.82
Hamming 1.36 0.54 0.2274 1.78
Blackman 1.73 0.42 0.135 1.1
Kaiser
(αK=4.)
1.93 0.37 -0.11 0.89
The known bias on spectral amplitudes of the window is defined by the
coherent gain factor:
=
n
nTfN
G )(1
(15)
Another parameter is the scalloping loss (SL):
Page 7
Grouped B-spline windows for improved power spectral density estimation 147
−
=
n
n
Nj
nTf
enTf
SL)(
)( /
(16)
The scalloping loss can be replaced by the maximum relative error ɛmax
[4]:
1max −= SL (17)
In (12) the parameters a , 1a and g are optimized to shape the spectral
grouped B-spline windows, by minimizing the maximum relative error max for
better estimation. We want to present the advantages of the new window functions
to estimate the small signals and consider the signal:
(1.2566n)sin 0.00001 +
+)(1.1309n sin 0.001+(1.005n)0.01sin + (0.8796n)sin = x(n) (18)
Fig. 3 shows the spectrum of the signal (18), by using the optimal ninth
order grouped B-spline window. If we impose k=m=9, ,0)(9 xBB for a= 1a =6, g=1
and x(-1,1). By decreasing a = 1a , in the first step, and g in the second step, the
interferences are minimized. In the next step, 1a is increased. The optimum values
for the three parameters are a=2.45, g=0.263 and 1a =2.475.
Fig. 6. Spectrogram plot of the signal (18) using the optimum ninth order grouped B-spline
window
Page 8
148 Lucian Stanciu, Valentin Stanciu
Fig. 7. Spectrogram plot of the signal (18) using a ninth order B-spline window.
In the situation k=m=10, ,0)(10 xBB for a= 1a =6.5, g=1 and x(-1,1). In
the first step, we decrease the parameters a= 1a and g in the second step, to
minimize the interferences. In the final step, 1a is increased. Finally, we obtain the
optimum values a=2.455, g=0.261 and 1a =2.477. By using the optimum tenth
order grouped B-spline window, the estimated spectrum of the signal (18) is given
in Fig. 4. In Fig. 5 are showed the frequency representations for the optimum
seventh, eigth, ninth and tenth order grouped B-spline windows.
Fig. 8. Spectrogram plot of the chirp signal using the optimum ninth order grouped B-spline
window.
Page 9
Grouped B-spline windows for improved power spectral density estimation 149
Fig. 9. Spectrogram plot of the chirp signal using Hanning window.
Fig. 6 illustrates the spectrogram plot for the signal (18), by using optimal
ninth order grouped B-spline window. By comparison, Fig. 7 shows the
spectrogram plot for the signal (18), by using the ninth order B-spline window.
The same comparative presentation is made, for the optimum ninth order grouped
B-spline window, in Fig. 8, respectively for Hanning window in Fig. 9, for the
spectrograms using chirp signal with the quadratic form variation of the signal
frequency. We observe that the spectral leakage rapidly decreases for the optimum
ninth order grouped B-spline windows.
Fig. 10 shows the spectrogram using chirp signal with the quadratic form
variation of the signal frequency, for the optimum tenth order grouped B-spline
window.
Fig. 10. Spectrogram plot of the chirp signal using the optimum tenth order grouped B-spline
window.
Page 10
150 Lucian Stanciu, Valentin Stanciu
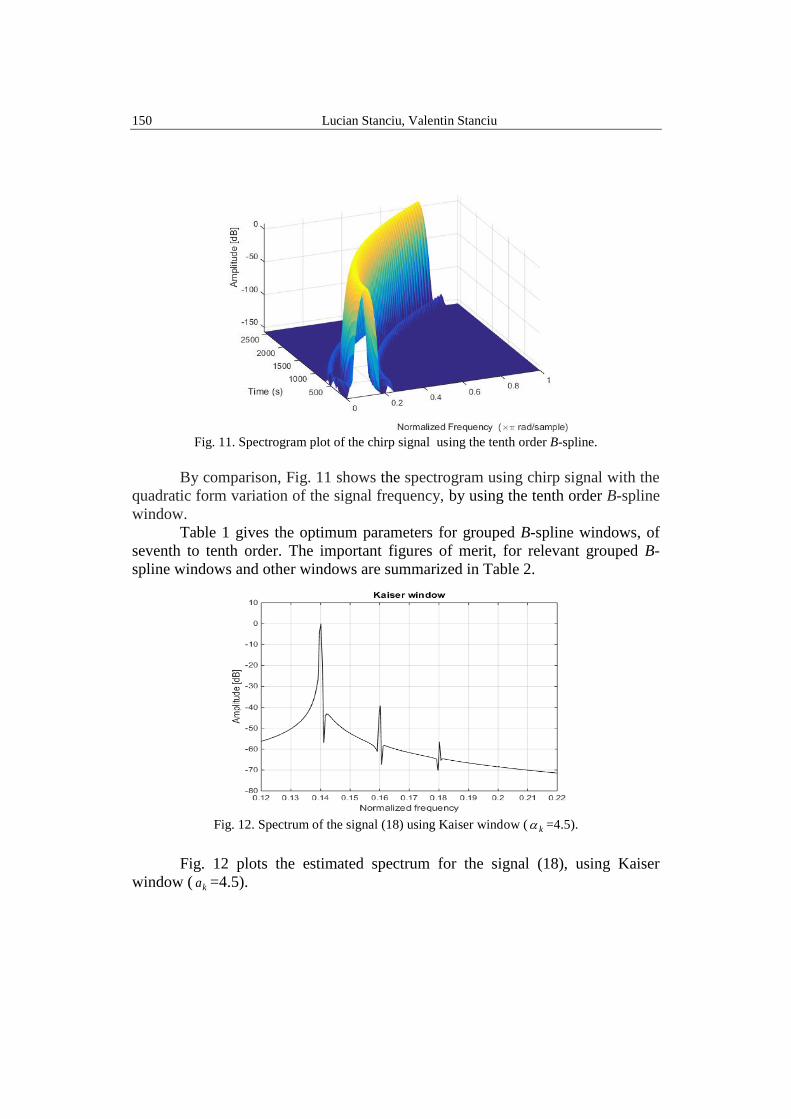
Fig. 11. Spectrogram plot of the chirp signal using the tenth order B-spline.
By comparison, Fig. 11 shows the spectrogram using chirp signal with the
quadratic form variation of the signal frequency, by using the tenth order B-spline
window.
Table 1 gives the optimum parameters for grouped B-spline windows, of
seventh to tenth order. The important figures of merit, for relevant grouped B-
spline windows and other windows are summarized in Table 2.
Fig. 12. Spectrum of the signal (18) using Kaiser window ( k =4.5).
Fig. 12 plots the estimated spectrum for the signal (18), using Kaiser
window ( ka =4.5).
Page 11
Grouped B-spline windows for improved power spectral density estimation 151
Fig. 13. Spectrum of the signal (18) using Hanning window.
Fig. 13 illustrates the estimation for the signal (18), using Hanning
window. In spectral analysis, the side lobes cause smearing or spreading of
energy, while the main lobe is responsible for appropriate smoothing effects.
These last results demonstrate the efficacy of the grouped B-spline
windows exposed, in estimation of small signals, by comparing with other
windows.
5. Conclusions
The spectral window does not exhibit side lobes and is as narrow in
frequency as possible. The choice of a time-limited window is important for
improving the accuracy of the harmonic amplitude. The resolution is sufficient,
and the leakage is small, if the main lobe is narrow and the side lobes are low and
decrease rapidly, with increasing distance from the main lobe. In this paper, we
presented an approach for the construction of the grouped B-spline windows.
These new windows contain three design parameters that can be used to solve the
trade-off problem, to have fast side lobe decay and maximized efficiency for small
signal detection. The reduction of leakage is inevitably accompanied by a further
loss of resolution, which is related to main lobe width into the side-lobe of a
window function. We have tested the spectral effects of these new more gradual
window functions in harmonic signal analysis.
The presented applications demonstrate that the grouped B-spline windows
ensure the possibility of a trade-off between resolution and leakage, by detecting
the small signals.
Page 12
152 Lucian Stanciu, Valentin Stanciu
R E F E R E N C E S
[1] S. Vaseghi, Advanced Digital Signal Processing and Noise Reduction, John Wiley and Son,
2008.
[2] Yixin Yang, Yahao Zhang, and Long Yang, “Wideband sparse spatial spectrum estimation
using matrix filter with nulling in a strong interference environment” , Statistical The
Journal of the Acoustical Society of America 143, 3891 (2018).
[3] Adrian Steffens, Patrick Rebentrost, Iman Marvian, Jens Eisert and Seth Lloyd, “ An efficient
cc quantum algorithm for spectral estimation”, New Journal of Physics, Volume 19,
March 2017.
[4] L. Stanciu, C. Stanciu, V. Stanciu, “Optimal Grouped B-Spline for Power Spectral Density
Estimation”, ISETC 2014, November 14-15, pp. 333-336, Timisoara, Romania.
[5] I. S. Reljin, B. D. Reljin, and V. D. Papic, “Extremely flat-top windows for harmonic analysis”,
Instrumentation and Measurement, IEEE Transactions on, vol. 56, no. 3, pp. 1025–1041,
June 2007.
[6] Tae Hyun Yoon and Eon Kyeong Joo, “Butterworth Window for Power Spectral Density
Estimation”, ETRI Journal, vol. 31, nr. 3, pp. 292-297, Junec2009.
[7] L. Stanciu, C. Stanciu, V. Stanciu, “Smooth Frequency Response Digital Audio Equalizers with
Small Ringing Impulse Response”, Revue Roumaine des Sciences Techniques-Serie
Electrotechnique et Energetique, pp. 416-425, no. 4, 2015.