Bruce D. Lindsey, U.S. Geological Survey New Cumberland, Pennsylvania Presented at: U.S. Fish and Wildlife Service National Conservation Training Center, Shepherdstown, West Virginia September 16 th , 2010 GROWING COMMUNITIES ON KARST 2010 GREAT VALLEY WATER RESOURCES SCIENCE FORUM
Transcript
Bruce D. Lindsey, U.S. Geological Survey
New Cumberland, Pennsylvania
Presented at: U.S. Fish and Wildlife Service National
Conservation Training Center, Shepherdstown, West Virginia
September 16th, 2010
GROWING COMMUNITIES ON
KARST 2010
GREAT VALLEY WATER RESOURCES
SCIENCE FORUM
Overview: Is water quality in the Valley and Ridge unique?
We will compare water quality in the Valley and Ridge carbonate-rock aquifers to:
Other aquifers in the United States
Other carbonate-rock aquifers in the nation
Other aquifers in the Valley and Ridge
Overview Issues related to water quality in karst –
from the obvious to the less obvious
Land use near the well
Density of sinkholes near the well (karst is more than just sinkholes)
Position of the well along the flow path or topographic position
One thing you can count on:
There are ALWAYS going to be exceptions!
General tendencies that follow are presented in that context.
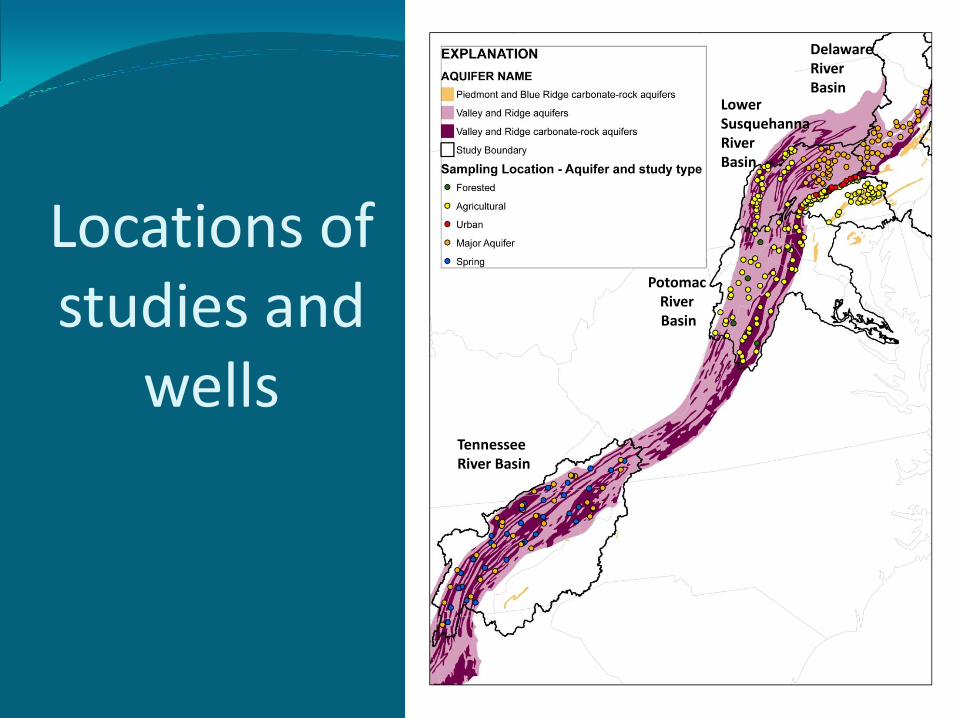
Locations of studies and
wellsTennessee River Basin
Potomac River Basin
Lower Susquehanna RiverBasin
Delaware River Basin
Reliance on domestic self-supply (private wells) is very high in Piedmont and Valley and Ridge aquifers
Data from Hutson and others, 2004
Study area
abbreviation Network type
Number of
wells sampled
Median nitrate
concentration,
in mg/L as N
Median well
depth below
water level, in
ft National Rank
Long Island-New
Jersey
Agricultural Land
Use 15 13 12 1
Puget Sound
Agricultural Land
Use 22 13 17 2
Susquehanna
Piedmont
carbonate 30 11 130 3
San Joaquin
Agricultural Land
Use 20 10 106 4
South Platte
Agricultural Land
Use 30 9.4 9 5
Susquehanna
Valley and Ridge
carbonate 30 9.1 83 6
Susquehanna
Valley and Ridge
carbonate 30 8.6 87 7
………………… ………………… ………………… ………………… ………………… …………………
Potomac
Valley and Ridge
Carbonate 28 4.6 101 30
Susquehanna
Valley and Ridge
Carbonate Urban 20 3.5 81 36
Comparison to national studies: Of the networks with the
highest concentrations of nitrate (of 133 networks total), the Piedmont or
Valley and Ridge carbonate-rock aquifers ranked among the highest.
Table S1 from Burow et al, 2010
Paleozoic
RoswellBlaine
Arbuckle-Simpson
New York/New EnglandCarbonate
Floridan
Castle Hayne
Valley and
Ridge
Mississippian
Ozark
Plateaus
Piedmont
Basin and Range
Silurian-Devonian
Edwards Trinity
Upper Carbonate
Ordovician
Prairie-du Chien
Biscayne
Locations of Carbonate Aquifers
Figure 1 from Lindsey and others, 2009
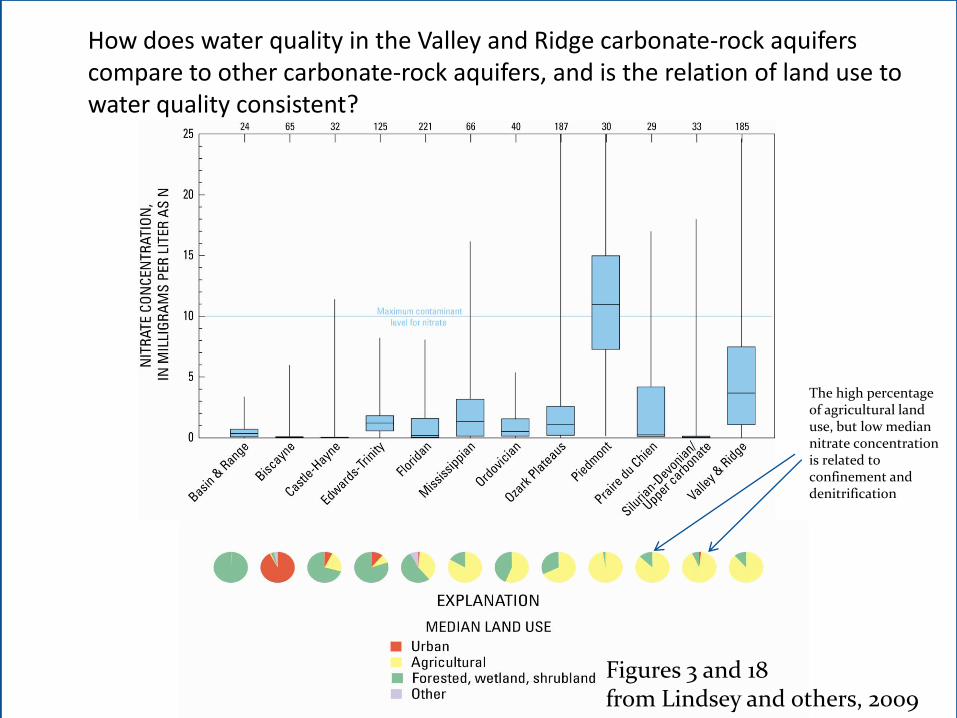
Figure 18 from Lindsey and others, 2009
Nitrate concentrations were highest in Piedmont and Valley and Ridge carbonate-rock aquifers when compared to other carbonate aquifers
Why the differences?
Figures 3 and 18from Lindsey and others, 2009
How does water quality in the Valley and Ridge carbonate-rock aquiferscompare to other carbonate-rock aquifers, and is the relation of land use to water quality consistent?
The high percentage of agricultural land use, but low median nitrate concentrationis related to confinement and denitrification
Reasons for high nitrate concentrations in Piedmont and Valley and Ridge:
High input of nitrogen
Oxic groundwater (allows nitrate to move without degrading)
Lacks organic carbon that would promote denitrification
Groundwater residence time is short
Lacks protective confining layer, and in some cases, even soils are very thin.
Karst features – sinkholes, conduits, caverns.
Hypothesis for Lindsey and others, 2010: Sinkholes contribute to degraded water quality
Photograph by W.E. Kochanov, Pennsylvania Geological Survey
Issues about sinkhole-density data Not every feature was
identified
Not every feature that was located has the same potential effect on water quality
Data were collected for different reasons, by different agencies, in different states
But on a broad scale, it seems be a good explanatory variable for water quality
Photograph by W.E. Kochanov, Pennsylvania Geological Survey
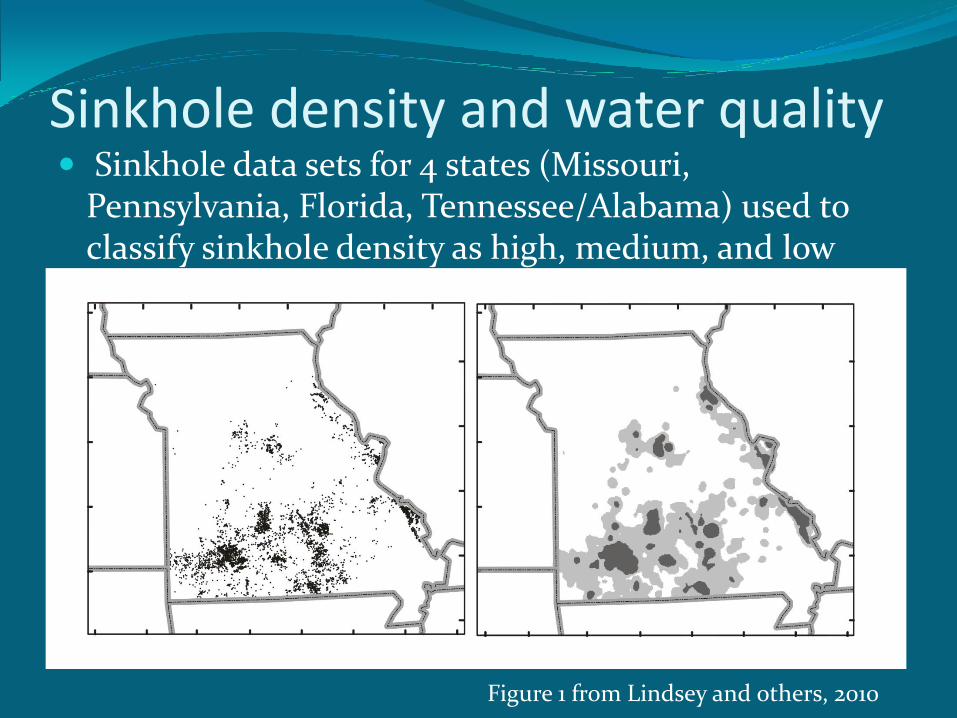
Sinkhole density and water quality Sinkhole data sets for 4 states (Missouri,
Pennsylvania, Florida, Tennessee/Alabama) used to classify sinkhole density as high, medium, and low
Figure 1 from Lindsey and others, 2010
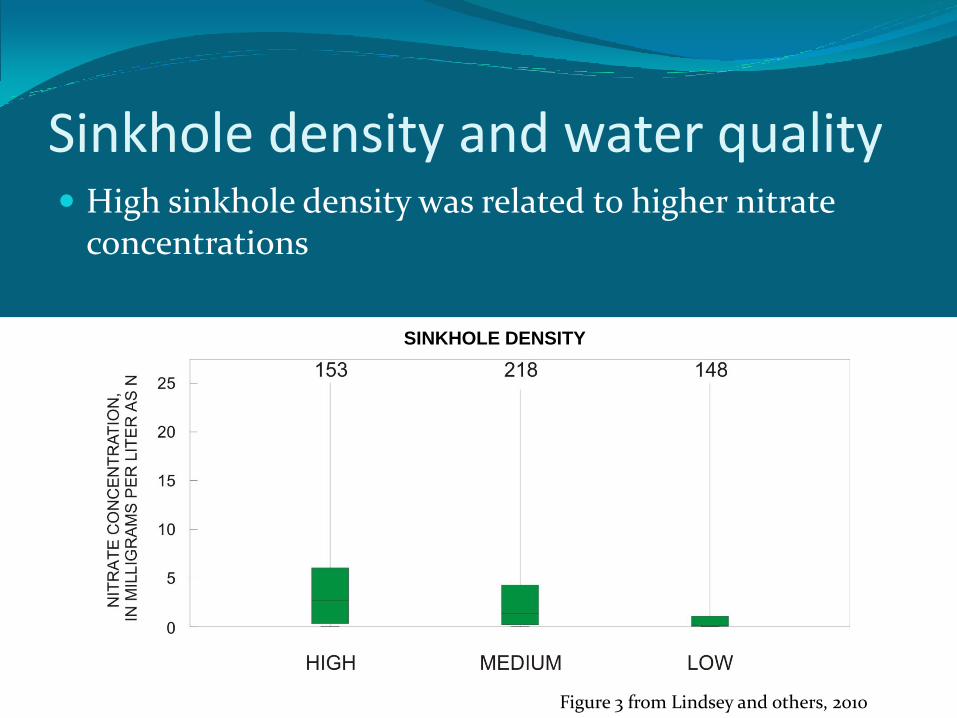
Sinkhole density and water quality High sinkhole density was related to higher nitrate
concentrations
Figure 3 from Lindsey and others, 2010
SINKHOLE DENSITY
Sinkhole density and water quality Sinkhole density was not a significant explanatory
variable for nitrate concentrations in the Valley and Ridge
Figure 5 from Lindsey and others, 2010
SINKHOLE DENSITY
Figure 4 from Lindsey and others, 2010
Nitrate concentrations can be very high in agriculturalareas, even in areas with low sinkhole density
AGRICULTURAL UNDEVELOPEDMIXED URBAN
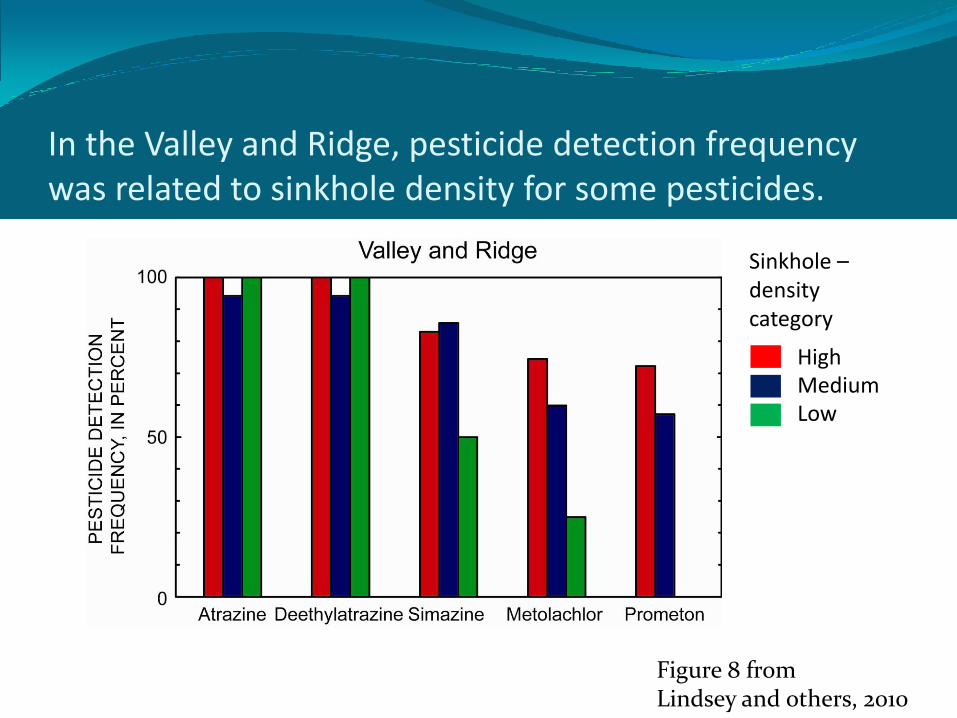
In the Valley and Ridge, pesticide detection frequency was related to sinkhole density for some pesticides.
Figure 8 from Lindsey and others, 2010
Sinkhole –density category
HighMediumLow
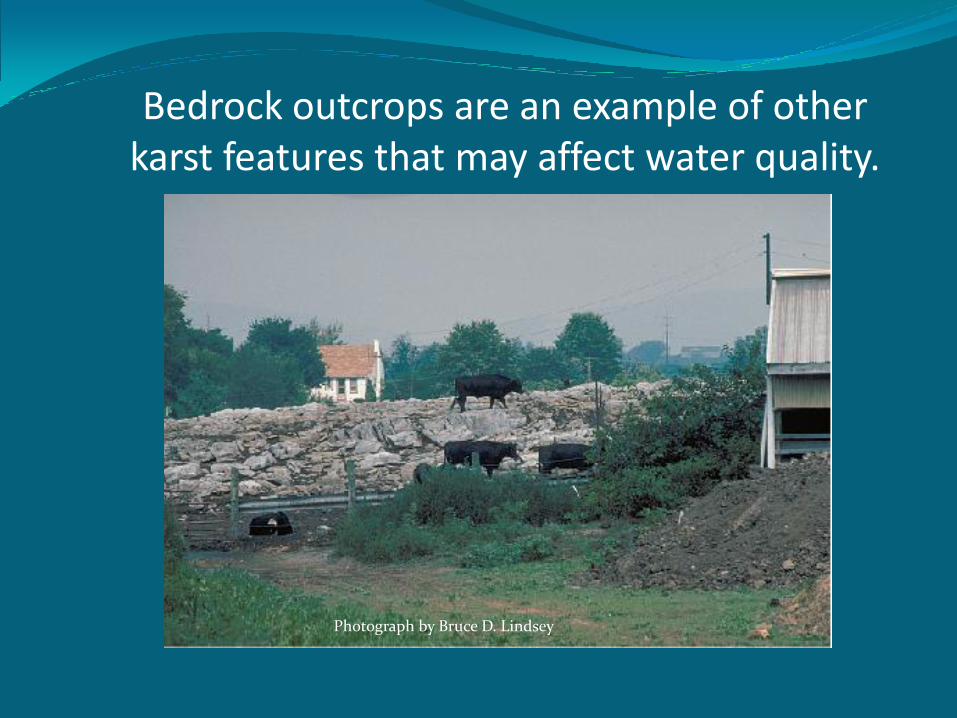
Bedrock outcrops are an example of other karst features that may affect water quality.
Photograph by Bruce D. Lindsey
Not all karst features are visible. Pooled water infiltrates rapidly into this corn field, and is drained in a matter of hours. Blue arrows indicate points of rapid infiltration.
Photograph by Bruce D. Lindsey
Closeup view of water infiltration into corn field from previous page.
Photograph by Bruce D. Lindsey
The blue arrows are locations in the field from the previous slide that are likely to be where the water was infiltrating (photo taken several days later). The holes in the soil are small – about 1 centimeter in diameter, but they were able to drain a large volume of water in a matter of a few hours. This is an example of karst features that are not easily delineated but can have an important effect on water quality.
Photograph by Bruce D. Lindsey
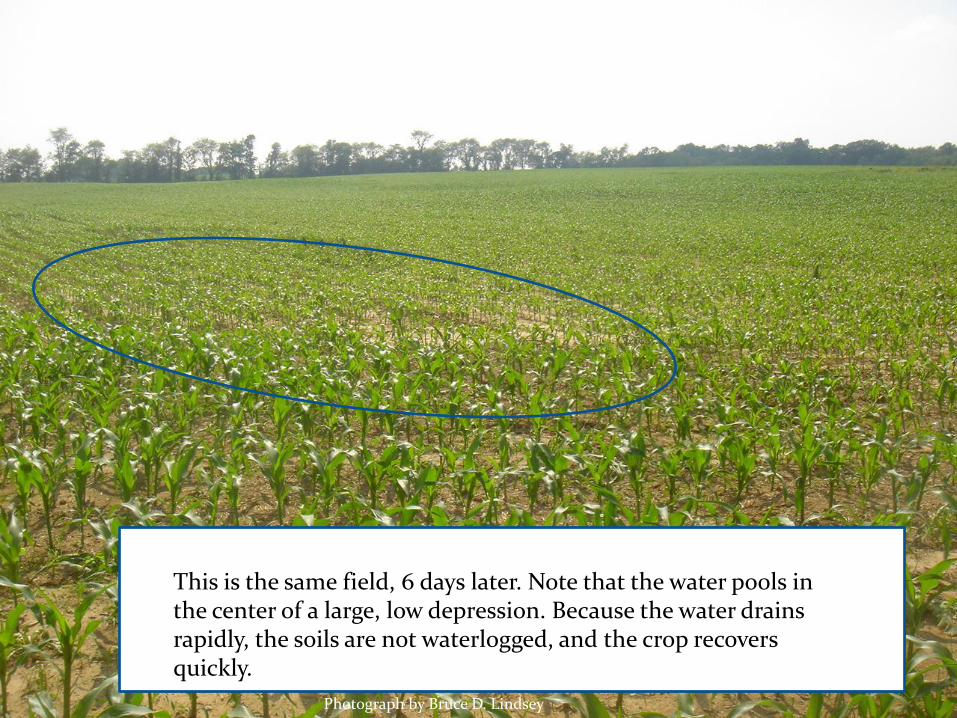
This is the same field, 6 days later. Note that the water po0ls in the center of a large, low depression. Because the water drains rapidly, the soils are not waterlogged, and the crop recovers quickly.
Photograph by Bruce D. Lindsey
This illustration from an educational report on sinkholes illustrates a hypothetical drainage system developed in karst bedrock. The rapid infiltration illustrated on the previous slides is highly unlikely unless a subsurface drainage network like this is present to convey the water away once it infiltrates. Figure 7 from Kochanov, 1999
Shippensburg
Big Spring
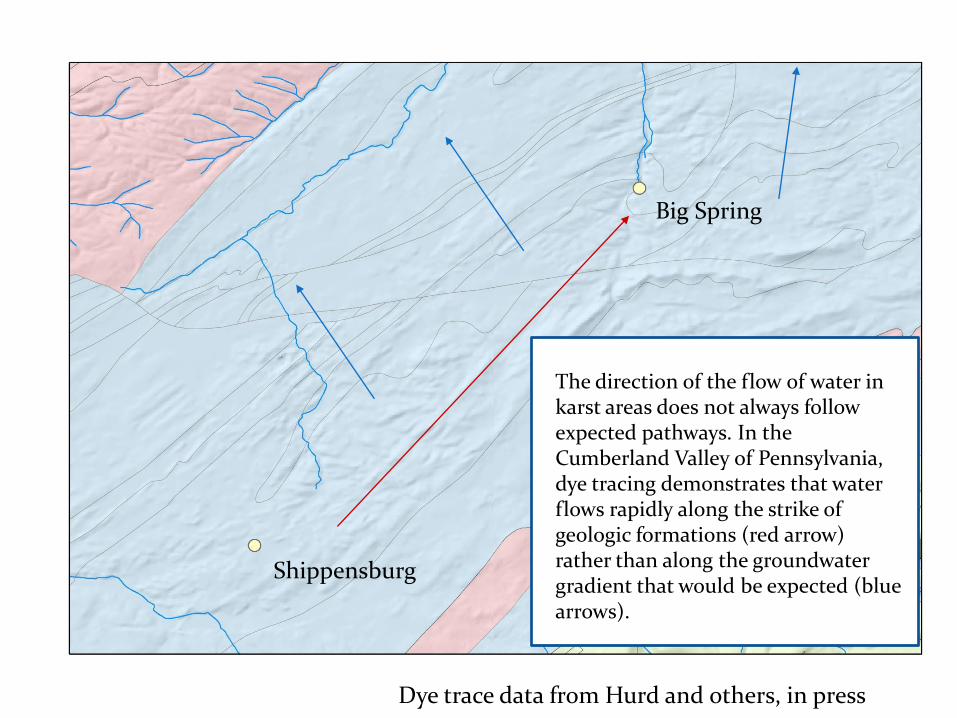
Dye trace data from Hurd and others, in press
The direction of the flow of water in karst areas does not always follow expected pathways. In the Cumberland Valley of Pennsylvania, dye tracing demonstrates that water flows rapidly along the strike of geologic formations (red arrow) rather than along the groundwater gradient that would be expected (blue arrows).
When analyzing water quality by topographic position, we are aware that water does not necessarily flow across the valley in a traditional way (light blue arrows) but has a strong component of flow down the valley (black arrows), as illustrated in the previous slide. Nonetheless, the water that is closer to the ridge is likely to have a relatively shorter residence time, and the water closer to the discharge area has a relatively longer residence time.
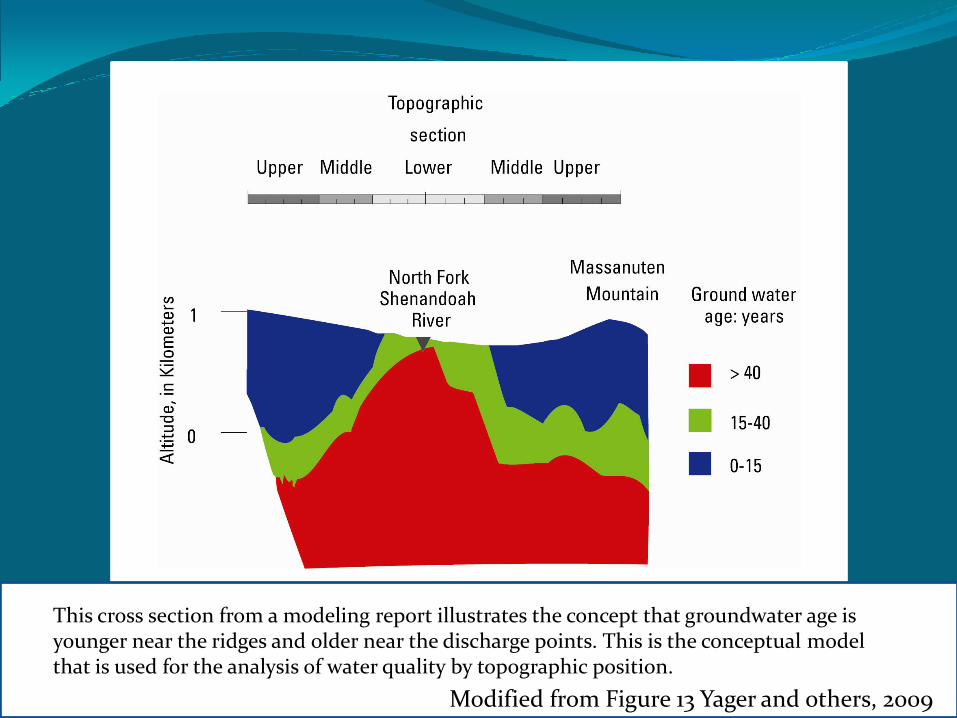
This cross section from a modeling report illustrates the concept that groundwater age is younger near the ridges and older near the discharge points. This is the conceptual model that is used for the analysis of water quality by topographic position.
Modified from Figure 13 Yager and others, 2009
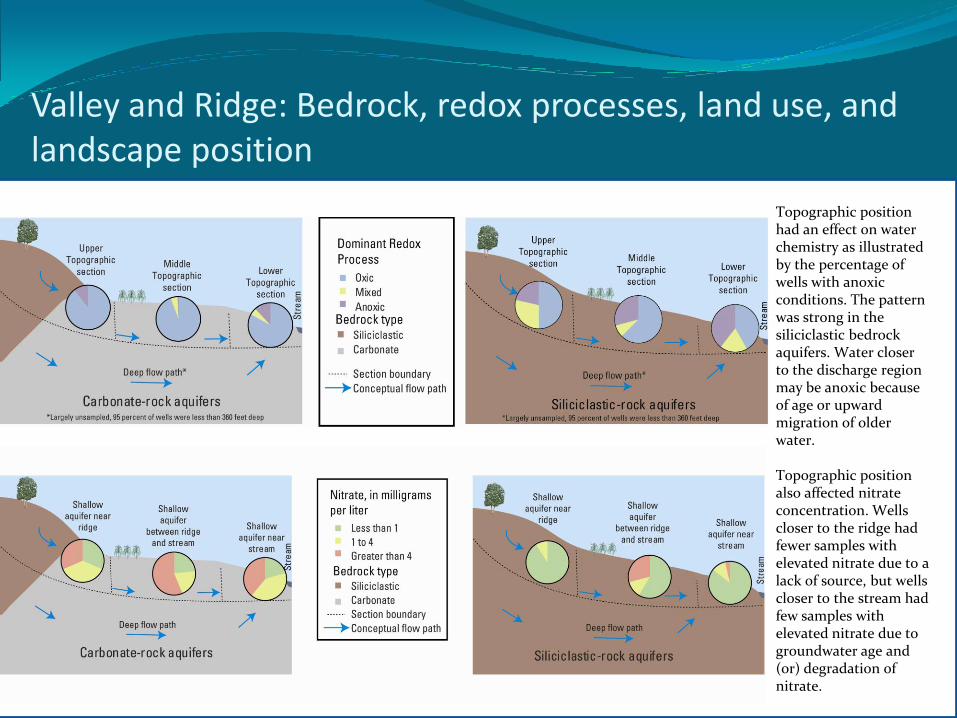
Valley and Ridge: Bedrock, redox processes, land use, and landscape position
Topographic position had an effect on water chemistry as illustrated by the percentage of wells with anoxic conditions. The pattern was strong in the siliciclastic bedrock aquifers. Water closer to the discharge region may be anoxic because of age or upward migration of older water.
Topographic position also affected nitrate concentration. Wells closer to the ridge had fewer samples with elevated nitrate due to a lack of source, but wells closer to the stream had few samples with elevated nitrate due to groundwater age and (or) degradation of nitrate.
Nitrate concentrations were higher in carbonate-rock aquifers when compared to siliciclastic-rock aquifers, even when land use is taken into account. Agricultural and urban settings had higher nitrate concentrations as well.
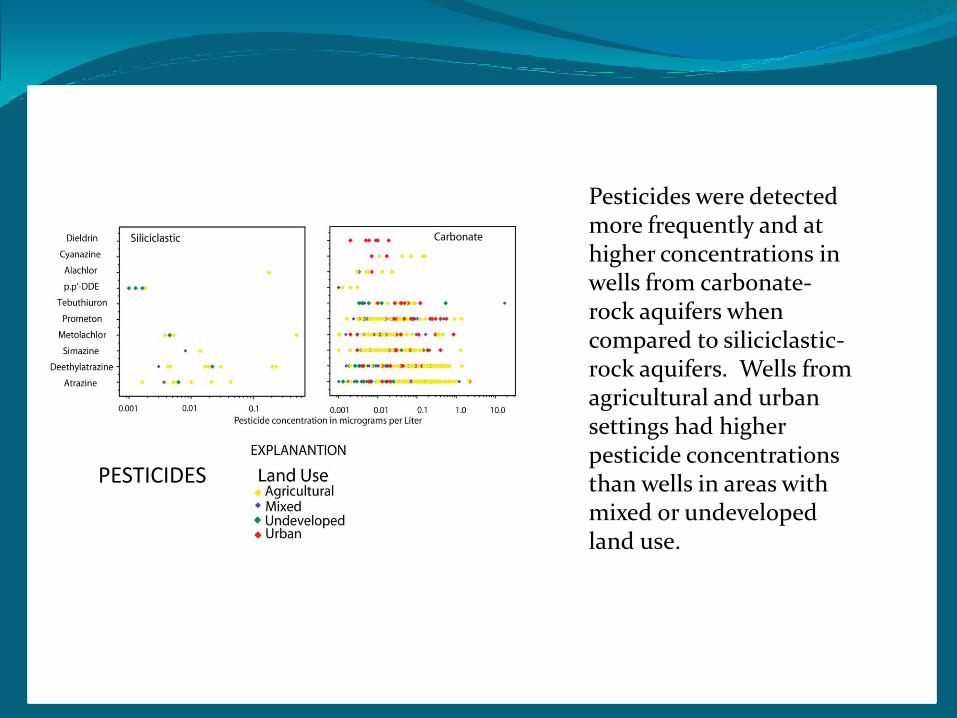
PESTICIDES
Pesticides were detected more frequently and at higher concentrations in wells from carbonate-rock aquifers when compared to siliciclastic-rock aquifers. Wells from agricultural and urban settings had higher pesticide concentrations than wells in areas with mixed or undeveloped land use.
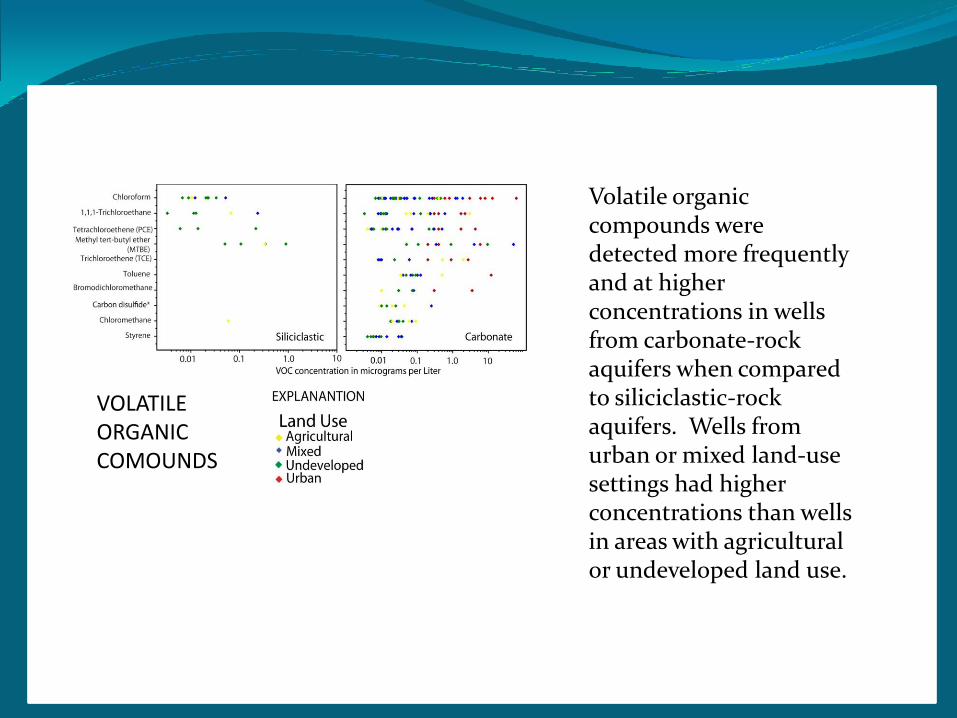
VOLATILE ORGANICCOMOUNDS
Volatile organic compounds were detected more frequently and at higher concentrations in wells from carbonate-rock aquifers when compared to siliciclastic-rock aquifers. Wells from urban or mixed land-use settings had higher concentrations than wells in areas with agricultural or undeveloped land use.
E. coli bacteria were detected more frequently and at higher concentrations in wells from carbonate-rock aquifers when compared to siliciclastic-rock aquifers.
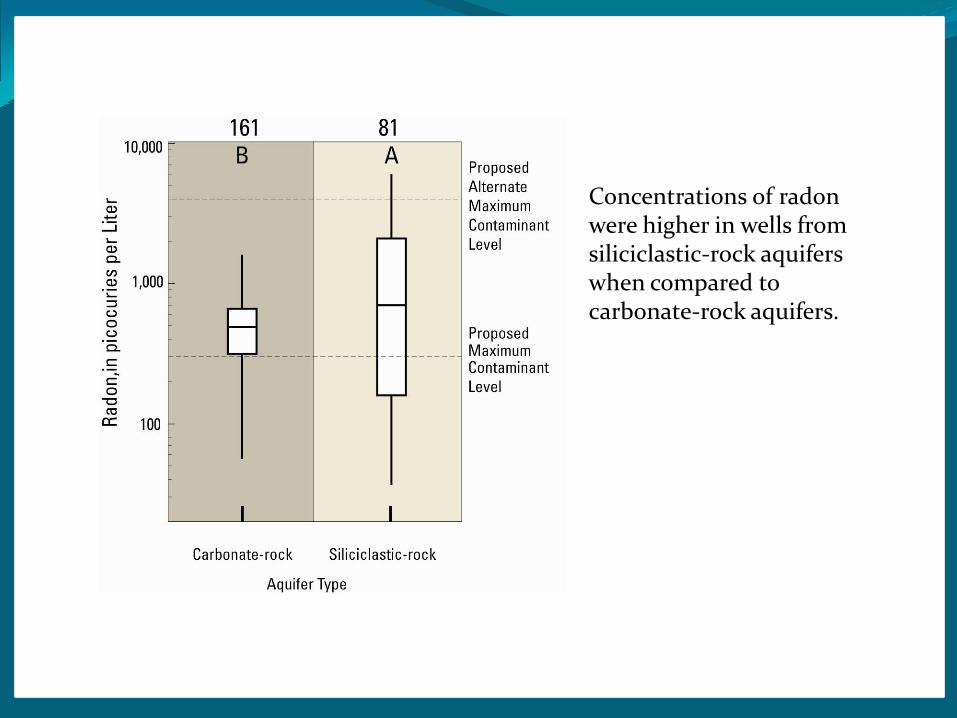
Concentrations of radon were higher in wells from siliciclastic-rock aquifers when compared to carbonate-rock aquifers.
Good news about water quality in carbonate-rock aquifers Concentrations of natural contaminants such as radon
and arsenic were typically lower in carbonate-rock aquifers due to lack of source or geochemical conditions not conducive to transport.
Nuisance contaminants such as iron and manganese had lower concentrations or were non-existent due to redox conditions.
pH in carbonate-rock aquifers was typically stable due to high alkalinity. However, calcium hardness is a trade-off for having water that is not corrosive.
Phosphorus transport through groundwater in carbonate aquifers was highly unlikely (Denver and others, 2010).
Burow, K.R., Nolan, B.T., Rupert, M.G., and Dubrovsky, N.M., 2010, Nitrate in Groundwater of the United States, 1991-2003 Environmental Science and Technology V. 44, n. 13, p. 4988–4997.
Denver, J.M., Cravotta, C.A. III, Ator, S.W., and Lindsey, B.D., 2010, Contributions of Phosphorus from Groundwater to Streams in the Piedmont, Blue Ridge, and Valley and Ridge Physiographic Provinces, Eastern United States, U.S. Geological Survey Scientific Investigations Report 2010-5176, in press.
Hurd, T.M., Brookhart-Rebert, A., Feeney, T.P., Otz, M.H., and Otz, I. (in press), Fast, regional conduit flow to an exceptional value spring creek: implications for source water protection in mantled karst of south central Pennsylvania, Journal of Cave and Karst Studies.
Hutson, S.S., Barber, N.L., Kenny, J.F., Linsey, K.S., Lumia, D.S., and Maupin, M.A., 2004, Estimated use of water in the United States in 2000, U.S. Geological Survey Circular 1268, 46 p.
Kochanov, W.E., 1999, Sinkholes in Pennsylvania, Pennsylvania Geological Survey Educational Series 11, 34 p.Lindsey, B.D., Katz, B.G., Berndt, M.P., Ardis, A.F., and Skach, K.A., 2010, Relations between sinkhole density and
anthropogenic contaminants in selected carbonate aquifers in the eastern United States, Environmental Earth Sciences, v. 60, no. 5, p. 1073-1090 (Also available at http://dx.doi.org/10.1007/s12665-009-0252-9).
Lindsey, B.D., Berndt, M.P., Katz, B.G., Ardis, A.F., and Skach, K., 2009, Factors Affecting Water Quality in Selected Carbonate Aquifers in the United States, 1993-2005, U.S. Geological Survey Scientific Investigations Report 2008-5340, 117 p.
Yager, R.M., Voss, C.I., and Southworth, S., 2009, Comparison of alternative representations of hydraulic-conductivity anisotropy in folded fractured-sedimentary rock—Modeling groundwater flow in the Shenandoah Valley (USA), Hydrogeology Journal, v. 17, no. 5, p. 1111–1131.
Note: Please check the web site for Regional Assessment of Groundwater Quality in the Piedmont and Valley and Ridge Aquifers at: http://water.usgs.gov/nawqa/studies/praq/piedvr/index.html or contact [email protected] for additional information.