21
Growing Our Brand, Sales, and Profits Growing Our Brand, Sales, and Profits Emil Brolick, President & Chief Concept Officer Emil Brolick, President & Chief Concept Officer

Growing Our Brand, Sales, and ProfitsGrowing Our Brand, Sales, and Profits
Emil Brolick, President & Chief Concept OfficerEmil Brolick, President & Chief Concept Officer

Five Key Strategies
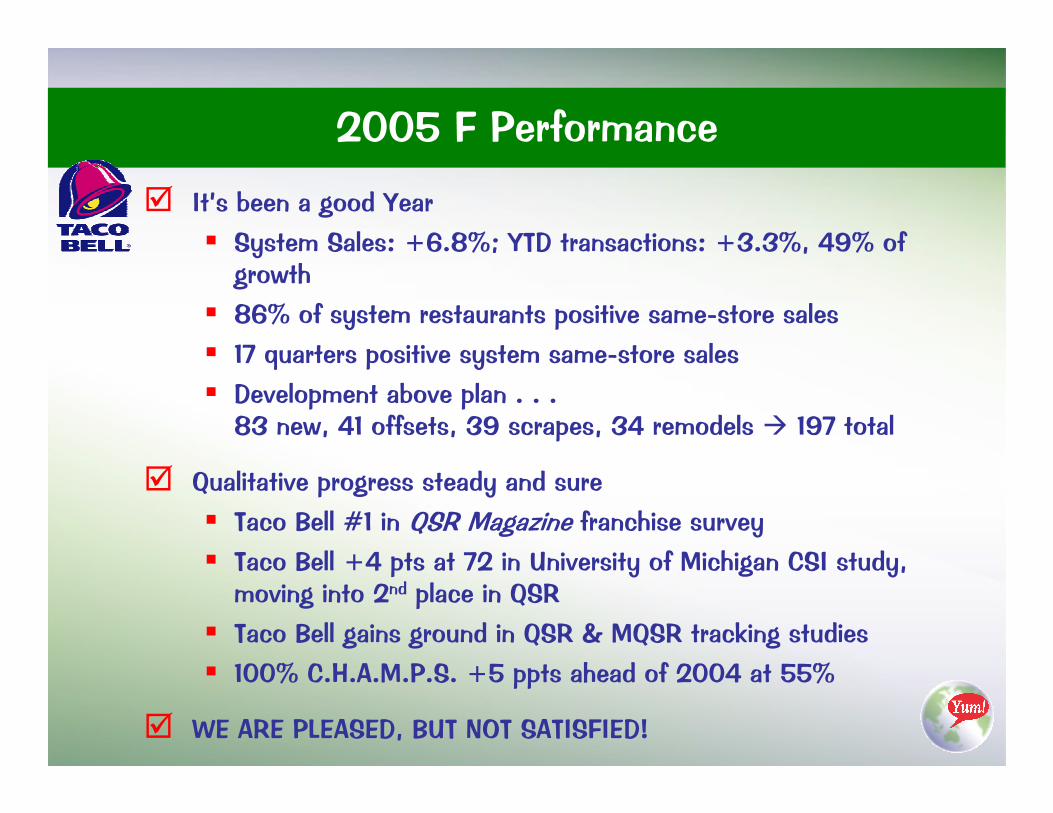
2005 F Performance
It’s been a good YearSystem Sales: +6.8%; YTD transactions: +3.3%, 49% of growth86% of system restaurants positive same-store sales17 quarters positive system same-store salesDevelopment above plan . . . 83 new, 41 offsets, 39 scrapes, 34 remodels 197 total
Qualitative progress steady and sureTaco Bell #1 in QSR Magazine franchise surveyTaco Bell +4 pts at 72 in University of Michigan CSI study, moving into 2nd place in QSRTaco Bell gains ground in QSR & MQSR tracking studies100% C.H.A.M.P.S. +5 ppts ahead of 2004 at 55%
WE ARE PLEASED, BUT NOT SATISFIED!
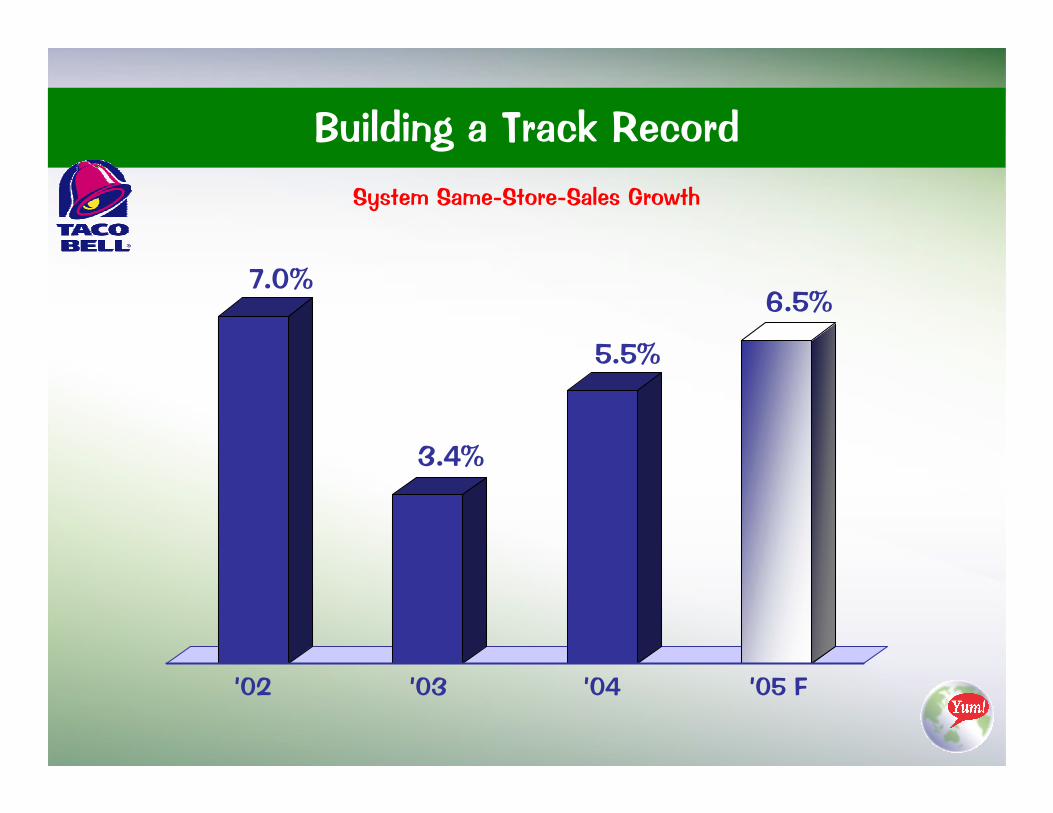
Building a Track RecordSystem Same-Store-Sales Growth
7.0%
3.4%
5.5%
6.5%
’02 ’03 ’04 ’05 F

Annual Restaurant AUVs($ thousands)
$918
$1,006$1,069
$1,130
’02 ’03 ’04 ’05 F
+210 KSince ’02+210 K
Since ’02

Five Key Strategies
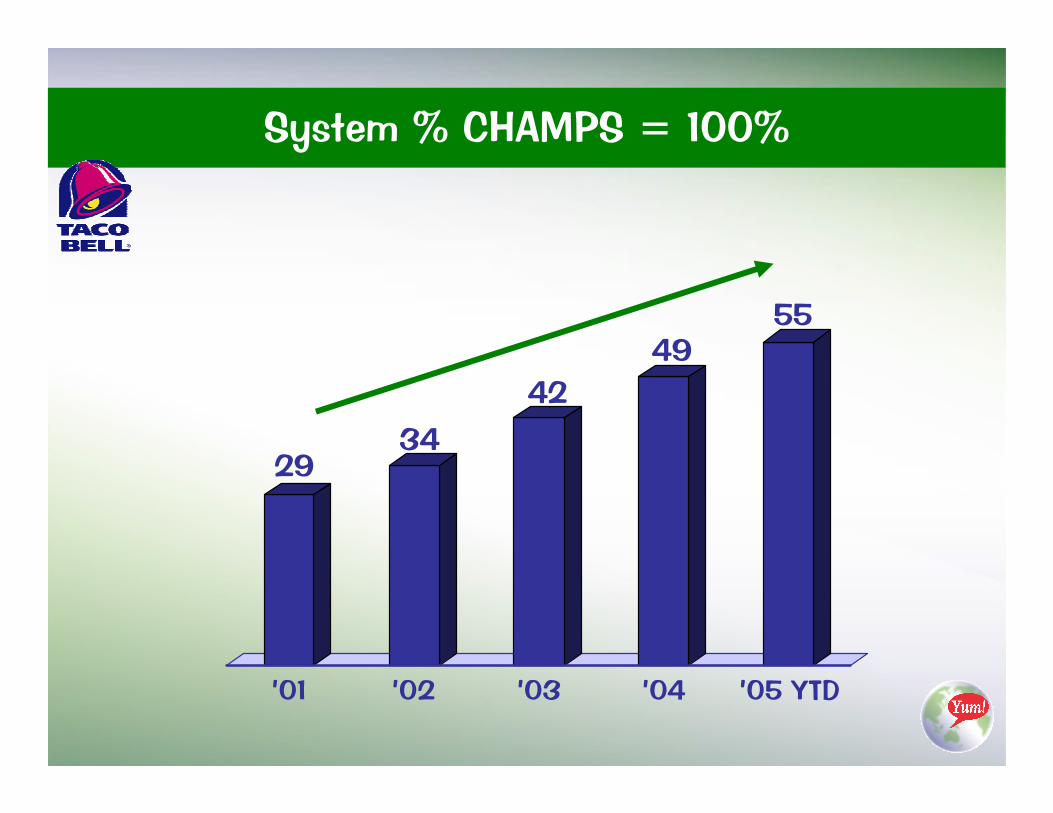
System % CHAMPS = 100%
2934
4249
55
’01 ’02 ’03 ’04 ’05 YTD
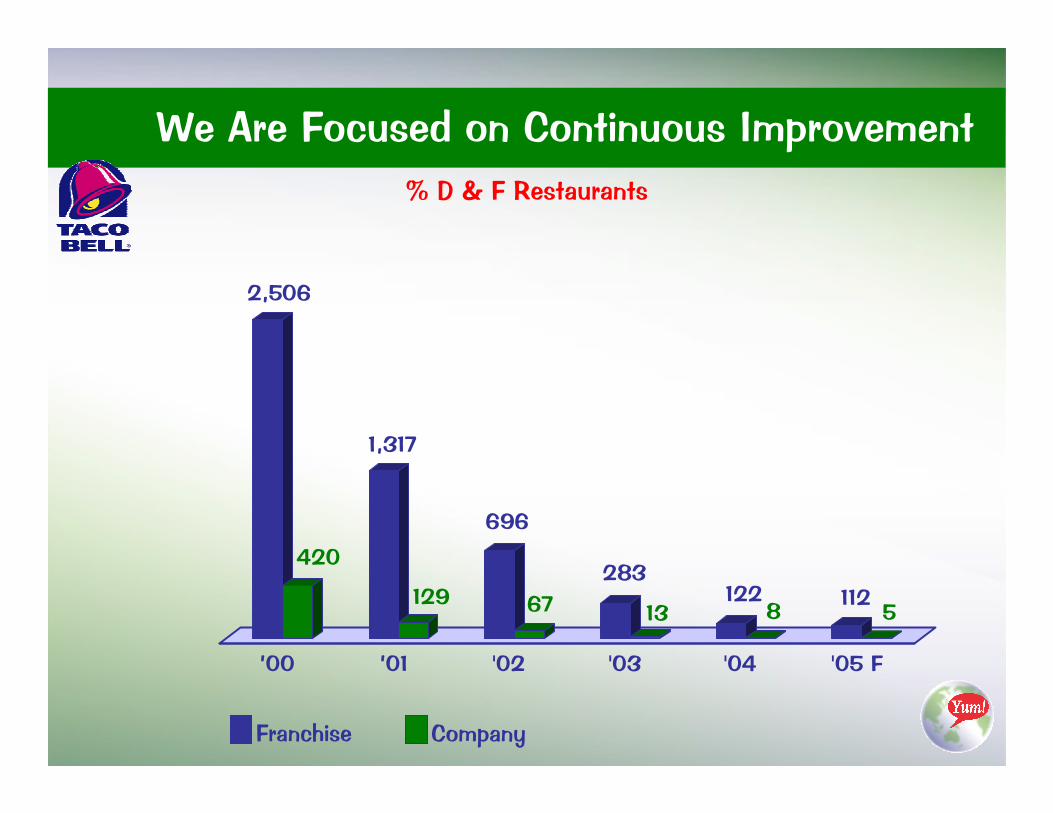
2,506
420
1,317
129
696
67283
13122
8112
5
’00 ’01 '02 '03 '04 '05 F
We Are Focused on Continuous Improvement% D & F Restaurants
Franchise Company
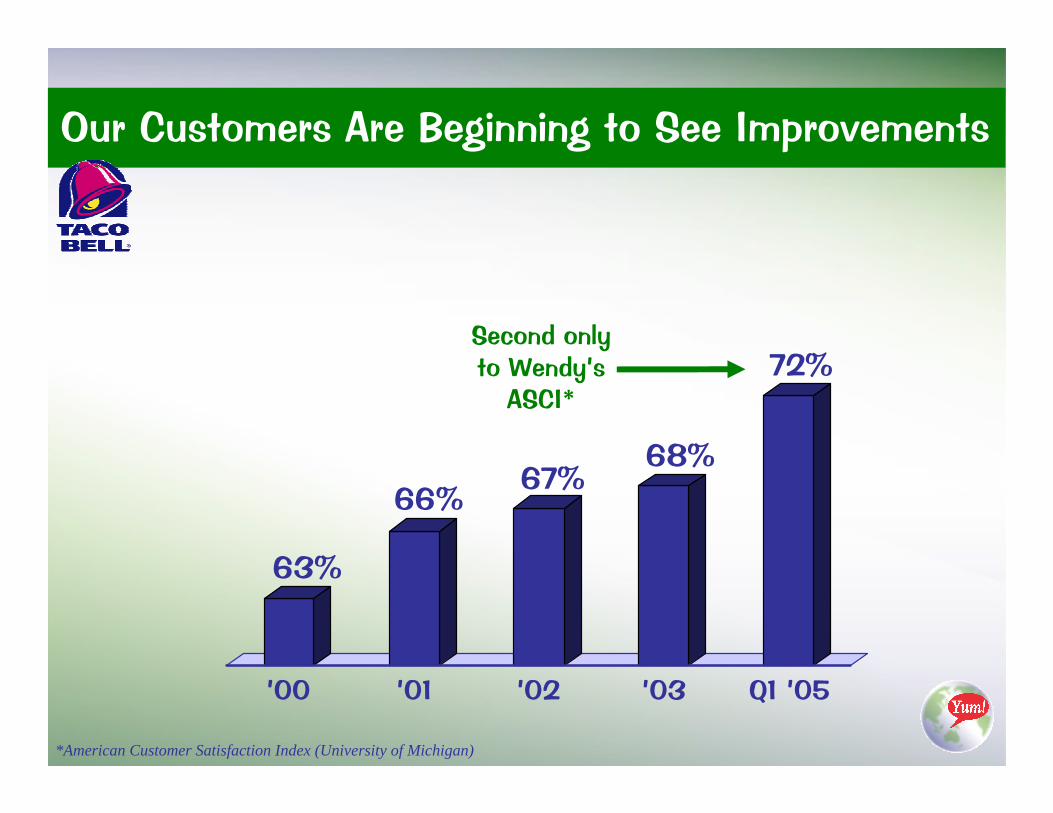
Our Customers Are Beginning to See Improvements
63%
66%67%
68%
72%
’00 ’01 ’02 ’03 Q1 ’05
Second onlyto Wendy’s
ASCI*
*American Customer Satisfaction Index (University of Michigan)
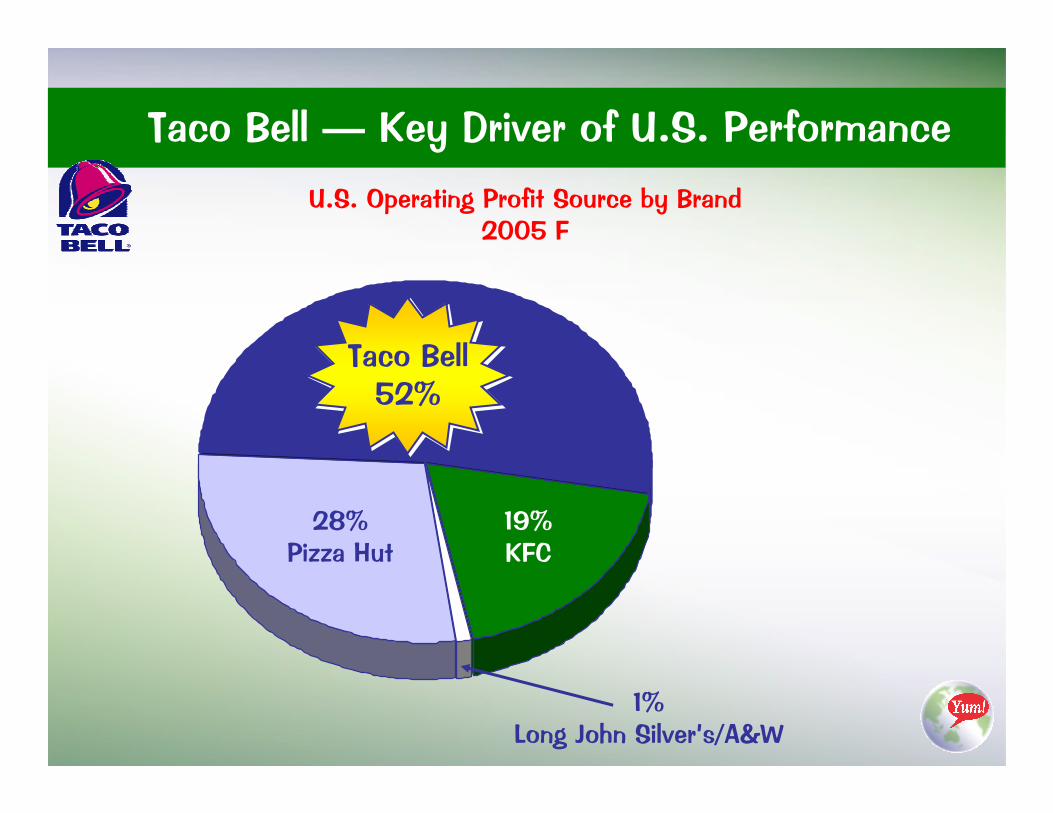
Taco Bell — Key Driver of U.S. Performance
U.S. Operating Profit Source by Brand2005 F
28%Pizza Hut
19%KFC
1%Long John Silver’s/A&W
Taco Bell52%
Taco Bell52%
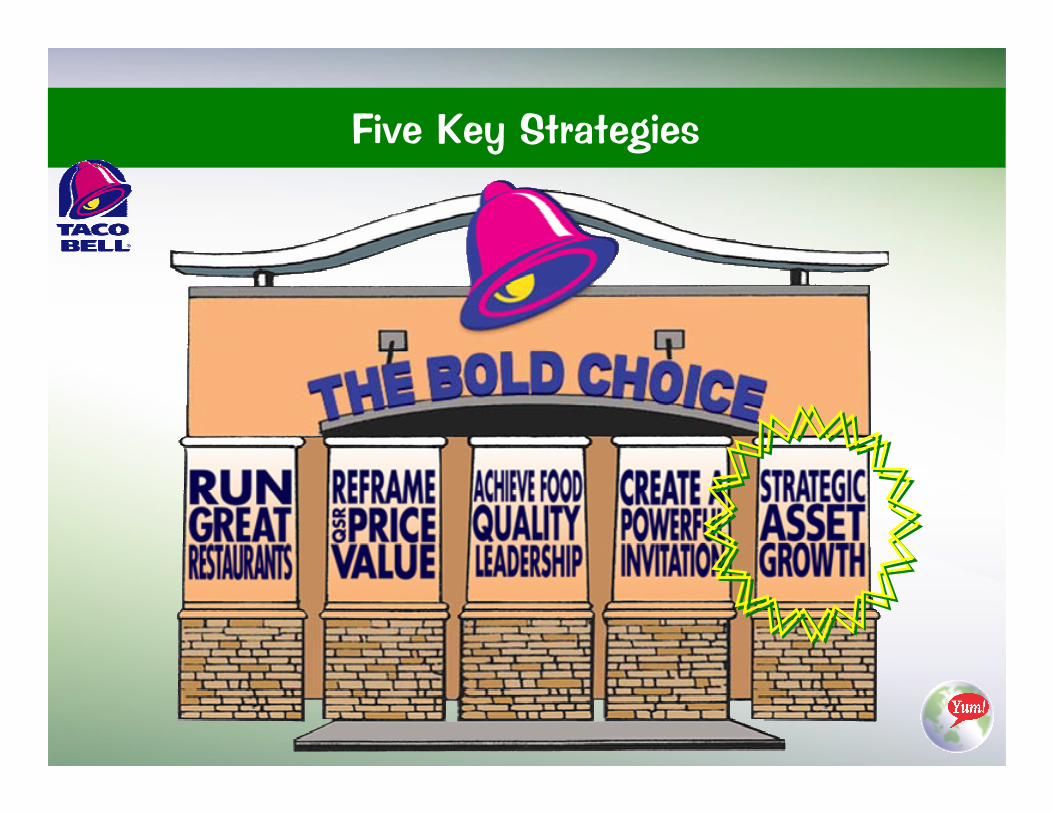
Five Key Strategies
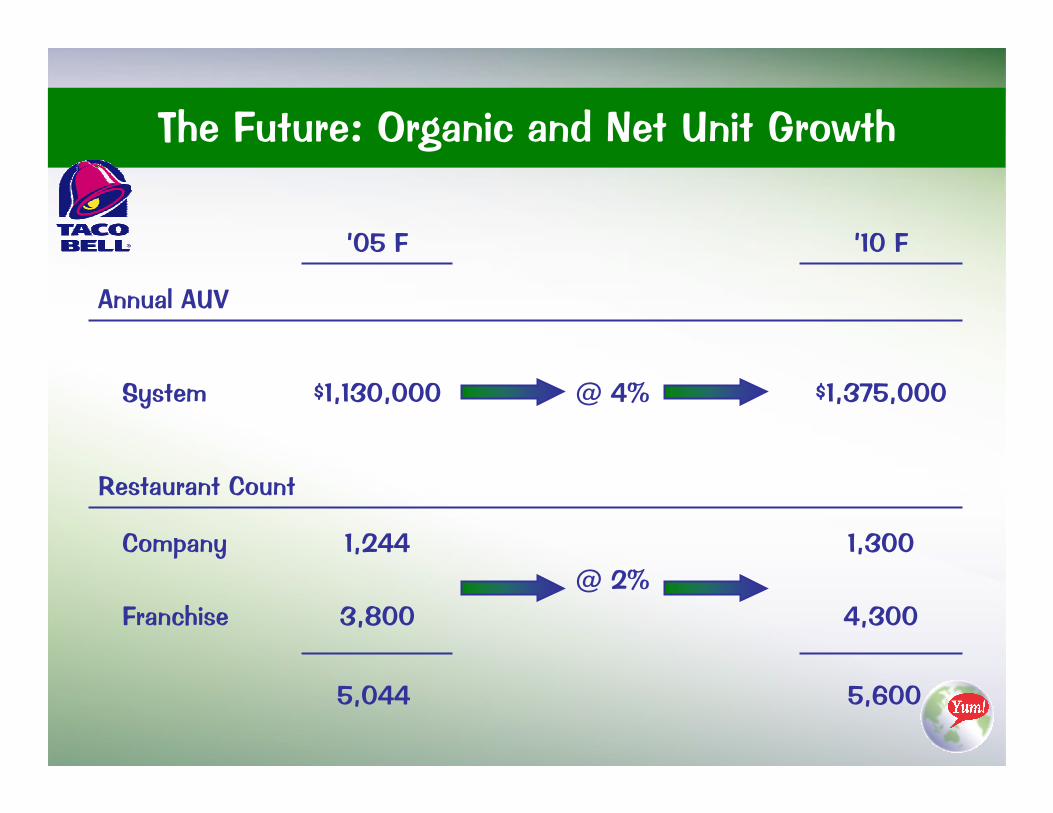
The Future: Organic and Net Unit Growth
Annual AUV
4,3003,800Franchise
1,300@ 2%
1,244Company
Restaurant Count
$1,375,000@ 4%$1,130,000System
’10 F’05 F
5,044 5,600

History Suggests We Are a Growth-Oriented Franchise System
125 118128
190 183
101
5437
2747 53
'95 '96 ’97 ’98 ’99 ’00 ’01 ’02 ’03 ’04 ’05 F
Franchise New-Restaurant Openings

We Continue to Believe in the Market Opportunity
U.S. Domestic System Count1
Population per Store2
Subway
McDonald’s
Burger King
Taco Bell
18,457
13,440
7,424
5,448
16,037
22,024
39,871
54,332
1 Source: Recount report, spring 20052Based on U.S. population of 296 million
Index
73
100
181
247

Development Results Are Solid
$1.1 $1.1 Current System AverageCurrent System Average
$1.4+Replacements
$1.3 to 1.4KFC/Taco Bells
$1.3 to 1.4Taco Bell/Long John Silver’s
$1.1 to 1.3Single Brand Taco Bell
NEW RESTAURANTSNEW RESTAURANTS
($ million)

Our Four-Year Development Goals Are Achievable
20
60
20
14
30
53
20
55
30
12
44
70
20
65
40
45
50
80
20
75
40
55
60
90
Replacement Remodel New Build ReplacementRemodel New Build Replacement Remodel New Build ReplacementRemodel New Build
Replacement & Remodel & New Build
197197197231231231
340340340
’05 F’05 F ’07 F’07 F ’08 F’08 F
300300300
’06 F’06 F
80
34
8375
42
114
85 85
130
95 95
150
Franchise Company

With KFC
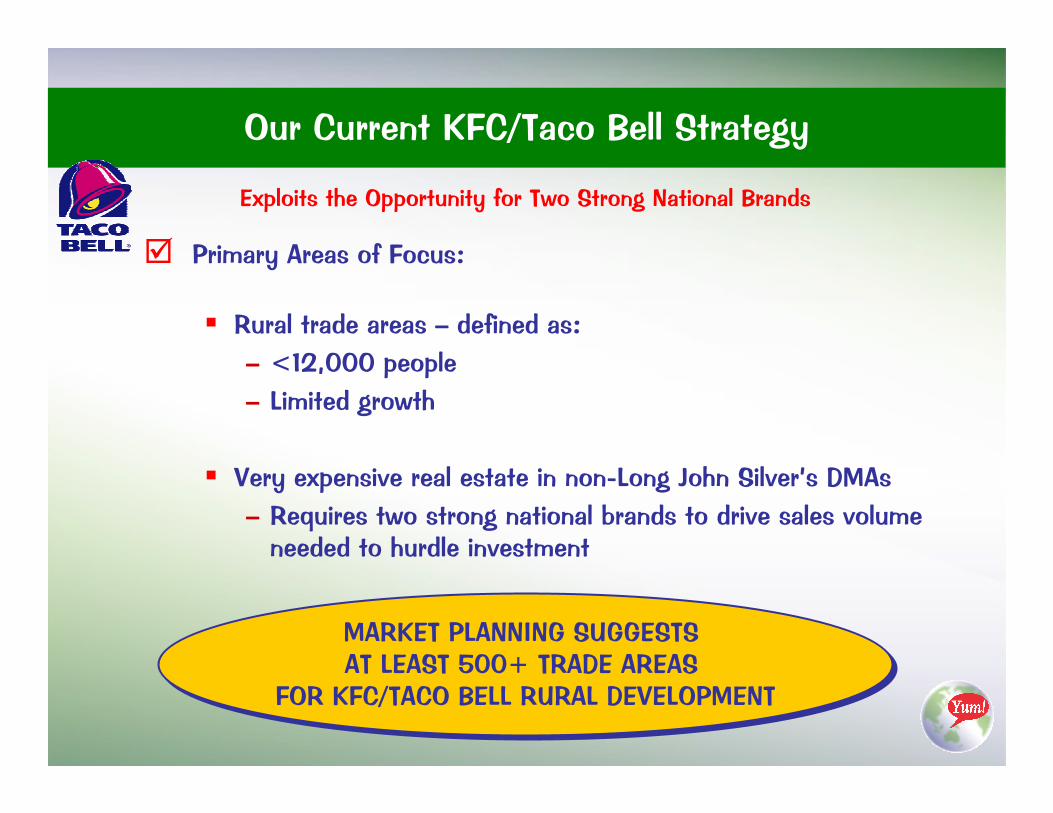
MARKET PLANNING SUGGESTS AT LEAST 500+ TRADE AREAS
FOR KFC/TACO BELL RURAL DEVELOPMENT
MARKET PLANNING SUGGESTS AT LEAST 500+ TRADE AREAS
FOR KFC/TACO BELL RURAL DEVELOPMENT
Our Current KFC/Taco Bell Strategy
Primary Areas of Focus:
Rural trade areas – defined as:– <12,000 people– Limited growth
Very expensive real estate in non-Long John Silver’s DMAs– Requires two strong national brands to drive sales volume
needed to hurdle investment
Exploits the Opportunity for Two Strong National Brands

With Long John Silver’s
Taco Bell
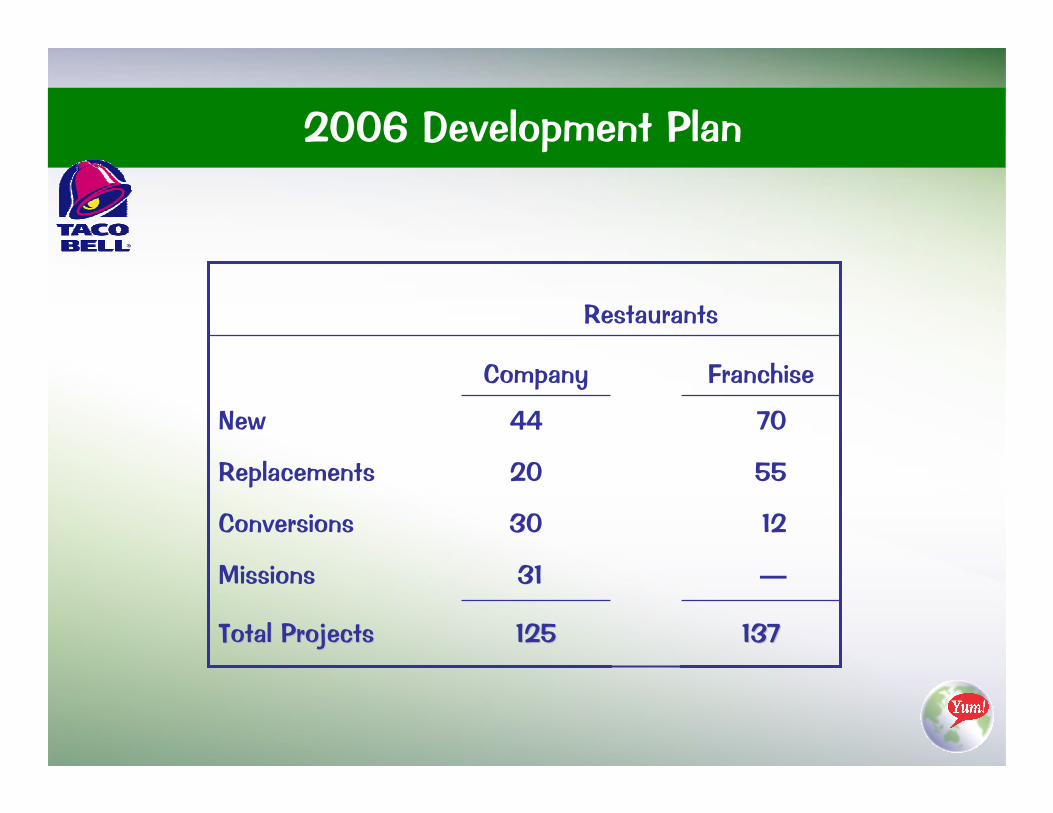
2006 Development Plan
Restaurants
137137125125Total ProjectsTotal Projects
—31Missions
1230Conversions
5520Replacements
7044New
FranchiseCompany


