Growing Our Energy Agricultural Waste-to-Energy Renewable Energy Generation and GHG Emission Reductions via Innovative Waste Management Presented To: ACEC Environmental Committee February 10, 2014 Presented By: William G. “Gus” Simmons, Jr., P.E. Cavanaugh & Associates, P.A. 1
Transcript
Growing Our Energy Agricultural Waste-to-Energy
Renewable Energy Generation and GHG Emission Reductions via
Innovative Waste Management
Presented To:
ACEC Environmental Committee
February 10, 2014
Presented By:
William G. “Gus” Simmons, Jr., P.E.
Cavanaugh & Associates, P.A.
1
Why Are We Looking at Alternative Energy / Fuels???
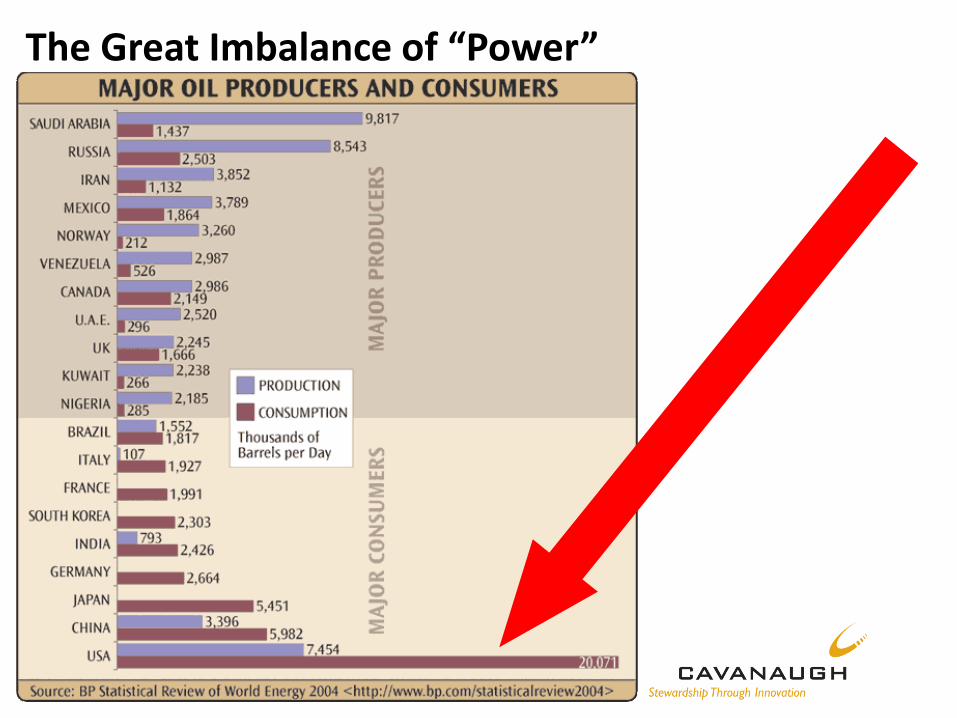
• With less than 5% of the world’s population, the United States consumes 25% of the world’s oil supply.
• The U.S. has just 1.6% of the world’s oil reserves.
• We currently export 1.1 billion gallons of U.S.-produced ethanol annually (Europe, UAE, etc.)
• There are problems…
2
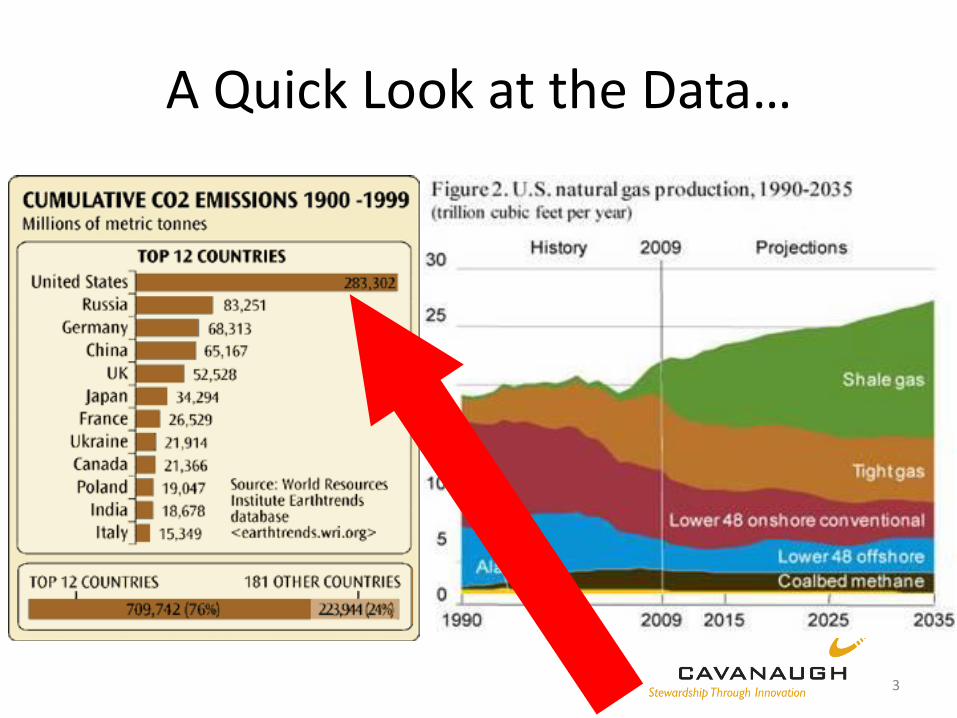
A Quick Look at the Data…
3
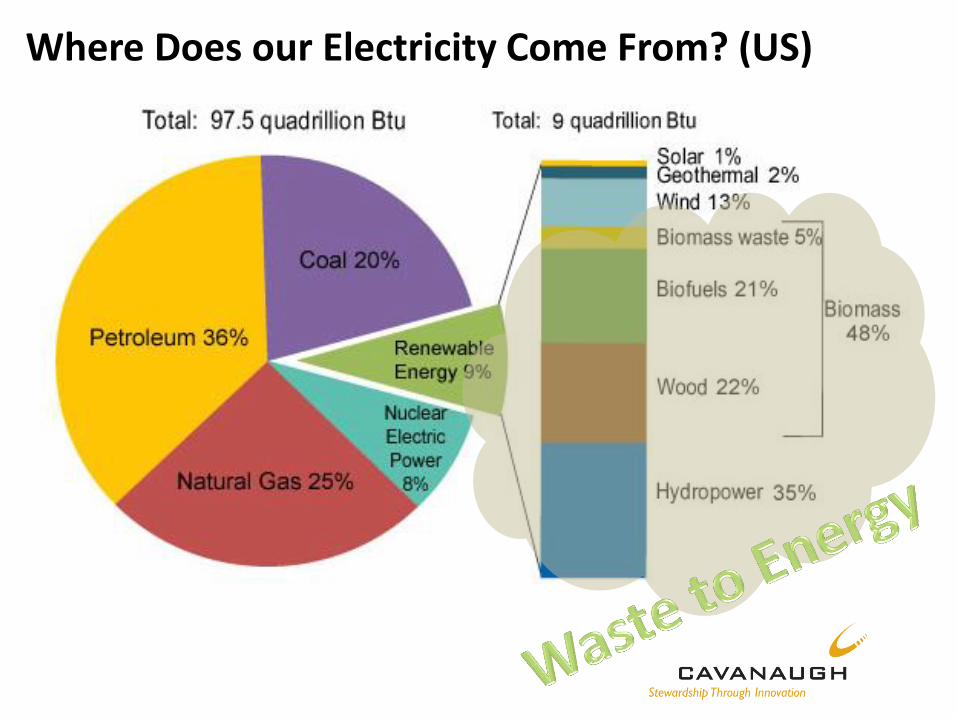
Where Does our Electricity Come From? (US)
The Great Imbalance of “Power”
A Global Supply Problem…
Alberta Tar Sand Pit
- This area used to be forested, full of trees and wildlife - 54,000 square miles in size – A little bigger than entire NC! - 4 Gallons of Water used for every 1 gallon of Oil Produced!!!
Why is NC Looking at Alternative Energy / Fuels from Ag Waste???
• NC Ranks 2nd in the US in pigs produced, with 15% of the US pig crop (IA)
• NC Ranks 2nd in the US in turkeys produced, with 13% of the US turkey crop (MN)
• NC Ranks 4th in the US in broilers produced, with 9% of the US broiler crop (GA)
• NC Ranks 10th in the US in residential electricity consumption, per capita
7
Agricultural WTE Reqmnts in NC • With the passage of Senate Bill 3 (2007), North Carolina
became the first state in the Southeast to adopt a Renewable Energy and Energy Efficiency Portfolio Standard (REPS).
• SB3 requires: – investor-owned utilities in North Carolina to provide up to 12.5% of
their energy through renewable energy resources or energy efficiency measures.
– Rural electric cooperatives and municipal electric suppliers are subject to a 10% REPS requirement.
• Agree or Disagree – a linkage was made between the potential for the development of renewable energy (biogas / biomass) and all the pig farms in North Carolina
8
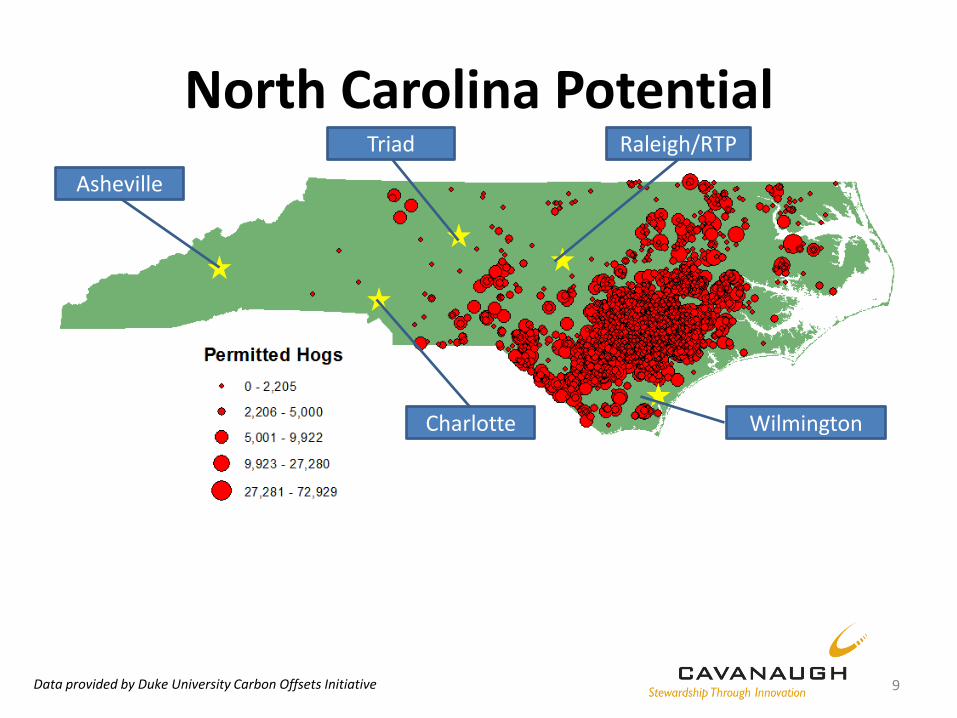
North Carolina Potential
Data provided by Duke University Carbon Offsets Initiative 9
Asheville
Triad Raleigh/RTP
Charlotte Wilmington
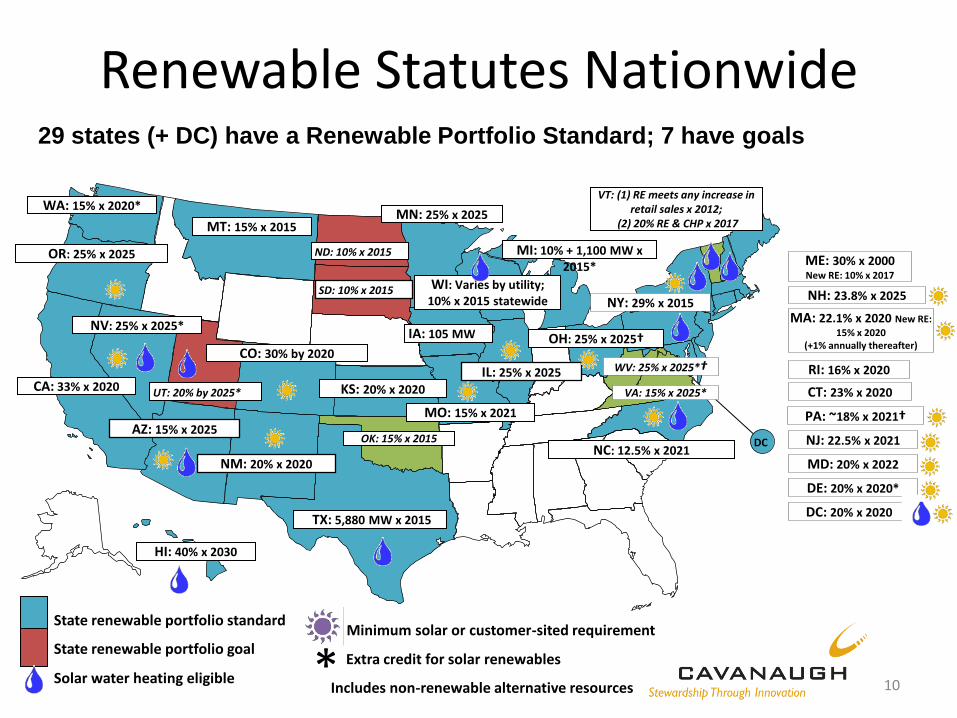
Renewable Statutes Nationwide
State renewable portfolio standard
State renewable portfolio goal
Solar water heating eligible * Extra credit for solar renewables
Includes non-renewable alternative resources
WA: 15% x 2020*
CA: 33% x 2020
NV: 25% x 2025*
AZ: 15% x 2025
NM: 20% x 2020
HI: 40% x 2030
Minimum solar or customer-sited requirement
TX: 5,880 MW x 2015
UT: 20% by 2025*
CO: 30% by 2020
MT: 15% x 2015
ND: 10% x 2015
SD: 10% x 2015
IA: 105 MW
MN: 25% x 2025
MO: 15% x 2021
WI: Varies by utility; 10% x 2015 statewide
MI: 10% + 1,100 MW x 2015*
OH: 25% x 2025†
ME: 30% x 2000 New RE: 10% x 2017
NH: 23.8% x 2025
MA: 22.1% x 2020 New RE:
15% x 2020 (+1% annually thereafter)
RI: 16% x 2020
CT: 23% x 2020
NY: 29% x 2015
NJ: 22.5% x 2021
PA: ~18% x 2021†
MD: 20% x 2022
DE: 20% x 2020*
DC: 20% x 2020
VA: 15% x 2025*
NC: 12.5% x 2021
VT: (1) RE meets any increase in retail sales x 2012;
(2) 20% RE & CHP x 2017
KS: 20% x 2020
OR: 25% x 2025
IL: 25% x 2025 WV: 25% x 2025*†
DC OK: 15% x 2015
29 states (+ DC) have a Renewable Portfolio Standard; 7 have goals
10
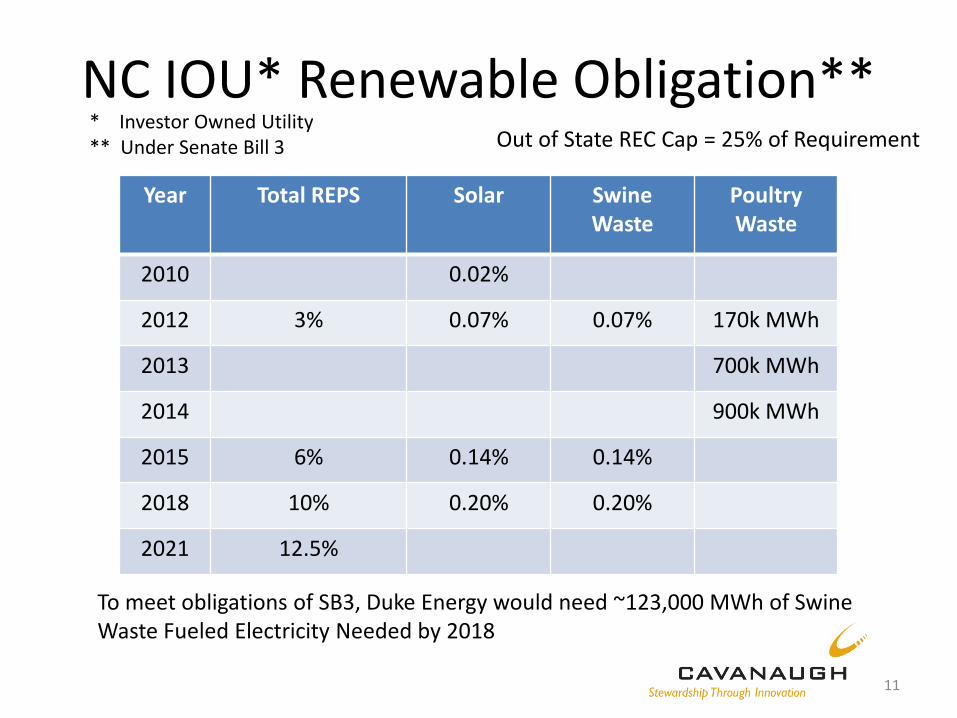
NC IOU* Renewable Obligation**
11
* Investor Owned Utility ** Under Senate Bill 3
Year Total REPS Solar Swine Waste
Poultry Waste
2010 0.02%
2012 3% 0.07% 0.07% 170k MWh
2013 700k MWh
2014 900k MWh
2015 6% 0.14% 0.14%
2018 10% 0.20% 0.20%
2021 12.5%
Out of State REC Cap = 25% of Requirement
To meet obligations of SB3, Duke Energy would need ~123,000 MWh of Swine Waste Fueled Electricity Needed by 2018
The North Carolina Potential - What Can We Expect from Swine
Waste to Energy Systems? • About 1.1 M MWh electricity annually
• About 6.3 M tons GHGs reduced annually
• Potential for major nutrient management strides and pathogen reductions
• Creation of new acres of cash cropland Data provided by Duke University Carbon Offsets Initiative
12
How to turn pig waste into electrons?
13
Step 1: Model Development Project Goals: (2006)
• Make it “Market Feasible” – farm owners perspective
• Energy Generation + Water Quality Improvement + Air Emissions Improvement
• Make it flexible - different farm sizes & types
• Process based, not technology based
• Innovative waste management : Achieve environmental performance standards as described by NC legislation – Substantial elimination of odor, ammonia, total nitrogen,
and pathogens
14
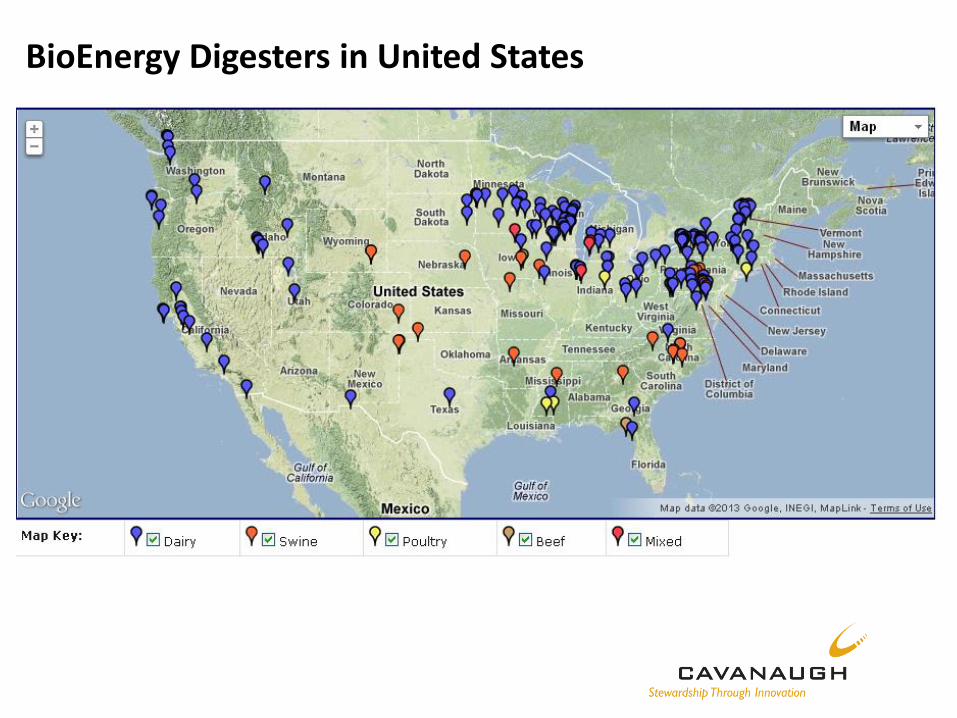
BioEnergy Digesters in United States
BioEnergy Digesters in North Carolina
Commercial-Scale Project : Case Study: Digester Systems for Animal Waste Solids – Loyd Ray Farms Project GHG Emission
Reductions and Renewable Energy Generation via Innovative Waste Management
17
Commercial-Scale Demonstration Project: Loyd Ray Farms Swine Waste-to-Energy Project Converts waste from 9,000 pigs into electricity Improved Environmental Management
How it Works:
19
~65% CH4
Raw
Was
te
Mixed Digester
Bio
gas
Liq
uid
s
How it Works
Existing Storage Lagoon
Photos by: Marc Deshusses, Duke University, 2011
What it looks like… After Construction
21
What it looks like… Steady State
Covered Anaerobic Digester
22
Aeration System
23
Gas Conditioning System & Microturbine
Microturbine Specifications: •65 kilowatt Generative Capacity •First Scheduled Service @ 8,000 Hrs •Only one moving part @ >90,000 RPM •Air bearings – no lubricant or coolant required
24
Expected Outcomes: 5,000± Carbon Offsets per Year, registered with Climate Action Reserve
Duke University & Google: Retire to meet carbon neutrality goal,
retire for immediate internal demand, and/or sell when strong
market signal arises
500± Renewable Energy Credits per Year
Utility: Motivated by NC Renewable Energy and Energy Efficiency
Portfolio Standard Swine Waste Set Aside
Electricity Generation
Farm: Energy to offset increased demand from innovative system
and offset baseline electricity demand (projected to offset up to
half of farm’s existing electricity demand)
Compliance with Environmental Performance Standards for New &
metals and zero discharge of waste to surface and groundwater);
Ensures compliance with offset standard to meet all air and water
quality standards by controlling nutrient loads
25
Equivalent GHG Emissions: • Annual greenhouse gas emissions from 889 passenger vehicles
• CO2 emissions from 508,512 gallons of gasoline consumed
• CO2 emissions from 10,549 barrels of oil consumed
• CO2 emissions from 60 tanker trucks’ worth of gasoline
• CO2 emissions from the electricity use of 566 homes for one year
• CO2 emissions from the energy use of 393 homes for one year
• Carbon sequestered by 116,306 tree seedlings grown for 10 years
• Carbon sequestered annually by 967 acres of pine or fir forests
• Carbon sequestered annually by 45 acres of forest preserved from deforestation
• CO2 emissions from 188,997 propane cylinders used for home barbeques
• CO2 emissions from burning 25 railcars’ worth of coal
• Greenhouse gas emissions avoided by recycling 1,580 tons of waste instead of sending it to the landfill
Source: EPA Greenhouse Gas Equivalencies Calculator
26
RESULTS
27
0
10
20
30
40
50
60
706
/1/2
01
1
6/8
/20
11
6/1
5/2
01
1
6/2
2/2
01
1
6/2
9/2
01
1
7/6
/20
11
7/1
3/2
01
1
7/2
0/2
01
1
7/2
7/2
01
1
8/3
/20
11
8/1
0/2
01
1
8/1
7/2
01
1
8/2
4/2
01
1
8/3
1/2
01
1
9/7
/20
11
9/1
4/2
01
1
9/2
1/2
01
1
9/2
8/2
01
1
10
/5/2
01
1
10
/12
/20
11
10
/19
/20
11
10
/26
/20
11
11
/2/2
01
1
11
/9/2
01
1
11
/16
/20
11
11
/23
/20
11
11
/30
/20
11
12
/7/2
01
1
12
/14
/20
11
12
/21
/20
11
12
/28
/20
11
Po
we
r (k
W)
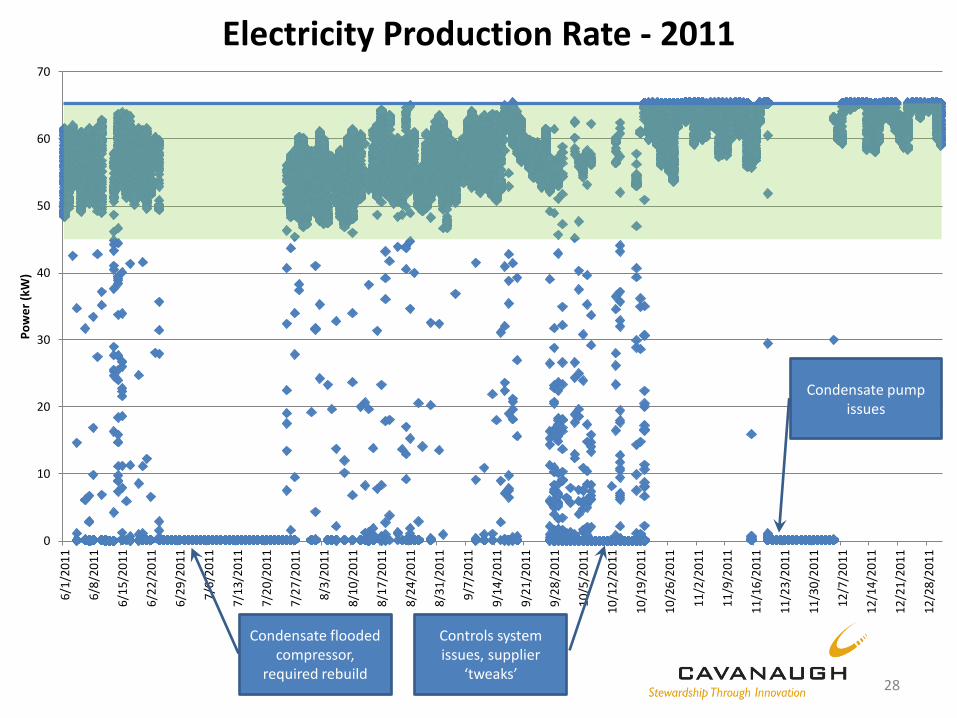
Electricity Production Rate - 2011
28
Condensate flooded compressor,
required rebuild
Controls system issues, supplier
‘tweaks’
Condensate pump issues
0
10
20
30
40
50
60
701
2/3
1/2
01
1
1/7
/20
12
1/1
4/2
01
2
1/2
1/2
01
2
1/2
8/2
01
2
2/4
/20
12
2/1
1/2
01
2
2/1
8/2
01
2
2/2
5/2
01
2
3/3
/20
12
3/1
0/2
01
2
3/1
7/2
01
2
3/2
4/2
01
2
3/3
1/2
01
2
4/7
/20
12
4/1
4/2
01
2
4/2
1/2
01
2
4/2
8/2
01
2
5/5
/20
12
5/1
2/2
01
2
5/1
9/2
01
2
5/2
6/2
01
2
6/2
/20
12
6/9
/20
12
6/1
6/2
01
2
6/2
3/2
01
2
6/3
0/2
01
2
7/7
/20
12
7/1
4/2
01
2
7/2
1/2
01
2
7/2
8/2
01
2
8/4
/20
12
8/1
1/2
01
2
8/1
8/2
01
2
8/2
5/2
01
2
Po
we
r (k
W)
Electricity Production Rate - 2012
29
Compressor cooler failure, controls
Manual Operation Only – Gas Skid Replacement
Scorecard
30
Parameter Goal Actual Success Gauge
RECs 500 344 69%
Carbon Offsets 5,000 Tons 2,500 Tons 50%
Environmental Performance - Surface Water Protection
Substantial Elimination Accomplished by Permit
Passed
Environmental Performance - Ground Water Protection
Substantial Elimination Accomplished by Permit
Passed
Environmental Performance - Odor Emissions
>7:1 D/T 2:1 D/T Passed
Environmental Performance - Ammonia Emissions
WWTP = Farm =
106 kg/wk 476 kg/wk
23 kg/wk 341 kg/wk
460% (Passed) 140% (Passed)
Environmental Performance - Vector Reduction
<7,000 mpn/100mL <5,000 mpn/100mL
140% (Passed)
Costs and Benefits Costs
• Capital: $1.7M
• O&M: $80,000/year
Funding sources • NCACSP LCP • CCPI/EQIP • Farm Bill Section 9006 REEP • NRCS CIG & FPPC • USDA SBIR • USDA SARE • NSF • US Dept. of Energy • NC State Energy Office • Sale of RECs and Carbon Offsets
Benefits
• Cash flow for farm owner
• Improved animal health
• Other ecosystem services (N, P control)
• Variability in nitrogen output for fertilizer
• Reduced sludge management cost
• Improved air quality on-site
• Reduction of odors off site
• More choice in cropping plan
• Sustaining NC Agriculture
• Reduced GHG Emissions
31
A couple of firsts… • First Swine Waste-to-energy project in the State
of North Carolina to place RECs on the North Carolina Utilities Commission REC Tracking System
• First Transfer of RECs from a NC Swine Farm to Duke Energy
• First ‘Innovative Swine Waste Treatment System’ permitted that utilizes digester
• First Swine Farm Expansion Permit Since 1997???
32
Deployment? • Broad-scale deployment has been inhibited by:
– Costs: still requires “artificial economics” to make financial feasibility threshold
– Management: Requires ~240 farms to meet the goal, which means 240+ generators, etc.
– Risks: Many risks for many folks
• Policy, environmental, biosecurity, technology, etc.