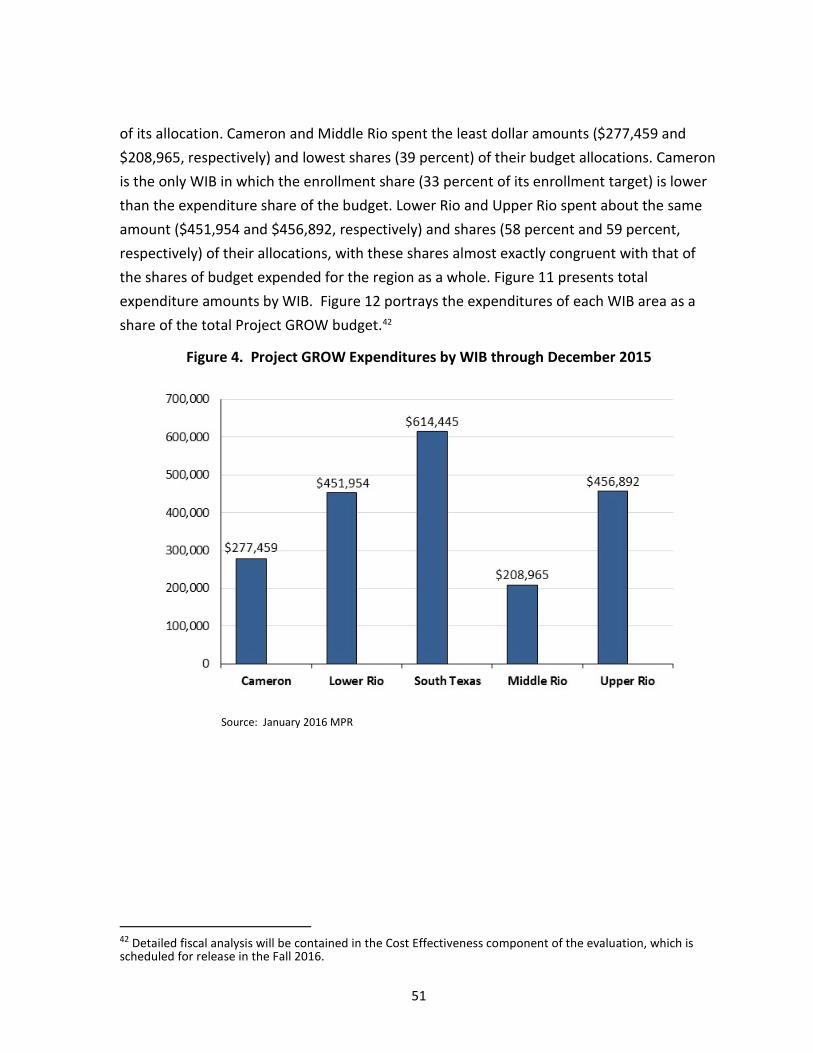
4:4:004 GROWING REGIONAL OPPORTUNITY FOR THE WORKFORCE: PROJECT GROW GOES TO SEED IN THE TEXAS-MEXICO BORDER AREAS Final Implementation Analysis Report Draft Review for Comments — Please Do Not Cite or Circulate Dan O’Shea Ashweeta Patnaik Heath Prince June 2016 3001 Lake Austin Blvd., Suite 3.200 Austin, TX 78703 (512) 471-7891 raymarshallcenter.org
Transcript
4:4:004
GROWING REGIONAL OPPORTUNITY FOR THE WORKFORCE:
PROJECT GROW GOES TO SEED IN THE TEXAS-MEXICO
BORDER AREAS
Final Implementation Analysis Report
Draft Review for Comments — Please Do Not Cite or Circulate
Dan O’Shea Ashweeta Patnaik Heath Prince June 2016
3001 Lake Austin Blvd., Suite 3.200 Austin, TX 78703 (512) 471-7891 raymarshallcenter.org
4:4:004
This report was prepared with funds provided by the U.S. Department of Labor under CFDA 17.283 and subcontracted by Jobs for the Future to the Ray Marshall Center for the Study of Human Resources at the University of Texas at Austin. The views expressed here are those of the authors and do not represent the positions of the funding agencies or The University.
4:4:004
TABLE OF CONTENTS
List of Figures ............................................................................................................................ iii
List of Tables ............................................................................................................................. iv
Acknowledgments...................................................................................................................... v
Executive Summary .................................................................................................................. vii
Evaluation Overview ........................................................................................................ 4 Key Research Questions ........................................................................................... 4 Process Evaluation .................................................................................................... 5
Organization of the Report .............................................................................................. 6
Design and Implementation: Key Demonstration Features ..................................................... 8 Introduction ..................................................................................................................... 8 Partnership Structures ..................................................................................................... 9
Border Region Collaboration, Role, and Responsibilities ......................................... 9 Border Workforce Alliance ..................................................................................... 11 Training Providers................................................................................................... 16 Career Center Contractors ..................................................................................... 20
Key Industry Sectors and Targeted Occupations ........................................................... 21 Participation Criteria ...................................................................................................... 24
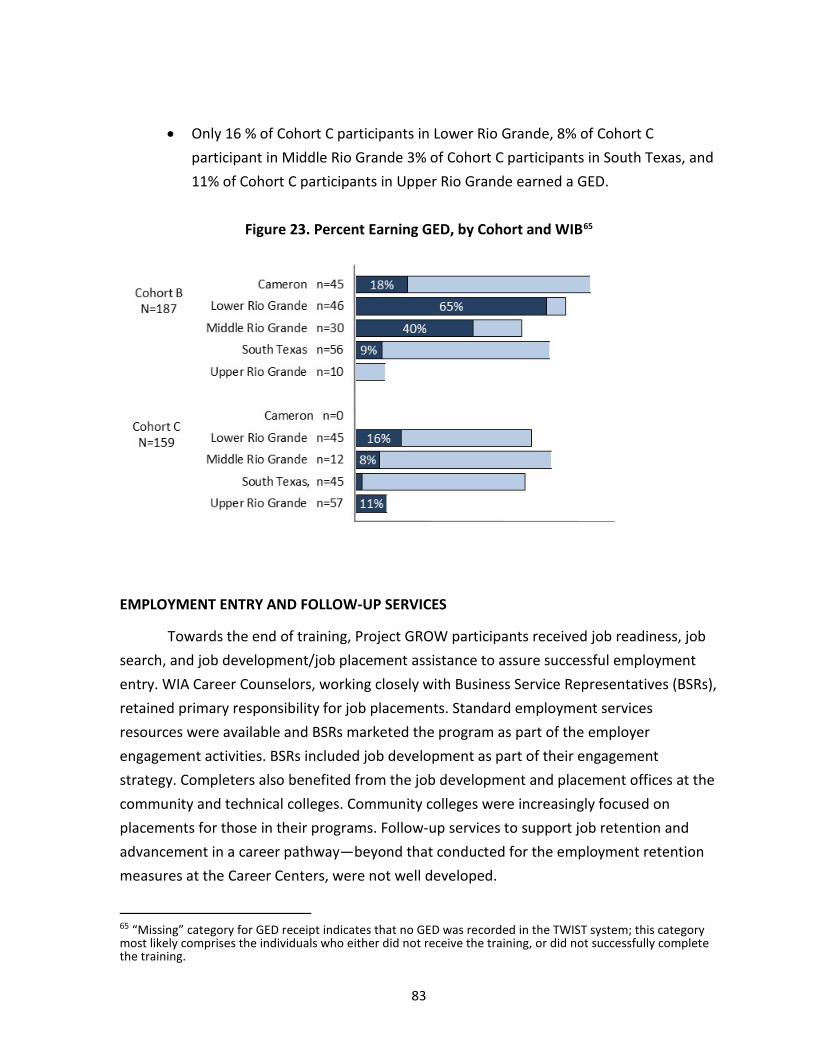
Case Management ......................................................................................................... 31 Academic Preparation ................................................................................................... 32
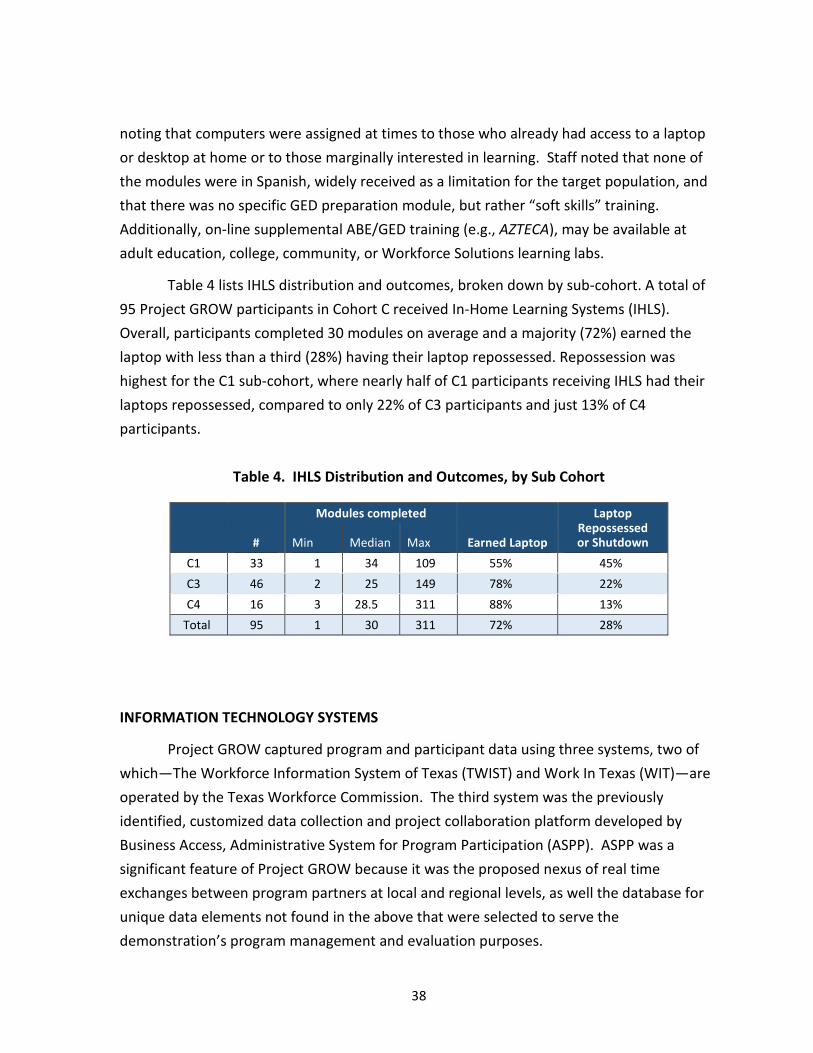
College Readiness ................................................................................................... 32 Contextualized or Bridge GED/ABE/ESL ................................................................. 35 In Home Learning System ....................................................................................... 37
Information Technology Systems .................................................................................. 38 Employer Engagement ................................................................................................... 40 Gauging Success ............................................................................................................. 43
Enrollment, Participation, and Service Delivery ............................................................ 71 Program Participation ............................................................................................ 75 Program Completion .............................................................................................. 77 Credential Achievement ......................................................................................... 78
Assessments and Observations .............................................................................................. 86 Summary of Findings ..................................................................................................... 86 Accomplishements and Constraints .............................................................................. 86 Considerations and Recommendations ......................................................................... 91 Final Comments ............................................................................................................. 93
Table 6. Self-Assessment Tool Scores by WIB Area .............................................................. 49
Table 7. Self-Assessment Tool Scores by Local Area Partner: All WIBs ................................ 49
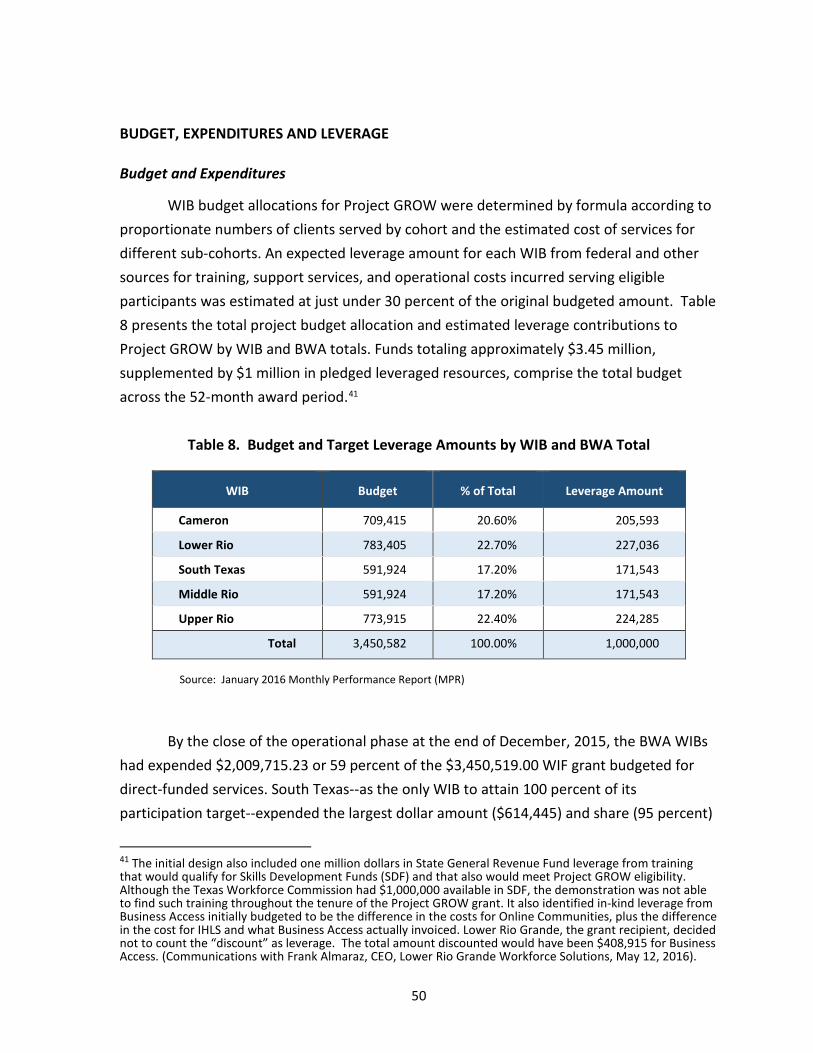
Table 8. Budget and Target Leverage Amounts by WIB and BWA Total .............................. 50
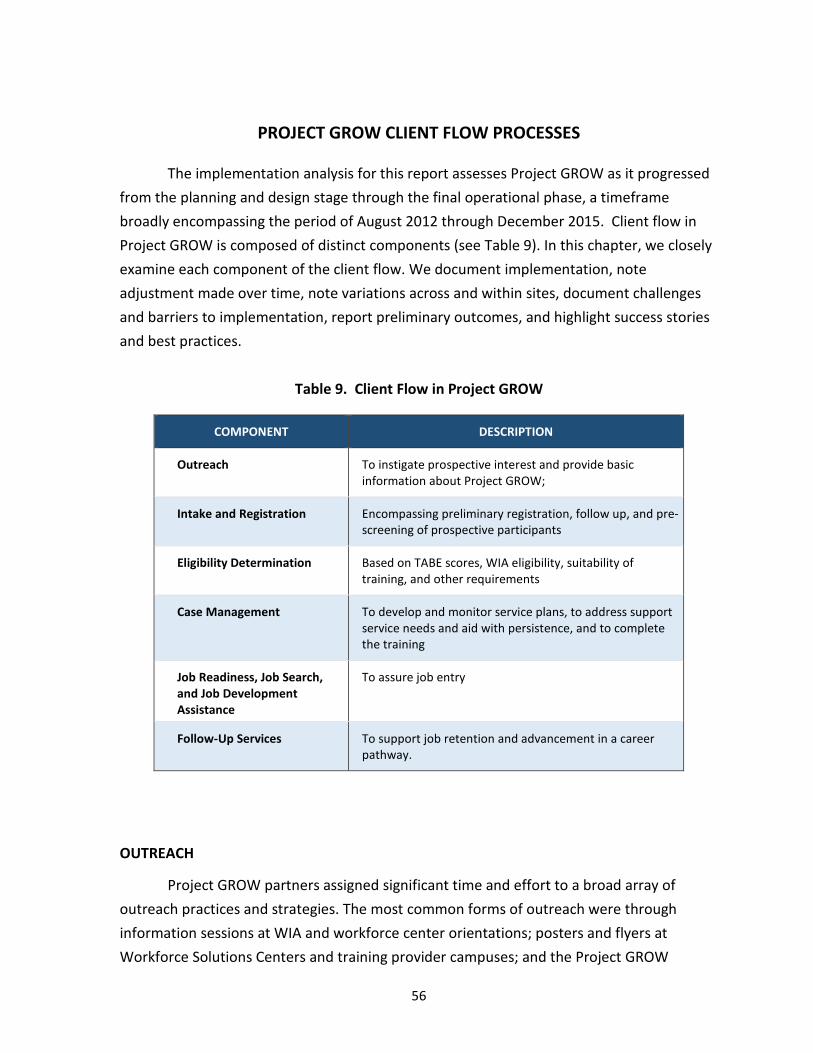
Table 9. Client Flow in Project GROW ................................................................................... 56
Table 10. Non-Eligibility Reasons, by Board Area .................................................................. 67
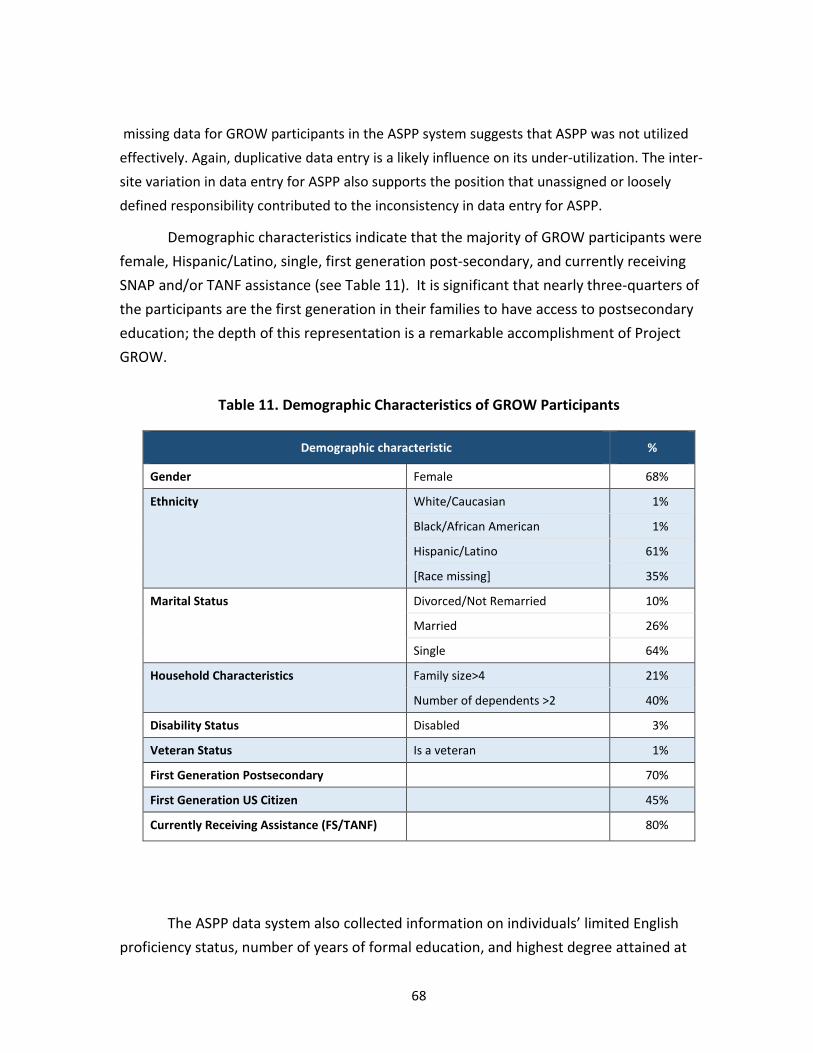
Table 11. Demographic Characteristics of GROW Participants ............................................. 68
Table 12. Variation in Demand Occupation Interest Across the 5 WIBs ............................... 70
Table 13. Variation in Demand Occupation Interest by Gender ........................................... 71
Table 14. Project GROW Targets and Final Participant Count, by Cohort ............................. 72
Table 15. Service Delivery by Cohort and Board Area ........................................................... 76
Table 16. Service Delivery by Cohort and Board Area ........................................................... 77
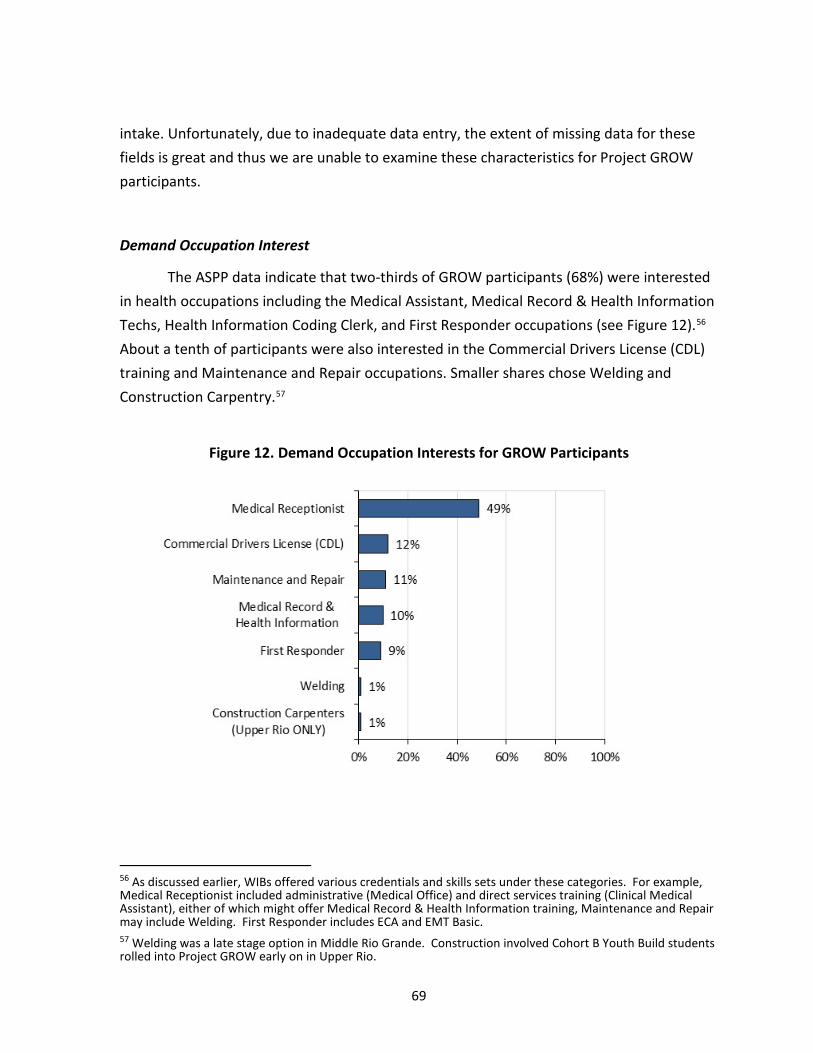
Table 17. Participant Counts by Cohort ................................................................................. 81
iv
4:4:004
ACKNOWLEDGMENTS
Researchers at the Ray Marshall Center extend their gratitude to the administrators and staff of the partnering agencies in the Project GROW demonstration without whose concerted help conducting research and preparing this Final Implementation Report would have been impossible. We’d like to give a special “nod” to David O. Gutierrez, Project GROW Program Coordinator at Lower Rio Grande. David’s excellent project management skills have streamlined our access to consistent, accurate program policy parameters and service delivery practices, as well as performance management data across sites. Among the Border Workforce Alliance leaders, we would like to recognize the contributions and support of the WIB executives and staff who supported the field work. Minimally this includes Frank Almaraz and Shelly Sanchez at Lower Rio Grande; Pat Hobbs, Juan Garcia, and Maria Gonzalez in Cameron; Rogelio Trevino and Diana Sanchez at South Texas; Ronnie Rivera and Betty Sifuentes in Middle Rio Grande; and Joyce Wilson, Janet Bono, and Lucio Glenn in the Upper Rio Grande.
Of course, neither Project GROW nor its evaluation could meet expectations without the action and support of the management and staff of the several Workforce Solutions contractors in the BWA. These include Omar Treviño, Andrea Navarro, and Martha Lopez of C2 Global Professional Services in Lower Rio Grande; Henry Castillo and Terry Avalos at Southwest Keys in Cameron; Elizabeth Benavides and Guillermo Bermudez of C2 Global Professional Services in South Texas; Karina Salas and Barbara Lopez of the MRGDC in Middle Rio Grande; and Jennifer Martinez, Hugo Carillo, and Yadira Aguilar with Serco in Upper Rio Grande.
Administrators, instructors, and staff of the community and technical colleges have done outstanding jobs trying to align systems and career pathways with their workforce partners. Olivia De la Rosa and Juan Carlos Aguirre at South Texas College in Lower Rio are noted leaders in accelerated career pathway services and shared their experience and knowledge with Project GROW peers. Juan Leal and Claudia Hernandez at Texas State Technical College made dedicated efforts to enroll and train participants in their well-recognized programs. Armando Fonseca and Sandra Cortez at Laredo Community College were attentive to the demonstration targets and intent (and successfully attained or exceeded their participation targets, the only training provider to do so). Romelia Aranda and Kristel Sanchez, among others at Southwest Texas Junior College strove to provide effective education and training across the broad expanse and dispersed settlements of the Middle Rio Grande area. Last, but certainly not least, we thank Sara Martinez, Mari Carmen
v
4:4:004
Casavantes, Nellee Powell, Ann Savino, and the many others at El Paso Community college who as a team shared their insights and experiences with and beyond Project GROW regarding basic education and training services for those with more limited labor market viability who are often bypassed by economic growth and prosperity.
Our gratitude also extends to Priscilla Alvarez, Irma Garcia, and Bernie Saenz at Project VIDA in the lower valley and Roman Ortiz, Jeremy Hensley, and Vicki Ray at Project ARRIBA in El Paso for sharing their experiences and insights regarding the challenges of creating opportunities for residents in the economic margins. We would like to thank Lois Joy at Jobs for the Future for sharing implementation observations and the very helpful comments that JFF provided on draft versions of this report. Additionally, Jaime Schwartz at Business Access has worked with us to align ASPP data with evaluation needs and provided data extracts for ongoing analyses. As always in efforts such as this, the authors are once again indebted to our research support staff, especially Susie Riley and Alanna Burney, for their editing and formatting skills.
vi
4:4:004
EXECUTIVE SUMMARY
Project GROW (Growing Regional Opportunities for the Workforce) was an ambitious regional, multi-partner, strategically comprehensive effort that sought to build upon successful and innovative practices to accelerate certification, employment, and career advancement in demand occupations for an array of economically marginal target groups. The service area encompassed five Workforce Investment Boards (WIBs) that span the entire Texas-Mexico border area from the City of Brownsville in the south to El Paso in the north. Despite significant economic expansion in recent years, this region remains one of the most disadvantaged areas in the state and the nation in terms of poverty, unemployment, literacy, limited English language proficiency, education, and income. Project GROW was designed to reduce the predominance of these characteristics for sections of the population that generally have the most difficulty successfully navigating available education, training, and employment opportunities and to prepare the workforce needed to meet the needs of employers in key growth industry sectors.
Project GROW was funded by the U.S. Department of Labor under the Workforce Innovation Fund (WIF) Grant Program, which supports innovative approaches to the design and delivery of employment and training services that generate long-term, cost-effective improvements in the performance of the public workforce system in terms of outcomes for job seekers and employers. The Border Workforce Alliance (BWA) – a consortium comprised of the 5 WIBs (Cameron, Lower Rio Grande, South Texas, Middle Rio Grande, and Upper Rio Grande) serving the region – is the regional entity that oversaw Project GROW implementation. The Lower Rio Grande WIB served as project lead and grant administrator for the BWA. The WIBs and local partnerships began enrolling participants between February and May 2013, and the operational phase of the demonstration concluded in December, 2015.
The BWA shared a consensus that there was insufficient alignment and capacity within and across the border WIBs to more effectively and quickly upgrade the skills and knowledge of the current and future workforce—particularly those least attached and often under-served through public education and training channels— to meet employer needs and sustain regional economic growth. With WIF grant funding the BWA sought to demonstrate innovative regional efforts to develop and scale up integrated college and career pathways designs that result in more rapid and timely completion of credentials valued in the labor market; facilitate stronger employment connections with key industry sectors, and promote workforce system and institution level policy and programmatic reforms to support and sustain the model.
vii
4:4:004
KEY FEATURES OF PROJECT GROW
Central features of Project GROW’s comprehensive strategic approach included:
• Border region collaboration/systemic workforce development across and within the five WIBs of the BWA that aligns adult education, postsecondary, and workforce services.
• Accelerated credentialing in high demand occupations with identifiable career pathways.
• Partition of the target population into Service Cohorts (Cohorts A, B, and C and subgroups of these), by academic proficiency as determined by Tests of Basic Adult Education (TABE) scores, secondary education credentials, and college readiness to demonstrate the effectiveness of tailored service regimes. Accelerated learning program interventions aligned with service cohorts were:
College readiness efforts and occupational training for Cohort A participants, who already have a high school diploma or GED, but are not college ready as determined by standardized assessment. Only a fifth of Project GROW participants were individuals enrolled in Cohort A
Integrated pathways combining GED preparation and occupational training for Cohort B comprising individuals without a secondary credential, but generally functioning within the 9th through 12th grade levels. Nearly half of Project GROW participants were individuals enrolled in Cohort B; and
Contextualized or bridge learning curricula for Cohort C students who function below high school equivalency levels and require adult basic education and ESL to prepare for academic and occupational advancement. A little over a third of Project GROW participants were individuals enrolled in Cohort C
• The development and use of a common information technology platform—the Administrative System for Program Participation (ASPP)—constructed by Business Access for Project GROW in order to facilitate real time client information exchanges between service delivery partners and to serve as the unique database for program performance management and evaluation purposes.
• A self-paced In Home Learning System (IHLS), including a laptop and internet access, randomly distributed and monitored by Business Access to subgroups of Cohort C to potentially accelerate learning gains.
viii
4:4:004
• Provision of intensive or standard case management to different subgroups of the target populations, as well as intentionally enhanced, timely, supportive services for all participants to increase retention, completion, and employment entry.
• Advanced levels of employer engagement and introduction of industry cluster approaches through which workforce development efforts might more closely align with the human resource needs of related business in support of regional economic growth and development.
• Capacity-building services provided by Jobs for the Future (JFF), a national workforce intermediary, which also oversees evaluation services, and Abt & Associates, which serves as the National Evaluation WIF Grant Coordinator for USDOL, and also provides technical assistance to the WIF grantees and program evaluators.
• Rigorous process, outcome, impact, cost effectiveness, and formative evaluation services provided by the Ray Marshall Center.
• Project GROW funding available for services at the WIB level totals approximately $3.45 million, supplemented by $1 million in committed leveraged resources across the 56-month award period.
ACCOMPLISHMENTS AND CONSTRAINTS
Project GROW was in almost constant flux as partners in the WIBs attempted to enhance their capacity and refine their approaches to implement the many features of the demonstration. The challenges faced included complex eligibility procedures such as dual eligibility determination in WIA and Project GROW and pre-eligibility testing in adult education and college readiness in order to form tiered training cohorts; the introduction of a stand-alone program and performance management data system; enhanced levels of employer and industry sector engagement; and the alignment of career pathway options in demand occupation between workforce and postsecondary training providers, as well as alignment within colleges between continuing education departments and academic programs.
The implementation analysis reveals that Project GROW has produced mixed results.
Almost all partners assert that Project GROW was a positive, but challenging learning experience regarding the education, training, and appropriate services for participants whose access to more extensive and intensive services has been more limited
ix
4:4:004
in the past. Family circumstances, income demands, and transportation issues are among the key challenges to persistence and completion of the education and training services. Providers adjusted scheduling and sequencing, as well as pedagogical approaches in order to improve outcomes and respond to challenges faced by participants. Partners met on a regular or as-needed basis to discuss implementation challenges.
Project GROW served as a precursor to the Workforce Innovation and Opportunity Act (WIOA). WIB administrators and leads for Project GROW, managers and staff for the Workforce Solutions Career Centers, and most training providers at the community and technical colleges indicated that the demonstration helped to prepare for implementing provisions of WIOA, which include services for priority populations (similar to the demonstrations Cohorts), institutional alignment, employer engagement, industry cluster requirements, and support for career pathways.
Knowledge and practice regarding career pathways has been enhanced across the BWA region, as has receptivity to contextualized and bridge programs in adult education pedagogy (among four of the five WIBs). Partners gained practical experience and knowledge of responses to challenges of persistence, completion of training, and the attainment of an entry level credential for those bereft of occupational or basic educational accomplishments, who often face constraints to intensive regimes like those in Project GROW.
Alignment between adult education and ESL providers, postsecondary education, and workforce institutions has improved due to the demonstration’s service model. Although inconsistent across the entire region, these entities purposefully served common clients. Regular and as needed contact between affiliated program staff enhanced awareness of institutional practices, policies, and operational prerogatives. Project GROW supported a mutual “learning curve.”
Alignment between continuing education and academic departments at postsecondary institutions has improved, as well. Articulated credit, shared curriculum content, and stackable credentials became increasingly common features in Project GROW trainings. Continuing Education Units (contact hours) in Project GROW’s occupational trainings are almost all held in “escrow” and convert to academic credit hours, should a participant enroll for additional certification.
Sites provided a handful of examples of participants who have made substantial advances in their career and livelihood prospects as a result of Project GROW. Many participants have given testimony to the value of the demonstration to their livelihood prospects, sense of accomplishment, and capacity to better support their families.
x
4:4:004
Significantly, nearly three-quarters of the participants are the first generation in their families to have access to postsecondary education. The depth of this representation is a remarkable accomplishment of Project GROW, with potential inter-generational effects as the possibility of college is viewed as a tenable option for descendants of the current adult participants.
Nevertheless, complete successful implementation eluded the demonstration.
Cohort formation and participation levels were not as successful as anticipated in the original plan. Because of low outreach responses, misalignment of client interests and the type of training available, and low eligibility rates by cohorts, particularly due to testing outside of the TABE score range, it was difficult to form cohorts for planned career path trainings or to coordinate training starts due to an insufficient number of recruits to meet minimum class size. Geographic distances, the disbursed populations, and locations of training sites in many areas of the border region exacerbate these challenges.
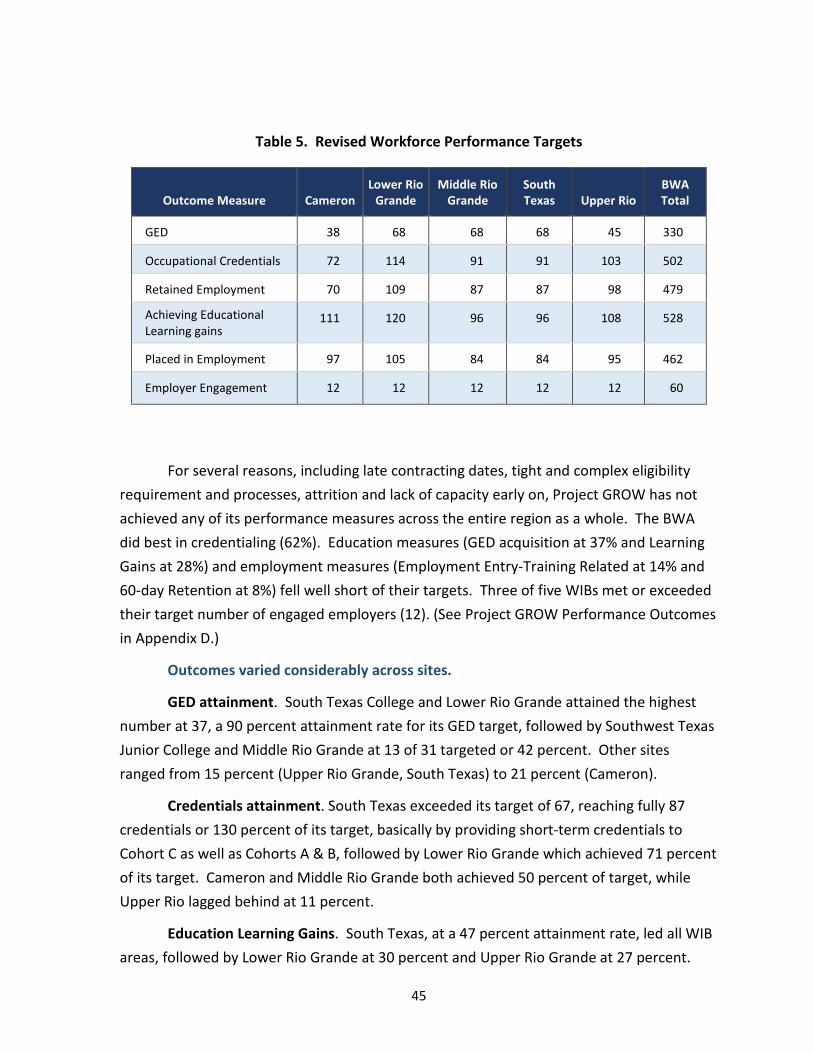
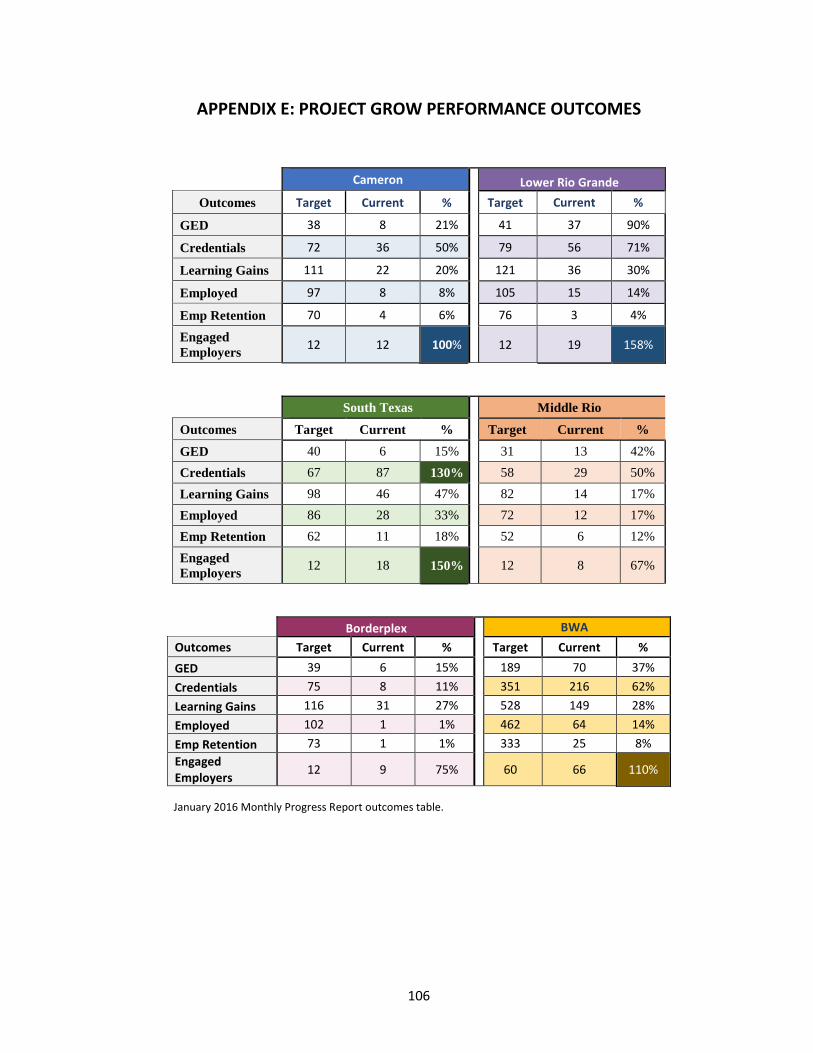
For several reasons, including late contracting dates, tight and complex eligibility requirement and processes, attrition, and lack of capacity early on, Project GROW has not achieved any of its performance measures across the entire region as a whole. The BWA did best in credentialing (62%). Education measures (GED acquisition at 37% and Learning Gains at 28%) and employment measures (Employment Entry-Training Related at 14% and 60-day Retention at 8%) fell well short of their targets. Three of five WIBs met or exceeded their target number of engaged employers (12).
Employer engagement fell short of expectations regarding scope and depth of involvement, and there was no observed advance in industry sector development. Beyond recruiting individual employers for curriculum review, employment prospects, and internship or work experience placements, there was little expansion or deepening of employer engagement efforts by Business Services Representatives (BSRs).
The anticipated contributions and involvement of community-based organizations were not realized. There were no enrollments in the College Readiness Academy and postsecondary education for Cohort A through VIDA in Cameron or the Lower Rio Grande areas. Intensive case management for Cohorts C1 and C3, the very least job-ready, through VIDA in Cameron did not occur and such referrals to ARRIBA in Upper Rio Grande were late in starting and did not attain expected numbers.
The In Home Learning System (IHLS) was distributed late in the demonstration and the ability to evaluate its effectiveness has largely been compromised. IHLS distribution was hampered by low enrollments and its efficacy as a learning enhancement was
xi
4:4:004
questioned by many in the field. Random assignment if IHLS was dropped in the final year of the program.
Dual data entry, consistent and reliable data entry, and other issues plagued the Administrative System for Program Participation (ASPP), the proposed nexus of real time exchanges between program partners at local and regional levels, and the database for unique data elements that were basic to the demonstration’s program management and evaluation designs. . Field staff made limited use of ASPP because of dual data entry (TWIST and ASPP) and, at times, lack of clear responsibility for data entry and quality control.
CONSIDERATIONS AND RECOMMENDATIONS
Researchers recommend the following be considered for future iterations of accelerated career pathway models.
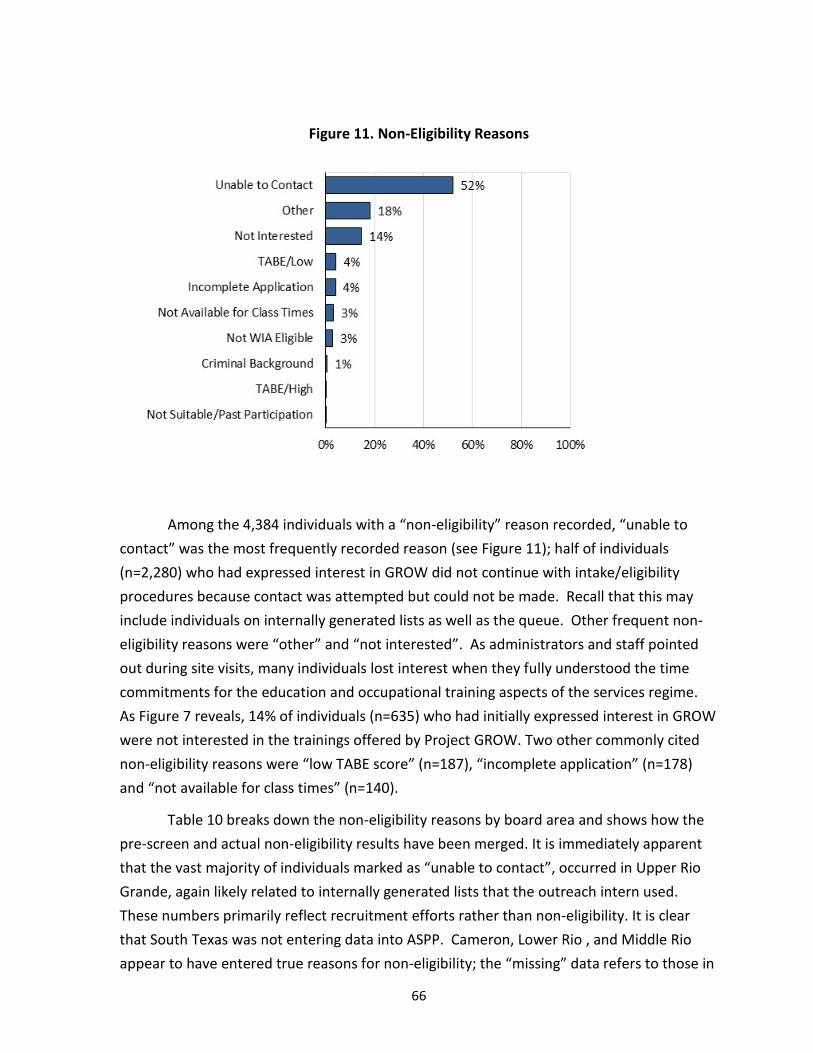
Provide more flexibility regarding demand occupations and career selections. Be more responsive to client choice. Among the 2,104 individuals with a “non-eligibility” reason recorded in ASPP (which includes those who preliminarily registered in Project GROW or were contacted by staff as part of outreach) 635 were not interested in the trainings selected or currently available through Project GROW.
Include community and technical colleges in the career pathway and demand occupational selections to align their capacity with employer and industry labor demand. The BWA selected Project GROW occupations options prior to contract negotiations; trainings for some of were not developed or yet associated with a credential at the postsecondary level, leading to delays in cohort formation. Also, involve Career Center, training provider, and CBO staff in the client assessment process to assure that participants meet the selection criteria of these partners who are at least partially accountable for meeting performance expectations
Initially target demand occupations aligned with established trainings at the community or technical college that have industry recognition and good placement records to more quickly ramp up enrollment and training of cohorts, strengthen outcomes, and solidify partnerships between workforce, postsecondary, and employer stakeholders. It may be strategically valuable to build out and scale up career pathway programs starting with the strengths of the local partners to build confidence and support for the approach among stakeholders, including the target populations. Rapid placement in services may also help to reduce attrition, which was reportedly common among those who been determined eligible for Project GROW, but held on a wait list while developing training capacity or availability.
xii
4:4:004
Continue employer engagement efforts; recognize that industry sector engagement is a process that demands significant effort over time; and make resources available specifically for such endeavors. Business Services Representatives (BSR) should be assigned and resourced as workforce intermediaries to develop and maintain specific industry groups of employers, training providers, and workforce staff. There was no funding built in Project GROW for initiating or expanding such efforts. The quality of the human capital prepared through the workforce system must meet industry standards for skilled and productive workers that add to the “bottom line” to get and keep employers engaged. (As should wages earned in the entry level occupations be adequate to keep workers in the industry.) Employers must realize the value of and support internal career pathway opportunities.
Create clear and tangible options for those starting with an entry level credential on a career pathway to acquire advanced credentials that further enhance employment and earnings prospects. Every area in Texas might combed various funding streams supportive of career pathway progressions that also require or benefit from partnerships involving a mix of WIBs, business, community and technical colleges or extension services, economic development agencies, and CBOs. Several potential funding sources for basic skills or advanced training are available to continue the pathway approach partnerships started in the demonstration and further encouraged by WIOA.
xiii
4:4:004
4:4:004
INTRODUCTION
Project GROW (Growing Regional Opportunities for the Workforce) was an ambitious regional, multi-partner, strategically comprehensive effort that sought to build upon successful and innovative practices to accelerate credentialing, employment, and career advancement in demand occupations for an array of economically marginal target groups. The service area encompassed five Workforce Investment Boards (WIBs) that span the entire Texas-Mexico border area from the City of Brownsville in the south to El Paso in the north. These WIBs formed the Border Workforce Alliance (BWA) to adopt and refine regional approaches to workforce development. Despite significant economic expansion in recent years, the border region remains one of the most disadvantaged areas in the state and the nation in terms of poverty, unemployment, literacy, limited English language proficiency, education, and income. Project GROW was designed to reduce the predominance of these characteristics for sections of the population that generally have the most difficulty successfully navigating available education, training, and employment opportunities through accelerated, entry level occupational credentialing in a career pathway that aligns with the needs of employers in key growth industry sectors.
Project GROW is funded by the U.S. Department of Labor under the Workforce Innovation Fund Grant Program, which supports innovative approaches to the design and delivery of employment and training services that generate long-term, cost-effective improvements in the performance of the public workforce system in terms of outcomes for job seekers and employers.1 The Ray Marshall Center at the Lyndon B. Johnson School of Public Affairs at The University of Texas-Austin is conducting a multi-method evaluation of Project GROW, including implementation/process, outcomes, net impacts, and cost effectiveness analyses. The ultimate purpose of the evaluation is to generate evidence for regional, state, and federal policy makers, workforce development system practitioners and other stakeholders about the experiences, achievements, and value of the demonstration.
1 The Workforce Innovation Fund Grant Program is authorized by the Full-Year Continuing Appropriations Act, 2011 (P.L. 112-10). The U.S. Department of Labor has awarded nearly $150 million in competitive four-year grants to 26 grantees across the nation through the Workforce Innovation Fund program. Independent project evaluators and a national evaluator are assessing funded demonstrations. (http://innovation.workforce3one.org/)
“I will always remember and hold in high regard the opportunity that Project Grow gave me a chance to restart my life, with hard work and dedication anything can be possible (sky’s the limit).”
This final implementation analysis describes the accomplishments and constraints of Project GROW regarding its strategic components, service delivery model, and performance measures. It builds upon client flow descriptions, participation patterns, and preliminary outcomes discussed in the Interim Process Analysis report released in August 2014, which addressed the design and the early implementation phases of the demonstration. 2 This report identifies adjustments over the course of nearly three years of program operations to the design, operational practices, and enrollment patterns that inform and frame the outcomes, net impacts, and cost-effectiveness components. The cost-effectiveness, outcomes, and impacts reports will be available in the Fall, 2016.3
BWA Regional Workforce Development Challenges
Project GROW introduced its ambitious agenda to test various approaches in this challenging region. The 22 counties comprising the service area of the BWA have a population of approximately 2.6 million people--about 10% of Texas’s population.4 Despite a history of employment and poverty challenges, the Texas-Mexico border region is also a region of job growth and significant labor demand in four key industry sectors--health care; construction; transportation, distribution and logistics; and manufacturing—selected by the WIBs as the target industries for the demonstration. At the root of the region’s challenge is the deep mismatch between many of the in-demand jobs and the skill levels of residents (TIP Strategies, 2012). As in other parts of the country, an increasing number of jobs along the border require post-secondary certificates and degrees. However, in the BWA service area 36% of adults lack a GED or high school diploma (compared to 13% statewide and 8% nationally) and a high percentage speak English less than “very well” (33.5%, compared to 15.5% statewide and 8.7% nationally). (TIP Strategies, 2012) With these skills barriers, many employers find it difficult to find the workers they need, and many job openings—as many as 6,000-9,000 in the Lower Rio Grande Valley alone—go unfilled. Because of low-skill levels and labor market challenges, border residents are more likely to be low-income ($14,766 per capita in 2010 compared to $24,870 statewide), unemployed (a 2010 rate of
2This report encompasses and updates the findings and observations found in the Interim Process Analysis Report (O’Shea, et al., 2014) that addressed grant related activities from September, 2012, through December, 2013. 3 The remaining research components of the demonstration evaluation permit a follow-up period through June, 2016, to capture additional employment entry, retention, and earnings information or other late outcomes for GROW participants and comparison group members in the quasi-experimental design impact study, as well as late reported financial data, particularly additional resources leveraged for GROW cases that were closed in December, 2015, but continued to receive WIA services in which they had been co-enrolled as a demonstration eligibility requirement. 4 Based on 2013 population estimate. (http://quickfacts.census.gov/qfd/states/48000.html)
10.4% in the region, compared to 8.8% statewide), and have families living in poverty (more than 26% in 2010 compared to 10% statewide).5 (TIP Strategies, 2011) In terms of population demographics, settlement patterns, and economic opportunities, the border area served by Project GROW is one of the most distinctive regions of the nation. Rapid growth notwithstanding, this region remains one of the most economically disadvantaged areas in the state and the nation.
Regional Systemic Approach
While elements of the public workforce development system along the border have made strides in addressing labor market mismatches, education deficits, and low incomes, significant gaps remain. Project GROW recognized the several dimensions to these problems and, pledging to move beyond “pockets of innovation”, proposed to demonstrate regional, systemic solutions for low-income populations who lack academic and occupational skills to succeed in the labor market.6 Project GROW’s strategic approach aimed to produce sustainable improvements in education, training, and employment outcomes across the borderlands service areas by:
• developing and implementing career pathways aligned with demand occupations in key growth industry sectors;
• introducing new operating efficiencies gained through program alignment and a common information technology platform, known as the Administrative System for Program Participation (ASPP), developed by Business Access;
• tailoring of programs and services to specific sub-populations, distinguished primarily by variations in lower educational achievement;
• improving access to and coordination of case management and support services between service delivery partners;
• enhancing employer and industry sector engagement practices; and
• strengthening regional system capacity through collaborative practices that benefit resident job seekers, employers, while stimulating economic growth.
5 Although unemployment has steadily dropped across the region, from approximately 9.2 percent to 6.2 percent from January 2013 through January 2016, the border area generally exhibited unemployment rates 25 percent to 40 percent higher than the State unemployment rate which dropped from 6.9 percent to 4.4 percent over the same period. (USBLS, 2016, Texas Association of Counties, 2016). Three BWA WIBs operate in metropolitan areas with the highest poverty rates in the nation: McAllen-Edinburg-Mission (34.3 percent), Brownsville-Harlingen (32.5 percent), and Laredo (31.1 percent), nearly double the State poverty rate (17.2 percent). (CPPP, 2014 and Texas Association of Counties, 2016). 6 A graphic of a logic model depicting GROW’s theory of change is included in Appendix A.
3
4:4:004
EVALUATION OVERVIEW
The Ray Marshall Center at the LBJ School of Public Affairs is providing evaluation services to Project GROW. The multi-method, multi-year evaluation combines qualitative and quantitative methodologies to develop comprehensive analyses of Project GROW from the initial design and implementation phases of the project through the fully operational phase and conclusion of the evaluation period (September 1, 2012 through October 31, 2016). The four methodological components of the evaluation are:
• quantitative outcomes and net impact evaluations, the latter based upon a quasi-experimental design methodology;
• process evaluations tracking the implementation and adaptation of program-related policies, practices, and structures from design through fully operational status;
• formative evaluation services that provide short-term feedback on Project GROW’s progression toward stated objectives and goals, based on current analyses and field observations generated by the approaches and best practices in the field of workforce development; and
• cost-effectiveness analyses estimating the net economic value and returns on the investments made to Project GROW in the border area.
Key Research Questions
Evaluation research questions for Project GROW include:
1. What components of career pathway designs were implemented by the five participating WIBs as part of Project GROW, and, as implemented, how were they similar or different across the region?
2. To what extent did integrated college and career pathway designs achieve scale within and across areas of the region and within individual colleges? What design and implementation steps, including career center-, college-, and community-based organization (CBO)-level activities, as well as changes to practices, policies, and systems, were essential to scaling up these programs?
3. What impact did integrated college and career pathway designs have on student progress and outcomes in college and in the labor market relative to comparison groups of students similar to the population in Project GROW, but not participating in the program?
4
4:4:004
4. What was the return-on-investment (ROI) from Project GROW and its component strategies, considered from the participant, taxpayer and societal perspectives? What economic impacts did the initiative have in the region and on each of the participating WIBs?
5. To what extent did Project GROW lead to significant changes in systems and processes in the region and on the participating WIBs?
Process Evaluation
The process analysis is the primary qualitative research component of the evaluation for describing, monitoring, and improving the operational dimensions of Project GROW. Specifically, the process analysis serves to:
• describe the initial program design and monitor the continuing development and improvement of the operational model across the evaluation time frame;
• provide a basis for formative recommendations regarding positive adjustments to enhance program performance from an operational perspective, as well as to advance scalability, replicability, and sustainability of the service delivery model;
• enhance the explanatory power of program outcomes and the net impacts analyses observed by the quasi-experimental design;
• provide a basis for identifying cost centers and expenditures in support of cost-effectiveness and return-on-investment estimates; and
• enrich the literature of workforce development through its detailed portrayal of the accomplishments and constraints experienced by Project GROW regarding the implementation and operations of its innovative, regional employment and training model across the five WIBs that comprise the Border Workforce Alliance.
Methodological Approach
The implementation analysis required detailed review of planning, policy, and technical assistance documents; quarterly progress reports to the U S. Department of Labor; and monthly progress reports (MPRs) for internal program management produced by the Project Coordinator. Researchers maintained steady contact with project development issues and accomplishments through regular participation in Project GROW’s functional
5
4:4:004
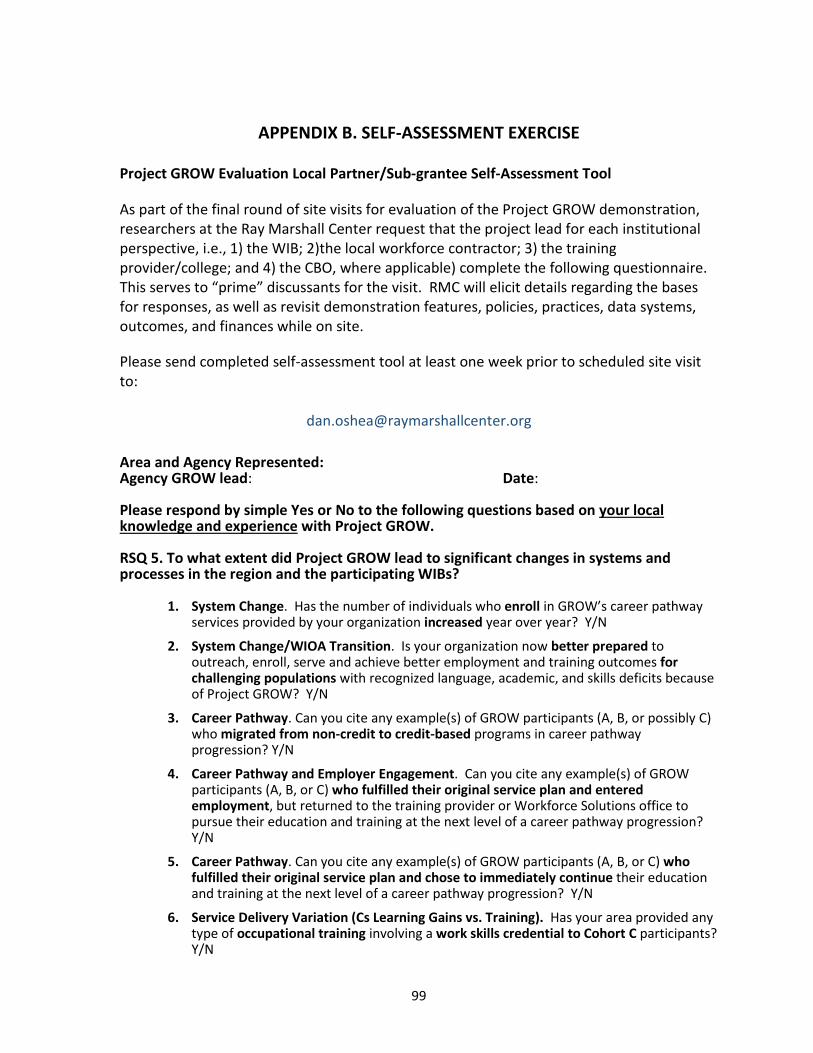
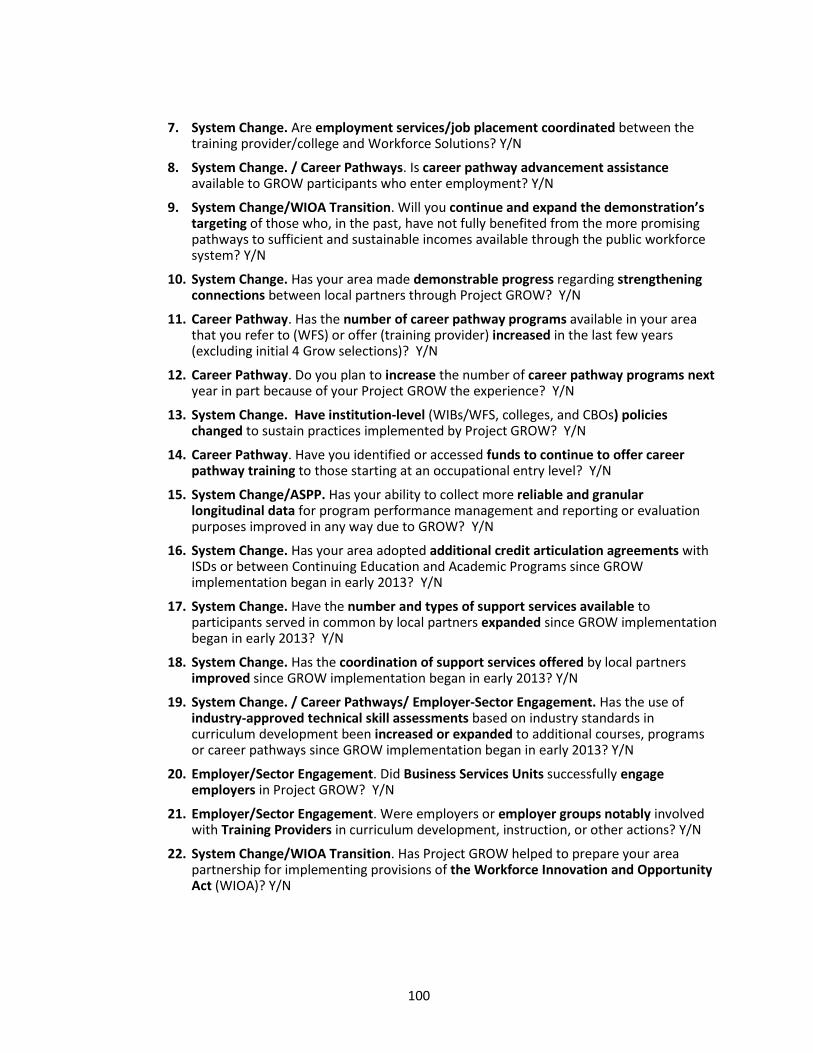
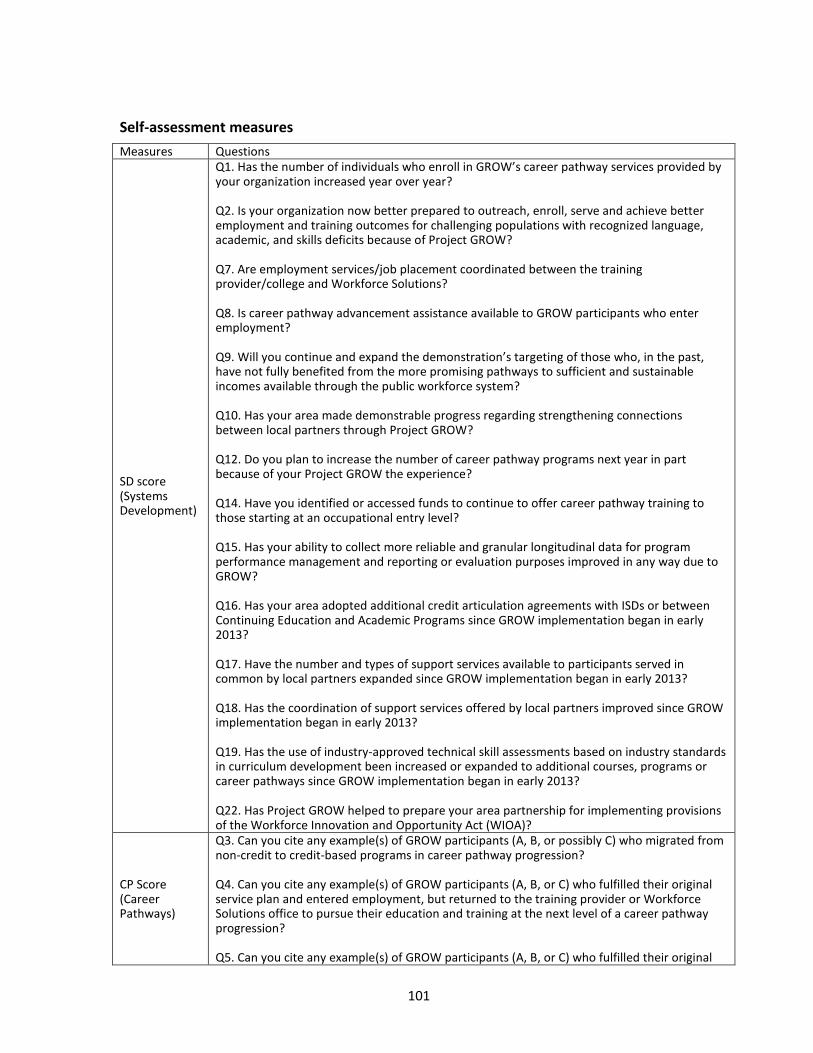
committee structure.7 Four-rounds of site visits (baseline in May-June 2013; early implementation in October-December 2013; full operational in April-May 2015; and final review in September-October 2015) allowed researchers to deeply engage administrators and staff of local partners (WIB, workforce contractors, training providers, and CBOs) in extensive, guided conversations concerning their Project GROW experiences. Additionally, this component assessed demographic, participation, and preliminary outcome data recorded in the Administrative System for Program Participation (ASPP) and/or the Workforce Information System of Texas (TWIST).8 Prior to the final site visits, researchers requested cohort training data and fiscal reports to date (expenditure and leverage). During the final round of site visits, researchers also distributed, and local partners each completed, a Self-Assessment Tool (Appendix B) comprised of twenty-two questions aligned with evaluation measures, strategic components, and features of the demonstration.9
ORGANIZATION OF THE REPORT
The ultimate purpose of the evaluation is to generate evidence for regional, state, and federal policy makers, workforce development system practitioners and other stakeholders about the experiences, achievements, and value of the demonstration. The remainder of the report provides more detail about the design features, adjustments, implementation experiences, and preliminary outcomes of Project GROW. The following section addresses the operating context, partnerships, innovative and strategic components of the demonstration, performance and evaluation measures, and the budget and expenditure patterns. Section III discusses client flow, activities and services, participation patterns, and preliminary outcomes drawn from TWIST and ASPP. The last section, Assessments and Observations, presents summative inferences, and final comments regarding the value and lessons of Project GROW to policymakers, analysts, and program practitioners looking toward the future.
7 The Lower Rio Project Coordinator conducted regularly scheduled and as-needed telephone conference and webinars with Project GROW administrators and key partners to discuss project challenges, priority tasks, policy concerns, program documentation, and other research features. These included weekly “Quick Calls” with the Project Coordinator, the research team, and Jobs for the Future, and scheduled monthly meetings of the Border Workforce Alliance “Partners”, the Employer Engagement Committee, the Evaluation Advisory Committee, and the Training Provider Committee teleconferences. 8 TWIST is the statewide, integrated database system for the public workforce system in Texas. 9 Each question solicited a simple yes/no response and served as a basic indicator of effectiveness regarding the feature or measure, as well as a take-off point for more in-depth discussion on-site regarding related accomplishments or constraints based on the informants perspective and experience with Project GROW.
“If someone was to ask me how to describe the project I would simply say, it is an opportunity that can better your future, create new career options and help you get started on the path to a successful life.”
-Monica C.
6
4:4:004
7
4:4:004 DESIGN AND IMPLEMENTATION: KEY DEMONSTRATION FEATURES
INTRODUCTION
The U.S. Department of Labor awarded the Border Workforce Alliance a $6 million demonstration grant for a 52-month operations and evaluation period extending from September 1, 2012 through December 31, 2016 for Project GROW. The program design sought to build and strengthen regional approaches among the border area WIBs, improve institutional alignment and local partnerships between the public workforce system, adult and postsecondary education, and leading edge community-based workforce services providers, while introducing or expanding promising and innovative approaches to services for economically marginal populations.
As an initial action, BWA members convened in August 2012 to determine priorities as grant funding became available September 2012. The BWA consortium members—the Cameron, Lower Rio , Middle Rio, South Texas and Upper Rio WIBs—immediately began to market the effort and initiate or strengthen partnerships with regional employers, Career Center operators, community colleges, training providers, and community-based organizations. With the assistance of national workforce intermediary Jobs for the Future, Project GROW partners began refining the program model in preparation for implementation.
In late January 2013, the BWA and grant administrative leadership at the Lower Rio Grande WIB organized a multi-partner, regional kick-off meeting of WIB personnel, Workforce Solutions contractors, training providers at the community and technical colleges, and CBO staff in McAllen, Texas. At this convening, grant administrators at Lower Rio Grande, project leads from Jobs for the Future and Business Access, and researchers from the Ray Marshall Center, presented and discussed the initial design structures, procedures, and policies; ASPP status and use; and program evaluation methods and objectives.
Other early activities through February 2013 included initial design and management structure clarification, refining policies and practices, ASPP development, staff assignment and trainings, and training contractor procurement. Almost all of these activities were continuous throughout the demonstration as local partners sought to refine and implement the multiple features of the demonstration.
By March, 2013, early enrollments had begun in a few WIB areas and by June, 2013, in all. Enrollments ended as early as September 2014 in one site and continued as late as
8
4:4:004 September 2015, when the last site began to wind down operations in order to exit participants by December 31, 2015, the date Project GROW operations ceased. Evaluation activities continue through October, 2016, at which time final cost effectiveness, outcomes, and net impact reports will be available. The remainder of this section describes the partnerships, policies, operating context and regional experiences with the strategic elements of the demonstration from the design phase though the final operations phase of Project GROW.
PARTNERSHIP STRUCTURES
Border Region Collaboration, Role, and Responsibilities
Prior to Project GROW, the Border Workforce Alliance had previously worked to advance STEM initiatives throughout the region. The stated purpose of the BWA is to:
• create a unified voice for the Texas/Mexico border workforce board region;
• expand and initiate innovative “evidence- based” practices to rapidly accelerate literacy and skill level gains;
• research and analyze data for the development of responsive programs; and
• leverage partnerships and secure funding to further the vision of the BWA.10
The Lower Rio Grande is the lead agency and administrative entity for the WIF Grant. As such, operational, fiscal management and reporting for Project GROW reside with the WIB. The WIB hired a full-time Project Coordinator to liaise with partnering BWA WIB staff and their local partners, as well as to provide day-to-day oversight and support for Project GROW. The Project Coordinator was the critical agent for guiding consistent implementation of Project GROW demonstration features across the region. In addition to providing guidance regarding policies and implementation practices to the WIBs and local partners, the Project Coordinator served as the intermediary between the WIBs, Business Access, Jobs for the Future, and the Ray Marshall Center.
The Project Coordinator also established and directed a number of dedicated committees that convened regularly by teleconference and Webinars. These included
4:4:004 weekly “Quick Calls” with the Project Coordinator, the research team, and Jobs for the Future, and scheduled monthly meetings of the Border Workforce Alliance “Partners”, the Employer Engagement Committee, the Evaluation Advisory Committee, and the Training Provider Committee teleconferences. The committee structure was an important mechanism for discussing project challenges, priority tasks, policy concerns, program documentation, and other issues. Based on participatory observations, the research team agrees that although participation was at times uneven, the committee structure was an asset to the implementation of the complex program and to progress toward regional systemic development.
Each WIB designated a manager-level Board lead with responsibility for oversight and management of administrative and operations functions of Project GROW. As in other workforce programs, the individual WIBs and Career Center contractors were responsible for fiscal accountability, program and performance management, compliance, reporting, procurement, and other functions. However, only in Cameron and Lower Rio Grande did the original Project GROW lead at the WIB remain for the duration of the demonstration. The position turned over at least four times in Upper Rio Grande, thrice in South Texas, and once in Middle Rio Grande, mostly due to attrition and other job opportunities. In Upper Rio Grande, the entire executive and upper level administrative staff of the WIB, having lost the support of the Board, was removed two-thirds through the demonstration. Researchers assert that to the extent that these levels of key personnel turnovers affected implementation, it was most noticeable in the Upper Rio Grande area. Ironically, Cameron, the WIB with the most stable staffing, served the fewest total and only Cohort B participants.
10
4:4:004 Figure 1. Project GROW: Border Worker Force Alliance WIB Areas in Texas
Border Workforce Alliance
The five BWA WIBS share much in common beyond their border location and common workforce development challenges. Despite significant economic expansion in recent years, this region remains one of the most disadvantaged areas in the state and the nation in terms of poverty, unemployment, literacy, limited English language proficiency, education, and income. Yet distinctive features in terms of spatial distances, population distribution, settlement patterns, and other factors contributed to variations in service delivery styles, implementation challenges, and program outcomes across the five WIBs.
The BWA region encompasses nearly 46,000 square miles (sq. mi.) of south and west Texas and is home to 26 million people. The geographic coverage within the WIB areas ranges from 21,700 sq. mi. in Upper Rio Grande to 891 sq. mi. in Cameron (see Table 1). Resident populations in the service area range from a low of 169,036 in Middle Rio Grande to a high of 881,620 in Lower Rio Grande. Population concentrations and settlement (large- to small-urban and rural disbursed) are significantly varied across and within WIB areas as well. For example, almost all of the Upper Rio Grande’s population (97 percent) resides in
11
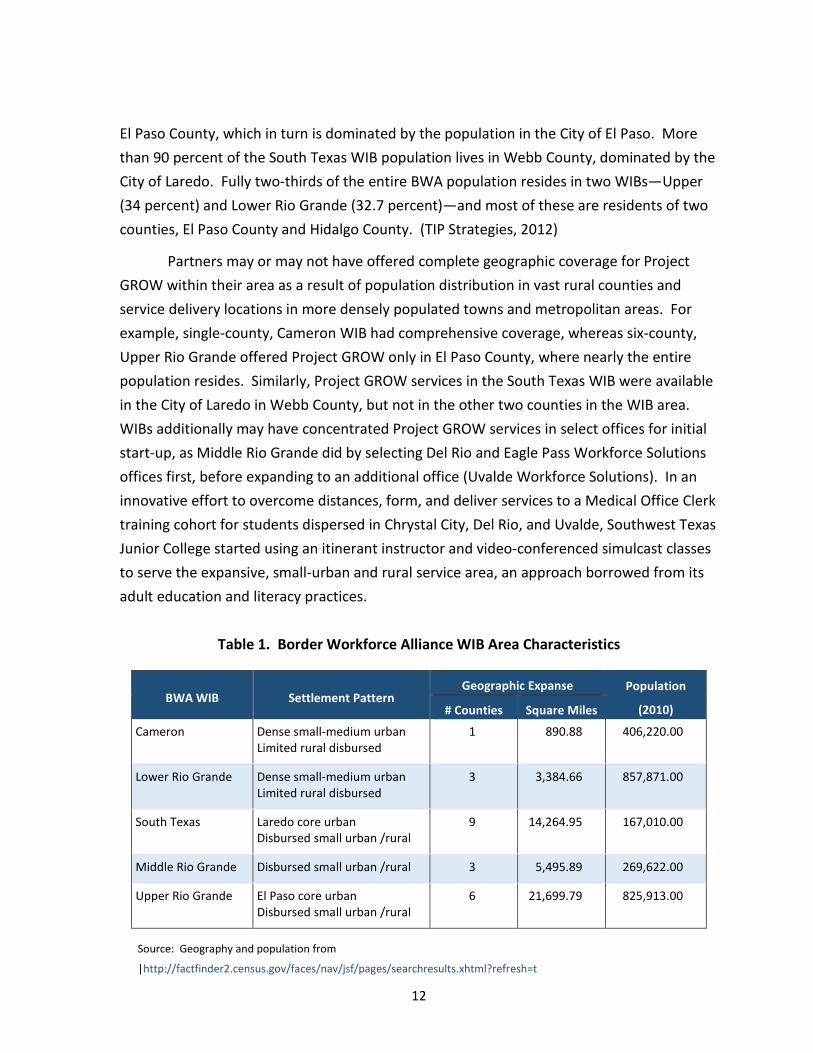
4:4:004 El Paso County, which in turn is dominated by the population in the City of El Paso. More than 90 percent of the South Texas WIB population lives in Webb County, dominated by the City of Laredo. Fully two-thirds of the entire BWA population resides in two WIBs—Upper (34 percent) and Lower Rio Grande (32.7 percent)—and most of these are residents of two counties, El Paso County and Hidalgo County. (TIP Strategies, 2012)
Partners may or may not have offered complete geographic coverage for Project GROW within their area as a result of population distribution in vast rural counties and service delivery locations in more densely populated towns and metropolitan areas. For example, single-county, Cameron WIB had comprehensive coverage, whereas six-county, Upper Rio Grande offered Project GROW only in El Paso County, where nearly the entire population resides. Similarly, Project GROW services in the South Texas WIB were available in the City of Laredo in Webb County, but not in the other two counties in the WIB area. WIBs additionally may have concentrated Project GROW services in select offices for initial start-up, as Middle Rio Grande did by selecting Del Rio and Eagle Pass Workforce Solutions offices first, before expanding to an additional office (Uvalde Workforce Solutions). In an innovative effort to overcome distances, form, and deliver services to a Medical Office Clerk training cohort for students dispersed in Chrystal City, Del Rio, and Uvalde, Southwest Texas Junior College started using an itinerant instructor and video-conferenced simulcast classes to serve the expansive, small-urban and rural service area, an approach borrowed from its adult education and literacy practices.
Table 1. Border Workforce Alliance WIB Area Characteristics
BWA WIB Settlement Pattern Geographic Expanse Population
The Cameron WIB serves its single, namesake county service area. Cameron County has a population of 406,220 and a density of 456 people per square mile across its 891 sq. mi. area.11 Settlement is concentrated in the Brownsville-Harlingen Metropolitan Statistical Area (MSA) and distributed across several other small urban and rural areas. The WIB operates two full-service One-Stop Workforce Centers, a satellite Workforce Center, and a Mobile Resource Lab. The WIB contracts with Southwest Keys to operate the centers.
The two full service centers—one in Brownsville and one in Harlingen—provided Project GROW services. Initially, Cameron planned to secure Southmost Texas College in Brownsville as its training provider, but was unable to do so because of restructuring of the college. Cameron eventually secured training services with Texas State Technical College in Harlingen. In the late stages of the demonstration, all participants were from the Harlingen Workforce Solutions office, since, as the WIB and contractor spokespersons assert, participants from Brownsville were unwilling to travel nearly 30 miles to Harlingen for training.
Lower Rio Grande WIB
The Lower Rio WIB serves Hidalgo, Willacy, and Starr Counties. Ninety percent of its 857,871 population resides in Hidalgo County—mostly in the McAllen-Edinburg-Mission MSA where Project GROW was available at the Mission, Weslaco, and Edinburg Career Centers. The two remaining offices in the area are located in more sparsely populated Raymondville (Willacy County) and Rio Grande City (Starr County). C2 Global Professional Services (C2GPS) operates the Career Centers under contract for the WIB. Originally services were concentrated in the Mission and Weslaco offices; they expanded to Edinburg and Rio Grande City. Unlike residents of Brownsville, participants in Rio Grande City were willing to travel nearly 60 miles to receive Health Information Management Clerk training in McAllen.
11 The data in this discussion is taken from US Census Bureau, American Community Survey, 5 year estimates (2006-2010) using the American Fact Finder. Data, except for population, is for the year 2010. The data on population is from the year 2011 (American Community Survey, 1 year estimate 2011, US Census Bureau).
The South Texas WIB serves Webb, Zapata, and Jim Hogg Counties, an area totaling nearly 5,496 sq. mi. with a population of 269,622, most of which is concentrated in the City of Laredo and the Laredo MSA in Webb County. Ninety-three percent of the population lives in Webb County with a population density of 74.5 people per square mile; density falls sharply in Zapata and Jim Hogg Counties to 14 and 4.7 persons per sq. mi., respectively. The WIB contracted Career Center operations to ResCare, Inc. thru September 2013, and subsequently to C2GPS (the same operator for the Lower Rio Grande) to operate a full service center in Laredo and satellite offices in Zapata (Zapata County) and Hebronville (Jim
4:4:004 Hogg County). All Project GROW services were delivered through the Workforce Solutions office in Laredo.
Middle Rio Grande WIB
Moving north up the Rio Grande, spatial coverage and population distributions begin to exhibit more dramatic features. The Middle Rio Grande WIB serves a 14,265 sq. mi. area that includes the nine counties of Val Verde, Kinney, Edwards, Real, Uvalde, Dimmit, La Salle, Maverick, and Zavala Counties. Most of the area’s 167,010.00 population resides in one of the Micropolitan Statistical Areas of Del Rio (Val Verde County), Eagle Pass (Maverick County), or Uvalde (Uvalde County). The population density tapers off quickly outside of Eagle Pass at 42.4 persons per sq. mi., and residents are disbursed across small towns and expansive rural tracks characteristic of the area. The Middle Rio Grande Development Corporation (MRGDC) operates four full service “One-Stop” Workforce Centers—one each in Carrizo Springs (Dimmitt County), Eagle Pass (Maverick County), Uvalde (Uvalde County) and Del Rio (Val Verde County) and more limited or satellite services in the other counties. MRGDC also serves as the WIB staff. Project GROW was available at the Eagle Pass, Del Rio, Carrizo Springs, and Uvalde Workforce Solutions sites.
Upper Rio Grande WIB
The Upper Rio Grande WIB, covering 21,700 sq. mi., is fifty percent larger than Middle Rio Grande, the second most expansive WIB in the BWA, and accounts for nearly half (of all the land area in the entire BWA region. The WIB serves six counties - El Paso, Jeff Davis, Hudspeth, Culberson, Presidio, and Brewster. Project GROW services were concentrated in the El Paso MSA that surrounds the City of El Paso. The WIB’s resident population is 825,913, and 800,647 of these persons are living in densely populated El Paso county (790.6 persons per sq. mi., compared to the remaining counties in the area that have 2 or fewer residents per sq. mi.).
Upper Rio Grande has had the most dramatic personnel transitions within the BWA. The area has had four WIB leads for Project GROW. In June, 2014, the entire executive and administrative staff at the WIB was relieved of duty and a new Executive Director and Management team emplaced. In March, 2015, as part of an effort for stronger private sector impact, the Upper Rio Grande, now known as Workforce Solutions Borderplex, separately bid and awarded the Business Services part of Contractor services to Manpower,
15
4:4:004 Inc. Serco, an international service company, is the Workforce Solutions/One-Stop contractor.12
Borderplex has eight Workforce Solutions office sites, six in the El Paso area, three of which are in the core city (Downtown, Northeast, and Lower Valley). In early 2015, Borderplex began to emulate Lower Rio and South Texas by bringing on an outreach intern in an effort to ramp up enrollments, which then evolved into a regular position. Also, in the late operations stage, Borderplex assigned dedicated case managers and a resource specialist in the Lower Valley office to further streamline, improve, and coordinate Project GROW services. Other Workforce Solutions offices in El Paso County are located at Fort Bliss, Canutillo (northwest El Paso County), and Fabens (south El Paso County). There are also career centers in Alpine (Brewster County) and Presidio (Presidio County), both cities of well under 10,000.
Training Providers
Each WIB procured a training provider for college readiness training, contextualized ESL/ABE/GED education, and accelerated occupational training along career pathways in stable or growth industries with high occupational demand. WIBs began to release Requests for Assistance in Fall 2012, and by the Spring 2013, contracts for services were signed or under advanced negotiations. Training providers selected were:
• Cameron: Texas State Technical College (TSTC); 13 Valley Initiative for Development and Advancement (VIDA)14
• Lower Rio Grande: South Texas College (STC)); VIDA
12 The WIB released an RFS for the career centers contract for 2014, but there were no proposals submitted. 13 Texas Southmost College (TSC) in Brownsville, Cameron County, had originally anticipated a role as training provider also, but withdrew from the emergent service delivery configuration due to administrative restructuring of the college as a separate entity from The University of Texas-Brownsville. In March, 2011, the Texas Southmost College District Board of Trustees voted to withdraw TSC from the 20-year partnership agreement entered in 1991. The dissolution of the partnership and reorganization hampered partnership development and contract negotiations with Cameron for Project GROW. 14 As noted, Cameron never reached agreement with VIDA. Funds for the college readiness academy and postsecondary training that VIDA placed on the table as leverage depleted. As a result VIDA provided none of the anticipated services in Cameron and none of the Cohort A1 services anticipated for Lower Rio. This and the fact that TSTC established a CRA with Brownsville ISD in the final year are discussed later in this report..
16
4:4:004 • South Texas:
Laredo Community College (LCC).
• Middle Rio Grande: Southwest Texas Junior College (SWTJC)
• Upper Rio Grande: El Paso Community College (EPCC); Advanced Retraining & Redevelopment Initiative in Border Areas (Project ARRIBA)
The community and technical colleges, WIBs, and Career Center operators shared responsibility for developing and providing education and training for Project GROW’s accelerated career pathways. In conjunction with Business Services Representatives in the career centers, they attempted to identify the specific skills and competencies that employers sought in high growth industries and demand occupations and to develop programs and career pathways accordingly. The community colleges made referrals for internal student support, as well as coordinated support services and shared best practices to make the program more successful with local and regional partners. VIDA had been expected to provide intensive case management to subsets of Cohorts A and Cohort C participants, as well as offer the College Readiness Academy and postsecondary training to subsets of Cohort A at TSTC in Cameron and at STC in the Lower Rio Grande WIB area. ARRIBA provided intensive case management to Cohort C only. Both CBO’s eventually picked up former Project GROW participants and provided college readiness, advanced occupational training, and wrap around services that prepared them for employment in higher wage jobs in demand occupations.
Texas State Technical College
TSTC Harlingen is part of the Texas State Technical College System, the sole state-supported technical college system in Texas. TSTC Harlingen is one of four colleges (along with TSTC Marshall, TSTC Waco, and TSTC West Texas) and five extension programs providing academic credit and non-credit programs to prepare technical skills-competitive students in cooperation with business and industry, government agencies, and other educational institutions for rewarding careers.15 TSTC Harlingen has historically provided education and training to individuals served by the Cameron and Lower Rio Grande WIBs, as well as Project VIDA. Students earn regular academic degrees, as well as Continuing
15 For example, TSTC’s University Center serves as an extension for at least seven 4-year universities, including the University of Texas, and Texas A&M University, as well as private universities.
17
4:4:004 Education Units (CEUs) that articulate with academic credits when the course meets established criteria. The Corporate & Community Education division provides targeted training and services, including customized training through its Corporate Education Office and an array of more standard curricula, through its Continuing Education Office, both within the division under a common Dean. The Director of Continuing Education was the TSTC Project GROW lead with support and commitment across areas of responsibility within the division.
South Texas College
STC is one of three community colleges in Texas authorized by the Texas Higher Education Coordinating Board (THECB) to award baccalaureate, as well as Associate degrees. The College serves Hidalgo and Starr counties in the service delivery area of the Lower Rio Grande WIB, and has five campuses—three in McAllen, one in Weslaco, and one in Rio Grande City. Since 2009, South Texas College has been working with the Lower Rio Grande WIB in successful efforts to integrate adult basic education with career and technical pathways training leading to credentials that help ensure success in high demand occupations. The accomplishments and experiences of the partnership between VIDA, Lower Rio Grande, and STC with the “Breaking Through” initiative formed the basis for Project GROW’s integrated education and career pathways model. As the contractor for Project GROW, STC provided college readiness, GED, adult basic education, and ESL classes, in addition to occupational training.
Laredo Community College
Laredo Community College serves the three county area of Webb, Jim Hogg, and Zapata counties contiguous with the South Texas WIB. LCC has two campuses, both in Laredo: one in the new and refurbished facilities at the historic Fort McIntosh site in central Laredo; the other, a relatively new (2001) campus in south Laredo. The Division of Workforce Education offers numerous programs of study designed for employment and career advancement and lead to either an Associate of Applied Science Degree or a Technical Vocational certificate. The Division of Workforce Education contains both the Continuing Education Department, which also arranges customized training classes for business, and the Adult basic Education Department. These Departments were most directly responsible for Project GROW training provider services.
18
4:4:004 Southwest Texas Junior College (SWTJC)
Southwest Texas Junior College (SWTJC) operates three campuses—the main campus in Uvalde (Uvalde County) 70 miles east of the Mexican border, and two additional campuses in the border cities of Del Rio (Val Verde County) and Eagle Pass (Maverick County). SWTJC also operates instructional facilities in Crystal City (Zavala County), Pearsall (Frio County), and Hondo (Medina County), the latter two of which are located beyond the boundaries of the Middle Rio Grande WIB. The Workforce Development and Adult basic Education Office comprises the Adult Education and Literacy division, as well as the Workforce Training and Development division, the adult and continuing education units that provided the Project GROW education and training services. The Adult Education and Literacy offices in Del Rio were originally co-located with the workforce programs operated by MRGDC at the Career Center and offered ABE/GED/ESL and academic assessments on-site. The college withdrew from the Workforce Solutions office at the start of the third year of operations due to funding constraints. College Readiness for Project GROW was delivered at the SWTJC Del Rio campus. The Dean of Workforce Development and Adult basic Education and two Workforce Training and Development Program Coordinators had lead responsibility for Project GROW at SWTJC.
El Paso County Community College
El Paso County Community College (EPCC) operates five campuses in the greater El Paso area: the original Rio Grande Campus in central El Paso; Valle Verde in southeast El Paso; the Trans-Mountain Campus in northeast El Paso; the Northwest Campus in the county’s upper valley; and the Mission del Paso Campus, serving the Eastside/Lower Valley area of the county. Additionally, EPCC offers student resources at the Administrative Services Center, which houses the offices of the Workforce/Economic Development and Continuing Education department, near the Val Verde Campus. The college’s occupational training programs, academic support courses, and basic academic skills programs are well developed, and in recent years EPCC has increasingly focused on contextualized ABE/ESL/GED curricula, as well as initial and continuing education credentialing that assists student advancement from non-credit, continuing education coursework to regular academic credit programs along a career pathway. It’s “On-RAMP” recruitment efforts at area adult education and workforce centers provides “Career-College Exploration and Readiness” instruction to help challenged populations transition to postsecondary opportunities. The Director of Workforce Development and the Director of Workplace Literacy Programs, as well as the Career Pathways Coordinator in the Workforce/Economic
19
4:4:004 Development and Continuing Education Department shared key management responsibility for Project GROW.
Project VIDA and Project ARRIBA
The Valley Initiative for Development and Advancement (Project VIDA), serving the Cameron and the Lower Rio Grande WIBs, and Advanced Retraining & Redevelopment Initiative in Border Areas (Project ARRIBA) in the Upper Rio WIB, are the primary CBO partners. Both are highly successful workforce intermediary organizations that link motivated job seekers to training in well-paying, career pathways identified in cooperation with engaged employers whose human capital needs their efforts aim to satisfy. Projects VIDA and ARRIBA are “sister” organizations that provide educational, personal, and financial supports to economically disadvantaged adults to obtain postsecondary credentials (Occupational Certificates and licensing, Associate or bachelor’s degrees) and high wage jobs. As noted earlier, VIDA’s intent to provide access to a College Readiness Academy and training for Cohort A participants in Cameron and Lower Rio never materialized. VIDA did provide intensive case management to subsets of Cohort C participants in Lower Rio, but not in Cameron. ARRIBA’s role was limited to providing intensive case management to subsets of Cohort C in El Paso, a group outside of their regular participant parameters. Normally, ARRIBA serves those with a high school diploma or GED, providing college readiness and occupational training in well-paying, demand occupations, as well as other services.
Career Center Contractors
WIBs contract service delivery for “Career Centers,” the designated One-Stop employment and training centers branded as Workforce Solutions offices in Texas, and these contractors were de facto partners in Project GROW. Contractors had lead responsibility for outreach, intake, eligibility determination, WIA case management, support services, job placement, follow-up, and information management reporting. The Career Center operators negotiated service delivery practices with the WIBs to attain performance expectations for which the WIBs and themselves were held accountable. Career Center contractors in BWA WIB areas for Project GROW were:
• Cameron: Southwest Keys
• Lower Rio Grande: C2 Global Professional Services (C2GPS)
20
4:4:004 • South Texas: ResCare, Inc. thru September 2013; hence, C2GPS
• Middle Rio Grande: Middle Rio Grande Development Council (MRGDC)
• Upper Rio Grande/Borderplex: Serco, Inc.; in late 2014, Manpower, Inc., obtained the Business Services portion of the One-Stop contract
KEY INDUSTRY SECTORS AND TARGETED OCCUPATIONS
Based on local LMI analysis and their Demand and Targeted Occupations Lists, the BWA WIBs identified key industries and occupations for Project GROW start-up. The WIBs selected four higher growth industry sectors across the border region for the Project GROW initial design: Healthcare; Construction; Distribution, Logistics, and Transportation; and Manufacturing. For initial implementation, each BWA WIB selected four demand occupations within these industries. BWA partners intentionally tried to select common demand occupations to support relative program consistency across the region. Cameron, Lower Rio Grande, South Texas, and Middle Rio Grande selected the same four demand occupations for the early Project GROW training cohorts:
• Maintenance and Repair Workers/General (ONET Code: 49-9071)
• Medical Assistant (ONET Code: 31-9092)
• Truck Drivers, Heavy and Tractor-Trailer (ONET Code: 53-3032), and
• Emergency Medical Technicians and Paramedics (ONET Code: 29-2041).
Upper Rio also included Maintenance and Repair Workers/General, and Emergency Medical Technicians, but added:
• Medical Records & Health Information Techs (ONET Code: 29-2071), and
• Construction Carpenters (ONET Code: 47-2031)
Content and credential within these occupational categories is not comparable across sites. Early guidance from USDOL permitted the expansion of occupations within the selected industry sectors.16 Upper Rio Grande and El Paso Community College started the
16 LRG sought to expand the target occupations (career pathway) options to include the various programs of study available at VIDA in order to facilitate easier access for enrollment into Project GROW, particularly for Cohort A. (Email exchange between Kajuana Donahue at ETA and Shelly Sanchez at LRG, 2/19/2013 thru 3/7/2013). One of the evaluation System Change Indicators involves the year to year change in career pathway programs in Project GROW.
21
4:4:004 first of three small HVAC Cohort A trainings in July, 2013. Middle Rio Grande added a Welding pathway program in late 2014 with USDOL, but was unable to come to an agreement with the Del Rio and Eagle Pass ISDs for leasing their instructional sites for the Fall of 2014 or Spring 2015 to serve prospective participants in those areas. Three were eventually enrolled during the Summer and Fall of 2015 at Southwest Texas Junior College’s Uvalde facility. GROW participants were braided with similar VAST participants in these classes. TSTC and Cameron built Welding and HVAC training options within their Maintenance and Repair pathway from the start.
There are other noteworthy inter-site variations in the trainings available embedded within these occupational pathways, particularly regarding what the entry level credential should be for the career pathway. While these might be understood as necessary accommodations to align training appropriate to the capacity of specific cohorts with the availability of instruction, the variations have different implications for employment, wages, and career advancement outcomes. For example, under Emergency Medical Technicians (EMT) and Paramedics, TSTC and EPCC students qualified to test for a nationally recognized EMT Level-One or EMT-basic certificate after successfully completing the course. Classes offered through their continuing education departments shared the curriculum of their academic counterparts, and continuing education units (CEUs) were made to articulate with academic credit should the individual seek to advance further in the career pathway. In the last EMT training at EPCC, continuing education and regular academic were combined in the same class. Educators had noted that non-credit EMT classes for Project GROW students were “accelerated”, i.e., twelve weeks to cover a semester’s curriculum, which proved problematical in terms of persistence and success; those less-prepared for advanced training were required to digest intense amounts of information in less time than presumptively better-prepared regular academic students in the 16-week semester program. Rather than EMT basic or Level One, Lower Rio Grande offered entry level training as an Emergency Care Assistant (ECA), a lower rung on the EMT pathway ladder, tied to a Certificate of Completion issued by STC. Although the ECA must pass a National Registry Assessment, this credential alone is reportedly less-valued by employers of first-responders because of limited allowable patient contact and skills acquisition.17
17 The Texas Department of State Health Services requires 40 hours of classroom training to sit for the Emergency Care Attendant (ECA) licensing exam. There is no clinical training or field internship required. EMT requires at least 140 hours of classroom training, plus in-hospital clinical training and an in-vehicle field internship. EMTs may provide basic life support in critical situations. ECAs may work on ambulances in Texas in areas where there are few EMTs and are not authorized for direct care. Four of the nine ECA students who completed training passed the exam; three found employment (although entry wages were below WIB target wages.)
22
4:4:004 Medical Assistant is another occupation responsive to different concentrations and
levels of training. The occupation contains both administrative and clinical functions. Administrative duties may include scheduling appointments, maintaining medical records, billing, and coding information for insurance purposes. Clinical duties may include taking and recording vital signs and medical histories, preparing patients for examination, drawing blood, and administering medications as directed by physician.18
Middle Rio Grande and its partner SWTJC offered Clinical Medical Assistant training to an early Cohort A group of 11 students and an early Cohort B group of 4 students. Those who completed training earned a certificate of completion that, alongside a check list of skills acquired through clinical experience, qualified students to take the certification exams of the National Healthcare Association for Medical Assisting, Electrocardiography, and Phlebotomy. Later, in January 2015, the local partners enrolled an additional 10 Cohort B participants in this pathway, but training--now as a Medical Office Specialist--became limited to the administrative functions. Similarly, Upper Rio Grande enrolled 10 Cohort B students at EPCC for Medical Office Specialists training in June 2015
The South Texas training provider Laredo Community College offered a Medical Office Clerk training generally composed of 5-6 modules, 3 or 4 of which dealt with Health Information Technology Training (HITT). The training required a total of 200 class hours of continuing education for Cohort A, B, and C students who could earn a certificate of completion. At least one class comingled Cohort A and B students, and one class comingled Cohort B and C students.19 Other than CDL training, which is obviously standardized for licensing reasons, this is the only example of the same training offered to all three Cohorts.
The availability of a credentialed Medical Office Clerk training and the fact that these CEUs are held in escrow for those who may wish to continue academic training as a Medical Assistant at LCC represents is an example of the kind of stackable credential, institutional alignment, and career pathway opportunity that Project GROW purposefully encouraged. Initially, the academic Medical Assistant Program resisted the issuance of any continuing education credential that could potentially be confused by employers and undermine the marketability of the full-year, academic Medical Assistant certificate or the two-year degree
18 http://www.onetonline.org/link/summary/31-9092.00 19 Early in the demonstration, LCC concentrated on solely ESL/ABE/GED training for Cohort C students; late in the demonstration LCC provided Medical Office Clerk and CDL training to Cohort C students as well, resulting in a boost in the credentialing performance measure success rate. At 130% of the performance standard for credentials attained, South Texas and LCC were the only partners to meet or surpass the target for any outcomes measure.
23
4:4:004 for Medical Assistant Associate of Applied Sciences. After the intent and potential benefits for reaching non-traditional students became clear, the President of LCC and the academic program acceded to the introduction of the accelerated initial training certificate and articulating the CEUs with future credit enrollment,
South Texas College, the Lower Rio Grande WIB’s training provider, took another slightly different approach and initiated a Cohort B training for Medical Receptionist early and two Cohort C trainings midway in the demonstration; those who were successful earned a certificate of completion. The last Cohort C training co-enrolled a single Cohort B student. Having determined that the local market was saturated for Medial Receptionists, Lower Rio introduced a Health Information Management (HIM) Coding Clerk training and co-enrolled 3 Cohort B students with 16 Cohort C students. As will be discussed later, nearly 20 percent of those determined eligible for Project Grow in Upper Rio Grande selected Health Information Technology as their occupational field of choice, but there was some concern that the Project GROW participants were not adequately prepared for the college level of academic instruction. The closest available training offered was the Medical Office Specialist Cohort B, offered to 10 participants in the waning months of program operations.
PARTICIPATION CRITERIA
Eligibility Requirements
Project GROW participants were at minimum 18 years of age or older and eligible or enrolled in a WIA youth, adult or dislocated worker program. Project GROW had also anticipated enrolling TANF recipients who were co-enrolled in WIA programs and veterans who are a service priority for all of the WIBs. Additionally, a prospective participant had to:
• be U.S. citizen or eligible to work in the United States;
• meet applicable Selective Service requirements;
• commit to one of the four targeted occupations for their respective workforce area to obtain training and be considered suitable for such training; and
• fit the criteria of the service cohort assignment process.
24
4:4:004 Participant Cohorts
To promote differentiation and alignment of program model interventions with the needs of specific target populations, Project GROW segmented the lower-skilled adult population into three major service cohorts, to test various service delivery features. These groups of sub-populations by design were expected to form education and training cohorts for targeted occupations. Participants were assigned to cohorts based on their level of academic attainment and Tests of Adult basic Education (TABE) scores. The TABE test was administered to all prospective participants at eligibility determination.20 As has been noted in earlier reports, sites generally struggled with the cohort training model in part because prospective clients tested outside the TABE score range for the proposed training cohort that Workforce Solutions tried to fill. The criteria for triaging participant service cohorts were:
Cohort A: Adults with a GED or high school diploma with high school level TABE scores but not college ready. All scores must be within between 9th & 12th grade score equivalencies), College readiness is determined by the postsecondary training provider using a recognized assessment tool; currently the Texas Success Initiative Assessment (TSIA is required statewide).21 The plan was for Cohort A participants to receive college readiness training that prepared them to enroll in regular postsecondary academic credit programs leading to a credit-based, certificate or associate degree, while avoiding the need for developmental education that might slow or divert their career progressions.
Cohort B: Out of school youth and adults without a GED or high school diploma, but with high school level TABE scores. Cohort B test scores must generally be within 9th & 12th grade score equivalencies, and participants participate in contextualized GED classes, while receiving occupational training.22
20 Pre/post TABE test scores are also an outcome measure for Educational Learnings Gains, specific to Project GROW and not to be confused with Education Functional Learning (EFLs) levels, which are associated with WIA Out of School Youth (OSY) measures. TABE tests are among several federally-approved test to assess adult basic and ESL skills, and are the de facto standard tests in Texas. 21 Community and technical colleges have historically used THEA, Accuplacer or Compass placement tests approved by the THECB as part of the Texas Success Initiative (TSI). In September 2013, technical and community colleges began to migrate to a statewide, standardized TSI Assessment (TSIA). Pre/post TSI-approved tests are required of all Cohort A participants. A failed pre-test is a requirement for Cohort A selection. Successful post-testing certifies college readiness and indicates that the individual is not required to attend developmental education classes, resulting in cost- and time-savings for the Project GROW participant. RMC had intended to report score increases as an evaluation measure, but accurate data is not available. 22 Project GROW’s initial functional equivalencies called for 9th grade scores or better, but policy permits slightly lower scores to align and leverage similar postsecondary funding streams (e.g., Accelerate Texas and other Adult basic Education – Innovation Grants). Policy also allows those conducting eligibility determination some flexibility based on their personal judgment of the prospective participant’s willingness and ability to benefit from services.
25
4:4:004 Cohort C: Adults who do not have a GED or high school diploma, and score
below high school level equivalencies. At least one section of the Cohort C participant’s TABE scores must fall within 6th & 8th grade score equivalency range, and all scores must be higher than a 6th grade-level equivalency. The design anticipated that the majority of Cohort C participants had limited English proficiency and required ESL services as part of their contextualized adult basic literacy classes.23
Cohorts A and B most resemble the populations poised to benefit from a career pathway program; Cohort C represents the most challenging sector of the target population. Project GROW expected that a notable number of Cohort C participants would advance beyond ESL/ adult basic literacy and that a limited number would eventually and successfully complete integrated GED/occupational training pathways available to Cohort B participants.24 Adults in this cohort—lacking secondary equivalencies or exhibiting limited English proficiency—were not usually enrolled in staff-assisted, intensive, or training services under WIA. Since Project GROW required WIA eligibility determination and program enrollment, the demonstration target population increased risks in terms of attaining WIA performance measures, as well as opportunities for testing and refining innovative but challenging service practices and policies. As WIA Adult or Dislocated Worker participants, adult Project GROW participants were subject to WIA academic or occupational credentialing, employment entry, wage, and retention measures. WIA Youth retained the prospect of attaining Education Functional Learning increases as a positive WIA performance outcome.
Participation Cohort Sub-groups
Participants in service cohorts were further triaged into sub-groups (see Figure 3). Cohort A was into divided into subgroups A1 and A2.25 A1 included individuals in the
23 El Paso Community College explored the acquisition of a Spanish GED plus intensive English language development as an “on-ramp” into occupational training to help English language learners access training and increase English skills. 24 Those enrolled as Cohort C participants will remain so identified for evaluation purposes. 25 In the original design, Cohort A was originally further divided into three subgroups. A2 and A3 were combined as the project design was refined and contracts negotiated prior to start-up, and only A1 has access to VIDA’s College Prep Academy.
“At first I was hesitant in applying for the program. I was concerned about how I was going to pay for the gas. Workforce has been able to help me with a gas card which has enabled me to attend the training. I am now well on my way to earning my GED and Medical Receptionist Certificate.”
-Melinda G.
26
4:4:004 Cameron and Lower Rio Grande WIBs who were to be referred to VIDA for assessment and potential participation, via random assignment, in its Innovative Strategies for Increasing Self-sufficiency (ISIS) project.26 Selected A1 participants were to receive VIDA’s case management, intensive supplemental instruction, support services, and enrollment in its semester-long College Readiness Academy (CRA) prior to beginning occupational training at TSTC or STC.27 VIDA was to leverage ISIS funds to provide the CRA and credit-based training leading to a one-year credential or associates degree. A2 comprised persons scheduled to receive supplemental college readiness instruction and case management before entering occupational training in one of the key industry sectors; they were not referred to a CBO for more intensive case management and supportive services.
Figure 3. Service Sub-Cohorts
Cohort BCohort A Cohort C
Target Population
C1 C2 C3 C4B1 B2A1 A2
In the initial design, Cohort B originally comprised two subgroups: B1, out of school youth (OSY); and B2, adults. Both subgroups participated in integrated, contextualized GED preparation and occupational pathway training in an accelerated format that led to both a
26 ISIS is funded by the Administration for Children and Families office at the United States Department of Health and Human Services and the Open Society Foundation and is administered by Abt Associates. 27 Those deemed eligible and not randomly assigned to ISIS were to be banned from receiving workforce services for two years. This constrained the willingness of some WIB and Workforce Solutions personnel from making referrals early in Project GROW. When random assignment had been completed, there was no proposed leveraged training available. AdditionallyVIDA noted that the career path/occupations were too limited and prospective participants were disinterested.
27
4:4:004 high school credential and a post-secondary credential in a 1-2 semester timeframe. By June 2013, partners had decided to collapse these distinctions, noting that there was little practical difference in the two target groups; Project GROW originally anticipated that the two groups might be different based on their skill levels (perhaps favoring younger adults) and motivation and persistence skills (perhaps favoring older adults). Both subgroups also received case management and support services.
All Cohort C participants were to receive contextualized bridge programs at basic adult literacy levels-and/or ESL possibly extended through GED preparation, and support services. Although not required by contract, three WIB areas also provided access to short-term training leading to a credential. Cohort C also comprised subgroups that were differentiated by access to intensive case management (provided by VIDA and ARRIBA in their respective service areas) and by the provision (or not) of randomly assigned In-Home Learning System (IHLS) through Business Access to further accelerate their learning. Subgroups C1 and C2 received intensive case management and supportive services; C1 also received access to IHLS. Subgroups C3 and C4 received standard WIA case management through the Career Center contractor—there was no CBO involved; C3 was assigned an IHLS, C4 was not, at least as originally laid out. In March, 2015, with some 40 or so laptops yet to be assigned and the project poised to start winding down, the WIBs decided to make the IHLS available to all incoming Cohort C. As a result all late entry Cohort C members received IHLS access. Eventually, 97 of the 105 laptops were distributed.
Participation Targets
Table 2 and Table 3 portray the early and later adjusted target number and distribution by WIB of subgroups within the major service cohorts in the Project GROW model. The original target number distribution was reset in the February to April 2015 time frame to support WIB areas that were having success at serving specific sub-Cohorts in order that the BWA region as a whole might come closer to attaining participation targets, as well as to enable distribution of IHLS to areas successfully serving C1 and C3 participants.
As Table 3 indicates, the total number served by Cohort remained unchanged. Key adjustments between WIBs were:
• South Texas increased by 11B; Borderplex/Upper Rio decreased 11B
• Middle Rio reduced 11C; Borderplex/Upper Rio increased 11C
• Middle Rio reduced from 120 total to 109 participants
• South Texas increased from 120 total to 131 participants
Adjustments in the C Sub-Cohort mix are also notable:
• C4 was reduced from 60 to 44 participants
• C3 increased from 60 to 76 participants
• C2 increased from 45 to 48 participants
• C1 decreased from 45 to 42 participants
29
4:4:004 Tables 2 and 3 also reveal the WIB level internal adjustments associated with the
rebalancing of cohorts:
• In Cameron C2 increased from 15 to 25 participants and C1 decreased from 15 to 5 participants
• In Lower Rio C2 decreased from 15 to 8 participants and C1 increased from 15 to 22 participants, largely reflecting the additional assignment of available IHLS laptops in the area.
• In South Texas C4 decreased from 30 to 15 participants; C3 increased from 15 to 30 participants; and B increased from 45 to 56 participants
• In Middle Rio C4 decreased from 30 to 24 participants andC3 decreased from 15 to 10 participants
• In Upper Rio/Borderplex C4 increased from 0 to 5 participants; C3 increased from 15 to 21 participants, and Cohort B was reduced from 45 to 34 participants
The redistribution required minor contract amendments regarding budgets and the performance targets of South Texas and Middle Rio, the two areas whose total participant count changed. South Texas acquired access to an additional $54,260 taken from Middle Rio for Project GROW services. Regarding performance targets:
For South Texas
• The GED target increased from 31 to 40
• The Credentials target increased from 58 to 67
• The Learning Gains target increased from 90 to 98
• The Employment Entry target increased from 77 to 86
• The Employment Retention target increased from 57 to 62
For Middle Rio Grande:
• There was no change in the GED or Credentials targets
• The Learning Gains target decreased from 90 to 82
• The Employment Entry target increased from 77 to 86
• The Employment Entry target decreased from 57 to 52
30
4:4:004 CASE MANAGEMENT
Case management type services were provided by Project GROW partners in multiple ways at various points in the integrated services model. Project GROW case management can be understood to include all or parts of the following, depending on the local area and the integrated services model that the partners adopted:
• individual case management as provided under WIA;
• intensive individual case management, the ”high touch” services provided by Project ARRIBA and VIDA; and
• ancillary case management, ongoing direct exchanges regarding student status between ABE/postsecondary instructors, Workforce Solutions Career Counselors and CBO case managers.
Primary case management responsibility for most clients resided in the workforce system with the WIA Career Counselors who had responsibility for service planning, formal needs assessment, and timely provision of support services. Project ARRIBA and VIDA provided intensive case management to Cohort C1 and C2 participants. By design, WIB areas took a “multiple touches” approach to supporting students, which involved partners in a mostly complementary, not duplicative, way.
All Project GROW participants received individual case management with leveraged WIA resources and a small amount of Project GROW funds for case management and supportive services. However, individual case management approaches varied between Career Center contractors based on their service delivery practices. For example, WIA requires at least one, in-person client contact per month for clients in training. In some instances, this was limited to a brief meeting to provide transportation assistance. In other areas, case manager practice promoted more scheduled and as-needed contact, leading to deeper involvement in client progress. Normal WIA caseload size per worker also varied between and within BWA WIBS, suggesting that available time per case in some WIBs was more restrictive than others.
Overall, the case management approach varied to some degree by the frontline community college or Career Center staff’s understanding of Project GROW’s demonstration features and the demonstration’s intent to provide comprehensive wrap-around case
“At first I was hesitant in applying for the program. I was concerned about how I was going to pay for the gas. Workforce has been able to help me with a gas card which has enabled me to attend the training. I am now well on my way to earning my GED and Medical Receptionist Certificate.”
-Melinda G.
31
4:4:004 management and supportive services in a timely manner to improve retention and advancement. Career Centers and WIBS moved beyond their prevailing focus upon WIA programs, which account for a major share of their operating budgets, and WIA performance measures for which they are held strictly accountable. Local partners moved toward more effective information exchanges, anticipated by the introduction of the ASPP and the ongoing alignment of education, training, and support services contained in the Project GROW model.
VIDA and Project ARRIBA by design provided intensive case management to assigned clients. Lower Rio Grande and Upper Rio Grande enrolled and referred Project GROW Cohort C customers to VIDA and ARRIBA for these services. Cameron did not enroll any Cohort C over the duration of Project GROW stating that prospective participants tested outside of TABE parameters or were not interested in making the time commitment. Upper Rio had difficulty aligning cohorts with El Paso Community College in the first year, leaving Project ARRIBA waiting in the wings for clients until the second year
Ancillary Case Management was inherent in the Project GROW model. All Project GROW participants were deemed to receive a limited functional amount of shared case
management, since class instructors, WIA case managers, and other college and WIB staff shared information concerning participation, service delivery, and progress. Conversations with technical and community college staff consistently revealed that these providers were deeply committed to
student success in the classroom, as well as the work place. The potential strength of the Project GROW model was the coordination across partners serving the same clients to achieve results.
ACADEMIC PREPARATION
College Readiness
College readiness fills the gap between the acquisition of a high school diploma or GED and the functional academic skills required for college-level studies. The 79 Cohort A participants served enrolled in a college readiness or “On-Ramp” course intended to prepare them to pass the Texas Success Initiative Assessment (TSIA) and enter academic
“I am thankful for every teacher who took their time to help me get through this program. I truly appreciate this opportunity.”
Rocio V.
32
4:4:004 training directly, while avoiding the time and tuition costs of developmental education.28 Prior to September 2013 when statewide standardized TSIA testing was initiated, multiple assessment such as Accuplacer, Compass, T-Comp, etc., had been endorsed. The structure of college readiness varied distinctively in the Project GROW model across Cohort A subgroups and respective training providers, but all had pre/post TSI recognized tests, and most had practice tests to gauge student progress and adjust the learning plans, if necessary. The following narrative describes the local variance. By the end of the operational period, College Readiness efforts, initially varied in design from 480 hours in the VIDA academy (which has never been utilized as an option in Cameron WIB due to lack of enrollment and lapsed funding) down to 50 hours at Laredo Community College, seem to be trending toward 12-15 week course of 240 to 300 hours of classroom time.
By design, A1 participants from Cameron and Lower Rio Grande were to be enrolled in VIDA’s College Prep Academy, a well-established program that provides 480 hours of instruction during a 16-week semester period. Students would have received reading (120 hours instruction), writing (160 hours of instruction), and math (200 hours of instruction), if they had been enrolled. When TSTC stepped up to serve Cohort A participants midway through the grant period (after VIDA no longer had the resources available to serve Cohort A in Cameron), the college contracted w/Brownsville ISD to provide a TSI Academy. The Academy offered 206 continuing education hours composed of Keyboarding (200 hours of instruction, Microsoft Word (22 hours of instruction), Myfoundationlab online/Lecture Course (64 hours of instruction), TSTC College Math Course (48 hours of instruction), TSTC College Reading/Writing Course (48 hours of instruction),.and TSI Prep Exam (8 hours of instruction). Although TSTC tried to form two cohorts (EMT basis and Maintenance Technician) in the final year, neither was formed due to insufficient numbers of interested and eligible individuals.
Similarly, South Texas College, serving Lower Rio, had developed a 10-week college readiness course that provided students 320 hours of instruction: reading (80 hours of instruction), writing (106 hours of instruction), and math (134 hours of instruction). This or a very similar course regime has proven successful and would have been available to GROW participants, again if any A2 had been enrolled in Lower Rio.
28 During an informal conversation, one Texas education and workforce development official stated that the “accelerated” characteristic of the emerging focus on career pathway training referred to the time saved by not having to attend developmental education.
33
4:4:004 Laredo Community College offered a more streamlined version of college readiness
test preparations, comprised of 8 hours orientation to college followed by 36 hours of test preparation spread over a three-week period. (30 A2 enrolled)
El Paso Community College operates a Career and College Readiness Institute which offers “On-Ramp Preparation”. The Institute is comprised of the Career and College Readiness Workshop and the Transition to College Course. The former, provided to Project GROW participants is a three week workshop (48 hours) that focuses upon personal, academic, career and college knowledge. For the final project, students develop their individual Career and College Pathway. The Transition to College Course (108 hours) contains additional reinforcing instruction by focusing upon academic, college, and personal readiness for college, as well as career knowledge and readiness for training. The Institute emphasized contextualized reading and math classes for Project GROW participants.29
College readiness classes generally preceded occupational skills training or were delivered slightly overlapping. Experience dictated that if individuals in some occupations like Welder or Truck Driving received their credential or license first, they were likely to exit prior to TSIA post-testing. Cohort A participants may earn their training credential based on continuing education units (CEUs) after the college readiness class and seek employment based on that credential.
There was an expectation, but no performance requirement, that the individual pass the exit TSIA exam or enroll in an academic credit-based credentialing course.30 Although partners at each WIB area can identify participants--mostly Cohort A, a few Cohort B, and at least one Cohort C--who have passed the TSIA and advanced from continuing education to credit-based career path training, the weight of experiences anecdotally drawn from the site visits falls to the suggestion that most of these lower income participants are interested in occupational certification, employment, and earnings to support themselves and their families as soon as possible after the entry level preparation gained from the demonstration. Modulating factors include the inability or inconvenience of longer-term time commitments in the academic program, the seeming irrelevance of college readiness for their chosen area of occupational interest (e.g., CDL), and the fact that all of Project
29 The anticipated total duration of various pathway training options varied by occupation (e.g., 396 contact hours for HVAC vs. three weeks for a CDL and the delivery strategy (i.e., whether participants were receiving AEL or TSIA training concurrently or sequentially. Sites experimented with both approaches). 30 TSI test scores, academic milestones, and credentials obtained are among the evaluation measures. Unfortunately, such results were not uniformly entered in ASPP or available in TWIST, and will not serve as outcomes measures.
34
4:4:004 GROW’s occupational trainings reside in the workforce development and continuing education departments, none of which require TSIA success.
Nonetheless, every training provider counseled students on the opportunities and benefits of advancing certification along a career pathway that resonates with the interest and potential of the participant. The intangible benefit of expanding information about the plausibility and availability of more education is that it may induce participants to return at some point in the future. Relatedly, some 70 percent of the participants are the first generation in their families to have any access to postsecondary education. The extent that participants adapt a “sense of place” and familiarity with the postsecondary environment may expand the horizons of opportunity for successive generations.
Contextualized or Bridge GED/ABE/ESL
Cohorts B and C were provided adult education classes infused with occupational content matter to increase the relevancy of the learning process to the participant’s occupational interests, support their occupational skills and knowledge development, and to accelerate their advancement toward credentialing and career pathway employment entry. Cohort B integrated pathway preparation contained both the contextualized GED coursework, as well as occupational skills training leading to a certificate. The original, excessively ambitious performance standard of 330 GEDs attained among the 225 Cohort B participants and 210 Cohort C participants was subsequently reduced to a more realistic 189 proportion at of the Cohort B target and possibly a few Cohort C students. To achieve the original target all Cohort B and just under half of Cohort C participants would have had to pass the GED test. The project design did anticipate that a number of Cohort C participants would move from contextualized bridge programs (to improve basic literacy/math levels and English language skills) into GED preparation classes available to Cohort B participants, and that some of these would also earn a GED.31 A few did so but the exact number cannot be extracted from ASPP. Some areas reported all ABE and GED enrollment as GED preparation; others reported them and ESL separately.
According to the January 2016 MPR, Project GROW had attained 70 of its targeted 189 GEDs (37 percent) by the end of December, 2015. Nearly half of these were awarded during the first nine month enrollment ending two years earlier in December, 2013. The low
31 Despite the fact that the original design only specified completion of the basic education or ESL course, 3 of the five WIBs—Lower Rio, South Texas, and Middle Rio--provided occupational training to Cohort C participants; Cameron (which enrolled no Cohort C participants) and Upper Rio did not.
35
4:4:004 achievement rate is due to a number of factors. In January, 2014, the GED Testing Service that administers the GED test converted the test from paper and pencil to computer-based, raised the prices, and increased the rigor of the test. Though it is unclear at this time what the test take-up and pass rate for Project GROW participants is at this time due to data limitations, statewide the pass rate for the general population fell from 74.4 percent to 51.9 percent between 2013 and 2014.32 Field informants indicated that the switch to a computer-based test--beyond being more difficult to pass--created an additional challenge for those less tech savvy or with little keyboarding skills. Moreover, some participants were interested in the occupational certificate, for instance Welding or CDL, and basically “blew off” or skipped the GED exam.33 For some, practice test scores indicated that the student was not ready to take the exam at the end of their class.
A related issue was who paid for retesting. One site built three test payments into the Training Provider contract. In others, the WIB or Training Provider might pay for the initial GED test, and there was some maneuvering to determine how to pay for retest or it was left up to the participant to pay. Areas also approached teaching and testing differently. In at least one site, instructors taught and tested one section pf the GED at a time; rather than sitting for testing in all sections at once at the end of the class.
The actual GED attainment number may increase by the time the outcomes analysis for Project GROW is completed for two reasons. First, In January, 2016, the GED Testing Service announced that it was lowering the pass score threshold for the exam, asserting that the academic rigor of the exam had gone beyond that required of an average high school graduate. As a result, Project GROW participants can retroactively gain their GED if their test scores were above the revised scoring threshold. It is unclear at this time how many of these will be added to the administrative records, since the operational phase of the project is several months ended and none have yet been added.
Secondly, almost all sites had additional support available in the resource rooms at the Career Centers or open access to ongoing GED classes for those who did not pass the GED exam during their period of active Project GROW participation. Since all participants in the demonstration were co-enrolled in WIA/WIOA and GED attainment is a positive outcome for adults in those programs, some are required to participate in these supplemental activities, others may voluntarily do so. Again, it is uncertain whether these
32 Austin American Statesman, “GED: Tougher Test. Less Success.” February 15, 2015. Pp. E1. 33 Similarly, many participants were less than serious about the post-TQABE test that measured Learning Gains.
36
4:4:004 GEDs, if any are attained, will be entered into the TWIST data. It does seem justifiable to acknowledge that the demonstration laid the academic foundation upon which these accomplishments are based.
In Home Learning System
Project GROW was designed to demonstrate the effectiveness of providing an In-Home Learning System (IHLS) to randomly assigned subsets of Cohort C participants. Participants signed a form at enrollment that acknowledged the random assignment procedures. IHLS was expected to support persistence, learning gains, and accelerated advancement through career pathway education and training. IHLS included a laptop, wireless Internet access (filtered and restricted from international roaming), access to a full suite of online education and training resources, help-desk support, and a mentor. Business Access distributed the IHLS to selected individuals, generally about two weeks into the program to ensure that their commitment as reflected by attendance indicated that these persons were committed to the learning opportunity. Business Access also electronically tracked utilization. Business Access also pledged to conduct customer satisfaction surveys with assigned participants.
The laptop was frequently perceived as an “incentive” for participation. The actual use was monitored by Business Access; instructors, training providers, and case managers had no on-site role. Business Access determined whether the individual completed the three training modules per month required during the Adult basic Education (ABE) enrollment period to “keep” the laptop computer. Failure to complete three modules a month or non-attendance in class triggered the disabling or “repossession” of the IHLS by Business Access.
By design only C1 and C3 would have received a randomly assigned IHLS. In March, 2015, with some 40 or so laptops yet to be assigned and the project poised to start winding down, the WIBs decided to make the IHLS available to all incoming Cohort C (which accounts for the 16 C4 in the Table 10). Up until that time, sub-Cohort C participants were frequently co-mingled in their adult education class, some with, others without laptops; educators noted that after universal assignment, class cohesion, persistence, and learning tended to improve. Students felt they were being more fairly treated. Instructors were able to share lessons, assignments, and communicate better with students.
Prior to universal assignment, some adult education and training provider staff viewed random assignment as unfair, ill-thought out, and a constraint to client success,
37
4:4:004 noting that computers were assigned at times to those who already had access to a laptop or desktop at home or to those marginally interested in learning. Staff noted that none of the modules were in Spanish, widely received as a limitation for the target population, and that there was no specific GED preparation module, but rather “soft skills” training. Additionally, on-line supplemental ABE/GED training (e.g., AZTECA), may be available at adult education, college, community, or Workforce Solutions learning labs.
Table 4 lists IHLS distribution and outcomes, broken down by sub-cohort. A total of 95 Project GROW participants in Cohort C received In-Home Learning Systems (IHLS). Overall, participants completed 30 modules on average and a majority (72%) earned the laptop with less than a third (28%) having their laptop repossessed. Repossession was highest for the C1 sub-cohort, where nearly half of C1 participants receiving IHLS had their laptops repossessed, compared to only 22% of C3 participants and just 13% of C4 participants.
Table 4. IHLS Distribution and Outcomes, by Sub Cohort
Project GROW captured program and participant data using three systems, two of which—The Workforce Information System of Texas (TWIST) and Work In Texas (WIT)—are operated by the Texas Workforce Commission. The third system was the previously identified, customized data collection and project collaboration platform developed by Business Access, Administrative System for Program Participation (ASPP). ASPP was a significant feature of Project GROW because it was the proposed nexus of real time exchanges between program partners at local and regional levels, as well the database for unique data elements not found in the above that were selected to serve the demonstration’s program management and evaluation purposes.
38
4:4:004 ASPP records data using a web-based administration system created by Business
Access for social service programs that was adapted to track the participation, service delivery, costs, and outcomes of Project GROW. In addition to demographic information and assessment results, ASPP had the capacity to capture service category, the funding source associated with the service, the provider, start date, completion date, attendance, follow-up, case notes, and payment records. The system also had the ability to track key educational outputs and outcomes, such as course enrollment, course completion, grades, key test scores, credentials awarded, etc. Whereas TWIST and WIT are the primary databases for management and performance measurement in the Texas workforce system,34 the flexibility and customization of the ASPP was intended to be a tailored, comprehensive database for Project GROW program and performance management, to be supplemented, as needed, by TWIST and WIT for evaluation purposes.
ASPP was not universally or consistently used across the BWA area or between local partners in Project GROW. Only one WIB area partnership indicated that ASPP enhanced information capacity and operating efficiencies. Most managers and staff did not consider it an asset, but rather more so an unnecessary burden. Its cross-partner use was limited for several reasons. The use of ASPP sustained a major setback when the Texas Workforce Commission withheld permission to allow client intake and management data in TWIST to migrate to ASPP. The BWA and Business Access had incorrectly assumed at start-up that TWC would support the data system exchange. This disallowance resulted in dual data entry for frontline workers, a very unwelcome development. . Although the Project Coordinator frequently provided technical assistance and reminded WIB area partners of incorrect and missing data entries, local partners were not responsive to the system they felt redundant and for which responsibility for data entry and quality assurance at the WIB level was often weak or diffused.
ASPP was meant to also support real time exchanges between program partners at local levels regarding various data of shared interest such as TABE or other test scores, attendance, support service needs, or other issues. Case notes were at times shared between case managers and educators through ASPP, but partners were more likely to shoot an email or telephone when timely communication was necessary. ASPP had no “alert” or flagging mechanism and it was not reasonable to assume that staff would scroll
34 For evaluation purposes, the Ray Marshall Center is supplementing these databases with others such as longitudinal UI wage and claims records from the Texas Workforce Commission (TWC), and TANF, Medicaid and related participation data from the Texas Health and Human Services Commission (HHSC).
39
4:4:004 through their entire caseload on ASPP regularly to become aware of issues, needs, or other developments.
The common information technology platform was useful for obtaining client demographic data and a few other helpful descriptors for the evaluation, as well as an assistive tool for preparing the Monthly Performance Reports. Participation and outcome data in the MPR was verified in TWIST by the Project Coordinator prior to inclusion in the MPR. Complete and accurate data entry, as well as clarity regarding data field definitions, continued to be areas of concern throughout the demonstration period.
EMPLOYER ENGAGEMENT
Project GROW aimed to recruit, maintain, and strengthen relations with business in growth industries, significantly so through industry sector associations. Both workforce and postsecondary providers are entwined with private and public sector business interests. WIBs are based on a private sector leadership model, and WIB administrative offices and Career Center operators house personnel known by various titles (e.g., Business Partnerships, Business Relations or Business Solutions units) in the former and more commonly as Business Service Representatives (BSRs) in primarily Wagner-Peyser funded Business Services units in the latter. 35 Employers are a major customer of workforce services, particularly labor exchange, job development, and job placement services. Texas WIBs are subject to state business service measures regarding job orders, placements, and other employer services. Activity is entered into the Employer Contact and Tracking Log (ECAT). For Project GROW, the ECAT could track employer engagement regarding activities such as Curriculum Review, Worksite Tours, Mock Interviews, Guest Speakers in Class, Hiring Participants, and Internships or Work Experience.
Community and technical colleges also have structured business relations through departmental and program advisory committees of private sector and community representatives, and increasingly so through career development and placement offices, as postsecondary institutions become more focused on completion rates and employment success of their graduates. These providers are also keen to business interests by association through customized training services and continuing education courses that
35 Borderplex separated the Business Services unit from the Career Center contract and brought the private sector firm, Manpower, Inc., on board as the Business Services contractor. There was no mention of support for Project GROW. Hence from late 2014 forward any BSR activity in support of the demonstration is voluntary leverage from Manpower.
40
4:4:004 serve employer/employee workplace needs. WIBs and postsecondary institutions are both major players in local and regional economic development activities.
Project GROW was challenged to build upon these workforce and postsecondary efforts. Key areas of interest to strengthen employer engagement included the number of employers involved and the industries/occupations they represent; the introduction or expansion of the industry sector approach to workforce and economic development; and the involvement of employers in curriculum development and review to assure responsiveness to industry standards and practices, as well as employer-identified skills and competencies. Other dimensions of employer engagement anticipated in the evaluation design were the direct participation of employers as supplemental instructors, direct referrals of incumbent workers to workforce services to enhance their career prospects (potentially creating openings for entry level workers as incumbent workers advance along the career pathway); workplace flexibility, for example, in scheduling to accommodate training and support for advanced training such as tuition reimbursement or raises tied to the additional credential; and expanding placement prospects for training participants–including internships/clinicals, work experience, and employment—pursuant to career pathways. Despite the challenges or shortcomings regarding these employer engagement elements, almost all informants agreed that Project GROW provided an opportunity to test the waters and advance institutional alignment to serve a challenging population: GROW was a start!
Early in Project GROW, BSRs were charged with recruiting twelve prospectively supportive employers in the targeted industries. BSRs contacted known employers with whom they had ongoing relations and identified additional employers from among those who had recently posted a job opening in WIT related to the occupational trainings offered in Project GROW. BSRs distributed a one-page survey to identified employers to solicit and gauge their support. The Employer Survey gathered contact information and asked about entry-level hiring practices, the availability of paid or unpaid internships, willingness to consider Project GROW participants for these, if available, and the employers willing ness to participate in an Employer Engagement “panel,” as well as the skills and competencies that the employer deemed important for entry-level workers.
Workforce Solutions Career Counselors and BSRs worked together to find appropriate job leads in WIT and mine the number of recruited employers who were willing to pre-screen and hire those exiting Project GROW. Beyond recruiting individual employers for curriculum review and employment prospects or internship and work experience
41
4:4:004 placements, there was little expansion or deepening of employer engagement efforts by BSRs overtime. For example, by May, 2014, three of the five WIBs had met or exceeded their employer engagement target: Cameron (12), Lower Rio (18), and South Texas (18); two had not: Middle Rio (8) and upper Rio (9). These numbers hardly changed over the final 21-months of the program—Lower Rio added one employer. Except for a few clinical placements in early cohorts (e.g., Clinical Medical Assistants in Middle Rio), job fairs, and occasional site visits, additional examples of further engagement was not offered or observed during the last two rounds of site visits.36
WIBs and Workforce Solutions staff generally perceived that the employer engagement efforts were successful, but when assessed against key features of successful employer engagement models, this self-assessment might be challenged. Partners generally perceived the employer engagement efforts of the BSRs less favorably and limited beyond placement assistance.37 As noted there was little change in the number of participating employers. There were no examples of pre-payment of tuition for workers participating in program or use of employer subject matter experts as program instructors and only very thin anecdotal suggestion that employer support for the demonstration had strengthened over time. In a few instances, employers had reportedly “disengaged” from Project GROW.
Curriculum review sought by Project GROW at times put BSRs in an awkward position and possibly placed an unknown measure of strain between the workforce and postsecondary institutions. BSRs were asked to get employers to review and comment on curriculum after the training had already started. Many of the trainings, like EMT, were already based on state and national content and licensing standards; requesting reviews was redundant, if not futile. Continuing education course content is often based on the curricula of the credit-based program and contact hours convert to credit hours, if participants choose to seek advanced credentials. Directors and instructors are wary of adjusting curriculum, especially in subject areas that are newly aligned with the academic side of the college.
Despite latent opportunity in health care, oil & gas, and possibly manufacturing, there have been no reported efforts or observations regarding the introduction of industry sector approaches. There were no concerted efforts to align the departmental or program
36 During the first round of site visits, BSRs referred researchers to a few “engaged” employers. Researchers encountered limited knowledge and commitment to the program. 37 The service delivery model of VIDA and ARRIBA career pathway trainings revolves around their core role as workforce intermediaries and movement toward industry sector approaches, perhaps resulting in more advanced levels of employer engagement.
42
4:4:004 employer advisory committees with the BSR employer contacts to move toward an industry sector approach. At one site in which BSRs had emerging relations with a newly assembled Health Care Industry Task Force and long-term engagement with a manufacturing association, there was no effort to infuse Project GROW into the groups and develop an industry sector interest in the program and participants.
Developing an industry sector approach likely would have been more propitious if some significant share of the 60 Sub-cohort A1 participants had been enrolled in postsecondary academic training resulting in an Associate Degree or full year academic certification path. With such advanced training through VIDA, these participants would likely have been more appealing to employers and a more confidant “sell” for BSRs. As it was, however, the demonstration’s trainings mostly consisted of basic training leading to Certificate of Completion in workforce and continuing education departments and adult basic education that yielded few GED acquisitions or learning gains. Industry sector approaches thrive when the human capital produced by the training regime has the skills and competencies to contribute to or enhance the efficiencies, quality, and productivity of the business; value is added to the enterprise. The lower rung efforts will not attract interest and commitment fundamental to a vibrant industry sector approach. BSRs will not perceive that they could be compromising their efforts to meet employers’ needs and place skilled, qualified workers, if they push less-skilled, entry level applicants that are readily available throughout the border region. Moreover, those areas in Texas that have developed industry sector approaches—like Austin and Houston, for example—took years of concerted effort to successfully do so.
GAUGING SUCCESS
Workforce Performance Measures
Project GROW focused on a short list of education, training, and employment performance measures similar to current state and federal workforce measures, as well as a single employer engagement measure. Except for the latter, standards (target number and shares) were based on recent year outcomes, slightly adjusted to reflect somewhat stronger outcomes expected from the Project GROW interventions. In the areas of education and training, Project GROW had originally planned to prepare:
• 330 participants— half of the target enrollment—to successfully attain GEDs;
43
4:4:004 • 502 participants to receive occupational credentials in a targeted industry sector;
• 528 participants to achieve educational learning gains;
• 462 participants for employment entries in a training-related occupation; and
• 479 participants for 60-day employment retention.
The design also required the WIBs to build-in partnerships with at least 60 engaged employers, twelve from each WIB.
Revised Performance Standards. Project GROW subsequently revisited and downwardly adjusted several standards for the performance measures based on the realization that they were miscalculated in relation to Cohort C expectations in the design and other factors. For example, although training providers were only accountable for Educational Learning Gains for Cohort C participants, to attain the original GED target of 330, all Cohort B and one-half of Cohort C would have had to successfully passed the GED test. . Also, Cohort C were not required to attain an occupational credential. Lastly, the 60-day employment retention standard at 479 was higher than the 462 employment entries. As a result the:
• GED attainment performance standard was lowered from 330 to 189, a number more in line with realistic expectations;
• Occupational Credential standard was reduced from 502 to 351; and the
• Employment Retention performance standard was lowered from 479 to 351
Educational Learning Gains, Employment Entry, and Employer Engagement targets remained unchanged.
44
4:4:004
Table 5. Revised Workforce Performance Targets
Outcome Measure Cameron Lower Rio
Grande Middle Rio
Grande South Texas Upper Rio
BWA Total
GED 38 68 68 68 45 330
Occupational Credentials 72 114 91 91 103 502
Retained Employment 70 109 87 87 98 479
Achieving Educational Learning gains
111 120 96 96 108 528
Placed in Employment 97 105 84 84 95 462
Employer Engagement 12 12 12 12 12 60
For several reasons, including late contracting dates, tight and complex eligibility requirement and processes, attrition and lack of capacity early on, Project GROW has not achieved any of its performance measures across the entire region as a whole. The BWA did best in credentialing (62%). Education measures (GED acquisition at 37% and Learning Gains at 28%) and employment measures (Employment Entry-Training Related at 14% and 60-day Retention at 8%) fell well short of their targets. Three of five WIBs met or exceeded their target number of engaged employers (12). (See Project GROW Performance Outcomes in Appendix D.)
Outcomes varied considerably across sites.
GED attainment. South Texas College and Lower Rio Grande attained the highest number at 37, a 90 percent attainment rate for its GED target, followed by Southwest Texas Junior College and Middle Rio Grande at 13 of 31 targeted or 42 percent. Other sites ranged from 15 percent (Upper Rio Grande, South Texas) to 21 percent (Cameron).
Credentials attainment. South Texas exceeded its target of 67, reaching fully 87 credentials or 130 percent of its target, basically by providing short-term credentials to Cohort C as well as Cohorts A & B, followed by Lower Rio Grande which achieved 71 percent of its target. Cameron and Middle Rio Grande both achieved 50 percent of target, while Upper Rio lagged behind at 11 percent.
Education Learning Gains. South Texas, at a 47 percent attainment rate, led all WIB areas, followed by Lower Rio Grande at 30 percent and Upper Rio Grande at 27 percent.
45
4:4:004 Middle Rio Grande at 17 percent and Cameron at 20 percent occupied the lower end of the attainment rates. Recall that all areas reported having some difficulty getting participants to take the post-TABE assessment—the basis for determining gains—seriously. As a result it was not uncommon to find post-TABE scores lower than the pretest scores. Recommended policy after these results began appearing was to post-TABE two weeks before the end of the class.
Employment Entry. Employment entry also fell short of expectations. Led by South Texas at a 33 percent attainment rate, it was a mere 1 percent in Upper Rio Grande- a single employment entry in a training-related occupation from a total of 103 participants. The employment entry rate was 17 percent in Middle Rio Grande, 14 percent in Lower Rio Grande and 8 percent in Cameron.
60-day Employment Retention. Once again South Texas led the way with an 18 percent employment retention rate (11 individuals), followed by Middle Rio Grande at 12 percent (6 individuals). Attainment dropped 6 percent in Cameron, 4 percent in Lower Rio Grande, and 1 percent in Upper Rio Grande
Evaluation Measures
Researchers selected an array of evaluation measures that provide a more refined perspective on the Project GROW’s accomplishments. These include education, employment, systems change, and employer engagement measures. These measures are informed by administrative databases such as WIT, TWIST, and UI wage records as well as, ASPP, the demonstrations performance and management reports, and on-site observations of program practices and policies. These include:
• Education measures that track accomplishments related to the academic advancement and occupational learning gains of program participants
• Employment measures that address Project GROW’s participant earnings and socioeconomic outcomes, as well as data for net impact analysis and benefits/costs estimation.
• Systems change measures that indicate the growth and development of the demonstration’s innovative features and practices features within and across operational partners that are associated with increased capacity and that support sustainability after the evaluation period.
46
4:4:004 • Employer engagement measures that indicate ongoing progress and prospects
for better meeting the needs of employers, stimulating economic growth and stability, and enhancing the career prospects of border area residents.
Self-Assessment Tool
During the final round of site visits, researchers distributed a Self-Assessment Tool (Appendix B) comprised of twenty-two questions aligned with evaluation measures, strategic components, and features of the demonstration. The program lead and key personnel of local partners for each institutional perspective (the WIB, the local workforce contractor, the training provider/college, and the CBO, where applicable) completed the form. Each question solicited a simple yes/no response and the composite, average total score of the binary response (1 for yes, 0 for no) serves as a basic index of effectiveness or accomplishment regarding the feature or measure, as well as a take-off point for more in-depth discussion on-site regarding related practices, policies, accomplishments or constraints based on the local partners’ perspectives and experience with Project GROW.38
As Table 6 indicates, researchers clustered questions and responses under six headings comprised of four strategic components (system development, career pathways, employer engagement, WIOA transition) and two design features (ASPP and Cohort C training). The maximum total score is 22 per respondent, indicating an optimal perception or experience of accomplishment regarding all the dimensions of Project GROW queried. The maximum total score varies under other headings based on the number of related questions. The distance from the calculated score to the maximum per heading score is the indicator of relative progress. Unique questions may relate to more than one dimension. For example, a questions such as, “Is career pathway assistance available to GROW participant who enter employment?”(Q8) ” is included within system development and career pathway indices.39
Table 6 shows that the South Texas partners, with an average total score of 18.0 of the 22.0 maximum score (82 percent), indicated the strongest support for perceived progress under Project GROW, while Cameron with a 10.7 score (49 percent) indicated the least. At an average score of 13.7 of 22 (68 percent), it can be inferred that the local area
38 This application of the instrument proved quite productive in opening up the conversation and engaging the many inter-related elements and common or varying experiences from the different, yet colluding, institutional partners’ perspectives. 39 Appendix B contains the distribution of questions by strategy and feature.
47
4:4:004 partners overall may be equivocal, yet somewhat positive about Project GROW’s progress and accomplishments.40
WIOA transition with an average overall score of 2.6 of 3 (87 percent) elicited the highest positive response across the WIB areas. The perception that Project GROWs has enhanced readiness for transition of Project GROW as a strong, seasoned, and resilient base to fully grasp the intent to the Workforce Innovation and Opportunity Act is a positive result of the demonstration.
For the three strategic components, the directional indicator was similar to that of the region as a whole for all headings. The System Development score overall at 9.1 of 14 maximum (65 percent); the Career Pathway score at 4.9 of 8.0 maximum (61 percent), and the Employer Engagement score at 2.4 of 4.0 maximum (60 percent) suggest a slightly positive inclination towards a perception of progress in these areas.
South Texas (100 percent) and Middle Rio Grande (70 percent) were inclined to positively perceive that more reliable and granular data became available under Project GROW. Other sites felt less so, yet the Project GROW overall score of .5 of 1 (50 percent) on this question gives at least some credence to a perceived value of ASPP, despite the fact that almost every informant in the field when asked what they would eliminate from the model if they were to start anew indicated ASPP.
Q6 in the Self-Assessment Tool is a proxy for expanded services for Cohort C participants who most closely represented among those not generally offered training leading to an occupational credential in the Texas public workforce system. As mentioned earlier, occupational training for Cohort was not required. Rather providers were expected to provide contextualized ESL and ABE tied to the Learning Gains performance measure with the expectation that some in Cohort C would advance to GED and occupational training offered to Cohort B. That 3 of the 5 WIB areas offered training to this subgroup added notably to the learning curve of providers and served as a preparatory experience for serving “priority” populations in WIOA.
40 This corresponds with the qualitative information and observations from site visits. For example, at the end of the conversations with each subset of partners within each WIB area, researchers requested (and advance notice was given) individuals--from frontline to administrative staff—to share five adjectives that describe their experience with Project GROW. Almost every respondent offered descriptors that included the likes of “challenging, frustrating, complex, and very time-consuming, as well a satisfying, rewarding, and ambitious, as well as a welcome, inspiring, and helpful opportunity.
48
4:4:004 Table 6. Self-Assessment Tool Scores by WIB Area
Board Area
Avg. Total Score
(Max 22)
Avg. SD Score
(Max 14)
Avg. CP score
(Max 8)
Avg. EE score
(Max 4)
Avg. WT score
(Max 3)
Avg. ASPP score
(Max 1)
Avg. C score
(Max 1)
Cameron 10.7 7.7 4.0 2.0 3.0 0.0 0.0
Lower Rio 11.7 6.0 4.3 2.7 2.0 0.3 1.0
Middle Rio 14.3 9.7 4.7 2.3 2.3 0.7 1.0
South Texas 18.0 12.3 6.7 3.7 3.0 1.0 0.7
Upper Rio 13.7 10.0 4.7 1.3 2.7 0.3 0.3
Project GROW Overall 13.7 9.1 4.9 2.4 2.6 0.5 0.6
Note: Scores reflect responses from WFS, WIB & Training provider in each board areas. Responses from CBO are not included because of their limited involvement and are instead presented separately below.
Table 7 aggregates the scores by constituent entities in the local area partnership. As can be observed, scores from Workforce Solutions (career center and WIA/WIOA operators, the WIB staff, and the community and technical colleges are very similar across all headings. The two CBO’s, which were both under-utilized during the implementation period and struggled with getting referrals, had much lower indicators of perceived accomplishment. It is interesting to note that ARRIBA and VIDA, both of which serve as workforce intermediaries, offered no credence to employer engagement efforts on the part of the demonstration.
Table 7. Self-Assessment Tool Scores by Local Area Partner: All WIBs
Type
Avg. Total Score
(Max 22)
Avg. SD Score
(Max 14)
Avg. CP score
(Max 8)
Avg. EE score
(Max 4)
Avg. WT score
(Max 3)
Avg. ASPP score
(Max 1)
Avg. C score
(Max 1)
WFS 13.8 9.0 5.2 2.2 2.6 0.6 0.6
WIB 14.2 9.6 4.8 2.4 3.0 0.4 0.6
CBO 7.0 4.0 3.5 0.0 1.5 0.5 0.5
Training Provider 13.0 8.8 4.6 2.6 2.2 0.4 0.6
49
4:4:004 BUDGET, EXPENDITURES AND LEVERAGE
Budget and Expenditures
WIB budget allocations for Project GROW were determined by formula according to proportionate numbers of clients served by cohort and the estimated cost of services for different sub-cohorts. An expected leverage amount for each WIB from federal and other sources for training, support services, and operational costs incurred serving eligible participants was estimated at just under 30 percent of the original budgeted amount. Table 8 presents the total project budget allocation and estimated leverage contributions to Project GROW by WIB and BWA totals. Funds totaling approximately $3.45 million, supplemented by $1 million in pledged leveraged resources, comprise the total budget across the 52-month award period.41
Table 8. Budget and Target Leverage Amounts by WIB and BWA Total
WIB Budget % of Total Leverage Amount
Cameron 709,415 20.60% 205,593
Lower Rio 783,405 22.70% 227,036
South Texas 591,924 17.20% 171,543
Middle Rio 591,924 17.20% 171,543
Upper Rio 773,915 22.40% 224,285
Total 3,450,582 100.00% 1,000,000
Source: January 2016 Monthly Performance Report (MPR)
By the close of the operational phase at the end of December, 2015, the BWA WIBs had expended $2,009,715.23 or 59 percent of the $3,450,519.00 WIF grant budgeted for direct-funded services. South Texas--as the only WIB to attain 100 percent of its participation target--expended the largest dollar amount ($614,445) and share (95 percent)
41 The initial design also included one million dollars in State General Revenue Fund leverage from training that would qualify for Skills Development Funds (SDF) and that also would meet Project GROW eligibility. Although the Texas Workforce Commission had $1,000,000 available in SDF, the demonstration was not able to find such training throughout the tenure of the Project GROW grant. It also identified in-kind leverage from Business Access initially budgeted to be the difference in the costs for Online Communities, plus the difference in the cost for IHLS and what Business Access actually invoiced. Lower Rio Grande, the grant recipient, decided not to count the “discount” as leverage. The total amount discounted would have been $408,915 for Business Access. (Communications with Frank Almaraz, CEO, Lower Rio Grande Workforce Solutions, May 12, 2016).
50
4:4:004 of its allocation. Cameron and Middle Rio spent the least dollar amounts ($277,459 and $208,965, respectively) and lowest shares (39 percent) of their budget allocations. Cameron is the only WIB in which the enrollment share (33 percent of its enrollment target) is lower than the expenditure share of the budget. Lower Rio and Upper Rio spent about the same amount ($451,954 and $456,892, respectively) and shares (58 percent and 59 percent, respectively) of their allocations, with these shares almost exactly congruent with that of the shares of budget expended for the region as a whole. Figure 11 presents total expenditure amounts by WIB. Figure 12 portrays the expenditures of each WIB area as a share of the total Project GROW budget.42
Figure 4. Project GROW Expenditures by WIB through December 2015
Source: January 2016 MPR
42 Detailed fiscal analysis will be contained in the Cost Effectiveness component of the evaluation, which is scheduled for release in the Fall 2016.
51
4:4:004 Figure 5. Expenditures by WIB as Shares of Total Project GROW Budget
Source: January 2016 MPR
Obviously, under-spending during the operational phase is related to below-target enrollments, yet reported expenditures vary due to several factors as well. These include:
Variants in the types, volume, and costs of services provided. A Medical Receptionist tuition in Continuing Education may cost $1200 per student compared to $4,750 for CDL training.43 Support Services expenditures for occupations varied widely across WIBs, modulated by such factors as work-tools and equipment needed for occupations (e.g., tools and equipment for Welders vs. work-related expenses for Medical Receptionists) or transportation needs that vary by the distances between residences and training provider locations (e.g. Brownsville to Harlingen or Del Rio to Eagle Pass vs. intra-urban commutes in McAllen or El Paso). Per person Sub-cohort budget amounts ranged
43 Short-term CDL training became a popular option in two WIB areas, particularly in the last months of the demonstration, because of foreshortened time horizon that precluded the ability to complete other longer-term training options before the expiration of the grant.
52
4:4:004 from a low of $2,783 for A1 to $8,533 for C1 and C2; the budgeted amount for all other Sub-cohorts was $4,933.44
Variants in billing practices. The training provider may invoice for the true cost of training (e.g., $2,962 for Maintenance & Repair or $2,167 for EMT in Middle Rio), bill a flat $3,750, the budgeted training amount or simply bill for contact hours. Training providers might invoice all or part of training costs at enrollment, or at completion.45 The earlier the billing practice, the less risk of losing payment due to attrition by the training provider. Those that invoice the cap $3,750 training costs can average higher costs training--like CDL which hovers around $4,500 in most sites—with lower cost classroom training. 46
Persistence of the participants in the service regime associated with their sub-cohort. For example, if a participant is receiving education and training sequentially or slightly concurrently, this individual may drop out prior to beginning the next intervention in their service plan or before the mandatory billing date. WIBs with higher attrition rates were less likely to spend down their training and CBO dollars.
Variants in service delivery structure. For example, sites may have fixed costs for specialized staff who are assigned on an ongoing full-time basis to Project GROW, such as a dedicated case manager or outreach/intake coordinator. Others had more generic staff who occasionally had contact with GROW participants alongside service delivery tasks of other workforce activities. Expenditures for the latter fluctuate with caseload or services.
Leverage
Leveraged resource amounts reported by WIB through January, 2016, are dramatically uneven. (Figure 6) WIBs report leverage amounts by completing and submitting a standardized Leverage Resource Report developed specifically for Project GROW. Sources of leverage include WIB staff time dedicated to Project GROW, services and activities provided to participants from other funding sources, such as WIA/WIOA support
44 These amounts exclude the costs of the IHLS ($3,500) invoiced to LRG as grant recipient and include the costs of Intensive Case Management for C1 and C2. Appendix C contains the Sub-cohort per participant budget. 45 The amount available for the occupational training in the career pathway also had some variation due to the costs of the ESL/ABE/GED or College Readiness education components. These may be fully or partially leveraged with none or some of the expensed included in the $3,750 available for supplemental education and occupational training tuition and fees. 46 Although costs for CDL training vary across sites, it generally exceeds the $3750 training cap, up to as high as $4950 per enrollment in one site. A college may pay the full price for each enrollee, recovering the overspending by averaging the expense with lower cost training or funds leveraged from another source.
53
4:4:004 services and Adult Education and Literacy funds for ABE/ESL/GED, and other labor and resource contributions not paid for by the demonstration,
Lower Rio Grande has reported $528,927 in leverage value—fully 233 percent of its $227,036 assignment. At the other end of the spectrum, Cameron has reported $41,234 or 20 percent of its$205,593 leverage target. Middle Rio Grande --at $94,441—has accounted for 55 percent of its $171,543 leverage target. Upper Rio--at $82,464 or 37 percent of its 224,886 leverage target—splits the difference between Cameron and Middle Rio. South Texas has reported $218,268 leveraged resources or 127 percent of its $171,543 target and is the only WIB to exhibit expenditures/leveraged resources rate near the 30 percent budget formula. Figure 7 indicates that WIBs have achieved 97 percent of the leverage resource target overall for Project GROW, and that the regional success is carried almost entirely by the Lower Rio Grande.
Figure 6. Leveraged Project GROW Amounts by WIB through December 2015
Focusing solely on these preliminary values, researchers calculated a crude estimated cost per participant as a function of the expenditures and the number of participants enrolled.47 The BWA as a whole enrolled 426 participants at a reported total WIF grant expenditure of $2,009,715 or a cost per participant of $ 4,798. The crude cost per participant in Lower Rio ($4,966), South Texas ($4,690) and Upper Rio ($4,436) are very similar to this overall cost per participant and to each other. Cameron ($6,166) is the outlier at the high end, and Middle Rio ($3,732) is the outlier at the low end.
47 A more refined estimated cost per participant calculation will be contained in the Cost Effectiveness Analysis (scheduled for the Fall 2016) after establishing the consistency, comparability, and reliability of the expenditure and leverage data from the five WIBs and the Grant Recipient.
55
4:4:004 PROJECT GROW CLIENT FLOW PROCESSES
The implementation analysis for this report assesses Project GROW as it progressed from the planning and design stage through the final operational phase, a timeframe broadly encompassing the period of August 2012 through December 2015. Client flow in Project GROW is composed of distinct components (see Table 9). In this chapter, we closely examine each component of the client flow. We document implementation, note adjustment made over time, note variations across and within sites, document challenges and barriers to implementation, report preliminary outcomes, and highlight success stories and best practices.
Table 9. Client Flow in Project GROW
COMPONENT DESCRIPTION
Outreach To instigate prospective interest and provide basic information about Project GROW;
Intake and Registration Encompassing preliminary registration, follow up, and pre-screening of prospective participants
Eligibility Determination Based on TABE scores, WIA eligibility, suitability of training, and other requirements
Case Management To develop and monitor service plans, to address support service needs and aid with persistence, and to complete the training
Job Readiness, Job Search, and Job Development Assistance
To assure job entry
Follow-Up Services To support job retention and advancement in a career pathway.
OUTREACH
Project GROW partners assigned significant time and effort to a broad array of outreach practices and strategies. The most common forms of outreach were through information sessions at WIA and workforce center orientations; posters and flyers at Workforce Solutions Centers and training provider campuses; and the Project GROW
56
4:4:004 website48. Other common outreach practices consisted of Public Service Announcements (PSAs) and presentations at local ISDs, high schools, dropout recovery/alternative schools, and adult education centers, as well as at community-based organizations. One Workforce Center advertised Project GROW opportunities on its electronic banner fronting the parking lot. Some WIB areas used Twitter and Facebook to reach potential clients. “Success stories” of graduates were featured on the Project GROW website as part of the marketing effort.
WIBs also offered “stand alone” Project GROW orientations as part of their outreach and recruitment efforts. These orientations were linked to various outreach strategies distinguished by
combinations of geography/location, occupations/career pathways, and cohort target groups. Outreach strategies included a more generalized “blanket outreach” within the active service catchment49 aimed at attracting a broad response from individuals who were interested in any of the selected trainings. More commonly, outreach was targeted to specific occupations and/or cohorts.
Those who “showed” were pre-screened and could advance through eligibility and enrollment. The eventual “shake out” determined which cohorts and trainings had
48 A few offices used the website as the computer screensaver in their Career Center resource areas. In addition to the informative value of the Project GROW website, each WIB was encouraged to predominantly display Project GROW on its own website homepage. 49 As noted earlier, partners may or may not have offered complete geographic coverage for Project GROW within their area as a result of population density and spatial coverage, and may have shuffled participating offices.
“I first heard about Project GROW from a flyer I received when visiting my local Workforce Center. I decided to apply for the training when I found out that it was offering a GED, which I very much needed plus a Medical Receptionist Certificate which is a field I am interested in.”
-Alyssa C.
57
4:4:004 sufficient numbers to be initiated. However, low outreach responses, misalignment of client interests and availability, and low eligibility rates by cohorts constrained the effectiveness of the process. It was difficult to schedule or fill training slots and to coordinate training starts due to an insufficient number of recruits.
INTAKE AND REGISTRATION
Web-Registration and Public Access Queue
Intake often began with self-registrations on the Project GROW website. Submission of contact information placed persons in a Public Access Queue, from which prospective clients were drawn for staff follow-up. Individuals may have found the website on their own or through outreach media, and were regularly directed to register at group orientations; by the front-end staff at the Career Center; and by instructors, counselors, and other personnel of the training providers. Individuals interested in Project GROW’s training opportunities could also provide basic personal and contact information on the limited intake form found at the Career Centers. Career Center staff would follow-up and pre-screen these interested individuals.
Business Access designed the Public Access Queue to “push” clients through to formal intake. Residential contact information was geocoded to the county and WIB area, and the Project Coordinator “cleaned” the queue weekly by sorting and assigning clients to their respective WIB area. Designated staff at the WIB or Career Center could pull down the list in the queue and, by selecting a name, auto-populate the respective fields in the ASPP database. As designed, this enabled local staff to contact the person, pre-screen for eligibility, and possibly refer the person to a group orientation, directly to a formal individual intake appointment, or to a consultation with a WIA Career Counselor/Case Manager.
Project GROW regularly reported initial registrants in the “ASPP Data Entry” count in the Monthly Participation Report (MPR), a management report prepared by the Project Coordinator, once the case was opened in ASPP by the designated local staff. In addition to those who independently self-registered on the Project GROW website, this count included walk-ins, internal referrals at the Workforce Center, and referrals from the training providers or others who had provided limited information and whose cases had been opened in ASPP. This pool was available for pre-eligibility screening and eligibility determination upon passing the screen.
58
4:4:004 ASPP Registration Patterns
ASPP registration for Project GROW began in February 2013 and continued through September 2015 (see Figure 8). Monthly registrations ranged from a low of 20 in February 2013 to a high of 1,004 in April 2015. ASPP registration appeared to begin slowly and steadily in the spring of 2013 with a sharp increase in the fall of 2013. Registration stayed steady for a few months at the end of 2013 before declining in the first half of 2014 and increasing through December of 2014. After a drop in January 2015, ASPP registration increased to its peak high of 1,007 in April 2015 and has declined since. As of December 30, 2015, a total of 9,314 individuals had been registered in ASPP in GROW.
Figure 8. Intake and Registration Over the Program Implementation Period
ASPP registration across the WIBs varied considerably (see Figure 9), ranging from a high of 4,575 in the Upper Rio Grande to a low of 274 in Cameron.50 These outliers were related to outreach and initial intake practices. Cameron began to register participants in Project GROW after they completed the initial WIA service sequence, in effect adding a de
50 Most of Upper Rio’s ASPP data entry count occurred after December 2014 when an intern (later to become FTE) aggressively pursued potential clients from the queue as well as locally generated lists of individuals in WIT or current workforce services who seemed appropriate for services based on job interests or apparent eligibility qualifications. The low number in Cameron is a function of the aforementioned practice of requiring completion of WIA service sequencing prior to GROW eligibility determination. Cameron’s Workforce Solutions did attempt to enroll Cohort C participants from among 54 adult basic education students with limited English proficiency, nearly one-third of whom were foreign born. All of the prospective participants scored below the 6th grade equivalence in at least one of the TABE sections. Unable to meet this minimum requirement, none were eligible for Project GROW.
59
4:4:004 facto behavioral screen. Late in the demonstration, Upper Rio Grande/Borderplex brought an intern on board, which evolved into a full-time position to follow-up on the Public Access Queue, as well as to contact hundreds of individuals who had expressed interest in target occupations drawn from WIT. WIB variation was influenced by a number of other inter-related factors, including:
• differences in the number, type, and success of outreach and marketing methods across sites;
• failure to accurately capture interested individuals in the ASPP system due to error, oversight, or underutilization of the ASPP system (as noted in the previous section); and
• variance between sites in the structured responsibility for follow-up with interested individuals in the Public Access Queue.
Figure 9. Recruitment Across the 5 WIBs
Variations in Follow-Up Protocols
WIBs and Career Centers structured administrative responsibility for follow-up and full registrations differently, but basically three general structures could be identified:
1. single point of contact (SPOC) model wherein a dedicated career counselor/case manager or other staff served as the WIB area specialist for Project GROW;
60
4:4:004 2. modified SPOC model in which a dedicated career counselor/case manager in
the WIA unit at the Career Center served as the Project GROW intake specialist for that specific office; and a
3. diffused model in which intake may have been conducted by one of a number of career counselor/case managers within the WIA unit at the Career Center.
The SPOC or modified SPOC proved to be the more effective approaches for implementing the complex and challenging features of the demonstration because it concentrated authority and accountability. As such it facilitated clear “messaging” to clients and partners. Lower Rio Grande was the only site that followed the SPOC model exclusively. The WIB and C2GPS, the local workforce contractor, originally assigned a special projects coordinator who served as a dedicated career counselor, housed at the WIB office, to follow-up on self-registrants and referrals, guide the eligibility process, and provide ongoing case management to those enrolled. As the number of participants grew, a dedicated career counselor was also assigned to the WIB office. The two retained the lead responsibility for registration and partner relations, working closely with the C2GPS Program Manager and frontline staff at the Career Centers. After completion of Project GROW commitment, the Project GROW career counselor transferred case management responsibilities to WIA career counselors at one of the three workforce centers in the WIB area for job readiness and placement services.
Cameron used the diffused model, having decided that Project GROW funds were insufficient to dedicate a full-time staff assignment and that clients were better served when “mainstreamed” with WIA clients in the Career Centers. Individuals in the queue were assigned to career counselors in the Career Centers for intake processing. Southwest Keys and the Cameron WIB required that prospective demonstration participants must not only be WIA eligible, but also complete the WIA service sequence of core and intensive services prior to an offering of one of Project GROW’s pathway trainings. Originally both the Brownsville and Harlingen offices handled Project GROW participants; late in the project all cases were handled by the Harlingen Office.
The remaining three WIBs and their contractors originally followed a modified SPOC model; Upper Rio Grande and South Texas later moved toward the more unified SPOC approach. Initially, a single career counselor with a full WIA caseload had responsibility for follow-up, registration, pre-screening, and case management at a single office (Main Street) serving Project GROW in Upper Rio. Mid-project, Upper Rio began to distribute
61
4:4:004 responsibilities across three offices. Finally in December 2014, Upper Rio Grande brought on an intern outreach coordinator to follow-up and pre-screen self-registrants, referring promising prospects to one of the career counselors at the three El Paso offices. By the last year of the project, the services were again concentrated at a single office where a project lead, career counselor, and resource navigator administered Project GROW. The outreach coordinator referred promising prospects to that office. After completing their Project GROW commitment, participants were referred back to a case manager at the local office closest to their residence.
South Texas re-bid their workforce services in 2014 and awarded the contract to C2GPS and the area quickly adopted the SPOC model used in Lower Rio Grande. Middle Rio Grande and MRGDC assigned a Project GROW lead in each of the three Project GROW offices, supported by a high level of coordination of WIB, contractor, and training provider personnel.
ELIGIBILITY DETERMINATION
Project GROW eligibility determination was a multi-step process that involved meeting demonstration-specific criteria related to target population and cohort assignment (age, education attainment, TABE scores, TSI scores, etc.) and WIA eligibility requirements.51 Service flow required melding WIA procedures and Project GROW procedures in a seamless manner. After positive pre-screening, the staff person assigned to Project GROW intake guided the eligibility process through enrollment. Regular eligibility specialists determined that WIA requirements were met according to standard procedures and case managers assured that adequate occupational and aptitude assessment tools (AVIATOR, Cops/CAPS, etc.) verified the suitability of training for the WIA participant.
Although these practices were standard, frontline staff occasionally reported reluctance to determine eligibility and enroll prospective Project GROW participants in WIA when the cohort training they sought was not scheduled to start or recruiting the minimum cohort size (established by the training provider) was unlikely. Eligibility and other staff were concerned that the 45-day window for initiating WIA services would expire prior to the desired training start and eligibility would lapse. WIA trainings must begin within this
51 To a much lesser extent, but nonetheless a consideration, individuals may have had to meet the readiness standards of continuing or regular academic classes for entry into a mainstream curricula at the college. For example, a Cohort A or B participant may have been required to have a 10th grade equivalency in Math on the TABE to qualify for health or technology courses in which they were combined with other students. Although, under the terms of their agreements, colleges had developed suitable curricula for the target group and cohorts, situational constraints may have occurred that needed to be addressed.
62
4:4:004 period or eligibility or must be re-determined, requiring additional time and effort from the eligibility specialist, the WIA case manager, and the client. Prospective participants often lost interest or were no longer available if required to wait long to start their cohort and selected training regime.
Project GROW required developing and introducing new practices for integrating TABE and TSI assessment test scores into the eligibility process, and WIBs approached testing and information sharing in several ways. TABE test scores that fell within the specified range were a primary requirement for Project GROW eligibility and cohort assignment. As noted earlier, new college readiness standards and assessments were being codified under TSI, and responsibility for Adult Education programs had recently transferred to the Texas Workforce Commission. For adult education assessment, Project GROW required that TABE pre/post testing methods be consistent within the WIB area, but not across all participating WIBs. As a result:
• in four of the five WIBs, the test was administered prior to determining WIA eligibility; only Cameron determined WIA eligibility prior to TABE testing;
• the location of the testing varied between WIBs. The TABE test was administered either at the Career Center or at the college assessment center, and at both in at least one instance;52
• state workforce and project policy did not yet specify procedures and permitted WIBs to use different versions of the test (Locator, Survey, and battery) and testing/scoring methods (computer or paper versions); and
• Project GROW also did not specify which entity or funding source paid for the TABE test. Funding may have been provided from Wagner-Peyser, WIA, adult education, postsecondary sources or written into the Project GROW contract. There was no standard practice for payment across WIBs, streamlining access to tests, and sharing test scores.53
52 Under adult education program requirements, pre/post testing of learning gains must be consistent. In this instance, South Texas and Laredo Community College used different versions of TABE. Post-testing was the responsibility of the training provider in Project GROW, and if pre-testing at the Career Center was inconsistent with that test, the ABE provider was required to retest at baseline using their preferred version and method. Partners resolved this disconnect and LCC took over TABE testing. 53 Although ASPP was structured to share test scores and other client information, its use was not evenly adopted within and across all sites—particularly for sharing test scores and information between the Career Center and postsecondary staff. Who delivered and paid for TABE tests was a result of alignment process that Boards and their providers underwent, and the flexibility they had to identify the approach that worked best for them.
63
4:4:004 TABE test scores within specified ranges proved to be a major eligibility challenge to
cohort assignment and enrolling training cohorts. With few exceptions—for example, Cohort C Training for Medical Receptionists in Lower Rio Grande and Cohort A Training for Medical Office Assistants in Middle Rio Grande—discussions with partners made clear that TABE scores outside of specified ranges hampered enrollments and training starts. WIBs reported instances where Cohort B recruits for a scheduled training tested out as Cohort C and Cohort C recruits tested below the 6th grade level. TSI scores affected entry as well. In Cameron, 6 of 9 recruits for Cohort A EMT pathway were determined ineligible because they had passed college readiness assessment test or had prior training in the occupational field. As a result of these challenges, WIBs and training providers discussed changing the skill level range assumptions for each cohort. After much discussion, the Project GROW partners decided to maintain the original criteria.
Project GROW’s original design called for training cohorts to be in the 12-15 student range, but sites were rarely able to attain this number to schedule and begin the career pathway sequence, resulting in starting with a smaller class size or postponing training starts. The cohort training approach did not meet expectations, and several sites moved to enrolling very numerically small cohorts or even single individuals in order to initiate training, as well as “braiding” GROW participants with other similar groups of VAST and Accelerate Texas participants.54
Eligibility Patterns
Among the 9,314 individuals registered in the ASPP database, only 425 (5 percent)
were determined eligible for Project GROW. Eligibility approval rates as a share of all those in the ASPP database varied across the 5 WIBs (see Figure 10), and were highest for Cameron (16%) and South Texas (15%), and lowest for Upper Rio Grande (2%). However, these statistics should be interpreted with care, due to the previously noted variations in outreach, recruitment, and enrollment.
54 This braiding or more specifically paying for training out of other funding sources led to the disqualification of an EMT cohort at EPCC from Upper Rio’s participation and performance measures since Project GROW did not pay for the training. Two of the completers had even continued to immediately advance along the career pathway, one becoming a Licensed Vocational Nurse and the other a paramedic.
64
4:4:004 Figure 10. Eligibility approvals by WIB
Non-Eligibility Reasons
ASPP captured follow-up results from the queue or other in-house lists (pre-eligibility determination screening results) and non-eligibility reasons (post-eligibility determination results)in the same pull-down screen, confounding the distinction between those who may or may not have been pre-screened and their reason for not continuing thru eligibility determination with those who actually completed the eligibility process. For the 8,889 individuals who were not determined eligible for Project Grow, any reason was missing for about half of these individuals (n=4,505).55 Since inclusion in the ASPP data count minimally required some attempt at prospective client contact, it may be that data simply was never entered into the ASPP.
55 Put simply, it would be a bit of a stretch to indicate that nearly 9000 eligibility determinations were conducted for Project GROW.
65
4:4:004 Figure 11. Non-Eligibility Reasons
Among the 4,384 individuals with a “non-eligibility” reason recorded, “unable to contact” was the most frequently recorded reason (see Figure 11); half of individuals (n=2,280) who had expressed interest in GROW did not continue with intake/eligibility procedures because contact was attempted but could not be made. Recall that this may include individuals on internally generated lists as well as the queue. Other frequent non-eligibility reasons were “other” and “not interested”. As administrators and staff pointed out during site visits, many individuals lost interest when they fully understood the time commitments for the education and occupational training aspects of the services regime. As Figure 7 reveals, 14% of individuals (n=635) who had initially expressed interest in GROW were not interested in the trainings offered by Project GROW. Two other commonly cited non-eligibility reasons were “low TABE score” (n=187), “incomplete application” (n=178) and “not available for class times” (n=140).
Table 10 breaks down the non-eligibility reasons by board area and shows how the pre-screen and actual non-eligibility results have been merged. It is immediately apparent that the vast majority of individuals marked as “unable to contact”, occurred in Upper Rio Grande, again likely related to internally generated lists that the outreach intern used. These numbers primarily reflect recruitment efforts rather than non-eligibility. It is clear that South Texas was not entering data into ASPP. Cameron, Lower Rio , and Middle Rio appear to have entered true reasons for non-eligibility; the “missing” data refers to those in
66
4:4:004 the queue who had expressed interest, but may have changed their minds and not applied after hearing requirements or were screened out. Additionally, “missing” in Lower Rio in part is related to follow up by C2 GPS staff with prospective participants on a list provided by South Texas College of individuals who had previously taken and failed the college readiness assessment. Apparently the reasons for non-interest were not recorded at the time contact was attempted
Table 10. Non-Eligibility Reasons, by Board Area
Non Eligibility Reason Cameron,
n=229
Lower Rio
Grande, n=2497
Middle Rio
Grande, n=936
South Texas, n=755
Upper Rio
Grande, n=4472 Total
Criminal background 3 25 0 0 1 29
Incomplete Application 1 173 3 1 0 178
Not Available for Class Times 10 45 5 0 80 140
Not Interested 20 79 33 0 503 635
Not Suitable/Past Participation 1 1 0 0 1 3
Not WIA Eligible 1 94 26 3 2 126
Other 22 66 101 11 603 803
TABE/High 0 3 0 0 0 3
TABE/Low 16 123 20 0 28 187
Unable to Contact 0 26 17 0 2237 2,280
[Missing] 155 1,862 731 740 1,017 4,505
Demographic Characteristics of Eligible Individuals.
A rich array of demographic information was collected on individuals approved as eligible for Project GROW, through the ASPP data system. However, there was widespread inconsistency in demographic data captured across the WIB areas. As a result, a number of demographic fields in the ASPP data system are missing information for a majority of participants. The amount and extent of
“After four intense months I received my GED on September 28, 2014. That was the happiest day of my life and the beginning of a new chapter.”
Kimberly P.
67
4:4:004 missing data for GROW participants in the ASPP system suggests that ASPP was not utilized effectively. Again, duplicative data entry is a likely influence on its under-utilization. The inter-site variation in data entry for ASPP also supports the position that unassigned or loosely defined responsibility contributed to the inconsistency in data entry for ASPP.
Demographic characteristics indicate that the majority of GROW participants were female, Hispanic/Latino, single, first generation post-secondary, and currently receiving SNAP and/or TANF assistance (see Table 11). It is significant that nearly three-quarters of the participants are the first generation in their families to have access to postsecondary education; the depth of this representation is a remarkable accomplishment of Project GROW.
Table 11. Demographic Characteristics of GROW Participants
Demographic characteristic %
Gender Female 68%
Ethnicity White/Caucasian 1%
Black/African American 1%
Hispanic/Latino 61%
[Race missing] 35%
Marital Status Divorced/Not Remarried 10%
Married 26%
Single 64%
Household Characteristics Family size>4 21%
Number of dependents >2 40%
Disability Status Disabled 3%
Veteran Status Is a veteran 1%
First Generation Postsecondary 70%
First Generation US Citizen 45%
Currently Receiving Assistance (FS/TANF) 80%
The ASPP data system also collected information on individuals’ limited English proficiency status, number of years of formal education, and highest degree attained at
68
4:4:004 intake. Unfortunately, due to inadequate data entry, the extent of missing data for these fields is great and thus we are unable to examine these characteristics for Project GROW participants.
Demand Occupation Interest
The ASPP data indicate that two-thirds of GROW participants (68%) were interested in health occupations including the Medical Assistant, Medical Record & Health Information Techs, Health Information Coding Clerk, and First Responder occupations (see Figure 12).56 About a tenth of participants were also interested in the Commercial Drivers License (CDL) training and Maintenance and Repair occupations. Smaller shares chose Welding and Construction Carpentry.57
Figure 12. Demand Occupation Interests for GROW Participants
56 As discussed earlier, WIBs offered various credentials and skills sets under these categories. For example, Medical Receptionist included administrative (Medical Office) and direct services training (Clinical Medical Assistant), either of which might offer Medical Record & Health Information training, Maintenance and Repair may include Welding. First Responder includes ECA and EMT Basic. 57 Welding was a late stage option in Middle Rio Grande. Construction involved Cohort B Youth Build students rolled into Project GROW early on in Upper Rio.
69
4:4:004 Concentrations of occupational interest by WIB area are apparent (see Table 12).58 A
majority of participants from Cameron, Lower Rio Grande, Middle Rio Grande, and South Texas were interested in the Medical Receptionist occupations. The second most popular occupations were Maintenance and Repair in Cameron; Medical Record & Health Information Coding in Lower Rio Grande; and CDL training in Middle Rio Grande and South Texas. By contrast in Upper Rio Grande, First Responders (EMT) was the most popular occupation.
Table 12. Variation in Demand Occupation Interest Across the 5 WIBs
Cameron Lower Rio
Grande
Middle Rio
Grande South Texas
Upper Rio Grande
n=45 n=91 n=55 n=131 n=103
Commercial Drivers License (CDL) 0% 5% 36% 20% 2%
Construction Carpenters (Upper Rio ONLY) 0% 0% 0% 0% 3%
First Responder 0% 14% 2% 0% 25%
Maintenance and Repair 38% 12% 2% 2% 14%
Medical Receptionist 62% 47% 49% 77% 8%
Medical Record & Health Information 0% 21% 5% 0% 19%
Welding 0% 0% 5% 1% 0%
Interests in the demand occupations also varied by gender (see Table 13). The vast majority (87%) of female participants were interested in allied health occupations. The most
popular allied health occupation among female GROW participants was Medical Receptionist (67%), although small proportions of female participants were also interested in the Medical Record and Health Information (13%) and First Responders (7%) occupations. A small proportion of female participants were also interested in the CDL trainings (4%).
58 Again, these distributions should be interpreted with caution. They are the occupational interests of participants, not applicants. Enrollments, cohort formation, and occupational interests served (demand) are modulated by postsecondary course availability (supply), as well as Cohort/Sub-cohort performance targets and the appropriateness of the training in relation to the variable capacity of the Cohorts.
“With the help of Project Grow I am now have my GED and a trade in the Medical Field. I can better my life for me and my daughter.”
Andrea C.
“Thanks to Project GROW I am now ready for a career with a steady income and not just a job.”
-Kassandra F
70
4:4:004 Table 13. Variation in Demand Occupation Interest by Gender
Female Male
n=289 n=136
Commercial Drivers License (CDL) 4% 31%
Construction Carpenters (Upper Rio ONLY) 0% 2%
First Responder 7% 15%
Maintenance and Repair 0% 32%
Medical Receptionist 67% 10%
Medical Record & Health Information 13% 3%
Welding 0% 3%
About a third of male participants were interested in the CDL trainings (31%), another third were interested in Maintenance and Repair occupations (32%), and a little less than a third were also interested in the allied health occupations (28%). Small proportions of male participants were also interested in the Welding (3%) and Construction Carpentry (2%) occupations.
ENROLLMENT, PARTICIPATION, AND SERVICE DELIVERY
Service Cohorts
Following the program design, individuals determined as eligible for Project GROW were partitioned into three service cohorts (Cohorts A, B, and C) based on academic ability as determined by Tests of Adult basic Education (TABE) scores, secondary education credentials, and college readiness.
Overall Project GROW served mostly students in Cohort B and Cohort C (see Figure 13). A little over a third of Project GROW participants were individuals enrolled in Cohort C who functioned below high school equivalency levels and required adult basic education and ESL. Nearly half of Project GROW participants were individuals enrolled in Cohort B who were without a secondary credential, but generally functioned within the 9th through 12th grade levels. Only a fifth of Project GROW participants were individuals enrolled in Cohort A who already had a high school diploma or GED, but were not college ready. Table 14
71
4:4:004 compares target participant counts and final participant counts, broken down by sub-cohort.
Figure 13. Overall Service Cohort Distribution
Table 14. Project GROW Targets and Final Participant Count, by Cohort
Original Targets
Revised Targets
Final Counts
% of revised target
achieved
Cohort A A1 60 60 0 0
A2 165 165 79 48%
Cohort B B1 120 225 187 83%
B2 105
Cohort C C1 45 42 37 88%
C2 45 48 22 46%
C3 60 76 52 68%
C4 60 44 48 109%
Total 660 660 425 64%
72
4:4:004 Figure 14 shows the proportion of students in each cohort served in each of the five
board areas. Cameron only served participants in Cohort B. Participants in Lower Rio Grande were evenly split between Cohort B and Cohort C. Upper Rio Grande, Middle Rio Grande and South Texas served participants in all three cohorts.
Figure 14. Service Cohorts by WIBs
Service Sub-Cohorts
One of the unique features of Project GROW was its effort to demonstrate effective services for Border residents on the margins of economic viability by further triaging participants in service cohorts into subgroups (see Figure 15). Cohort A1 and A2 were distinguished by access to intensive case management (ICM) and VIDA’s College Readiness Academy (A1) or not (A2). Cameron and Lower Rio, who both had thirty of each as participation targets, served none of either. Cohort C was split into four sub-cohorts based on access or not to intensive case management and the In Home Learning System (IHLS) One third of Cohort C participants were enrolled in subgroup C3 (IHLS), nearly another third were enrolled in subgroup C4 (no IHLS, no ICM), while about a quarter were enrolled in subgroup C1 (ICM, IHLS). Subgroup C2 (ICM) had the lowest number of participants. Figure 16 documents the distribution of Cohort C sub-groups by WIB.
73
4:4:004 Figure 15. Sub-Groups by Cohort
Figure 16. Distribution of Cohort C Sub-Groups by WIB
74
4:4:004 Program Participation
Figure 17 examines service delivery to Project GROW participants, broken down by cohort. Overall, services provided to Project GROW participants align with the service delivery models deigned for the cohorts. Nearly all (97%) of the participants in Cohort A received study skills instruction. Nearly as large of shares of the participants in Cohort B and Cohort C (92% and 87% respectively) received GED instruction. Nearly all of the participants in Cohort C (99%) received ABE/ESL instruction. While a majority of the participants in Cohort A and Cohort B (99% and 88% respectively) received occupational skills training, only half of the participants in Cohort C (49%) received occupational skills training. Recall that occupational skills training was included as part of the intervention only for Cohort C participants in three WIB areas.
Figure 17. Service Delivery by Cohort
Table 15 examines service delivery by cohort and board area. As noted previously, services provided to Project GROW participants aligns with the service delivery models designed for the cohorts. Note, too, that while Upper Rio Grande had 10 Cohort B
“This training was awesome. It helped me to get my GED, complete ECA training and most importantly it allowed me to make my family proud.”
-Rodolfo S
75
4:4:004 participants, they were not recorded as receiving GED instruction in TWIST.59 The variation in numbers enrolled in different activities within the same cohort reflects service sequencing and attrition. For example, all 45 Cohort B participants may have shown up for training, but never started the GED component, whereas all 46 Cohort B participants in Lower Rio Grande started GED classes and 2 dropped out before sequencing into occupational training.
Table 15. Service Delivery by Cohort and Board Area
# assigned to
Cohort
# receiving Occupational/Vocational
Training
# receiving college
readiness instruction
#receiving GED
instruction
# receiving ABE/ESL
instruction
Cameron
Cohort A 0
Cohort B 45 45 0 41 0
Cohort C 0
Lower Rio Grande
Cohort A 0
Cohort B 46 44 46
Cohort C 45 36 41 45
Middle Rio Grande
Cohort A 13 13 13
Cohort B 30 20 29
Cohort C 13 9 1 12
South Texas
Cohort A 30 29 30
Cohort B 56 45 56
Cohort C 45 32 40 45
Upper Rio Grande
Cohort A 36 36 34
Cohort B 10 10 0
Cohort C 57 57 56
59 This data anomaly will be resolved prior to processing final outcomes data in July, 2016. The 10-person Cohort B for Medical Office Specialist began June 1, 2015, followed by GED classes the next day, yet only the occupational training data registered.
76
4:4:004 Program Completion
Table 16 lists program completion for Project GROW overall. Two-thirds of Project GROW participants completed their occupational vocational training, while half successfully completed their occupational vocational training. For occupational vocational training, successful completion means that the participant attended all occupational training classes and did receive the credential, while unsuccessful completion means that the participant attended all occupational training classes but did not receive a credential because they did not pass the exit or licensing exam.
A vast majority of Project GROW participants (in Cohort A) successfully completed their college readiness instruction. However, while nearly three-quarters of Project GROW participants (in Cohorts B and C) completed their GED instruction, less than one quarter successfully completed their GED training. For GED trainings, successful completion means that the participant attended all GED classes and received their GED, while unsuccessful completion means that the participant attended all GED classes but had not received a GED.
Table 16. Service Delivery by Cohort and Board Area
Training type %
Completed % Successfully
Completed
Completed occupation/vocational training 65% 51%
Completed college readiness instruction 89% 89%
Completed GED instruction 72% 21%
Figure 18 examines program completion broken down by cohort. Vast majorities of Cohort A and Cohort B participants completed their occupational vocational training, while more than half successfully completed their occupational vocational training. Notably, a
third of Cohort A participants unsuccessfully completed their training (29%), likely due to the fact that many were unable to complete final licensing and credentialing. Less than half of Cohort C participants completed occupational vocational training and about a third successfully completed occupational vocational
“The Project GROW program helped me to develop skills as well as to acquire knowledge in the HVAC area.”
Marco V
“Project GROW gave me the opportunity to achieve knowledge and tools to pass my national (EMT) certification.”
Michael C.
77
4:4:004 training; recall however, that Cohort C training was not required and note that half of Cohort C participants did not receive any occupational vocational training.
Figure 18. Program Completion by Cohort
A vast majority (89%) of Cohort A participants successfully completed their college readiness instruction. While three-quarters of Cohort B participants completed their GED instruction, less than a third successfully completed by attaining their GED (30%). Successful completion rates among Cohort C participants was even lower; while two-thirds of Cohort C participants completed their ESL/ABE/GED instruction, only a tenth of Cohort C participants successfully completed by attaining their GED (9%). Recall however that GED attainment was not a target outcome for Cohort C, but rather a welcome achievement, as well as the negative effects of new GED test on pass rates discussed earlier.60
Credential Achievement
60 Recall that Educational Learning Gains was a performance measure linked to Cohort C progress. This analysis is based on TWIST data and terminology.
78
4:4:004 The following figures examines credential achievement for all Project GROW
participants. Half of all Project GROW participants earned an occupational credential; recall however that only half of Cohort C participants received occupational vocational training, and neither Cameron, which served no Cohort C, nor Upper Rio Grande, which served 57 or 35 percent of all Cohort C, provided training to that group. Only 16% of Project GROW participants earned a GED (23%); note however that (a) only Cohort B and a portion of Cohort C received GED training, and (b) GED attainment was not a target outcome for Cohort C.
Figure 19. Overall Credential Achievement61
Figure 20 and Figure 21 examine outcomes broken down by cohort:
• half of Cohort A participants and nearly two-thirds of Cohort B participants earned an occupational credential, certificate or license. Only a third of Cohort C participants earned an occupational credential, certificate or license; recall however that only half of Cohort C participants received occupational vocational training; and
• GED receipt rates were poor. Less than a third of Cohort B participants earned a GED. Only a tenth of Cohort C participants earned a GED; recall again that GED attainment was not a target outcome for Cohort C, as well as the notable reduction in the pass rate with the introduction of the new GED.
61 “Missing” category for GED and credential receipt outcomes indicates that no GED/credential receipt was recorded in the TWIST system; this category is composed of individuals who either did not receive the training, or did not successfully complete the training.
79
4:4:004 Figure 20. Percent Earning Occupational Skills Credentials, by Cohort62
Figure 21. Percent Earning GED, by Cohort
62 “Missing” category for GED and credential receipt indicates that no GED/credential receipt was recorded in the TWIST system; this category comprises of individuals who either did not receive the training, or did not complete the training.
80
4:4:004
Table 17 examines the participant counts for each cohort and outcome. In the following figures, outcomes are broken down by cohort and WIB to identify regional differences.
Table 17. Participant Counts by Cohort
# Assigned
# Received Occupational
Training
# Earned Occupational
Credential
# Received GED
Instruction # Earned
GED
Cohort A 79 78 41
Cohort B 187 164 114 172 55
Cohort C 159 77 58 139 15
Figure 22 examines occupational credential receipt broken down by cohort and WIB:
• Cohort A participants in Middle Rio Grande and South Texas had high credential attainment rates (69% and 83% respectively). Only 19% of Cohort A participants in Upper Rio Grande earned an occupational skills credential.
• Cohort B participants in Cameron had the highest credential attainment rates (80%), followed by Cohort B participants in Lower Rio Grande and South Texas (61% and 66% respectively). Less than half of Cohort B participants in Middle Rio Grande (40%) earned an occupational skills credential. However, only 10% of the Cohort B participants in Upper Rio Grande earned an occupational skills credential.
• More than half of Cohort C participants in Lower Rio Grande, Middle Rio Grande and South Texas had earned an occupational skills credential; recall however that only half of Cohort C participant received occupational vocational training.
81
4:4:004 Figure 22. Percent Earning Occupational Skills Credentials, by Cohort and WIB63
Figure 23 examines GED attainment, broken out by cohort and WIB.
• GED attainment rates were highest in Lower Rio Grande, where nearly two-thirds (65%) of Cohort B participants earned a GED.64 Nearly half (41%) of the Cohort B participants in Middle Rio Grande earned a GED. However, only 18 % of Cohort B participants in Cameron and 9 % of Cohort B participants in South Texas earned a GED.
63 “Missing” category for occupational credential receipt indicates that no occupational credential receipt was recorded in the TWIST system; this category most likely comprises the individuals who either did not receive the training, or did not successfully complete the training. 64 Recall once more that nearly half of these were awarded during the first nine month enrollment ending in December, 2013, prior to the new GED required during the last two full years of implementation.
82
4:4:004 • Only 16 % of Cohort C participants in Lower Rio Grande, 8% of Cohort C
participant in Middle Rio Grande 3% of Cohort C participants in South Texas, and 11% of Cohort C participants in Upper Rio Grande earned a GED.
Figure 23. Percent Earning GED, by Cohort and WIB65
EMPLOYMENT ENTRY AND FOLLOW-UP SERVICES
Towards the end of training, Project GROW participants received job readiness, job search, and job development/job placement assistance to assure successful employment entry. WIA Career Counselors, working closely with Business Service Representatives (BSRs), retained primary responsibility for job placements. Standard employment services resources were available and BSRs marketed the program as part of the employer engagement activities. BSRs included job development as part of their engagement strategy. Completers also benefited from the job development and placement offices at the community and technical colleges. Community colleges were increasingly focused on placements for those in their programs. Follow-up services to support job retention and advancement in a career pathway—beyond that conducted for the employment retention measures at the Career Centers, were not well developed.
65 “Missing” category for GED receipt indicates that no GED was recorded in the TWIST system; this category most likely comprises the individuals who either did not receive the training, or did not successfully complete the training.
83
4:4:004 Employment Placement
TWIST data indicates that only 17% of all Project GROW participants were employed. For the purposes of this report, employed is defined as the participant entering into a training-related job either in the quarter they exited Project GROW, or in the two quarters post-exit.66 Employment entry rates ranged from 30% in Cohort A to 13% in Cohort B and 14% in Cohort C (see Figure 24). Employment outcomes including placement, retention and wage gains will be explored in greater detail in the forthcoming outcomes and net impact evaluation report.
Figure 24. Percent Employed, by Cohort67
Figure 25 examines variations in employment placement by cohort and WIB:
• while nearly two-thirds (60%) of Cohort A participants in South Texas entered employment, only about a fifth of Cohort A participants in Middle Rio Grande and a tenth of Cohort A participants in Upper Rio Grande entered employment (23% and 8% respectively);
• while about a fifth of Cohort B participants in Cameron and South Texas entered employment, only 11% of Cohort B participants in Lower Rio Grande and 3% of
66 Note that this definition differs from that used in the Monthly Performance Reports. The MPRs define employed as participant entering a training-related job at any time after exit from Project GROW. 67 “Missing” category for employment outcomes indicates that no employment was recorded for these individuals in the TWIST system.
84
4:4:004 Cohort B participants in Middle Rio Grande entered employment. None of the Cohort B participants in Upper Rio Grande entered employment; and
• while about a third to nearly half of Cohort C participants in Middle Rio Grande entered employment, only a fifth of Cohort C participants in Lower Rio Grande and South Texas entered employment. Only 2% of Cohort C participants in Upper Rio Grande entered employment.
Figure 25. Percent Employed, by Cohort and WIB68
68 “Missing” category for employment outcomes indicates that no employment was recorded for these individuals in the TWIST system.
85
4:4:004 ASSESSMENTS AND OBSERVATIONS
SUMMARY OF FINDINGS
Project GROW was in almost constant flux as partners in the WIBs attempted to enhance their capacity and refine their approaches to implement the many features of the demonstration. These included complex eligibility procedures such as dual eligibility determination in WIA and Project GROW and pre-eligibility testing in adult education and college readiness in order to form tiered training cohorts; the introduction of a stand-alone program and performance management data system; enhanced levels of employer and industry sector engagement; and the alignment of career pathway options in demand occupation between workforce and postsecondary training providers, as well as alignment within colleges between continuing education departments and academic programs.
ACCOMPLISHEMENTS AND CONSTRAINTS
The implementation analysis reveals that Project GROW has produced mixed results.
Almost all partners assert that Project GROW was a positive, but challenging learning experience regarding the education, training, and appropriate services for participants whose access to more extensive and intensive services has been more limited in the past.
Family circumstances, income demands, and transportation issues are among the key challenges to persistence and completion of the education and training services. Providers adjusted scheduling and sequencing, as well as pedagogical approaches in order to improve outcomes and respond to challenges faced by participants. Local partners met on a regular or as-needed basis to discuss implementation challenges, participant progress, and the provision of support services. The Project GROW Coordinator also conducted region-wide monthly teleconferences of the Border Workforce Alliance “Partners”, the Employer Engagement Committee, and the Training Provider Committee, which provided opportunities for shared discussions of policies, practices, progress, and challenges.
Project GROW served as a precursor to the Workforce Innovation and Opportunity Act (WIOA).
WIB administrators and leads for Project GROW, managers and staff for the Workforce Solutions Career Centers, and most training providers at the community and technical colleges indicated that the demonstration helped to prepare for implementing
86
4:4:004 provisions of WIOA, which include services for priority populations (similar to the demonstrations Cohorts), institutional alignment, employer engagement, industry cluster requirements, and support for career pathways.
Project GROW’s most challenging target group may also have served as the more significant preparatory experience. Occupational training for Cohort C was not required. Rather providers were expected to provide contextualized ESL and ABE tied to the Learning Gains performance measure with the expectation that some in Cohort C would advance to GED and occupational training offered to Cohort B. That 3 of the 5 WIB areas offered training to this subgroup added notably to the learning curve of providers and helped to prepare for better serving “priority” populations in WIOA.
Knowledge and practice regarding career pathways has been enhanced across the BWA region, as has receptivity to contextualized and bridge programs in adult education pedagogy (among four of the five WIBs).
Although South Texas College entered the program as a respected national leader in the field (and VIDA and ARRIBA incorporate the career pathway approach in their regular programs), knowledge and practice regarding career pathways has been enhanced across the BWA region, particularly regarding persistence and completion of training and the attainment of an entry level credential for those bereft of occupational or basic educational accomplishments, who often face constraints to intensive and challenging training regimes like those in Project GROW.
Alignment between adult education and ESL providers, postsecondary education, and workforce institutions has improved due to the demonstration’s service model.
Although inconsistent across the entire region, these entities purposefully served common clients. Regular and as needed contact between affiliated program staff enhanced awareness of institutional practices, policies, and operational prerogatives. Project GROW supported a mutual “learning curve.”
Alignment between continuing education and academic departments at postsecondary institutions has improved.
Articulated credit, shared curriculum content, and stackable credentials became increasingly common features in Project GROW trainings. Continuing Education Units (contact hours) in Project GROW’s occupational trainings are almost all held in “escrow”
87
4:4:004 and convert to academic credit hours, should a participant enroll for additional certification. For example, El Paso Community College had success co-enrolling non-credit Project GROW students with academic credit students in its Emergency Medical Technician training. Laredo Community College navigated academic recognition and alignment of its non-credit Medical Office Professional with the academic Medical Office Specialist certificate and Medical Assistant associate degree, despite some initial resistance. Additionally, in at least one site, continuing education students can now receive career development and placement assistance formerly restricted to academic credit students. South Texas College now permits the Continuing Professional and Workforce Education Department to access Texas Public Education Grants (up to $500 per semester) for low-income, student support.
Sites provided a handful of examples of participants who have made substantial advances in their career and livelihood prospects as a result of Project GROW.
Many participants have given testimony to the value of the demonstration to their livelihood prospects, sense of accomplishment, and capacity to better support their families. Significantly, nearly three-quarters of the participants are the first generation in their families to have access to postsecondary education. The depth of this representation is a remarkable accomplishment of Project GROW, with potential inter-generational effects as the possibility of college is viewed as a tenable option for descendants of the current adult participants.
Nevertheless, complete successful implementation eluded the demonstration.
Cohort formation and participation levels were not as successful as anticipated in the original plan.
Because of low outreach responses, misalignment of client interests and the type of training available, and low eligibility rates by cohorts, particularly due to testing outside of the TABE score range, it was difficult to form cohorts for planned career path trainings or to coordinate training starts due to an insufficient number of recruits. Geographic distances, the disbursed populations, and locations of training sites in many areas of the border region exacerbate these challenges. Additionally, previously approved eligible persons often lost interest or became otherwise engaged when anticipated cohort start dates were rolled
88
4:4:004 back.69 All of the sites tried various tactics to recruit eligible, interested individuals who would make the extensive commitment to GROW, but prospective clients continued to test outside of established cohort boundaries. All administrators and staff commented upon the extensive time and energy expended on outreach/eligibility efforts to recruit, enroll, and form training cohorts. Only South Texas attained or exceeded its targeted participant levels across all Cohort Sub-groups. Lower Rio Grande attained all its targeted participant levels except for Cohort Sub-groups A1 and A2. Cameron served only Cohort B participants.
For several reasons, including late contracting dates, tight and complex eligibility requirement and processes, attrition, and lack of capacity early on, Project GROW has not achieved any of its performance measures across the entire region as a whole. The BWA did best in credentialing (62%). Education measures (GED acquisition at 37% and Learning Gains at 28%) and employment measures (Employment Entry-Training Related at 14% and 60-day Retention at 8%) fell well short of their targets. Three of five WIBs met or exceeded their target number of engaged employers (12).
Employer engagement fell short of expectations regarding scope and depth of involvement, and there was no observed advance in industry sector development.
Beyond recruiting individual employers for curriculum review, employment prospects, and internship or work experience placements, there was little expansion or deepening of employer engagement efforts by Business Services Representatives (BSRs). BSRs conducted an initial BSRs distributed a one-page survey to identified employers to solicit and gauge their support. The Employer Survey gathered contact information and asked about entry-level hiring practices, the availability of paid or unpaid internships, willingness to consider Project GROW participants for these, if available, and the employers willing ness to participate in an Employer Engagement “panel,” as well as the skills and competencies that the employer deemed important for entry-level workers.
Other dimensions of employer engagement anticipated in the evaluation design were the direct participation of employers as supplemental instructors, direct referrals of incumbent workers to workforce services to enhance their career prospects (potentially creating openings for entry level workers as incumbent workers advance along the career pathway); workplace flexibility, for example, in scheduling to accommodate training and
69 Initial outreach and recruitment efforts often marketed all four occupations originally. Another source of delay was the time for packaging and scheduling an appropriate career path training module for occupations for which no prior course had been available at the training provider.
89
4:4:004 support for advanced training such as tuition reimbursement or raises tied to the additional credential; and expanding placement prospects for training participants–including internships/clinicals, work experience, and employment—pursuant to career pathways. There was very sparse activity in any of these areas.
The anticipated contributions and involvement of community-based organizations were not realized.
There were no enrollments in the College Readiness Academy and postsecondary education for Cohort A through VIDA in Cameron or the Lower Rio Grande areas. Intensive case management for Cohorts C1 and C3, the very least job-ready, through VIDA in Cameron did not occur and such referrals to ARRIBA in Upper Rio Grande were late in starting and did not attain expected enrollment numbers. Nevertheless, ARRIBA did help several participants along the path to their GED, and both VIDA and ARRIBA enrolled former participants in their own career pathway training subsequent to their exit from Project GROW.
The In Home Learning System (IHLS) was distributed late in the demonstration and the ability to evaluate its effectiveness has largely been compromised.
IHLS distribution was hampered by low enrollments and its efficacy as a learning enhancement was questioned by many in the field. The teaching modules were all in English—there was no ESL training and no explicit GED prep program. Random assignment caused some concern because some of those who received the IHLS already had access to a computer. Universal assignment at the end of the demonstration reportedly improved its usefulness for teaching, since instructors and students could communicate and written assignments could be submitted electronically. Reportedly, class cohesions improved as well, since all were figuratively “on the same page.”
Dual data entry, consistent and reliable data entry, and other issues plagued the Administrative System for Program Participation (ASPP).
ASPP was the proposed nexus of real time exchanges between program partners at local and regional levels, and the database for unique data elements that were basic to the demonstration’s program management and evaluation designs. . Field staff made limited use of ASPP because of dual data entry (TWIST and ASPP) and, at times, lack of clear responsibility for data entry and quality control.
90
4:4:004
CONSIDERATIONS AND RECOMMENDATIONS
Researchers recommend the following be considered for future iterations of accelerated career pathway models.
Provide more flexibility regarding demand occupations and career selections.
Be more responsive to client choice. Among the 2,104 individuals with a “non-eligibility” reason recorded in ASPP (which includes those who preliminarily registered in Project GROW or were contacted by staff as part of outreach) 635 were not interested in the trainings selected or currently available through Project GROW. Other commonly cited non-eligibility reasons were “low TABE score” (187), “incomplete application” (178), and “not available for class times” (140). Most of the partners agree that participation and outcomes would have improved had broader participant choices been available. Flexibility is also recommended regarding cohort size (minimum number) and “braiding” or “mainstreaming” participants with other student groups.
Include community and technical colleges or other training providers on the Eligible Training Provider lists in the career pathway and demand occupational selections to align their capacity with employer and industry labor demand.
The BWA selected Project GROW occupations options prior to contract negotiations; trainings for some of were not developed or yet associated with a credential at the postsecondary level, leading to delays in cohort formation. Also, involve Career Center, training provider, and CBO staff in the client assessment process to assure that participants meet the selection criteria of these partners who are at least partially accountable for meeting performance expectations
Target demand occupations aligned with established trainings and successful outcomes to more quickly ramp up enrollment and training of cohorts and build confidence with the employer community.
It may be strategically valuable to build out and scale up career pathway programs starting with the strengths of the local partners. Rapid placement in services may help reduce attrition, which was reportedly common among those who had expressed interest or been determined eligible for Project GROW, but held on a wait list while developing training capacity or availability. Business and Employment Services Representatives at the WIB and Career Centers might begin to work with employers active in the program or
91
4:4:004 departmental advisory committees who already have a measure of vested interest in the occupational training content and value.
Continue employer engagement efforts, recognize that industry sector engagement is a process that demands significant effort over time, and make resources available specifically for such endeavors.
Current Business Services Representatives (BSR) should be assigned and resourced as workforce intermediaries to develop and maintain specific industry groups of employers, training providers, and workforce staff. There was no funding built in Project GROW for initiating or expanding such efforts, where there was incipient activity underway such as the Health Industry Task Force in Lower Rio Grande. The quality of the human capital prepared through the workforce system must meet industry standards for skilled and productive workers that add to the “bottom line” to get and keep employers engaged. (As should wages earned in the entry level occupations be adequate to keep workers in the industry.) Employers must realize the value of and support internal career pathway opportunities.
The Workforce Innovation and Opportunity Act of 2014 (WIOA) supports deeper employer engagement and sectoral approaches. WIOA establishes new regulations to measure the relationship between the public workforce system and employers’ needs. Developing, convening or implementing industry sector activities is now a required local activity. Moreover, WIOA aims to reduce gives local areas more flexibility to set requirements around employers’ financial and in-kind contributions for on-the job and customized training, possibly eliminating one barrier to engagement with the public workforce system (Barnow and Spaulding 2015).
Consider alignment of program requirements in those instances where participants are dually enrolled.
Programs may have conflictive or duplicative requirements. One Cohort A participant who was also a TANF recipient was required to work 30 hours a week in addition to the unpaid 20 hours per week Clinical Medical Assistant internship, which was not considered work.70 This “double-bind” or anything similar should be recognized and eliminated.
70 Despite the challenges this presented regarding parenting, professional development, and work, this participant succeeded in attaining the CMA certificate and license, completing her Project GROW commitment. Subsequently, this mother of three relocated to San Antonio and completed an LVN program
92
4:4:004 Create clear and tangible options for those starting with an entry level credential on
a career pathway to acquire advanced credentials that further enhance employment and earnings prospects.
Every area in Texas might access various funding streams supportive of career pathway progressions, many of which also require or benefit from partnerships involving a mix of WIBs, business, community and technical colleges or extension services, economic development agencies, and CBOs. Several potential funding sources for basic skills or advanced training are available to continue the pathway approach partnerships started in the demonstration and further encourage by WIOA.
The Texas Workforce Commission’s Skills Development Fund and its Self-Sufficiency Fund for employer driven, customized training for new and incumbent worker are prospective means of creating entry and advancement opportunities. The State also has access to SNAP E&T 50/50 funds, which can be used for paid Work Experience for those exiting with an entry level credential, a potential asset to “jump start” individuals on their career pathway. Community Colleges in Project GROW and elsewhere have also been accessing the Texas Higher Education Coordinating Board’s (THECB) Accelerate Texas and VAST grants that, similar to GROW, support integrated basic education and workforce training program career pathways to support Adult Education and Literacy students transitioning to workforce training programs that lead to credentials in demand occupations at community and technical colleges, particularly basic skills and limited English proficiency students. In addition to potential WIOA funding or Pell Grants for college support, those wishing to advance their training may access Texas Public Educational Grant (TPEG) funds. TPEG is a grant from the college’s own resources that helps students with financial need attend public community colleges, public technical colleges, or public state colleges in Texas.
FINAL COMMENTS
Project GROW was designed as a bold and ambitious demonstration project. The program design included five workforce areas spanning the entire Texas-Mexico border region. Although these areas conjoined as the Border Workforce Alliance and shared common challenges of language, low basic skills, and labor exchange skills gaps, they also have distinct settlement features (large urban, small urban/semi-rural, and disbursed rural) and had varying capacity at start-up regarding the delivery of career pathway training that influenced program implementation. These variable geographies and initial capacity, when combined with differentiated service delivery through the grouping of the target population
93
4:4:004 into cohorts and sub-cohorts, multiple program offerings in a number of diverse demand occupation, dual enrollment and performance expectations in WIA/WIOA and Project GROW, elicited similar, but somewhat distinct responses to the multiple and complex challenges to program implementation, documented throughout this final report.
The demonstration fell short of a clear model of regional systemic development and career pathway designs varied regarding training regimes, entry-level occupational credentials, and success at serving various Cohorts, particularly Cohort A, among other features. Nevertheless, the demonstration served as a vibrant laboratory of practice regarding accelerated clear pathways for very challenging target groups as noted above and detailed throughout this report. Project GROW certainly increased capacity within the five WIB partnerships. Similarly, although the demonstration did not reach scale regarding participation and formation of additional career pathways, it did influence policies and practices with community and technical colleges and promoted improved institutional alignment within the local partnership configurations.
The complexity of Project GROW's program design also poses challenges to the evaluation, particularly the outcomes and impact evaluation. Project GROW was designed to test and demonstrate a number of different strategies, ranging from the use of IHLS to support learning for Cohort C participants, to the use of intensive case management for Cohort A and subsets of Cohort C participants. This final implementation report documents the considerable cross-site variation in the manner in which these strategies were implemented and preliminary variations in results, including participation levels, as well as external challenges such as the introductions of the new, more demanding GED and the state TSI college readiness assessment. These considerable variations and the low participation counts have implications for the evaluation team's ability to measure the success of Project GROW's differentiated strategies. These implications will be discussed further in the final outcomes report.
The report also suggest that the cost-effectiveness of the demonstration may not be positive, but will be very different across sites, given the variation in expenditures, leverage amounts, participation rates, and employment outcomes. Nevertheless, the net value of the demonstration is inseparable from its consideration as a training ramp for WIOA and, perhaps more importantly, as a
“I appreciate the opportunity that Project GROW provided me. It has helped me gain confidence in myself and I am now setting goals I would have never thought to set before my time in this training.”
-Sandra V.
94
4:4:004 gateway to postsecondary enrollment for the vast majority of the participants who were the first-generation in their lineage to enroll in college courses. Opening this path to a new and valued “place” may produce a positive, tangible benefit to the extent that it foreshadows opportunity for future generations.
95
4:4:004
4:4:004 REFERENCES
Barnow, Burt S., and Shayne Spaulding. 2015. “Employer Involvement in Workforce Programs: What Do We Know?” In Transforming U.S. Workforce Development Policies for the 21st Century, edited by Carl Van Horn, Tammy Edwards, and Todd Greene, 231–64. Atlanta, GA: Federal Reserve Bank of Atlanta, Federal Reserve Bank of Kansas City, and Rutgers University.
Center for Public Policy Priorities (2014). Key Facts About Poverty and Income in Texas. KIDS COUNT Data Center. U.S. Census American Community Survey (ACS). Accessed at http://forabettertexas.org/images/EO_2014_ACSPovertyIncome_Charts.pdf
O’Shea, Dan, H. J. Prince, A. Patnaik, A. Khan & G. Cumpton (2014). Growing Regional Opportunities for the Workforce: Project G.R.O.W Taking Root in the Texas-Mexico Border Area. Interim Process Analysis Report. Austin: Ray Marshall Center, Lyndon B. Johnson School of Public Affairs, University of Texas at Austin.
Spaulding, Shayne and Ananda Martin-Caughey. 2015. “The Goals and Dimensions of Employer Engagement in Workforce Development Programs.” Washington, D.C.: Urban Institute.
Texas Association of Counties. 2016, Texas County Profiles, The County Information Program. Retrieved from http://www.txcip.org/tac/census/CountyProfiles.php
TIP Strategies. 2012. “Future of the Workforce: Regional Context.” Austin, TX. http://www.wfsolutions.org/~wforce/images/workforce/GeneralWebsite/Content/WhoWeAre/Resources/TIPReports/2012-08-22_TIP_Future_of_the_Workforce_EXPANDED_VERSION.pdf
US. Bureau of Labor Statistics. 2016. Retrieved from FRED, Federal Reserve Bank of St. Louis https://research.stlouisfed.org/fred2/series/TXHIDA5URN, June 5, 2016.
Wilson, Randall. 2015. A Resource Guide to Engaging Employers. Boston: Jobs for the Future. http://www.jff.org/publications/resource-guide-engaging-employers. Center for Public Policy Priorities (2014). Key Facts About Poverty and Income in Texas. KIDS COUNT Data Center. U.S. Census American Community Survey (ACS). Accessed at http://forabettertexas.org/images/EO_2014_ACSPovertyIncome_Charts.pdf
Context Inputs Activities Outputs Student Outcomes Systems Impact
Strong employer demand for skilled, credentialed workers in key sectors Large local population of Spanish speakers (85% of population is Hispanic/Latin) with LEP and low literacy Region-wide interest in improving outcomes for low-skilled adult students to meet employer need Gap in public workforce system’s ability to assist and engage lower-skilled adults Existing partnerships between the WIBs, community colleges and CBOs Some college capacity and commitment to innovation, data use, program development but uneven across region; “pockets” of innovation Strong CBO providers who can help address student needs
From BWA • Funding • Eligibility • Case Management • Referrals • Support services
From LRWS • Initiative oversight • Fiscal management • Data and reporting
From Border Community Colleges • Education and Training • Student Supports
From VIDA/Project ARRIBA • (Intrusive) Case
management/ skill development
• College prep academy • Funding
From JFF • TA to partners • Evaluation management • Partner convening
From Business Access • Use of technology for skills
development and program implementation
• In-home learning systems
• Outreach & Recruitment
• Intake and Assessment
• Career Counseling • Career Exploration • Case Management • Supportive
Services • College readiness • Job Work
readiness (to include soft skills)
• Contextualized ABE/ESL/GED prep
• English language instruction
• Occupational Training
• Job Placement • Employer
engagement • Retention Services • Digital Literacy • Social Media and
Online learning communities
• Computer training
STUDENTS: • 660 students enrolled
in 3 subgroups (A, B, C) of integrated pathways
• 45-60 employers engaged in 5 regions
• 105 adults receive in-home learning systems and digital literacy
• 165 students complete college readiness academy
SYSTEMS: • Standardized
procedures and policy across partnered agencies
• Expansion of evidence-based acceleration models and dissemination of tools and best practices.
• Expanded, consistent participant access and services across area
• Improved participant employment through employer/program alignment and enhanced infrastructure.
• Increased data capacity
SHORT-TERM Students complete the following milestones: • All Groups:
Completion of training courses
• All Groups: Attain credentials
• Group A; completion of college readiness academy
• Group B and C: Completion of GED
• Group C: Completion of onramp/ contextualized bridge program.
SPECIFICS: 502 Low-skilled adult students attain occupational degrees and certificates. 462 low skilled adults are employed in good paying jobs in occupations with career ladders. 479 workers retained for at least 60 days 330 adults earn a GED 528 adults achieve measurable educational gains
Better alignment of the public workforce system with local employers, public colleges, and community based organizations to meet the needs of employers for a skilled workforce. • Operational
efficiencies and streamlined participant plans.
• Accelerated time to completion of credentials for lower-skilled adult learners
• Strengthened coordination of support services, leading to increased retention and completion.
• Strongly linked education and training programs aligned with labor market needs.
• Strengthened capacity of the public workforce infrastructure leading to greater scale and program sustainability.
98
4:4:004 APPENDIX B. SELF-ASSESSMENT EXERCISE
Project GROW Evaluation Local Partner/Sub-grantee Self-Assessment Tool
As part of the final round of site visits for evaluation of the Project GROW demonstration, researchers at the Ray Marshall Center request that the project lead for each institutional perspective, i.e., 1) the WIB; 2)the local workforce contractor; 3) the training provider/college; and 4) the CBO, where applicable) complete the following questionnaire. This serves to “prime” discussants for the visit. RMC will elicit details regarding the bases for responses, as well as revisit demonstration features, policies, practices, data systems, outcomes, and finances while on site.
Please send completed self-assessment tool at least one week prior to scheduled site visit to:
Area and Agency Represented: Agency GROW lead: Date: Please respond by simple Yes or No to the following questions based on your local knowledge and experience with Project GROW. RSQ 5. To what extent did Project GROW lead to significant changes in systems and processes in the region and the participating WIBs?
1. System Change. Has the number of individuals who enroll in GROW’s career pathway services provided by your organization increased year over year? Y/N
2. System Change/WIOA Transition. Is your organization now better prepared to outreach, enroll, serve and achieve better employment and training outcomes for challenging populations with recognized language, academic, and skills deficits because of Project GROW? Y/N
3. Career Pathway. Can you cite any example(s) of GROW participants (A, B, or possibly C) who migrated from non-credit to credit-based programs in career pathway progression? Y/N
4. Career Pathway and Employer Engagement. Can you cite any example(s) of GROW participants (A, B, or C) who fulfilled their original service plan and entered employment, but returned to the training provider or Workforce Solutions office to pursue their education and training at the next level of a career pathway progression? Y/N
5. Career Pathway. Can you cite any example(s) of GROW participants (A, B, or C) who fulfilled their original service plan and chose to immediately continue their education and training at the next level of a career pathway progression? Y/N
6. Service Delivery Variation (Cs Learning Gains vs. Training). Has your area provided any type of occupational training involving a work skills credential to Cohort C participants? Y/N
4:4:004 7. System Change. Are employment services/job placement coordinated between the
training provider/college and Workforce Solutions? Y/N
8. System Change. / Career Pathways. Is career pathway advancement assistance available to GROW participants who enter employment? Y/N
9. System Change/WIOA Transition. Will you continue and expand the demonstration’s targeting of those who, in the past, have not fully benefited from the more promising pathways to sufficient and sustainable incomes available through the public workforce system? Y/N
10. System Change. Has your area made demonstrable progress regarding strengthening connections between local partners through Project GROW? Y/N
11. Career Pathway. Has the number of career pathway programs available in your area that you refer to (WFS) or offer (training provider) increased in the last few years (excluding initial 4 Grow selections)? Y/N
12. Career Pathway. Do you plan to increase the number of career pathway programs next year in part because of your Project GROW the experience? Y/N
13. System Change. Have institution-level (WIBs/WFS, colleges, and CBOs) policies changed to sustain practices implemented by Project GROW? Y/N
14. Career Pathway. Have you identified or accessed funds to continue to offer career pathway training to those starting at an occupational entry level? Y/N
15. System Change/ASPP. Has your ability to collect more reliable and granular longitudinal data for program performance management and reporting or evaluation purposes improved in any way due to GROW? Y/N
16. System Change. Has your area adopted additional credit articulation agreements with ISDs or between Continuing Education and Academic Programs since GROW implementation began in early 2013? Y/N
17. System Change. Have the number and types of support services available to participants served in common by local partners expanded since GROW implementation began in early 2013? Y/N
18. System Change. Has the coordination of support services offered by local partners improved since GROW implementation began in early 2013? Y/N
19. System Change. / Career Pathways/ Employer-Sector Engagement. Has the use of industry-approved technical skill assessments based on industry standards in curriculum development been increased or expanded to additional courses, programs or career pathways since GROW implementation began in early 2013? Y/N
20. Employer/Sector Engagement. Did Business Services Units successfully engage employers in Project GROW? Y/N
21. Employer/Sector Engagement. Were employers or employer groups notably involved with Training Providers in curriculum development, instruction, or other actions? Y/N
22. System Change/WIOA Transition. Has Project GROW helped to prepare your area partnership for implementing provisions of the Workforce Innovation and Opportunity Act (WIOA)? Y/N
Q1. Has the number of individuals who enroll in GROW’s career pathway services provided by your organization increased year over year? Q2. Is your organization now better prepared to outreach, enroll, serve and achieve better employment and training outcomes for challenging populations with recognized language, academic, and skills deficits because of Project GROW? Q7. Are employment services/job placement coordinated between the training provider/college and Workforce Solutions? Q8. Is career pathway advancement assistance available to GROW participants who enter employment? Q9. Will you continue and expand the demonstration’s targeting of those who, in the past, have not fully benefited from the more promising pathways to sufficient and sustainable incomes available through the public workforce system? Q10. Has your area made demonstrable progress regarding strengthening connections between local partners through Project GROW? Q12. Do you plan to increase the number of career pathway programs next year in part because of your Project GROW the experience? Q14. Have you identified or accessed funds to continue to offer career pathway training to those starting at an occupational entry level? Q15. Has your ability to collect more reliable and granular longitudinal data for program performance management and reporting or evaluation purposes improved in any way due to GROW? Q16. Has your area adopted additional credit articulation agreements with ISDs or between Continuing Education and Academic Programs since GROW implementation began in early 2013? Q17. Have the number and types of support services available to participants served in common by local partners expanded since GROW implementation began in early 2013? Q18. Has the coordination of support services offered by local partners improved since GROW implementation began in early 2013? Q19. Has the use of industry-approved technical skill assessments based on industry standards in curriculum development been increased or expanded to additional courses, programs or career pathways since GROW implementation began in early 2013? Q22. Has Project GROW helped to prepare your area partnership for implementing provisions of the Workforce Innovation and Opportunity Act (WIOA)?
CP Score (Career Pathways)
Q3. Can you cite any example(s) of GROW participants (A, B, or possibly C) who migrated from non-credit to credit-based programs in career pathway progression? Q4. Can you cite any example(s) of GROW participants (A, B, or C) who fulfilled their original service plan and entered employment, but returned to the training provider or Workforce Solutions office to pursue their education and training at the next level of a career pathway progression? Q5. Can you cite any example(s) of GROW participants (A, B, or C) who fulfilled their original
101
4:4:004 service plan and chose to immediately continue their education and training at the next level of a career pathway progression? Q8. Is career pathway advancement assistance available to GROW participants who enter employment? Q11. Has the number of career pathway programs available in your area that you refer to (WFS) or offer (training provider) increased in the last few years (excluding initial 4 Grow selections)? Q12. Do you plan to increase the number of career pathway programs next year in part because of your Project GROW the experience? Q14. Have you identified or accessed funds to continue to offer career pathway training to those starting at an occupational entry level? Q19. Has the use of industry-approved technical skill assessments based on industry standards in curriculum development been increased or expanded to additional courses, programs or career pathways since GROW implementation began in early 2013?
EE score (Employer Engagement)
Q4. Can you cite any example(s) of GROW participants (A, B, or C) who fulfilled their original service plan and entered employment, but returned to the training provider or Workforce Solutions office to pursue their education and training at the next level of a career pathway progression? Q19. Has the use of industry-approved technical skill assessments based on industry standards in curriculum development been increased or expanded to additional courses, programs or career pathways since GROW implementation began in early 2013? Q20. Did Business Services Units successfully engage employers in Project GROW? Q21. Were employers or employer groups notably involved with Training Providers in curriculum development, instruction, or other actions?
WT score (WIO Transition)
Q2. Is your organization now better prepared to outreach, enroll, serve and achieve better employment and training outcomes for challenging populations with recognized language, academic, and skills deficits because of Project GROW? Q9. Will you continue and expand the demonstration’s targeting of those who, in the past, have not fully benefited from the more promising pathways to sufficient and sustainable incomes available through the public workforce system? Q22. Has Project GROW helped to prepare your area partnership for implementing provisions of the Workforce Innovation and Opportunity Act (WIOA)?
ASPP Score Q 15. Has your ability to collect more reliable and granular longitudinal data for program performance management and reporting or evaluation purposes improved in any way due to GROW?
C score Q6. Has your area provided any type of occupational training involving a work skills credential to Cohort C participants?
102
4:4:004 Self-Assessment Tool Scores by WIB and Partners
Note: VIDA was CBO for both Lower Rio and Cameron
103
4:4:004 APPENDIX C. ALLOWABLE COSTS PER PARTICIPANT