30
GAIL (India) Limited Growing with Green Energy Analyst Presentation 31 st May 2012
| Date post: | 09-Mar-2018 |
| Category: |
Documents |
| Upload: | nguyenthuy |
| View: | 218 times |
| Download: | 2 times |

GAIL (India) Limited
Growing with Green Energy
Analyst Presentation
31st May 2012

Safe Harbor Statement • This presentation has been prepared by GAIL (India) Ltd (Company or GAIL) solely
for providing information about the Company.
• The information contained in this presentation is only current as of its date. Certain statements made in this presentation may not be based on historical information or facts and may be "forward-looking statements", including those relating to the Company’s general business plans and strategy, its future financial condition and growth prospects, and future developments in its industry and its competitive and regulatory environment. Actual results may differ materially from these forward-looking statements due to a number of factors, including future changes or developments in the Company’s business, its competitive environment, information technology and political, economic, legal and social conditions in India.
• This communication is for general information purposes only, without regard to specific objectives, financial situations and needs of any particular person. Company do not accept any liability whatsoever, direct or indirect, that may arise from the use of the information herein.
• The Company may alter, modify or otherwise change in any manner the content of this presentation, without obligation to notify any person of such revision or changes
2
Be the leading company in natural gas and beyond with global focus, committed to customer care, value creation for all stakeholders and environment responsibility
To accelerate and optimize the effective and economic use of Natural Gas and its fractions to the benefit of the national economy

4
GAIL Management
Sh B C Tripathi C&MD
Sh R D Goyal Director (Proj)
Sh S L Raina Director (HR)
Sh Prabhat Singh Director (Mktg)
Sh S Venkatraman Director (BD)
Sh P K Jain Director (Fin)
Dr. Vinayshil Gautam
Sh R M Sethi Sh Mahesh Shah
Sh Arun Aggarwal
Dr. Neeraj Mittal Sh Sudhir Bhargava
Dr A K Khandelwal
Sh R P Singh
Smt Shyamala Gopinath
Functional Directors Independent Directors C&MD Govt. Nom. Directors
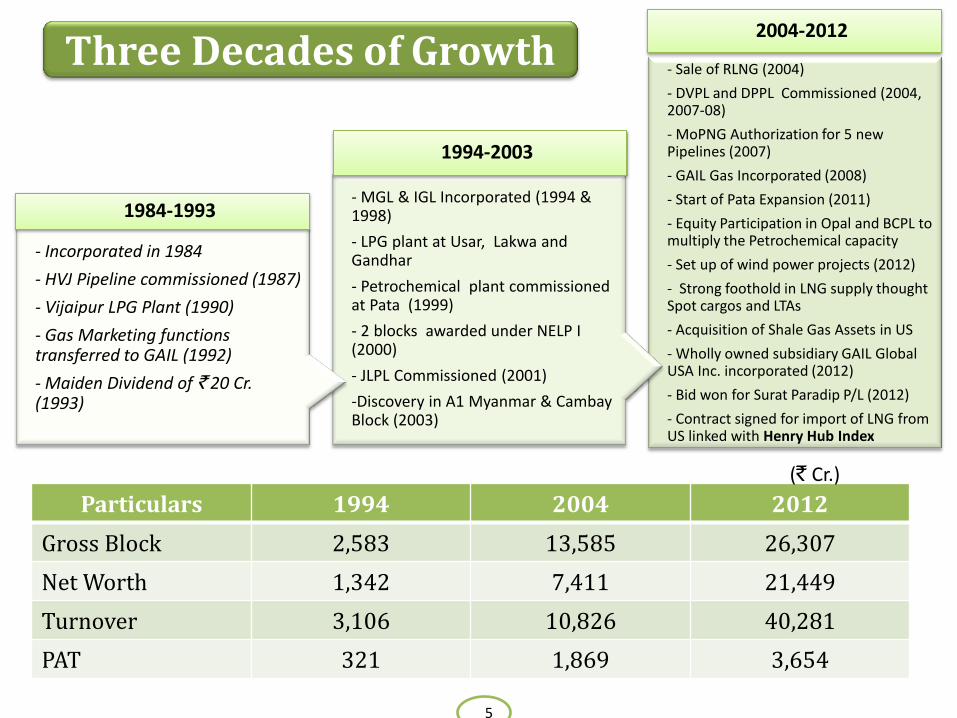
Three Decades of Growth
5
- Sale of RLNG (2004)
- DVPL and DPPL Commissioned (2004, 2007-08)
- MoPNG Authorization for 5 new Pipelines (2007)
- GAIL Gas Incorporated (2008)
- Start of Pata Expansion (2011)
- Equity Participation in Opal and BCPL to multiply the Petrochemical capacity
- Set up of wind power projects (2012)
- Strong foothold in LNG supply thought Spot cargos and LTAs
- Acquisition of Shale Gas Assets in US
- Wholly owned subsidiary GAIL Global USA Inc. incorporated (2012)
- Bid won for Surat Paradip P/L (2012)
- Contract signed for import of LNG from US linked with Henry Hub Index
2004-2012
- MGL & IGL Incorporated (1994 & 1998)
- LPG plant at Usar, Lakwa and Gandhar
- Petrochemical plant commissioned at Pata (1999)
- 2 blocks awarded under NELP I (2000)
- JLPL Commissioned (2001)
-Discovery in A1 Myanmar & Cambay Block (2003)
1994-2003
- Incorporated in 1984
- HVJ Pipeline commissioned (1987)
- Vijaipur LPG Plant (1990)
- Gas Marketing functions transferred to GAIL (1992)
- Maiden Dividend of ` 20 Cr. (1993)
1984-1993
Particulars 1994 2004 2012
Gross Block 2,583 13,585 26,307
Net Worth 1,342 7,411 21,449
Turnover 3,106 10,826 40,281
PAT 321 1,869 3,654
(` Cr.)

Quick Facts
About 3/4th of the Total Natural Gas Transmitted though
pipelines in India
More than 1/2 of the natural gas sold in India
Almost 1/5th (21%) of Poly-ethelene produced in country
LPG produced for every 10th LPG cylinder in the country
Pipeline Transmission of around 1/4th of country’s total LPG
Gas Supply for about 1/2 of the country’s Fertilizer produced
6
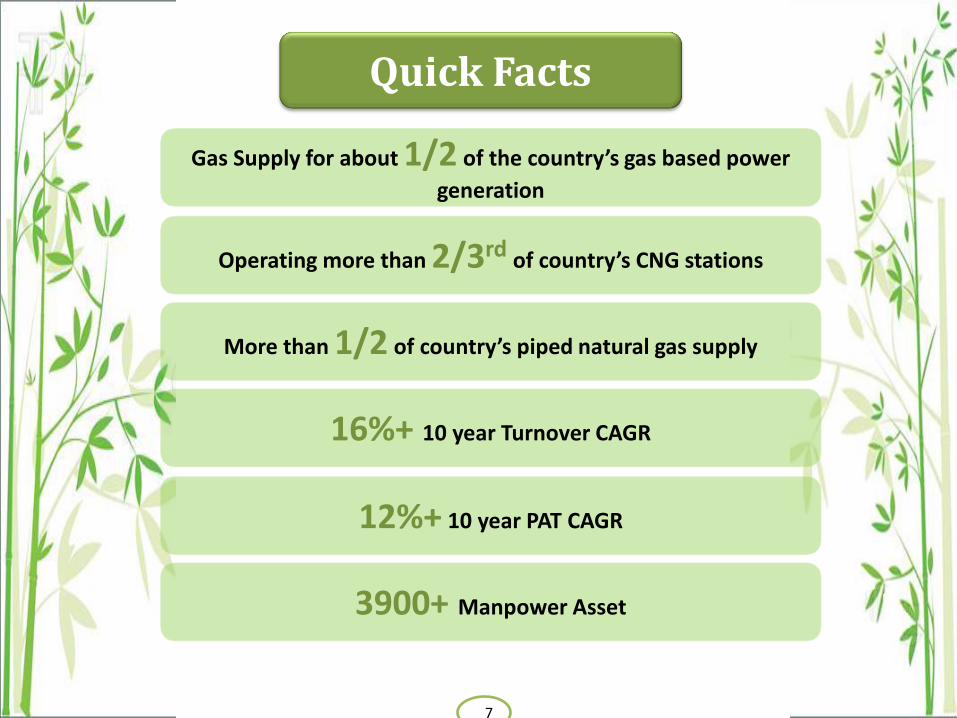
Gas Supply for about 1/2 of the country’s gas based power
generation
Operating more than 2/3rd of country’s CNG stations
More than 1/2 of country’s piped natural gas supply
16%+ 10 year Turnover CAGR
12%+ 10 year PAT CAGR
3900+ Manpower Asset
7
Quick Facts
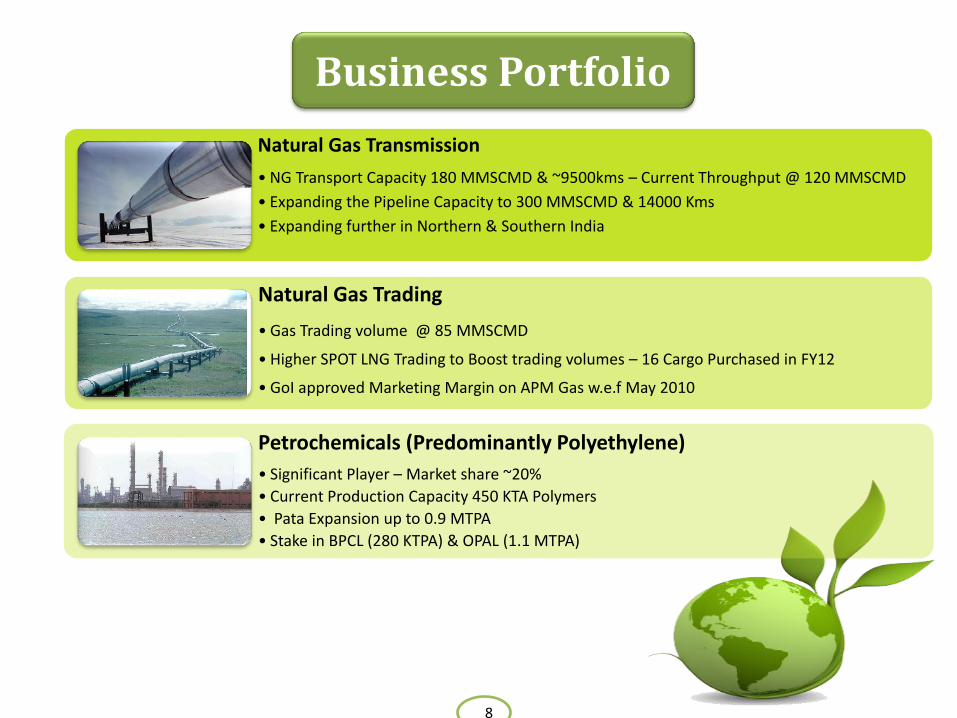
Natural Gas Transmission
• NG Transport Capacity 180 MMSCMD & ~9500kms – Current Throughput @ 120 MMSCMD
• Expanding the Pipeline Capacity to 300 MMSCMD & 14000 Kms
• Expanding further in Northern & Southern India
Natural Gas Trading
• Gas Trading volume @ 85 MMSCMD
• Higher SPOT LNG Trading to Boost trading volumes – 16 Cargo Purchased in FY12
• GoI approved Marketing Margin on APM Gas w.e.f May 2010
Petrochemicals (Predominantly Polyethylene)
• Significant Player – Market share ~20%
• Current Production Capacity 450 KTA Polymers
• Pata Expansion up to 0.9 MTPA
• Stake in BPCL (280 KTPA) & OPAL (1.1 MTPA)
Business Portfolio
8
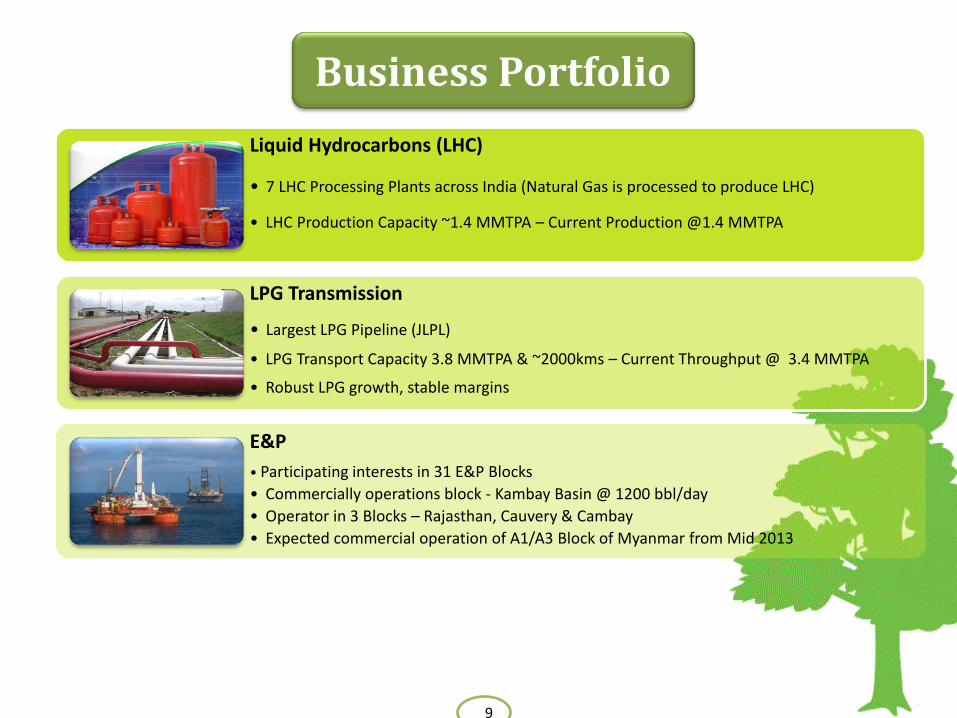
Liquid Hydrocarbons (LHC)
• 7 LHC Processing Plants across India (Natural Gas is processed to produce LHC)
• LHC Production Capacity ~1.4 MMTPA – Current Production @1.4 MMTPA
LPG Transmission
• Largest LPG Pipeline (JLPL)
• LPG Transport Capacity 3.8 MMTPA & ~2000kms – Current Throughput @ 3.4 MMTPA
• Robust LPG growth, stable margins
E&P
• Participating interests in 31 E&P Blocks
• Commercially operations block - Kambay Basin @ 1200 bbl/day
• Operator in 3 Blocks – Rajasthan, Cauvery & Cambay
• Expected commercial operation of A1/A3 Block of Myanmar from Mid 2013
Business Portfolio
9

10
Subsidiary
GAIL Gas
BCPL
GAIL Global, Singapore
GAIL Global, USA
JVs CGD - JVs
Maharashtra Nat Gas
Avantika gas
Bhagyanagar Gas
Central UP Gas
Green Gas Ltd.
Mahanagar Gas
Indraprastha Gas
Tripura NGCL
OPAL
PLL
RGPPL
GAIL China Gas Global Energy Holding
Associates
GSEG
Fayum Gas, Egypt
NATGAS, Egypt
China Gas Holding Ltd.
GAIL Group

GAIL’s Pan-India Presence
11
Surat Paradip Pipeline

GAIL’s Pan-India Presence
12

Performance Highlights
13
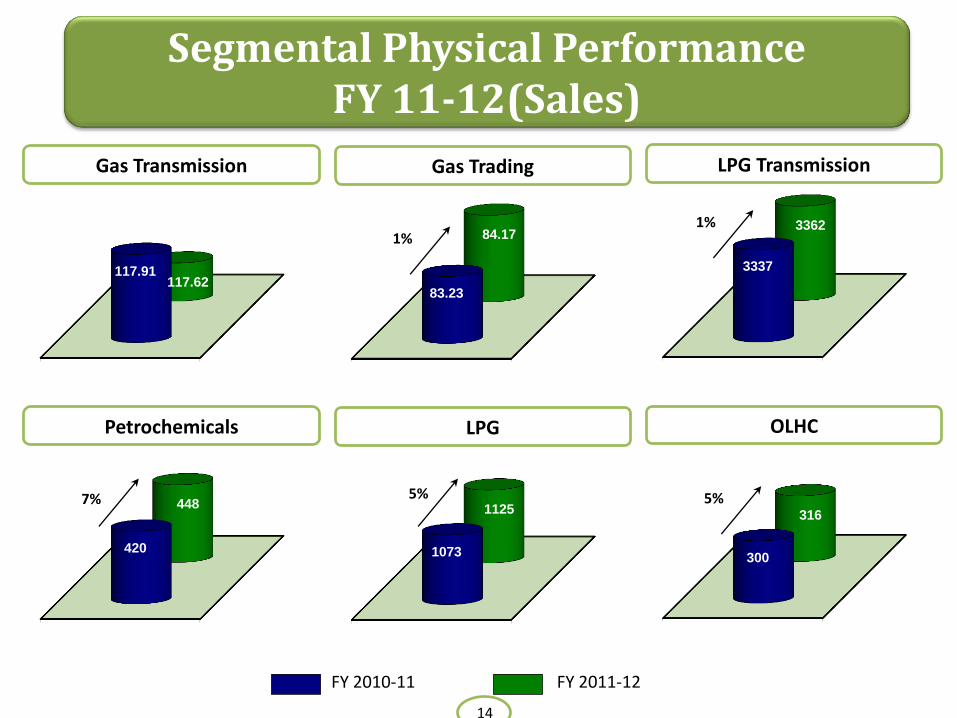
117.91 117.62
Segmental Physical Performance FY 11-12(Sales)
Gas Transmission
83.23
84.17 1%
Gas Trading
420
448 7%
Petrochemicals
1073
1125 5%
LPG
FY 2010-11 FY 2011-12
3337
3362 1%
LPG Transmission
300
316
5%
OLHC
14

32459
40281 24%
HIGHLIGHTS – FINANCIAL PERFORMANCE (` IN CR)
Sales (Net of ED)
5973
6247 5%
Gross Margin (PBDIT)
5240
5340 2%
PBT
3561
3654 3%
PAT
FY 2010-11 FY 2011-12
LPG Subsidy for FY 11-12: ` 3183 Cr (` 2111 Cr for FY 10-11) 15

0
1000
2000
3000
4000
0
5,000
10,000
15,000
20,000
25,000
30,000
35,000
40,000
45,000
2003
-04
2004
-05
2005
-06
2006
-07
2007
-08
2008
-09
2009
-10
2010
-11
201
1-1
2
Subsidy Turnover with Subsidy
Turnover without Subsidy
Financials – With & Without Subsidy
Turnover PAT
Turnover with Subsidy - ` 40281 Cr. (24% ↑ YoY)
Turnover without Subsidy - ` 43464 Cr. (26% ↑ YoY)
PAT with Subsidy - ` 3654 Cr. (3% ↑ YoY)
PAT without Subsidy - ` 5804 Cr. (17% ↑ YoY)
FY 2011-12 vs. FY 2010-11
16
0
1000
2000
3000
4000
0
1,000
2,000
3,000
4,000
5,000
6,000
200
3-0
4
2004
-05
2005
-06
2006
-07
200
7-0
8
2008
-09
2009
-10
2010
-11
2011
-12
Subsidy PAT with Subsidy PAT without Subsidy
Sub
sid
y
Sub
sid
y

Financial Highlights
17
38%
5%
20%
27%
10%
NG Trans LPG Trans NG Trad Petro LHC
Breakup of Turnover - ` 40281 Cr
9% 1%
74%
8%8%
Breakup of Profit Before Tax - ` 5340 Cr
% share in Turnover & PBT is Excluding Unallocated Segment
Gas Sector Analysis
18

Energy Consumption in India
0
200
400
600
800
1000
1200
1400
1600
1800
2010 2030 2050
Gas Power Coal Petroleum Others
+1.9%
+3.2%
+2.8%
+4.3%
+4.5%
CAGR (2010-2050)
Ener
gy C
on
sum
pti
on
in
MTO
E
Source: McKinney Global Energy Perspective 2050
Energy consumption in India to grow by 3 per cent with natural gas growing the fastest at 4.5 per cent
19
20
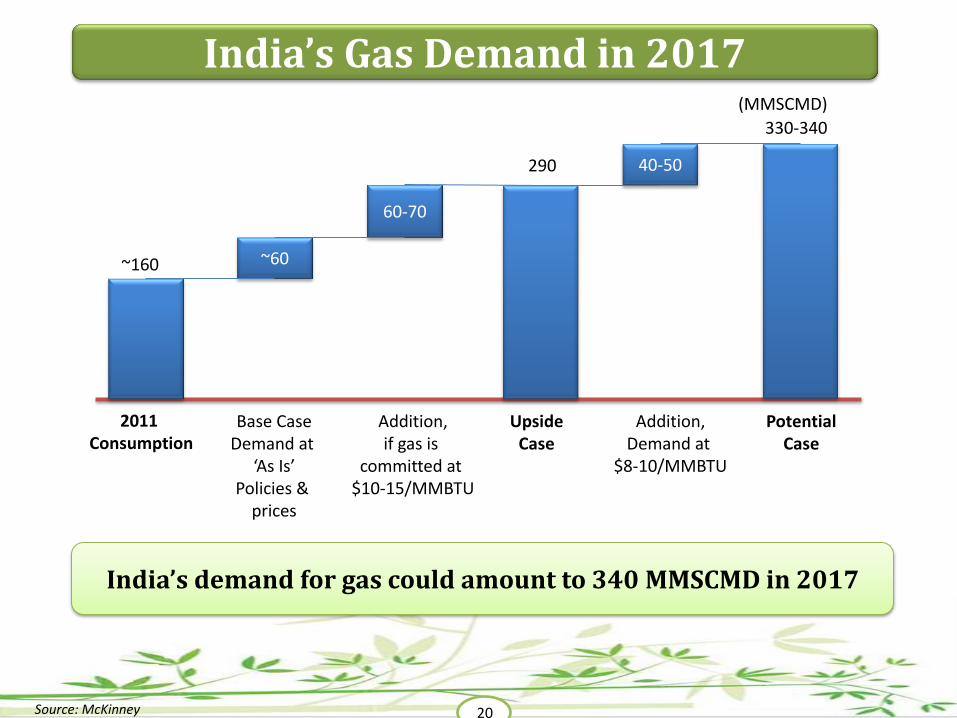
India’s Gas Demand in 2017
Source: McKinney
(MMSCMD)
40-50
60-70
~60
2011 Consumption
~160
290
330-340
Base Case Demand at
‘As Is’ Policies &
prices
Addition, if gas is
committed at $10-15/MMBTU
Upside Case
Potential Case
Addition, Demand at
$8-10/MMBTU
India’s demand for gas could amount to 340 MMSCMD in 2017

21
Current Gas Supply (2012)
Source: McKinney
(MMSCMD)
Current domestic gas supply is insufficient, necessitating imports
22
28
15
ONGC/OIL
60
~160
PMT/JVs RIL (KG) Total Domestic
Supply
TOTAL SUPPLY
Contracted LNG
35
110
SPOT LNG

Future Gas Sources by 2017
Source: McKinney
India can access an additional 70–100 MMSCMD from domestic sources of gas by 2017, but will still need to rely on LNG for the balance 35 MMSCMD
Source Potential Supply
(MMSCMD) Potential Landed Price ($/MMBTU)
Domestic (Conv.+D/W) 60-100 7-9
CBM/Marginal fields 10-30 7-9
TAPI 40 10-15
Shale gas# 0-2 6-9
LNG – HH linked 10-15 11-13
LNG – spot + contracted 15-20 16-18
TOTAL 135-200
# India’s shale policy to be finalised only by 2013; unlikely that large-scale shale gas production would occur by 2017
22

Gas Price Segmentation
Source: McKinney, assuming crude @$90/BBL
(MMSCMD)
Upto $10/MMBTU Upto $14/MMBTU Upto $18/MMBTU
150-160 60-70
210-230
60-70
60
270-290
Power (CCGT), Fertilizer (Gas), Steel
Fertilizers (Naphtha), Fertilizers (FO), Industrial, CGD, Power (CCHP), Power (Peaking), Petrochemicals, Refining
Power (Naphtha), Captive Power, Refining (Naphtha)
Three broad price segments exist in India’s gas market, although the end user and geographic segments are many more in number.
Price
23

0
2,500
5,000
7,500
10,000
2012-13 2013-14 2014-15
Pipeline E&P Petro Others
7354 7260
3772
Planned Capex from 2012-13 to 2014-15
`18,386 Cr
% share of Capex
36%
8% 40%
16%
(` in Cr)
Projected Capex
24
GAIL has a history of Excellent Project Management to execute the Project within given time frame and without cost over run

Planned Borrowings from 2012-13 to 2014-15
~ `8,100 Cr
Projected Capex Funding
4,500
3,600
0
2,000
4,000
6,000
2012-13 2013-14
Borrowing Portfolio
46%
18%
25%
11%
ECA/ECB BondsOIDB Term Loan
(` in Cr)
25
Aggressive Capex Plan calls for Borrowings (Domestic & International) Leverage on GAIL’s very low debt Equity ratio (0.25:1) as on 31.03.2012
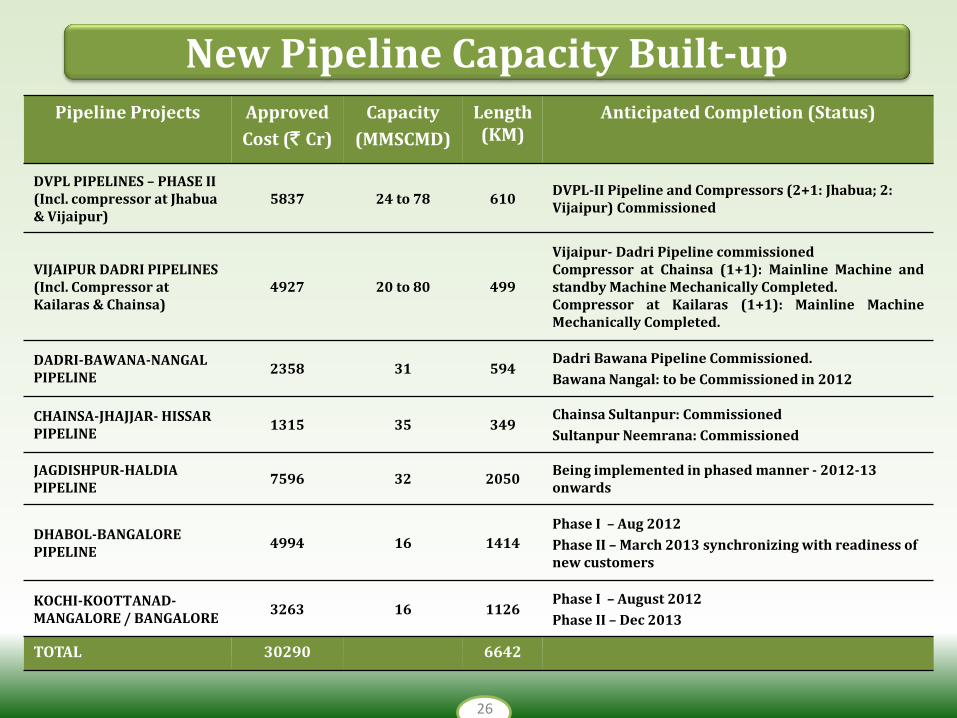
Pipeline Projects Approved
Cost (` Cr)
Capacity
(MMSCMD)
Length (KM)
Anticipated Completion (Status)
DVPL PIPELINES – PHASE II (Incl. compressor at Jhabua & Vijaipur)
5837 24 to 78 610 DVPL-II Pipeline and Compressors (2+1: Jhabua; 2: Vijaipur) Commissioned
VIJAIPUR DADRI PIPELINES (Incl. Compressor at Kailaras & Chainsa)
4927 20 to 80 499
Vijaipur- Dadri Pipeline commissioned Compressor at Chainsa (1+1): Mainline Machine and standby Machine Mechanically Completed. Compressor at Kailaras (1+1): Mainline Machine Mechanically Completed.
DADRI-BAWANA-NANGAL PIPELINE
2358 31 594 Dadri Bawana Pipeline Commissioned.
Bawana Nangal: to be Commissioned in 2012
CHAINSA-JHAJJAR- HISSAR PIPELINE
1315 35 349 Chainsa Sultanpur: Commissioned
Sultanpur Neemrana: Commissioned
JAGDISHPUR-HALDIA PIPELINE
7596 32 2050 Being implemented in phased manner - 2012-13 onwards
DHABOL-BANGALORE PIPELINE
4994 16 1414
Phase I – Aug 2012
Phase II – March 2013 synchronizing with readiness of new customers
KOCHI-KOOTTANAD-MANGALORE / BANGALORE
3263 16 1126 Phase I – August 2012
Phase II – Dec 2013
TOTAL 30290 6642
New Pipeline Capacity Built-up
26

Total Blocks 31
Onshore Blocks 9
Offshore Blocks Deep 15 & Shallow – 7
Major Operators ONGC, OIL, GSPC, Daewoo, Petrogas, Hardy, Eni, Jubilant, Dart Energy
Net investment `2854 Cr (upto 31.03.2011)
Hydrocarbons Discoveries where appraisal & Development activities are in progress
Hydrocarbons Discoveries in 7 Existing Blocks : Cambay onland, A1 & A3 blocks (Myanmar), Mahanadi offshore, Ankleshwar onland, Cauvery offshore & Tripura Onland
Operator in 3 blocks RJ-ONN-2004/1 (NELP-VI), CY-ONN-2005/1 (NELP-VII) & CB-ONN-2010/11 (NELP-IX)
Commercial Block Crude oil from Cambay Basin
E&P Activities
27
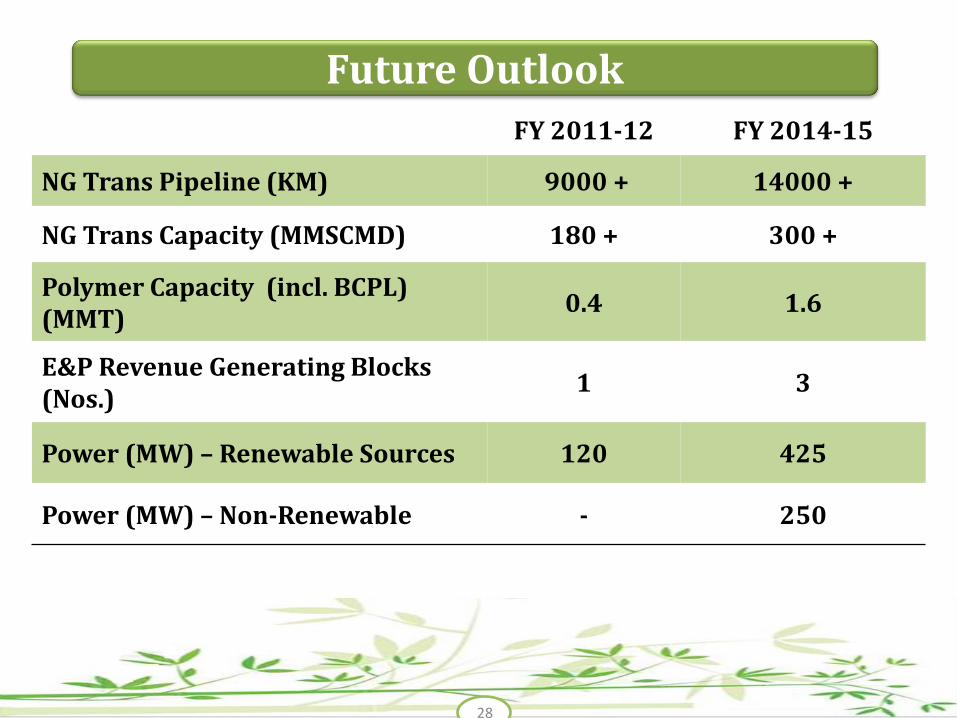
FY 2011-12 FY 2014-15
NG Trans Pipeline (KM) 9000 + 14000 +
NG Trans Capacity (MMSCMD) 180 + 300 +
Polymer Capacity (incl. BCPL) (MMT)
0.4 1.6
E&P Revenue Generating Blocks (Nos.)
1 3
Power (MW) – Renewable Sources 120 425
Power (MW) – Non-Renewable - 250
Future Outlook
28

Identified as a Thrust Area Wind Power - 120 MW commissioned Won bid for Solar Power Strategy in place for Non-renewable
LNG (Dabhol & Kochi), Incremental RIL, ONGC- Marginal Fields, TAPI, NELP Blocks, FSRU, New LNG Terminals
29
Additional Gas
Availability
Pata Expansion, Participation in BCPL-Assam, OPaL- Dahej / participation overseas Petrochemical projects
Petro-chemical
Expansion
8 JVs already operational, GAIL Gas Ltd, a 100% Subsidiary incorporated ; More than 230 cities identified for CGD in a phased manner
City Gas Distribution
Power Sector
Growth Drivers

30
Growing with Green Energy
In almost all Asian cultures, the bamboo plant or more appropriate “bamboo grass” has been treated reverentially attributing to it several virtues such as creation, longevity, adaptability and humility. Bamboo’s long life makes it a Chinese symbol of longevity, while in India it is a symbol of friendship. In Japan, bamboo forests often surround Shinto Shrines as a sacred protection against evil spirits. In Vietnam, bamboo is a symbol for soul and often represents ideas of hard work, optimism, unity and adaptability. Some Asian cultures even believe that humanity emerged from a bamboo stem. In Hawaiian legend, bamboo is considered the corporal form of the Polynesian creator god, Kane Milohai. Myths and Legends apart, bamboo commonly referred to as “Grass of steel” is a symbol of strength, versatility, flexibility, tenacity and endurance. Which is why this mystical plant symbolizes GAIL in its myriad ways. Among the many amazing facets of bamboo is its fast rate of growth. In fact, no other plant in the world grows faster than bamboo. The growth of GAIL is almost similar, and inspite of being one of the youngest PSUs in the country it has a proven track record of robust growth and performance. And the growth story continues…
Thank You


