79
Growth and Change
Growth and Change
2 TESCO CORPORATION – ANNUAL REPORT 2013
20122013 2011except
2010 2009
**
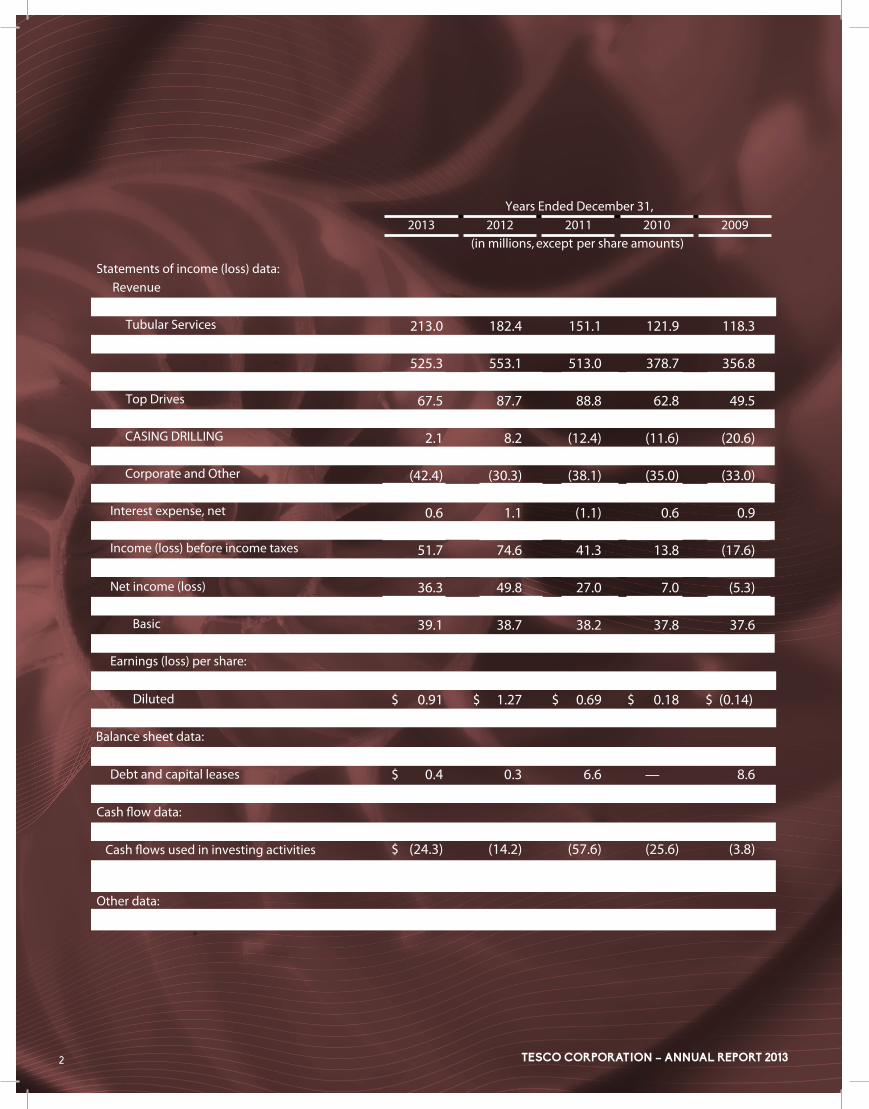
$ 311.7 $ 357.8 $ 344.7 $ 243.9 $ 224.8 213.0 182.4 151.1 121.9 118.3 0. 6 12.9 17.2 12.9 13.7 525.3 553.1 513.0 378.7 356.8 67.5 87.7 88.8 62.8 49.5 37.0 21.7 16.7 8.2 (2.9) 2.1 8.2 (12.4) (11.6) (20.6) (8.6) (10.5) (12.5) (9.1) (7.4) (42.4) (30.3) (38.1) (35.0) (33.0) 55.6 76.8 42.5 15.3 (14.4) 0.6 1.1 (1.1) 0.6 0.9 (3.3) 1.1 2.3 0.9 2.3 51.7 74.6 41.3 13.8 (17.6) 15.4 24.8 14.3 6.8 (12.3) 36.3 49.8 27.0 7.0 (5.3)
39.1 38.7 38.2 37.8 37.6 39.8 39.1 38.9 38.3 37.6 $ 0.93 $ 1.29 $ 0.71 $ 0.19 $ (0.14) $ 0.91 $ 1.27 $ 0.69 $ 0.18 $ (0.14) $ — $ — $ — $ — $ — $ 637.7 $ 583.8 $ 549.2 $ 454.9 $ 442.6 $ 0.4 0.3 6.6 — 8.6 $ 517.0 469.5 412.8 375.7 362.2
$ 94.0 $ 17.6 $ 19.3 $ 54.8 $ 63.0 $ (24.3) (14.2) (57.6) (25.6) (3.8) $ 5.5 (4.4) 0.8 (8.4) (40.4)
$ 96.9 21.8 16.4 60.6 31.3
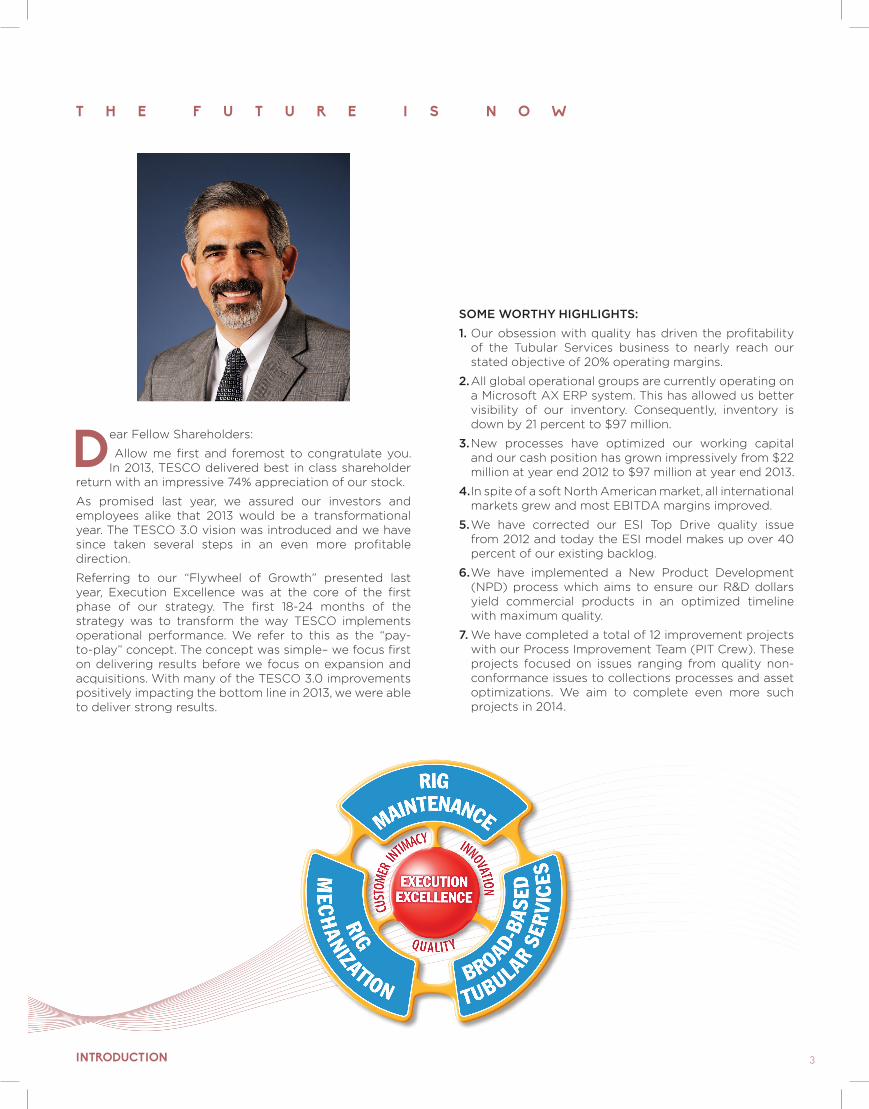
Dear Fellow Shareholders:
Allow me first and foremost to congratulate you. In 2013, TESCO delivered best in class shareholder
return with an impressive 74% appreciation of our stock.
As promised last year, we assured our investors and employees alike that 2013 would be a transformational year. The TESCO 3.0 vision was introduced and we have since taken several steps in an even more profitable direction.
Referring to our “Flywheel of Growth” presented last year, Execution Excellence was at the core of the first phase of our strategy. The first 18-24 months of the strategy was to transform the way TESCO implements operational performance. We refer to this as the “pay-to-play” concept. The concept was simple– we focus first on delivering results before we focus on expansion and acquisitions. With many of the TESCO 3.0 improvements positively impacting the bottom line in 2013, we were able to deliver strong results.
INTRODUCTION
SOME WORTHY HIGHLIGHTS:1. Our obsession with quality has driven the profitability
of the Tubular Services business to nearly reach our stated objective of 20% operating margins.
2. All global operational groups are currently operating on a Microsoft AX ERP system. This has allowed us better visibility of our inventory. Consequently, inventory is down by 21 percent to $97 million.
3. New processes have optimized our working capital and our cash position has grown impressively from $22 million at year end 2012 to $97 million at year end 2013.
4. In spite of a soft North American market, all international markets grew and most EBITDA margins improved.
5. We have corrected our ESI Top Drive quality issue from 2012 and today the ESI model makes up over 40 percent of our existing backlog.
6. We have implemented a New Product Development (NPD) process which aims to ensure our R&D dollars yield commercial products in an optimized timeline with maximum quality.
7. We have completed a total of 12 improvement projects with our Process Improvement Team (PIT Crew). These projects focused on issues ranging from quality non-conformance issues to collections processes and asset optimizations. We aim to complete even more such projects in 2014.
T H E F U T U R E I S N O W
3

Standards that set the benchmark
TESCO CORPORATION – ANNUAL REPORT 2013
E X C E P T I O N A L P E R F O R M A N C E
6
Our obsession with Quality is paying off in many ways. As we continue to hone our skills in all aspects of our business, I have no doubt that we will drive performance in 2014 unlike ever before at TESCO. We are committed to implementing TESCO 3.0 starting from the ground up. We, the investors and employees alike, will be the benefactors of this continual obsession with Quality.
However, the most important part of our obsession with Quality in 2013 is that many of the changes we have implemented will not yield maximum financial value until 2014 and beyond.
Perhaps the greatest story of 2013 is one which is often not seen by our investors, but one which translates into real value by minimizing costs and supporting
customer loyalty. This is in the area of Quality, Health, Safety and Environment (QHSE). TESCO has proudly posted the best safety performance in the history of the company with a first quartile Total Recordable Incident Rate (TRIR) of 1.13.
Safety, besides being a moral mandate for all our leaders, truly adds value to the bottom line. As an example, I would like to share the performance of our Asian operations in Tubular Services as we work for several companies in this part of the world. Many, as a result of our exceptional performance, work exclusively with TESCO and are willing to pay a premium for our service. In fact, one major customer in the region (who maintains a very extensive evaluation of its contractors) rates TESCO as the best service company it contracts with, inclusive of the large drilling contractors and the largest of service companies. As seen from the chart below, our QHSE excellence corresponds with steady growth and improved profitability over several years.
TE SCO GLOBAL TRI R - YE
1 . 4
1 . 2
0 . 8
0 . 4
1
0 . 6
0 . 2
0
A p rM a rFe bJ a n M a y J u n e J u l y A u g S e p t O c t N o v D e c
0.86
0.650.73
0.70 0.72
0.84
0.98 1.04 1.01
1.16
TRIR Target
0.430.44
1.13
INTE RNAT IONAL TUBUL AR SE RVICE SOPE RAT ING INCOME IN M I LL IONS
$ 3 0
$ 2 5
$ 1 5
$ 5
$ 2 0
$ 1 0
$ 0
( $ 5 )
2 0 1 02 00 92 00 82 00 7 2 0 1 1 2 0 1 2 2 0 1 3 2 0 1 4
$5.2$3.9
$2.5
$6.3
-$2.9
$25.1
$ 1 2 0
$ 8 0
$ 4 0
$ 1 00
$ 60
$ 2 0
$ 0
2 0 1 02 00 92 00 82 00 7 2 0 1 1 2 0 1 2 2 0 1 3 2 0 1 4
$37.0
$39.9 $53.5
$108.3
$76.8
$37.2
INTE RNAT IONAL TUBUL AR SE RVICE SRE VENUE IN M I LL IONS
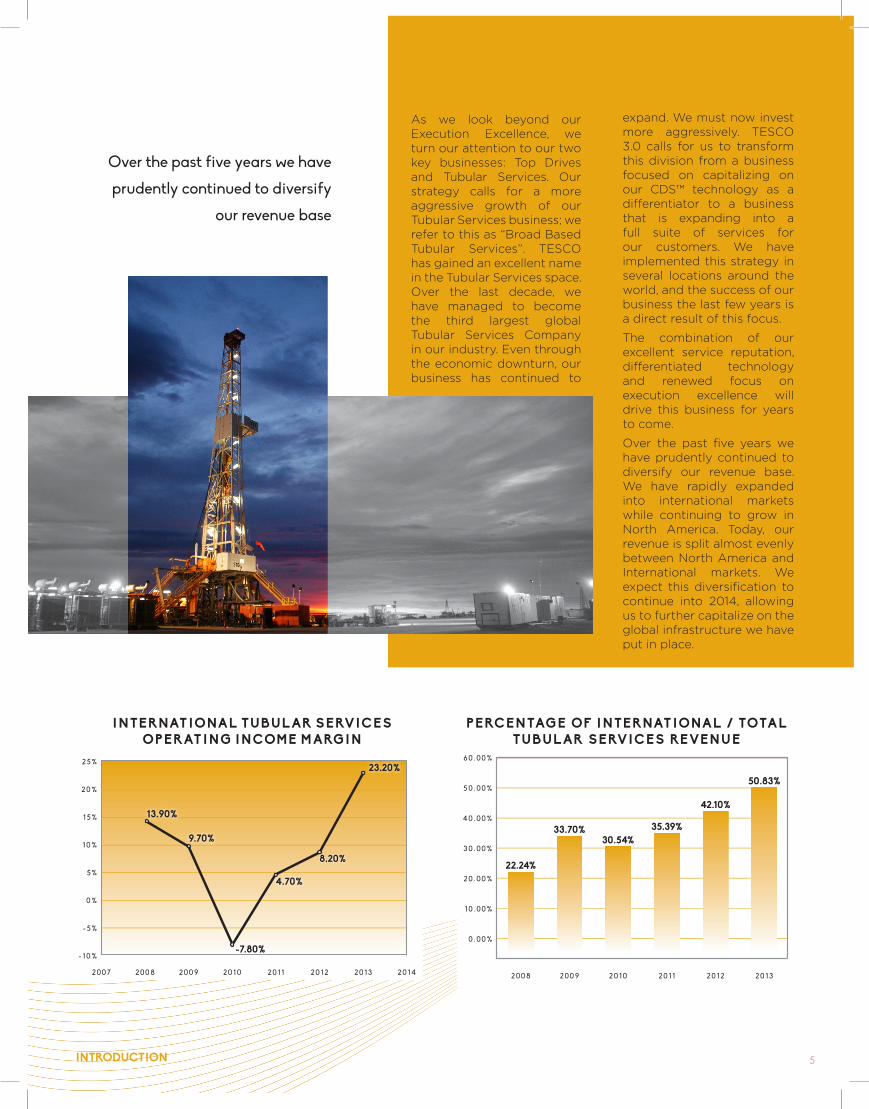
Over the past five years we have
prudently continued to diversify
our revenue base
INTRODUCTION
expand. We must now invest more aggressively. TESCO 3.0 calls for us to transform this division from a business focused on capitalizing on our CDS™ technology as a differentiator to a business that is expanding into a full suite of services for our customers. We have implemented this strategy in several locations around the world, and the success of our business the last few years is a direct result of this focus.
The combination of our excellent service reputation, differentiated technology and renewed focus on execution excellence will drive this business for years to come.
Over the past five years we have prudently continued to diversify our revenue base. We have rapidly expanded into international markets while continuing to grow in North America. Today, our revenue is split almost evenly between North America and International markets. We expect this diversification to continue into 2014, allowing us to further capitalize on the global infrastructure we have put in place.
5
As we look beyond our Execution Excellence, we turn our attention to our two key businesses: Top Drives and Tubular Services. Our strategy calls for a more aggressive growth of our Tubular Services business; we refer to this as “Broad Based Tubular Services”. TESCO has gained an excellent name in the Tubular Services space. Over the last decade, we have managed to become the third largest global Tubular Services Company in our industry. Even through the economic downturn, our business has continued to
2 0 %
2 5 %
1 0 %
0 %
1 5 %
5 %
- 5 %
- 1 0 %
2 0 1 02 00 92 00 82 00 7 2 0 1 1 2 0 1 2 2 0 1 3 2 0 1 4
13.90%
9.70%
4.70%
23.20%
8.20%
-7.80%
INTE RNAT IONAL TUBUL AR SE RVICE SOPE RAT ING INCOME MARG IN
PE RCENTAGE OF INTE RNAT IONAL / TOTALTUBUL AR SE RVICE S RE VENUE
60 . 00 %
5 0 . 00 %
3 0 . 00 %
1 0 . 00 %
4 0 . 00 %
2 0 . 00 %
0 . 00 %
2 0 1 02 00 92 00 8 2 0 1 1 2 0 1 2 2 0 1 3
22.24%
33.70% 35.39%
42.10%
30.54%
50.83%
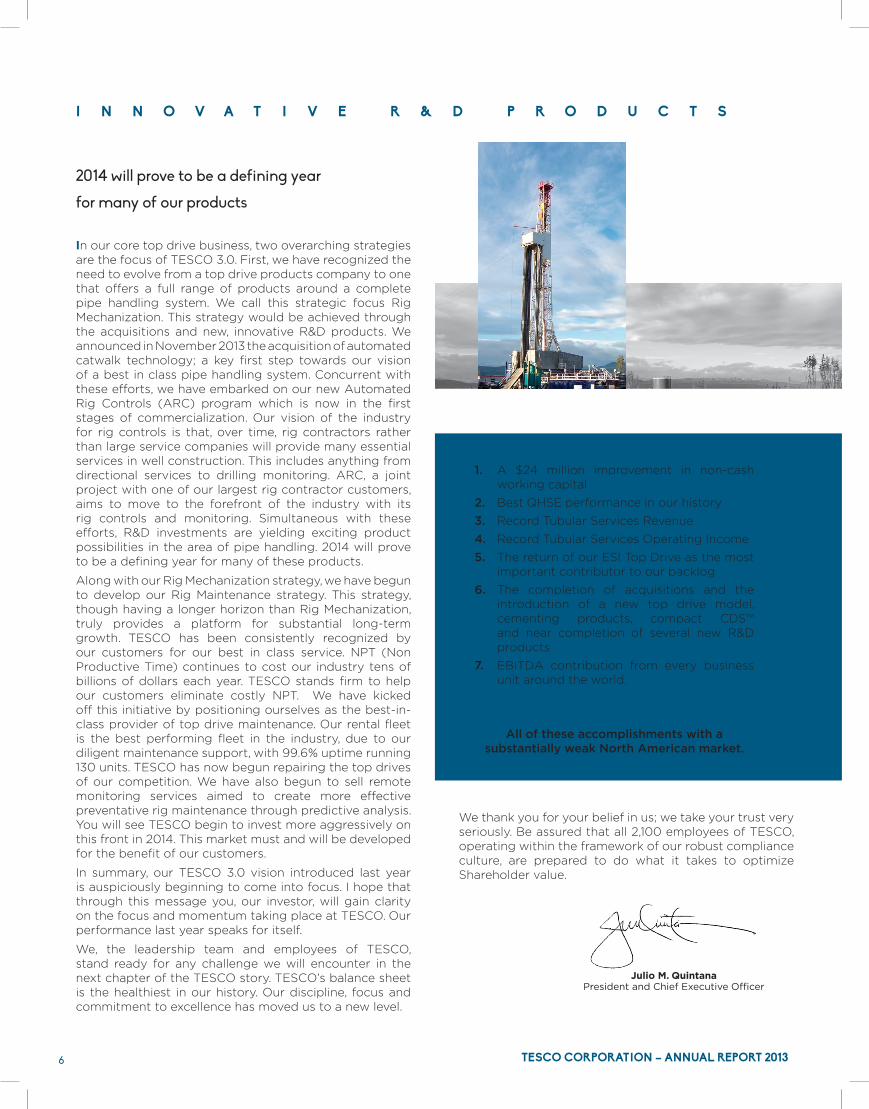
2014 will prove to be a defining year
for many of our products
TESCO CORPORATION – ANNUAL REPORT 2013
I N N O V A T I V E R & D P R O D U C T S
6
1. A $24 million improvement in non-cash working capital
2. Best QHSE performance in our history
3. Record Tubular Services Revenue
4. Record Tubular Services Operating Income
5. The return of our ESI Top Drive as the most important contributor to our backlog
6. The completion of acquisitions and the introduction of a new top drive model, cementing products, compact CDS™ and near completion of several new R&D products
7. EBITDA contribution from every business unit around the world.
All of these accomplishments with a substantially weak North American market.
In our core top drive business, two overarching strategies are the focus of TESCO 3.0. First, we have recognized the need to evolve from a top drive products company to one that offers a full range of products around a complete pipe handling system. We call this strategic focus Rig Mechanization. This strategy would be achieved through the acquisitions and new, innovative R&D products. We announced in November 2013 the acquisition of automated catwalk technology; a key first step towards our vision of a best in class pipe handling system. Concurrent with these efforts, we have embarked on our new Automated Rig Controls (ARC) program which is now in the first stages of commercialization. Our vision of the industry for rig controls is that, over time, rig contractors rather than large service companies will provide many essential services in well construction. This includes anything from directional services to drilling monitoring. ARC, a joint project with one of our largest rig contractor customers, aims to move to the forefront of the industry with its rig controls and monitoring. Simultaneous with these efforts, R&D investments are yielding exciting product possibilities in the area of pipe handling. 2014 will prove to be a defining year for many of these products.
Along with our Rig Mechanization strategy, we have begun to develop our Rig Maintenance strategy. This strategy, though having a longer horizon than Rig Mechanization, truly provides a platform for substantial long-term growth. TESCO has been consistently recognized by our customers for our best in class service. NPT (Non Productive Time) continues to cost our industry tens of billions of dollars each year. TESCO stands firm to help our customers eliminate costly NPT. We have kicked off this initiative by positioning ourselves as the best-in-class provider of top drive maintenance. Our rental fleet is the best performing fleet in the industry, due to our diligent maintenance support, with 99.6% uptime running 130 units. TESCO has now begun repairing the top drives of our competition. We have also begun to sell remote monitoring services aimed to create more effective preventative rig maintenance through predictive analysis. You will see TESCO begin to invest more aggressively on this front in 2014. This market must and will be developed for the benefit of our customers.
In summary, our TESCO 3.0 vision introduced last year is auspiciously beginning to come into focus. I hope that through this message you, our investor, will gain clarity on the focus and momentum taking place at TESCO. Our performance last year speaks for itself.
We, the leadership team and employees of TESCO, stand ready for any challenge we will encounter in the next chapter of the TESCO story. TESCO’s balance sheet is the healthiest in our history. Our discipline, focus and commitment to excellence has moved us to a new level.
Julio M. QuintanaPresident and Chief Executive Officer
We thank you for your belief in us; we take your trust very seriously. Be assured that all 2,100 employees of TESCO, operating within the framework of our robust compliance culture, are prepared to do what it takes to optimize Shareholder value.
UNITED STATESSECURITIES AND EXCHANGE COMMISSION
Washington, D.C. 20549
Form 10-KANNUAL REPORT PURSUANT TO SECTION 13 OR 15(d) OF THE SECURITIES EXCHANGE ACT OF 1934
For the Fiscal Year Ended December 31, 2013
TRANSITION REPORT PURSUANT TO SECTION 13 OR 15(d) OF THE SECURITIES EXCHANGE ACT OF 1934
For the transition period from to Commission file number: 001-34090
Tesco Corporation(Exact name of registrant as specified in its charter)
Alberta 76-0419312(State or Other Jurisdiction
of Incorporation or Organization)(I.R.S. Employer
Identification No.)
3993 West Sam Houston Parkway NorthSuite 100
Houston, Texas 77043-1221(Address of Principal Executive Offices) (Zip Code)
713-359-7000(Registrant’s telephone number, including area code)
Securities to be registered pursuant to Section 12(b) of the Act:
Title of Each Class Name of Each Exchange on Which RegisteredCommon Shares, without par value Nasdaq Stock Market
Securities registered pursuant to Section 12(g) of the Act:None
Indicate by check mark if the registrant is a well-known seasoned issuer, as defined in Rule 405 of the Securities Act. Yes No Indicate by check mark if the registrant is not required to file reports pursuant to Section 13 or 15(d) of the Act. Yes No Indicate by check mark whether the registrant (1) has filed all reports required to be filed by Section 13 or 15(d) of the Securities Exchange
Act of 1934 during the preceding 12 months (or for such shorter period that the registrant was required to file such reports), and (2) has been subject to such filing requirements for the past 90 days. Yes No
Indicate by check mark whether the registrant has submitted electronically and posted on its corporate Web site, if any, every Interactive Data File required to be submitted and posted pursuant to Rule 405 of Regulation S-T during the preceding 12 months (or for such shorter period that the registrant was required to submit and post such files). Yes No
Indicate by check mark if disclosure of delinquent filers pursuant to Item 405 of Regulation S-K is not contained herein, and will not be contained, to the best of registrant’s knowledge, in definitive proxy or information statements incorporated by reference in Part III of this Form 10-K or any amendment to this Form 10-K.
Indicate by check mark whether the registrant is a large accelerated filer, an accelerated filer, a non-accelerated filer, or a smaller reporting company. See the definitions of “large accelerated filer,” “accelerated filer” and “smaller reporting company” in Rule 12b-2 of the Exchange Act. (Check one):
Large accelerated filer Accelerated filer Non-accelerated filer (Do not check if a smaller reporting company) Smaller reporting company
Indicate by check mark whether registrant is a shell company (as defined in Rule 12b-2 of the Exchange Act). Yes No The aggregate market value of voting and non-voting common equity held by non-affiliates of the registrant at the close of business on
June 28, 2013 was $377,359,706 based upon the last sales price reported for such date on the NASDAQ Stock Market. For purposes of this disclosure, shares of common stock held by persons who hold more than 5% of the outstanding shares of common stock and shares held by
Table of Contents

officers and directors of the registrant as of June 28, 2013 have been excluded as such persons may be deemed to be affiliates. This determination is not necessarily conclusive.
Number of shares of Common Stock outstanding as of February 28, 2014: 39,690,056
DOCUMENTS INCORPORATED BY REFERENCEPortions of the Proxy Statement for the registrant’s 2014 Annual Meeting of Stockholders are incorporated by reference into Part III of this
Report on Form 10-K.
Table of Contents

TABLE OF CONTENTS
Page PART I Item 1.Item 1A.Item 1B.Item 2.Item 3.Item 4.
PART II Item 5.
Item 6.Item 7.Item 7A.Item 8.Item 9.Item 9A.Item 9B.
PART III Item 10.Item 11.Item 12.Item 13.Item 14.
PART IV Item 15.
Below is a list of defined terms that are used throughout this document:
TESCO Casing Drilling® = Casing DrillingTESCO’s Casing Drive System = CDSTM or CDSTESCO’s Multiple Control Line Running System = MCLRSTM or MCLRSTESCO's After Market Sales and Services = AMSS
A list of our trademarks and the countries in which they are registered is presented below:
Trademark Country of RegistrationTESCO® United States, CanadaTESCO Casing Drilling® United StatesCasing Drilling® CanadaCasing Drilling™ United StatesCasing Drive System™ United States, CanadaCDS™ United States, CanadaMultiple Control Line Running System™ United States, CanadaMCLRS™ United States, Canada
Table of Contents
Business 1Risk Factors 6Unresolved Staff Comments 13Properties 13Legal Proceedings 14Mine Safety Disclosures 14
Market for Registrant’s Common Equity, Related Stockholder Matters and Issuer Purchases of Equity Securities 15
Selected Financial Data 16Management’s Discussion and Analysis of Financial Condition and Results of Operations 19Quantitative and Qualitative Disclosures About Market Risk 29Financial Statements and Supplementary Data 30Changes in and Disagreements with Accountants on Accounting and Financial Disclosure 31Controls and Procedures 31Other Information 32
Directors, Executive Officers and Corporate Governance 33Executive Compensation 33Security Ownership of Certain Beneficial Owners and Management and Related Stockholder Matters 33Certain Relationships and Related Transactions and Director Independence 33Principal Accountant Fees and Services 33
Exhibits and Financial Statement Schedules 34

When we refer to “TESCO”, “we”, “us”, “our”, “ours”, or “the Company”, we are describing Tesco Corporation and our subsidiaries.
This Annual Report on Form 10-K for the fiscal year ended December 31, 2013 (the"Report on Form 10-K"), contains "forward-looking statements" within the meaning of Canadian and United States securities laws, including within the safe harbor provisions of the United States Private Securities Litigation Reform Act of 1995. From time to time, our public filings, press releases and other communications by our officers and representatives (such as conference calls and presentations) will contain forward-looking statements. Forward-looking information is often, but not always, identified by the use of words such as “anticipate”, “believe”, “expect”, “plan”, "goal", "seek", "strategy", "future", “intend”, “forecast”, “target”, “project”, "likely", “may”, “will”, “should”, “could”, “estimate”, “predict” or similar words suggesting future outcomes or language suggesting an outlook. Forward-looking statements in this Report on Form 10-K include, but are not limited to, statements with respect to expectations of our prospects, future revenue, earnings, activities, and technical results.
Forward-looking statements are neither historical facts nor assurances of future performance. Instead, they are based only on our current beliefs, expectations, and assumptions regarding the future of our business, future plans and strategies, projections, anticipated events, and trends, the economy, and other future conditions. The forward-looking statements in this Report on Form 10-K are made as of the date it was issued and we do not undertake any obligation to update publicly or to revise any of the included forward-looking statements, whether as a result of new information, future events, or otherwise, except as required by applicable law.
By their very nature, forward-looking statements involve inherent risks and uncertainties, both general and specific, and risks that outcomes implied by forward-looking statements will not be achieved. We caution readers not to place undue reliance on these statements as a number of important factors could cause the actual results to differ materially from the beliefs, plans, objectives, expectations and anticipations, estimates, and intentions expressed in such forward-looking statements. Therefore, you should not rely on any of these forward-looking statements.
Table of Contents
1
PART I
Item 1. Business General
We are a global leader in the design, manufacture, and service delivery of technology-based solutions for the upstream energy industry. We seek to change the way wells are drilled by delivering safer and more efficient solutions that add real value by reducing the costs of drilling for, and producing, oil and natural gas. Our product and service offerings consist mainly of equipment sales and services to drilling contractors and oil and natural gas operating companies throughout the world.
We were created on December 1, 1993 through the amalgamation of Shelter Oil and Gas Ltd., Coexco Petroleum Inc., Forewest Industries Ltd. and Tesco Corporation. The amalgamated corporation continued under the name Tesco Corporation, which is organized under the laws of Alberta, Canada.
Prior to the sale of the Casing Drilling business during the second quarter of 2012, our four business segments were:
• Top Drives – top drive sales, top drive rentals and after-market sales and services;
• Tubular Services – automated and conventional tubular services;
• Casing Drilling – proprietary Casing Drilling technology; and
• Research and Engineering – internal research and development activities related to our automated tubular services and top drive model development, as well as the Casing Drilling technology prior to the sale.
For further discussion of our business segments, see Part II, Item 7, Management’s Discussion and Analysis of Financial Condition and Results of Operations and Part II, Item 8, Financial Statements and Supplementary Data, Note 15 included in this Report on Form 10-K.
Top Drive segment
Our Top Drive segment sells equipment and provides services to drilling contractors and oil and natural gas operating companies throughout the world. We provide top drive rental services on a day-rate basis for land and offshore drilling rigs, and we provide after-market sales to, and service for, our customers.
We primarily manufacture top drives that are used in drilling operations to rotate the drill string and/or casing while suspended from the derrick above the rig floor. Our top drives offer portability and flexibility, permitting drilling companies to conduct top drive drilling for all or any portion of a well. We offer for sale a range of portable and permanently installed top drive products that includes both hydraulically and electrically powered machines capable of delivering 400 to 1,350 horsepower, with a rated lifting capacity of 150 to 750 tons. With each top drive we sell, we offer the services of top drive technicians who provide customers with training, installation, and support services.
We offer nine distinct model series of top drive systems, using hydraulic, permanent magnet alternating current (“AC”), and induction AC technology. We believe that we are industry leaders in the development and provision of permanent magnet technology in both portable and permanently installed top drive systems. This technology provides very high power density, allowing for high performance and low weight. We use AC induction technology and late generation power electronics in our smaller horsepower systems, such as our EMI machines, allowing the end user to specify its preferred power electronics and motor combination and permitting us to select components from a larger vendor base. EMI top drive units are available with 150 to 250 ton load path configurations. We also developed our EXI system in response to market demands for a high performance compact electric top drive system, commonly required on modern fast moving rigs frequently used in pad drilling operations. The EXI system has a load path rating of 350 to 400 tons and generates 600 horsepower at the quill. The ESI is our new model, which has a load path rating of 500 to 750 tons and generates 1,350 horsepower at the quill. The HXI is a new generation of our current hydraulic HMI system, incorporating a full suite of operational features and providing a significant gain in performance at the quill. The HXI machine has a load path rating of 150 to 250 tons and has a 700 horsepower self-contained diesel-driven hydraulic power unit.
In addition to our top drive sales, we rent top drives on a day-rate basis for land and offshore drilling rigs. Our rental fleet
offers a range of systems that can be installed in practically any mast configuration, including workover rigs. Our rental fleet is composed principally of hydraulically powered top drive systems, with power ratings of 475 to 1,205 horsepower and load path
Table of Contents

2
ratings of 150 to 650 tons, each equipped with its own independent diesel engine driven hydraulic power unit. This unique combination permits a high level of portability and installation flexibility.
Our top drive rental fleet, which was comprised of 129 units at December 31, 2013, is deployed strategically around the world to be available to customers on a timely basis. Our fleet is highly transportable and we mobilize the top drive units to meet customer requests. In order of size by region from highest to lowest, we currently have rental units in Latin America, the United States and Canada, Russia, Asia-Pacific, Europe, and the Middle East. During 2012 and 2013, we mobilized top drives to geographic areas with higher demand such as Latin America and Russia.
We also provide after-market sales and services to our installed customer base around the globe. We maintain regional stocks of high-demand parts in order to expedite top quality, original replacement parts for top drive systems. Our service offerings include the commissioning of all new units and recertification of working units including top drives, power units and various other top drive product and component repairs. Our field-experienced personnel are responsible for the rig up and installation of all units, which includes both rental units and customer-owned units. Our personnel also provide onsite training and top drive supervision. In addition, our technicians are available to perform work under ongoing maintenance contracts.
Markets and Competition
Demand for our top drive products and rental services depends primarily upon capital spending of drilling contractors and oil and natural gas companies and the level of drilling activity. Our customers for top drive sales and after-market sales and service primarily consist of drilling contractors, rig builders and equipment brokers. Occasionally, we may also sell top drives and provide after-market sales and services to major and independent oil and natural gas companies and national oil companies who wish to own and manage their own top drive systems. Our customers for our rental fleet include drilling contractors, major and independent oil and natural gas companies and national oil companies.
We estimate that approximately 60% of land drilling rigs are currently equipped with top drive systems, including Russia and China, where few rigs operate with top drives today. By contrast, we estimate that approximately 95% of offshore rigs are equipped with top drives. We were the first top drive manufacturer to provide portable top drives for land drilling rigs. We believe that significant further land-based market potential exists for our top drive drilling system technology, including both portable and permanently installed applications. Further, where many top drive systems approach the end of their useful lives and are inefficient or may not have legacy parts available, we believe that a market for replacement systems will be created. We believe the development of that market could be an important opportunity for us.
Our primary competitors in the sale of top drive systems are National Oilwell Varco, Inc. (“NOV”) and Canrig Drilling Technology Ltd., a subsidiary of Nabors Industries Ltd. In addition, low-cost manufacturers, notably from China, have entered the market in recent years. We believe that we have the second largest customer installed base and are the number two global provider of top drives, following NOV. Of the three major top drive system providers, we maintain the largest fleet of assets solely for rental purposes. Competition in our industry in the sale of top drive systems takes place primarily on the basis of the features and capacities of the equipment, the quality of the services and technical support offered, delivery lead time, and price.
Backlog
We believe that top drive sales backlog is an indicator of how our business will be affected by changes in the global macro-economic environment. However, we are continuing to see increasing numbers of intra-quarter top drive sales which are not captured in our quarterly top drive sales backlog due to the contract and sale occurring in the same quarterly period. We consider a product sale order as backlog when the customer has signed a purchase contract, submitted the purchase order and, if required by the purchase agreement, paid a non-refundable deposit. Revenue from services is recognized as the services are rendered, based upon agreed daily, hourly, or job rates. Accordingly, we have no backlog for services.
Our top drive sales backlog at December 31, 2013 was 32 units with a total potential revenue value of $44.2 million, compared to 28 units with a total potential revenue value of $42.2 million at December 31, 2012. In our North America market, we are experiencing improving quoting and bidding activity. Our customers in North America have maintained their focus on lowering project costs, which continues to put downward pressure on our product sales. Our international customers represent a large portion of our backlog and we expect this to improve heading into 2014.
We have the ability to expand or downsize our top drive manufacturing capacity to meet current and expected customer demand. In response to declining demand for our top drives due to industry and operating conditions caused by the recession, we downsized our manufacturing operations substantially during 2009. As market conditions improved during 2011 and 2012, we maintained and added to our core manufacturing team, with a current manufacturing capacity of 10 to 14 top drive units per month,
Table of Contents
3
depending on system complexity. We believe that our top drive business needs to maintain manufacturing inventory of one to two quarters of production. This limits our exposure in the event that the sales market softens and allows us to effectively manage our supply chain and workforce, yet allows us to be responsive to our client base.
Tubular Services segment
Our Tubular Services segment includes a suite of automated offerings, as well as conventional casing and tubing running services. Casing is steel pipe that is installed in oil, natural gas, or geothermal wells to maintain the structural and pressure integrity of the well bore, isolate water bearing surface sands, prevent communication between subsurface strata, and provide structural support of the wellhead and other casing and tubing strings in the well. Most operators and drilling contractors install casing and tubing using service companies, like ours, who use specialized equipment and personnel trained for this purpose. Wells can have from two to ten casing strings of various sizes installed. These jobs encompass wells from vertical holes to high angle extended reach wells and include both onshore and offshore applications.
Our patented Casing Drive System (“CDS”) is a tool which facilitates running and reaming casing into a well bore on any rig equipped with a top drive. This tool offers improved safety and efficiency over traditional methods by eliminating operations that are associated with high risk of personal injury. It also increases the likelihood that the casing can be run to casing point on the first attempt, offers the ability to simultaneously rotate and reciprocate the casing string as required while circulating drilling fluid, and requires fewer people on the rig for casing running operations than traditional methods.
Tesco also supplies a rotating Side Entry Swivel Sub (SESS). This tool works in conjunction with the CDS tool to allow rotation and reciprocation of the casing string during cementing operations. Reciprocation and rotation is recognized by the industry as greatly improving the uniformity and quality of the cement sheath around the casing, in turn helping to reduce the potential of environmental incidents.
We also offer installation service of deep water completion equipment using our Multiple Control Line Running System (“MCLRS”) proprietary and patented technology. We believe that this technology substantially improves the quality of the installation of high-end well completions by eliminating damage and splices to control and injection lines. We also believe that this technology improves the speed and safety of the completion process by splitting the work area between personnel making up the tubing and personnel installing completion equipment.
Our conventional service offerings provide equipment and personnel for the installation of tubing and casing, including power tongs, pick-up/lay-down units, torque monitoring services, and connection testing services for new well construction and in work-over and re-entry operations.
Markets and Competition
Our Tubular Services customers primarily consist of oil and natural gas operating companies, including major and independent companies, national oil companies and, on occasion, other service companies that have contractual obligations to provide tubular running and handling services. Demand for our tubular services strongly depends upon capital spending of oil and natural gas companies, the actual number of wells drilled by these companies, and the complexity of the wells drilled.
The conventional tubular services market consists generally of several large, global operators and a large number of small and medium-sized operators that typically operate in limited geographic areas where the market is highly fragmented. The largest global competitors in this market are Weatherford International, Ltd. (“Weatherford International”), Franks International, Inc., and Baker Hughes Incorporated. Competition in the conventional tubular services market takes place primarily on the basis of the quality of the services offered, the quality and utility of the equipment provided, the proximity of the service provider and equipment to the work site and price.
While we are aware of competitive technology similar to our CDS tool, we believe that we continue to be the market leader in this technology. Other companies offering similar technology and services include NOV, Weatherford International, and Franks International, Inc. Our CDS system is easily and quickly installed on any top drive system and we offer skilled and trained personnel at the field level who have specialized knowledge of top drive drilling system operations.
Casing Drilling segment
On June 4, 2012, we completed the sale of substantially all of the assets of the Casing Drilling segment to the Schlumberger Group. For detailed discussion of this matter, see Part II, Item 8, Financial Statements and Supplementary Data, Note 3 included in the Report on Form 10-K.
Table of Contents

4
The Casing Drilling process used oilfield casing in place of drill pipe to simultaneously drill and case the well, reducing both drilling time and the chance of unscheduled drilling events. Casing Drilling technology minimized the use of conventional drill pipe and drill collars and enabled the operators to eliminate pipe trips and case the interval while drilling. This avoided well bore exposure during tripping and mitigated associated risks such as borehole collapse, lost circulation problems and stuck tools or pipe.
Research and Engineering segment
As a technology-driven company, we continue to invest significantly in research and development activities, primarily related to our proprietary technologies in tubular services and top drive model development, as well as the Casing Drilling technology prior to the sale. We hold rights, through patents and patent license agreements, to patented and/or patent pending technologies for certain innovations that we believe will have application to our core businesses. We pursue patent protection in appropriate jurisdictions where we believe our innovations could have significant potential application to our core businesses. We hold patents and patent applications in the United States, Canada, Europe, and various other countries. Our patent portfolio currently includes 119 issued patents, comprised of 53 U.S. and 66 foreign patents, and 85 pending patent applications, comprised of 40 U.S. and 45 foreign patent applications. We generally retain all intellectual property rights to our technology through non-disclosure and technology ownership agreements with our employees, suppliers, consultants, and other third parties with whom we do business.
We hold patents for various specific aspects of the design of our portable top drive and related equipment. Our CDS is protected by patents on some of the gripping tools and on the “link tilt” system, which is a method used to handle casing. We hold numerous patents related to the installation and utilization of certain accessories for casing for purposes of casing rotation. Various other related methods and tools are patent protected as well.
Our research and development costs were $8.6 million, $10.5 million, and $12.5 million for the years ended 2013, 2012, and 2011, respectively. We will continue to invest in the development, commercialization, and enhancements of our proprietary technologies.
Financial Information About Geographic Areas
Our Top Drive and Tubular Services businesses are distributed globally. For the information of our property, plant, and equipment by business segment and geographic area at December 31, 2013, see Part II, Item 8, Financial Statements and Supplementary Data, Note 15 included in the Report on Form 10-K. The following table presents our revenue by segment and geographic areas for the years ended December 31, 2013, 2012, and 2011 (United States dollars in thousands):
Table of Contents

5
Top Drive Segment United States and Canada International Total Revenue % Revenue % Revenue2013 $ 172,166 55% $ 139,466 45% $ 311,6322012 217,990 61% 139,852 39% 357,8422011 219,168 64% 125,530 36% 344,698 Tubular Services Segment United States and Canada International Total Revenue % Revenue % Revenue2013 $ 111,864 53% $ 101,133 47% $ 212,9972012 109,377 60% 73,027 40% 182,4042011 97,644 65% 53,480 35% 151,124 Casing Drilling Segment (1) United States and Canada International Total Revenue % Revenue % Revenue2013 $ 624 100% $ — —% $ 6242012 4,268 33% 8,625 67% 12,8932011 4,572 27% 12,575 73% 17,147__________________________________
(1) On June 4, 2012, we completed the sale of substantially all of the assets of the Casing Drilling segment to the Schlumberger Group. For detailed discussion of this matter, see Part II, Item 8, Financial Statements and Supplementary Data, Note 3 included in this Report on Form 10-K.
Procurement of Materials and Supplies
For a discussion of the procurement of materials and supplies, see Part II, Item 8, Financial Statements and Supplementary Data, Note 15 included in this Report on Form 10-K.
Seasonality
Our business is subject to seasonal cycles associated with winter-only, summer-only, dry-season, or regulatory-based access to drilling locations. The most significant of these occur in Canada and Russia where traditionally the first and fourth calendar quarters of each year are the busiest as the contractor fleet can access drilling locations that are only accessible when frozen. As of December 31, 2013, approximately 14% of our top drive rental fleet operated in Canada and Russia.
In certain Asia Pacific and South American regions, we are subject to a decline in activities due to seasonal rains. Further, seasonal variations in the demand for hydrocarbons and accessibility of certain drilling locations in North America can affect our business as our activity follows the active drilling rig count reasonably closely. We actively manage our asset base around the world to minimize the impact of geographically specific seasonality.
Customers
Our accounts receivable are principally with major international and national oil and natural gas service and exploration and production companies and are subject to normal industry credit risks. We perform ongoing credit evaluations of customers and grant credit based upon past payment history, financial condition, and anticipated industry conditions. Customer payments are regularly monitored and a provision for doubtful accounts is established based upon specific situations and overall industry conditions. Many of our customers are located in international areas that are inherently subject to risks of economic, political and civil instabilities, including the effects of currency fluctuations and exchange controls, such as devaluation of foreign currencies and other economic problems, which may impact our ability to collect those accounts receivable. We monitor customers who are at risk for non-payment and, if warranted by the set of circumstances, will lower available credit extended to those customers or establish alternative arrangements, including increased deposit requirements or payment schedules.
One customer accounted for approximately 10% of our consolidated revenue during the year ended December 31, 2013. No single customer accounted for 10% or more of our consolidated revenue in any of the years ended December 31, 2012 and 2011.
Table of Contents
6
Employees
As of December 31, 2013, the total number of our employees worldwide was 2,125. We believe that our relationship with our employees is good. We seek to maintain a high level of employee satisfaction and we believe our employee compensation systems are competitive. Less than 5% of our employees are subject to union contracts.
Available Information
Access to our corporate governance policies and Securities and Exchange Commission (“SEC”) filings, including annual reports on Form 10-K, quarterly reports on Form 10-Q, interactive data, current reports on Form 8-K, Section 16 filings, and all amendments to those reports, are available through our website, www.tescocorp.com, free of charge. These reports are made available on our website as soon as reasonably practicable after such reports are electronically filed in the United States (“U.S.”) with the SEC and in Canada on the System for Electronic Document Analysis and Retrieval (“SEDAR”). Our Code of Business Conduct and Ethics ("Code") is also posted on our website. We intend to satisfy the disclosure requirement under Item 5.05 of Form 8-K and applicable NASDAQ rules regarding amendments to or waivers of our Code by posting this information on our website at www.tescocorp.com. In addition to our website, copies of our U.S. public filings are available at www.sec.gov and copies of our Canadian public filings are available at www.sedar.com.
We have included our website address only as an inactive textual reference. The information contained on our website is not incorporated by reference into this Report on Form 10-K.
Item 1A. Risk Factors
Cautionary Statement for Purposes of the “Safe Harbor” Provisions of the Private Securities Litigation Reform Act of 1995
We operate in an environment that involves a number of significant risks and uncertainties. We caution you to read the following risk factors, which have affected, and/or in the future could affect, our business, prospects, operating results, and financial condition. The risks described below include forward-looking statements, and actual events and our actual results may differ materially from these forward-looking statements. Additional risks and uncertainties not currently known to us or that we currently deem immaterial may also impair our business, prospects, operating results, and financial condition. Furthermore, additional risks and uncertainties are described under other captions in this Report on Form 10-K and should also be considered by our investors.
Risks associated with the global economy
The current global economic and political environment may negatively impact industry fundamentals, and the related decrease in demand for drilling rigs could cause a downturn in the oil and natural gas industry. Such a condition could have a material adverse impact on our business.
An extended deterioration in the global economic environment may impact fundamentals that are critical to our industry, such as the global demand for, and consumption of, oil and natural gas. Reduced demand for oil and natural gas generally results in lower oil and natural gas prices and prolonged weakness in the economy could impact the economics of planned drilling projects, resulting in curtailment, reduction, delay or postponement for an indeterminate period of time. Furthermore, an extended deterioration in the political environment in countries where we operate or that produce significant supply of the world’s demand for oil may also impact fundamentals that are critical to our industry, such as the global supply of oil and natural gas. Constraints in the global supply of oil caused by political turmoil in any of the large oil-producing countries of the world could significantly increase oil and natural gas prices while the removal of such constraints could significantly decrease oil and natural gas prices for an indeterminate period of time. Such volatility in oil and natural gas prices could negatively impact the world economy and our industry. Any long-term reduction in oil and natural gas prices will reduce oil and natural gas drilling and production activity and result in a corresponding decline in the demand for our products and services, which could adversely affect the demand for sales, rentals or services of our top drive units and for our Tubular Services. These reductions could adversely affect the future net realizability of assets, including inventory, fixed assets, goodwill, and other intangible assets.
Table of Contents
7
We are exposed to risks associated with the financial markets.
While we intend to finance our operations with existing cash, cash flow from operations, and borrowing under our existing credit facility, we may require additional financing to support our growth. If any of the significant lenders, insurance companies, or other financial institutions are unable to perform their obligations under our credit agreements, insurance policies, or other contracts, and we are unable to find suitable replacements on acceptable terms as a result of recent credit disruptions or otherwise, our results of operations, liquidity, and cash flows could be adversely affected.
Many of our customers access the credit markets to finance their oil and natural gas drilling and production activity. The possible inability of these parties to obtain financing on acceptable terms, due to the recent credit disruptions or otherwise, could impair their ability to perform under their agreements with us and lead to various negative effects on us, including business disruption, decreased revenue, and increases in bad debt write-offs. A sustained decline in the financial stability of these parties could have an adverse impact on our business and results of operations.
The occurrence or threat of terrorist attacks could materially impact our business.
The occurrence or threat of future terrorist attacks could adversely affect the economies of the United States and other developed countries. A lower level of economic activity could result in a decline in energy consumption, which could cause a decrease in spending by oil and natural gas companies for exploration and development. In addition, these risks could trigger increased volatility in prices for crude oil and natural gas which could also adversely affect spending by oil and natural gas companies. A decrease in spending for any reason could adversely affect the markets for our products and thereby adversely affect our revenue and margins and limit our future growth prospects. Moreover, these risks could cause increased instability in the financial and insurance markets and adversely affect our ability to access capital and to obtain insurance coverage that we consider adequate or are required to obtain by our contracts with third parties.
We face risks related to natural disasters and pandemic diseases, which could materially and adversely disrupt our operations and affect travel required for our worldwide operations.
A portion of our business involves the movement of people, parts, and supplies to or from foreign locations. Any restrictions on travel or shipments to and from foreign locations, due to the occurrence of natural disasters such as earthquakes, floods, or hurricanes; or an epidemic or outbreak of diseases, in these locations, could significantly disrupt our operations and decrease our ability to provide services to our customers. In addition, our local workforce could be affected by such an occurrence or outbreak which could also significantly disrupt our operations and decrease our ability to provide services to our customers.
Risks associated with the oil and natural gas industry
We could be subject to substantial liability claims, which would adversely affect our financial condition, results of operations, and cash flows.
Certain equipment and processes are used by us and other companies in the oil and natural gas industry during the delivery of oilfield services in hostile environments, such as exploration, development, and production applications. An accident or a failure of a product or process could cause personal injury, loss of life, damage to property, equipment, or the environment, and suspension of operations. Our insurance may not protect us against liability for some kinds of events, including events involving pollution, or against losses resulting from business interruption. Moreover, in the future we may not be able to maintain insurance at levels of risk coverage or policy limits that we deem adequate. Substantial claims made under our policies could cause our premiums to increase. Any future damages caused by our products that are not covered by insurance, or are in excess of policy limits or are subject to substantial deductibles, could adversely affect our financial condition, results of operations, and cash flows.
We face risks due to the cyclical nature of the energy industry and the corresponding credit risk of our customers.
Changing political, economic, or military circumstances throughout the energy-producing regions of the world can impact the market price of oil and natural gas for extended periods of time. As most of our accounts receivable are with customers involved in the oil and natural gas industry, any significant change in such circumstances could result in financial exposure in relation to affected customers.
Table of Contents

8
Fluctuations in the demand for and prices of oil and natural gas would negatively impact our business.
Fluctuations in the demand for, and prices of, oil and natural gas impact the level of drilling activity by our customers and potential customers. The prices are primarily determined by supply, demand, government regulations relating to oil and natural gas production and processing, and international political events, none of which can be accurately predicted. In times of declining activity, not only is there less opportunity for us to sell our products and services but there is increased competitive pressure that tends to reduce our prices and, therefore, our margins.
Possible legislation and regulations related to global warming and climate change could have an adverse effect on our operations and the demand for oil and natural gas.
Foreign, federal, state, and local authorities and agencies are currently evaluating and promulgating climate-related legislation and regulations that are focused on restricting greenhouse gas (“GHG”) emissions. In the United States, the Environmental Protection Agency (“EPA”) is taking steps to require monitoring and reporting of GHG emissions and to regulate GHGs as pollutants under the Clean Air Act (“CAA”). The EPA finalized the Mandatory Greenhouse Reporting Rules in 2009. The EPA expanded those rules to require the reporting of GHG emissions from other specified large GHG emission sources in the United States on an annual basis, as well as certain onshore and offshore oil and natural gas production facilities on an annual basis, beginning in 2012 for emissions occurring in 2011.
In addition, climate change legislation is pending in the United States Congress. Foreign jurisdictions are also considering the need to address climate changes by legislation or regulation. Several regional GHG initiatives have formed which may require reporting or development of cap and trade programs. These developments may curtail production and demand for fossil fuels such as oil and natural gas in areas of the world where our customers operate and thus adversely affect future demand for our services, which may in turn adversely affect future results of operations. Additionally, federal and/or state legislation to reduce the effects of GHG may potentially have a direct or indirect adverse effect on our operations, including the possible imposition on us and/or our customers of additional operational costs due to carbon emissions generated by oil and natural gas related activities. Finally, our business could be negatively affected by climate change related physical changes or changes in weather patterns, which could result in damages to or loss of our physical assets, impacts on our ability to conduct operations and/or disruption of our customers’ operations.
Our onshore oil and natural gas operations could be adversely impacted by changes in, and compliance with, restrictions or regulations on onshore drilling in the United States and in other areas around the world which may adversely affect our business and operating results.
New federal and state legislation regulating hydraulic fracturing may result in increased costs to drill, complete, and operate wells, as well as delays in obtaining permits to drill wells all of which could negatively impact our clients and thereby our business and operating results. If legislation is passed to ban hydraulic fracturing, the number of wells drilled in the future could drop dramatically, and the economic performance of those drilled would be negatively affected. Local authorities have also instituted restrictions to hydraulic fracturing operations which could result in negative impacts to our business.
Our revenue and earnings are subject to fluctuations period over period and are difficult to forecast.
Our revenue and earnings may vary significantly from quarter to quarter depending upon:
• the level of drilling activity worldwide, as well as the particular geographic focus of the activity;
• the variability of customer orders or a reduction in customer orders, which are particularly unpredictable in international markets and which may leave us with excess or obsolete inventories;
• the levels of inventories of our products held by end-users and distributors;
• the mix of our products sold or leased and the margins on those products;
• new products offered and sold or leased by us or our competitors;
• weather conditions or other natural disasters that can affect our operations or our customers’ operations;
• changes in oil and natural gas prices and currency exchange rates, which in some cases affect the costs and prices for our products;
Table of Contents

9
• the level of capital equipment project orders, which may vary with the level of new rig construction and refurbishment activity in the industry;
• changes in drilling and exploration plans, which can be particularly volatile in international markets;
• the ability of our vendors to timely supply necessary component parts used for the manufacturing of our products; and
• the ability to manufacture and timely deliver customer orders, particularly in the top drive segment due to the increasing size and complexity of our models.
In addition, our fixed costs cause our margins to decrease when demand is low and service capacity is underutilized.
Any significant consolidation or loss of end-user customers could have an impact on our business.
Exploration and production company operators and drilling contractors have undergone substantial consolidation in recent years. Additional consolidation is probable. In addition, many oil and natural gas properties could be transferred over time to different potential customers.
Consolidation of drilling contractors results in fewer end-users for our products and could result in the combined contractor standardizing its equipment preferences in favor of a competitor’s products.
Merger activity among both major and independent oil and natural gas companies also affects exploration, development, and production activity, as these consolidated companies attempt to increase efficiency and reduce costs. Generally, only the more promising exploration and development projects from each merged entity are likely to be pursued, which may result in overall lower post-merger exploration and development budgets. Moreover, some end-users prefer not to use relatively new products or premium products in their drilling operations.
We operate in an intensively competitive industry, and if we fail to compete effectively, our business will suffer.
Our competitors may attempt to increase their market share by reducing prices or our customers may adopt competing technologies. The drilling industry is driven primarily by cost minimization. Our strategy is aimed at reducing drilling costs through the application of new technologies. Our competitors, many of whom have a more diverse product line and access to greater amounts of capital than we do, have the ability to compete against the cost savings generated by our technology by reducing prices and by introducing competing technologies. Our competitors may also have the ability to offer bundles of products and services to customers that we do not offer. We have limited resources to sustain prolonged price competition and maintain the level of investment required to continue the commercialization and development of our new technologies.
To compete in our industry, we must continue to develop new technologies and products.
The markets for our products and services are characterized by continual technological developments and we have identified our products as providing technological advantages over other competitive products. As a result, substantial improvements in the scope and quality of product function and performance can occur over a short period of time. If we are not able to develop commercially competitive products in a timely manner in response to changes in technology, our business may be adversely affected. Our future ability to develop new products depends on our ability to:
• design and commercially produce products that meet the needs of our customers;
• successfully market new products; and
• obtain and maintain patent protection.
We may encounter resource constraints, technical barriers, or other difficulties that would delay introduction of new products and services in the future. Our competitors may introduce new products or obtain patents before we do and achieve a competitive advantage. Additionally, the time and expense invested in product development may not result in commercial applications.
For example, from time to time, we have incurred significant losses in the development of new technologies which were not successful for various commercial or technical reasons. If we are unable to successfully implement technological or research and engineering type activities, our growth prospects may be reduced and our future revenue may be materially and adversely affected.
Table of Contents
10
Moreover, we may experience operating losses after new products are introduced and commercialized because of high start-up costs, unexpected manufacturing costs or problems, or lack of demand.
Risks associated with our business
We have been party to patent infringement claims and we may not be able to protect or enforce our intellectual property rights.
In two separate actions, we were sued by VARCO I/P, Inc. and Weatherford International, who have alleged that our CDS tool and other equipment and processes violate certain of their patents. See Part II, Item 8, Financial Statements and Supplementary Data, Note 14 included in this Report on Form 10-K. We settled our lawsuit with Weatherford International, and we believe the suit with VARCO I/P, Inc. is without merit. We intend to continue to defend ourselves vigorously. In the event that we are not successful in defending ourselves in this matter, it may have a material adverse effect on our Tubular Services segment and, therefore, on our business. In addition, in the future we may be subject to other infringement claims and if any of our products were found to be infringing, our consolidated financial results may be adversely affected.
Some of our products and the processes used to produce them have been granted U.S. and international patent protection, or have patent applications pending. Nevertheless, patents may not be granted from our applications and, if patents are issued, the claims allowed may not be sufficient to protect our technology. Recent changes in U.S. patent law may have the effect of making certain of our patents more likely to be the subject of claims for invalidation.
Our competitors may be able to independently develop technology that is similar to ours without infringing on our patents. This is especially true internationally where the protection of intellectual property rights may not be as effective. In addition, obtaining and maintaining intellectual property protection internationally may be significantly more expensive than doing so domestically. We may have to spend substantial time and money defending our patents. After our patents expire, our competitors will not be legally constrained from marketing products substantially similar to ours.
We may be negatively impacted by cutbacks by the Mexican Government on the annual budget of Petróleos Mexicanos (PEMEX).
In Mexico, the majority of our business is performed for PEMEX. For the twelve months ended December 31, 2013, PEMEX accounted for approximately 9% of our consolidated revenues and a significant amount of operating cash flows. PEMEX is a decentralized public entity of the Mexican Government and its annual budget is approved by the Mexican Congress. The Mexican Government may cut spending in the future and such cuts could adversely affect PEMEX's annual budget and thereby its ability to engage us or compensate us for our products and services. Further, at the expiration of existing contracts, we may be required to participate in open auctions to renew such contracts.
We are subject to legal proceedings and may, in the future, be subject to additional legal proceedings.
In the normal course of our business, we are subject to legal proceedings brought by or against us and our subsidiaries. We are currently involved in legal proceedings described in Part II, Item 8, Financial Statements and Supplementary Data, Note 14 included in this Report on Form 10-K. From time to time, we may become subject to additional legal proceedings which may include contract, tort, intellectual property, tax, regulatory compliance and other claims.
We are also subject to complaints or allegations from former, current, or prospective employees from time to time, alleging violations of employment-related laws. Lawsuits or claims could result in decisions against us which could have a material adverse effect on our financial condition, results of operations, or cash flows.
Our products and services are used in hazardous conditions, and we are subject to risks relating to potential liability claims.
Most of our products are used in hazardous drilling and production applications where an accident or a failure of a product can have catastrophic consequences. For example, the unexpected failure of a top drive to rotate a drill string during drilling operations could result in the loss of control over a well, leading to blowout and the discharge of pollutants into the environment. Damages arising from an occurrence at a location where our products are used have in the past and may in the future result in the assertion of potentially large claims against us.
While we attempt to limit our exposure to such risks through contracts with our customers, these measures may not protect us against liability for certain kinds of events, including blowouts, cratering, explosions, fires, loss of well control, loss of hole, damaged or lost drilling equipment, damage or loss from inclement weather or natural disasters, and losses resulting from business interruption. Our insurance coverage generally provides that we assume a portion of the risk in the form of a self-insured retention,
Table of Contents
11
and may not be adequate in risk coverage or policy limits to cover all losses or liabilities that we may incur. The occurrence of an event not fully insured or indemnified against, or the failure of a customer or insurer to meet its indemnification or insurance obligations, could result in substantial losses. Moreover, we may not be able in the future to maintain insurance at levels of risk coverage or policy limits that we deem adequate. Any significant claims made under our policies will likely cause our premiums to increase. Any future damages caused by our products or services that are not covered by insurance, are in excess of policy limits or are subject to substantial deductibles, could reduce our earnings and cash available for operations.
Environmental compliance and remediation costs and the costs of environmental liabilities could exceed our estimates.
The energy industry is affected by changes in public policy, federal, state, local, and foreign laws and regulations. The adoption of laws and regulations curtailing exploration and development drilling for oil and natural gas for economic, environmental and other policy reasons may adversely affect our operations due to our customers having limited drilling and other opportunities in the oil and natural gas exploration and production industry. The operations of our customers, as well as our properties, are subject to increasingly stringent laws and regulations relating to environmental protection, including laws and regulations governing air emissions, water discharges, waste management and workplace safety.
Our credit facility contains restrictions that may limit our ability to finance future operations or capital needs and could accelerate debt payments.
Our credit facility contains covenants which limit the amount of borrowings available by the maintenance of certain financial ratios. Decreases in our financial performance could prohibit us from borrowing amounts under our credit facility, force us to make repayments of outstanding debt in order to remain in compliance with these restrictive covenants, or accelerate our debt payments and other financing obligations and those of our subsidiaries. Additionally, our credit agreements are collateralized by equity interests in our subsidiaries. A breach of the covenants under these agreements could permit the lenders to exercise their rights to foreclose on these collateral interests. If this were to occur, we might not be able to repay such debt and other financing obligations. These restrictions may negatively impact our ability to finance future operations, implement our business strategy or fund our capital needs. Compliance with these financial ratios may be affected by events beyond our control, including the risks and uncertainties described in the other risk factors discussed elsewhere in this report.
For further discussion of our credit facility, see Part II, Item 8, Financial Statements and Supplementary Data, Note 9 included in this Report on Form 10-K.
We have a revolving credit facility that is not contracted at current market rates.
In April 2012, we amended our credit agreement to provide a revolving line of credit of $125 million including up to $20 million of swing line loans. The new credit facility has a term of five years and all outstanding borrowings on the new agreement are due and payable on April 27, 2017.
At this time it is difficult to forecast the future state of the bank loan market. As a result of the uncertain state of various financial institutions and the credit markets generally, we may be unable to maintain our current borrowing capacity in the event of bank or banks failure to fund any commitments under the current credit facility, and we may not be able to refinance our bank facility in the same amount and on the same terms as we currently hold, which could negatively impact our liquidity and results of operations. We provide warranties on our products and if our products fail to operate properly our business will suffer.
We provide warranties as to the proper operation and conformance to specifications of the equipment we manufacture. Our products are often deployed in harsh environments including subsea applications. The failure of these products to operate properly or to meet specifications may increase our costs by requiring additional engineering resources and services, replacement of parts and equipment or monetary reimbursement to a customer. We have experienced quality problems with raw material vendors, which required us to recall and replace certain equipment and components. We have also received warranty claims and we expect to continue to receive them in the future. Such claims may exceed the reserve we have set aside for them. To the extent that we incur substantial warranty claims in any period because of quality issues with our products, our reputation, ability to obtain future business and earnings could be materially and adversely affected.
Our foreign operations and investments involve special risks.
We sell products and provide services in parts of the world where the political and legal systems are very different from those in the U.S. and Canada. In places like Russia, Latin America, the Middle East and Asia Pacific, we may have difficulty or extra
Table of Contents
12
expense in navigating the local bureaucracies and legal systems. We may face challenges in enforcing contracts in local courts or be at a disadvantage when we have a dispute with a customer that is an agency of the state. We may be at a disadvantage to competitors that are not subject to the same international trade and business practice restrictions that U.S. and Canadian laws impose on us.
While diversification is desirable, it can expose us to risks related to cultural, political, and economic factors of foreign jurisdictions which are beyond our control. As a general rule, we have elected not to carry political risk insurance against these risks. Such risks include the following:
• loss of revenue, property, and equipment as a result of hazards such as wars or insurrection;
• the effects of currency fluctuations and exchange controls, such as devaluation of foreign currencies and other economic problems;
• changes or interpretations in laws, regulations, and policies of foreign governments, including those associated with changes in the governing parties, nationalization, and expropriation;
• protracted delays in securing government consents, permits, licenses, or other regulatory approvals necessary to conduct our operations; and
• protracted delays in the collection of accounts receivable due to economic, political, and civil instabilities.
We are subject to foreign governmental regulations in some jurisdictions in which we operate that favor or require awarding contracts to local contractors or require foreign contractors to employ citizens of or purchase supplies from a certain jurisdiction. Such regulations may adversely affect our ability to compete in that jurisdiction. Our operations in some jurisdictions may be significantly affected by union activity and general labor unrest. In Argentina and Mexico, particularly, where we have significant operations, labor organizations have substantial support and have considerable political influence. In Argentina, the demands of labor organizations have increased in recent years and seem likely to continue as a result of the general labor unrest and dissatisfaction resulting from the disparity between the cost of living and salaries in Argentina as a result of the devaluation of the Argentine Peso. There can be no assurance that our operations in Argentina or Mexico will not face labor disruptions in the future or that any such disruptions will not have a material adverse effect on our financial condition or results of operations. Further, unionization efforts have been made from time to time in other jurisdictions in which we operate with varying degrees of success. Any such unionization could increase our costs or limit the flexibility in that market.
Our profitability is driven to a large extent by our ability to deliver the products we manufacture in a timely manner.
Disruptions to our production schedule may adversely impact our ability to meet delivery commitments. If we fail to deliver products according to contract terms, we may suffer financial penalties and a diminution of our commercial reputation and future product orders.
We rely on the availability of raw materials, component parts and finished products to produce our products.
We buy raw materials, components and precision machining or sub-assembly services from many different vendors located in Canada, the U.S., Europe, South East Asia and the Middle East. The price and lead times for some products have fluctuated along with the general changes of steel prices around the world. We also source a substantial amount of electrical components, including permanent magnet motors and drives as well as a substantial amount of hydraulic components, including hydraulic motors, from suppliers located in the U.S. and abroad. The inability of suppliers to meet performance, quality specifications, and delivery schedules could cause delays in manufacturing and make it difficult or impossible for us to meet outstanding orders or accept new orders for the manufacture of the affected equipment. In addition, the lack of an efficient supply chain could cause us to hold higher levels of inventory.
The design of some of our equipment is based on components provided by specific sole source manufacturers.
Some of our products have been designed around components which are only available from one source of supply. In some cases, a manufacturer has developed or modified the design of a component at our request, and consequently we are the only purchaser of such items. If the manufacturer of such an item should go out of business or cease or refuse to manufacture the component in question, or raise the price of such components unduly, we may have to identify alternative components and redesign portions of our equipment. This could cause delays in manufacturing and make it difficult or impossible for us to meet outstanding orders or accept new orders for the manufacture of the affected equipment.
Table of Contents
13
Our business requires the retention and recruitment of a skilled workforce and key employees, and the loss of such employees could result in the failure to implement our business plans.
As a technology based company, we depend upon skilled engineering and other professionals in order to engage in product innovation and ensure the effective implementation of our innovative technology. We compete for these professionals, not only with other companies in the same industry, but with oil and natural gas service companies generally and other industries. In periods of high energy and industrial manufacturing activity, demand for the skills and expertise of these professionals increases, which can make the hiring and retention of these individuals more difficult and expensive. Failure to recruit and retain such individuals may result in our inability to maintain a competitive advantage over other companies and loss of customer satisfaction. The loss or incapacity of certain key employees for any reason, including our President and Chief Executive Officer, Julio M. Quintana, could have a negative impact on our ability to implement our business plan due to the specialized knowledge these individuals possess. We do not maintain key man insurance on any of our personnel.
Our business relies on the skills and availability of trained and experienced trades and technicians to provide efficient and necessary services to us and our customers. Hiring and retaining such individuals are critical to the success of our business plan. Retention of staff and the prevention of injury to staff are essential in order to provide a high level of service.
We may be unable to identify or complete acquisitions.
Acquisitions have been and may continue to be an element of our business strategy. We can give no assurance that we will be able to secure, close, or integrate successfully the assets and operations of acquired businesses with our own business. Any inability on our part to integrate and manage the growth of acquired businesses may have a material adverse effect on our results of operations and financial condition. We can give no assurance that we will be able to identify and acquire additional businesses in the future on terms favorable to us.
Item 1B. Unresolved Staff Comments.
None.
Item 2. Properties.
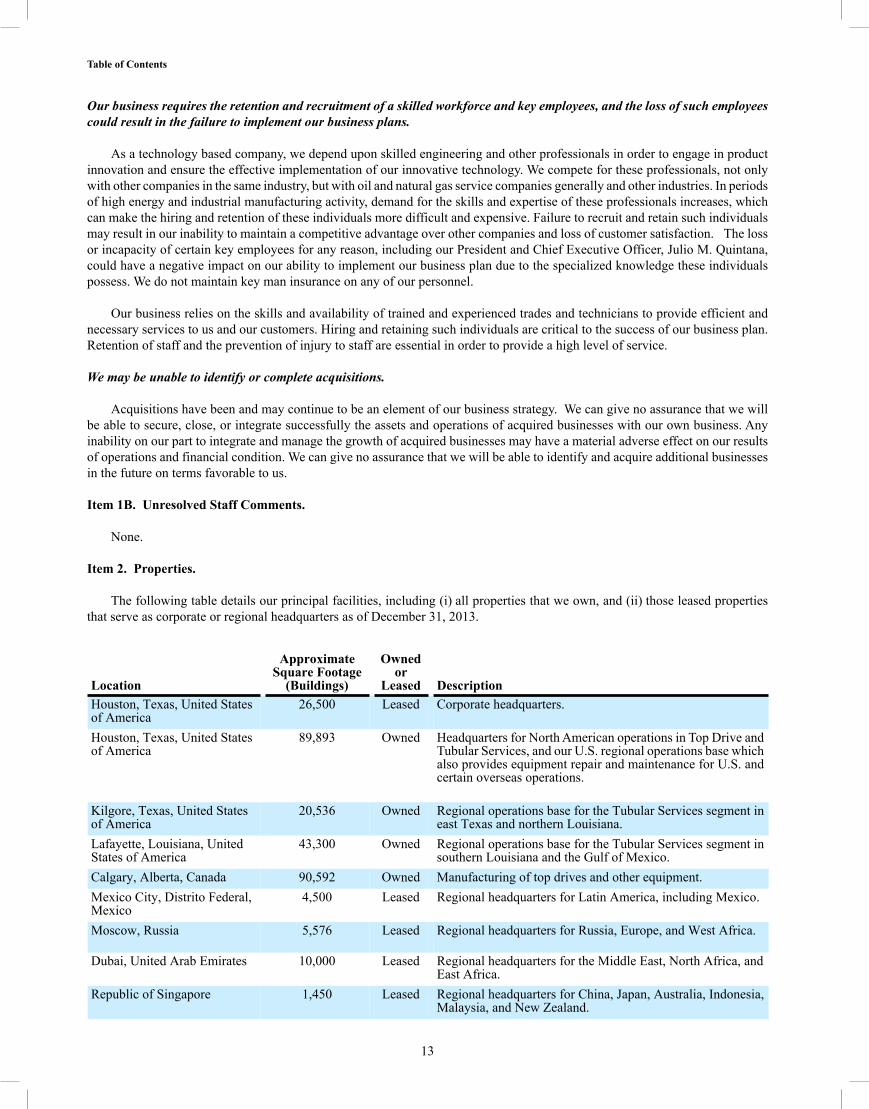
The following table details our principal facilities, including (i) all properties that we own, and (ii) those leased properties that serve as corporate or regional headquarters as of December 31, 2013.
Location
ApproximateSquare Footage
(Buildings)
Owned or
Leased DescriptionHouston, Texas, United Statesof America
26,500 Leased Corporate headquarters.
Houston, Texas, United Statesof America
89,893 Owned Headquarters for North American operations in Top Drive and Tubular Services, and our U.S. regional operations base which also provides equipment repair and maintenance for U.S. and certain overseas operations.
Kilgore, Texas, United Statesof America
20,536 Owned Regional operations base for the Tubular Services segment ineast Texas and northern Louisiana.
Lafayette, Louisiana, UnitedStates of America
43,300 Owned Regional operations base for the Tubular Services segment insouthern Louisiana and the Gulf of Mexico.
Calgary, Alberta, Canada 90,592 Owned Manufacturing of top drives and other equipment.Mexico City, Distrito Federal,Mexico
4,500 Leased Regional headquarters for Latin America, including Mexico.
Moscow, Russia 5,576 Leased Regional headquarters for Russia, Europe, and West Africa.
Dubai, United Arab Emirates 10,000 Leased Regional headquarters for the Middle East, North Africa, andEast Africa.
Republic of Singapore 1,450 Leased Regional headquarters for China, Japan, Australia, Indonesia,Malaysia, and New Zealand.
Table of Contents
14
In addition, we lease operational facilities at locations in Oklahoma, Pennsylvania, Texas, and Wyoming. Each of these locations supports operations in its local area, primarily for the Tubular Services segment.
Outside the U.S., we lease additional operating facilities in Argentina, Australia, Brazil, Canada, China, Colombia, Dubai, Ecuador, Egypt, Indonesia, Malaysia, Mexico, New Zealand, Romania, Russia, Saudi Arabia, Republic of Singapore, the United Kingdom, and Venezuela. The majority of these facilities support the Top Drive and Tubular Services segments.
We consider our existing equipment and facilities to be adequate to support our operations.
Item 3. Legal Proceedings.
In the normal course of our business, we are subject to legal proceedings brought by or against us and our subsidiaries. None of these proceedings involves a claim for damages exceeding ten percent of our current assets on a consolidated basis. See Part II, Item 8, Financial Statements and Supplementary Data, Note 14 included in this Report on Form 10-K for a summary of certain closed and ongoing legal proceedings. Such information is incorporated into this Part I, Item 3-"Legal Proceedings" in this Report on Form 10-K by reference.
Item 4. Mine Safety Disclosures.
None.
Table of Contents
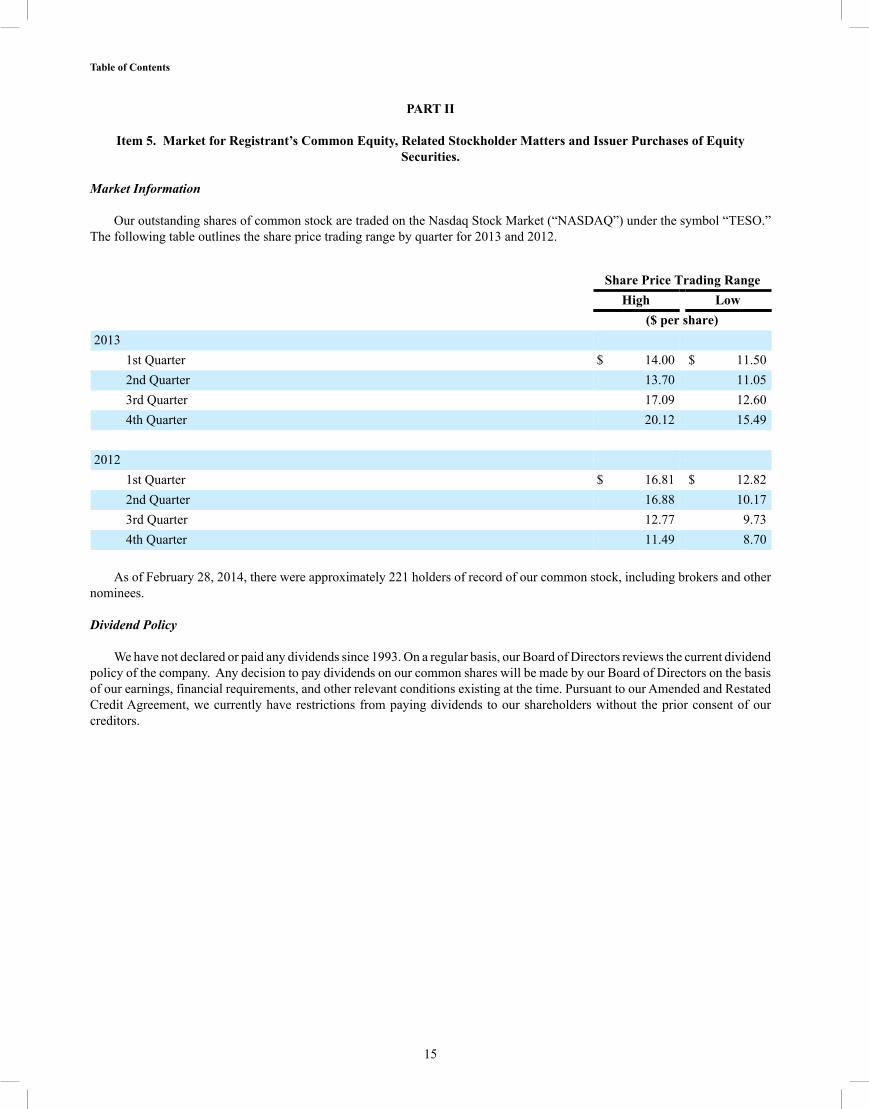
15
PART II
Item 5. Market for Registrant’s Common Equity, Related Stockholder Matters and Issuer Purchases of Equity Securities.
Market Information
Our outstanding shares of common stock are traded on the Nasdaq Stock Market (“NASDAQ”) under the symbol “TESO.” The following table outlines the share price trading range by quarter for 2013 and 2012.
Share Price Trading Range High Low ($ per share)2013
1st Quarter $ 14.00 $ 11.502nd Quarter 13.70 11.053rd Quarter 17.09 12.604th Quarter 20.12 15.49
2012 1st Quarter $ 16.81 $ 12.822nd Quarter 16.88 10.173rd Quarter 12.77 9.734th Quarter 11.49 8.70
As of February 28, 2014, there were approximately 221 holders of record of our common stock, including brokers and other
nominees.
Dividend Policy
We have not declared or paid any dividends since 1993. On a regular basis, our Board of Directors reviews the current dividend policy of the company. Any decision to pay dividends on our common shares will be made by our Board of Directors on the basis of our earnings, financial requirements, and other relevant conditions existing at the time. Pursuant to our Amended and Restated Credit Agreement, we currently have restrictions from paying dividends to our shareholders without the prior consent of our creditors.
Table of Contents
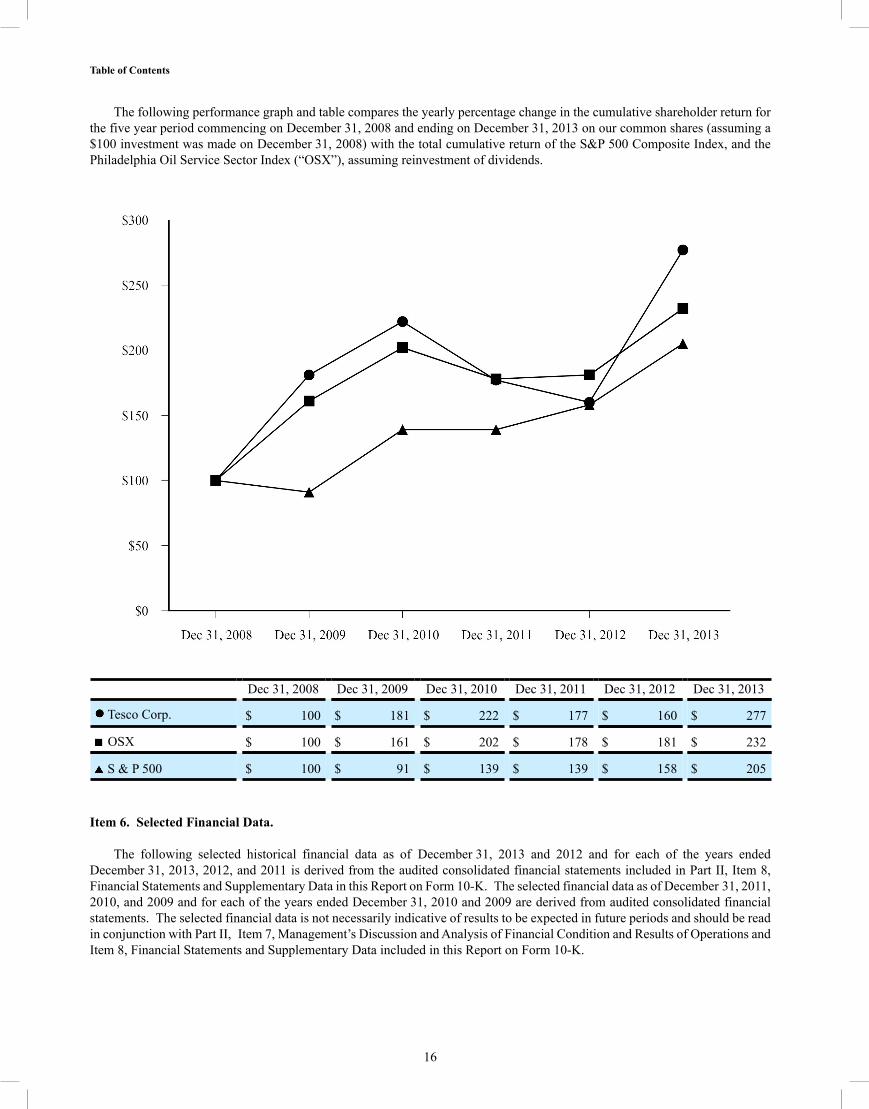
16
The following performance graph and table compares the yearly percentage change in the cumulative shareholder return for the five year period commencing on December 31, 2008 and ending on December 31, 2013 on our common shares (assuming a $100 investment was made on December 31, 2008) with the total cumulative return of the S&P 500 Composite Index, and the Philadelphia Oil Service Sector Index (“OSX”), assuming reinvestment of dividends.
Dec 31, 2008 Dec 31, 2009 Dec 31, 2010 Dec 31, 2011 Dec 31, 2012 Dec 31, 2013
Tesco Corp. $ 100 $ 181 $ 222 $ 177 $ 160 $ 277
OSX $ 100 $ 161 $ 202 $ 178 $ 181 $ 232
S & P 500 $ 100 $ 91 $ 139 $ 139 $ 158 $ 205
Item 6. Selected Financial Data.
The following selected historical financial data as of December 31, 2013 and 2012 and for each of the years ended December 31, 2013, 2012, and 2011 is derived from the audited consolidated financial statements included in Part II, Item 8, Financial Statements and Supplementary Data in this Report on Form 10-K. The selected financial data as of December 31, 2011, 2010, and 2009 and for each of the years ended December 31, 2010 and 2009 are derived from audited consolidated financial statements. The selected financial data is not necessarily indicative of results to be expected in future periods and should be read in conjunction with Part II, Item 7, Management’s Discussion and Analysis of Financial Condition and Results of Operations and Item 8, Financial Statements and Supplementary Data included in this Report on Form 10-K.
Table of Contents
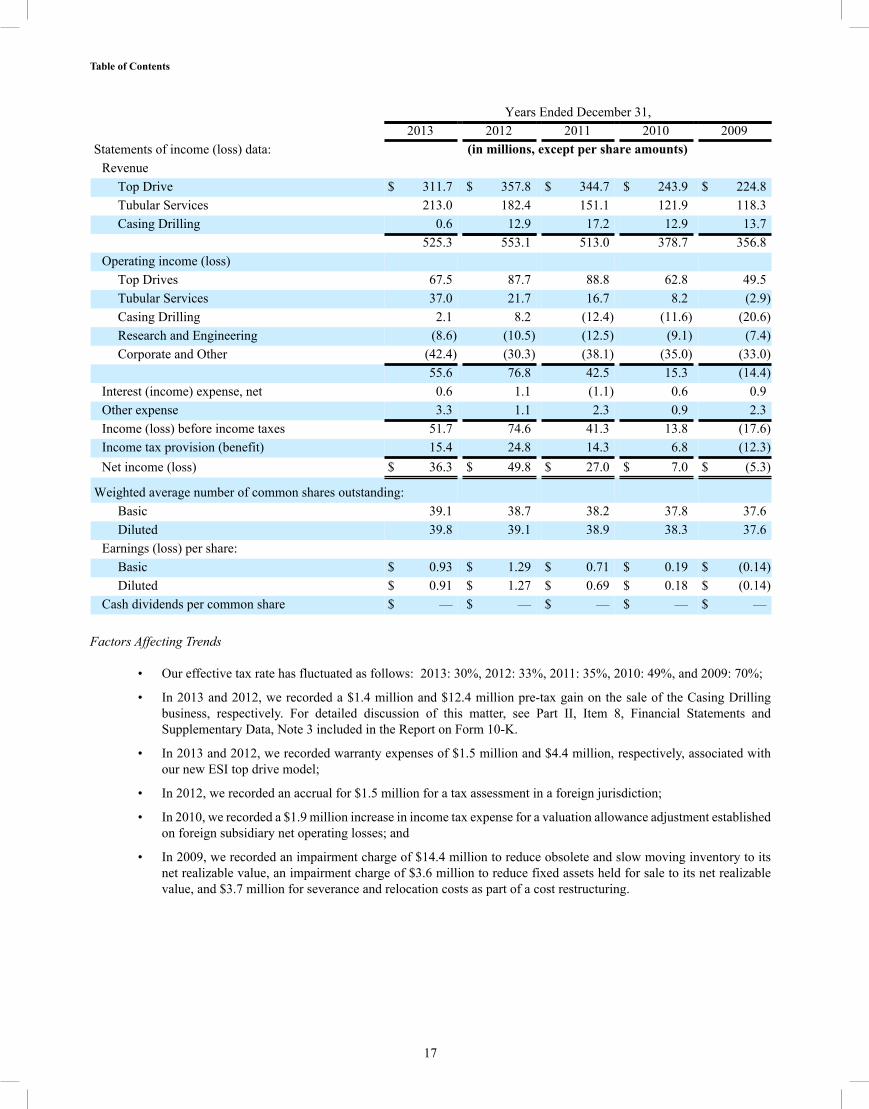
17
Years Ended December 31, 2013 2012 2011 2010 2009Statements of income (loss) data: (in millions, except per share amounts)
Revenue Top Drive $ 311.7 $ 357.8 $ 344.7 $ 243.9 $ 224.8Tubular Services 213.0 182.4 151.1 121.9 118.3Casing Drilling 0.6 12.9 17.2 12.9 13.7
525.3 553.1 513.0 378.7 356.8Operating income (loss)
Top Drives 67.5 87.7 88.8 62.8 49.5Tubular Services 37.0 21.7 16.7 8.2 (2.9)Casing Drilling 2.1 8.2 (12.4) (11.6) (20.6)Research and Engineering (8.6) (10.5) (12.5) (9.1) (7.4)Corporate and Other (42.4) (30.3) (38.1) (35.0) (33.0)
55.6 76.8 42.5 15.3 (14.4)Interest (income) expense, net 0.6 1.1 (1.1) 0.6 0.9Other expense 3.3 1.1 2.3 0.9 2.3Income (loss) before income taxes 51.7 74.6 41.3 13.8 (17.6)Income tax provision (benefit) 15.4 24.8 14.3 6.8 (12.3)Net income (loss) $ 36.3 $ 49.8 $ 27.0 $ 7.0 $ (5.3)
Weighted average number of common shares outstanding: Basic 39.1 38.7 38.2 37.8 37.6Diluted 39.8 39.1 38.9 38.3 37.6
Earnings (loss) per share: Basic $ 0.93 $ 1.29 $ 0.71 $ 0.19 $ (0.14)Diluted $ 0.91 $ 1.27 $ 0.69 $ 0.18 $ (0.14)
Cash dividends per common share $ — $ — $ — $ — $ —
Factors Affecting Trends
• Our effective tax rate has fluctuated as follows: 2013: 30%, 2012: 33%, 2011: 35%, 2010: 49%, and 2009: 70%;
• In 2013 and 2012, we recorded a $1.4 million and $12.4 million pre-tax gain on the sale of the Casing Drilling business, respectively. For detailed discussion of this matter, see Part II, Item 8, Financial Statements and Supplementary Data, Note 3 included in the Report on Form 10-K.
• In 2013 and 2012, we recorded warranty expenses of $1.5 million and $4.4 million, respectively, associated with our new ESI top drive model;
• In 2012, we recorded an accrual for $1.5 million for a tax assessment in a foreign jurisdiction;
• In 2010, we recorded a $1.9 million increase in income tax expense for a valuation allowance adjustment established on foreign subsidiary net operating losses; and
• In 2009, we recorded an impairment charge of $14.4 million to reduce obsolete and slow moving inventory to its net realizable value, an impairment charge of $3.6 million to reduce fixed assets held for sale to its net realizable value, and $3.7 million for severance and relocation costs as part of a cost restructuring.
Table of Contents
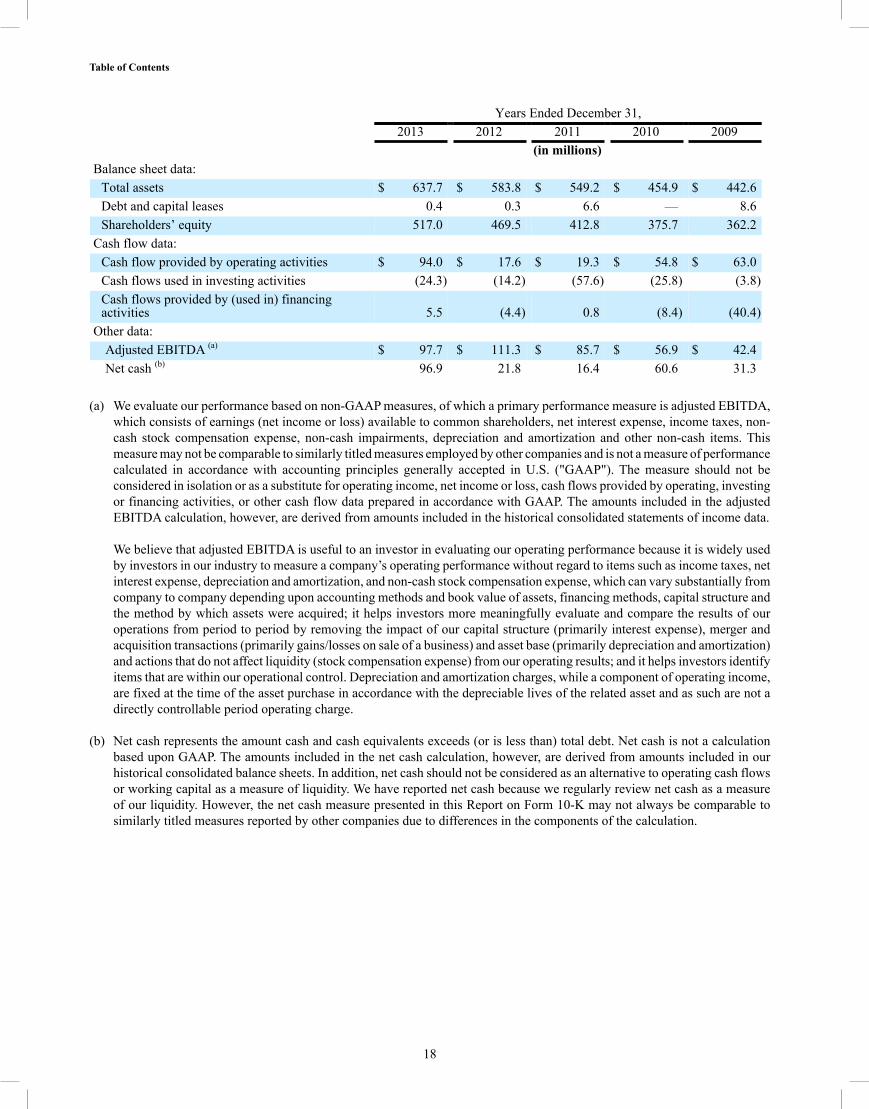
18
Years Ended December 31, 2013 2012 2011 2010 2009 (in millions)Balance sheet data:
Total assets $ 637.7 $ 583.8 $ 549.2 $ 454.9 $ 442.6Debt and capital leases 0.4 0.3 6.6 — 8.6Shareholders’ equity 517.0 469.5 412.8 375.7 362.2
Cash flow data: Cash flow provided by operating activities $ 94.0 $ 17.6 $ 19.3 $ 54.8 $ 63.0Cash flows used in investing activities (24.3) (14.2) (57.6) (25.8) (3.8)Cash flows provided by (used in) financingactivities 5.5 (4.4) 0.8 (8.4) (40.4)
Other data: Adjusted EBITDA (a) $ 97.7 $ 111.3 $ 85.7 $ 56.9 $ 42.4Net cash (b) 96.9 21.8 16.4 60.6 31.3
(a) We evaluate our performance based on non-GAAP measures, of which a primary performance measure is adjusted EBITDA,
which consists of earnings (net income or loss) available to common shareholders, net interest expense, income taxes, non-cash stock compensation expense, non-cash impairments, depreciation and amortization and other non-cash items. This measure may not be comparable to similarly titled measures employed by other companies and is not a measure of performance calculated in accordance with accounting principles generally accepted in U.S. ("GAAP"). The measure should not be considered in isolation or as a substitute for operating income, net income or loss, cash flows provided by operating, investing or financing activities, or other cash flow data prepared in accordance with GAAP. The amounts included in the adjusted EBITDA calculation, however, are derived from amounts included in the historical consolidated statements of income data.
We believe that adjusted EBITDA is useful to an investor in evaluating our operating performance because it is widely used by investors in our industry to measure a company’s operating performance without regard to items such as income taxes, net interest expense, depreciation and amortization, and non-cash stock compensation expense, which can vary substantially from company to company depending upon accounting methods and book value of assets, financing methods, capital structure and the method by which assets were acquired; it helps investors more meaningfully evaluate and compare the results of our operations from period to period by removing the impact of our capital structure (primarily interest expense), merger and acquisition transactions (primarily gains/losses on sale of a business) and asset base (primarily depreciation and amortization) and actions that do not affect liquidity (stock compensation expense) from our operating results; and it helps investors identify items that are within our operational control. Depreciation and amortization charges, while a component of operating income, are fixed at the time of the asset purchase in accordance with the depreciable lives of the related asset and as such are not a directly controllable period operating charge.
(b) Net cash represents the amount cash and cash equivalents exceeds (or is less than) total debt. Net cash is not a calculation based upon GAAP. The amounts included in the net cash calculation, however, are derived from amounts included in our historical consolidated balance sheets. In addition, net cash should not be considered as an alternative to operating cash flows or working capital as a measure of liquidity. We have reported net cash because we regularly review net cash as a measure of our liquidity. However, the net cash measure presented in this Report on Form 10-K may not always be comparable to similarly titled measures reported by other companies due to differences in the components of the calculation.
Table of Contents
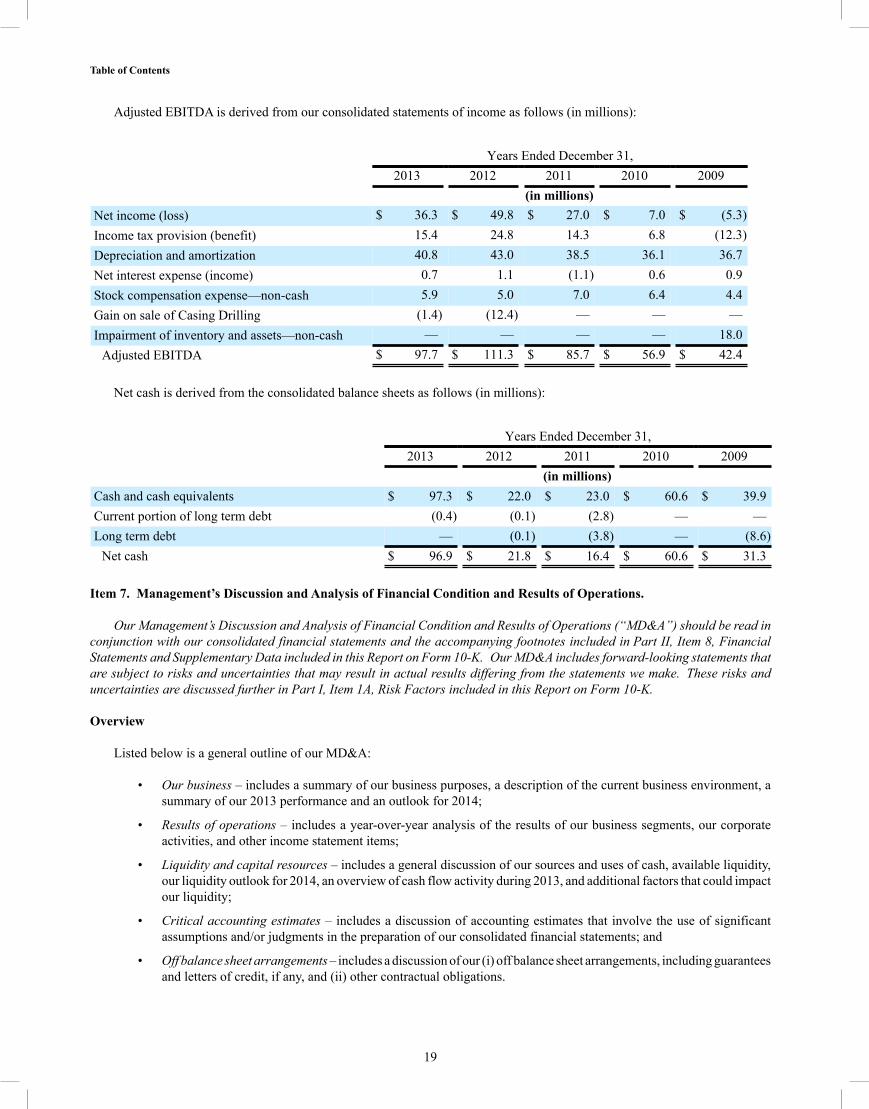
19
Adjusted EBITDA is derived from our consolidated statements of income as follows (in millions):
Years Ended December 31, 2013 2012 2011 2010 2009 (in millions)Net income (loss) $ 36.3 $ 49.8 $ 27.0 $ 7.0 $ (5.3)Income tax provision (benefit) 15.4 24.8 14.3 6.8 (12.3)Depreciation and amortization 40.8 43.0 38.5 36.1 36.7Net interest expense (income) 0.7 1.1 (1.1) 0.6 0.9Stock compensation expense—non-cash 5.9 5.0 7.0 6.4 4.4Gain on sale of Casing Drilling (1.4) (12.4) — — —Impairment of inventory and assets—non-cash — — — — 18.0
Adjusted EBITDA $ 97.7 $ 111.3 $ 85.7 $ 56.9 $ 42.4
Net cash is derived from the consolidated balance sheets as follows (in millions):
Years Ended December 31, 2013 2012 2011 2010 2009 (in millions)Cash and cash equivalents $ 97.3 $ 22.0 $ 23.0 $ 60.6 $ 39.9Current portion of long term debt (0.4) (0.1) (2.8) — —Long term debt — (0.1) (3.8) — (8.6)
Net cash $ 96.9 $ 21.8 $ 16.4 $ 60.6 $ 31.3
Item 7. Management’s Discussion and Analysis of Financial Condition and Results of Operations.
Our Management’s Discussion and Analysis of Financial Condition and Results of Operations (“MD&A”) should be read in conjunction with our consolidated financial statements and the accompanying footnotes included in Part II, Item 8, Financial Statements and Supplementary Data included in this Report on Form 10-K. Our MD&A includes forward-looking statements that are subject to risks and uncertainties that may result in actual results differing from the statements we make. These risks and uncertainties are discussed further in Part I, Item 1A, Risk Factors included in this Report on Form 10-K.
Overview
Listed below is a general outline of our MD&A:
• Our business – includes a summary of our business purposes, a description of the current business environment, a summary of our 2013 performance and an outlook for 2014;
• Results of operations – includes a year-over-year analysis of the results of our business segments, our corporate activities, and other income statement items;
• Liquidity and capital resources – includes a general discussion of our sources and uses of cash, available liquidity, our liquidity outlook for 2014, an overview of cash flow activity during 2013, and additional factors that could impact our liquidity;
• Critical accounting estimates – includes a discussion of accounting estimates that involve the use of significant assumptions and/or judgments in the preparation of our consolidated financial statements; and
• Off balance sheet arrangements – includes a discussion of our (i) off balance sheet arrangements, including guarantees and letters of credit, if any, and (ii) other contractual obligations.
Table of Contents
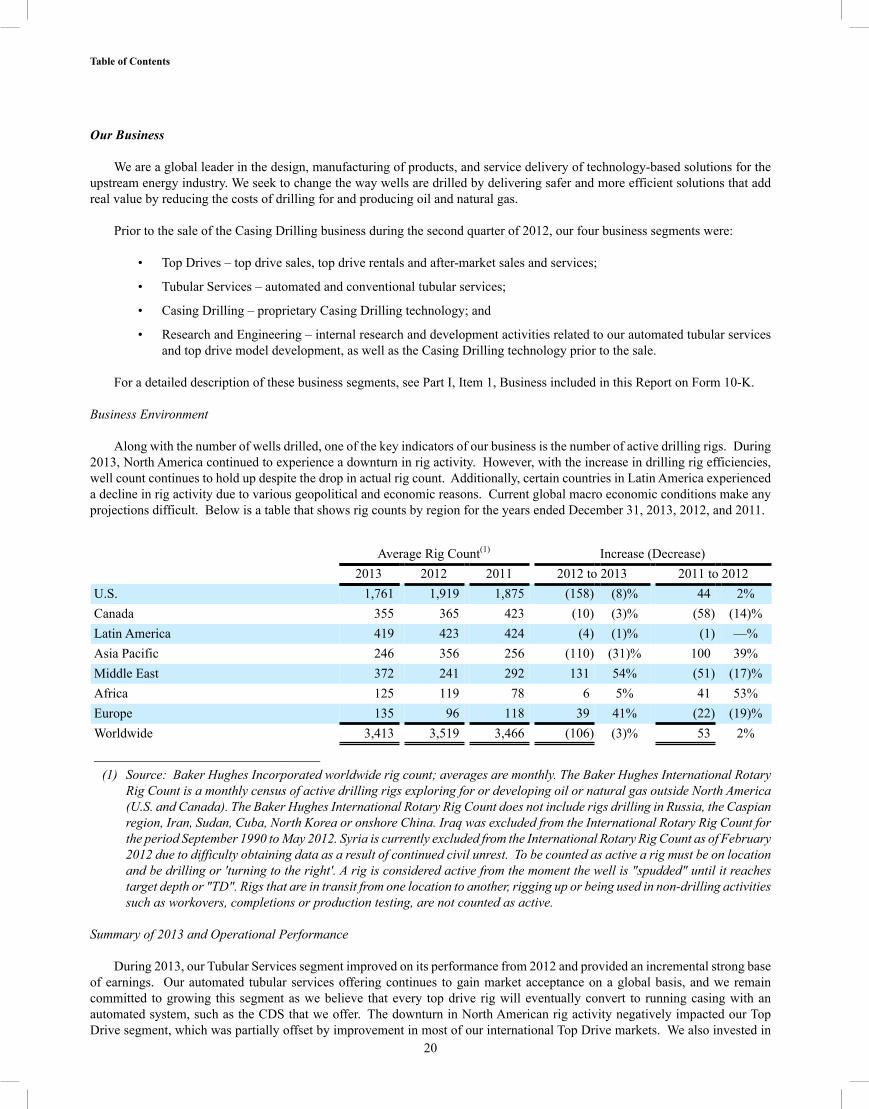
20
Our Business
We are a global leader in the design, manufacturing of products, and service delivery of technology-based solutions for the upstream energy industry. We seek to change the way wells are drilled by delivering safer and more efficient solutions that add real value by reducing the costs of drilling for and producing oil and natural gas.
Prior to the sale of the Casing Drilling business during the second quarter of 2012, our four business segments were:
• Top Drives – top drive sales, top drive rentals and after-market sales and services;
• Tubular Services – automated and conventional tubular services;
• Casing Drilling – proprietary Casing Drilling technology; and
• Research and Engineering – internal research and development activities related to our automated tubular services and top drive model development, as well as the Casing Drilling technology prior to the sale.
For a detailed description of these business segments, see Part I, Item 1, Business included in this Report on Form 10-K.
Business Environment
Along with the number of wells drilled, one of the key indicators of our business is the number of active drilling rigs. During 2013, North America continued to experience a downturn in rig activity. However, with the increase in drilling rig efficiencies, well count continues to hold up despite the drop in actual rig count. Additionally, certain countries in Latin America experienced a decline in rig activity due to various geopolitical and economic reasons. Current global macro economic conditions make any projections difficult. Below is a table that shows rig counts by region for the years ended December 31, 2013, 2012, and 2011.
Average Rig Count(1) Increase (Decrease) 2013 2012 2011 2012 to 2013 2011 to 2012U.S. 1,761 1,919 1,875 (158) (8)% 44 2%Canada 355 365 423 (10) (3)% (58) (14)%Latin America 419 423 424 (4) (1)% (1) —%Asia Pacific 246 356 256 (110) (31)% 100 39%Middle East 372 241 292 131 54% (51) (17)%Africa 125 119 78 6 5% 41 53%Europe 135 96 118 39 41% (22) (19)%Worldwide 3,413 3,519 3,466 (106) (3)% 53 2%__________________________________
(1) Source: Baker Hughes Incorporated worldwide rig count; averages are monthly. The Baker Hughes International Rotary Rig Count is a monthly census of active drilling rigs exploring for or developing oil or natural gas outside North America (U.S. and Canada). The Baker Hughes International Rotary Rig Count does not include rigs drilling in Russia, the Caspian region, Iran, Sudan, Cuba, North Korea or onshore China. Iraq was excluded from the International Rotary Rig Count for the period September 1990 to May 2012. Syria is currently excluded from the International Rotary Rig Count as of February 2012 due to difficulty obtaining data as a result of continued civil unrest. To be counted as active a rig must be on location and be drilling or 'turning to the right'. A rig is considered active from the moment the well is "spudded" until it reaches target depth or "TD". Rigs that are in transit from one location to another, rigging up or being used in non-drilling activities such as workovers, completions or production testing, are not counted as active.
Summary of 2013 and Operational Performance
During 2013, our Tubular Services segment improved on its performance from 2012 and provided an incremental strong base of earnings. Our automated tubular services offering continues to gain market acceptance on a global basis, and we remain committed to growing this segment as we believe that every top drive rig will eventually convert to running casing with an automated system, such as the CDS that we offer. The downturn in North American rig activity negatively impacted our Top Drive segment, which was partially offset by improvement in most of our international Top Drive markets. We also invested in
Table of Contents
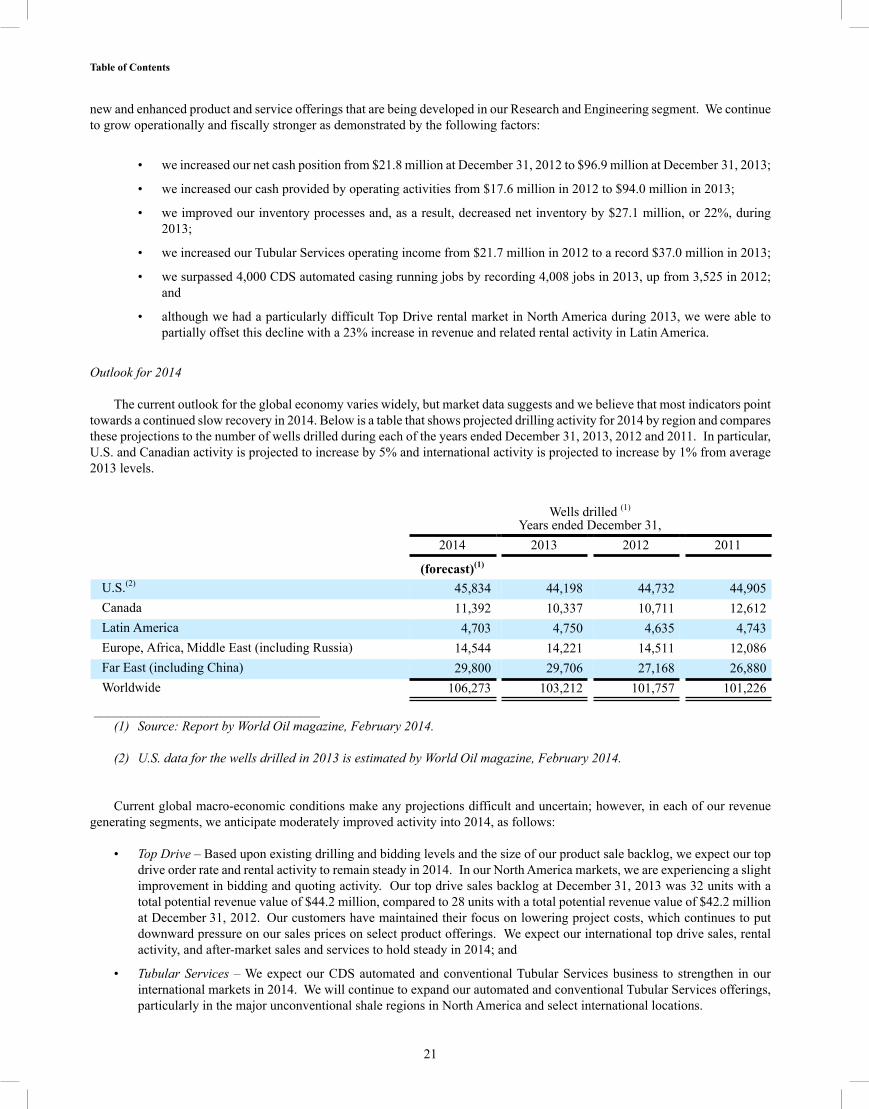
21
new and enhanced product and service offerings that are being developed in our Research and Engineering segment. We continue to grow operationally and fiscally stronger as demonstrated by the following factors:
• we increased our net cash position from $21.8 million at December 31, 2012 to $96.9 million at December 31, 2013;
• we increased our cash provided by operating activities from $17.6 million in 2012 to $94.0 million in 2013;
• we improved our inventory processes and, as a result, decreased net inventory by $27.1 million, or 22%, during 2013;
• we increased our Tubular Services operating income from $21.7 million in 2012 to a record $37.0 million in 2013;
• we surpassed 4,000 CDS automated casing running jobs by recording 4,008 jobs in 2013, up from 3,525 in 2012; and
• although we had a particularly difficult Top Drive rental market in North America during 2013, we were able to partially offset this decline with a 23% increase in revenue and related rental activity in Latin America.
Outlook for 2014
The current outlook for the global economy varies widely, but market data suggests and we believe that most indicators point towards a continued slow recovery in 2014. Below is a table that shows projected drilling activity for 2014 by region and compares these projections to the number of wells drilled during each of the years ended December 31, 2013, 2012 and 2011. In particular, U.S. and Canadian activity is projected to increase by 5% and international activity is projected to increase by 1% from average 2013 levels.
Wells drilled (1)
Years ended December 31, 2014 2013 2012 2011
(forecast)(1) U.S.(2) 45,834 44,198 44,732 44,905Canada 11,392 10,337 10,711 12,612Latin America 4,703 4,750 4,635 4,743Europe, Africa, Middle East (including Russia) 14,544 14,221 14,511 12,086Far East (including China) 29,800 29,706 27,168 26,880Worldwide 106,273 103,212 101,757 101,226
__________________________________(1) Source: Report by World Oil magazine, February 2014.
(2) U.S. data for the wells drilled in 2013 is estimated by World Oil magazine, February 2014.
Current global macro-economic conditions make any projections difficult and uncertain; however, in each of our revenue generating segments, we anticipate moderately improved activity into 2014, as follows:
• Top Drive – Based upon existing drilling and bidding levels and the size of our product sale backlog, we expect our top drive order rate and rental activity to remain steady in 2014. In our North America markets, we are experiencing a slight improvement in bidding and quoting activity. Our top drive sales backlog at December 31, 2013 was 32 units with a total potential revenue value of $44.2 million, compared to 28 units with a total potential revenue value of $42.2 million at December 31, 2012. Our customers have maintained their focus on lowering project costs, which continues to put downward pressure on our sales prices on select product offerings. We expect our international top drive sales, rental activity, and after-market sales and services to hold steady in 2014; and
• Tubular Services – We expect our CDS automated and conventional Tubular Services business to strengthen in our international markets in 2014. We will continue to expand our automated and conventional Tubular Services offerings, particularly in the major unconventional shale regions in North America and select international locations.
Table of Contents

22
Results of Operations
Below is a summary of our revenue and operating results for the years ended December 31, 2013, 2012, and 2011 (in thousands, except percentages):
Year Ended December 31, Increase/Decrease 2013 2012 2011 2012 to 2013 2011 to 2012Segment revenue
Top Drive $ 311,632 $ 357,842 $ 344,698 $ (46,210) (13)% $ 13,144 4%Tubular Services 212,997 182,404 151,124 30,593 17% 31,280 21%Casing Drilling 624 12,893 17,147 (12,269) (95)% (4,254) (25)%
Consolidated revenue $ 525,253 $ 553,139 $ 512,969 $ (27,886) (5)% $ 40,170 8%
Segment operating income Top Drive $ 67,462 $ 87,716 $ 88,799 $ (20,254) (23)% $ (1,083) (1)%Tubular Services 37,004 21,708 16,680 15,296 70% 5,028 30%Casing Drilling 2,124 8,191 (12,392) (6,067) (74)% 20,583 166%Research andengineering (8,578) (10,457) (12,512) 1,879 18% 2,055 16%Corporate and other (42,396) (30,363) (38,058) (12,033) (40)% 7,695 20%
Consolidatedoperating income 55,616 76,795 42,517 (21,179) (28)% 34,278 81%
Other expense 3,952 2,200 1,245 1,752 80% 955 77%Income before incometaxes 51,664 74,595 41,272 (22,931) (31)% 33,323 81%Income tax provision 15,404 24,781 14,276 (9,377) (38)% 10,505 74%Net income $ 36,260 $ 49,814 $ 26,996 $ (13,554) (27)% $ 22,818 85%
Top Drive Segment
Our Top Drive business segment sells equipment and provides services to drilling contractors and oil and natural gas operating companies throughout the world. We primarily manufacture top drives that are used in drilling operations to rotate the drill string and/or casing while suspended from the derrick above the rig floor. We also provide top drive rental services on a day-rate basis for land and offshore drilling rigs, and we provide after-market sales and support for our customers. The following is a summary of our top drive operating results and metrics for the years ended December 31, 2013, 2012, and 2011 (revenue and operating income in thousands, except percentages):
Table of Contents
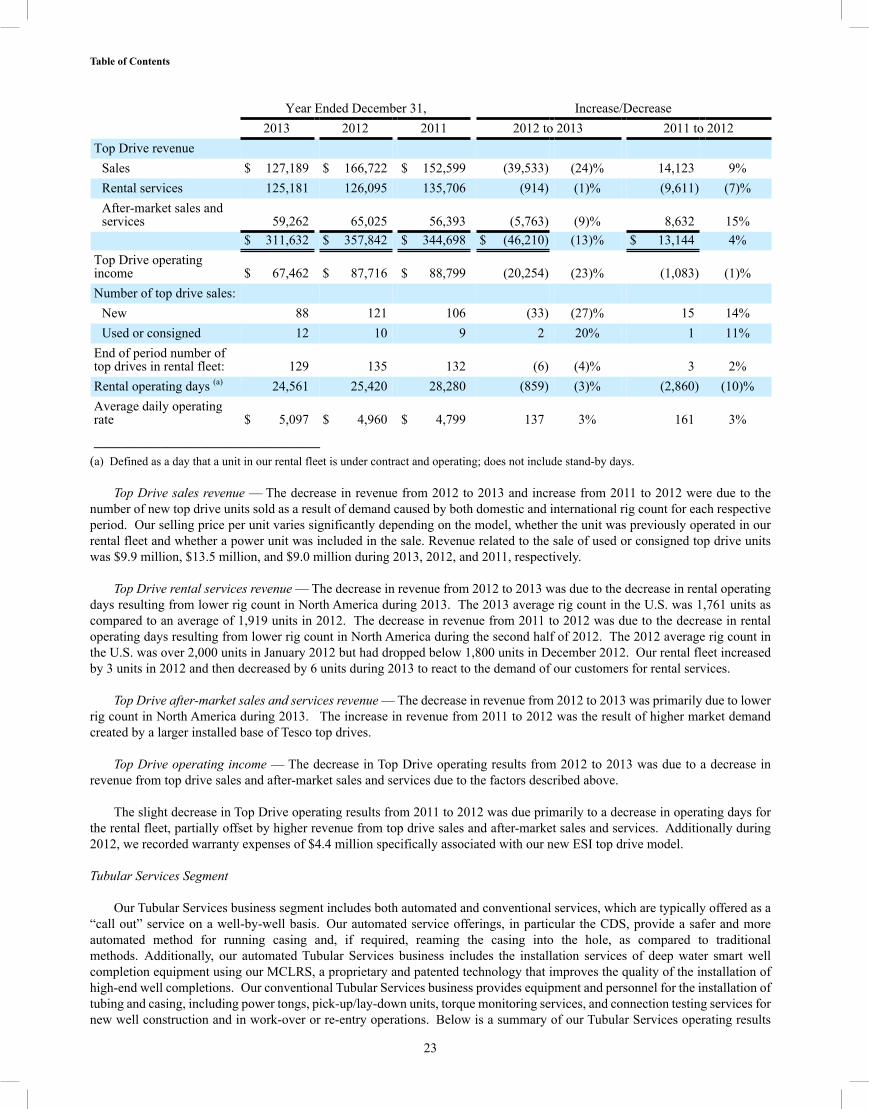
23
Year Ended December 31, Increase/Decrease 2013 2012 2011 2012 to 2013 2011 to 2012Top Drive revenue
Sales $ 127,189 $ 166,722 $ 152,599 (39,533) (24)% 14,123 9%Rental services 125,181 126,095 135,706 (914) (1)% (9,611) (7)%After-market sales andservices 59,262 65,025 56,393 (5,763) (9)% 8,632 15%
$ 311,632 $ 357,842 $ 344,698 $ (46,210) (13)% $ 13,144 4%Top Drive operatingincome $ 67,462 $ 87,716 $ 88,799 (20,254) (23)% (1,083) (1)%Number of top drive sales:
New 88 121 106 (33) (27)% 15 14%Used or consigned 12 10 9 2 20% 1 11%
End of period number oftop drives in rental fleet: 129 135 132 (6) (4)% 3 2%Rental operating days (a) 24,561 25,420 28,280 (859) (3)% (2,860) (10)%Average daily operatingrate $ 5,097 $ 4,960 $ 4,799 137 3% 161 3%__________________________________
(a) Defined as a day that a unit in our rental fleet is under contract and operating; does not include stand-by days.
Top Drive sales revenue — The decrease in revenue from 2012 to 2013 and increase from 2011 to 2012 were due to the number of new top drive units sold as a result of demand caused by both domestic and international rig count for each respective period. Our selling price per unit varies significantly depending on the model, whether the unit was previously operated in our rental fleet and whether a power unit was included in the sale. Revenue related to the sale of used or consigned top drive units was $9.9 million, $13.5 million, and $9.0 million during 2013, 2012, and 2011, respectively.
Top Drive rental services revenue — The decrease in revenue from 2012 to 2013 was due to the decrease in rental operating days resulting from lower rig count in North America during 2013. The 2013 average rig count in the U.S. was 1,761 units as compared to an average of 1,919 units in 2012. The decrease in revenue from 2011 to 2012 was due to the decrease in rental operating days resulting from lower rig count in North America during the second half of 2012. The 2012 average rig count in the U.S. was over 2,000 units in January 2012 but had dropped below 1,800 units in December 2012. Our rental fleet increased by 3 units in 2012 and then decreased by 6 units during 2013 to react to the demand of our customers for rental services.
Top Drive after-market sales and services revenue — The decrease in revenue from 2012 to 2013 was primarily due to lower rig count in North America during 2013. The increase in revenue from 2011 to 2012 was the result of higher market demand created by a larger installed base of Tesco top drives.
Top Drive operating income — The decrease in Top Drive operating results from 2012 to 2013 was due to a decrease in revenue from top drive sales and after-market sales and services due to the factors described above.
The slight decrease in Top Drive operating results from 2011 to 2012 was due primarily to a decrease in operating days for the rental fleet, partially offset by higher revenue from top drive sales and after-market sales and services. Additionally during 2012, we recorded warranty expenses of $4.4 million specifically associated with our new ESI top drive model.
Tubular Services Segment
Our Tubular Services business segment includes both automated and conventional services, which are typically offered as a “call out” service on a well-by-well basis. Our automated service offerings, in particular the CDS, provide a safer and more automated method for running casing and, if required, reaming the casing into the hole, as compared to traditional methods. Additionally, our automated Tubular Services business includes the installation services of deep water smart well completion equipment using our MCLRS, a proprietary and patented technology that improves the quality of the installation of high-end well completions. Our conventional Tubular Services business provides equipment and personnel for the installation of tubing and casing, including power tongs, pick-up/lay-down units, torque monitoring services, and connection testing services for new well construction and in work-over or re-entry operations. Below is a summary of our Tubular Services operating results
Table of Contents

24
and metrics for the years ended December 31, 2013, 2012, and 2011 (revenue and operating income in thousands, except percentages):
Year Ended December 31, Increase/Decrease 2013 2012 2011 2012 to 2013 2011 to 2012Tubular Services revenue
Automated $ 172,174 $ 141,191 $ 120,315 $ 30,983 22% $ 20,876 17%Conventional 40,823 41,213 30,809 (390) (1)% 10,404 34%
$ 212,997 $ 182,404 $ 151,124 $ 30,593 17% $ 31,280 21%Tubular Servicesoperating income $ 37,004 $ 21,708 $ 16,680 $ 15,296 70% $ 5,028 30%
Number of automated jobs 4,008 3,525 3,557 483 14% (32) (1)%
The increases in Tubular Services revenue from 2012 to 2013 and from 2011 to 2012 were due to increased demand for tubular services. A significant amount of current U.S. drilling activity is in shale formations that require directional and horizontal drilling techniques, which we believe are good applications for our automated service offerings. In addition, increased domestic and international demand for our tubular services, both automated and conventional, has resulted in new jobs at more favorable pricing terms. The Tubular Services automated revenue for 2013, 2012, and 2011 also included $16.1 million, $6.7 million, and $2.3 million, respectively, of revenue from CDS equipment sales. Additionally, during 2013 and 2012, Premiere Casing Services - Egypt SAE ("Premiere"), which we acquired in October 2011, recorded $13.3 million and $8.3 million of revenue, respectively, from conventional service offerings, compared to $0.7 million during 2011.
The increase in Tubular Services operating income from 2012 to 2013 was due primarily to higher revenue for our automated tubular services offerings mentioned above and increased CDS equipment sales, which provide higher operating margins. The improvement in our Tubular Services operating results from 2011 to 2012 was primarily a function of the revenue factors discussed above, which provided flow-through to our operating margin as benefits were derived from economies of scale. During 2010, our operating results included a $1.8 million decrease in operating income resulting from a customer dispute over contract term interpretations, which was resolved favorably in 2013.
Casing Drilling Segment
On June 4, 2012, we completed the sale of substantially all of the assets of the Casing Drilling segment to the Schlumberger Group. For detailed discussion of this matter, see Part II, Item 8, Financial Statements and Supplementary Data, Note 3 included in the Report on Form 10-K.
Below is a summary of our Casing Drilling operating results for the years ended December 31, 2013, 2012, and 2011 (in thousands, except percentages):
Year Ended December 31, Increase/Decrease 2013 2012 2011 2012 to 2013 2011 to 2012
Casing Drilling revenue $ 624 $ 12,893 $ 17,147 $ (12,269) (95)% $ (4,254) (25)%Casing Drilling operatingincome (loss) $ 2,124 $ 8,191 $ (12,392) $ (6,067) (74)% $ 20,583 166%
Casing Drilling operating income for the years ended December 31, 2013 and 2012, includes a $1.4 million and $12.4 million
gain from the sale of the business segment, respectively.
Research and Engineering Segment
Our Research and Engineering segment is comprised of our internal research and development activities related to our automated tubular services and top drive model development, as well as the Casing Drilling technology prior to the sale on June 4, 2012. The following is a summary of our research and engineering expense for the years ended December 31, 2013, 2012, and 2011 (in thousands, except percentages):
Table of Contents

25
Year Ended December 31, Increase/Decrease 2013 2012 2011 2012 to 2013 2011 to 2012Research and engineeringexpense $ 8,578 $ 10,457 $ 12,512 $ (1,879) (18)% $ (2,055) (16)%
Research and engineering expenses decreased from 2012 to 2013 and 2011 to 2012 due to the absence of Casing Drilling
research and engineering after the sale of this business segment on June 4, 2012. We continue our investment in the development, commercialization and enhancements of our proprietary technologies.
Corporate and Other Segment
Corporate and other expenses primarily consist of the corporate level overhead, general and administrative expenses, and certain selling and marketing expenses. Below is a summary of our corporate and other expense for the years ended December 31, 2013, 2012, and 2011 (in thousands, except percentages):
Year Ended December 31, Increase/Decrease 2013 2012 2011 2012 to 2013 2011 to 2012Corporate and otherexpenses $ 42,396 $ 30,363 $ 38,058 $ 12,033 40% $ (7,695) (20)%Corporate and otherexpenses as a % ofrevenue 8% 5% 7% 3 pts
(2) pts
Corporate and other expenses were higher in 2013 than in 2012 due primarily to increased general and administrative long-
term and short-term incentive compensation of $3.8 million, increased legal fees of $2.9 million, and increased costs associated with centralized operations support personnel and other related increases of $5.3 million. Corporate and other expenses were lower in 2012 than in 2011 primarily due to decreased short term and long term incentive compensation.
Corporate and other expenses as a percentage of revenue increased in 2013 as compared to 2012 and 2011 due to lower revenues during 2013 primarily due to decreased top drive sales and increased corporate and other expenses due to the factors mentioned above.
Other Expense
Below is a summary of our other expense for the years ended December 31, 2013, 2011, and 2010 (in thousands, except percentages):
Year Ended December 31, Increase/Decrease 2013 2012 2011 2012 to 2013 2011 to 2012Other expense
Interest expense $ 713 $ 1,204 $ 1,504 $ (491) (41)% $ (300) (20)%Interest income (49) (104) (2,596) 55 53% 2,492 96%Foreign exchange losses 4,835 3,083 2,523 1,752 57% 560 22%Other income (1,547) (1,983) (186) 436 22% (1,797) (966)%
Total other expense $ 3,952 $ 2,200 $ 1,245 $ 1,752 80% $ 955 77% Interest expense — Interest expense decreased from 2012 to 2013 due primarily to interest expenses accrued during 2012
for tax assessments in foreign jurisdictions. Interest expense decreased from 2011 to 2012 due primarily to a reduction of $1.6 million to interest expense previously accrued for a legacy withholding tax issue in a foreign jurisdiction based on favorable determinations received in April 2012 and January 2013. This reduction was partially off-set by interest expenses accrued during 2012 for tax assessments in foreign jurisdictions. For detailed discussion of these tax matters, see Part II, Item 8, Financial Statements and Supplementary Data, Note 14 included in the Report on Form 10-K. During the fourth quarter of 2012, we drew
Table of Contents
26
down and repaid $10.0 million on our credit facility to fund working capital needs. In addition, 2012 results include interest expense on the debt assumed from our acquisition of Premiere in October 2011.
Interest income — Interest income decreased from 2011 in both 2012 and 2013 due to a refund received from the Mexican tax authorities during the second quarter of 2011 as described in Part II, Item 8. Financial Statements and Supplementary Data, Note 14 of this Report on Form 10-K. We recorded $2.4 million in interest income and $0.6 million in other income, partially offset by $0.4 million of interest expense during 2011 related to this refund.
Foreign exchange losses — Foreign exchange losses increased from 2012 to 2013 and from 2011 to 2012 due to fluctuations in the valuation of the U.S. dollar compared to other currencies in which we transact around the world, including the Venezuelan bolivar fuerte, Canadian dollars, Argentine pesos, Mexican pesos, Russian rubles, Euros, and Singapore dollars, among others. During 2013 we were especially impacted by currency losses in Latin America. During 2012 and 2011, our foreign exchange losses were negatively affected by increased volatility in the global economy caused by the U.S. debt downgrade and European debt crisis. From time to time, we may use foreign currency forward contracts to manage our currency exchange exposures on foreign currency denominated balances and anticipated cash flows. However, we did not have any foreign currency forward contracts in place during the years ended December 31, 2013, 2012, and 2011.
Other expense — Other expense reflects gains and losses on sales of non-operating assets, penalties, and other miscellaneous expense (income). In 2013, we participated in an amnesty program for tax issues in a foreign jurisdiction. The impact of this program was recognized in the first quarter of 2013 by reversing $1.8 million of other expense previously accrued for this issue. In 2012, we recorded a reduction of $3.1 million previously expensed for a legacy withholding tax issue in a foreign jurisdiction based on favorable determinations received in April 2012 and January 2013. This reduction was partially off-set by penalties accrued during 2012 for tax assessments in foreign jurisdictions. For detailed discussion of these tax matters, see Part II, Item 8, Financial Statements and Supplementary Data, Note 14 included in the Report on Form 10-K.
Income Tax Provision
Year Ended December 31, Increase/Decrease 2013 2012 2011 2012 to 2013 2011 to 2012Effective income tax rate 30% 33% 35% (3) pts (2) pts
We are an Alberta, Canada corporation. We conduct business and are taxed on profits earned in a number of jurisdictions
around the world. Our income tax rate is based on the laws and rates in effect in the countries in which our operations are conducted or in which we are considered a resident for income tax purposes. Our effective tax rate, which is income tax expense as a percentage of pre-tax earnings, fluctuates from year to year based on the level of profits earned in each jurisdiction in which we operate and the tax rates applicable to such earnings.
Our effective tax rates for 2013, 2012, and 2011 were higher than the 25.0% Canadian statutory rate primarily due to the level of profit earned in higher-taxed jurisdictions and non-deductible expenses in those jurisdictions.
Additionally, our effective tax rate in 2012 included an accrual of $1.5 million for a tax assessment in a foreign jurisdiction and a $1.4 million valuation allowance adjustment related to foreign subsidiary net operating losses. No provision is made for taxes that may be payable on the repatriation of accumulated earnings in our foreign subsidiaries on the basis that these earnings will continue to be used to finance the activities of these subsidiaries.
For a further description of income tax matters, see Part II, Item 8. Financial Statements and Supplementary Data, Note 11 and Part II, Item 9A, Controls and Procedures included in this Report on Form 10-K.
Liquidity and Capital Resources
We rely on our cash and access to credit to fund our operations, growth initiatives, and acquisitions. Our primary sources of liquidity are cash flows generated from our operations, available cash and cash equivalents, and availability under our revolving credit facility. We use these sources of liquidity to fund our working capital requirements, capital expenditures, strategic investments and acquisitions. For 2014, we forecast capital expenditures to be between $35 million and $45 million, based on current market conditions. We expect to be able to fund our activities for 2014 with cash flows generated from our operations, available cash and cash equivalents, and available borrowings under our revolving credit facility.
Table of Contents
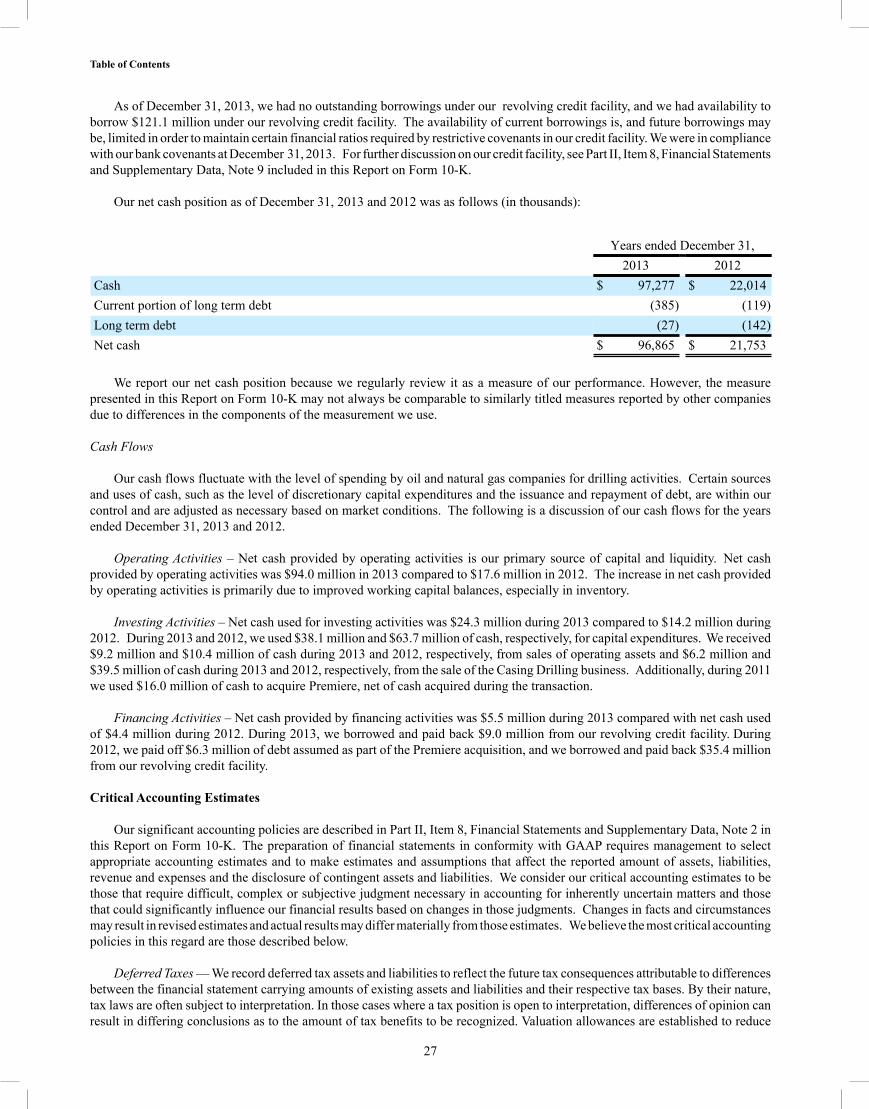
27
As of December 31, 2013, we had no outstanding borrowings under our revolving credit facility, and we had availability to borrow $121.1 million under our revolving credit facility. The availability of current borrowings is, and future borrowings may be, limited in order to maintain certain financial ratios required by restrictive covenants in our credit facility. We were in compliance with our bank covenants at December 31, 2013. For further discussion on our credit facility, see Part II, Item 8, Financial Statements and Supplementary Data, Note 9 included in this Report on Form 10-K.
Our net cash position as of December 31, 2013 and 2012 was as follows (in thousands):
Years ended December 31, 2013 2012Cash $ 97,277 $ 22,014Current portion of long term debt (385) (119)Long term debt (27) (142)Net cash $ 96,865 $ 21,753
We report our net cash position because we regularly review it as a measure of our performance. However, the measure presented in this Report on Form 10-K may not always be comparable to similarly titled measures reported by other companies due to differences in the components of the measurement we use.
Cash Flows
Our cash flows fluctuate with the level of spending by oil and natural gas companies for drilling activities. Certain sources and uses of cash, such as the level of discretionary capital expenditures and the issuance and repayment of debt, are within our control and are adjusted as necessary based on market conditions. The following is a discussion of our cash flows for the years ended December 31, 2013 and 2012.
Operating Activities – Net cash provided by operating activities is our primary source of capital and liquidity. Net cash provided by operating activities was $94.0 million in 2013 compared to $17.6 million in 2012. The increase in net cash provided by operating activities is primarily due to improved working capital balances, especially in inventory.
Investing Activities – Net cash used for investing activities was $24.3 million during 2013 compared to $14.2 million during 2012. During 2013 and 2012, we used $38.1 million and $63.7 million of cash, respectively, for capital expenditures. We received $9.2 million and $10.4 million of cash during 2013 and 2012, respectively, from sales of operating assets and $6.2 million and $39.5 million of cash during 2013 and 2012, respectively, from the sale of the Casing Drilling business. Additionally, during 2011 we used $16.0 million of cash to acquire Premiere, net of cash acquired during the transaction.
Financing Activities – Net cash provided by financing activities was $5.5 million during 2013 compared with net cash used
of $4.4 million during 2012. During 2013, we borrowed and paid back $9.0 million from our revolving credit facility. During 2012, we paid off $6.3 million of debt assumed as part of the Premiere acquisition, and we borrowed and paid back $35.4 million from our revolving credit facility.
Critical Accounting Estimates
Our significant accounting policies are described in Part II, Item 8, Financial Statements and Supplementary Data, Note 2 in this Report on Form 10-K. The preparation of financial statements in conformity with GAAP requires management to select appropriate accounting estimates and to make estimates and assumptions that affect the reported amount of assets, liabilities, revenue and expenses and the disclosure of contingent assets and liabilities. We consider our critical accounting estimates to be those that require difficult, complex or subjective judgment necessary in accounting for inherently uncertain matters and those that could significantly influence our financial results based on changes in those judgments. Changes in facts and circumstances may result in revised estimates and actual results may differ materially from those estimates. We believe the most critical accounting policies in this regard are those described below.
Deferred Taxes — We record deferred tax assets and liabilities to reflect the future tax consequences attributable to differences between the financial statement carrying amounts of existing assets and liabilities and their respective tax bases. By their nature, tax laws are often subject to interpretation. In those cases where a tax position is open to interpretation, differences of opinion can result in differing conclusions as to the amount of tax benefits to be recognized. Valuation allowances are established to reduce
Table of Contents

28
deferred tax assets when it is more likely than not that some portion or all of the tax asset will not be realized. We consider estimates of future taxable income and ongoing tax planning in assessing the utilization of available tax losses and credits. Unforeseen events and industry conditions may impact forecasts of future taxable income which, in turn, can affect the carrying value of the deferred tax assets and liabilities and impact our future reported earnings. The level of evidence and documentation necessary to support a position prior to being given recognition and measurement within the financial statements is a matter of judgment that depends on all available evidence. A change in our forecast of future taxable income, or changes in circumstances, assumptions and clarification of uncertain tax regimes may require changes to any valuation allowances associated with our deferred tax assets, which could have a material effect on net income.
Loss Contingencies — We accrue loss contingency reserves when our assessments indicate that it is probable that a liability
has been incurred or an asset will not be recovered and an amount can be reasonably estimated. Estimates of our liabilities are based on an evaluation of potential outcomes and currently available facts. Actual results may differ from our estimates, and our estimates can be revised in the future, either negatively or positively, depending upon actual outcomes or changes in expectations based on the facts surrounding each matter.
Revenue Recognition — We recognize revenue when the earnings process is complete, persuasive evidence of an arrangement exists, price is fixed or determinable, and collectability is reasonably assured. For product sales, revenue is recognized upon delivery when title and risk of loss of the equipment is transferred to the customer, with no right of return. For the sale of our top drives, we determine the transfer of title and risk of loss in accordance with contracts with our customers and the related International Commercial Terms. Revenue in the Top Drive segment may be generated from contractual arrangements that include multiple deliverables. Revenue from these arrangements is recognized as each item or service is delivered based on their relative fair value and when the delivered items or services have stand-alone value to the customer. For revenue other than product sales, we recognize revenue as the services are rendered based upon agreed daily, hourly or job rates.
We provide product warranties on equipment sold pursuant to manufacturing contracts and provide for the anticipated cost of such warranties in cost of sales and services when sales revenue is recognized. The accrual of warranty costs is an estimate based upon historical experience and upon specific warranty issues as they arise. We periodically review our warranty provision to assess its adequacy in the light of actual warranty costs incurred. The key factors with respect to estimating our product warranty accrual are our assumptions regarding the quantity and the estimated cost of potential warranty exposure. Historically, our warranty expense has fluctuated based on the identification of specifically identified technical issues, and warranty expense does not necessarily move in concert with sales levels. However, because the warranty accrual is an estimate, it is reasonably possible that future warranty issues could arise that could have a significant impact on our financial statements.
Allowance for Doubtful Accounts Receivable — We maintain an allowance for doubtful accounts to record accounts receivable at their net realizable value. The main factors in determining the allowance needed for accounts receivable are customer bankruptcies, delinquency, and management’s estimate of ability to collect outstanding receivables based on the number of days outstanding and risks of economic, political and civil instabilities. We make assumptions regarding current market conditions and how they may affect our customers’ ability to pay outstanding receivables based on the length of time that a receivable remains unpaid, our historical experiences with the customers, the financial condition of the individual customers and the international areas in which they operate. Historically, our estimates have not differed materially from the ultimate amounts recognized for bad debts. However, these allowances are based on estimates. If actual results are not consistent with our assumptions and judgments used, we may be exposed to additional write offs of accounts receivable that could be material to our results of operations.
Excess and Obsolete Inventory Provisions — Our inventory is stated at the lower of cost or market. Our estimated market value of inventory depends upon demand driven by oil and natural gas drilling activity, which depends in turn upon oil and natural gas prices, the general outlook for economic growth worldwide, available financing for our customers, political stability in major oil and natural gas producing areas and the potential obsolescence of various types of equipment we sell, among other factors. Quantities of inventory on hand are reviewed periodically to ensure they remain active part numbers and the quantities on hand are not excessive based on usage patterns and known changes to equipment or processes. Our primary exposure with respect to estimating our provision for excess and obsolete inventory is our assumption regarding the projected quantity usage patterns. These estimates are based on historical usage and operating forecasts and are reviewed for reasonableness on a periodic basis. Significant or unanticipated changes in business conditions and/or changes in technologies could impact the amount and timing of provision for excess or obsolete inventory that may be required.
Impairment of Goodwill and Long-Lived Assets —Long-lived assets, which include goodwill, property, plant and equipment, and intangible assets, comprise a substantial portion of our assets. The carrying value of goodwill is reviewed for impairment on an annual basis and the carrying value of other long-lived assets are reviewed for impairment whenever events or changes in circumstances indicate that their carrying amounts may not be recoverable.
Table of Contents
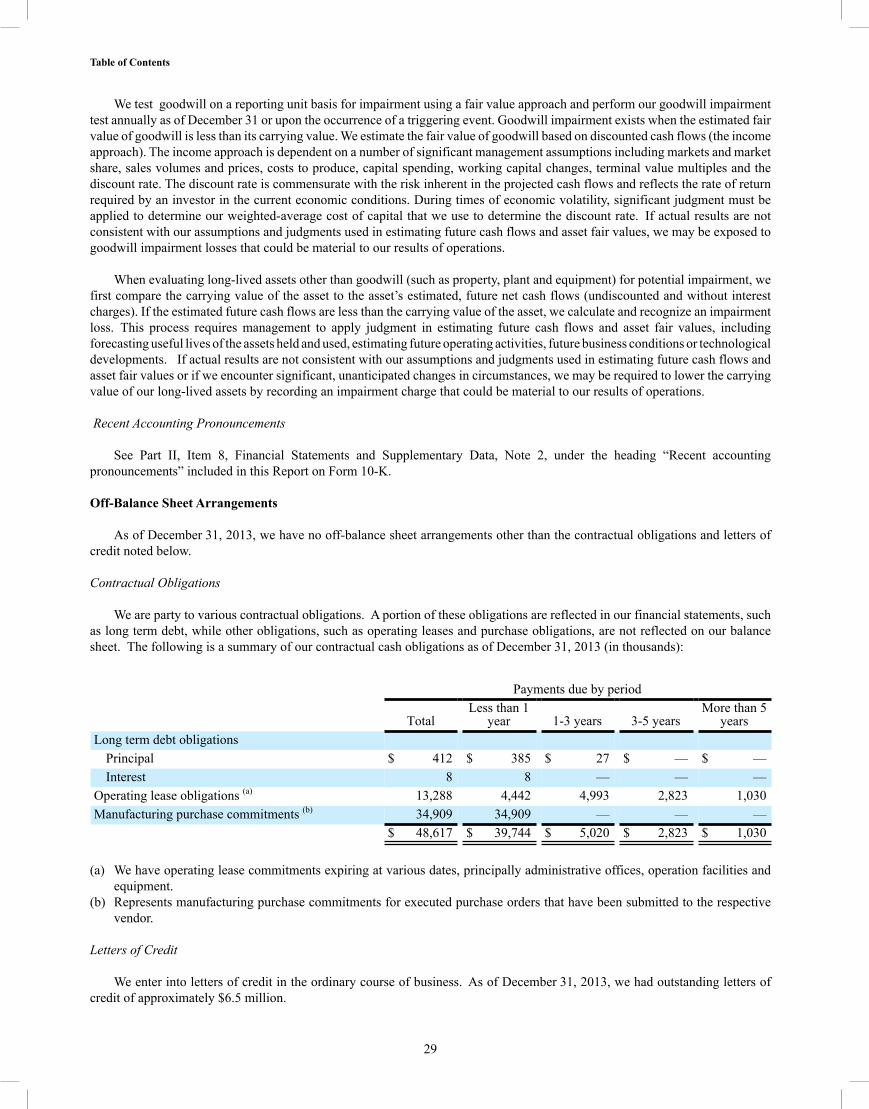
29
We test goodwill on a reporting unit basis for impairment using a fair value approach and perform our goodwill impairment test annually as of December 31 or upon the occurrence of a triggering event. Goodwill impairment exists when the estimated fair value of goodwill is less than its carrying value. We estimate the fair value of goodwill based on discounted cash flows (the income approach). The income approach is dependent on a number of significant management assumptions including markets and market share, sales volumes and prices, costs to produce, capital spending, working capital changes, terminal value multiples and the discount rate. The discount rate is commensurate with the risk inherent in the projected cash flows and reflects the rate of return required by an investor in the current economic conditions. During times of economic volatility, significant judgment must be applied to determine our weighted-average cost of capital that we use to determine the discount rate. If actual results are not consistent with our assumptions and judgments used in estimating future cash flows and asset fair values, we may be exposed to goodwill impairment losses that could be material to our results of operations.
When evaluating long-lived assets other than goodwill (such as property, plant and equipment) for potential impairment, we first compare the carrying value of the asset to the asset’s estimated, future net cash flows (undiscounted and without interest charges). If the estimated future cash flows are less than the carrying value of the asset, we calculate and recognize an impairment loss. This process requires management to apply judgment in estimating future cash flows and asset fair values, including forecasting useful lives of the assets held and used, estimating future operating activities, future business conditions or technological developments. If actual results are not consistent with our assumptions and judgments used in estimating future cash flows and asset fair values or if we encounter significant, unanticipated changes in circumstances, we may be required to lower the carrying value of our long-lived assets by recording an impairment charge that could be material to our results of operations. Recent Accounting Pronouncements
See Part II, Item 8, Financial Statements and Supplementary Data, Note 2, under the heading “Recent accounting pronouncements” included in this Report on Form 10-K.
Off-Balance Sheet Arrangements
As of December 31, 2013, we have no off-balance sheet arrangements other than the contractual obligations and letters of credit noted below.
Contractual Obligations
We are party to various contractual obligations. A portion of these obligations are reflected in our financial statements, such as long term debt, while other obligations, such as operating leases and purchase obligations, are not reflected on our balance sheet. The following is a summary of our contractual cash obligations as of December 31, 2013 (in thousands):
Payments due by period
TotalLess than 1
year 1-3 years 3-5 yearsMore than 5
yearsLong term debt obligations
Principal $ 412 $ 385 $ 27 $ — $ —Interest 8 8 — — —
Operating lease obligations (a) 13,288 4,442 4,993 2,823 1,030Manufacturing purchase commitments (b) 34,909 34,909 — — — $ 48,617 $ 39,744 $ 5,020 $ 2,823 $ 1,030
(a) We have operating lease commitments expiring at various dates, principally administrative offices, operation facilities and equipment.
(b) Represents manufacturing purchase commitments for executed purchase orders that have been submitted to the respective vendor.
Letters of Credit
We enter into letters of credit in the ordinary course of business. As of December 31, 2013, we had outstanding letters of credit of approximately $6.5 million.
Table of Contents
30
Item 7A. Quantitative and Qualitative Disclosures About Market Risk.
We are exposed to market risks in our normal business activities. Market risk is the potential loss that may result from market changes associated with an existing or forecasted financial transaction. The types of market risks we are exposed to are credit risk, foreign currency risk and interest rate risk.
Credit Risk – Our financial instruments that potentially subject us to concentrations of credit risk consist primarily of cash equivalents and accounts receivable. Cash equivalents, such as deposits, investments in short-term commercial paper and other money market instruments, are held by major banks. Our accounts receivable are principally with oil and natural gas service, exploration and production companies and are subject to normal industry credit risks. For a further discussion, see Part II, Item 8, Financial Statements and Supplementary Data, Note 15 included in this Report on Form 10-K.
Interest Rate Risk – At December 31, 2013, our debt consisted of capital leases assumed in our acquisition of Premiere and various short-term notes payable. At year end, we had no outstanding debt related to our credit facility, but we have had significant debt borrowings in the past and currently have the ability to borrow up to $121.1 million under our existing revolving credit facility, subject to the maintenance of certain financial ratios required by restrictive covenants. Our credit facility has a variable interest rate, which exposes us to interest rate risk. From time to time, we may use derivative financial instruments to manage our interest rate exposures. Exposures arising from changes in prevailing levels of interest rates relative to the contractual rates on our debt may be managed by entering into interest rate swap agreements when it is deemed appropriate. We were not party to any interest rate swaps during the year ended December 31, 2013.
The carrying value of cash, investments in short-term commercial paper, and other money market instruments, accounts receivable, accounts payable, and accrued liabilities approximate their fair value due to the relatively short-term period to maturity of the instruments. The fair value of our long-term debt depends primarily on current market interest rates for debt issued with similar maturities by companies with risk profiles similar to us.
Foreign Currency Risk – As a multinational company, we conduct business in over 35 countries. On a global basis, our functional currency is the US dollar, which is consistent with much of the oil and gas industry. Over 75% of our revenue in 2013 was denominated in US dollars. However, outside the United States, a significant portion of our expenses are incurred in foreign currencies. Therefore, when the US dollar weakens in relation to the foreign currencies of the countries in which we conduct business, the US dollar-reported expenses will increase. Conversely, when local currencies weaken in relation to the US dollar we experience foreign exchange losses on monetary settlement and balances that are receivable in local currencies. As a result, we have experienced foreign exchange losses of $4.8 million, $3.1 million and $2.5 million for the years ended December 31, 2013, 2012 and 2011, respectively.
In late January 2014, Venezuela announced the establishment of a dual exchange rate system. A rate of 6.3 Venezuelan bolivar fuerte to the US dollar will be applied to priority sectors, such as food and medicine, while other sectors of the economy will apply an exchange rate determined based on the results of the Venezuelan central bank’s system of weekly currency auctions. Although the functional currency of our operations in Venezuela is the US dollar, a portion of the transactions are denominated in bolivar fuerte. For financial reporting purposes, such local currency transactions are remeasured into US dollars at the official exchange rate which was fixed at 6.3 Venezuelan bolivar fuerte to the US dollar for most of 2013. At December 31, 2013, we had approximately $5 million of net monetary assets denominated in Venezuelan bolivar fuerte. Depending on the exchange rate we are required to apply, we may incur a charge to our income statement in the first quarter of 2014. For example, if we are required to apply an exchange rate that is 20% more Venezuelan bolivar fuerte to the US dollar it would result in a charge of approximately $1.0 million.
The functional currency of our operations in Argentina is the US dollar, a portion of the transactions are denominated in Argentine pesos. For financial reporting purposes, such local currency transactions are remeasured into US dollars at the market exchange rates through related reporting periods. For 2013 the exchange rate of Argentine pesos to the US dollar for most of 2013 fluctuated and became more unfavorable to the US dollar as the year progressed. At January 1, 2013 the exchange rate of Argentine pesos to the US dollar was 4.9 and at December 31, 2013 the exchange rate was 6.5. This unfavorable trend is expected to continue into 2014 as the exchange rate at January 31, 2014 was 8.0. At December 31, 2013, we had approximately $8 million of net monetary assets denominated in Argentine pesos. Depending on the exchange rate we are required to apply, we may incur a charge to our income statement in the first quarter of 2014. For example, if we are required to apply an exchange rate of 8.0 Argentine Pesos to the US dollar it would result in a charge of approximately $1.8 million.
Item 8. Financial Statements and Supplementary Data.
The financial statements and supplementary data required by this item are included in Part IV, Item 15, Exhibits and Financial Statement Schedules included in this Report on Form 10-K and are presented beginning on page F-1.
Table of Contents

31
Item 9. Changes in and Disagreements with Accountants on Accounting and Financial Disclosure.
As previously reported, the Audit Committee of the Board of Directors (the “Audit Committee”) of the Company conducted a competitive process to select an independent registered public accounting firm to serve as the Company’s independent registered public accounting firm for the fiscal year ending December 31, 2014. As a result of this selection process, the Audit Committee approved the dismissal of PricewaterhouseCoopers LLP (“PwC”) from that role on February 10, 2014. The Audit Committee approved the engagement of Ernst & Young LLP (“E&Y”) to serve as the Company’s independent registered public accounting firm for the fiscal year ended December 31, 2014. The Audit Committee’s formal engagement of E&Y is subject to the approval of the Company’s shareholders at the Company’s 2014 annual meeting of shareholders.
During the two fiscal years ended December 31, 2013 and December 31, 2012, respectively, and the subsequent interim period through February 10, 2014, there were no disagreements between the Company and PwC on any matter of accounting principles or practices, financial statement disclosure or auditing scope or procedure which, if not resolved to PwC’s satisfaction, would have caused PwC to make reference to the subject matter of the disagreement in connection with their reports on the Company’s consolidated financial statements for such years within the meaning of Item 304(a)(1)(iv) of Regulation S-K. In addition, during the periods identified above, there were no reportable events as defined in Item 304(a)(1)(v) of Regulation S-K.
Item 9A. Controls and Procedures. Evaluation of disclosure controls and procedures
We maintain disclosure controls and procedures designed to provide reasonable assurance that information required to be disclosed in the SEC reports we file or submit under the Securities Exchange Act of 1934, as amended (the “Exchange Act”) is recorded, processed, summarized, and reported within the time period specified by the SEC’s rules and forms and that such information is accumulated and communicated to management, including our Chief Executive Officer and Chief Financial Officer, to allow timely decisions regarding required disclosure. As of December 31, 2013, our Chief Executive Officer and Chief Financial Officer participated with management in evaluating the effectiveness of our disclosure controls and procedures (as defined in Rules 13a-15(e) and 15d-15(e) under the Exchange Act). Our Chief Executive Officer and Chief Financial Officer have concluded that, as of December 31, 2013, our disclosure controls and procedures were effective at the reasonable assurance level.
Management’s report on internal control over financial reporting
A company’s internal control over financial reporting is a process designed by, or under the supervision of, a company’s Chief Executive Officer and Chief Financial Officer, or persons performing similar functions, and effected by the board of directors, management and other personnel, to provide reasonable assurance regarding the reliability of financial reporting and the preparation of financial statements for external purposes in accordance with GAAP. A company’s internal control over financial reporting includes those policies and procedures that: (i) pertain to the maintenance of records that, in reasonable detail, accurately and fairly reflect the transactions and dispositions of the assets of the company, (ii) provide reasonable assurance that transactions are recorded as necessary to permit preparation of financial statements in accordance with GAAP and that receipts and expenditures are being made only in accordance with authorizations of management and directors of the company, and (iii) provide reasonable assurance regarding prevention or timely detection of unauthorized acquisition, use or disposition of the company’s assets that could have a material effect on the financial statements.
Because of its inherent limitations, internal control over financial reporting may not prevent or detect misstatements. Also, projections of any evaluation of effectiveness to future periods are subject to the risk that controls may become inadequate because of changes in conditions, or that the degree of compliance with the policies or procedures may deteriorate.
Management is responsible for establishing and maintaining adequate internal control over financial reporting. Our management, with the participation of our Chief Executive Officer and Chief Financial Officer, has assessed the effectiveness of our internal control over financial reporting as of December 31, 2013. In making this assessment, our management used the criteria established in Internal Control—Integrated Framework issued in 1992 by the Committee of Sponsoring Organizations of the Treadway Commission (“COSO”).
Based on management's assessment using the COSO criteria, we have concluded that, as of December 31, 2013, our internal control over financial reporting was effective.
The effectiveness of our internal control over financial reporting as of December 31, 2013, has been audited by PricewaterhouseCoopers LLP, our independent registered public accounting firm, as stated in their report which is included herein.
Table of Contents

32
Changes in internal control over financial reporting
There were no changes in our internal control over financial reporting during the quarter ended December 31, 2013, that materially affected, or are reasonably likely to materially affect, our internal control over financial reporting. Item 9B. Other Information.
None.
Table of Contents
33
PART III
Item 10. Directors, Executive Officers and Corporate Governance.
The information required by this Item (other than the information set forth in the next paragraph in this Item 10) will be included under the section captioned “Election of Directors (Proposal One)” in our proxy statement for the 2014 annual meeting of shareholders, which information is incorporated into this Report on Form 10-K by reference.
We have adopted a Code of Business Conduct and Ethics that applies to our officers, directors, and employees. The full text of our code of business conduct and ethics can be found on our website (http://www.tescocorp.com) under the “Corporate Governance” heading on the “Investor Relations” page and attached hereto as Exhibit 14. We may satisfy the disclosure requirements under Item 5.05 of Form 8-K regarding an amendment to, or a waiver from, a provision of our code of business conduct and ethics that applies to our principal executive officer, principal financial officer, principal accounting officer, or controller, or persons performing similar functions, by posting such information on our website where it is accessible through the same link noted above.
Item 11. Executive Compensation.
The information required by this Item will be included under the sections captioned “Compensation Discussion and Analysis” and “Certain Relationships and Related Transactions” in our proxy statement for the 2014 annual meeting of shareholders, which information is incorporated into this Report on Form 10-K by reference.
Item 12. Security Ownership of Certain Beneficial Owners and Management and Related Stockholder Matters.
The information required by this Item will be included under the section captioned “Security Ownership of Certain Beneficial Owners and Management” in our proxy statement for the 2014 annual meeting of shareholders, which information is incorporated into this Report on Form 10-K by reference.
Item 13. Certain Relationships and Related Transactions and Director Independence.
The information required by this Item will be included under the section captioned “Certain Relationships and Related Transactions” in our proxy statement for the 2014 annual meeting of shareholders, which information is incorporated into this Report on Form 10-K by reference.
Item 14. Principal Accountant Fees and Services.
Information required by this Item will be included under the section captioned “Appointment of the Independent Auditors (Proposal Two)” in our proxy statement for the 2014 annual meeting of shareholders, which information is incorporated into this Report on Form 10-K by reference.
Table of Contents
34
PART IV
Item 15. Exhibits and Financial Statement Schedules.
(a) The following documents are filed as part of this report:
(1) Financial Statements Page No. Report of independent registered public accounting firm F-2 Consolidated balance sheets - December 31, 2013 and 2012 F-3 Consolidated statements of income for each of the three years in the period ended December 31,
2013 F-4 Consolidated statements of shareholders’ equity and comprehensive income for each of three years
in the period ended December 31, 2013 F-5 Consolidated statements of cash flows for each of the three years in the period ended December 31,
2013 F-6 Notes to consolidated financial statements F-7 (2) Financial Statement Schedules Page No. Schedule II—Valuation and qualifying accounts F-30
(b) Exhibits
Exhibit No. Description
3.1* Restated Articles of Amalgamation of Tesco Corporation, dated May 29, 2007 (incorporated by reference toExhibit 3.1 to Tesco Corporation’s Current Report on Form 8-K filed with the SEC on June 1, 2007)
3.2* Amended and Restated By-laws of Tesco Corporation (incorporated by reference to Exhibit 3.1 to TescoCorporation’s Current Report on Form 8-K filed with the SEC on May 22, 2007)
4.1* Form of Common Share Certificate for Tesco Corporation (incorporated by reference to Exhibit 4.1 to TescoCorporation’s Quarterly Report on Form 10-Q filed with the SEC on November 8, 2011)
4.2* Shareholder Rights Plan Agreement between Tesco Corporation and Computershare Trust Company ofCanada, as Rights Agent, Amended and Restated as of May 4, 2011 (incorporated by reference to Exhibit 10.1to Tesco Corporation’s Current Report on Form 8-K filed with the SEC on June 13, 2011)
10.1* Asset Purchase Agreement dated April 29, 2012 (incorporated by reference to Exhibit 10.1 to TescoCorporation’s Current Report on Form 8-K filed with the SEC on May 1, 2012)
10.2* First Amendment to Asset Purchase Agreement dated June 4, 2012 (incorporated by reference to Exhibit 10.1to Tesco Corporation’s Current Report on Form 8-K filed with the SEC on June 8, 2012)
10.3* Second Amended and Restated Credit Agreement dated April 27, 2012 by and among Tesco Corporation,Tesco US Holding LP, the lender parties thereto and JP Morgan Chase Bank, NA (incorporated by reference toExhibit 10.2 to Tesco Corporation’s Current Report on Form 8-K filed with the SEC on May 1, 2012)
10.4*Lease between NK IV Tech, Ltd. and Tesco Corporation (US), for the lease of the corporate headquarters ofTesco Corporation, dated July 6, 2006 (incorporated by reference to Exhibit 10.9 to Tesco Corporation’sAnnual Report on Form 10-K filed with the SEC on March 29, 2007)
10.5First Amendment to Lease between TIC Properties Management, LLC, as successor in interest to NK IV TechLtd. and Tesco Corporation (US), for an extension tot he lease of the corporate headquarters of TescoCorporation, dated and effective September 19, 2013
10.6* Final Settlement and License Agreement between Tesco Corporation and Weatherford International Inc. andWeatherford/Lamb, Inc. dated January 11, 2011, effective as of October 26, 2010
Table of Contents

35
Exhibit No. Description
10.7*+ Form of Director Indemnity Agreement (incorporated by reference to Exhibit 10.1 to Tesco Corporation’s Current Report on Form 8-K filed with the SEC on April 6, 2009)
10.8*+ Form of Officer Indemnity Agreement (incorporated by reference to Exhibit 10.2 to Tesco Corporation’s Current Report on Form 8-K filed with the SEC on April 6, 2009)
10.9*+ Employment Agreement effective December 31, 2008 by and between Tesco Corporation and Julio M. Quintana (incorporated by reference to Exhibit 10.1 to Tesco Corporation’s Current Report on Form 8-K filed with the SEC on August 29, 2008)
10.10*+ Employment Agreement effective August 18, 2008 by and between Tesco Corporation and Robert L. Kayl (incorporated by reference to Exhibit 10.1 to Tesco Corporation’s Current Report on Form 8-K filed with the SEC on September 5, 2008)
10.11*+ Employment Agreement effective December 31, 2007 between Tesco Corporation and Jeffrey Foster (incorporated by reference to Exhibit 10.3 to Tesco Corporation’s Current Report on Form 8-K filed with the SEC on January 2, 2008)
10.12*+ Employment Agreement effective May 11, 2009 by and between Tesco Corporation and Fernando Assing (incorporated by reference to Exhibit 10.4 to Tesco Corporation’s Current Report on Form 10-Q filed with the SEC on August 7, 2009)
10.13*+ Employment Agreement dated September 1, 2010, effective as of August 3, 2010 by and between Tesco Corporation and Dean Ferris (incorporated by reference to Exhibit 10.1 to Tesco Corporation’s Current Report on Form 8-K filed with the SEC on September 3, 2010)
10.14*+Employment Agreement dated December 23, 2013, effective as of January 1, 2014 by and between Tesco Corporation and Christopher L. Boone (incorporated by reference to Exhibit 10.1 to Tesco Corporation’s Current Report on Form 8-K filed with the SEC on December 24, 2013)
10.15*+ First Amendment to the Amended and Restated Employment Agreement effective March 15, 2009 by and between Tesco Corporation and Julio M. Quintana (incorporated by reference to Exhibit 10.1 to Tesco Corporation’s Current Report on Form 8-K filed with the SEC on March 17, 2009)
10.16*+ First Amendment to the Employment Agreement effective March 15, 2009 by and between Tesco Corporation and Robert L. Kayl (incorporated by reference to Exhibit 10.2 to Tesco Corporation’s Current Report on Form 8-K filed with the SEC on March 17, 2009)
10.17*+ First Amendment to the Employment Agreement effective March 15, 2009 by and between Tesco Corporation and Jeffrey Foster (incorporated by reference to Exhibit 10.3 to Tesco Corporation’s Current Report on Form
filed with the SEC on March 17, 2009)
10.18*+ Second Amendment to the Employment Agreement effective December 31, 2010 by and between Tesco Corporation and Julio M. Quintana (incorporated by reference to Exhibit 10.21 to Tesco Corporation’s Annual Report on Form 10-K filed with the SEC on March 1, 2011)
10.19*+
Second Amendment to the Employment Agreement effective December 31, 2010 by and between TescoCorporation and Robert L. Kayl (incorporated by reference to Exhibit 10.22 to Tesco Corporation’s AnnualReport on Form 10-K filed with the SEC on March 1, 2011)
10.20*+
Second Amendment to the Employment Agreement effective December 31, 2010 by and between Tesco Corporation and Jeffrey L. Foster (incorporated by reference to Exhibit 10.23 to Tesco Corporation’s Annual Report on Form 10-K filed with the SEC on March 1, 2011)
10.21*+
First Amendment to the Employment Agreement effective December 31, 2010 by and between TescoCorporation and Dean Ferris (incorporated by reference to Exhibit 10.24 to Tesco Corporation’s AnnualReport on Form 10-K filed with the SEC on March 1, 2011)
10.22*+
First Amendment to the Employment Agreement effective December 31, 2010 by and between TescoCorporation and Fernando Assing (incorporated by reference to Exhibit 10.25 to Tesco Corporation’s AnnualReport on Form 10-K filed with the SEC on March 1, 2011)
10.23*+ Third Amendment to the Employment Agreement effective July 15, 2011, but dated October 10, 2011 by and between Tesco Corporation and Jeffrey L. Foster (incorporated by reference to Exhibit 10.23 to Tesco Corporation’s Annual Report on Form 10-K filed with the SEC on March 2, 2012)
Table of Contents
36
Exhibit No. Description
10.24*+
Letter Agreement effective July 15, 2011, but dated February 23, 2012 by and between Tesco Corporation and Fernando Assing (incorporated by reference to Exhibit 10.24 to Tesco Corporation’s Annual Report on Form
filed with the SEC on March 2, 2012)
10.25*+Third Amendment to the Employment Agreement effective January 1, 2014, but dated December 11, 2013 by and between Tesco Corporation and Fernando R. Assing (incorporated by reference to Exhibit 10.1 to Tesco Corporation’s Current Report on Form 8-K filed with the SEC on December 11, 2013.)
10.26*+ Amended and Restated Tesco Corporation 2005 Incentive Plan (incorporated by reference to Exhibit 10.1 to Tesco Corporation’s Current Report on Form 8-K filed with the SEC on May 22, 2007)
10.27*+ Form of Instrument of Grant under Tesco Corporation 2005 Stock Option Plan (incorporated by reference to Exhibit 10.8 to Tesco Corporation’s Annual Report on Form 10-K filed with the SEC on March 28, 2007)
10.28*+ Form of Instrument of Grant under Amended and Restated Tesco Corporation 2005 Incentive Plan (incorporated by reference to Exhibit 10.16 to Tesco Corporation’s Annual Report on Form 10-K filed with the SEC on February 27, 2008)
10.29+ Form of Instrument of Grant under Amended and Restated Tesco Corporation 2005 Incentive Plan, revised November 2013
10.30*+ Tesco Corporation Employee Stock Savings Plan (incorporated by reference to Exhibit 10.2 to Tesco Corporation’s Current Report on Form 8-K filed with the SEC on May 22, 2007)
10.31*+ Tesco Corporation Short Term Incentive Plan 2011 (incorporated by reference to Exhibit 10.33 to Tesco Corporation's Annual Report on Form 10-K filed with the SEC on March 1, 2011)
10.32*+ Tesco Corporation Short Term Incentive Plan 2012 (incorporated by reference to Exhibit 10.32 to Tesco Corporation's Annual Report on Form 10-K filed with the SEC on March 2, 2012)
10.33*+ Tesco Corporation Short Term Incentive Plan 2013 (incorporated by reference to Exhibit 10.31 to Tesco Corporation's Annual Report on Form 10-K filed with the SEC on March 5, 2013)
10.34*+ Tesco Corporation Short Term Incentive Plan 2014 (incorporated by reference to Exhibit 10.2 to Tesco Corporation's Current Report on Form 8-K filed with the SEC on December 24, 2013)
14* Tesco Corporation Code of Business Conduct and Ethics (incorporated by reference to Exhibit 14.1 to Tesco Corporation's Current Report on Form 8-K filed with the SEC on August 14, 2013)
16* Letter from PricewaterhouseCoopers LLP (incorporated by reference to Exhibit 16.1 to Tesco Corporation's Current Report on Form 8-K filed with the SEC on February 14, 2014)
21 Subsidiaries of Tesco Corporation
23 Consent of Independent Registered Public Accounting Firm, PricewaterhouseCoopers LLP
24 Power of Attorney (included on signature page)
31.1 Rule 13a-14(a)/15d-14(a) Certification, executed by Julio M. Quintana, President and Chief Executive Officer of Tesco Corporation
31.2 Rule 13a-14(a)/15d-14(a) Certification, executed by Christopher L. Boone, Senior Vice President and ChiefFinancial Officer of Tesco Corporation
32 Certification pursuant to 18 U.S.C. Section 1350, as adopted pursuant to Section 906 of the Sarbanes-Oxley Act of 2002, executed by Julio M. Quintana, President and Chief Executive Officer of Tesco Corporation and Christopher L. Boone, Senior Vice President and Chief Financial Officer of Tesco Corporation
__________________________________
* Incorporated by reference+ Management contract or compensatory plan or arrangement.
Table of Contents
37
SIGNATURES
Pursuant to the requirements of Section 13 or 15(d) of the Securities Exchange Act of 1934, the registrant has duly caused this report to be signed on its behalf by the undersigned, thereunto duly authorized.
TESCO CORPORATION By: /S/ JULIO M. QUINTANA Julio M. Quintana,
President and Chief Executive Officer Date: March 4, 2014
POWER OF ATTORNEY
KNOW ALL PERSONS BY THESE PRESENTS, that each person whose signature appears below constitutes and appoints
Julio M. Quintana and Dean Ferris, and each of them, acting individually, as his attorney-in-fact, each with full power of substitution and resubstitution, for him and in his name, place and stead, in any and all capacities, to sign any and all amendments to this Report on Form 10-K and other documents in connection herewith and therewith, and to file the same, with all exhibits thereto, with the Securities and Exchange Commission, granting unto said attorneys-in-fact and agents, and each of them, full power and authority to do and perform each and every act and thing requisite and necessary to be done in connection herewith and therewith and about the premises, as fully to all intents and purposes as he might or could do in person, hereby ratifying and confirming all that said attorneys-in-fact and agents, or any of them, or their or his substitute or substitutes, may lawfully do or cause to be done by virtue hereof.
Pursuant to the requirements of the Securities Exchange Act of 1934, this Report on Form 10-K has been signed below by the following persons on behalf of the registrant and in the capacities and on the dates indicated.
Signature Title Date
/S/ JULIO M. QUINTANA President and Chief ExecutiveOfficer and Director
(Principal Executive Officer)March 4, 2014Julio M. Quintana
/s/ CHRIS L. BOONE Senior Vice President andChief Financial Officer
(Principal Financial and Accounting Officer)March 4, 2014Chris L. Boone
/s/ MICHAEL W. SUTHERLIN Chairman of the Board March 4, 2014Michael W. Sutherlin
/s/ FRED J. DYMENTDirector March 4, 2014Fred J. Dyment
/s/ GARY L. KOTT Director March 4, 2014Gary L. Kott
/s/ R. VANCE MILLIGAN Director March 4, 2014R. Vance Milligan
/s/ JOHN T. REYNOLDS Director March 4, 2014John T. Reynolds
/s/ NORMAN W. ROBERTSONDirector March 4, 2014
Norman W. Robertson
Table of Contents
F-1
INDEX TO FINANCIAL STATEMENTS OF TESCO CORPORATIONAND CONSOLIDATED SUBSIDIARIES
Page
Table of Contents
Report of Independent Registered Public Accounting Firm 2Consolidated Balance Sheets—December 31, 2013 and 2012 3Consolidated Statements of Income for each of the three years in the period ended December 31, 2013 4Consolidated Statements of Shareholders’ Equity for each of the three years in the period ended December 31, 2013
5Consolidated Statements of Cash Flows for each of the three years in the period ended December 31, 2013 6Notes to the Consolidated Financial Statements 7Supplementary Data 29Schedule II—Valuation and Qualifying Accounts 30

F-2
Report of Independent Registered Public Accounting Firm
To the Board of Directors and Shareholders of Tesco Corporation
In our opinion, the accompanying consolidated balance sheets and the related consolidated statements of income, shareholders’ equity and of cash flows present fairly, in all material respects, the financial position of Tesco Corporation and its subsidiaries at December 31, 2013 and 2012, and the results of their operations and their cash flows for each of the three years in the period ended December 31, 2013 in conformity with accounting principles generally accepted in the United States of America. Also in our opinion, the Company maintained, in all material respects, effective internal control over financial reporting as of December 31, 2013 based on criteria established in Internal Control - Integrated Framework 1992 issued by the Committee of Sponsoring Organizations of the Treadway Commission (COSO). The Company's management is responsible for these financial statements, for maintaining effective internal control over financial reporting and for its assessment of the effectiveness of internal control over financial reporting, included in Management's Report on Internal Control over Financial Reporting. Our responsibility is to express opinions on these financial statements and on the Company's internal control over financial reporting based on our integrated audits. We conducted our audits in accordance with the standards of the Public Company Accounting Oversight Board (United States). Those standards require that we plan and perform the audits to obtain reasonable assurance about whether the financial statements are free of material misstatement and whether effective internal control over financial reporting was maintained in all material respects. Our audits of the financial statements included examining, on a test basis, evidence supporting the amounts and disclosures in the financial statements, assessing the accounting principles used and significant estimates made by management, and evaluating the overall financial statement presentation. Our audit of internal control over financial reporting included obtaining an understanding of internal control over financial reporting, assessing the risk that a material weakness exists, and testing and evaluating the design and operating effectiveness of internal control based on the assessed risk. Our audits also included performing such other procedures as we considered necessary in the circumstances. We believe that our audits provide a reasonable basis for our opinions.
A company’s internal control over financial reporting is a process designed to provide reasonable assurance regarding the reliability of financial reporting and the preparation of financial statements for external purposes in accordance with generally accepted accounting principles. A company’s internal control over financial reporting includes those policies and procedures that (i) pertain to the maintenance of records that, in reasonable detail, accurately and fairly reflect the transactions and dispositions of the assets of the company; (ii) provide reasonable assurance that transactions are recorded as necessary to permit preparation of financial statements in accordance with generally accepted accounting principles, and that receipts and expenditures of the company are being made only in accordance with authorizations of management and directors of the company; and (iii) provide reasonable assurance regarding prevention or timely detection of unauthorized acquisition, use, or disposition of the company’s assets that could have a material effect on the financial statements.
Because of its inherent limitations, internal control over financial reporting may not prevent or detect misstatements. Also, projections of any evaluation of effectiveness to future periods are subject to the risk that controls may become inadequate because of changes in conditions, or that the degree of compliance with the policies or procedures may deteriorate.
/s/PricewaterhouseCoopers LLP Houston, TexasMarch 4, 2014
Table of Contents
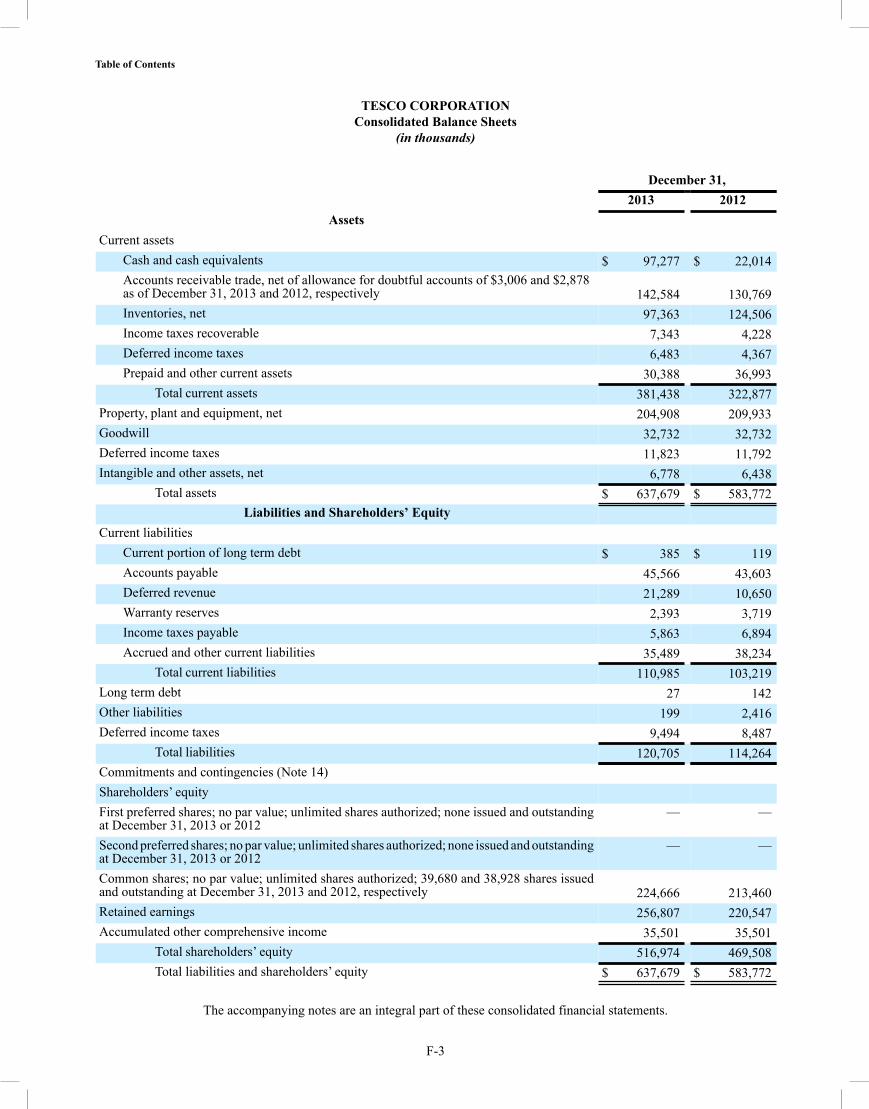
F-3
TESCO CORPORATIONConsolidated Balance Sheets
(in thousands)
December 31, 2013 2012
Assets Current assets
Cash and cash equivalents $ 97,277 $ 22,014Accounts receivable trade, net of allowance for doubtful accounts of $3,006 and $2,878as of December 31, 2013 and 2012, respectively 142,584 130,769Inventories, net 97,363 124,506Income taxes recoverable 7,343 4,228Deferred income taxes 6,483 4,367Prepaid and other current assets 30,388 36,993
Total current assets 381,438 322,877Property, plant and equipment, net 204,908 209,933Goodwill 32,732 32,732Deferred income taxes 11,823 11,792Intangible and other assets, net 6,778 6,438
Total assets $ 637,679 $ 583,772Liabilities and Shareholders’ Equity
Current liabilities Current portion of long term debt $ 385 $ 119Accounts payable 45,566 43,603Deferred revenue 21,289 10,650Warranty reserves 2,393 3,719Income taxes payable 5,863 6,894Accrued and other current liabilities 35,489 38,234
Total current liabilities 110,985 103,219Long term debt 27 142Other liabilities 199 2,416Deferred income taxes 9,494 8,487
Total liabilities 120,705 114,264Commitments and contingencies (Note 14)Shareholders’ equity First preferred shares; no par value; unlimited shares authorized; none issued and outstanding at December 31, 2013 or 2012
— —
Second preferred shares; no par value; unlimited shares authorized; none issued and outstanding at December 31, 2013 or 2012
— —
Common shares; no par value; unlimited shares authorized; 39,680 and 38,928 shares issued and outstanding at December 31, 2013 and 2012, respectively 224,666 213,460Retained earnings 256,807 220,547Accumulated other comprehensive income 35,501 35,501
Total shareholders’ equity 516,974 469,508Total liabilities and shareholders’ equity $ 637,679 $ 583,772
The accompanying notes are an integral part of these consolidated financial statements.
Table of Contents
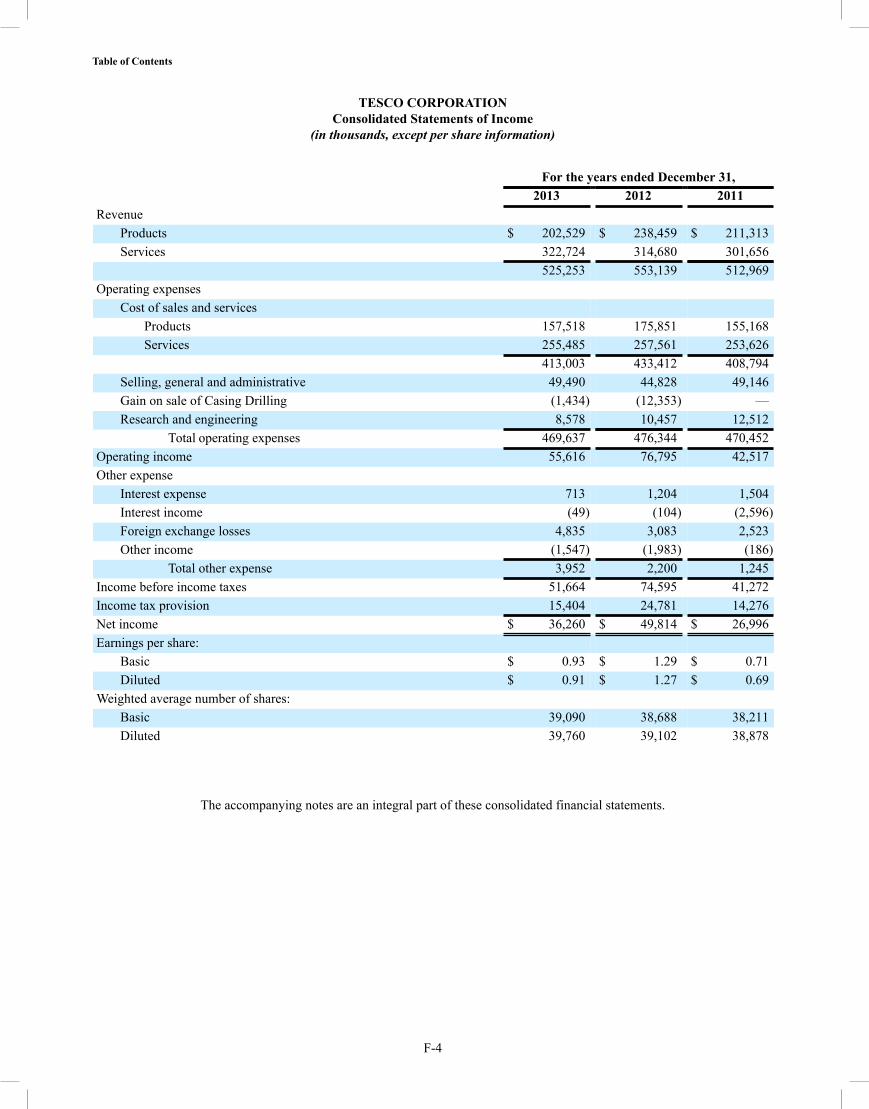
F-4
TESCO CORPORATIONConsolidated Statements of Income
(in thousands, except per share information)
For the years ended December 31, 2013 2012 2011Revenue
Products $ 202,529 $ 238,459 $ 211,313Services 322,724 314,680 301,656
525,253 553,139 512,969Operating expenses
Cost of sales and services Products 157,518 175,851 155,168Services 255,485 257,561 253,626
413,003 433,412 408,794Selling, general and administrative 49,490 44,828 49,146Gain on sale of Casing Drilling (1,434) (12,353) —Research and engineering 8,578 10,457 12,512
Total operating expenses 469,637 476,344 470,452Operating income 55,616 76,795 42,517Other expense
Interest expense 713 1,204 1,504Interest income (49) (104) (2,596)Foreign exchange losses 4,835 3,083 2,523Other income (1,547) (1,983) (186)
Total other expense 3,952 2,200 1,245Income before income taxes 51,664 74,595 41,272Income tax provision 15,404 24,781 14,276Net income $ 36,260 $ 49,814 $ 26,996Earnings per share:
Basic $ 0.93 $ 1.29 $ 0.71Diluted $ 0.91 $ 1.27 $ 0.69
Weighted average number of shares: Basic 39,090 38,688 38,211Diluted 39,760 39,102 38,878
The accompanying notes are an integral part of these consolidated financial statements.
Table of Contents

F-5
TESCO CORPORATIONConsolidated Statements of Shareholders’ Equity
(in thousands)
Commonstockshares
Commonshares
Retainedearnings
Accumulated othercomprehensive
income TotalBalances at December 31, 2010 38,058 $ 196,431 $ 143,737 $ 35,501 $ 375,669
Net income — — 26,996 — 26,996Issuance and exercises under stock plans 511 10,142 — — 10,142
Balances at December 31, 2011 38,569 206,573 170,733 35,501 412,807Net income — — 49,814 — 49,814Issuance and exercises under stock plans 359 6,887 — — 6,887
Balances at December 31, 2012 38,928 213,460 220,547 35,501 469,508Net income — — 36,260 — 36,260Issuance and exercises under stock plans 752 11,206 — — 11,206
Balances at December 31, 2013 39,680 $ 224,666 $ 256,807 $ 35,501 $ 516,974
The accompanying notes are an integral part of these consolidated financial statements.
Table of Contents
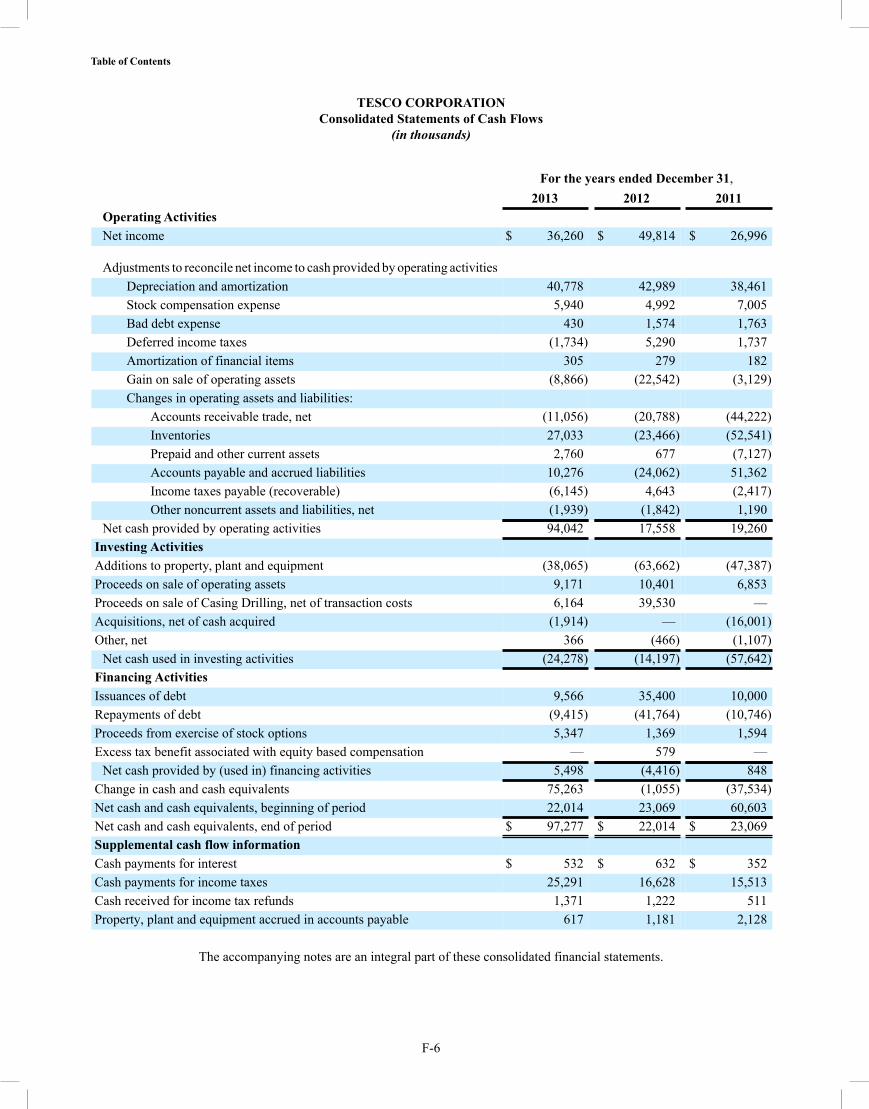
F-6
TESCO CORPORATIONConsolidated Statements of Cash Flows
(in thousands)
For the years ended December 31, 2013 2012 2011
Operating Activities Net income $ 36,260 $ 49,814 $ 26,996
Adjustments to reconcile net income to cash provided by operating activities Depreciation and amortization 40,778 42,989 38,461Stock compensation expense 5,940 4,992 7,005Bad debt expense 430 1,574 1,763Deferred income taxes (1,734) 5,290 1,737Amortization of financial items 305 279 182Gain on sale of operating assets (8,866) (22,542) (3,129)Changes in operating assets and liabilities:
Accounts receivable trade, net (11,056) (20,788) (44,222)Inventories 27,033 (23,466) (52,541)Prepaid and other current assets 2,760 677 (7,127)Accounts payable and accrued liabilities 10,276 (24,062) 51,362Income taxes payable (recoverable) (6,145) 4,643 (2,417)Other noncurrent assets and liabilities, net (1,939) (1,842) 1,190
Net cash provided by operating activities 94,042 17,558 19,260Investing Activities Additions to property, plant and equipment (38,065) (63,662) (47,387)Proceeds on sale of operating assets 9,171 10,401 6,853Proceeds on sale of Casing Drilling, net of transaction costs 6,164 39,530 —Acquisitions, net of cash acquired (1,914) — (16,001)Other, net 366 (466) (1,107)
Net cash used in investing activities (24,278) (14,197) (57,642)Financing Activities Issuances of debt 9,566 35,400 10,000Repayments of debt (9,415) (41,764) (10,746)Proceeds from exercise of stock options 5,347 1,369 1,594Excess tax benefit associated with equity based compensation — 579 —
Net cash provided by (used in) financing activities 5,498 (4,416) 848Change in cash and cash equivalents 75,263 (1,055) (37,534)Net cash and cash equivalents, beginning of period 22,014 23,069 60,603Net cash and cash equivalents, end of period $ 97,277 $ 22,014 $ 23,069Supplemental cash flow information Cash payments for interest $ 532 $ 632 $ 352Cash payments for income taxes 25,291 16,628 15,513Cash received for income tax refunds 1,371 1,222 511Property, plant and equipment accrued in accounts payable 617 1,181 2,128
The accompanying notes are an integral part of these consolidated financial statements.
Table of Contents

F-7
TESCO CORPORATIONNotes to the Consolidated Financial Statements
Note 1— Nature of Operations and Basis of Presentation
Nature of operations
We are a global leader in the design, manufacture, and service delivery of technology-based solutions for the upstream energy industry. We seek to change the way wells are drilled by delivering safer and more efficient solutions that add real value by reducing the costs of drilling for and producing oil and natural gas. Our product and service offerings consist mainly of equipment sales and services to drilling contractors and oil and natural gas operating companies throughout the world.
Basis of presentation
These consolidated financial statements have been prepared by management in accordance with accounting principles generally accepted in the United States (“U.S. GAAP”) and include the accounts of all consolidated subsidiaries after the elimination of all significant intercompany accounts and transactions.
Unless indicated otherwise, all amounts in these consolidated financial statements are denominated in United States (“U.S.”) dollars. All references to US$ or $ are to U.S. dollars and references to C$ are to Canadian dollars.
Reclassifications
Our audited consolidated balance sheet as of December 31, 2012 includes reclassifications that are made to conform to the current year presentation. These reclassifications did not impact our reported net income or stockholders' equity.
Subsequent Events
We conducted our subsequent events review through the date these consolidated financial statements were filed with the U.S. Securities and Exchange Commission ("SEC").
Note 2— Summary of Significant Accounting Policies
Use of estimates
The preparation of financial statements in conformity with U.S. GAAP requires management to make estimates and assumptions that affect the reported amounts of assets and liabilities and disclosures of contingent assets and liabilities at the date of the financial statements, and the reported amounts of revenue and expenses during the reporting period. On an ongoing basis, we evaluate our estimates, including those related to reserves for excess and obsolete inventory, uncollectible accounts receivable, valuation of goodwill, intangible assets and long-lived assets, determination of income taxes, contingent liabilities, stock-based compensation and warranty provisions. We base our estimates on historical experience and various other assumptions that we believe are reasonable under the circumstances, the results of which form the basis for making judgments about the carrying value of our assets and liabilities not readily apparent from other sources. Actual results could differ from those estimates.
Cash and cash equivalents
Cash equivalents are highly liquid, short-term investments with original maturities of less than three months, which are readily convertible to known amounts of cash. At both December 31, 2013 and 2012, cash and cash equivalents consisted entirely of bank balances.
Allowance for doubtful accounts
We establish an allowance for doubtful accounts receivable based on customer bankruptcies or delinquencies and on the number of days outstanding. Uncollectible accounts receivable are written off when a settlement is reached for an amount less than the outstanding historical balance or when we determine the balance will not be collected.
Table of Contents
F-8
Inventories and inventory reserves
Inventories consist primarily of top drives and tubular services parts, spare parts, work in process and raw materials to support ongoing manufacturing operations and the installed base of specialized equipment used throughout the world. We have several valuation methods for our various types of inventories and consistently use the following methods for each type of inventory:
• We value our work in process manufactured equipment using standard costs, which approximate actual costs for raw materials, direct labor and manufacturing overhead allocations;
• We value our finished manufactured equipment at the lower of cost or market using specific identification; and
• We value our spare parts at the lower of cost or market using the average cost method.
Research and engineering expenses and selling, general and administrative expenses are reported as period costs and excluded from inventory cost. We establish reserves for obsolete inventory and for inventory in excess of demand based on our usage of inventory on-hand, technical obsolescence and market conditions, as well as our expectations of future demand based on our manufacturing sales backlog, our installed base and our development of new products.
Property, plant, and equipment
Property, plant, and equipment are carried at cost. Maintenance and repairs are expensed as incurred. The costs of replacements, betterments, and renewals are capitalized. When properties and equipment, other than top drive units in our rental fleet, are sold, retired, or otherwise disposed of, the related cost and accumulated depreciation are removed from the books and the resulting gain or loss is recognized on our consolidated statement of income. When top drive units in our rental fleet are sold, the sales proceeds are included in revenue and the net book value of the equipment sold is included in cost of sales and services on our consolidated statement of income.
Property, plant, and equipment used in operations are assessed for impairment whenever changes in facts and circumstances indicate a possible significant deterioration in the future cash flows expected to be generated by an asset group. Individual assets are grouped for impairment purposes at the lowest level for which there are identifiable cash flows that are largely independent of the cash flows of other groups of assets. If, upon review, the sum of the undiscounted pretax cash flows is less than the carrying value of the asset group, the carrying value is written down to estimated fair value and reported as an impairment charge in the period in which the determination of the impairment is made. Because there usually is a lack of quoted market prices for long-lived assets, the fair value of impaired assets is typically determined based on the present values of expected future cash flows using discount rates believed to be consistent with those used by principal market participants. Long-lived assets committed by management for disposal within one year are accounted for at the lower of amortized cost or fair value, less cost to sell, with fair value determined using a binding negotiated price, if available, or the present value of expected future cash flows as previously described.
Table of Contents

F-9
Depreciation and amortization of property, plant, and equipment, including intangible assets and capital leases, is computed on the following basis:
Asset Category Description Method Life Land, buildings, and leaseholds Buildings
Leasehold improvements Straight-line
Straight-line 20 years
Lease term
Drilling equipment Top drive rental unitsTubular services equipmentSupport equipment
UsageStraight-lineStraight-line
2,600 days5 – 7 years5 – 7 years
Manufacturing equipment Straight-line 5 – 7 years
Office equipment and other Computer hardware and softwareIT development costsFurniture and equipmentVehicles
Straight-lineStraight-lineStraight-lineStraight-line
2 – 5 years5 years5 years3 – 4 years
Goodwill and other intangible assets
Goodwill, resulting from business combinations, is initially recorded at acquisition-date fair value. Goodwill is not amortized but is subject to an annual impairment test, which we perform in the fourth quarter of each year, or upon the occurrence of a triggering event. An impairment loss is recognized when the fair value of our goodwill is less than the carrying amount of that goodwill. We perform our goodwill impairment tests at the reporting unit level using the discounted cash flow method. All of our goodwill is assigned to our Tubular Services segment. During the years ended December 31, 2013, 2012, and 2011, management concluded that goodwill was not impaired.
Intangible assets that have indefinite useful lives are not amortized but are subject to an annual impairment test or the occurrence of a triggering event. Indefinite lived intangibles are considered impaired if the fair values of the intangible assets are lower than their net book values. The fair value of intangible assets is determined based on quoted market prices in active markets, if available, or the discounted cash flow method or estimated replacement cost, if quoted market prices are not available. We had no indefinite lived intangibles, other than goodwill, as of December 31, 2013 and 2012.
Intangible assets that have finite useful lives are capitalized at their acquisition-date fair value and amortized on a straight-
line basis over their estimated useful lives. Our intangible assets that have finite useful lives consist primarily of customer relationships, patents and non-compete agreements. We review our intangible assets for impairment when circumstances indicate their carrying values may not be recoverable as measured by the amount their carrying values are exceeded by their fair values.
Income taxes
Deferred income taxes are determined using the liability method and are provided on all temporary differences between the financial reporting basis and the tax basis of our assets and liabilities, except for deferred taxes on income considered to be permanently reinvested in certain foreign subsidiaries. Deferred income taxes are measured using enacted tax rates and laws expected to apply to taxable income in the years in which the temporary differences are expected to reverse. The effect of a change in tax rates applied to deferred income taxes is recognized in the period that the change is enacted. A valuation allowance is established to reduce deferred tax assets when it is more likely than not some or all of the benefit from the deferred tax asset will not be realized. Accrued interest and penalties related to unrecognized tax benefits are reflected in interest expense and other expense, respectively, on our consolidated statements of income.
Contingent liabilities
We recognize liabilities for loss contingencies, including legal costs expected to be incurred in connection with such loss contingencies, when we believe a loss is probable and the amount of the probable loss can be reasonably estimated. Such estimates may be based on advice from third parties or on management’s judgment, as appropriate. Revisions to our contingent liabilities are reflected in income in the period in which facts become known or circumstances change that affect our previous judgments with respect to the likelihood or amount of the probable loss.
Table of Contents

F-10
Warranties
We provide product warranties on equipment sold pursuant to manufacturing contracts and recognize the anticipated cost of these warranties in cost of sales and services when sales revenue is recognized. We estimate our warranty liability based upon historical warranty claim experience and specific warranty claims. We periodically review our warranty provision and make adjustments to the provision as claim data and historical experience change.
Per share information
Basic earnings (loss) per share of common stock is calculated using the weighted average number of our shares outstanding during the year.
Diluted earnings (loss) per share of common stock is calculated using the treasury stock method, under which we assume proceeds obtained upon exercise of “in the money” share-based payments, granted under our compensation plan, would be used to purchase our common shares at the average market price during the period. Diluted earnings (loss) per share includes the shares used in the basic net income calculation, plus our unvested restricted shares and outstanding stock options, to the extent that these instruments dilute earnings (loss) per share. No adjustment to basic earnings (loss) per share is made if the result of the diluted earnings (loss) per share calculation is anti-dilutive.
Revenue recognition
We recognize revenue when the earnings process is complete, persuasive evidence of an arrangement exists, price is fixed or determinable, and collectability is reasonably assured. For product sales, revenue is recognized upon delivery when title and risk of loss of the equipment is transferred to the customer, with no right of return. For revenue other than product sales, we recognize revenue as the services are rendered based upon agreed daily, hourly or job rates.
Top Drive sales - We determine the transfer of title and risk of loss in accordance with contracts with our customers and the related International Commercial Terms. Revenue in the Top Drive segment may be generated from contractual arrangements that include multiple deliverables. Revenue from these arrangements is recognized as each item or service is delivered based on their relative fair value and when the delivered items or services have stand-alone value to the customer. We generally require customers to pay a non-refundable deposit with their purchase orders. Customer advances or deposits are deferred and recognized as revenue when we have completed all of our performance obligations related to the sale.
Top Drive rentals, Tubular Services, and Casing Drilling - Revenue generated from specific time, materials and equipment contracts is based upon agreed daily, hourly or job rates and price, and recognized as amounts are earned in accordance with the contract terms. Under these contracts, we may receive revenue and incur incremental costs directly related to the mobilization of equipment and personnel to the contracted site. Revenue earned and costs incurred directly related to mobilization are deferred and recognized over the estimated contract service period on a straight-line basis, which is consistent with the general pace of activity, level of services being provided and day rates being earned over the service period of the contract. Mobilization costs to relocate equipment when a contract does not exist are expensed as incurred. Demobilization fees received are recognized, along with any related expenses, upon completion of contracts. Revenue generated from materials and equipment sales is recognized upon delivery in accordance with the contract terms.
Shipping and handling costs billed to customers are recognized in net revenue. Shipping and handling costs are included in cost of sales and services.
Operating leases
We have entered into non-cancelable operating lease agreements primarily involving office space. Certain of these leases contain escalating lease payments and we recognize expense on a straight-line basis, which is more representative of the time pattern in which the leased property is physically employed. In certain instances, we are also entitled to reimbursements for part or all of leasehold improvements made and record a deferred credit for such reimbursements, which is amortized over the remaining life of the lease term as a reduction in lease expense.
Research and engineering expenses
We expense research and engineering costs when incurred. Payments received from third parties, including payments for the use of equipment prototypes, during the research or development process are recognized as a reduction in research and engineering
Table of Contents
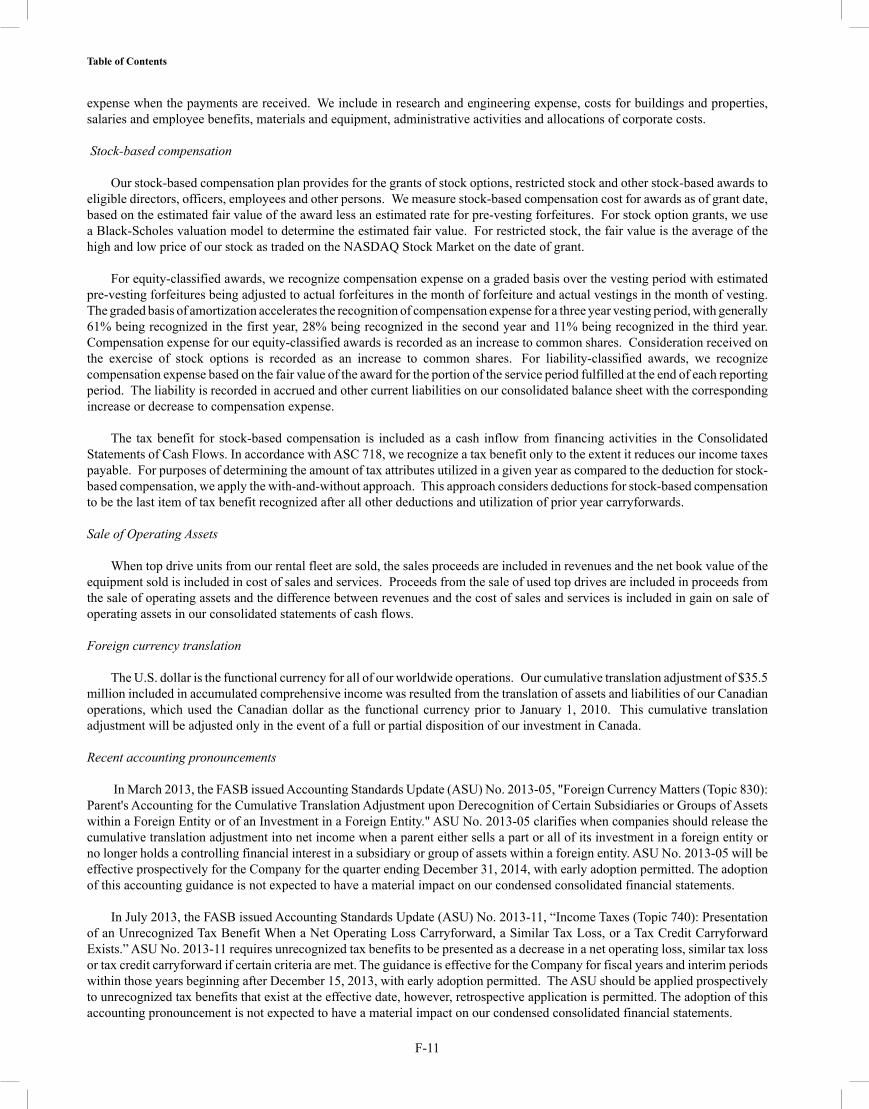
F-11
expense when the payments are received. We include in research and engineering expense, costs for buildings and properties, salaries and employee benefits, materials and equipment, administrative activities and allocations of corporate costs.
Stock-based compensation
Our stock-based compensation plan provides for the grants of stock options, restricted stock and other stock-based awards to eligible directors, officers, employees and other persons. We measure stock-based compensation cost for awards as of grant date, based on the estimated fair value of the award less an estimated rate for pre-vesting forfeitures. For stock option grants, we use a Black-Scholes valuation model to determine the estimated fair value. For restricted stock, the fair value is the average of the high and low price of our stock as traded on the NASDAQ Stock Market on the date of grant.
For equity-classified awards, we recognize compensation expense on a graded basis over the vesting period with estimated pre-vesting forfeitures being adjusted to actual forfeitures in the month of forfeiture and actual vestings in the month of vesting. The graded basis of amortization accelerates the recognition of compensation expense for a three year vesting period, with generally 61% being recognized in the first year, 28% being recognized in the second year and 11% being recognized in the third year. Compensation expense for our equity-classified awards is recorded as an increase to common shares. Consideration received on the exercise of stock options is recorded as an increase to common shares. For liability-classified awards, we recognize compensation expense based on the fair value of the award for the portion of the service period fulfilled at the end of each reporting period. The liability is recorded in accrued and other current liabilities on our consolidated balance sheet with the corresponding increase or decrease to compensation expense.
The tax benefit for stock-based compensation is included as a cash inflow from financing activities in the Consolidated Statements of Cash Flows. In accordance with ASC 718, we recognize a tax benefit only to the extent it reduces our income taxes payable. For purposes of determining the amount of tax attributes utilized in a given year as compared to the deduction for stock-based compensation, we apply the with-and-without approach. This approach considers deductions for stock-based compensation to be the last item of tax benefit recognized after all other deductions and utilization of prior year carryforwards.
Sale of Operating Assets
When top drive units from our rental fleet are sold, the sales proceeds are included in revenues and the net book value of the equipment sold is included in cost of sales and services. Proceeds from the sale of used top drives are included in proceeds from the sale of operating assets and the difference between revenues and the cost of sales and services is included in gain on sale of operating assets in our consolidated statements of cash flows.
Foreign currency translation
The U.S. dollar is the functional currency for all of our worldwide operations. Our cumulative translation adjustment of $35.5 million included in accumulated comprehensive income was resulted from the translation of assets and liabilities of our Canadian operations, which used the Canadian dollar as the functional currency prior to January 1, 2010. This cumulative translation adjustment will be adjusted only in the event of a full or partial disposition of our investment in Canada.
Recent accounting pronouncements
In March 2013, the FASB issued Accounting Standards Update (ASU) No. 2013-05, "Foreign Currency Matters (Topic 830): Parent's Accounting for the Cumulative Translation Adjustment upon Derecognition of Certain Subsidiaries or Groups of Assets within a Foreign Entity or of an Investment in a Foreign Entity." ASU No. 2013-05 clarifies when companies should release the cumulative translation adjustment into net income when a parent either sells a part or all of its investment in a foreign entity or no longer holds a controlling financial interest in a subsidiary or group of assets within a foreign entity. ASU No. 2013-05 will be effective prospectively for the Company for the quarter ending December 31, 2014, with early adoption permitted. The adoption of this accounting guidance is not expected to have a material impact on our condensed consolidated financial statements.
In July 2013, the FASB issued Accounting Standards Update (ASU) No. 2013-11, “Income Taxes (Topic 740): Presentation of an Unrecognized Tax Benefit When a Net Operating Loss Carryforward, a Similar Tax Loss, or a Tax Credit Carryforward Exists.” ASU No. 2013-11 requires unrecognized tax benefits to be presented as a decrease in a net operating loss, similar tax loss or tax credit carryforward if certain criteria are met. The guidance is effective for the Company for fiscal years and interim periods within those years beginning after December 15, 2013, with early adoption permitted. The ASU should be applied prospectively to unrecognized tax benefits that exist at the effective date, however, retrospective application is permitted. The adoption of this accounting pronouncement is not expected to have a material impact on our condensed consolidated financial statements.
Table of Contents
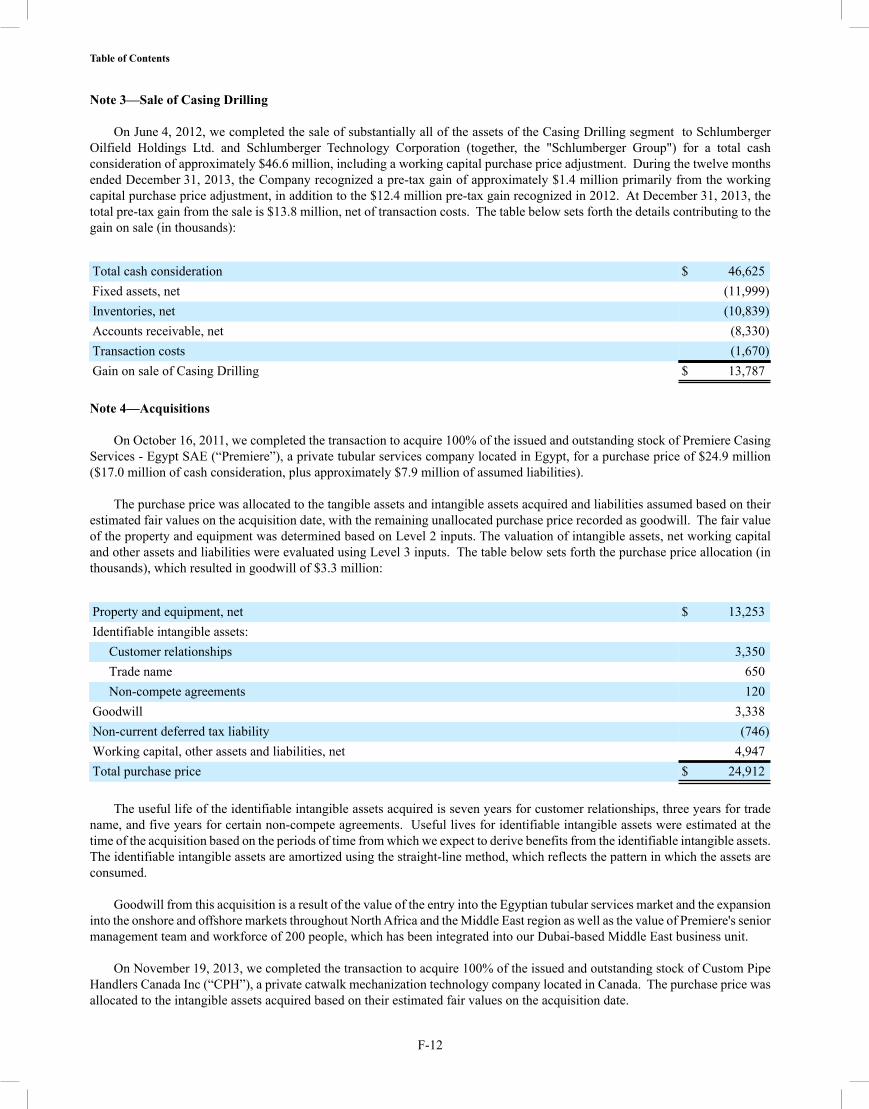
F-12
Note 3—Sale of Casing Drilling
On June 4, 2012, we completed the sale of substantially all of the assets of the Casing Drilling segment to Schlumberger Oilfield Holdings Ltd. and Schlumberger Technology Corporation (together, the "Schlumberger Group") for a total cash consideration of approximately $46.6 million, including a working capital purchase price adjustment. During the twelve months ended December 31, 2013, the Company recognized a pre-tax gain of approximately $1.4 million primarily from the working capital purchase price adjustment, in addition to the $12.4 million pre-tax gain recognized in 2012. At December 31, 2013, the total pre-tax gain from the sale is $13.8 million, net of transaction costs. The table below sets forth the details contributing to the gain on sale (in thousands):
Total cash consideration $ 46,625Fixed assets, net (11,999)Inventories, net (10,839)Accounts receivable, net (8,330)Transaction costs (1,670)Gain on sale of Casing Drilling $ 13,787
Note 4––Acquisitions
On October 16, 2011, we completed the transaction to acquire 100% of the issued and outstanding stock of Premiere Casing Services - Egypt SAE (“Premiere”), a private tubular services company located in Egypt, for a purchase price of $24.9 million ($17.0 million of cash consideration, plus approximately $7.9 million of assumed liabilities).
The purchase price was allocated to the tangible assets and intangible assets acquired and liabilities assumed based on their estimated fair values on the acquisition date, with the remaining unallocated purchase price recorded as goodwill. The fair value of the property and equipment was determined based on Level 2 inputs. The valuation of intangible assets, net working capital and other assets and liabilities were evaluated using Level 3 inputs. The table below sets forth the purchase price allocation (in thousands), which resulted in goodwill of $3.3 million:
Property and equipment, net $ 13,253Identifiable intangible assets: Customer relationships 3,350 Trade name 650 Non-compete agreements 120Goodwill 3,338Non-current deferred tax liability (746)Working capital, other assets and liabilities, net 4,947Total purchase price $ 24,912
The useful life of the identifiable intangible assets acquired is seven years for customer relationships, three years for trade name, and five years for certain non-compete agreements. Useful lives for identifiable intangible assets were estimated at the time of the acquisition based on the periods of time from which we expect to derive benefits from the identifiable intangible assets. The identifiable intangible assets are amortized using the straight-line method, which reflects the pattern in which the assets are consumed.
Goodwill from this acquisition is a result of the value of the entry into the Egyptian tubular services market and the expansion into the onshore and offshore markets throughout North Africa and the Middle East region as well as the value of Premiere's senior management team and workforce of 200 people, which has been integrated into our Dubai-based Middle East business unit.
On November 19, 2013, we completed the transaction to acquire 100% of the issued and outstanding stock of Custom Pipe Handlers Canada Inc (“CPH”), a private catwalk mechanization technology company located in Canada. The purchase price was allocated to the intangible assets acquired based on their estimated fair values on the acquisition date.
Table of Contents
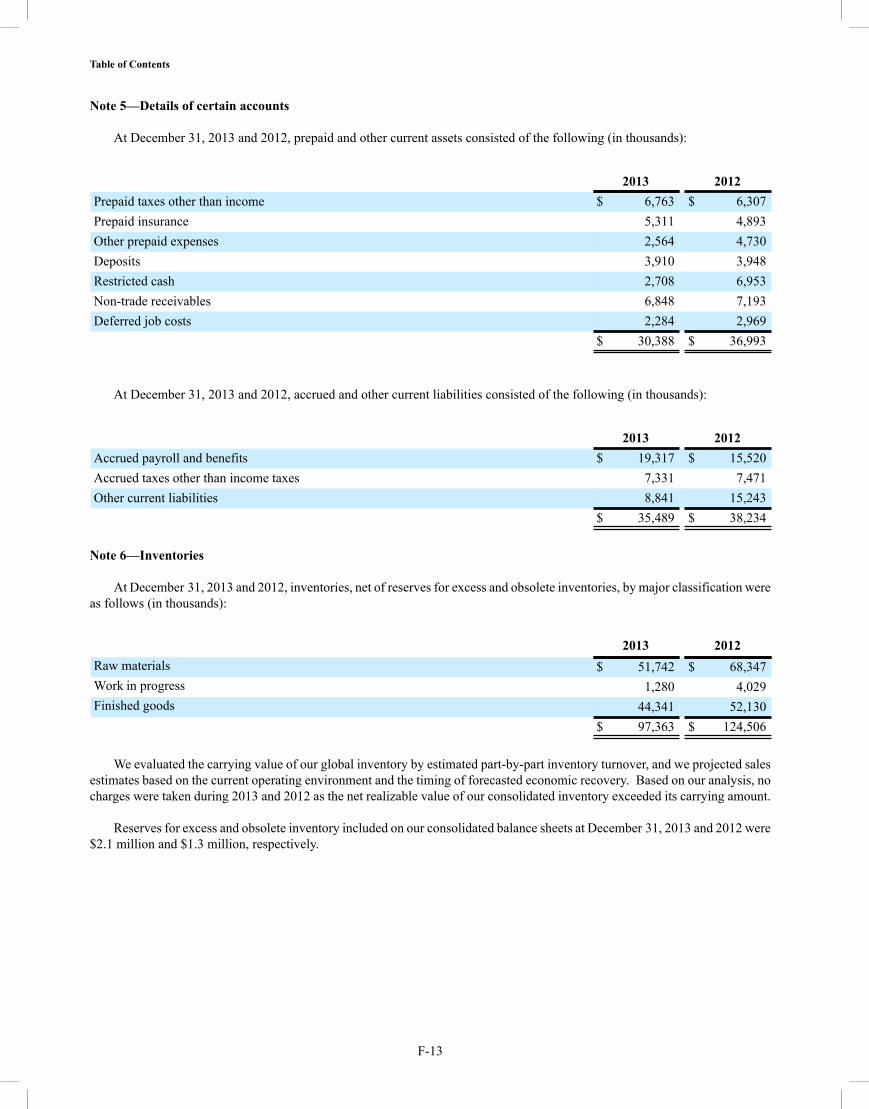
F-13
Note 5––Details of certain accounts
At December 31, 2013 and 2012, prepaid and other current assets consisted of the following (in thousands):
2013 2012Prepaid taxes other than income $ 6,763 $ 6,307Prepaid insurance 5,311 4,893Other prepaid expenses 2,564 4,730Deposits 3,910 3,948Restricted cash 2,708 6,953Non-trade receivables 6,848 7,193Deferred job costs 2,284 2,969 $ 30,388 $ 36,993
At December 31, 2013 and 2012, accrued and other current liabilities consisted of the following (in thousands):
2013 2012Accrued payroll and benefits $ 19,317 $ 15,520Accrued taxes other than income taxes 7,331 7,471Other current liabilities 8,841 15,243 $ 35,489 $ 38,234
Note 6—Inventories
At December 31, 2013 and 2012, inventories, net of reserves for excess and obsolete inventories, by major classification were as follows (in thousands):
2013 2012Raw materials $ 51,742 $ 68,347Work in progress 1,280 4,029Finished goods 44,341 52,130 $ 97,363 $ 124,506
We evaluated the carrying value of our global inventory by estimated part-by-part inventory turnover, and we projected sales
estimates based on the current operating environment and the timing of forecasted economic recovery. Based on our analysis, no charges were taken during 2013 and 2012 as the net realizable value of our consolidated inventory exceeded its carrying amount.
Reserves for excess and obsolete inventory included on our consolidated balance sheets at December 31, 2013 and 2012 were $2.1 million and $1.3 million, respectively.
Table of Contents
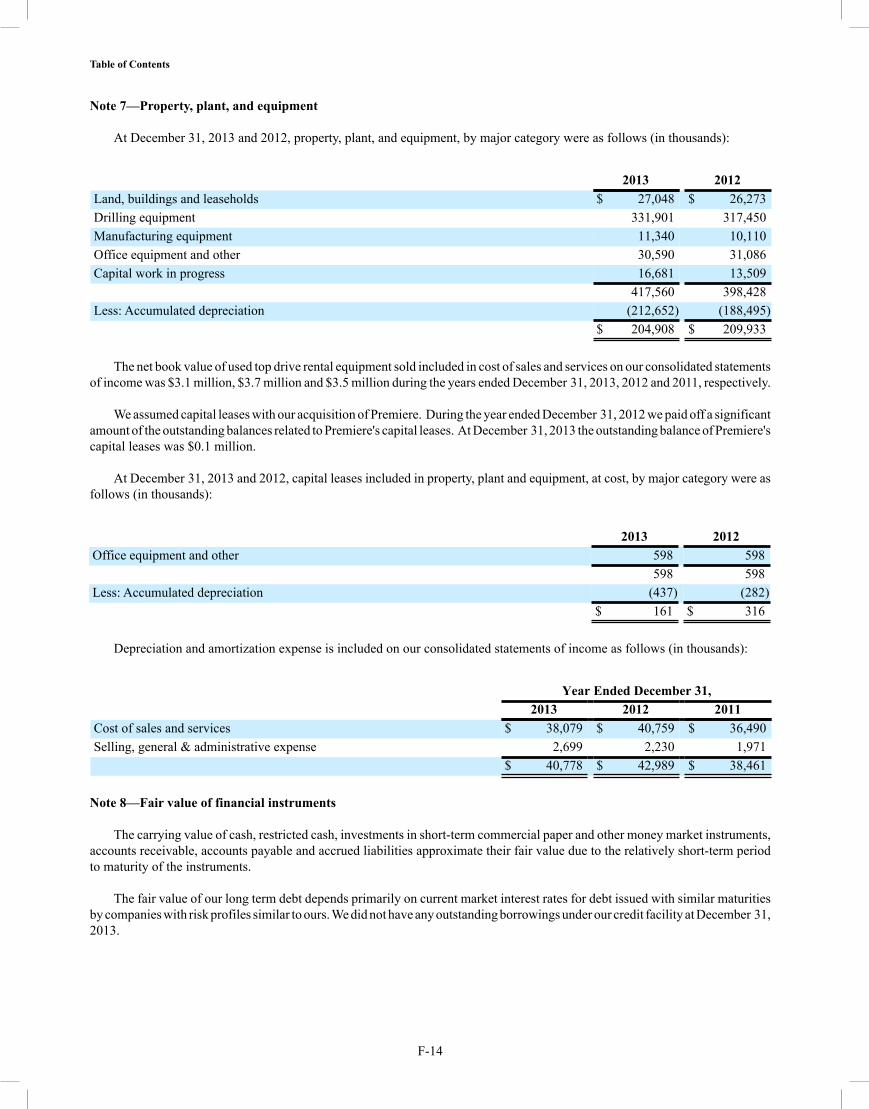
F-14
Note 7—Property, plant, and equipment
At December 31, 2013 and 2012, property, plant, and equipment, by major category were as follows (in thousands):
2013 2012Land, buildings and leaseholds $ 27,048 $ 26,273Drilling equipment 331,901 317,450Manufacturing equipment 11,340 10,110Office equipment and other 30,590 31,086Capital work in progress 16,681 13,509 417,560 398,428Less: Accumulated depreciation (212,652) (188,495) $ 204,908 $ 209,933
The net book value of used top drive rental equipment sold included in cost of sales and services on our consolidated statements of income was $3.1 million, $3.7 million and $3.5 million during the years ended December 31, 2013, 2012 and 2011, respectively.
We assumed capital leases with our acquisition of Premiere. During the year ended December 31, 2012 we paid off a significant amount of the outstanding balances related to Premiere's capital leases. At December 31, 2013 the outstanding balance of Premiere's capital leases was $0.1 million.
At December 31, 2013 and 2012, capital leases included in property, plant and equipment, at cost, by major category were as
follows (in thousands):
2013 2012Office equipment and other 598 598 598 598Less: Accumulated depreciation (437) (282) $ 161 $ 316
Depreciation and amortization expense is included on our consolidated statements of income as follows (in thousands):
Year Ended December 31, 2013 2012 2011Cost of sales and services $ 38,079 $ 40,759 $ 36,490Selling, general & administrative expense 2,699 2,230 1,971 $ 40,778 $ 42,989 $ 38,461
Note 8—Fair value of financial instruments
The carrying value of cash, restricted cash, investments in short-term commercial paper and other money market instruments, accounts receivable, accounts payable and accrued liabilities approximate their fair value due to the relatively short-term period to maturity of the instruments.
The fair value of our long term debt depends primarily on current market interest rates for debt issued with similar maturities by companies with risk profiles similar to ours. We did not have any outstanding borrowings under our credit facility at December 31, 2013.
Table of Contents
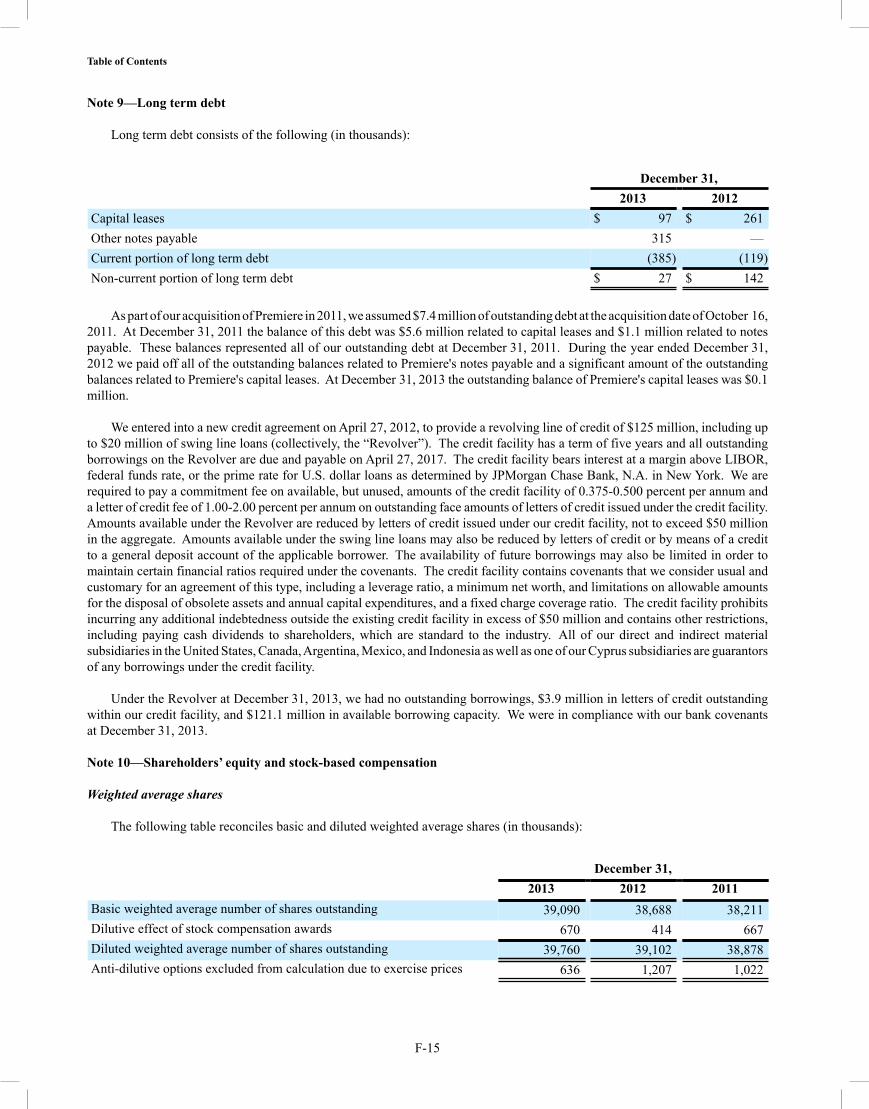
F-15
Note 9—Long term debt
Long term debt consists of the following (in thousands):
December 31, 2013 2012Capital leases $ 97 $ 261Other notes payable 315 —Current portion of long term debt (385) (119)Non-current portion of long term debt $ 27 $ 142
As part of our acquisition of Premiere in 2011, we assumed $7.4 million of outstanding debt at the acquisition date of October 16,
2011. At December 31, 2011 the balance of this debt was $5.6 million related to capital leases and $1.1 million related to notes payable. These balances represented all of our outstanding debt at December 31, 2011. During the year ended December 31, 2012 we paid off all of the outstanding balances related to Premiere's notes payable and a significant amount of the outstanding balances related to Premiere's capital leases. At December 31, 2013 the outstanding balance of Premiere's capital leases was $0.1 million.
We entered into a new credit agreement on April 27, 2012, to provide a revolving line of credit of $125 million, including up to $20 million of swing line loans (collectively, the “Revolver”). The credit facility has a term of five years and all outstanding borrowings on the Revolver are due and payable on April 27, 2017. The credit facility bears interest at a margin above LIBOR, federal funds rate, or the prime rate for U.S. dollar loans as determined by JPMorgan Chase Bank, N.A. in New York. We are required to pay a commitment fee on available, but unused, amounts of the credit facility of 0.375-0.500 percent per annum and a letter of credit fee of 1.00-2.00 percent per annum on outstanding face amounts of letters of credit issued under the credit facility. Amounts available under the Revolver are reduced by letters of credit issued under our credit facility, not to exceed $50 million in the aggregate. Amounts available under the swing line loans may also be reduced by letters of credit or by means of a credit to a general deposit account of the applicable borrower. The availability of future borrowings may also be limited in order to maintain certain financial ratios required under the covenants. The credit facility contains covenants that we consider usual and customary for an agreement of this type, including a leverage ratio, a minimum net worth, and limitations on allowable amounts for the disposal of obsolete assets and annual capital expenditures, and a fixed charge coverage ratio. The credit facility prohibits incurring any additional indebtedness outside the existing credit facility in excess of $50 million and contains other restrictions, including paying cash dividends to shareholders, which are standard to the industry. All of our direct and indirect material subsidiaries in the United States, Canada, Argentina, Mexico, and Indonesia as well as one of our Cyprus subsidiaries are guarantors of any borrowings under the credit facility.
Under the Revolver at December 31, 2013, we had no outstanding borrowings, $3.9 million in letters of credit outstanding within our credit facility, and $121.1 million in available borrowing capacity. We were in compliance with our bank covenants at December 31, 2013.
Note 10—Shareholders’ equity and stock-based compensation
Weighted average shares
The following table reconciles basic and diluted weighted average shares (in thousands):
December 31, 2013 2012 2011Basic weighted average number of shares outstanding 39,090 38,688 38,211Dilutive effect of stock compensation awards 670 414 667Diluted weighted average number of shares outstanding 39,760 39,102 38,878Anti-dilutive options excluded from calculation due to exercise prices 636 1,207 1,022
Table of Contents
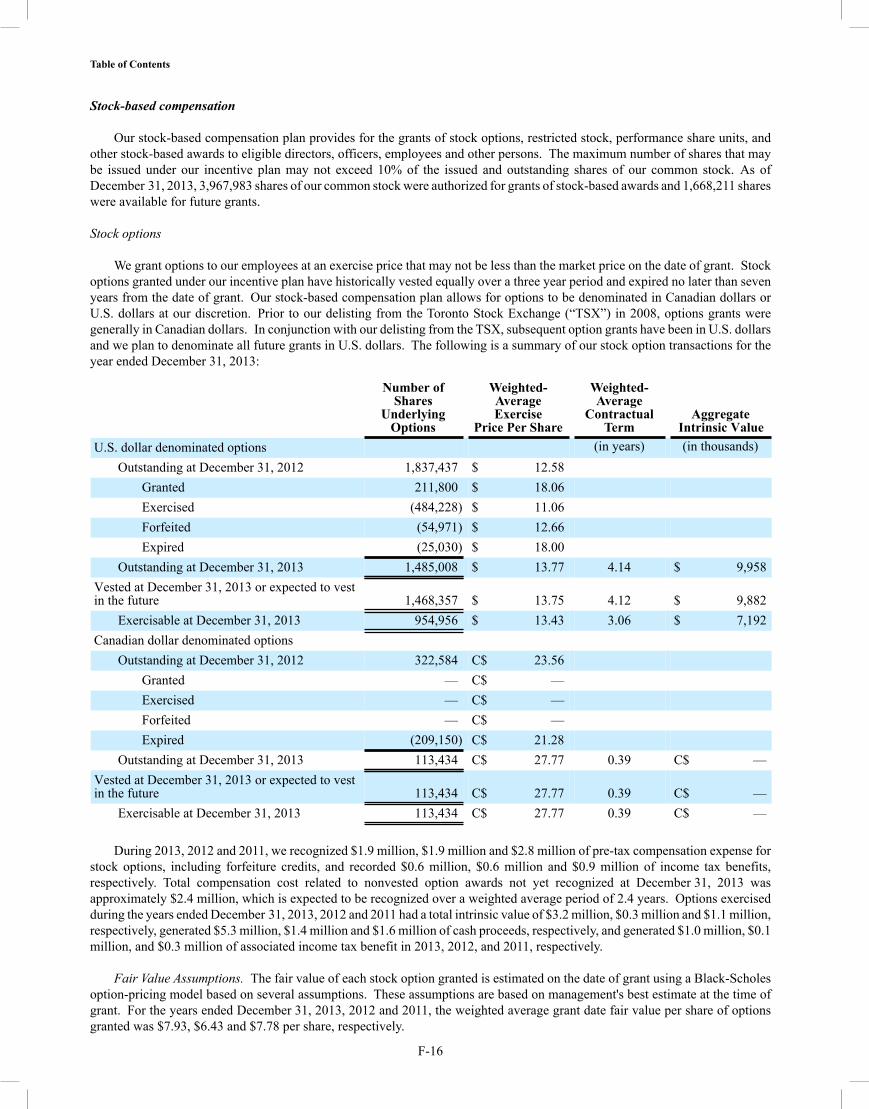
F-16
Stock-based compensation
Our stock-based compensation plan provides for the grants of stock options, restricted stock, performance share units, and other stock-based awards to eligible directors, officers, employees and other persons. The maximum number of shares that may be issued under our incentive plan may not exceed 10% of the issued and outstanding shares of our common stock. As of December 31, 2013, 3,967,983 shares of our common stock were authorized for grants of stock-based awards and 1,668,211 shares were available for future grants.
Stock options
We grant options to our employees at an exercise price that may not be less than the market price on the date of grant. Stock options granted under our incentive plan have historically vested equally over a three year period and expired no later than seven years from the date of grant. Our stock-based compensation plan allows for options to be denominated in Canadian dollars or U.S. dollars at our discretion. Prior to our delisting from the Toronto Stock Exchange (“TSX”) in 2008, options grants were generally in Canadian dollars. In conjunction with our delisting from the TSX, subsequent option grants have been in U.S. dollars and we plan to denominate all future grants in U.S. dollars. The following is a summary of our stock option transactions for the year ended December 31, 2013:
Number ofShares
UnderlyingOptions
Weighted-AverageExercise
Price Per Share
Weighted-Average
Contractual Term
AggregateIntrinsic Value
U.S. dollar denominated options (in years) (in thousands)Outstanding at December 31, 2012 1,837,437 $ 12.58
Granted 211,800 $ 18.06 Exercised (484,228) $ 11.06 Forfeited (54,971) $ 12.66 Expired (25,030) $ 18.00
Outstanding at December 31, 2013 1,485,008 $ 13.77 4.14 $ 9,958Vested at December 31, 2013 or expected to vestin the future 1,468,357 $ 13.75 4.12 $ 9,882
Exercisable at December 31, 2013 954,956 $ 13.43 3.06 $ 7,192Canadian dollar denominated options
Outstanding at December 31, 2012 322,584 C$ 23.56 Granted — C$ — Exercised — C$ — Forfeited — C$ — Expired (209,150) C$ 21.28
Outstanding at December 31, 2013 113,434 C$ 27.77 0.39 C$ —Vested at December 31, 2013 or expected to vestin the future 113,434 C$ 27.77 0.39 C$ —
Exercisable at December 31, 2013 113,434 C$ 27.77 0.39 C$ — During 2013, 2012 and 2011, we recognized $1.9 million, $1.9 million and $2.8 million of pre-tax compensation expense for
stock options, including forfeiture credits, and recorded $0.6 million, $0.6 million and $0.9 million of income tax benefits, respectively. Total compensation cost related to nonvested option awards not yet recognized at December 31, 2013 was approximately $2.4 million, which is expected to be recognized over a weighted average period of 2.4 years. Options exercised during the years ended December 31, 2013, 2012 and 2011 had a total intrinsic value of $3.2 million, $0.3 million and $1.1 million, respectively, generated $5.3 million, $1.4 million and $1.6 million of cash proceeds, respectively, and generated $1.0 million, $0.1 million, and $0.3 million of associated income tax benefit in 2013, 2012, and 2011, respectively.
Fair Value Assumptions. The fair value of each stock option granted is estimated on the date of grant using a Black-Scholes option-pricing model based on several assumptions. These assumptions are based on management's best estimate at the time of grant. For the years ended December 31, 2013, 2012 and 2011, the weighted average grant date fair value per share of options granted was $7.93, $6.43 and $7.78 per share, respectively.
Table of Contents

F-17
Listed below is the weighted average of each assumption based on grants for years ended December 31, 2013, 2012 and 2011:
2013 2012 2011Weighted average risk-free interest rate 1.31% 0.62% 1.20%Expected dividend yield —% —% —%Expected life (years) 4.5 4.5 4.5Weighted average expected volatility 52% 69% 61%Weighted average expected forfeiture rate 2% 2% 2%
We estimate expected volatility based on our historical stock price volatility over the expected term. We estimate the expected
term of our option awards based on the vesting period and average remaining contractual term, known as the "simplified method", as we do not have sufficient historical data for estimating our expected term due to significant changes in the make-up of our employees receiving stock-based compensation awards.
Canadian dollar-denominated stock option awards issued to non-Canadian employees and grants to non-employees are liability-classified awards. Accordingly, the fair value of these awards is included in accrued and other current liabilities in our consolidated balance sheets as of December 31, 2013 and 2012, the liability is adjusted to fair value at the end of each reporting period. At December 31, 2013 and 2012, the fair value of these awards was approximately $0.0 million.
Restricted Stock
We grant restricted stock units under our incentive plan, which generally vest equally in three annual installments from the date of grant and entitle the grantee to receive the value of one share of our common stock for each vested restricted stock unit. A summary of our restricted stock transactions for the year ended December 31, 2013 is presented below:
Number of Restricted
Shares
Weighted-AverageGrant Date Fair Value per Share
U.S. dollar denominated restricted stock units Nonvested at December 31, 2012 607,880 $ 12.15
Granted 214,930 $ 18.06Vested (255,483) $ 12.56Forfeited (74,610) $ 11.92
Nonvested at December 31, 2013 492,717 $ 14.54 During 2013, 2012, and 2011, we recognized $3.0 million, $2.6 million, and $4.2 million of pre-tax compensation expense including forfeiture credits, respectively, on restricted stock units and recorded $0.9 million, $0.8 million, and $1.1 million of income tax benefits, respectively. Total compensation cost related to nonvested restricted stock units not yet recognized at December 31, 2013 was approximately $5.0 million, which is expected to be recognized over a weighted average period of 2.5 years. The grant date fair value of our restricted stock granted during 2013, 2012 and 2011 was $3.9 million, $6.1 million, and $0.6 million, respectively.
Performance Share Units
We grant performance stock units under our incentive plan, which vest in full after 3 years from the grant date and entitle the grantee to receive the value of one share of our common stock for each vested performance share unit, subject to adjustment based on a performance measure. We have two types of performance share units; the first type is based on the annual performance of our stock price as compared to the stock price of a group of our peers, and the second type is based on meeting or exceeding a pre-determined annual operating income margin as set by our board of directors. The performance share unit performance objective multiplier can range from zero (when threshold performance is not met) to a maximum of 1.5 times the initial award. Performance share units may be settled by delivery of our shares or the payment of cash based on the market value of our shares at the time of settlement, at our discretion. A summary of our performance share units for the year ended December 31, 2013 is presented below:
Table of Contents
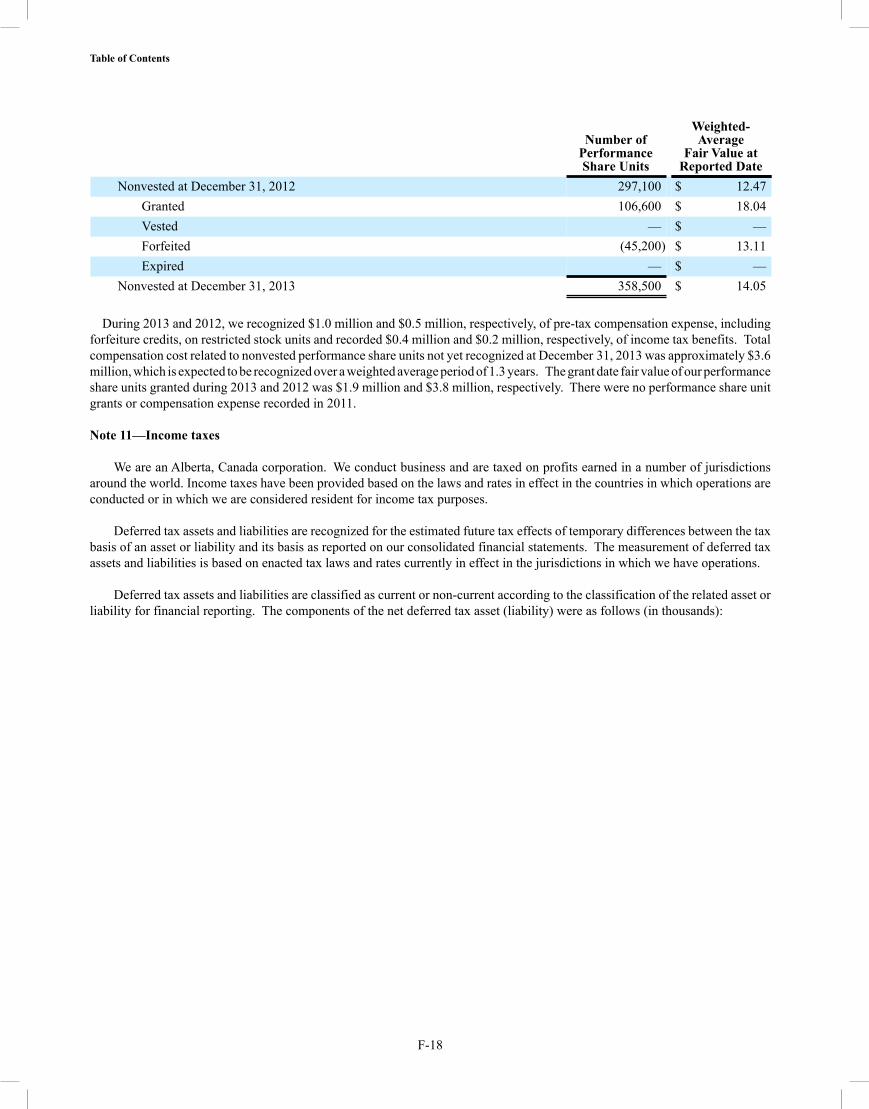
F-18
Number ofPerformanceShare Units
Weighted-Average
Fair Value at Reported Date
Nonvested at December 31, 2012 297,100 $ 12.47Granted 106,600 $ 18.04Vested — $ —Forfeited (45,200) $ 13.11Expired — $ —
Nonvested at December 31, 2013 358,500 $ 14.05
During 2013 and 2012, we recognized $1.0 million and $0.5 million, respectively, of pre-tax compensation expense, including forfeiture credits, on restricted stock units and recorded $0.4 million and $0.2 million, respectively, of income tax benefits. Total compensation cost related to nonvested performance share units not yet recognized at December 31, 2013 was approximately $3.6 million, which is expected to be recognized over a weighted average period of 1.3 years. The grant date fair value of our performance share units granted during 2013 and 2012 was $1.9 million and $3.8 million, respectively. There were no performance share unit grants or compensation expense recorded in 2011.
Note 11—Income taxes
We are an Alberta, Canada corporation. We conduct business and are taxed on profits earned in a number of jurisdictions around the world. Income taxes have been provided based on the laws and rates in effect in the countries in which operations are conducted or in which we are considered resident for income tax purposes.
Deferred tax assets and liabilities are recognized for the estimated future tax effects of temporary differences between the tax basis of an asset or liability and its basis as reported on our consolidated financial statements. The measurement of deferred tax assets and liabilities is based on enacted tax laws and rates currently in effect in the jurisdictions in which we have operations.
Deferred tax assets and liabilities are classified as current or non-current according to the classification of the related asset or liability for financial reporting. The components of the net deferred tax asset (liability) were as follows (in thousands):
Table of Contents

F-19
December 31, 2013 2012Deferred tax assets:
Current: Canada:
Loss carryforwards $ 1,230 $ 49Accrued liabilities and reserves 753 945
United States: Accrued liabilities and reserves 1,184 612
Other International: Accrued liabilities and reserves 3,497 2,850
Current deferred tax assets 6,664 4,456Less: Valuation allowance (181) (89)
Total current deferred tax assets $ 6,483 $ 4,367Non-current:
Canada: Tax credit carryforwards 1,360 1,836Property, plant and equipment 8,334 8,920
United States: Loss carryforwards 1,611 1,161Tax credit carryforwards 157 64Stock compensation 3,801 4,499
Other International: Loss carryforwards 4,536 3,977
Non-current deferred tax assets 19,799 20,457Less: Valuation allowance (4,348) (4,221)
Total non-current deferred tax assets $ 15,451 $ 16,236Deferred tax liabilities:
Current:Other International:
Accrued liabilities and reserves — (140)Total current deferred tax liabilities $ — $ (140)Non-current:
United States: Property, plant and equipment $ (9,830) $ (9,846)Intangibles (2,427) (1,791)
Other international: Property, plant and equipment 31 (401)Intangibles (894) (894)
Total non-current deferred tax liabilities (13,120) (12,932)Net deferred tax assets $ 8,814 $ 7,531
Deferred tax assets relating to tax benefits of employee stock-based compensation have been reduced to reflect stock options
exercised and restricted stock that vested during the year. Some exercises and vestings result in tax deductions in excess of previously recorded benefits based on the option value at the time of grant (“windfalls”). Although these additional tax benefits or “windfalls” are reflected in net operating tax carryforwards pursuant to accounting for stock compensation under GAAP, the additional tax benefit associated with the windfall is not recognized until the deduction reduces taxes payable. Because the tax benefit did not reduce our current taxes payable in 2011 due to net operating loss carryforwards, $0.6 million of “windfall” tax
Table of Contents

F-20
benefit was not reflected in our 2011 deferred tax asset related to net operating losses. However, because we utilized the prior year net operating loss carryforwards with windfall tax benefit in 2012, we recognized the additional "windfall" tax benefit of $0.6 million in 2012, as it reduced taxes payable in that year.
Since we are taxable in a number of jurisdictions around the world, income tax expense as a percentage of pre-tax earnings fluctuates from year to year based on the level of profits earned in these jurisdictions and the tax rates applicable to such profits.
The combined Canadian federal and Alberta provincial income tax rate for 2013 was 25%. The combined rates in 2012 and 2011 were 25% and 26.5%, respectively.
Our income before income taxes consisted of the following (in thousands):
December 31, 2013 2012 2011Canada $ 2,548 $ 27,362 $ 22,145United States 1,608 17,477 (3,512)Other international 47,508 29,756 22,639Income before taxes $ 51,664 $ 74,595 $ 41,272
Our income tax provision (benefit) consisted of the following (in thousands):
December 31, 2013 2012 2011Current:
Canada $ (706) $ 857 $ 617United States 1,148 2,842 (595)Other international 16,696 15,792 12,517
Total current 17,138 19,491 12,539Deferred:
Canada 15 3,456 3,264United States 47 3,970 560Other international (1,796) (2,136) (2,087)
Total deferred (1,734) 5,290 1,737Income tax provision $ 15,404 $ 24,781 $ 14,276
Table of Contents

F-21
A reconciliation of the statutory rate and the effective income tax rate is as follows:
Year Ended December 31, 2013 2012 2011Statutory tax rate 25.0% 25.0% 26.5%Effect of:
Tax rates applied to earnings not attributed to Canada 5.6 3.9 2.6U.S. state taxes 1.2 (0.1) 0.7Non-deductible and permanent items 2.7 2.7 4.8Change in future tax rates — — (0.1)Change in valuation allowance 0.7 1.9 1.0Research and development tax credits (2.1) (1.7) (2.7)Change in uncertain tax positions and tax audit assessments (2.8) 1.1 —Other (0.5) 0.4 1.8
Effective tax rate 29.8% 33.2% 34.6%
During 2013, we utilized $4.4 million of non-capital loss carryforwards in Canada. At December 31, 2013, we had $7.0 million of Canadian loss carryforwards remaining which do not expire until 2027. These losses can be carried forward and applied to reduce future taxable income. Based on our recent history of generating taxable income to utilize our loss carryforwards, expected future income and potential tax planning strategies, we expect to fully utilize these loss carryforwards. Therefore, there is no valuation allowance offsetting the deferred tax asset for these losses.
Certain of our U.S. and foreign subsidiaries file separate tax returns and have incurred losses in those respective jurisdictions. At December 31, 2013 we had a deferred tax asset related to the 2013 U.S. loss carryforward of $1.6 million. No valuation allowance has been established on the U.S. losses, as the future reversals of existing taxable temporary differences in the U.S. will generate enough taxable income to realize the tax benefit of those losses.
At December 31, 2013 we had a deferred tax asset related to other foreign loss carryforwards of $4.5 million. Due to insufficient earnings history in the jurisdictions where such losses were generated, we do not expect to fully utilize these foreign losses. Therefore, a partial valuation allowance has been established against the related deferred tax asset. The valuation allowance at December 31, 2013 was $3.4 million.
At December 31, 2013 we had a deferred tax asset related to foreign tax credits of $1.1 million. These foreign tax credits are fully offset by a valuation allowance of $1.1 million, for a net deferred tax asset related to foreign tax credits of zero.
No provision is made for taxes that may be payable on the repatriation of accumulated earnings in foreign subsidiaries on the basis that these earnings will continue to be used to finance the activities of these subsidiaries. It is not practicable to determine the amount of unrecognized deferred income taxes associated with these unremitted earnings.
At December 31, 2012, we had an accrual for uncertain tax positions of $2.2 million. During 2013, we reversed $2.0 million due to legal settlements, leaving a balance of $0.2 million at December 31, 2013. The accrual for uncertain tax positions is included in other liabilities in our consolidated balance sheet as we anticipate that these uncertainties will not be resolved within the next 12 months. The resolution of these uncertainties should not have a material impact on our effective tax rate.
Table of Contents
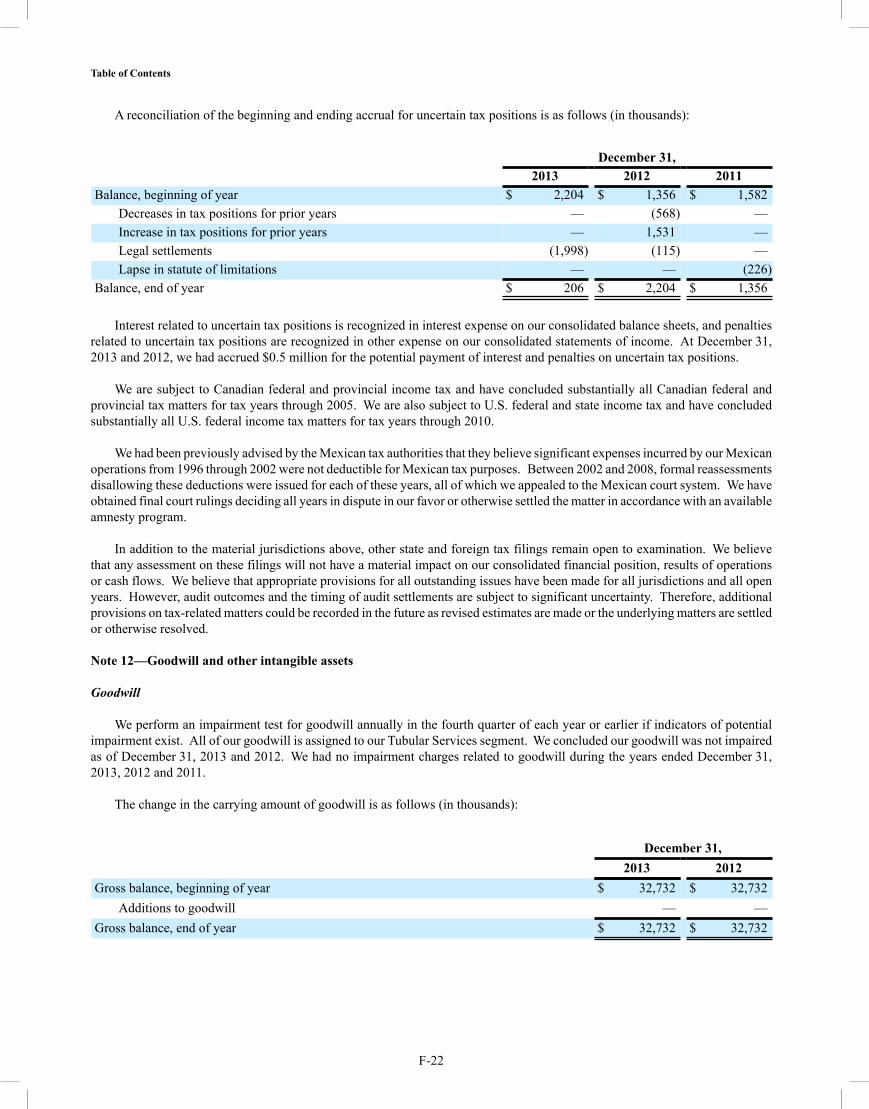
F-22
A reconciliation of the beginning and ending accrual for uncertain tax positions is as follows (in thousands):
December 31, 2013 2012 2011Balance, beginning of year $ 2,204 $ 1,356 $ 1,582
Decreases in tax positions for prior years — (568) —Increase in tax positions for prior years — 1,531 —Legal settlements (1,998) (115) —Lapse in statute of limitations — — (226)
Balance, end of year $ 206 $ 2,204 $ 1,356
Interest related to uncertain tax positions is recognized in interest expense on our consolidated balance sheets, and penalties related to uncertain tax positions are recognized in other expense on our consolidated statements of income. At December 31, 2013 and 2012, we had accrued $0.5 million for the potential payment of interest and penalties on uncertain tax positions.
We are subject to Canadian federal and provincial income tax and have concluded substantially all Canadian federal and provincial tax matters for tax years through 2005. We are also subject to U.S. federal and state income tax and have concluded substantially all U.S. federal income tax matters for tax years through 2010.
We had been previously advised by the Mexican tax authorities that they believe significant expenses incurred by our Mexican operations from 1996 through 2002 were not deductible for Mexican tax purposes. Between 2002 and 2008, formal reassessments disallowing these deductions were issued for each of these years, all of which we appealed to the Mexican court system. We have obtained final court rulings deciding all years in dispute in our favor or otherwise settled the matter in accordance with an available amnesty program.
In addition to the material jurisdictions above, other state and foreign tax filings remain open to examination. We believe that any assessment on these filings will not have a material impact on our consolidated financial position, results of operations or cash flows. We believe that appropriate provisions for all outstanding issues have been made for all jurisdictions and all open years. However, audit outcomes and the timing of audit settlements are subject to significant uncertainty. Therefore, additional provisions on tax-related matters could be recorded in the future as revised estimates are made or the underlying matters are settled or otherwise resolved. Note 12—Goodwill and other intangible assets Goodwill
We perform an impairment test for goodwill annually in the fourth quarter of each year or earlier if indicators of potential impairment exist. All of our goodwill is assigned to our Tubular Services segment. We concluded our goodwill was not impaired as of December 31, 2013 and 2012. We had no impairment charges related to goodwill during the years ended December 31, 2013, 2012 and 2011.
The change in the carrying amount of goodwill is as follows (in thousands):
December 31, 2013 2012Gross balance, beginning of year $ 32,732 $ 32,732
Additions to goodwill — —Gross balance, end of year $ 32,732 $ 32,732
Table of Contents
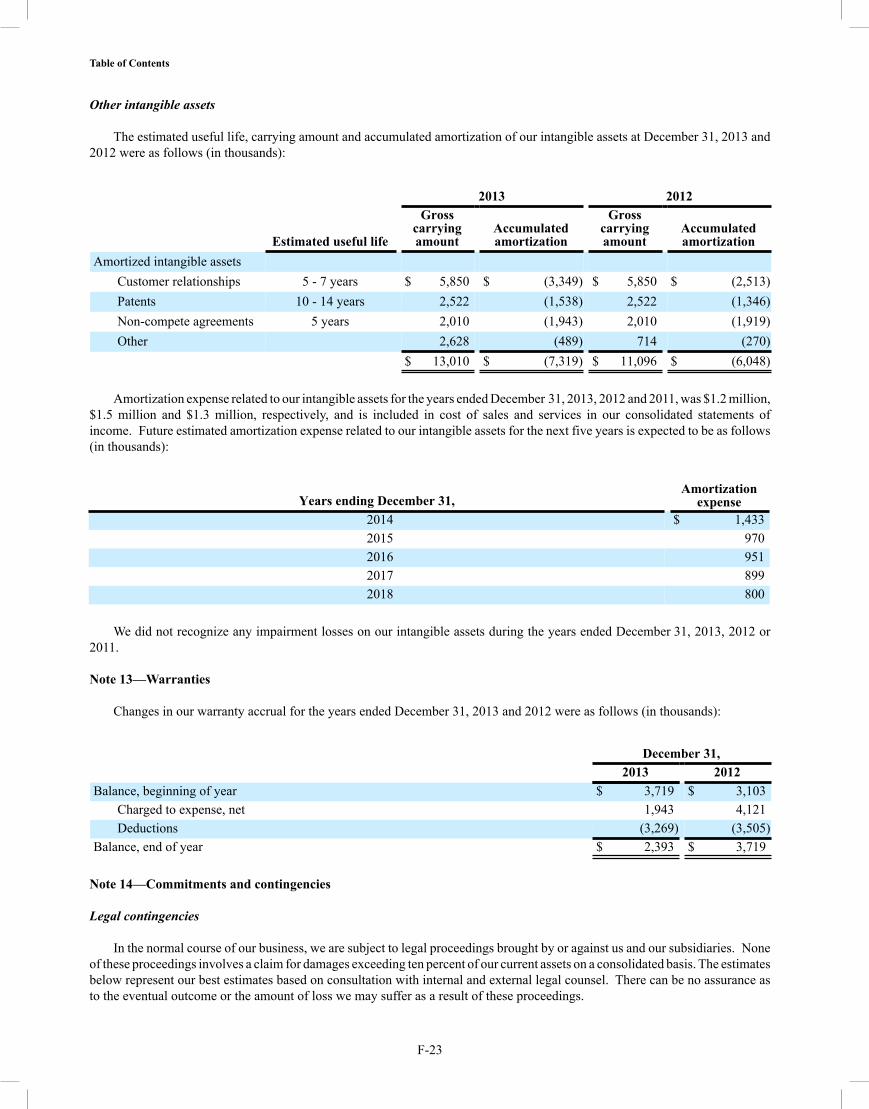
F-23
Other intangible assets
The estimated useful life, carrying amount and accumulated amortization of our intangible assets at December 31, 2013 and 2012 were as follows (in thousands):
2013 2012
Estimated useful life
Grosscarryingamount
Accumulatedamortization
Grosscarryingamount
Accumulatedamortization
Amortized intangible assets Customer relationships 5 - 7 years $ 5,850 $ (3,349) $ 5,850 $ (2,513)Patents 10 - 14 years 2,522 (1,538) 2,522 (1,346)Non-compete agreements 5 years 2,010 (1,943) 2,010 (1,919)Other 2,628 (489) 714 (270)
$ 13,010 $ (7,319) $ 11,096 $ (6,048)
Amortization expense related to our intangible assets for the years ended December 31, 2013, 2012 and 2011, was $1.2 million, $1.5 million and $1.3 million, respectively, and is included in cost of sales and services in our consolidated statements of income. Future estimated amortization expense related to our intangible assets for the next five years is expected to be as follows (in thousands):
Years ending December 31,Amortization
expense2014 $ 1,4332015 9702016 9512017 8992018 800
We did not recognize any impairment losses on our intangible assets during the years ended December 31, 2013, 2012 or
2011.
Note 13—Warranties
Changes in our warranty accrual for the years ended December 31, 2013 and 2012 were as follows (in thousands):
December 31, 2013 2012Balance, beginning of year $ 3,719 $ 3,103
Charged to expense, net 1,943 4,121Deductions (3,269) (3,505)
Balance, end of year $ 2,393 $ 3,719
Note 14—Commitments and contingencies
Legal contingencies
In the normal course of our business, we are subject to legal proceedings brought by or against us and our subsidiaries. None of these proceedings involves a claim for damages exceeding ten percent of our current assets on a consolidated basis. The estimates below represent our best estimates based on consultation with internal and external legal counsel. There can be no assurance as to the eventual outcome or the amount of loss we may suffer as a result of these proceedings.
Table of Contents
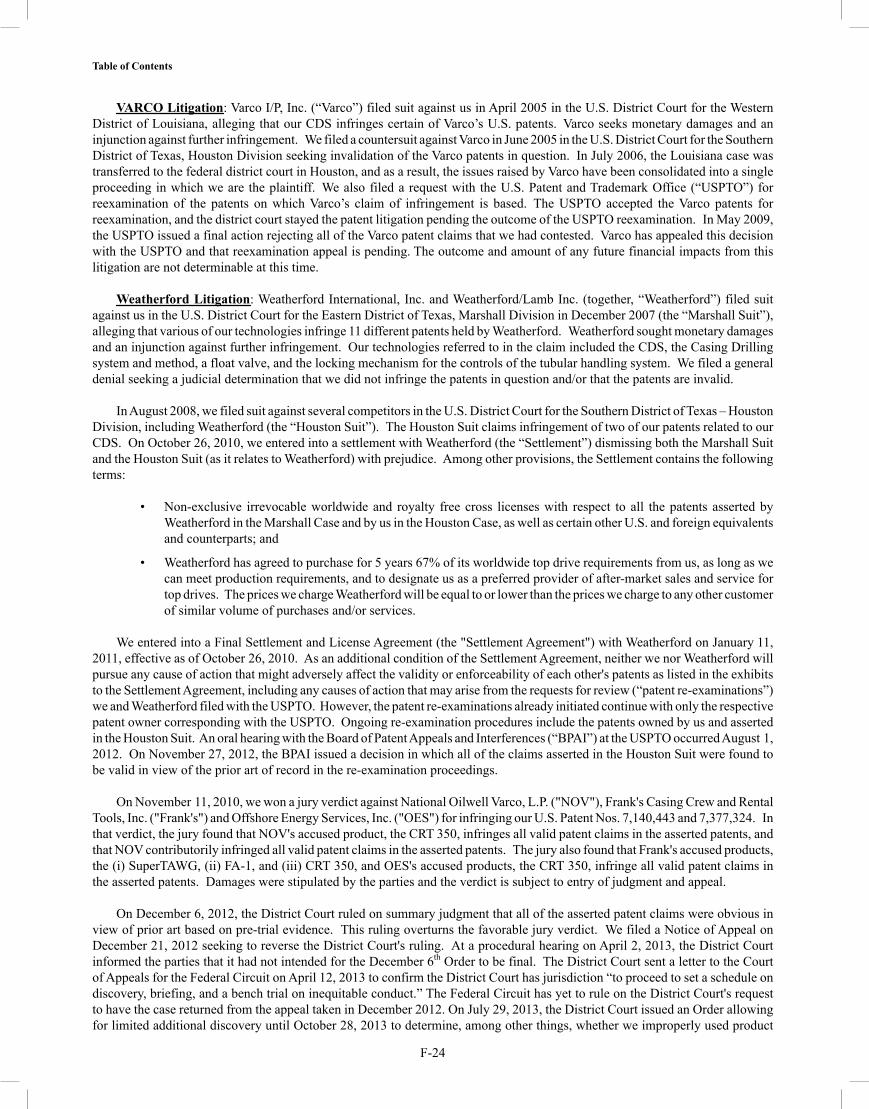
F-24
VARCO Litigation: Varco I/P, Inc. (“Varco”) filed suit against us in April 2005 in the U.S. District Court for the Western District of Louisiana, alleging that our CDS infringes certain of Varco’s U.S. patents. Varco seeks monetary damages and an injunction against further infringement. We filed a countersuit against Varco in June 2005 in the U.S. District Court for the Southern District of Texas, Houston Division seeking invalidation of the Varco patents in question. In July 2006, the Louisiana case was transferred to the federal district court in Houston, and as a result, the issues raised by Varco have been consolidated into a single proceeding in which we are the plaintiff. We also filed a request with the U.S. Patent and Trademark Office (“USPTO”) for reexamination of the patents on which Varco’s claim of infringement is based. The USPTO accepted the Varco patents for reexamination, and the district court stayed the patent litigation pending the outcome of the USPTO reexamination. In May 2009, the USPTO issued a final action rejecting all of the Varco patent claims that we had contested. Varco has appealed this decision with the USPTO and that reexamination appeal is pending. The outcome and amount of any future financial impacts from this litigation are not determinable at this time.
Weatherford Litigation: Weatherford International, Inc. and Weatherford/Lamb Inc. (together, “Weatherford”) filed suit against us in the U.S. District Court for the Eastern District of Texas, Marshall Division in December 2007 (the “Marshall Suit”), alleging that various of our technologies infringe 11 different patents held by Weatherford. Weatherford sought monetary damages and an injunction against further infringement. Our technologies referred to in the claim included the CDS, the Casing Drilling system and method, a float valve, and the locking mechanism for the controls of the tubular handling system. We filed a general denial seeking a judicial determination that we did not infringe the patents in question and/or that the patents are invalid.
In August 2008, we filed suit against several competitors in the U.S. District Court for the Southern District of Texas – Houston Division, including Weatherford (the “Houston Suit”). The Houston Suit claims infringement of two of our patents related to our CDS. On October 26, 2010, we entered into a settlement with Weatherford (the “Settlement”) dismissing both the Marshall Suit and the Houston Suit (as it relates to Weatherford) with prejudice. Among other provisions, the Settlement contains the following terms:
• Non-exclusive irrevocable worldwide and royalty free cross licenses with respect to all the patents asserted by Weatherford in the Marshall Case and by us in the Houston Case, as well as certain other U.S. and foreign equivalents and counterparts; and
• Weatherford has agreed to purchase for 5 years 67% of its worldwide top drive requirements from us, as long as we can meet production requirements, and to designate us as a preferred provider of after-market sales and service for top drives. The prices we charge Weatherford will be equal to or lower than the prices we charge to any other customer of similar volume of purchases and/or services.
We entered into a Final Settlement and License Agreement (the "Settlement Agreement") with Weatherford on January 11, 2011, effective as of October 26, 2010. As an additional condition of the Settlement Agreement, neither we nor Weatherford will pursue any cause of action that might adversely affect the validity or enforceability of each other's patents as listed in the exhibits to the Settlement Agreement, including any causes of action that may arise from the requests for review (“patent re-examinations”) we and Weatherford filed with the USPTO. However, the patent re-examinations already initiated continue with only the respective patent owner corresponding with the USPTO. Ongoing re-examination procedures include the patents owned by us and asserted in the Houston Suit. An oral hearing with the Board of Patent Appeals and Interferences (“BPAI”) at the USPTO occurred August 1, 2012. On November 27, 2012, the BPAI issued a decision in which all of the claims asserted in the Houston Suit were found to be valid in view of the prior art of record in the re-examination proceedings.
On November 11, 2010, we won a jury verdict against National Oilwell Varco, L.P. ("NOV"), Frank's Casing Crew and Rental Tools, Inc. ("Frank's") and Offshore Energy Services, Inc. ("OES") for infringing our U.S. Patent Nos. 7,140,443 and 7,377,324. In that verdict, the jury found that NOV's accused product, the CRT 350, infringes all valid patent claims in the asserted patents, and that NOV contributorily infringed all valid patent claims in the asserted patents. The jury also found that Frank's accused products, the (i) SuperTAWG, (ii) FA-1, and (iii) CRT 350, and OES's accused products, the CRT 350, infringe all valid patent claims in the asserted patents. Damages were stipulated by the parties and the verdict is subject to entry of judgment and appeal.
On December 6, 2012, the District Court ruled on summary judgment that all of the asserted patent claims were obvious in view of prior art based on pre-trial evidence. This ruling overturns the favorable jury verdict. We filed a Notice of Appeal on December 21, 2012 seeking to reverse the District Court's ruling. At a procedural hearing on April 2, 2013, the District Court informed the parties that it had not intended for the December 6th Order to be final. The District Court sent a letter to the Court of Appeals for the Federal Circuit on April 12, 2013 to confirm the District Court has jurisdiction “to proceed to set a schedule on discovery, briefing, and a bench trial on inequitable conduct.” The Federal Circuit has yet to rule on the District Court's request to have the case returned from the appeal taken in December 2012. On July 29, 2013, the District Court issued an Order allowing for limited additional discovery until October 28, 2013 to determine, among other things, whether we improperly used product
Table of Contents
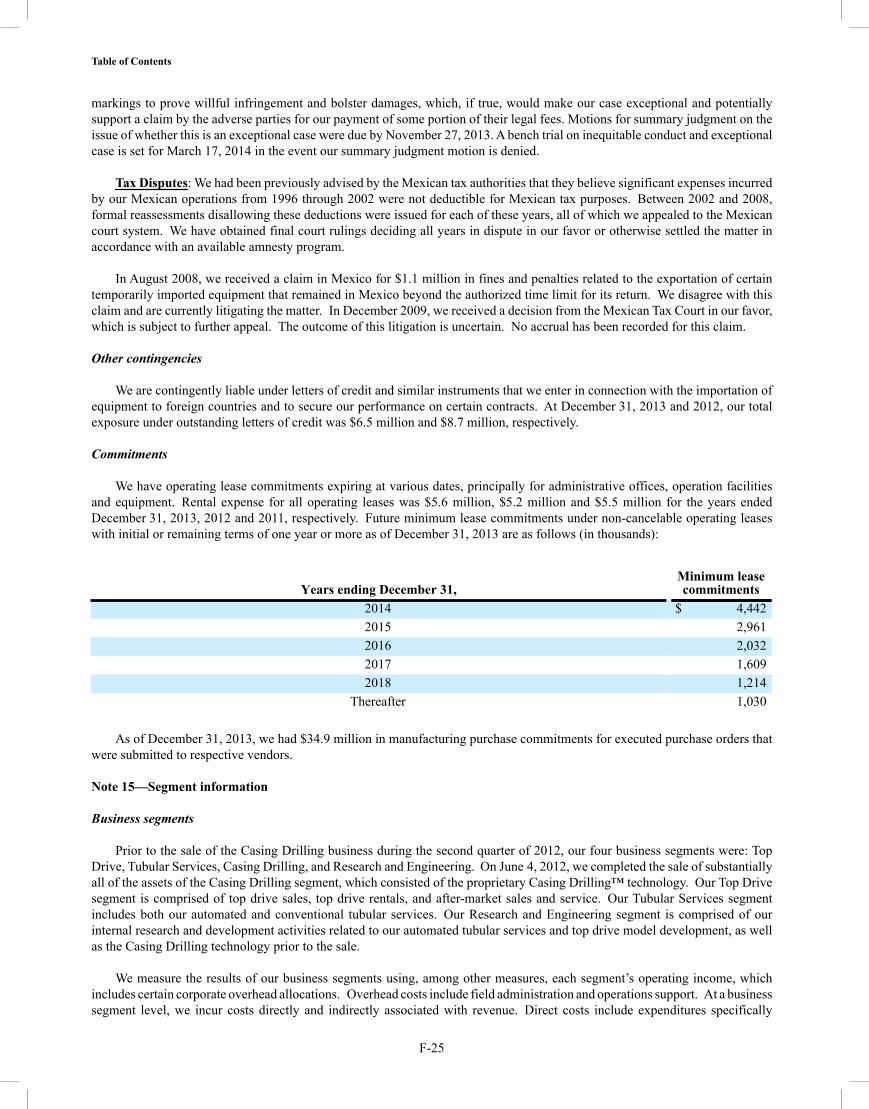
F-25
markings to prove willful infringement and bolster damages, which, if true, would make our case exceptional and potentially support a claim by the adverse parties for our payment of some portion of their legal fees. Motions for summary judgment on the issue of whether this is an exceptional case were due by November 27, 2013. A bench trial on inequitable conduct and exceptional case is set for March 17, 2014 in the event our summary judgment motion is denied.
Tax Disputes: We had been previously advised by the Mexican tax authorities that they believe significant expenses incurred by our Mexican operations from 1996 through 2002 were not deductible for Mexican tax purposes. Between 2002 and 2008, formal reassessments disallowing these deductions were issued for each of these years, all of which we appealed to the Mexican court system. We have obtained final court rulings deciding all years in dispute in our favor or otherwise settled the matter in accordance with an available amnesty program.
In August 2008, we received a claim in Mexico for $1.1 million in fines and penalties related to the exportation of certain temporarily imported equipment that remained in Mexico beyond the authorized time limit for its return. We disagree with this claim and are currently litigating the matter. In December 2009, we received a decision from the Mexican Tax Court in our favor, which is subject to further appeal. The outcome of this litigation is uncertain. No accrual has been recorded for this claim.
Other contingencies
We are contingently liable under letters of credit and similar instruments that we enter in connection with the importation of equipment to foreign countries and to secure our performance on certain contracts. At December 31, 2013 and 2012, our total exposure under outstanding letters of credit was $6.5 million and $8.7 million, respectively.
Commitments
We have operating lease commitments expiring at various dates, principally for administrative offices, operation facilities and equipment. Rental expense for all operating leases was $5.6 million, $5.2 million and $5.5 million for the years ended December 31, 2013, 2012 and 2011, respectively. Future minimum lease commitments under non-cancelable operating leases with initial or remaining terms of one year or more as of December 31, 2013 are as follows (in thousands):
Years ending December 31,Minimum leasecommitments
2014 $ 4,4422015 2,9612016 2,0322017 1,6092018 1,214
Thereafter 1,030
As of December 31, 2013, we had $34.9 million in manufacturing purchase commitments for executed purchase orders that were submitted to respective vendors. Note 15—Segment information
Business segments
Prior to the sale of the Casing Drilling business during the second quarter of 2012, our four business segments were: Top Drive, Tubular Services, Casing Drilling, and Research and Engineering. On June 4, 2012, we completed the sale of substantially all of the assets of the Casing Drilling segment, which consisted of the proprietary Casing Drilling™ technology. Our Top Drive segment is comprised of top drive sales, top drive rentals, and after-market sales and service. Our Tubular Services segment includes both our automated and conventional tubular services. Our Research and Engineering segment is comprised of our internal research and development activities related to our automated tubular services and top drive model development, as well as the Casing Drilling technology prior to the sale.
We measure the results of our business segments using, among other measures, each segment’s operating income, which includes certain corporate overhead allocations. Overhead costs include field administration and operations support. At a business segment level, we incur costs directly and indirectly associated with revenue. Direct costs include expenditures specifically
Table of Contents

F-26
incurred for the generation of revenue, such as personnel costs on location or transportation, maintenance and repair, and depreciation of our revenue-generating equipment.
Certain sales and marketing activities, financing activities, corporate general and administrative expenses, and other (income) expense and income taxes are not allocated to our business segments.
Goodwill is allocated to the business segment to which it specifically relates. Our goodwill has been allocated to the Tubular Services segment.
Significant financial information relating to these segments is as follows (in thousands):
Year Ended December 31, 2013
Top DriveTubularServices
CasingDrilling
Research &Engineering
Corporateand Other Total
Revenue $ 311,632 $ 212,997 $ 624 $ — $ — $ 525,253Depreciation and amortization 11,656 24,553 2 65 4,502 40,778Operating income (loss) 67,462 37,004 2,124 (8,578) (42,396) 55,616Other expense (3,952)Income before income taxes $ 51,664
Year Ended December 31, 2012
Top DriveTubularServices
CasingDrilling
Research &Engineering
Corporateand Other Total
Revenue $ 357,842 $ 182,404 $ 12,893 $ — $ — $ 553,139Depreciation and amortization 11,289 26,043 1,479 89 4,089 42,989Operating income (loss) 87,716 21,708 8,191 (10,457) (30,363) 76,795Other expense (2,200)Income before income taxes $ 74,595
Year Ended December 31, 2011
Top DriveTubularServices
CasingDrilling
Research &Engineering
Corporateand Other Total
Revenue $ 344,698 $ 151,124 $ 17,147 $ — $ — $ 512,969Depreciation and amortization 11,086 18,741 4,697 32 3,905 38,461Operating income (loss) 88,799 16,680 (12,392) (12,512) (38,058) 42,517Other expense (1,245)Income before income taxes $ 41,272
Table of Contents
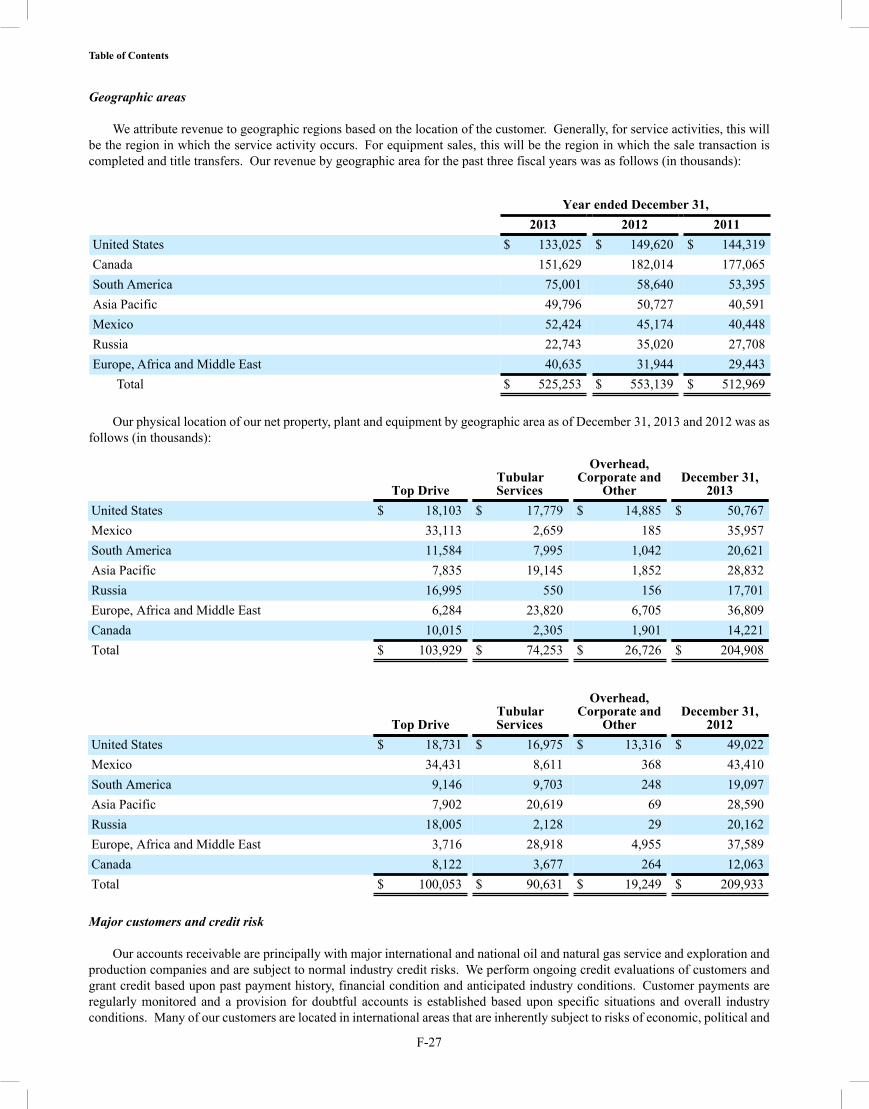
F-27
Geographic areas
We attribute revenue to geographic regions based on the location of the customer. Generally, for service activities, this will be the region in which the service activity occurs. For equipment sales, this will be the region in which the sale transaction is completed and title transfers. Our revenue by geographic area for the past three fiscal years was as follows (in thousands):
Year ended December 31, 2013 2012 2011United States $ 133,025 $ 149,620 $ 144,319Canada 151,629 182,014 177,065South America 75,001 58,640 53,395Asia Pacific 49,796 50,727 40,591Mexico 52,424 45,174 40,448Russia 22,743 35,020 27,708Europe, Africa and Middle East 40,635 31,944 29,443
Total $ 525,253 $ 553,139 $ 512,969
Our physical location of our net property, plant and equipment by geographic area as of December 31, 2013 and 2012 was as follows (in thousands):
Top DriveTubularServices
Overhead,Corporate and
OtherDecember 31,
2013United States $ 18,103 $ 17,779 $ 14,885 $ 50,767Mexico 33,113 2,659 185 35,957South America 11,584 7,995 1,042 20,621Asia Pacific 7,835 19,145 1,852 28,832Russia 16,995 550 156 17,701Europe, Africa and Middle East 6,284 23,820 6,705 36,809Canada 10,015 2,305 1,901 14,221Total $ 103,929 $ 74,253 $ 26,726 $ 204,908
Top DriveTubularServices
Overhead,Corporate and
OtherDecember 31,
2012United States $ 18,731 $ 16,975 $ 13,316 $ 49,022Mexico 34,431 8,611 368 43,410South America 9,146 9,703 248 19,097Asia Pacific 7,902 20,619 69 28,590Russia 18,005 2,128 29 20,162Europe, Africa and Middle East 3,716 28,918 4,955 37,589Canada 8,122 3,677 264 12,063Total $ 100,053 $ 90,631 $ 19,249 $ 209,933 Major customers and credit risk
Our accounts receivable are principally with major international and national oil and natural gas service and exploration and production companies and are subject to normal industry credit risks. We perform ongoing credit evaluations of customers and grant credit based upon past payment history, financial condition and anticipated industry conditions. Customer payments are regularly monitored and a provision for doubtful accounts is established based upon specific situations and overall industry conditions. Many of our customers are located in international areas that are inherently subject to risks of economic, political and
Table of Contents
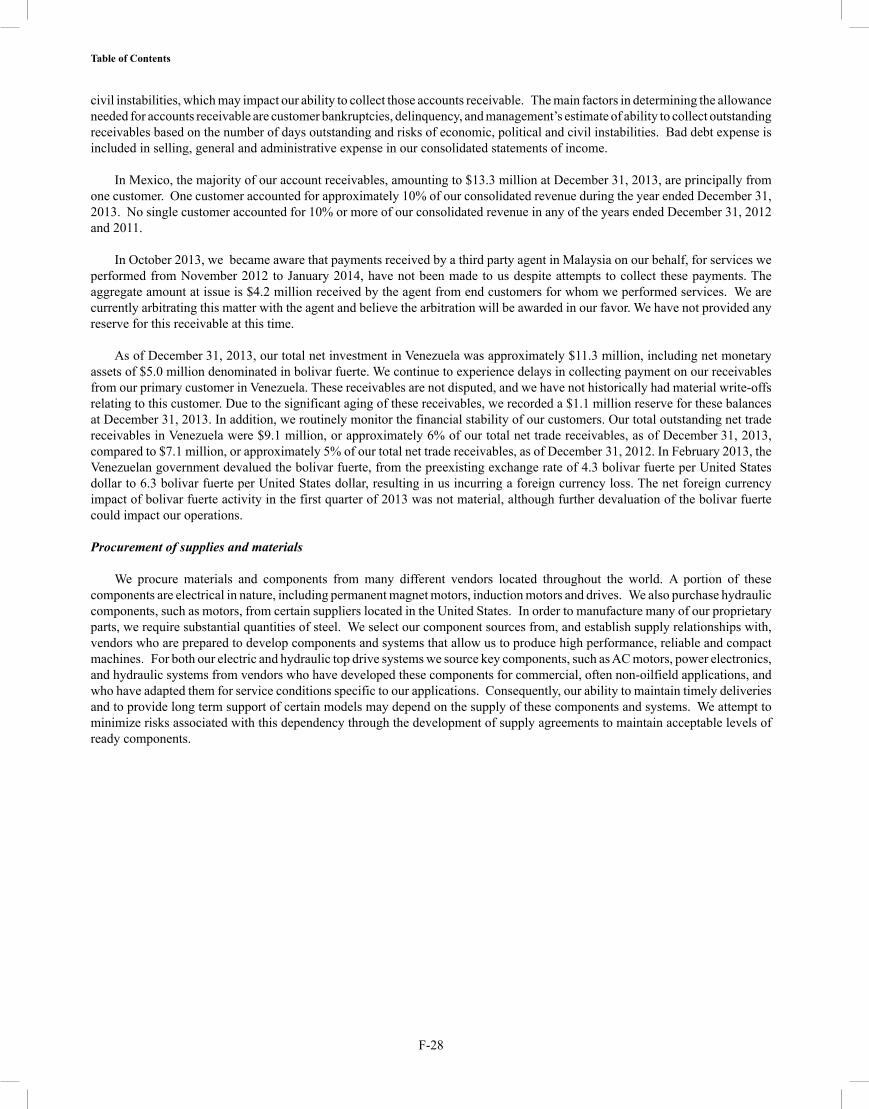
F-28
civil instabilities, which may impact our ability to collect those accounts receivable. The main factors in determining the allowance needed for accounts receivable are customer bankruptcies, delinquency, and management’s estimate of ability to collect outstanding receivables based on the number of days outstanding and risks of economic, political and civil instabilities. Bad debt expense is included in selling, general and administrative expense in our consolidated statements of income.
In Mexico, the majority of our account receivables, amounting to $13.3 million at December 31, 2013, are principally from one customer. One customer accounted for approximately 10% of our consolidated revenue during the year ended December 31, 2013. No single customer accounted for 10% or more of our consolidated revenue in any of the years ended December 31, 2012 and 2011.
In October 2013, we became aware that payments received by a third party agent in Malaysia on our behalf, for services we performed from November 2012 to January 2014, have not been made to us despite attempts to collect these payments. The aggregate amount at issue is $4.2 million received by the agent from end customers for whom we performed services. We are currently arbitrating this matter with the agent and believe the arbitration will be awarded in our favor. We have not provided any reserve for this receivable at this time.
As of December 31, 2013, our total net investment in Venezuela was approximately $11.3 million, including net monetary assets of $5.0 million denominated in bolivar fuerte. We continue to experience delays in collecting payment on our receivables from our primary customer in Venezuela. These receivables are not disputed, and we have not historically had material write-offs relating to this customer. Due to the significant aging of these receivables, we recorded a $1.1 million reserve for these balances at December 31, 2013. In addition, we routinely monitor the financial stability of our customers. Our total outstanding net trade receivables in Venezuela were $9.1 million, or approximately 6% of our total net trade receivables, as of December 31, 2013, compared to $7.1 million, or approximately 5% of our total net trade receivables, as of December 31, 2012. In February 2013, the Venezuelan government devalued the bolivar fuerte, from the preexisting exchange rate of 4.3 bolivar fuerte per United States dollar to 6.3 bolivar fuerte per United States dollar, resulting in us incurring a foreign currency loss. The net foreign currency impact of bolivar fuerte activity in the first quarter of 2013 was not material, although further devaluation of the bolivar fuerte could impact our operations.
Procurement of supplies and materials
We procure materials and components from many different vendors located throughout the world. A portion of these components are electrical in nature, including permanent magnet motors, induction motors and drives. We also purchase hydraulic components, such as motors, from certain suppliers located in the United States. In order to manufacture many of our proprietary parts, we require substantial quantities of steel. We select our component sources from, and establish supply relationships with, vendors who are prepared to develop components and systems that allow us to produce high performance, reliable and compact machines. For both our electric and hydraulic top drive systems we source key components, such as AC motors, power electronics, and hydraulic systems from vendors who have developed these components for commercial, often non-oilfield applications, and who have adapted them for service conditions specific to our applications. Consequently, our ability to maintain timely deliveries and to provide long term support of certain models may depend on the supply of these components and systems. We attempt to minimize risks associated with this dependency through the development of supply agreements to maintain acceptable levels of ready components.
Table of Contents

F-29
Supplementary Data Selected quarterly financial data (unaudited) The following table presents unaudited quarterly financial data for 2013 and 2012 (in thousands, except for per share amounts):
For the 2013 quarterly period ended March 31 June 30 September 30 December 31Revenue $ 127,095 $ 128,968 $ 132,248 $ 136,942Operating income 11,732 13,831 17,812 12,239Net income 8,836 10,229 11,680 5,512Earnings per share:
Basic $ 0.23 $ 0.26 $ 0.30 $ 0.14Diluted $ 0.22 $ 0.26 $ 0.29 $ 0.14
For the 2012 quarterly period ended March 31(1) June 30(2) September 30 December 31Revenue $ 152,421 $ 136,673 $ 126,419 $ 137,626Operating income 19,021 24,624 16,180 16,969Net income 14,419 13,106 8,956 13,333Earnings per share:
Basic $ 0.37 $ 0.34 $ 0.23 $ 0.34Diluted $ 0.37 $ 0.34 $ 0.23 $ 0.34
(1) Our results for the quarterly period ended March 31, 2012 included a $3.9 million charge to increase our warranty provisions specifically associated with the gear box housing issue for our ESI model.
(2) Our results for the quarterly period ended June 30, 2012 included a $13.3 million pre-tax gain on the sale of the Casing Drilling business.
Table of Contents
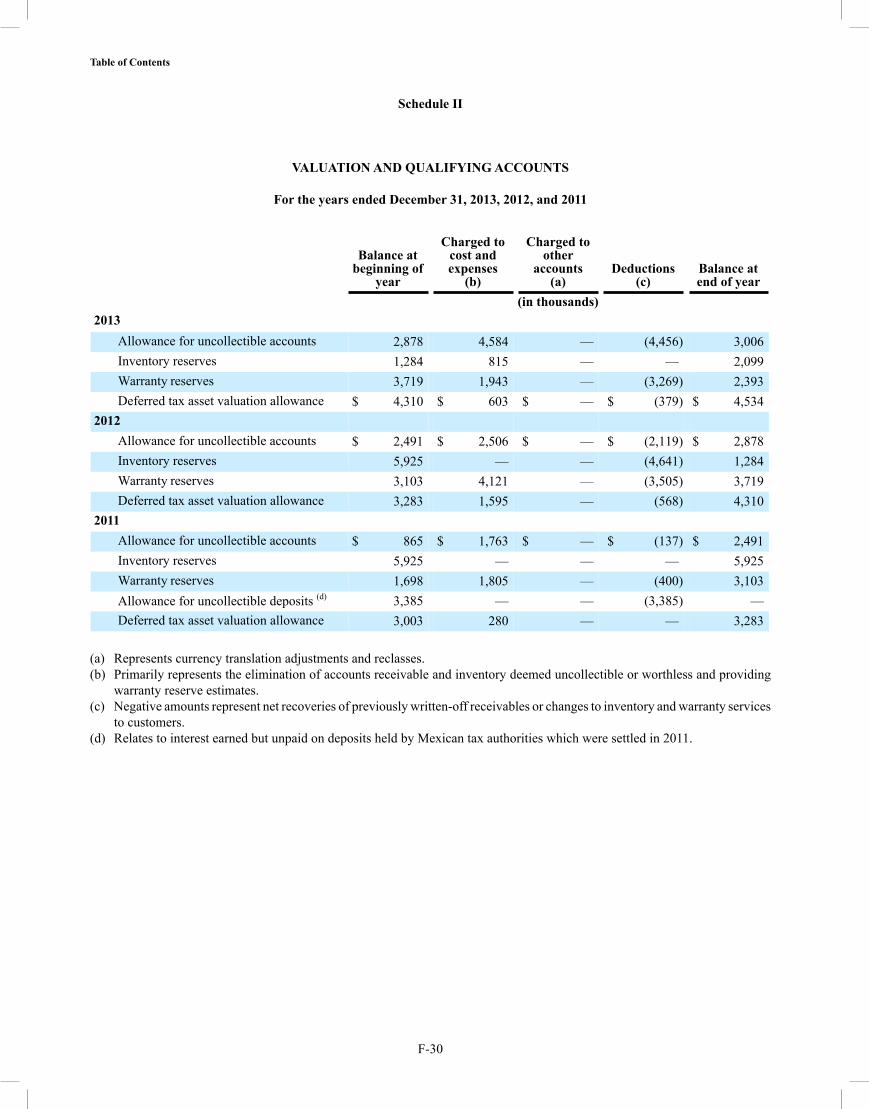
F-30
Schedule II
VALUATION AND QUALIFYING ACCOUNTS
For the years ended December 31, 2013, 2012, and 2011
Balance at
beginning ofyear
Charged to cost and expenses
(b)
Charged to other
accounts(a)
Deductions(c)
Balance atend of year
(in thousands)2013
Allowance for uncollectible accounts 2,878 4,584 — (4,456) 3,006Inventory reserves 1,284 815 — — 2,099Warranty reserves 3,719 1,943 — (3,269) 2,393Deferred tax asset valuation allowance $ 4,310 $ 603 $ — $ (379) $ 4,534
2012 Allowance for uncollectible accounts $ 2,491 $ 2,506 $ — $ (2,119) $ 2,878Inventory reserves 5,925 — — (4,641) 1,284Warranty reserves 3,103 4,121 — (3,505) 3,719Deferred tax asset valuation allowance 3,283 1,595 — (568) 4,310
2011 Allowance for uncollectible accounts $ 865 $ 1,763 $ — $ (137) $ 2,491Inventory reserves 5,925 — — — 5,925Warranty reserves 1,698 1,805 — (400) 3,103Allowance for uncollectible deposits (d) 3,385 — — (3,385) —Deferred tax asset valuation allowance 3,003 280 — — 3,283
(a) Represents currency translation adjustments and reclasses.(b) Primarily represents the elimination of accounts receivable and inventory deemed uncollectible or worthless and providing
warranty reserve estimates.(c) Negative amounts represent net recoveries of previously written-off receivables or changes to inventory and warranty services
to customers.(d) Relates to interest earned but unpaid on deposits held by Mexican tax authorities which were settled in 2011.
Table of Contents
TESCO Board of Directors
Standing Left to Right:
Elijio V. Serrano - Fred J. Dyment - Gary L. Kott - John P. Dielwart - John T. Reynolds
Sitting Left to Right:
President & Chief Executive Officer Julio M. Quintana - Chairman of the Board Michael W. Sutherlin
R. Vance Milligan
Not Pictured:
Retiring May 2014 AGM Norman W. Robertson

P R O G R E S S
2110
0e_R
evA
©20
14 Te
sco C
orpo
ratio
n. A
ll rig
hts r
eser
ved.
Tesco Corporation is an industry leader in the development and commercialization of drilling technology and services. TESCO’s mission is to change the way wells are drilled. By reducing drilling risk and increasing operational efficiency, TESCO generates real value for its customers. TESCO’s powerful combination of engineering and service excellence is provided by experienced and dedicated field personnel. Coupled with a passion for innovation, TESCO offers a comprehensive toolbox of proven technologies and delivers superior solutions at the wellbore. With a vision spanning the crown to the bit, from the desert to deepwater, around the world TESCO is THE DRILLING INNOVATION COMPANY™.
Corporate Headquarters3993 W. Sam Houston Parkway N.
Suite 100Houston, Texas 77043 U.S.A.
Tel: 713-359-7000Fax: 713-359-7001
Email: [email protected]
TESCO®, Casing Drive System™, CDS™, HCCDS™, MCLRS™, PDDP™, MLT™, Markfree™, Warthog™, TESCO TUBULAR SERVICES™, ULTREX™, Hydro-Form™, and TesTORK™ are trademarks of Tesco Corporation.
w w w . t e s c o c o r p . c o m


