Growth and characterization of electrodeposited orthorhombic FePO4.2H2O material
H. Ould Bouamer1,M. EL Joumani1, M. Lakhal1, G.Kaichouh1, K. Ouzaouit2,
H. Faqir2, A. EL Hourch1, A. Guessous1* 1Materials, Nanotechnologies and Environment Laboratory, Department of Chemistry, Faculty of Science
Mohammed V University in Rabat, Morocco oajar, BP 469 Marrakech, MoroccMANAGEM Group, Site de H -REMINEX Research Center 2
1.( Introduction Different types of iron phosphate are reported in the literature as monoclinic and trigonal FePO4 [1-2] and FePO4 hydrated phases, which include monoclinic and orthorhombic forms of FePO4·2H2O [1,3]. Iron phosphates exhibit different types of structures depending on the synthesis conditions. For example, FePO4 shows a trigonal structure at normal pressure, but it converts to an orthorhombic structure at high-pressure [1]. Iron phosphates have been explored as cathode and anode materials [4-6]. Dongyeon Son and al. [4] report the superior electrochemical properties of iron phosphates as anode materials for lithium ion batteries with 375 mAh/g as capacity, while Yuesheng(Wang and al [6] demonstrates for the first time that FePO4·2H2O can be used as the anode for an aqueous sodium ion battery. The capacity obtained in this case is of the order of 80 mAh / g at a rate of 0.5 C in a three-electrode system. FePO4.2H2O material is also study as a promising precursor for the synthesis of LiFePO4 [7-10] or as catalyst [11-12]and environment purification [13]. The synthesis of iron phosphate-based materials includes various types of preparation methods such as sol-gel[14], ion exchange [15], co-precipitation [16-17] and microwave-assisted synthesis [18]. The main disadvantages of these methods are a low production yield and complicated synthesis steps. It is why the development of a simple and cheap road of synthesis of iron phosphate-based material is of great interest. The paper reports on a new and original way to prepare orthorhombic FePO4 hydrated thin film by using the electrochemical oxidation of iron sulfate in H3PO4 solution at low temperature. Such a way was expected to produce films with fine particles owing to the intimate mixing of the component elements in the solution[19-21]. The synthesis of the orthorhombic FePO4 hydrated thin film; the experimental conditions to obtain a pure phase and the characterization of the deposited films are described in the paper.
2.( Materials and methods
All electrochemical experiments were carried out using a conventional set up comprising a three-electrode electrochemical cell connected to a computer-controlled Radiometer Analytical PGZ 301 potentiostat-galvanostat. The three-electrode electrochemical cell was placed in a double jacket to maintain a constant temperature throughout the experiment by circulation of thermo-stated water, i.e. 25°C or 70°C. The working electrode was a 2 cm2 Platinium plate. A saturated calomel electrode (SCE) was used as the reference electrode
Journal of materials and Environmental Sciences ISSN : 2028-2508
Orthorhombic hydrated phosphates FePO4·2H2O form has been synthesized by using the electrochemical oxidation of a solution containing a precursor of iron in phosphoric acid. By means of the voltammetry cyclic, we were able to show the mechanism of the formation of the electrolytic deposit by diffusion process. The study of the influence of certain parameters such as the concentration of iron ions, phosphoric acid H3PO4 and the scanning rates was realized in this article. A series of experiments including an X-ray diffraction study, thermogravimetric analysis and transmission electron microscopy investigation helped in determining the exact chemical formula of the obtained phase, i.e. FePO4·2H2O. The phase exhibits an orthorhombic structure with a=9.904Å; b=10.116Å; c=8.767Å.
Received 17 Jan 2017, Revised 27 Nov 2017, Accepted 30 Nov 2017
Ould Bouamer et al., J. Mater. Environ. Sci., 2018, 9 (4), pp. 1247-1254 1248
and the counter electrode was a wide-area Pt grid. The electrodes were placed in solutions comprising of (FeSO4.7H2O) in phosphoric acid (H3PO4). Just prior to the deposition, the working electrode were polished using different grades of Al2O3 powder. The electrodes were rinsed with ultrapure water (18 MΩ.cm-1). The solution was stirred throughout the experiment. The applied voltage is greater than 0.3V/SCE. White deposits resulting from the electrochemical oxidation of Fe2+ to Fe3+ were collected at the working electrode, washed with distilled water and then dried for several hours in air.Thermogravimetric analyses were carried out in air with a heating rate of 10 C/min using a TGA Q500 thermogravimetric analyzer. X-ray diffraction patterns were obtained with a X’Pert PRO diffractometer using Cu Kα radiation (λ=1.5406 Å) with operating voltage of 35 kV and a beam current of 30 mA. Infrared spectroscopy spectra were measured in KBr disks using a VERTEX 70 (IR/FT) instrument. 3.( Results and discussion 3.1 Voltammogram of a solution of FeSO4.7H2O in phosphoric acid Figure 1 presents the voltammograms obtained at 25°C in a solution of Phosphoric acid in the presence and in the absence of FeSO4.7H2Oat a scan rate of 100 mV/s. The applied voltage was varied from-0.3 V/SCE to 1 V/SCE. The figure 1 (1) concerns the electrolytic solution of solvent H3PO4 (1M), no peak was observed. Figure 1 (2) concerns the iron sulfate solution (0.2 M) in phosphoric medium (1M). In this case the currents density increase which is consistent with continuous oxidation of Fe2+ to Fe3+ onto the Platinum electrode. The reaction, which account for this oxidation is proposed as follows:
Fe2+ → Fe3+ + 1e-
The current observed for anodic peak at ∼0.3V/SCE. The cathodic peak at -0.002V/SCE during the reverse scan revealed the reduction of Fe3+ species formed during oxidation.
Figure 1: Voltammograms recorded at 25°C a scan rate of 100 mV s-1 of different solution: ---- H3PO4 (1M) +Fe2+
(0.2M),----H3PO4 (1M) 3.2. Influence of the concentration of H3PO4 solutions Various H3PO4 concentrated solutions, from 1M to 5M were used for voltammetry experiments. Figure 2 shows the curves obtained for a FeSO4.7H2O(0.2 M) in these solutions. We notice that the current intensity increases with H3PO4 concentration. For concentrations above 2M of phosphoric acid no deposit is observed on the electrode. For the concentration of 1M of phosphoric acid, a crystallized deposit is obtained. For 2M of phosphoric acid the deposit is amorphous. The reactions, which account for this oxidation, are proposed as follows [22]:
Fe2+ " Fe3+ + 1e-
Fe3+ + H2O " Fe(OH)2+ + H+
Fe(OH)2+ + H2O " Fe(OH)+2 + H+
Fe3+ + H3PO4" FeH2PO42++ H+
FeH2P O42++ H3PO4" Fe(H2PO4)2
+ + H+ Fe(OH)+
2 + Fe(H2PO4)2+ +2H2O" 2(FePO4 . 2H2O ) + 2H+
Ould Bouamer et al., J. Mater. Environ. Sci., 2018, 9 (4), pp. 1247-1254 1249
Figure 2:Current-potential polarization curves of the FeSO4.7H2Oin H3PO4 solutions. Scan rate=100 mV.s-1
We conclude that the presence of the entities Fe(OH)2+; Fe(OH)+2; FeH2PO4
2+; Fe(H2PO4)2+is necessary for the
formation of the deposit[22].The latter are in very small quantity for concentrations greater than 2M in phosphoric acid, hence the absence of deposition at the surface of the electrode.On the other hand, in 1M and 2M, a deposit is observed on the surface of the electrode. This work shows that the presence and the nature of the deposit onto the Platinum electrode is influenced by the ferrous sulfate concentrations and the phosphate concentrationswhen the voltage exceeded 0.3 V/SCE. The anodic and cathodic peak current densities and ΔEp at different concentrated of H3PO4 are reported in table 1, we notice that ΔEp is in a potentially higher range than [59 mV]. The oxidation reaction of iron II to iron III is not reversible in this phosphoric acid concentration range. The 1M concentration of phosphoric acid is chosen for the remainder of this work because it is the only concentration which has given rise to a crystallized deposit on the surface of the electrode.
Table 1: Peak currents and peak potentials at different scan of 0.2M FeSO4.7H2O
3.3. Influence of the concentration of FeSO4 .7H2O inphosphoric acid (1M) Various FeSO4.7H2Oconcentration solutions, from 0.05 M to 0.2 M in phosphoric acid (1M), were used for voltammetry experiments. Figure 3 shows the voltammogram curve obtained in these solutions at 0.1 V.s-1. The density of the anodic peak current increase with increasing FeSO4.7H2O concentrations. Showing that the oxidation peak corresponds well to the oxidation of Fe2+ to Fe3+ at the working electrode, a thicker deposit is obtained for the concentration of 0.2 FeSO4.7H2O.This concentration was chosen for the rest of our experiments. 3.4 Influence of different potential scan rates. Various scanning rates from 20 mV/s to 400 mV/s, were used for voltammetry experiments. Figure 4 shows the voltammogram curve obtained in these solutions. Current density of the anodic peak increases with increasing the scanning rates. The anodic and cathodic peak current densities at different potential scan rates are reported in table 2. We note that with the increasing of scan rate both anodic and cathodic peak current increases and the cathodic peak potentials have shifted towards negative values, while anodic peak potential move slightly towards more positive values. The peak potential separation, ∆Ep = Epa- Epc is between 155-425 mV. It is increased with the variation of scan rate (Fig. 5). The ratio of the oxidation peak current to its corresponding reduction counterpart, Ipa/Ipc is about 2. These suggest that the redox process is quasi-reversible reaction rather than a reversible reaction.
Ould Bouamer et al., J. Mater. Environ. Sci., 2018, 9 (4), pp. 1247-1254 1250
Figure 3: Cyclic voltammograms for different concentrations of FeSO4.7H2O in (1M) H3PO4 at a scan rate of 100 mV.s-1
Figure 4: Cyclic voltammograms for 0.2 M of FeSO4.7H2O in phosphoric acid H3PO4 (1M), at different scan rates.
Table 2: anodic and cathodic peak current densities (ip) at different potential scan rates.
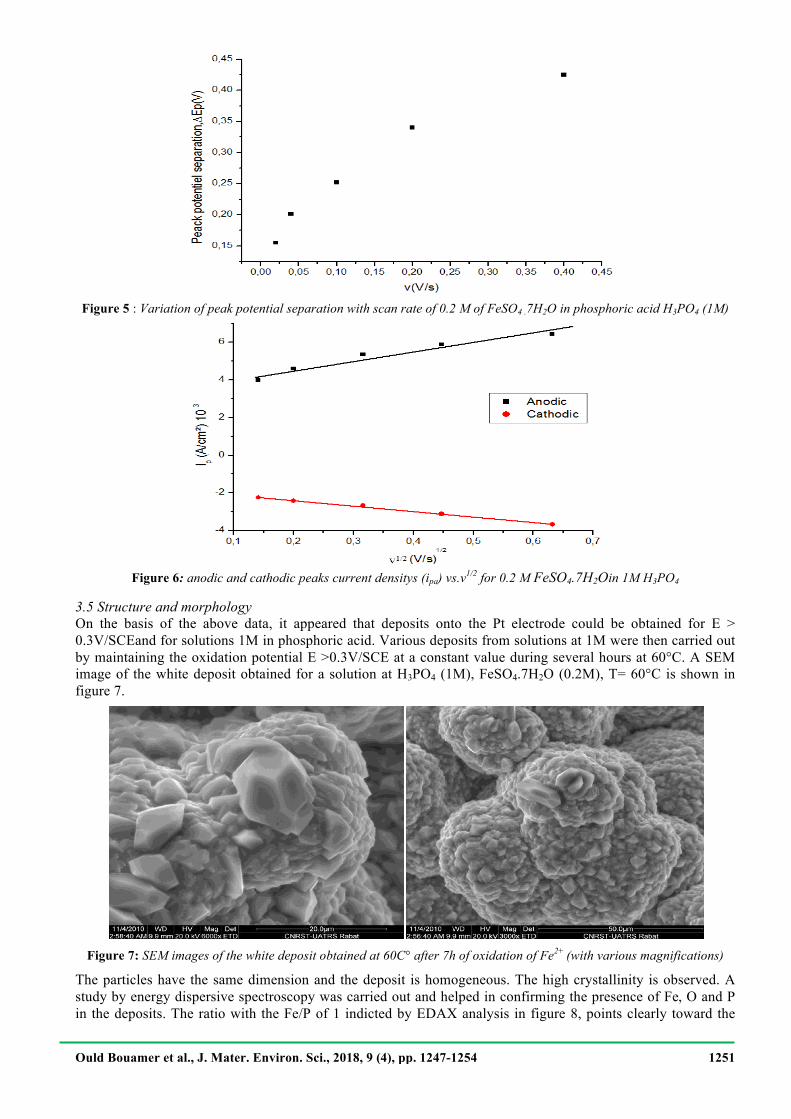
In Fig. 6, it is apparent that the peak current for the electrochemical oxidation of Fe (II) in phosphoric 1M has linear relation with square root of scan rates. This observation is in favor of the fact that the electrode process is diffusion controlled with no adsorption on the electrode surface. As the Fe3+/Fe2+ reaction is quasi reversible, the peak current Ip is given as follows [23]:
Ip = 0,4958×nFA (αnF/RT)1/2×A×D1/2×C×v1/2 Eqn.(1)
The numerical constant corresponds to expressing Ip is the peak current (A); A is the surface area of the electrode (cm2); D is the diffusion coefficient of the iron ion (cm2.s-1); C is the concentration of iron (mol.cm-3); v is the scanning rate (V.s-1); n is the number of electrons transferred in the electrode reaction. In this paper, n is equal to 1 and α is the coefficient of charge transfer. When the test temperature is kept at 25 ℃ the Eqn.(1) reduces to: Ip = 2.99 ×10⁵x n (αn )1/2AC D1/2 v1/2 Eqn.(2) Assuming αn equal to 0.5[23,24], the diffusion coefficient of Fe2+ calculated from the slope of this straight line is 3,35×10⁻⁹ cm2.s-1.The value of the diffusion coefficient calculated in phosphoric medium (1M) is lower than the value reported for Pt polished electrodes in aqueous medium DFe2+ = 5.4 .10-6 cm2 s-1 [25]. This difference can be explained by the nature of the electrolyte used which is less conductive.
Ould Bouamer et al., J. Mater. Environ. Sci., 2018, 9 (4), pp. 1247-1254 1251
Figure 5 : Variation of peak potential separation with scan rate of 0.2 M of FeSO4 .7H2O in phosphoric acid H3PO4 (1M)
Figure 6: anodic and cathodic peaks current densitys (ipa) vs.v1/2 for 0.2 M FeSO4.7H2Oin 1M H3PO4
3.5 Structure and morphology On the basis of the above data, it appeared that deposits onto the Pt electrode could be obtained for E > 0.3V/SCEand for solutions 1M in phosphoric acid. Various deposits from solutions at 1M were then carried out by maintaining the oxidation potential E >0.3V/SCE at a constant value during several hours at 60°C. A SEM image of the white deposit obtained for a solution at H3PO4 (1M), FeSO4.7H2O (0.2M), T= 60°C is shown in figure 7.
Figure 7: SEM images of the white deposit obtained at 60C° after 7h of oxidation of Fe2+ (with various magnifications)
The particles have the same dimension and the deposit is homogeneous. The high crystallinity is observed. A study by energy dispersive spectroscopy was carried out and helped in confirming the presence of Fe, O and P in the deposits. The ratio with the Fe/P of 1 indicted by EDAX analysis in figure 8, points clearly toward the
Ould Bouamer et al., J. Mater. Environ. Sci., 2018, 9 (4), pp. 1247-1254 1252
FePO4 phase deposited onto the Pt electrode. However the accuracy of the data was not sufficient to allow obtaining an accurate chemical composition.
Figure 8: EDX spectrum FePO4, 2H2O
The XRD pattern of the as-prepared deposit and the pics of PDF card 33-0667 are shown in Figure 9. All the diffraction peaks in pattern are in agreement with those of orthorhombic FePO4 2H2O (PDF card 33-0667).The strong and narrow diffraction peaks, indicate that the material is well crystallized.
Figure 9: XRD pattern of the as-prepared FePO4.2H2O.
The XRD patterns were indexed with single-phase orthorhombic FePO4.2H2O. Without any impurities phase. The lattice parameters refined in the orthorhombic system are: a=9.904 Å; b=10.116 Å and c=8.767Å. Iron phosphate, FePO4 hydrated and not exist with different crystalline forms, as shown in Table 3. The parameters calculated for our deposit are in accordance with those obtained by [1].
Table 3: Crystallographic parameters theoretical and calculated of orthorhombic FePO4. 2H2O
Compound Space group Crystallographic parameters Reference a (Å) b (Å) c (Å) β (°)
Ould Bouamer et al., J. Mater. Environ. Sci., 2018, 9 (4), pp. 1247-1254 1253
Several complementary techniques were used in order to confirm the obtained phases. The TG/DSC curves of FePO4.2H2O are shown in Figure 10. From TG–DSC curves, the mass of the product decreased up to change after 195°C, with a total mass lost of 19.69 %, which is consistent with the theoretical content of the crystalline water molecules in FePO4, 2H2O. From TG and DSC, the iron phosphate obtained by electrochemical method loses two water molecules at around 160 C°. Similar molecule loss has been observed, at higher temperature in [22, 27].
Figure10: TGA and DSC of deposits obtained for solutions comprising 0.2 Mof FeSO4.7H2O
in phosphoric acid (H3PO41M)
Infrared spectrum(IR) of the material deposited is shown in Figure 11. The observed bands IR are in agreement with the conclusions of the X-ray diffraction pattern.The vibrational motions of FePO4.2H2O may be divided into two parts in this range: the stretching and bending vibrations of water molecules identified, respectively, around 3400 and 1610 cm−1and the internal vibrations of FePO4 located in the range (1200–400) cm−1[28].
Figure11: The FTIR spectra of FePO4 2H2O
Finally, X-ray diffraction and IR spectra are in complete agreement. They indicate that it is possible to obtain a deposit of pure orthorhombic FePO4.2H2O by electrodeposition process of a solution comprising 0.2 M of iron sulfate (FeSO4) in phosphoric acid (H3PO4 1 M ) at a potential E>0.3V/SCE. Conclusion This work presents a new way to synthesis at low temperature a high quality of crystalline orthorhombic FePO4.2H2O by electrodeposition process of iron sulfate in phosphoric acid (1M) and using an oxidation potential E>0,3 V/SCE.
Ould Bouamer et al., J. Mater. Environ. Sci., 2018, 9 (4), pp. 1247-1254 1254
The mechanism of oxidation of iron sulfate in phosphoric acid (1M) was investigated. We were able to show that the oxidation isgoverned by diffusion process and the quasi-reversiblereaction at the interface of the electrode has been confirmed. The ion diffusion coefficient of Fe2+inphosphoric medium(1M) is of the order of 3,35×10⁻⁹cm2 s-1. The structural properties of the white deposit were investigated using serval complementary techniques.They confirm thatFePO4.2H2O with the orthorhombic structure was obtained. Acknowledgment-This work was supported by MESRSFC (Ministère de l'Enseignement Supérieur et de la Recherche Scientifique et de la Formation des cadres - Morocco) and CNRST (Centre National pour la Recherche Scientifique et Technique - Morocco) (project PPR). References
1.! Y. Song, P.Y. Zavalij, M. Suzuki, M.S. Whittingham, Inorg. Chem. 41 (2002) 5778 2.! H.N. Nang and, C. Calvo, Can. J. Chemistry. 53 (1975), 2064 3.! K. Zaghib, C.M. Julien, J. Power Sources. 142 (2005) 279 4.! D. Son, E. Kim, T.G. Kim, M. G. Kim, J. Cho and B. Park, Appl. Phys. Lett. 85 (2004) 5875 5.! K.B. Gandrud,O.Nilsen, H.Fjellvag,J. Power Sources. 306 (2016) 454 6.! Y. Wang, Z. Feng, D. Laul, W. Zhu, M. Provencher, M.L. Trudeau, A. Guerfi, K. Zaghib, J. Power Sources
374 (2018) 211 7.! A.S. Andersson, B. Kalska, L. Haggstrom, J.O. Thomas, Solid State Ionics. 130 (2000) 41 8.! C. Chen, G.B. Liu, Y. Wang , J.L. Li , H. Liu, Electrochim. Acta. 113 (2013) 464 9.! D. Zhou, X. Qiu, F. Liang, S. Cao, Y. Yao, X. Huang, W. Ma, B. Yang, Y. Dai, J. Ceramics International.
43 (2017) 13254 10.!M. Wang, Y. Xue, K. Zhang, Y. Zhang, Electrochim. Acta. 56 (2011) 4294 11.!T.B. Zhang, Y.C. Lu, G.S. Luo, CrystEngComm. 15 (2013) 9104 12.!D.Yu, J. Qian, N. Xue, D. Zhang, C. Wang, X. Guo, W. Ding, Y. Chen, Langmuir. 23 (2007) 382 13.!X.X. Zhang, S.S. Tang, M.L. Chen, J.H. Wang, J. Anal. At. Spectrom. 27 (2012) 466. 14.!W. Peng, L. Jiao, H. Gao, Z. Qi, Q. Wang, H. Du, Y. Si, Y. Wang, H. Yuan, J. Power Sources 196 (2011)
2841 15.!N. Marx, L. Croguennec, D. Carlier, L. Bourgeois, P. Kubiak, EL. Cras, C. Delmas, Chem, Mater. 22 (2010)
1854. 16.!X. Yang, S.M. Zhang, J.X. Zhang, M.Y. Xu, P. Ren, X.C. Li, I.C. Yan, Funct. Mater. Let. 4 (2011) 323 17.!Y. Zhu, S. Tang, H. Shi, H. Hu, Ceram. Int. 40 (2014) 2685 18.!Y. Yin, H. Zhang, P. Wu, B. Zhou, C. Cai. Nanotechnology.21 (2010). 19.!M. El Joumani, S. Bououd, Z. El Abbassi , F. Saidi, A. Kafih, A. El Hourch, A. Guessous,!J. Mater. Environ.
Sci.8 (2017) 188 20.!S. Bououd, A. El Hourch, K. El Kacemi, A. Guessous, A. Pradel, A. El Hourch, M. Ribes, J. Solid State
Sciences13 (2011) 2090 21.!D.P. Dubal, W.B. Kim, C.D.Lokhanden J. Phys. Chem. Solids 73 (2012) 18 22.!P. Zhao, H. Liu , H. Zheng , Q. Tang ,Y. Guo. Mater. Lett. 123 (2014)128 23.!A.Bard ,L.Faulkner ,R.Rosset, D.Bauer, book. Paris. New York. Masson, 1983. 24.!L.Xiao-gang, H. Ke-long, L. su-qin, C. Li-quan, J. Cent. South Univ. Technol.14 (2007) 51 25.!A.M. Baticle, F.Perdu, and P.Vennereau, Electrochim.Acta. 16 (1971) 901 26.!K.K. Palkina, S.I. Maksimova, S.I. Chibiskova, K. Schlesinger, G. Ladig, Z. Anorg. Allg. Chem. 529 (1985)
89. 27.!Y. Song, S. Yang, P.Y.Zavalij, M.S. Whittingham. Mater. Res. Bull. 37 (2002) 1249 28.!C.M. Burba, R. Frech, Spectrochimica Acta Part A 65 (2006) 44