46
GROWTH AND DEVELOPMENT (MCH- 3) Dr. Uzma Hassan (MBBS, MPH, MSc) Assistant Professor community Medicine Rawal Institute of Heath Sciences, Islamabad 1
| Date post: | 24-Dec-2015 |
| Category: |
Documents |
| Upload: | philip-victor-oconnor |
| View: | 218 times |
| Download: | 2 times |

1
GROWTH AND DEVELOPMENT
(MCH-3)
Dr. Uzma Hassan
(MBBS, MPH, MSc)
Assistant Professor community Medicine
Rawal Institute of Heath Sciences, Islamabad
Dated:04-June-2015
2DEFINITION
• Growth refers to increase in the physical size of the body
• Development refers to increase in skills and functions.
• Growth and development are considered together, because the child grows and develops as a whole.
• This includes not only physical aspect but also intellectual, emotional and social aspects.
3
• MCH care is considered with the process of growth and development which is the foundation of human life.
• It is the nature of this process of physical and psychological growth and development of the child which is crucial for health or ill health for life or death.

4Determinants of Growth and Development
1.Genetic Inheritance2.Nutrition3.Age4.Sex5.Physical surroundings6.Psychological factors7.Infections and Parasitosis8.Economic Factors9.Other factors

5Determinants of Growth and Development
9.Other factors:• Birth order of child• Birth spacing• Birth weight in single or multiple
pregnancies• Education of the parents

6NORMAL GROWTH
• Concept of Normality: A “normal child” may be defined as one whose characteristics fall within the range of measurements accepted as normal for the majority of children in the same (or reference) age groups.
• The limits of normal variation: Includes two standard deviations above and below the mean (between the 3rd centile and 97 centile).

7
• For physical development: measurement techniques like kilogram and centimeters.
• Some observations are based on observations: “Mile stones of development”

8Methods of Assessments
• Parameters for Growth: Weight, Height (length in Infants) and head and chest circumferences.
• These characteristics are measured and compared with the reference standards.
• Methods of comparison:
1.Mean (median) values
2.Percentiles or centiles
3.Age-independent indices: Weight for length Weight for height

9
• 1.Mean or Median Values: The median rather than mean is used where possible because of the skewed distribution of most anthropometric measurements.
• A variation of 2 standard deviations from either side of the mean or median is considered as within normal limits.
• 2. Percentiles or centiles: Percentiles are easier to understand than standard deviation.
• Percentiles refer to the percentage of individuals falling below a particular level.
• By definition 3 percentage of children are below the 3rd percentile, and a further 3 percent are above the 97 th percentile.
10

11
• Remaining 94 percent of individuals who fall between these two lines ( btw 3rd and 97 th percentile ) should be regarded s being within the range of “normal”.
• However the 6 percent of children outside this range may not be “abnormal” particularly if their growth is parallel with their centile lines.

12
• 3.Age in-dependent Indices: It is possible to assess growth of a child by the following methods
• Weight for length• Weight for height

13Assessment Of Growth
1.Longitudinal: Measuring the same child at regular intervals. This provides data of child progress.2.Cross sectional: Compare the child’s growth with that of peers. • This involves the comparison of
large number of children of the same age group.
• The range of their measurements( weight, height) is plotted, usually on percentile charts.
14Reference or Standard values
For national and international comparisons and for monitoring , reference or “standard values” of growth are essential:Reference Standards: Harvard or Boston Standards WHO Reference values Indian Standards (for developing
countries)

15
• 1.Harvard (or Bostan) Standards: They have been compiled longitudinally on a large series of children mostly from North Europeon Origin, from 1930 to 1956 and became widely used world wide
• 2.WHO Reference Values: These values replaced Harvard values for weight and height. These were based on cross sectional data assembled by US (NCHS).These are used for children upto 5 years of age

16
• 3.Indian Standards: Indian council during 1956 and 1965 conducted national cross sectional study to establish the much needed reference standards for Indian children.
• As Indian data are based on lower socio economic groups they cannot be representing standards values
17Reference versus Standard Values
• If the values are derived from a population racially different from the population under study, such values should be considered as referenced values only and not standard values.
• Example: It will be absurd to apply the Harvard standards of growth to Eskimos who are racially different

18SURVEILLANCE OF GROWTH AND DEVELOPMENT• Growth Surveillance Purpose:
• To identify those children who are not growing normally.
• Reflects the effectiveness of other components of child care such as nutrition, sanitation and control of infection. It covers the following components:
a. Physical Growth:
1. Weight- for- age
2. Height (length)- for- age
3. Weight- for- height
4. Head and Chest Circumference

19SURVEILLANCE OF GROWTH AND DEVELOPMENT
b. Behavioral Development:1. Motor development2. Personal-Social development3. Adaptive development4. Language development

201.Weight- for- Age
• Measurement of weight and rate of gain of weight are the best single parameters of assessing physical growth.
• Careful repeated measurements are important at intervals:
ideally monthly, from birth to 01 year every 02 months during the second year every 03 months thereafter up to 05 years
of age since this age group is at greatest risk from growth faltering.
• “Growth chart” is the tool for comparison with reference standards.
21Weight gain
• A baby should gain at least 500 gram weight per month in first three months of life. This is the minimum. Children who gain less weight are malnourished.
• First 03 Months of life: 01 kg per month
• First 05 months: doubles the weight
• End of first year: trebles
• Age of 02 years :quadruples During the first year: 07 kg During second year: 2.5 kg Until puberty: 02 Kg Per year
222.Height (length)- for- Age• Height should be taken in the standing
position without foot wear.• Errors in the measurements of young
children may lead to significant errors in the classification of the nutritional status.
• Length of baby at birth :50 cm.• During first year: length increases by 25
cm• During second year: Another 12 cm• During growth spurt Boys: add 20 cm• During growth spurt Girls: add 16 cm

23
• Indian girls: reach 98 % of their height by 16.5 years
• Indian Boys: reach the same stage by 17.75 years.
• Height is a stable measurement of growth as opposed to body weight. Weight reflects present health status of the child, height indicates the events in the past also.
24
• The use of growth (height) centile chart is valuable to study the height curve.
• Low Height for age : This is also called Nutritional “stunting” or “dwarfing”.
• It reflects past or chronic malnutrition.• The cut off point taken for diagnosis
stunting is 90 percent of the united states NCHS height for age values.
• Waterlow recorded the use of 2SD below median reference as the cut off point.

253. Weight- for- Height
• Height and weight are interrelated. Weight for height helps to determine whether the child is within the range of “normal” weight for his age.
• Low weight for height : This is also known as “nutritional wasting” or “emaciation” (acute malnutrition). It is associated with high risk of mortality and morbidity. Child less than 70 percent of the expected weight for height is classed as “severely wasted”.
• Weight Records : Weight chart is an important tool in the prevention of malnutrition.

264. Head and Chest Circumference
• At birth the head circumference is 34 cm.
• It is about 02 cm more than the chest circumference.
• By 06 To 09 months: the two measurements become equal.
• After that: chest circumference overtakes the head circumference.
• In severely malnourished children this over taking may be delayed by 03-04 years due to poor development of thoracic cage

27
• Besides increase in height and weight, the term Growth also includes various physiological events which occur at predictable periods such as:
dentition ossification of bones secondary sexual characteristics.

28BEHAVIOURAL DEVELOPMENT
• It is assessed in four fields :1. Motor development2. Personal-Social development3. Adaptive development4. Language development
29
• The developmental landmarks or mile stones of development: provide an estimate of the time when the child can be expected to attain certain skills or points in development.
• When a child takes longer time to cross the mile stones, the possibility of his being mentally handicapped should not be over looked.
30THE GROWTH CHART
• Growth chart” or “Road to health chart”:
• First designed by David Morley and later modified by WHO, is a visible display of child physical growth and development.
• It is designed for longitudinal follow up (growth monitoring ) of child, so that changes over time can be interpreted.
• This offers a simple and inexpensive way of monitoring weight gain and child health over time.
31
• Weight for Age chart: In this chart the height of the child is not considered. Because the weight of a child is the most sensitive measure of growth, and any deviation from normal can be detected easily by comparison with Reference curves.
• A Child can lose weight but not height

1.WHO Child growth Standards
• The new WHO standards depict normal early childhood growth under optimal environmental conditions and can be used to assess children everywhere, regardless of ethnicity, socio economic status and type of feeding
32

33WHO Child growth Standards
Reference curves The upper reference curve: represents
the median (50 percentile) for boys (slightly higher than for girls)
Lower reference curve: the 3rd percentile for girls (slightly lower than that of boys).
Chart can be used for both genders.
Road- to- Health: The space between the two growth curves (weight channel).
This will include the zone of normality for most populations i.e the weights of 95 percent of normal healthy children used as a reference fall within this area.

34WHO Growth Chart
It is the direction of growth that is more important than the position of dots on the line.
Flattening or falling of the child’s weight curve signals growth failure, which is the earliest sign of “Protein-energy malnutrition” and may precede clinical signs by weeks or even months.
The objective in child care is to keep the child above 3rd percentile.
35GROWTH CHART
• Reference curves: For purpose of comparison, reference curves are provided in growth chart. These show the limits of normal growth.
• Normally 50 th percentile corresponds to the reference median.
• It gives the value of 50 th child of a group of 100 when they are arranged in ascending or descending order.
• Here equal number of children will have measurements smaller or larger than the 50 th value.

36Mother and Child protection card• This card provides space for:• Recording the family identification
and registration, birth record, pregnancy record, institutional identification, care during pregnancy, preparation for delivery, immunization details, breast feeding , supplementary feeding, miles stones of the baby, birth spacing and reasons for special care.

2.Growth Chart used in India
• India has adopted the new WHO Child growth standards (2006) in feb 2009 for monitoring the young children growth and development.
• These standards are available for both girls and boys below 5 years of age.
• With these new standards the child care workers will know when the nutrition and care needs of the child is being compromised.
37

• The growth chart shows normal zone of weight for age, under nutrition (below 2- SD) and severely underweight zone (below 3- SD) .
38

39Growth Chart in developing countries• It has four reference curves.• The top most curve corresponds to 80
percent of the median (50th percentile) of the WHO reference standard
• Lower lines represents 70 percent, 60 percent and 50 percent of that standard.
• 80 percent median weight is approximately equal to 2 standard deviation below the median ( or mean ) which is the conventional limit of the “normal range”.
• The purpose of these lines is to show the degree of malnutrition.

40
• Degrees Of Malnutrition : First degree malnutrition: Mild
( Between 70 to 80% ) Second Degree malnutrition: Moderate
(Between 60-70 % ) Third Degree malnutrition: Severe
( Below 60 % ) Fourth Degree malnutrition Below 50 %

41Information on Growth Chart
1.Identification and registration2.Birth date and weight3.Chronological age4.History of sibling health5.Immunization procedure6.Introduction of supplementary food7.Episodes of sickness8.Child spacing9.Reasons for special care
42USES OF GROWTH CHART
1.Growth Monitoring2.Diagnostic tool3.Planning and Policy making4.Educational tool5.Tool for action6.Evaluation7.Tool for teaching
43Alternative methods of Growth Monitoring
• Height for age• Weight for height• Arm CircumferenceThe last two are independent of age and are useful when age is not known.
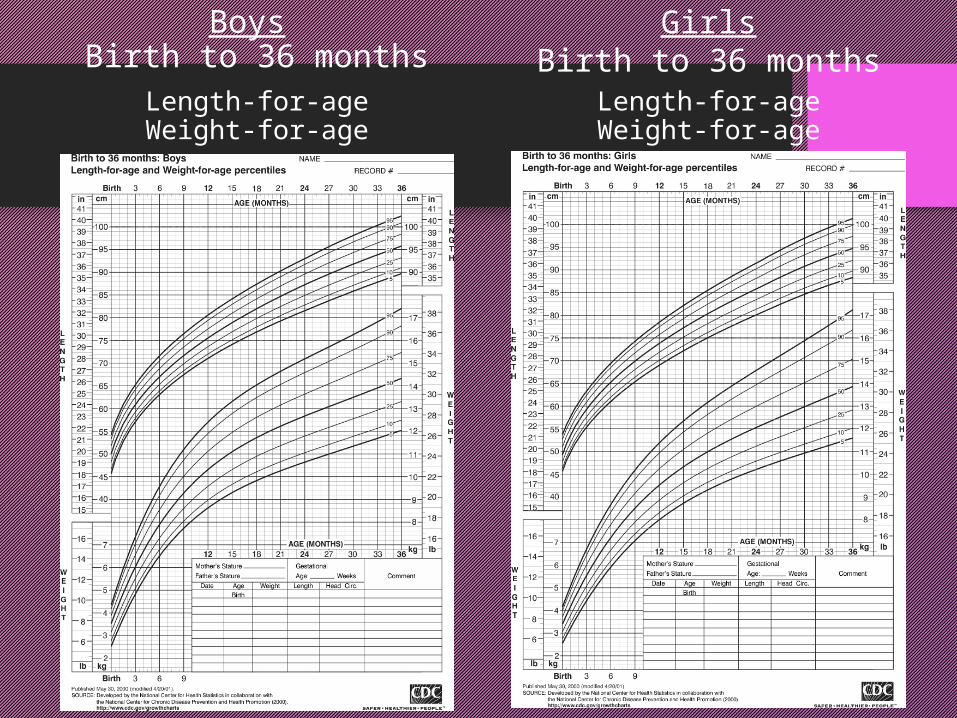
Boys Birth to 36 months
Length-for-ageWeight-for-age
GirlsBirth to 36 months
Length-for-ageWeight-for-age

Boys 2 to 20 YearsLength-for-ageWeight-for-age
Girls2 to 20 YearsLength-for-ageWeight-for-age

46
THANKS


