Growth and profit drivers in non-life R/I Accomplishing profitable growth in a challenging environment Jürgen Gräber, Member of the Executive Board/COO non-life 15th International Investors' Day 2012 London, 18 October 2012
Transcript
Growth and profit drivers in non-life R/IAccomplishing profitable growth in a challenging environment
Jürgen Gräber, Member of the Executive Board/COO non-life
15th International Investors' Day 2012London, 18 October 2012
Introduction Target markets Specialty lines Global R/I Conclusion
Growth and profit drivers in non-life reinsurance
1. Introduction
2. Growth and profit drivers by non-life divisions
a) Selected Target Market - North America Business
b) Specialty Lines example - Agency Business
c) Global Reinsurance examples – Facultative, Agricultural and ReTakaful Business
3. Conclusion
Growth and profit drivers in non-life R/I
Agenda
Recapturing Investors' Day 2010 and 2011: We remain on track
� 2010 – 2012F est. GWP growth of our Chinese business: 22%
� 2011 – 2012F est. GWP growth of our Specialty Lines: 12%
Introduction Target markets Specialty lines Global R/I Conclusion
Introduction
� World real GDP growth expected to slow down from 4.0% (2011) to 3.5% (2012)
� Real GPD growth of emerging and developing economies expected to slow down
from 6.2% (2011) to 5.6% (2012)
� Recession in Europe is likely to continue through 2013
� Uncertainty about the economic situation in Europe remains global key risk
� Nonetheless, non-life insurance premium increased during 2011 by 1.9%
� Demand for top-rated reinsurance companies remains high
Growth and profit drivers in non-life R/I
Sources: Towers Watson – Global Markets Overview, July 2012, International Monetary Fund - World Economic Outlook April 2012,
International Monetary Fund – World Economic Outlook Update July 2012, The World Bank – Global Economic Prospects January 2012,McKinsey Global Institute – Mapping global capital markets 2011
HR well positioned - high performance in a challenging economic environment
1
Introduction
Introduction Target markets Specialty lines Global R/I Conclusion
Non-life insurance market premium development
Growth and profit drivers in non-life R/I
Emerging markets lead the way
Source: Swiss Re Sigma 3/2012
Non-life insurance premium in bn. USD 2011 change vs. 2010
North America 736 -1.1%
Latin America and Caribbean 89 10.7%
Western Europe 642 0.7%
Central and Eastern Europe 72 6.7%
Japan and new advanced Asian economies 208 5.0%
South and East Asia 119 10.2%
Middle East and Central Asia 30 8.9%
Africa 22 3.3%
Oceania 53 8.1%
World 1,971 1.9%
Advanced markets 1,639 0.5%
Emerging markets 332 9.1%
2
Introduction
Introduction Target markets Specialty lines Global R/I Conclusion
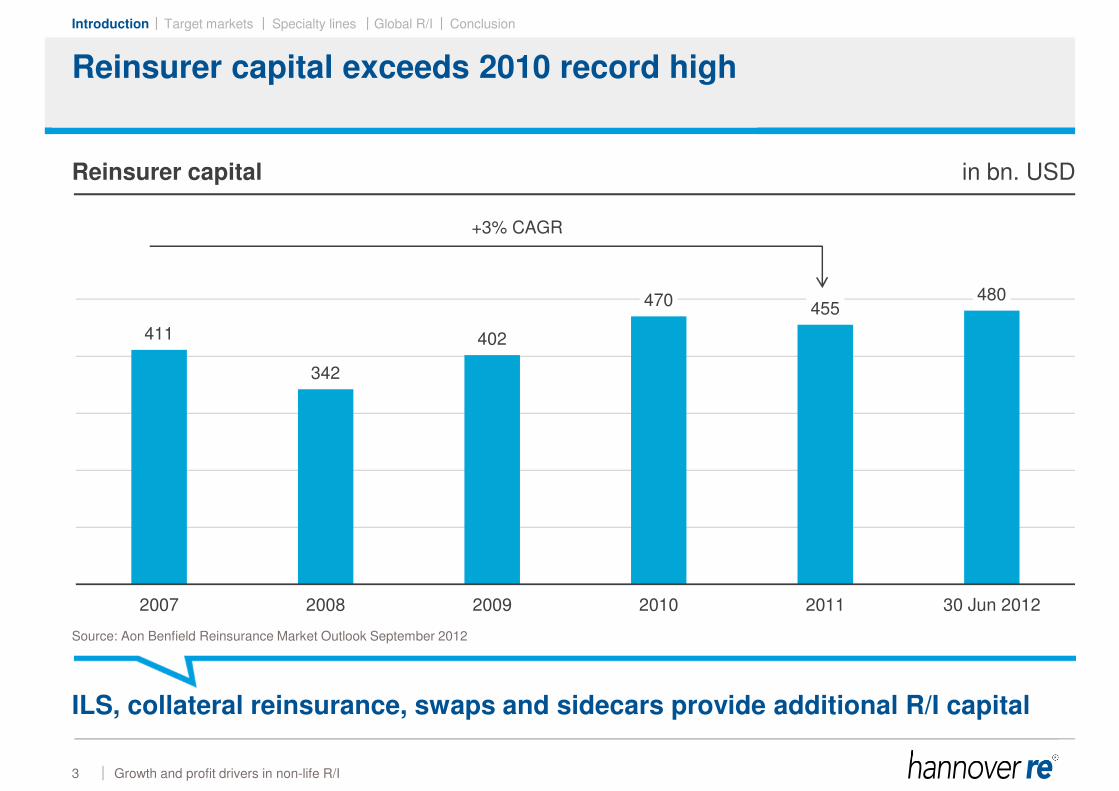
411
342
402
470455
480
2007 2008 2009 2010 2011 30 Jun 2012
Reinsurer capital exceeds 2010 record high
Growth and profit drivers in non-life R/I
Reinsurer capital in bn. USD
Source: Aon Benfield Reinsurance Market Outlook September 2012
ILS, collateral reinsurance, swaps and sidecars provide additional R/I capital
+3% CAGR
3
Introduction
Introduction Target markets Specialty lines Global R/I Conclusion
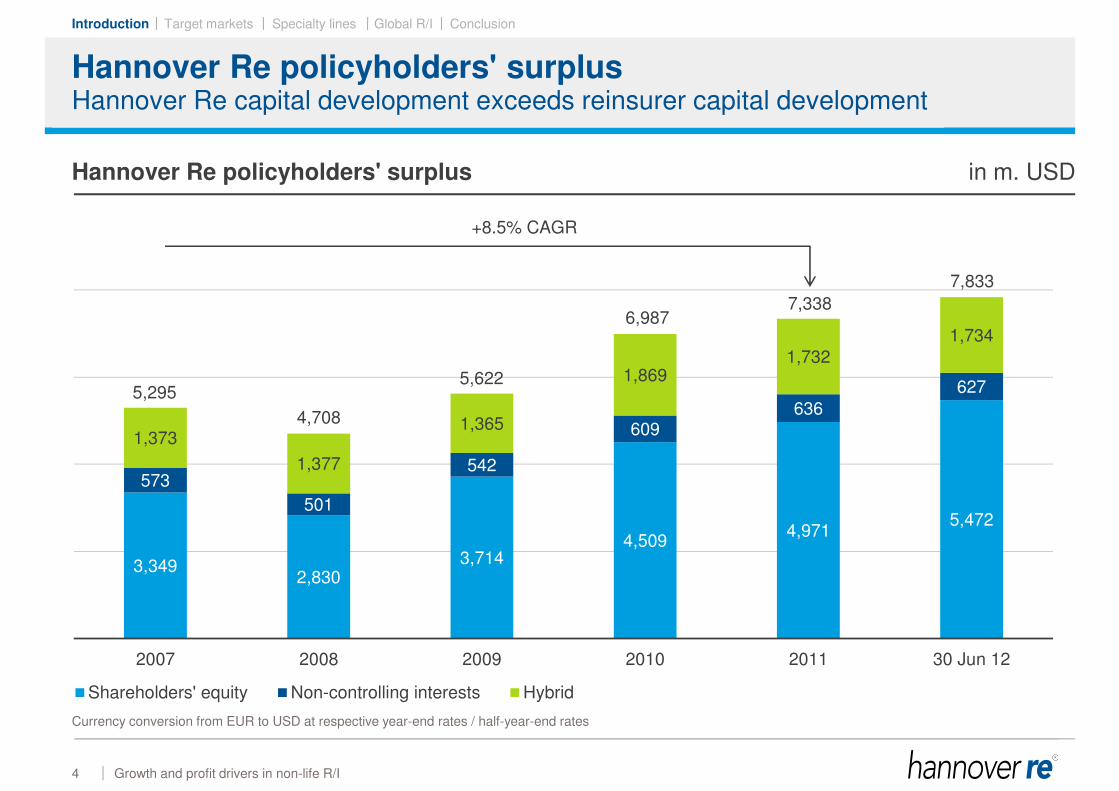
Hannover Re policyholders' surplus
Growth and profit drivers in non-life R/I
Hannover Re policyholders' surplus in m. USD
Hannover Re capital development exceeds reinsurer capital development
Inforce premium as at 1 January ≠ U/Y perspective!
12
Target markets
Introduction Target markets Specialty lines Global R/I Conclusion
North America Business
� The US non-life insurance market seems to be slowly hardening and will continue
to maintain this gradual momentum, barring the occurrence of any catastrophes
(we noticed a shift of business from the admitted to the surplus lines market)
� Although there is no firm hardening in the reinsurance market yet,
the reinsurance market is technically oriented and unwilling to compromise on
technical prices
� Selected, individual opportunities are presenting themselves offering the
chance to grow
Growth and profit drivers in non-life R/I
The reinsurance perspective
Strong brand awareness and efficient CRM further important drivers of growth
13
Target markets
Introduction Target markets Specialty lines Global R/I Conclusion
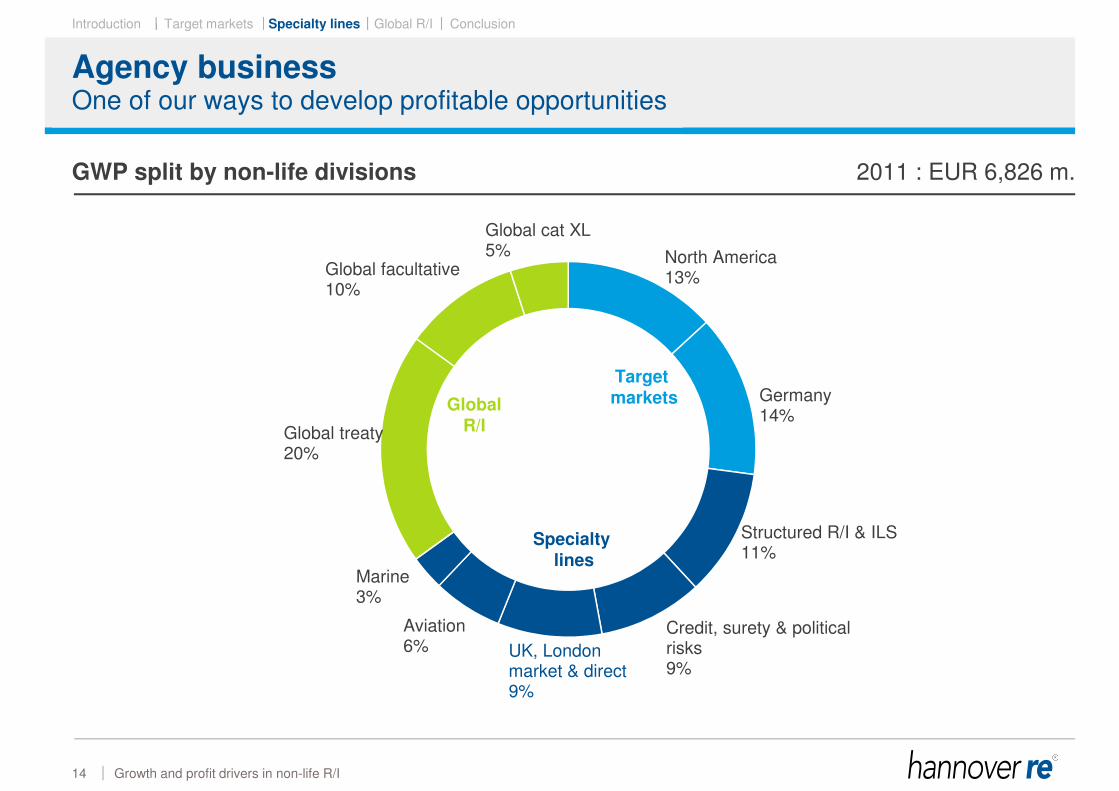
Agency business
North America13%
Germany14%
Structured R/I & ILS11%
Credit, surety & political risks9%
UK, London market & direct9%
Aviation6%
Marine3%
Global treaty20%
Global facultative10%
Global cat XL5%
Target markets
Specialty lines
Global R/I
Growth and profit drivers in non-life R/I
GWP split by non-life divisions 2011 : EUR 6,826 m.
One of our ways to develop profitable opportunities
14
Specialty lines
Introduction Target markets Specialty lines Global R/I Conclusion
Agency business
� Based on our strategy we underwrite direct insurance in selected markets in
addition to our core reinsurance business
� Emphasis lies on underwriting profitable business which we cannot access as
reinsurer
� On the one hand this refers to large risks that are underwritten on a co-insurance
basis similar to our facultative reinsurance business. By using our primary
insurance companies we can be independent of the proportion of facultative risks
our reinsurance customers are willing to cede
� On the other hand we conduct business via agents. In general, this would be
niche business such as mining or medical liability
� Especially in our non-life segment we expect our direct insurance business to
grow faster than our core reinsurance business
Growth and profit drivers in non-life R/I
Gaining access to profitable niche business
15
Specialty lines
Introduction Target markets Specialty lines Global R/I Conclusion
Agency business
� In general, we select partners who can conduct the main tasks of the direct
insurance administration themselves i.e. issuing policies, claims handling or sales
� Partners are direct insurance companies or in the case of co-insurance,
agents or brokers
� We underwrite exclusively to retain the business net within the Hannover Re
group (contrary to fee-income-model)
Growth and profit drivers in non-life R/I
Characteristics of our direct insurance activities
16
Specialty lines
Introduction Target markets Specialty lines Global R/I Conclusion
Agency business
Growth and profit drivers in non-life R/I
Gross written premium* FY in m. EUR
Gross written premium development
135
163
280
431
484
2007 2008 2009 2010 2011
* Agency business of Hannover Re's primary carriers
17
Specialty lines
Introduction Target markets Specialty lines Global R/I Conclusion
Agency Business
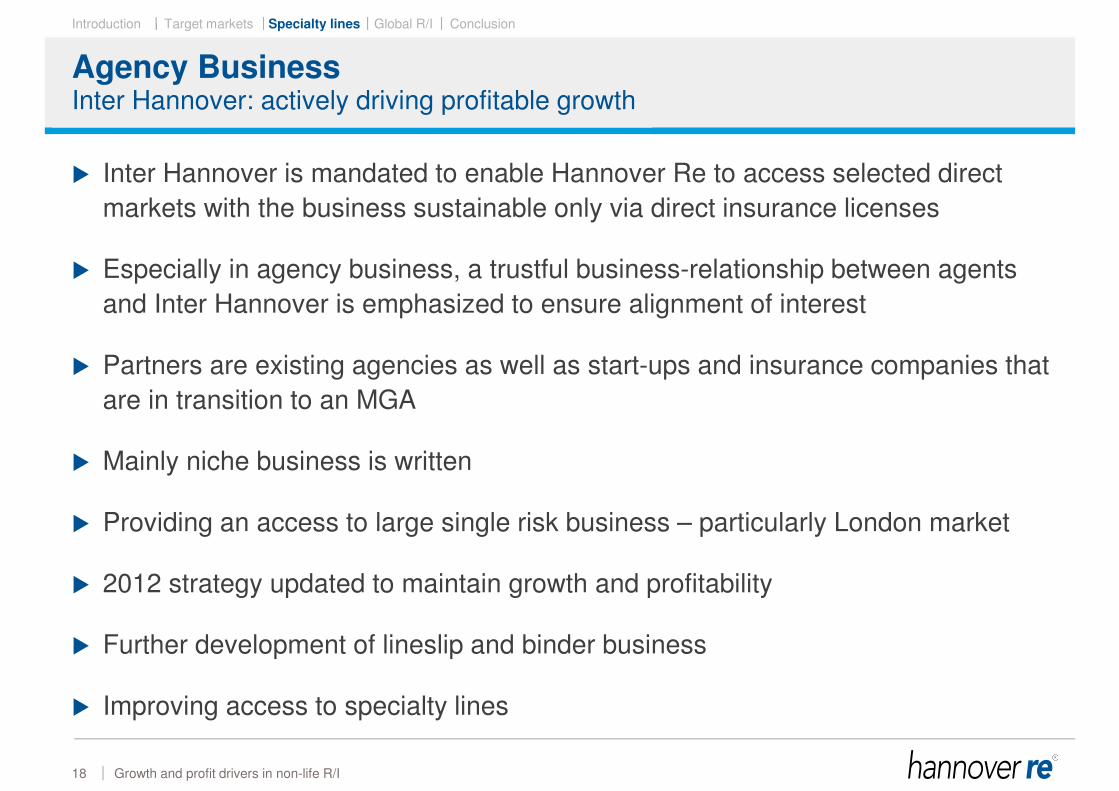
� Inter Hannover is mandated to enable Hannover Re to access selected direct
markets with the business sustainable only via direct insurance licenses
� Especially in agency business, a trustful business-relationship between agents
and Inter Hannover is emphasized to ensure alignment of interest
� Partners are existing agencies as well as start-ups and insurance companies that
are in transition to an MGA
� Mainly niche business is written
� Providing an access to large single risk business – particularly London market
� 2012 strategy updated to maintain growth and profitability
� Further development of lineslip and binder business
� Improving access to specialty lines
Growth and profit drivers in non-life R/I
Inter Hannover: actively driving profitable growth
18
Specialty lines
Introduction Target markets Specialty lines Global R/I Conclusion
Facultative business, agricultural business and ReTakaful
Growth and profit drivers in non-life R/I
GWP split by non-life divisions 2011: EUR 6,826 m.
Examples from our global reinsurance division
19
North America13%
Germany14%
Structured R/I & ILS11%
Credit, surety & political risks9%
UK, London market & direct9%
Aviation6%
Marine3%
Global treaty20%
Global facultative10%
Global cat XL5%
Target markets
Specialty lines
Global R/I
Global R/I
Introduction Target markets Specialty lines Global R/I Conclusion
Facultative business
Growth and profit drivers in non-life R/I
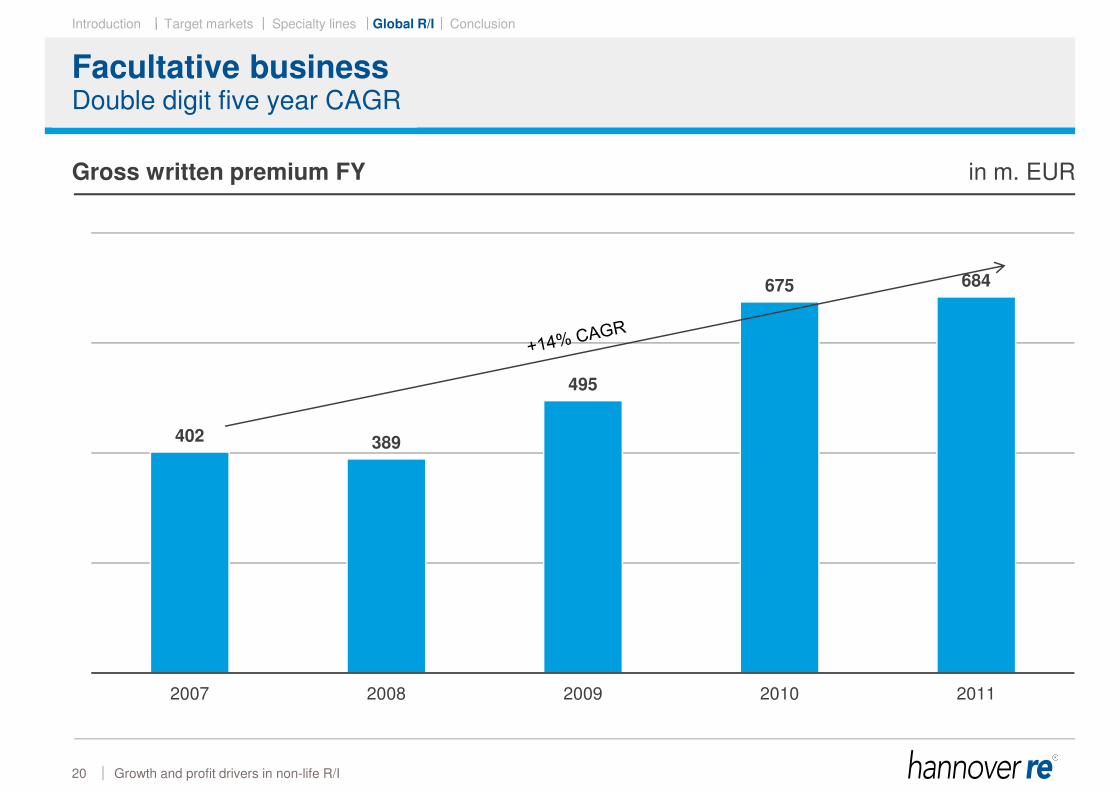
Gross written premium FY in m. EUR
Double digit five year CAGR
402 389
495
675 684
2007 2008 2009 2010 2011
20
Global R/I
Introduction Target markets Specialty lines Global R/I Conclusion
Facultative business
Growth and profit drivers in non-life R/I
Facultative split by lob Facultative split by region
Well diversified by line of business and region
2011 gross written premium: EUR 683 m.
21
Liability36%
Fire Property34%
Marine10%
Engineering8%
Motor7%
Personal Accident3%
Other fin. losses 2%
Other Property0%
United Kingdom32%
Europe(ex UK)21%
North America19%
Australasia12%
Others16%
Global R/I
Introduction Target markets Specialty lines Global R/I Conclusion
Facultative business
� CAGR of 14% over the past 5 years
� Positive technical results of EUR 52 m. on average in the last ten years
� Low costs with max. 7.5 % on gross premium
• (ca. 5% during hard market and ca. 10% during soft market, market average between
12% and 15%)
� Further growth for 2013 expected in the low double digit percentage range
� 120 experienced underwriters worldwide and 6 centres of competence – i.e. one
of the leaders in IDI (inherent defect insurance) and one of the leaders in sports &
entertainment reinsurance
� Organic growth is taking place in Asia / CIS and for engineering single risk
business in Europe
Growth and profit drivers in non-life R/I
Global expert knowledge ensures sustainable competitive advantage
Special expertise & presence worldwide i.e. leading R/I for the mining industry
22
Global R/I
Introduction Target markets Specialty lines Global R/I Conclusion
Agricultural business
Market premium development FY in bn. RMB � Agricultural insurance under
public private partnership
� Constantly growing market
� Hannover Re market share is
currently below average
� Our market share will be
increased by
• development of new products
• provision of high quality service to
Hannover Re customers
� AIR MPCI model launched for
China which will drive
awareness for NatCat risks
throughout the agricultural
insurance market
Growth and profit drivers in non-life R/I
Increasing our share in the growing market in China
5,3
11,1
13,4 13,6
17,4
0,41,3
2,0 2,02,6
2007 2008 2009 2010 2011
Premium R/I premiumSources:
Introduction to Agricultural Insurance in China, April 2012, Aon Benfield;China Statistical Yearbook 2007 – 2011; China Insurance Regulatory Commission
23
Global R/I
Introduction Target markets Specialty lines Global R/I Conclusion
Agricultural business
Growth and profit drivers in non-life R/I
Turkey market premium FY in m. TL
Over-proportional growth due to high market presence
0
100
200
300
400
500
2007 2008 2009 2010 2011
Brazil market premium FY in m. BRL
Our agricultural insurance market share in these countries is significant
Sources: Turkish Agriculture Insurance Pool (TARSIM); Ses-Susep, www.susep.gov.br
0
100
200
300
400
500
600
700
2007 2008 2009 2010 2011
Premium RI Premium
24
Global R/I
Introduction Target markets Specialty lines Global R/I Conclusion
Hannover ReTakaful
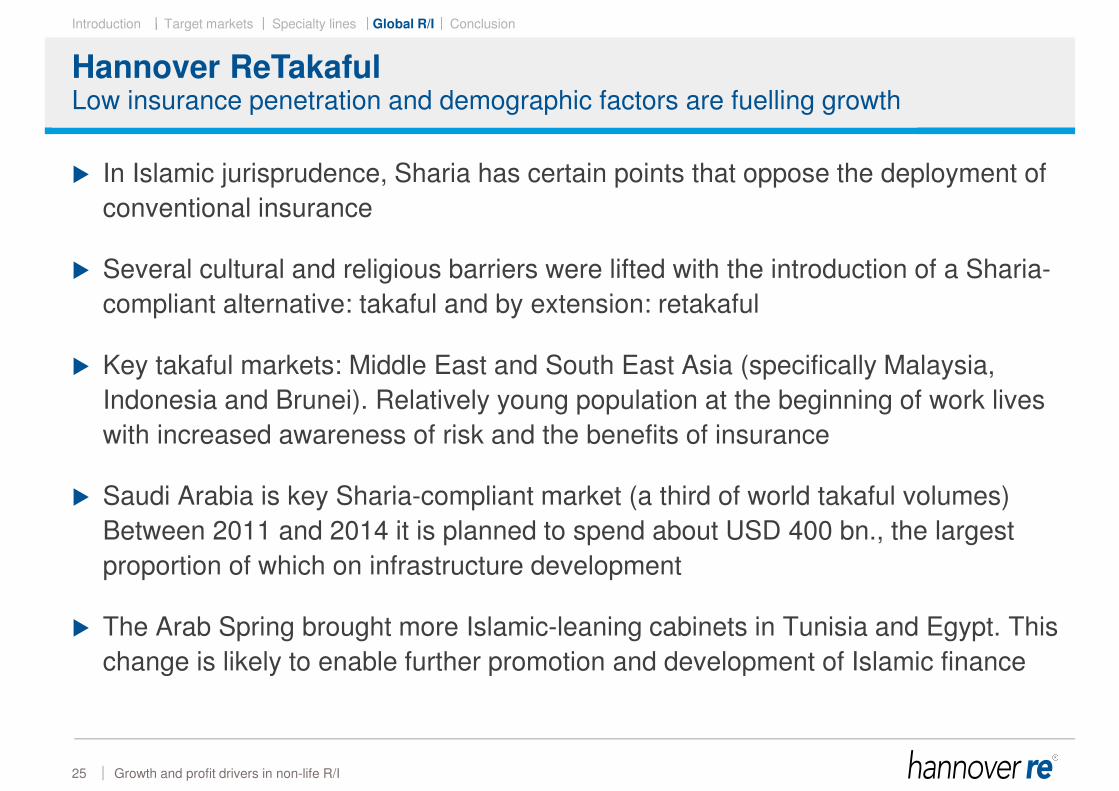
� In Islamic jurisprudence, Sharia has certain points that oppose the deployment of
conventional insurance
� Several cultural and religious barriers were lifted with the introduction of a Sharia-
compliant alternative: takaful and by extension: retakaful
� Key takaful markets: Middle East and South East Asia (specifically Malaysia,
Indonesia and Brunei). Relatively young population at the beginning of work lives
with increased awareness of risk and the benefits of insurance
� Saudi Arabia is key Sharia-compliant market (a third of world takaful volumes)
Between 2011 and 2014 it is planned to spend about USD 400 bn., the largest
proportion of which on infrastructure development
� The Arab Spring brought more Islamic-leaning cabinets in Tunisia and Egypt. This
change is likely to enable further promotion and development of Islamic finance
Growth and profit drivers in non-life R/I
Low insurance penetration and demographic factors are fuelling growth
25
Global R/I
Introduction Target markets Specialty lines Global R/I Conclusion
Hannover ReTakaful
Growth and profit drivers in non-life R/I
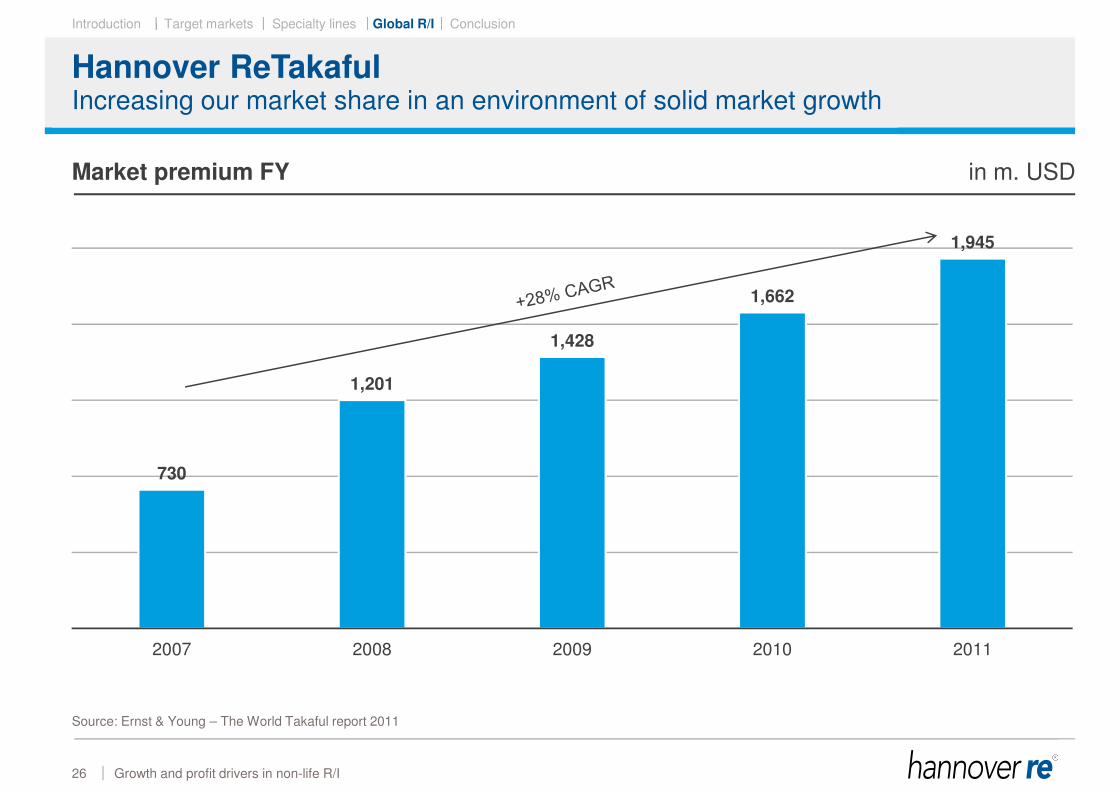
Market premium FY in m. USD
Increasing our market share in an environment of solid market growth
730
1,201
1,428
1,662
1,945
2007 2008 2009 2010 2011
Source: Ernst & Young – The World Takaful report 2011
26
Global R/I
Introduction Target markets Specialty lines Global R/I Conclusion
Hannover ReTakaful
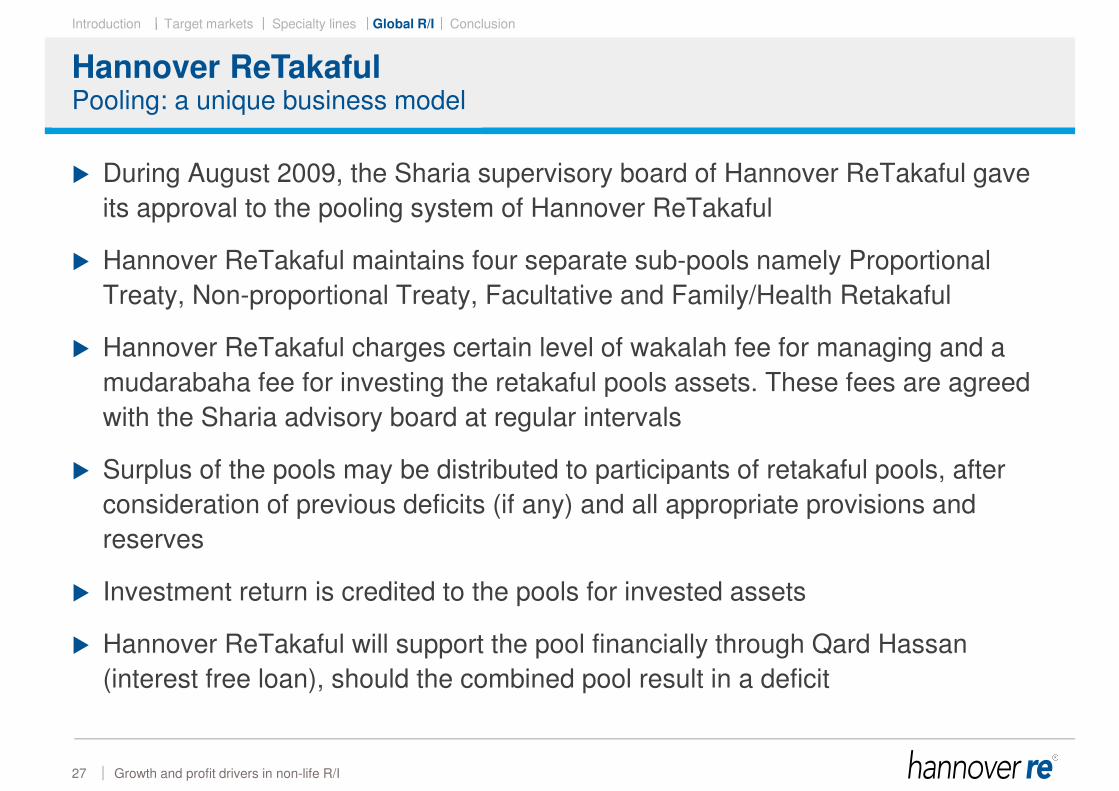
� During August 2009, the Sharia supervisory board of Hannover ReTakaful gave
its approval to the pooling system of Hannover ReTakaful
� Hannover ReTakaful maintains four separate sub-pools namely Proportional
Treaty, Non-proportional Treaty, Facultative and Family/Health Retakaful
� Hannover ReTakaful charges certain level of wakalah fee for managing and a
mudarabaha fee for investing the retakaful pools assets. These fees are agreed
with the Sharia advisory board at regular intervals
� Surplus of the pools may be distributed to participants of retakaful pools, after
consideration of previous deficits (if any) and all appropriate provisions and
reserves
� Investment return is credited to the pools for invested assets
� Hannover ReTakaful will support the pool financially through Qard Hassan
(interest free loan), should the combined pool result in a deficit
Growth and profit drivers in non-life R/I
Pooling: a unique business model
27
Global R/I
Introduction Target markets Specialty lines Global R/I Conclusion
Conclusion
� Hannover Re has continuously grown above market average as a result of
selective underwriting
� Hannover Re is strategically very well positioned, particularly with regard to
• Maintaining substantial expert knowledge for facultative underwriting
• Opportunities arising out of emerging markets (CRM approach)
• Utilising a unique franchise model in the Sharia-compliant market
Growth and profit drivers in non-life R/I
Strategically well positioned to meet a dynamic market environment
28
Conclusion
Introduction Target markets Specialty lines Global R/I Conclusion
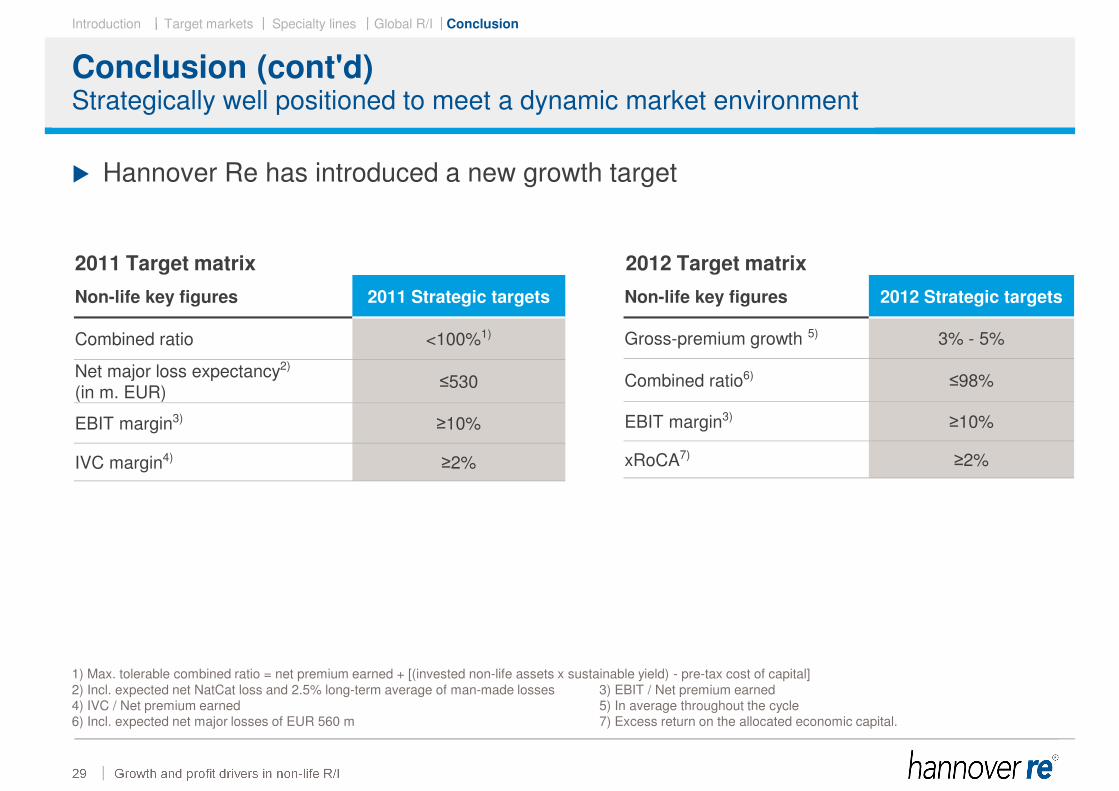
Conclusion (cont'd)
29
� Hannover Re has introduced a new growth target
Growth and profit drivers in non-life R/I
Strategically well positioned to meet a dynamic market environment
Non-life key figures 2011 Strategic targets
Combined ratio <100%1)
Net major loss expectancy2)
(in m. EUR)≤530
EBIT margin3)≥10%
IVC margin4)≥2%
Non-life key figures 2012 Strategic targets
Gross-premium growth 5) 3% - 5%
Combined ratio6)≤98%
EBIT margin3)≥10%
xRoCA7)≥2%
2011 Target matrix 2012 Target matrix
1) Max. tolerable combined ratio = net premium earned + [(invested non-life assets x sustainable yield) - pre-tax cost of capital]
2) Incl. expected net NatCat loss and 2.5% long-term average of man-made losses 3) EBIT / Net premium earned4) IVC / Net premium earned 5) In average throughout the cycle6) Incl. expected net major losses of EUR 560 m 7) Excess return on the allocated economic capital.
Conclusion
Introduction Target markets Specialty lines Global R/I Conclusion
Disclaimer
This presentation does not address the investment objectives or financial situation of any particular person or
legal entity. Investors should seek independent professional advice and perform their own analysis regarding
the appropriateness of investing in any of our securities.
While Hannover Re has endeavoured to include in this presentation information it believes to be reliable,
complete and up-to-date, the company does not make any representation or warranty, express or implied,
as to the accuracy, completeness or updated status of such information.
Some of the statements in this presentation may be forward-looking statements or statements of future
expectations based on currently available information. Such statements naturally are subject to risks and
uncertainties. Factors such as the development of general economic conditions, future market conditions,
unusual catastrophic loss events, changes in the capital markets and other circumstances may cause the
actual events or results to be materially different from those anticipated by such statements.
This presentation serves information purposes only and does not constitute or form part of an offer
or solicitation to acquire, subscribe to or dispose of, any of the securities of Hannover Re.