Growth Hormone Replacement Therapy: Clinical and Economic Implications for Managed Care Pinchas Cohen, MD Professor and Chief of Endocrinology Mattel Children’s Hospital David Geffen School of Medicine University of California, Los Angeles
Transcript
Growth Hormone Replacement Therapy: Clinical and Economic Implications for Managed Care
Pinchas Cohen, MDProfessor and Chief of Endocrinology
Mattel Children’s HospitalDavid Geffen School of Medicine
University of California, Los Angeles
Talking Points
• Review clinical and economic data on recombinant• Review clinical and economic data on recombinant human growth hormone (rhGH) therapy for adults and children with growth hormone deficiency (GHD) and
l d di d i l direlated disorders, including:– Outcomes– CostCost
Growth Hormone Deficiency in AdulthoodAdulthood
• Approximately 50 000 adults in the US have GHD• Approximately 50,000 adults in the US have GHD– 6,000 new cases are reported each year, including GHD children
who transition to GHD as an adult
• Categories based on the time GHD became manifest– Adult-onset (acquired) GHD: caused by trauma, central nervous
system infection, hypothalamic or pituitary tumors, infiltrative or y yp p ygranulomatous disease, cranial irradiation, surgery, etc.
– Pediatric Organic GHD: caused by genetic or acquired defects which continue into adulthood
– Child-onset idiopathic: childhood GHD of unknown cause that may or may not continue into adulthood
Adult Growth Hormone Deficiency (AGHD). The Human Growth Foundation Web site. Available at: http://www.hgfound.org/res_aghd.explained.html#aghdexplained3. Accessed October 12, 2010.
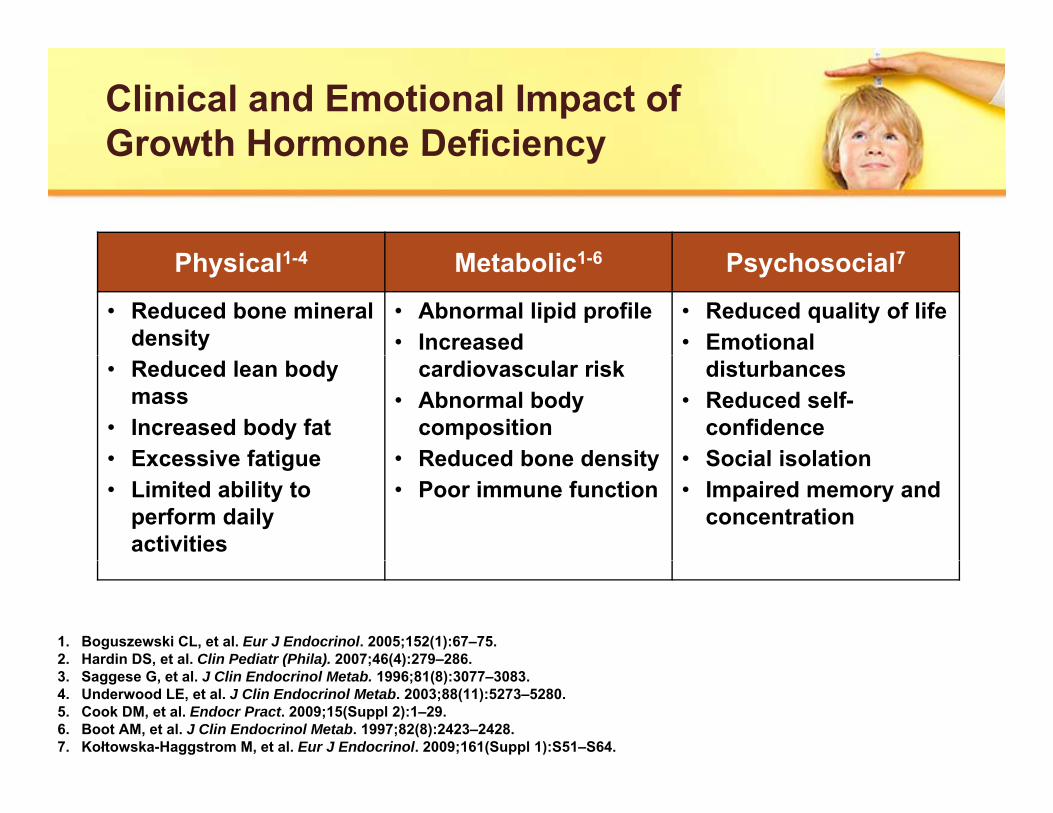
Clinical and Emotional Impact of Growth Hormone DeficiencyGrowth Hormone Deficiency
Ph i l1 4 M b li 1 6 P h i l7Physical1-4 Metabolic1-6 Psychosocial7
• Reduced bone mineral density
• Abnormal lipid profile• Increased
• Reduced quality of life• Emotional
• Reduced lean body mass
• Increased body fat• Excessive fatigue
cardiovascular risk• Abnormal body
composition• Reduced bone density
disturbances• Reduced self-
confidence• Social isolation• Excessive fatigue
• Limited ability to perform daily activities
• Reduced bone density• Poor immune function
• Social isolation• Impaired memory and
concentration
1. Boguszewski CL, et al. Eur J Endocrinol. 2005;152(1):67–75.2. Hardin DS, et al. Clin Pediatr (Phila). 2007;46(4):279–286.2. Hardin DS, et al. Clin Pediatr (Phila). 2007;46(4):279 286.3. Saggese G, et al. J Clin Endocrinol Metab. 1996;81(8):3077–3083.4. Underwood LE, et al. J Clin Endocrinol Metab. 2003;88(11):5273–5280.5. Cook DM, et al. Endocr Pract. 2009;15(Suppl 2):1–29.6. Boot AM, et al. J Clin Endocrinol Metab. 1997;82(8):2423–2428.7. Kołtowska-Haggstrom M, et al. Eur J Endocrinol. 2009;161(Suppl 1):S51–S64.
GH-Deficient Adults Are at Greater Risk for CVD and Other Chronic Conditionsfor CVD and Other Chronic Conditions
P E id f M bidiParameter Evidence of Morbidity
Bone density Three-fold increase in bone fracture frequency1
Atherosclerosis Over 20% increased carotid intima thickness2
Inflammation Two-fold increase in inflammatory markers CRP Inflammation and IL-63
Body composition Greater adiposity, lower muscle strength4
Quality of life Impaired quality of life compared with the general population5
CVD=cardiovascular disease1. Rosen T, et al. Eur J Endocrinol. 1997;137(3):240–245.2. Sen F, et al. Eur J Endocrinol. 2008;158(5):615–622.3. Leonsson M, et al. Clin Endocrinol (Oxf). 2003;59(2):242–250.4. Sartorio A, et al. Arch Med Res. 2008;39(1):78–83.5. Blum WF, et al. J Clin Endocrinol Metab. 2003;88(9):4158–4167.
CVD cardiovascular diseaseCRP=C-reactive protein
IL=interluekin
Total Cholesterol in GHD Patients Is Above Guideline-Recommended LevelsAbove Guideline Recommended Levels
Elevated Cholesterol Adds to the CVD Risk in Adult GHD
220230240
g/dL
)1
190200210220
este
rol (
mg
ATP III Total Cholesterol Target (200 mg/dL)2
160170180190
Tota
l Cho
l
150160
<20 20 to 29 30 to 39 40 to 49 40 to 59 ≥60
A ( )Age (years)
1. Abs R, et al. Eur J Endocrinol. 2006;155(1):79–90.2. ATP III Guidelines At-A-Glance Quick Reference. National Heart Lung and Blood Institute Web site.
Available at: http://www.nhlbi.nih.gov/guidelines/cholesterol/atglance.pdf. Accessed October 12, 2010.
GH Therapy Has Significant Beneficial Effects on Cholesterol Blood Pressure
Factors Treatment Weighted mean change Global Effect Size
Effects on Cholesterol, Blood Pressure
Factors g g(GH-placebo) (95% CI)GH Placebo
Lean B mass 473 474 2.82 kgFat mass 352 345 3.05 kgBMI 134 134 0 12 kg/m2BMI 134 134 -0.12 kg/m2
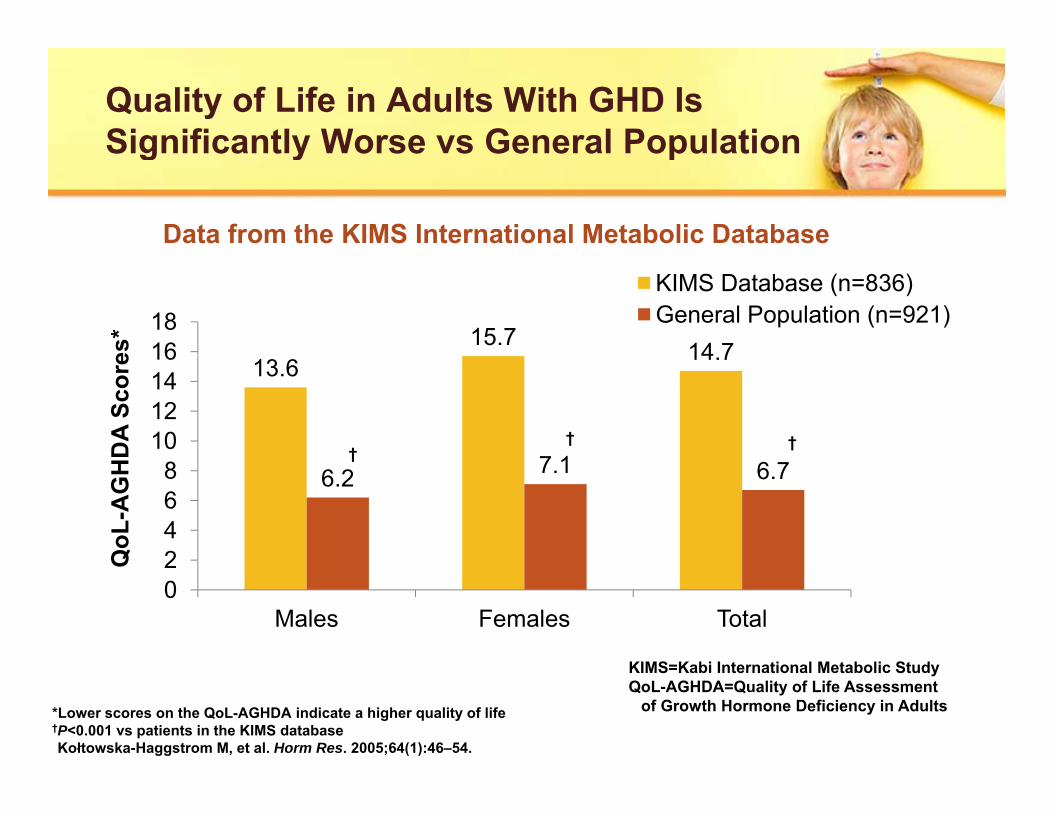
Kołtowska-Haggstrom M, et al. Eur J Endocrinol. 2006;155(1):109–119.
KIMS=Kabi International Metabolic Study
Very Low BMD in Adults With Severe GHDWith Severe GHD
0 5 0 5-0.5
00
-0.3-0.50
n=35 n=17 n=41
Lumbar Spine Femoral Neck
n=35n=17 n=41
-0.5 -0.5
-2-1.5
-1
1 86*-2-1.5
-1
T-sc
ore
T-sc
ore
-1.99*-2.5
2
Control Non-GHD Severe GHD
-1.86*-2.5
-2
Control Non-GHD Severe GHD
Mean GH (/L) 40.7, 28.3, and 0.9 for control, non-GHD, and severe GHD, respectively
Colao A, et al. J Clin Endocrinol Metab. 1999;84(6):1919–1924.*P<0.01
Bone Mineral Density in GHD Adults Increases With GH TherapyIncreases With GH Therapy
Effects of 10 Years of GH Therapy in GHD 87 Adults
0.130.1
0.2
T-sc
ore
*
*
-0.18 -0.210 2
-0.02
0 2
-0.1
0
Bod
y B
MD
T
*p<0.001 vs baseline*
*
-0.28
-0.2
-0.4
-0.3
-0.2
Tota
l B
p<0.001 vs baseline
Baseline 1 Year 3 Years 5 Years 7 Years 10 YearsMean GH dose (mg/d) 0.98 0.66 0.53 0.50 0.48 0.47
Gotherstrom G, et al. Eur J Endocrinol. 2007;156(1):55–64.
BMD=bone mineral density
12 Months of GH Therapy Reduced the Need for Health Carethe Need for Health Care
Data from the KIMS International Metabolic Database
Baseline 12 Months
Sick leave days (number in previous 6 months) 9.5 3.8*
Hospital days (number in previous 6 months) 1.7 0.6*
Doctor visits (number in previous 6 months) 2.1 1.4†(number in previous 6 months)
Leisure time physical activity (visual analog scale score) 40.8 51.1‡
Satisfaction with leisure time activities 41 6 48 8‡(visual analog scale score) 41.6 48.8‡
Need for assistance with daily activities (%) 21 16*
• n=150 and 154 adult men and women with GHD, respectively.
Hernberg-Ståhl E, et al. J Clin Endocrinol Metab. 2001, 86(11):5277–5281.
, p y• Mean ages: Men 51 years; women: 49 years.• None of the patients had received prior GH therapy in adulthood. • GH dose ranged from 0.042 mg/kg/wk to 0.083 mg/kg/wk.
*P<0.05 vs baseline†P<0.01 vs baseline‡P<0.001 vs baseline
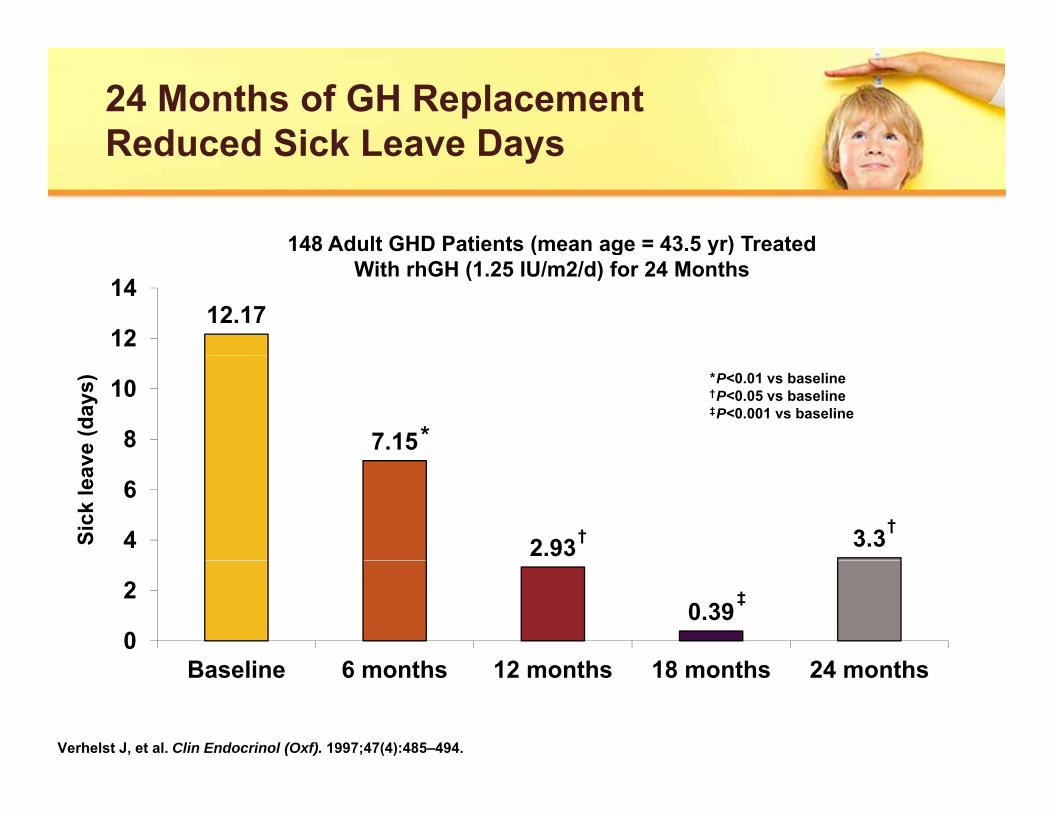
24 Months of GH Replacement Reduced Sick Leave DaysReduced Sick Leave Days
148 Adult GHD Patients (mean age = 43.5 yr) Treated
12.1712
14
( g y )With rhGH (1.25 IU/m2/d) for 24 Months
7.158
10
ve (d
ays)
*
*P<0.01 vs baseline†P<0.05 vs baseline‡P<0.001 vs baseline
2.93 3.34
6
Sick
leav
††
0.390
2
B li 6 th 12 th 18 th 24 th
‡
Baseline 6 months 12 months 18 months 24 months
Verhelst J, et al. Clin Endocrinol (Oxf). 1997;47(4):485–494.
Shift in Use for GH Therapy Indicates a Trend Toward Less Severe Forms of GHDTrend Toward Less Severe Forms of GHD
Webb SM, et al. J Clin Endocrinol Metab. 2009;94(2):392–399.
*P<0.001 vs 1996–1997†P=0.005 vs 1996–1997‡P=0.001 vs 1996–1997
*P<0.001 vs 1996–1997
Adult GHD:SummarySummary
• Adults with GHD are at increased risk for cardiovascular• Adults with GHD are at increased risk for cardiovascular disease, impaired physical function, and reduced quality of life
• It is recommended that GH be prescribed for adults with a history of hypothalamic-pituitary disease and biochemically proven GHDbiochemically proven GHD– GH therapy appears to have a beneficial effect on bone,
muscle, cardiovascular risk, quality of life and other variablesH d t th ff t f GH th d i t h– However, data on the effect of GH therapy on endpoints such as cardiovascular events, fractures, and death are lacking
16
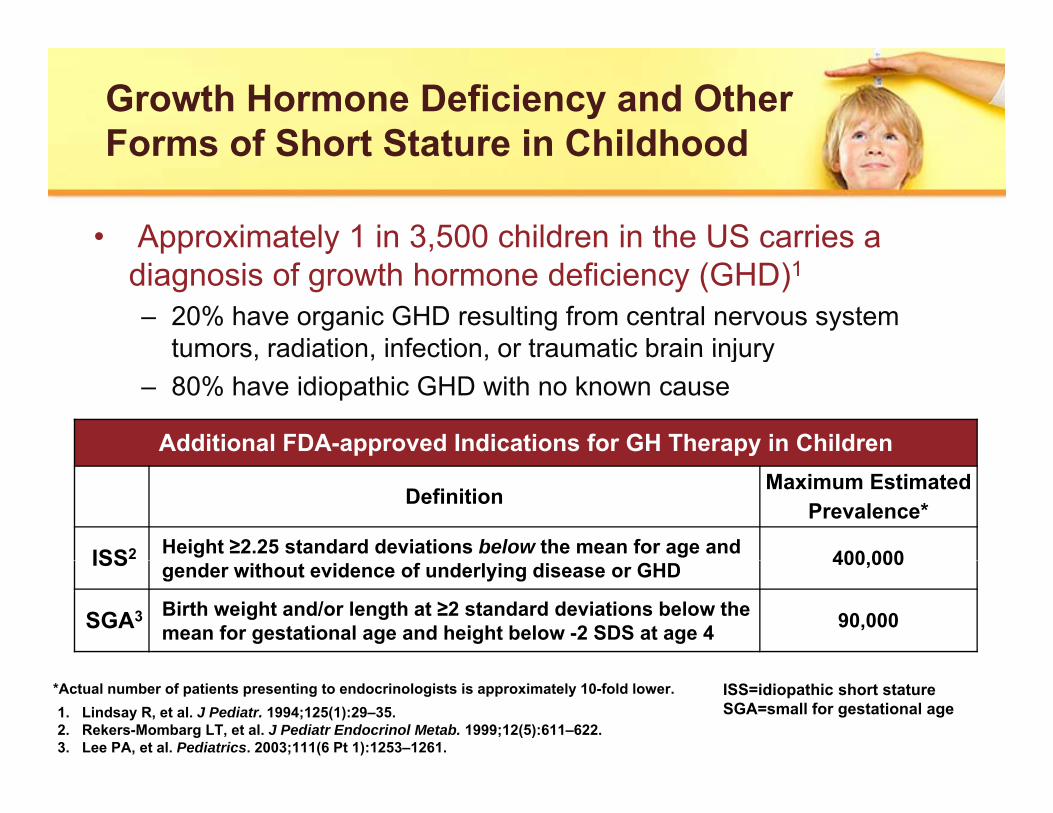
Growth Hormone Deficiency and Other Forms of Short Stature in ChildhoodForms of Short Stature in Childhood
• Approximately 1 in 3,500 children in the US carries a pp ydiagnosis of growth hormone deficiency (GHD)1
– 20% have organic GHD resulting from central nervous system tumors, radiation, infection, or traumatic brain injurytumors, radiation, infection, or traumatic brain injury
– 80% have idiopathic GHD with no known cause
Additional FDA-approved Indications for GH Therapy in Children
Definition Maximum Estimated Prevalence*
ISS2 Height ≥2.25 standard deviations below the mean for age and 400 000ISS gender without evidence of underlying disease or GHD 400,000
SGA3 Birth weight and/or length at ≥2 standard deviations below the mean for gestational age and height below -2 SDS at age 4 90,000
1. Lindsay R, et al. J Pediatr. 1994;125(1):29–35.2. Rekers-Mombarg LT, et al. J Pediatr Endocrinol Metab. 1999;12(5):611–622.3. Lee PA, et al. Pediatrics. 2003;111(6 Pt 1):1253–1261.
ISS=idiopathic short statureSGA=small for gestational age
*Actual number of patients presenting to endocrinologists is approximately 10-fold lower.
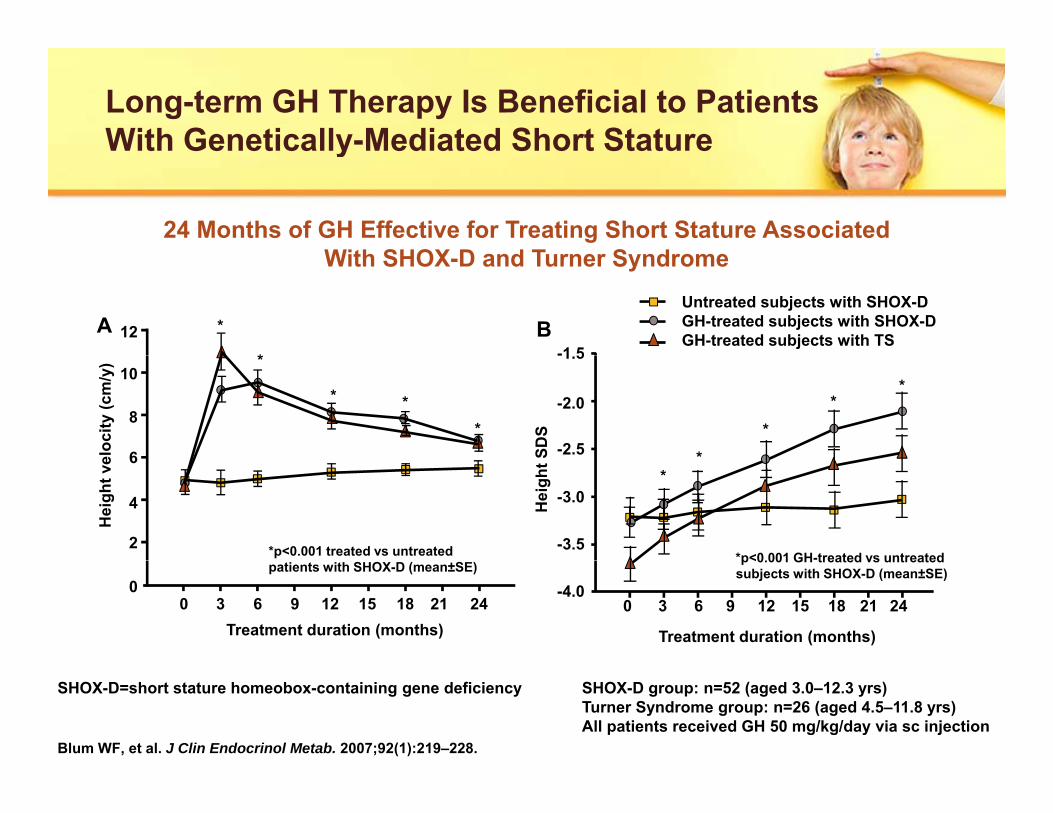
Long-term GH Therapy Is Beneficial to Patients With Genetically-Mediated Short StatureWith Genetically Mediated Short Stature
24 Months of GH Effective for Treating Short Stature Associated With SHOX D d T S dWith SHOX-D and Turner Syndrome
-1 5BA *
*
Untreated subjects with SHOX-DGH-treated subjects with SHOX-DGH-treated subjects with TS12
-1.5
-2.0
-2.5SDS
*
*
**
eloc
ity (c
m/y
) *
* **
10
8
6
-3.0
-3.5*p<0.001 GH-treated vs untreated
Hei
ght
*
Hei
ght v
e
*p<0.001 treated vs untreated
6
4
2
-4.0
p<0.001 GH treated vs untreated subjects with SHOX-D (mean±SE)
GH Therapy Reduces Body Fat and Increases Height in Patients With Genetically-Mediated Short Stature y
Significantly Lower Body Fat and Greater Height Following 6
44 6%50 140)
Significantly Lower Body Fat and Greater Height Following 6 Years of GH Therapy in Children With Prader-Willi Syndrome
36.1%
44.6%
30
40
50131
130
140
y fa
t (%
)
s of
GH
(cm
)
* *
10
20
30
114
110
120
Mea
n bo
dy
ht a
fter 6
yrs
0
10
100GH treatment†
(n=21)Control‡
(n=27)GH treatment†
(n=21)Control‡(n=27)
Hei
gh
Carrel AL, et al. J Clin Endocrinol Metab. 2010;95(3):1131–1136.
*P<0.01 vs control†Aged 6–9 yrs at baseline‡Aged 5–9 yrs at baseline
Dose-related Responses of Height and IGF-1 to 2 Years of GH Therapy in GH-Deficient Boys2 Years of GH Therapy in GH Deficient Boys
Height (2-year gain SDS) IGF-1 SDS
3
4p=0.05 p=0.07
4p=0.07
p=0.05
l
l
1
2
2
3
0
-1p=0 00003
1
25 50 100
Dose (μg/kg/day)
-2p=0.00003
Dose (μg/kg/day)
025 50 100
Cohen P, et al. J Clin Endocrinol Metab. 2002;87(1):90–98.
Plots represent +/- 2 SD (error bars), the 25 and 75% (box), the mean (red square), and the median (horizontal bar). SDS=standard deviation score
IGF-1=insulin-like growth factor 1
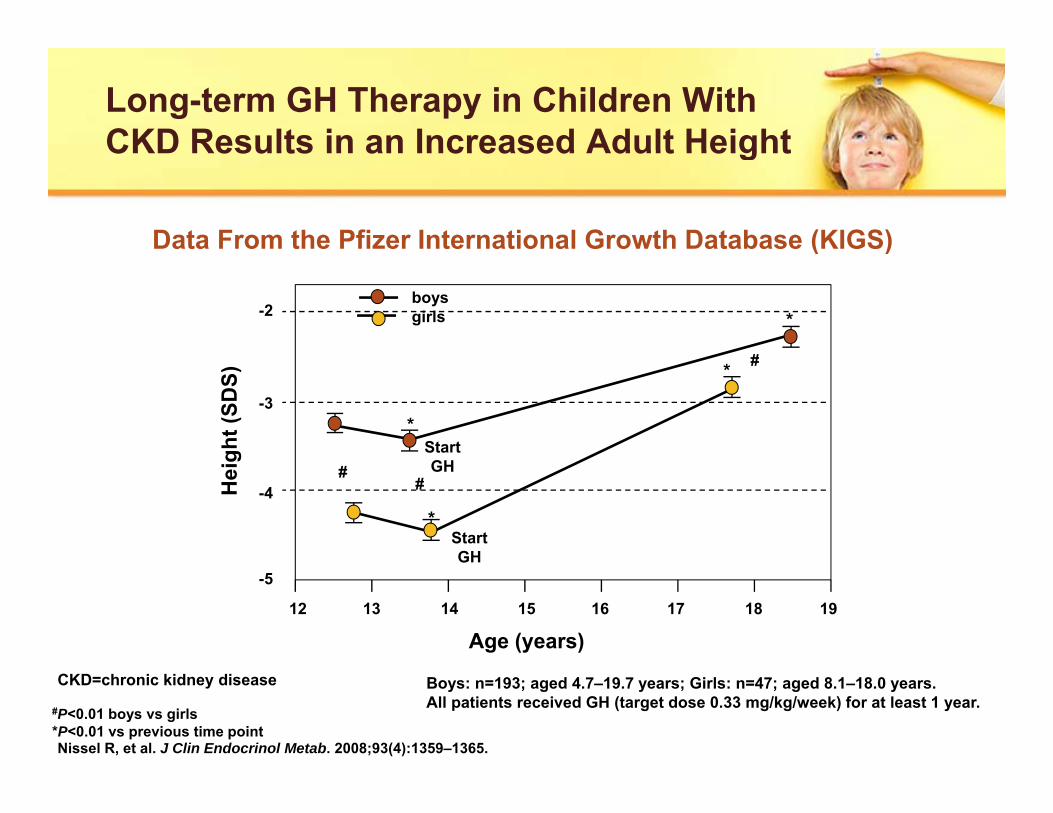
Long-term GH Therapy in Children With CKD Results in an Increased Adult HeightCKD Results in an Increased Adult Height
Data From the Pfizer International Growth Database (KIGS)( )
-2boysgirls *
#
-3
ght (
SDS)
Start*
* #
-4Hei
g GH
StartGH
*
##
-5
12 13 14 15 16 17 18 19
Age (years)
GH
Nissel R, et al. J Clin Endocrinol Metab. 2008;93(4):1359–1365.
Boys: n=193; aged 4.7–19.7 years; Girls: n=47; aged 8.1–18.0 years.All patients received GH (target dose 0.33 mg/kg/week) for at least 1 year.#P<0.01 boys vs girls
*P<0.01 vs previous time point
CKD=chronic kidney disease
GH Therapy in Children Born Small for Gestational Age Increases Adult HeightGestational Age Increases Adult Height
Meta-analysis of 5 Randomized Controlled Clinical Trials y
Study or SubgroupTreated Untreated
WeightMean Difference Mean Difference
Mean SD Total Mean SD Total IV, Random [95% CI] IV, Random, 95% CI
11Carel et all11 (2003) -2.1 1.0 102 -2.7 0.9 47 21.3% 0.60 [0.28–0.92]Dahlgren and Wikland10
Test for overall effect: z=5.11 (P<0.00001) -2 -1 0 1 2Favors control
Favors experimental
Maiorana A, Cianfarani S. Pediatrics. 2009;124(3);e519–e531.Carel JC, et al. J Clin Endocrinol Metab. 2003;88(4):1587–1593.Dahlgren J, Wikland KA. Pediatr Res. 2005;57(2):216–222.van Dijk M, et al. J Clin Endocrinol Metab. 2007;92(1):160–165.van Pareren Y, et al. J Clin Endocrinol Metab. 2003;88(8):3584–3590.
SGA Children Without Spontaneous Catch-up Growth Benefit From GH TreatmentGrowth Benefit From GH Treatment
Group I <4 yrs (60 μg/kg/d for 2 yrs)
2.5
3.0
S n
Group II <4 yrs (12 mos with no treatment; GH for 12 mos)Group I ≥4 yrs (60 μg/kg/d for 2 yrs)Group I <4 yrs (60 μg/kg/d for 2 yrs)
*†*† n=16
1.5
2.0
2.5
e H
eigh
t SD
Sca
l Age
Gai
n
n=18n=23§
*†
*†
*† n=16
‡
0
0.5
1.0
Cum
ulat
ive
Chr
onol
ogi
‡
*P<0 05 Group I <4 years vs Group I ≥4 years
-0.5Baseline +6 +12 +18 +24 mos
P<0.05 Group I <4 years vs Group I ≥4 years†P<0.05 Group I <4 years vs Group II <4 and ≥4 years‡P<0.05 Group I ≥4 years vs Group II <4 and ≥4 years§P<0.05 Group I ≥4 years vs Group II ≥4 yearsArgente J, et al. J Clin Endocrinol Metab. 2007;92(8):3095–3101.
GH Therapy Normalized BMD in Children Born Small for Gestational AgeBorn Small for Gestational Age
1.01.5
GH Placebo
DS * *(33 μg/kg/d)
0 50.00.5
y B
MD
SD
-1.5-1.0-0.5
Tota
l-bod
y
-2.5-2.0
Baseline Year 1 Year 2 Year 3
T
*P<0.001 vs placeboArends NJ, et al. Clin Endocrinol (Oxf). 2003;59(6):779–787.
Height Is Greater in GH-treated Idiopathic Short Stature Patients vs ControlsShort Stature Patients vs Controls
Sample sizes for years 1, 2, 3, and 4:Placebo=9, 19, 9, 3; GH=17, 23, 12, 9, respectively.
*P<0.001 vs control† P<0.05 vs control
Childhood GHD:SummarySummary
• 1 in 3 500 children in the US are diagnosed with GHD• 1 in 3,500 children in the US are diagnosed with GHD– Only 20% have organic GHD; readily identifiable cause absent
in the majority of cases
• Approximately 90,000 infants are born SGA in the US annually– GH treatment in SGA include increased final adult height and g
bone mineral density– GH therapy can be a cost-effective treatment for SGA
• Approximately 400 000 children in the US have ISS• Approximately 400,000 children in the US have ISS– GH therapy increases height and may improve behavioral
profile of children with ISSH i h f GH i ISS– However, no consensus exists on the use of GH in ISS