Page 1
1
Growth OK
Cautious consumers
Michael Workman
Senior Economist
Commonwealth Bank of Australia - (612) 9118 1019
[email protected]
Not For Profit Conference
Adelaide
October 2012
www.research.commbank.com.au
Page 2
2
Important Information
This advice has been prepared without considering your objectives, financial situation or needs, and
before acting on the advice, you should consider its appropriateness to your circumstances.
Commonwealth Bank of Australia (“CBA”) as a provider of investment, borrowing and other financial
services undertakes financial transactions with many corporate entities in Australia. This may include any
corporate issuer referred to in this report.
For US and US investors: If you would like to speak to someone regarding the subject securities
described in this report, please contact Commonwealth Australia Securities LLC (the “US Broker-Dealer”),
a broker-dealer registered under the U.S. Securities Exchange Act of 1934 (the “Exchange Act”) and a
member of the Financial Industry Regulatory Authority (“FINRA”) at 1 (212) 336-7737. This report was
prepared, approved and published by Global Markets Research, a division of Commonwealth Bank of
Australia ABN 48 123 123 124 AFSL 234945("the Bank") and distributed in the U.S. by the US Broker-
Dealer. The Bank is not registered as a broker-dealer under the Exchange Act and is not a member of
FINRA or any U.S. self-regulatory organization. Commonwealth Australia Securities LLC (“US Broker-
Dealer”) is a wholly owned, but non-guaranteed, subsidiary of the Bank, organized under the laws of the
State of Delaware, USA, with limited liability.
Please see further disclaimers at the back of this document. Please also view our website at
www.research.commbank.com.au for a more detailed disclaimer.
Page 3
3
Agenda
Australian growth outlook:
– NFP – income sources & risks
– Growth drivers
– Employment & population
– Consumer spending & leakages.
Interest rates & Housing
– Prices & lending.
Currencies:
– USD to stay weak, AUD above parity.
Page 4
4
CBA TEI & THE CASH RATE
3.8
4.4
5.1
5.7
6.4
7.0
Jul-97 Jul-99 Jul-01 Jul-03 Jul-05
-8
-5
-2
2
5
8
Cash
rate
(lhs)
CBA TEI*
(adv 9 mnths ,rhs)
%pa %pa
* Deviat ion from trend
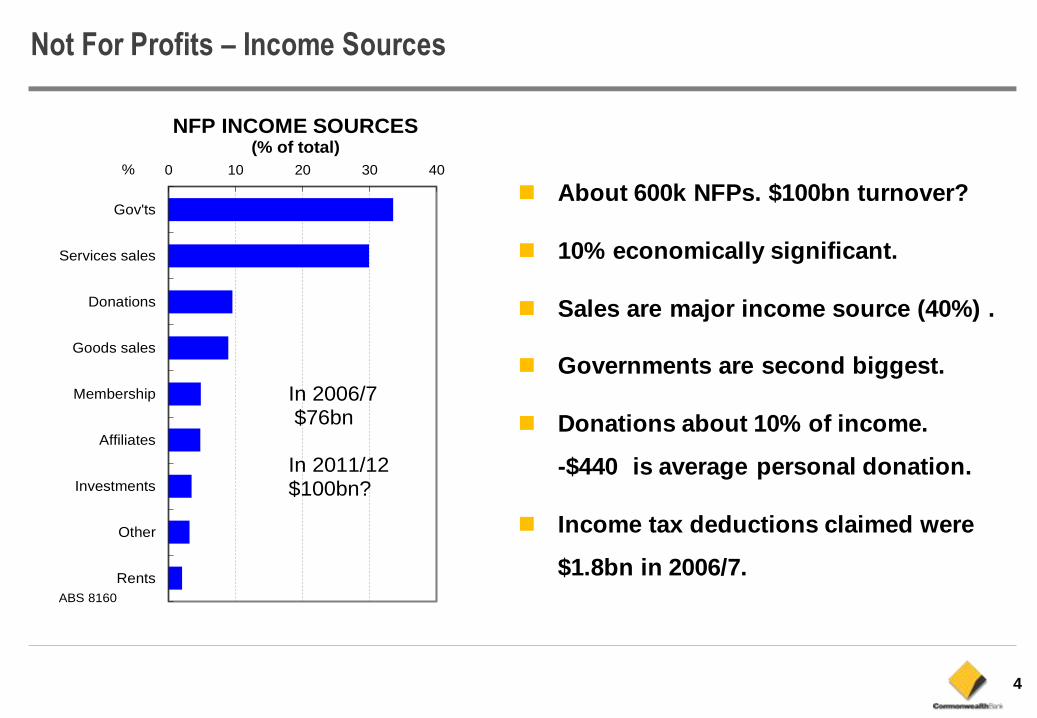
Not For Profits – Income Sources
About 600k NFPs. $100bn turnover?
10% economically significant.
Sales are major income source (40%) .
Governments are second biggest.
Donations about 10% of income.
-$440 is average personal donation.
Income tax deductions claimed were
$1.8bn in 2006/7.
0 10 20 30 40
Gov'ts
Services sales
Donations
Goods sales
Membership
Affiliates
Investments
Other
Rents
NFP INCOME SOURCES(% of total)
%
In 2006/7$76bn
In 2011/12$100bn?
ABS 8160
Page 5
5
CBA TEI & THE CASH RATE
3.8
4.4
5.1
5.7
6.4
7.0
Jul-97 Jul-99 Jul-01 Jul-03 Jul-05
-8
-5
-2
2
5
8
Cash
rate
(lhs)
CBA TEI*
(adv 9 mnths ,rhs)
%pa %pa
* Deviat ion from trend
Not For Profits – Shares of Incomes by Sector
Education and research groups
receive largest (22%) share of
income.
Services receive a rising share of
consumer incomes.
0 5 10 15 20 25
Ed'n & Res
Cult & Rec
Social Serv
Environ. et al.
Other
Health
Hospitals
Bus. & Unions
Religion
SHARES OF INCOME BY SECTOR(% of total) %
In 2006/7$76bn
In 2011/12$100bn?
ABS 8160
Page 6
6
CBA TEI & THE CASH RATE
3.8
4.4
5.1
5.7
6.4
7.0
Jul-97 Jul-99 Jul-01 Jul-03 Jul-05
-8
-5
-2
2
5
8
Cash
rate
(lhs)
CBA TEI*
(adv 9 mnths ,rhs)
%pa %pa
* Deviat ion from trend
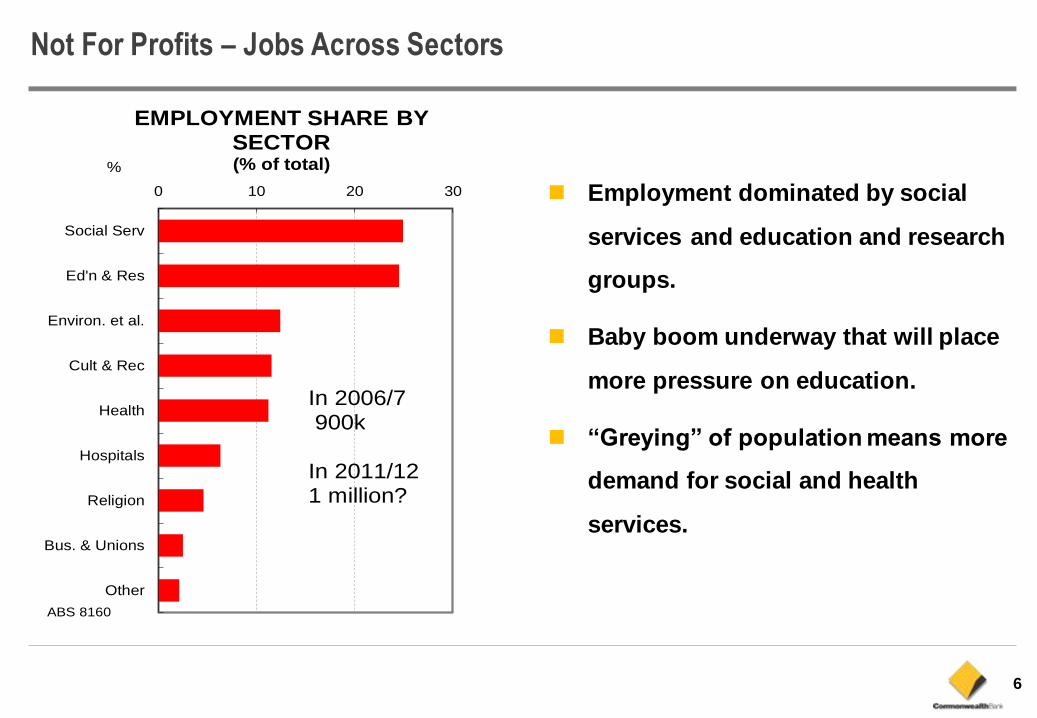
Not For Profits – Jobs Across Sectors
Employment dominated by social
services and education and research
groups.
Baby boom underway that will place
more pressure on education.
“Greying” of population means more
demand for social and health
services.
0 10 20 30
Social Serv
Ed'n & Res
Environ. et al.
Cult & Rec
Health
Hospitals
Religion
Bus. & Unions
Other
EMPLOYMENT SHARE BY SECTOR(% of total) %
In 2006/7900k
In 2011/121 million?
ABS 8160
Page 7
7
Asian protection
CBA TEI & THE CASH RATE
3.8
4.4
5.1
5.7
6.4
7.0
Jul-97 Jul-99 Jul-01 Jul-03 Jul-05
-8
-5
-2
2
5
8
Cash
rate
(lhs)
CBA TEI*
(adv 9 mnths ,rhs)
%pa %pa
* Deviat ion from trend
Australia & The Global Economy
Australia’s GDP growth highly correlated to China’s growth.
-9
-6
-3
0
3
6
9
12
-9
-6
-3
0
3
6
9
12
Jun-08 Jun-09 Jun-10 Jun-11 Jun-12
REAL GDP(annual % chg)%pa
Australia
US
%pa
China
UKEU
Japan
GFC
Page 8
8
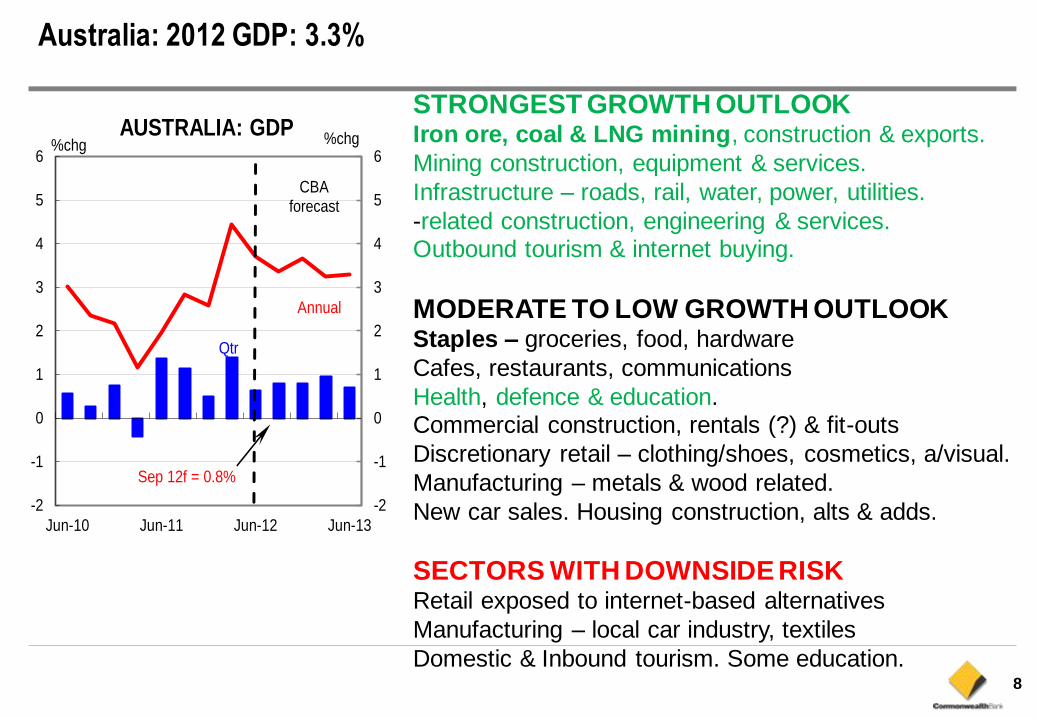
Australia: 2012 GDP: 3.3%
STRONGEST GROWTH OUTLOOK Iron ore, coal & LNG mining, construction & exports.
Mining construction, equipment & services.
Infrastructure – roads, rail, water, power, utilities.
-related construction, engineering & services. Outbound tourism & internet buying.
MODERATE TO LOW GROWTH OUTLOOK Staples – groceries, food, hardware
Cafes, restaurants, communications
Health, defence & education. Commercial construction, rentals (?) & fit-outs
Discretionary retail – clothing/shoes, cosmetics, a/visual.
Manufacturing – metals & wood related.
New car sales. Housing construction, alts & adds.
SECTORS WITH DOWNSIDE RISK Retail exposed to internet-based alternatives
Manufacturing – local car industry, textiles
Domestic & Inbound tourism. Some education.
-2
-1
0
1
2
3
4
5
6
-2
-1
0
1
2
3
4
5
6
Jun-10 Jun-11 Jun-12 Jun-13
AUSTRALIA: GDP
Annual
Qtr
%chg
Sep 12f = 0.8%
CBAforecast
%chg
Page 9
9
Growth: Mining v Rest
Consensus has trend GDP growth
over next few years and resources
accounting for ½-⅔ of that growth.
Implications:
– mining-related economy to expand at
≈16%pa over next two years;
– non-mining economy to grow at just 1½%pa if overall economy to be kept
within the “speed limits”;
– high AUD to keep driving structural change;
– AUD exposed sectors like tourism,
education, manufacturing, and
retailing to keep underperforming.
100
115
130
145
100
115
130
145
2010/11 2011/12 2012/13
ECONOMIC ACTIVITY(2010/11 = 100) Index
Source: RBA , CBA
MiningGDP
GDP
Non-miningGDP
Index
The “patchwork” economy
Page 10
10
Inflation at 1.2%....below 3% in 2012/13.
CPI running at 1.2%pa & underlying measures at 2.0%pa.
CPI has 58% goods and 42% services.
“AUD effected” inflation at -2.0%pa. Local (mainly services) inflation at 3.4%pa.
-2
0
2
4
6
-2
0
2
4
6
Mar-06 Mar-08 Mar-10 Mar-12
INFLATION(annual % change) %
AUD influenced prices
Local services
%
1
2
3
4
5
1
2
3
4
5
Mar-04 Mar-06 Mar-08 Mar-10 Mar-12
INFLATION(annual % change)% %
RBA target
Underlyinginflation
Headlineinflation
Page 11
11
Wages growth near 3.7%pa.
Business surveys suggest slower wages growth coming as unemployment rate rises.
Wages: Up 3.7%pa.
0.0 1.4 2.8 4.1 5.5
Mining
Mfg
Utilities
Construct.
Wholesale
Retail
Accom. etc
Transp
Communic.
Fin & insur
Rent & Hiring
Prof Serv.
Admin Serv.
Gov't
Education
Health
Cult & rec
Pers & other
WAGE PRICE INDEX(% annual growth)
Total = 3.7%
2
3
4
5
2
3
4
5
Sep-98 Dec-01 Mar-05 Jun-08 Sep-11
AUSTRALIAN WAGES(annual % change)
% %
Public
Total
Private
Page 12
12
Jobs: slowing………..unemployment rate to rise, except in WA.
Jobs growth expected to slow to 10k/mth, mainly in Victoria & NSW.
National unemployment rate likely to rise to 6 5.6% in late 2012.
3000
3250
3500
3750
7500
7750
8000
8250
Jan-09 Jan-10 Jan-11 Jan-12 Jan-13
EMPLOYMENT'000
Full-time(lhs)
Part-time(rhs)
'000
-50
0
50
100
150
3.8
4.4
4.9
5.5
6.0
Jan-08 Jan-09 Jan-10 Jan-11 Jan-12 Jan-13
LABOUR MARKET
Employmentgrowth(rhs)
Unemployment rate (lhs)
% '000
Page 13
13
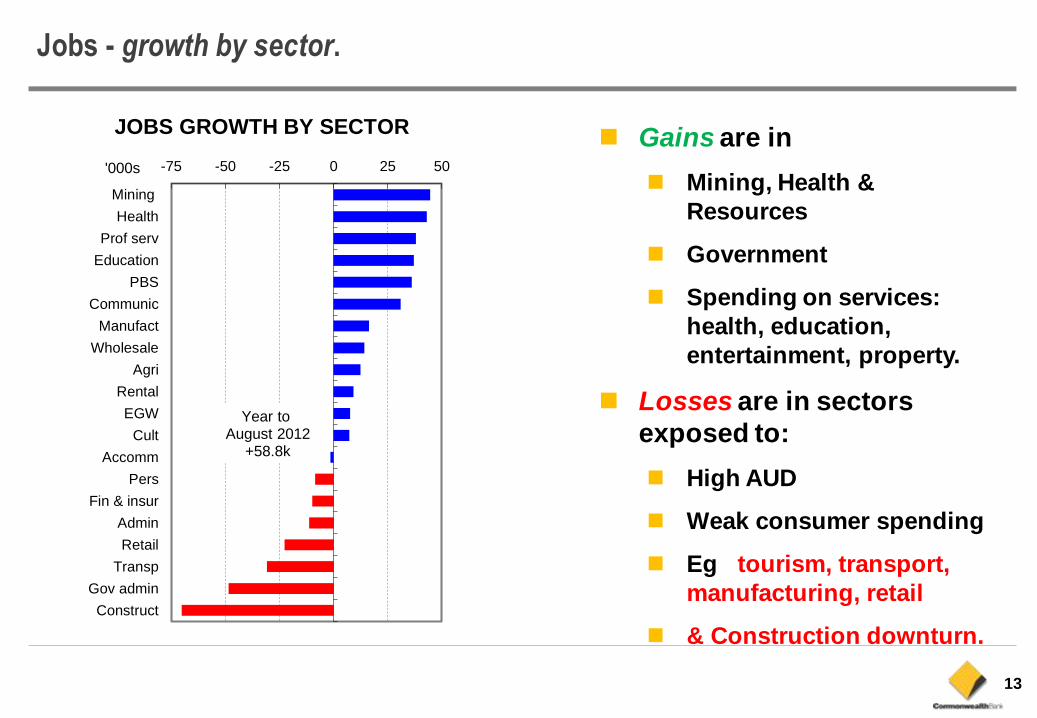
Jobs - growth by sector.
Gains are in
Mining, Health &
Resources
Government
Spending on services:
health, education,
entertainment, property.
Losses are in sectors
exposed to:
High AUD
Weak consumer spending
Eg tourism, transport,
manufacturing, retail
& Construction downturn.
-75 -50 -25 0 25 50
Mining
Health
Prof serv
Education
PBS
Communic
Manufact
Wholesale
Agri
Rental
EGW
Cult
Accomm
Pers
Fin & insur
Admin
Retail
Transp
Gov admin
Construct
JOBS GROWTH BY SECTOR
Year to August 2012
+58.8k
'000s
Page 14
14
Population: National 1.4%.......WA 3.0%.
National population growth at 331k (1.4%pa) gives underlying housing demand of 170k.
WA’s population growth strong at 3.1%pa. Boosted by interstate & overseas migration.
0.0
0.5
1.0
1.5
2.0
2.5
3.0
3.5
0.0
0.5
1.0
1.5
2.0
2.5
3.0
3.5
Jun-00 Jun-02 Jun-04 Jun-06 Jun-08 Jun-10 Jun-12
POPULATION GROWTH(annual % change)
Tas
QldWA
SA
%pa
NSW
Vic
%pa
ABS3101
0
50
100
150
200
250
300
350
400
450
Dec-97 Dec-00 Dec-03 Dec-06 Dec-09
POPULATION GROWTH
Nat Increase
Net Overseas
Moving annual total
'000s
ABS
Page 15
15
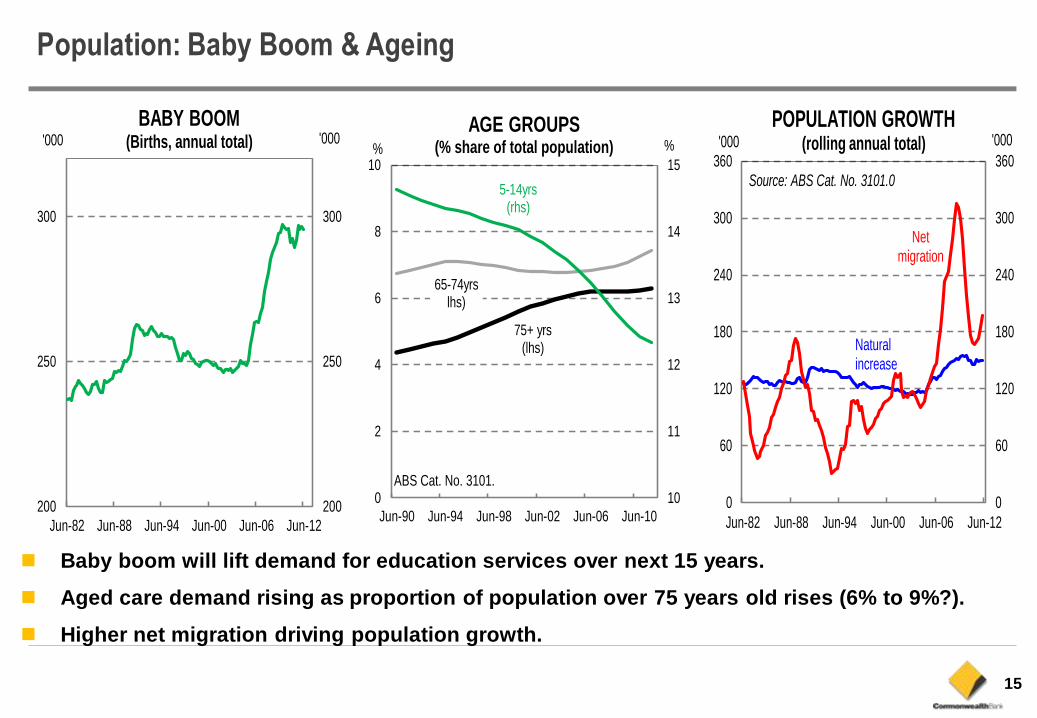
Population: Baby Boom & Ageing
Baby boom will lift demand for education services over next 15 years.
Aged care demand rising as proportion of population over 75 years old rises (6% to 9%?).
Higher net migration driving population growth.
200
250
300
200
250
300
Jun-82 Jun-88 Jun-94 Jun-00 Jun-06 Jun-12
'000 '000BABY BOOM
(Births, annual total)
0
60
120
180
240
300
360
0
60
120
180
240
300
360
Jun-82 Jun-88 Jun-94 Jun-00 Jun-06 Jun-12
'000 '000POPULATION GROWTH
(rolling annual total)
Netmigration
Naturalincrease
Source: ABS Cat. No. 3101.0
10
11
12
13
14
15
0
2
4
6
8
10
Jun-90 Jun-94 Jun-98 Jun-02 Jun-06 Jun-10
% %
AGE GROUPS(% share of total population)
75+ yrs(lhs)
65-74yrslhs)
5-14yrs(rhs)
ABS Cat. No. 3101.
Page 16
16
Consumers: Cautious About Spending
Ability to spend is OK
– Household incomes rising by 5%......with wages up 3.5% and jobs up 1.5%.
– BUT…..Wealth position: house prices and shares are weak.
– Strong growth in services, internet-based retail, & overseas travel.
Willingness is in doubt
– Consumer or retail caution prevails.
– Households still saving more.
– Bad news more often than goods. Especially on Europe and jobs.
– Government handed out $2.8bn in May & June, plus tax cuts.
Spending leakages were also important
– Power costs, health and rents up.
– Mortgage rates lower. Petrol flat. Olympics are good…. or bad for retail?
– More overseas travel, less inbound tourism. Both mean less local retail.
– Higher AUD means falling imported goods prices.
Page 17
17
Confidence: Not Happy, Jan.
Consumer confidence weak……are more rate cuts required?
Business confidence also poor. Big business worse than small business.
Are we in Athens yet?
-30
-15
0
15
30
Jan-03 Jan-05 Jan-07 Jan-09 Jan-11
-30
-15
0
15
30
CONFIDENCE & CONDITIONS(smoothed)Index Index
Source: NAB
Businessconditions Business
confidence
60
100
140
60
100
140
Jul-06 Jul-07 Jul-08 Jul-09 Jul-10 Jul-11 Jul-12
CONSUMER SENTIMENT
Source: Melbourne Institute
Index Index
Time to buy a dwelling
Personal Finances
12mo ahead
Consumersentiment
Page 18
18
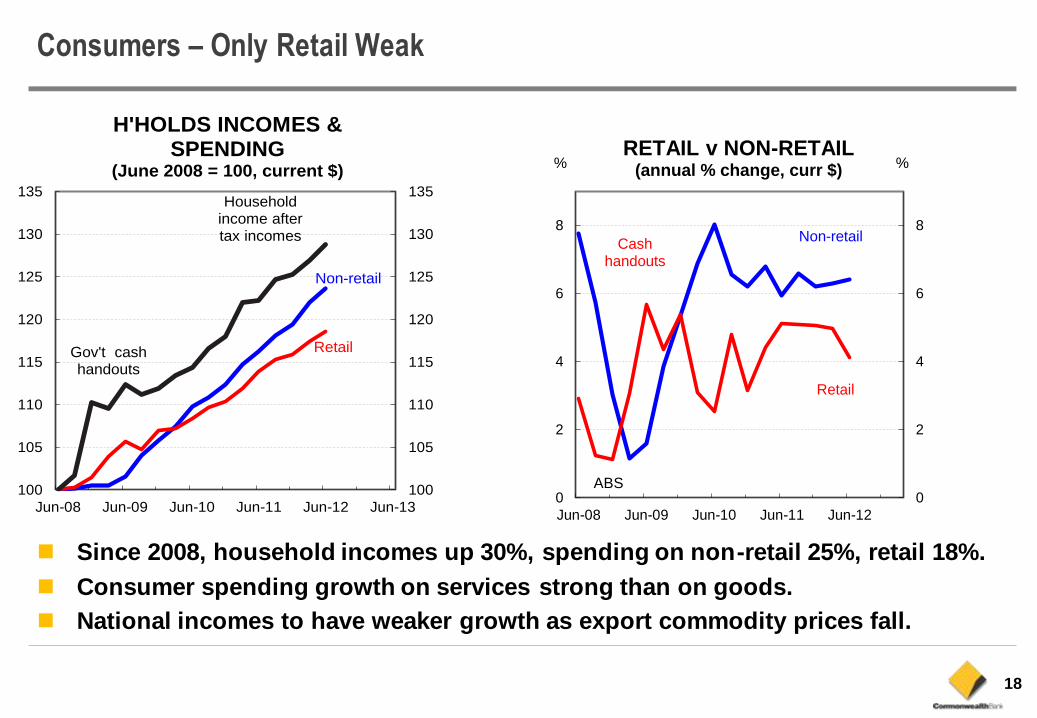
Consumers – Only Retail Weak
Since 2008, household incomes up 30%, spending on non-retail 25%, retail 18%.
Consumer spending growth on services strong than on goods.
National incomes to have weaker growth as export commodity prices fall.
100
105
110
115
120
125
130
135
100
105
110
115
120
125
130
135
Jun-08 Jun-09 Jun-10 Jun-11 Jun-12 Jun-13
H'HOLDS INCOMES & SPENDING
(June 2008 = 100, current $)
Retail
Non-retail
Household income after tax incomes
Gov't cash handouts
0
2
4
6
8
0
2
4
6
8
Jun-08 Jun-09 Jun-10 Jun-11 Jun-12
RETAIL v NON-RETAIL(annual % change, curr $)
Retail
Non-retail
% %
Cash handouts
ABS
Page 19
19
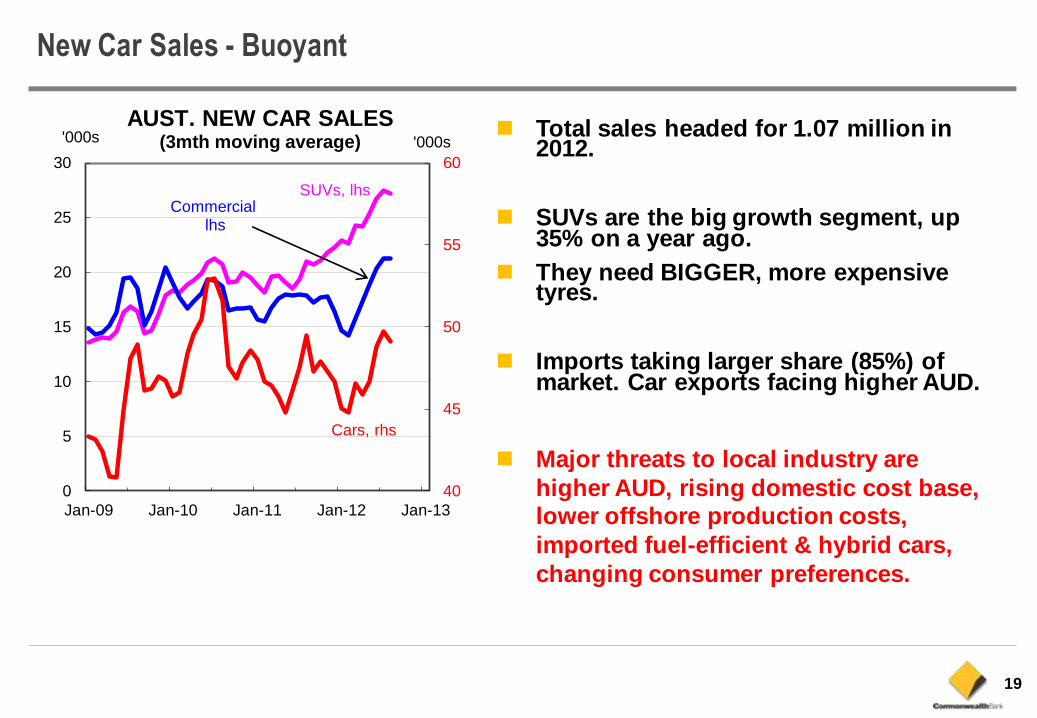
New Car Sales - Buoyant
Total sales headed for 1.07 million in 2012.
SUVs are the big growth segment, up 35% on a year ago.
They need BIGGER, more expensive tyres.
Imports taking larger share (85%) of market. Car exports facing higher AUD.
Major threats to local industry are
higher AUD, rising domestic cost base, lower offshore production costs,
imported fuel-efficient & hybrid cars,
changing consumer preferences.
40
45
50
55
60
0
5
10
15
20
25
30
Jan-09 Jan-10 Jan-11 Jan-12 Jan-13
AUST. NEW CAR SALES(3mth moving average)
Cars, rhs
Commerciallhs
SUVs, lhs
'000s '000s
Page 20
20
Overseas departures were 691k in June, up 8%pa. 40% above arrivals.
Higher charges in some areas are reducing discretionary spending ability.
Utility (electricity, gas & water) prices are 50% higher over the past 5 years.
More travel, higher bills.
Consumer Caution – leakages?
0.0
2.5
5.0
7.5
1.5
2.0
2.5
3.0
Mar-81 Mar-87 Mar-93 Mar-99 Mar-05 Mar-11
UTILITIES SPEND($bn & % of after tax income)% $bn/qtr
Spending as % ofafter tax income,,lhs
Spending,rhs
0
4
8
12
16
0
4
8
12
16
Sep-02 Sep-04 Sep-06 Sep-08 Sep-10 Sep-12
% %
Utilities
Purchase, rates &
maintenance
RENTS, UTILITIES & RATES(annual % change)
Rents
0.6
0.7
0.8
0.9
1
1.1
450
500
550
600
650
700
Jan-09 Jan-10 Jan-11 Jan-12
AUD/USD & TOURISM'000s AUD/USD
Departures, lhs
AUD/USD, rhs
Arrivals, lhs
Page 21
21
Credit card usage rising slowly…..debit cards as well.
Higher cash deposits shows precautionary savings rising firmly.
Saving ratio at 10%, highest since 1980s.
Consumer Caution – deposits to $700bn, up 8% pa.
-5
0
5
10
15
20
-5
0
5
10
15
20
Sep-72 Sep-80 Sep-88 Sep-96 Sep-04
SAVING RATIO% %
-3
0
3
6
9
12
-3
0
3
6
9
12
Jan-08 Jan-09 Jan-10 Jan-11 Jan-12
CREDIT CARD ACTIVITY(%pa smthd)
Balances
Avge balanceper card
Total Accounts
source RBA
400
500
600
700
800
2500
3000
3500
4000
4500
Mar-07 Mar-08 Mar-09 Mar-10 Mar-11 Mar-12
HOUSEHOLD ASSETS
Dwellings,lhs
Deposits, rhs
$bn $bn
RBA
Page 22
22
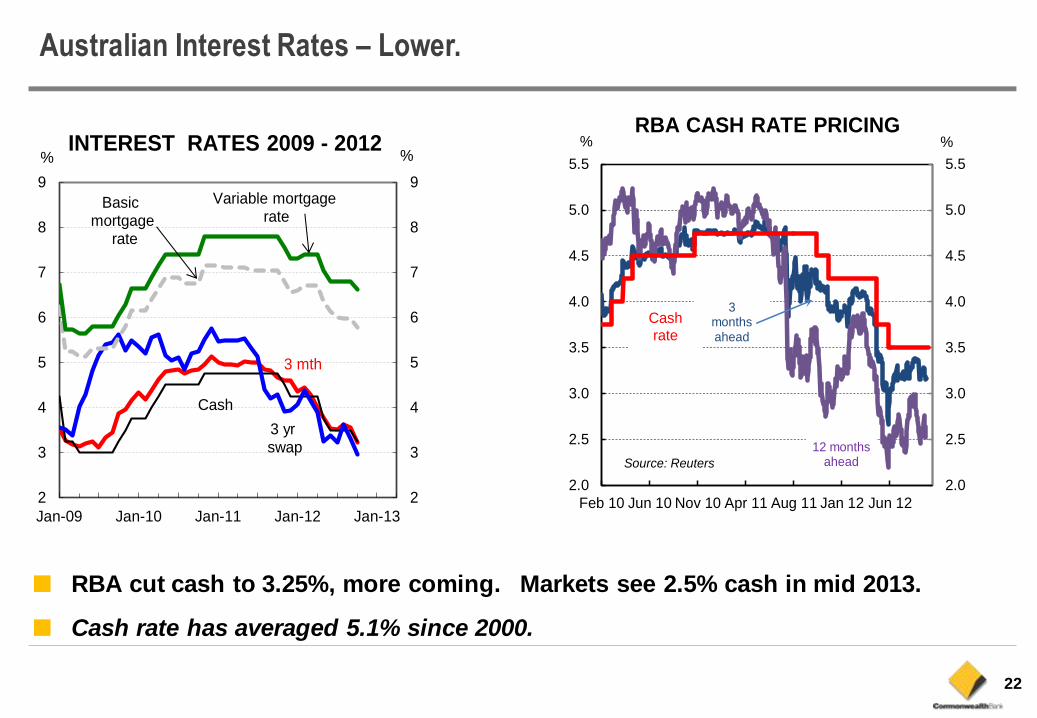
Australian Interest Rates – Lower.
■ RBA cut cash to 3.25%, more coming. Markets see 2.5% cash in mid 2013.
■ Cash rate has averaged 5.1% since 2000.
2.0
2.5
3.0
3.5
4.0
4.5
5.0
5.5
2.0
2.5
3.0
3.5
4.0
4.5
5.0
5.5
Feb 10 Jun 10 Nov 10 Apr 11 Aug 11 Jan 12 Jun 12
%
3 months ahead
12 monthsaheadSource: Reuters
RBA CASH RATE PRICING%
Cashrate
2
3
4
5
6
7
8
9
2
3
4
5
6
7
8
9
Jan-09 Jan-10 Jan-11 Jan-12 Jan-13
INTEREST RATES 2009 - 2012
Cash
3 mth
Variable mortgagerate
% %
3 yrswap
Basic mortgage
rate
Page 23
23
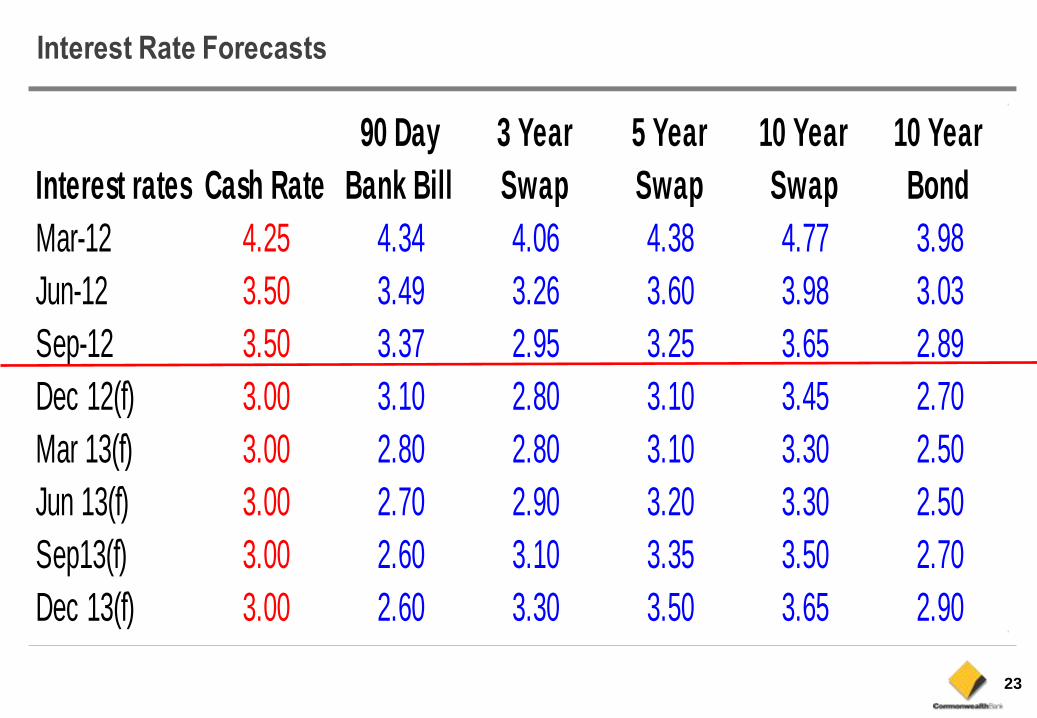
Interest Rate Forecasts
Interest rates Cash Rate
90 Day
Bank Bill
3 Year
Swap
5 Year
Swap
10 Year
Swap
10 Year
Bond
Mar-12 4.25 4.34 4.06 4.38 4.77 3.98
Jun-12 3.50 3.49 3.26 3.60 3.98 3.03
Sep-12 3.50 3.37 2.95 3.25 3.65 2.89
Dec 12(f) 3.00 3.10 2.80 3.10 3.45 2.70
Mar 13(f) 3.00 2.80 2.80 3.10 3.30 2.50
Jun 13(f) 3.00 2.70 2.90 3.20 3.30 2.50
Sep13(f) 3.00 2.60 3.10 3.35 3.50 2.70
Dec 13(f) 3.00 2.60 3.30 3.50 3.65 2.90
Page 24
24
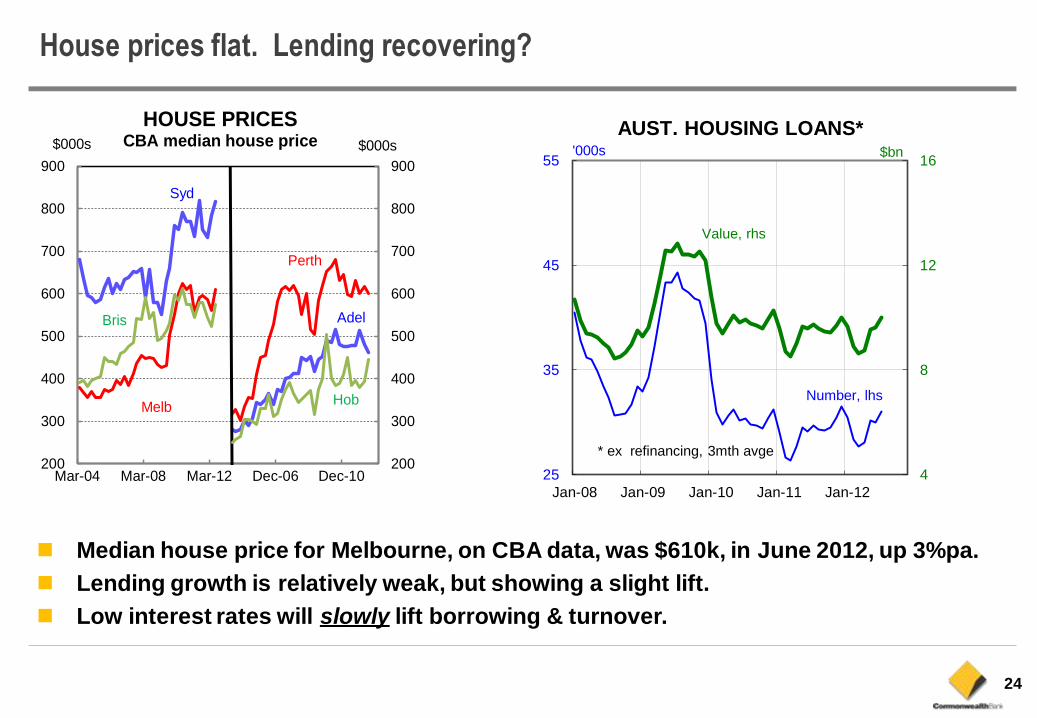
House prices flat. Lending recovering?
Median house price for Melbourne, on CBA data, was $610k, in June 2012, up 3%pa.
Lending growth is relatively weak, but showing a slight lift.
Low interest rates will slowly lift borrowing & turnover.
200
300
400
500
600
700
800
900
200
300
400
500
600
700
800
900
Mar-04 Mar-08 Mar-12 Dec-06 Dec-10
HOUSE PRICESCBA median house price
Syd
Adel
Melb
Bris
Perth
Hob
$000s $000s
4
8
12
16
25
35
45
55
Jan-08 Jan-09 Jan-10 Jan-11 Jan-12
AUST. HOUSING LOANS*$bn'000s
Number, lhs
* ex refinancing, 3mth avge
Value, rhs
Page 25
25
0.40
0.50
0.60
0.70
0.80
0.90
1.00
1.10
0.40
0.50
0.60
0.70
0.80
0.90
1.00
1.10
Jan-84 Jan-88 Jan-92 Jan-96 Jan-00 Jan-04 Jan-08 Jan-12
USD USD
The AUD cycles 1983 - 2012
AUD floats 12 Dec83 at USD0.9090
5 March 1983:
Labor Party wins election.
8 March 1983:
AUD devalued
10% to USD 0.8549
6-8 February 1985:
MX Missile Crisis
14 May 1986
Keating “Banana
Republic”
comment on radio
Commodity prices
at record lows
28 July 1986:
Keating changes
foreign investment
rules and RBA raises
rediscount rate to 16%.
AUD hits record low of
USD 0.5712 during day
and closes at
USD0.6155
20 October 1987:
Stockmarket crash
in Australia
Rising interest
rates and
higher commodity
prices
14 February 1989:
Keating comments
talk down AUD
Kuwait
invaded by
Iraq Aug 90
19 December 1991:
Keating becomes
Prime Minister
August 1991:
Failed Russian
coup
26 February 1992:
One Nation
Statement
Interest rates cut
15 times from
Jan 1990 to Dec 1993,
from 18% to 4.75%
October 1993:
Metals prices reach
record lows. AUD low
of USD 0.6410
RBA lifts rates 3 times
from 4.75% to 7.5%,
from July to Dec 1994.
Commodity
prices rising
September 1986 :
First downgrade of Australian
sovereign debt rating
October 1989 :
Second downgrade of
Sovereign debt rating
AUD peaks at USD0.9653
on 16 March 1984
Strong USD & AUD
falls Oil
prices
spike in
Gulf War I
July 1998:
Metals prices reach
record lows. AUD low
of USD 0.5815
Interest rates cut
5 times from
July 1996 to July 1997,
from 7.5% to 5.0%
June 1997:
Asia crisis begins,
THB floats
Commodity prics
falling from June 97
IMF packages for Asia: Markets rally, Jan 98
Japan in recession:
JPY & AUD weaken
March 1996
Howard
Gov’t
elected
Federal election dates: 5 March
1983
1 Dec 1984
11 July 1987
24 March 1990
13 March 1993
16 March 1996
3 Oct 1998
10 Nov 2001
9 Oct 2004
24 Nov 2007
21 August 2010
Average Annual Trading Range AUD/USD, 1983 - 2011: 13USc
Russian debt crisis
Ruble devalued
Gold falls to USD273/oz
AUD low of USD0.5530
on 28 Aug ‘99.
LTCM on 23 Sept 98
Commoditie
s
recover
April 99
May 1999
S&P Upgrade
Y2K related
selling
Oct 99
RBA lifts
rates: Nov
1999,
Feb, April,
May &
August
2000
AUD falls to USD0.5075
as USD rises.
US stockmarkets fall.
Oil hits $37/bbl
AUD low of USD0.4775
on 2 April 2001
RBA cash rate changes
2 Mar 05 5.50
3 May 06 5.75
2 Aug 6.0
6 Nov 6.25
8 Aug 07 6 .50
7 Nov 6.75
5 Feb 08 7.0
5 Mar 7.25
3 Sep 08 7.0
8 Oct 6.0
5 Nov 5.25
3 Dec 4.25
4 Feb 09 3.25
8 Apr 3.0
7 Oct 09 3.25
4 Nov 3.5
2 Dec 3.75
3 Mar 10 4.0
7 Apr 10 4.25
3 May 10 4.5
3 Nov 10 4.75
1 Nov 11 4.50
6 Dec 11 4.25
2 May 12 3.75
6 June 12 3.50
RBA lifts
rates in May
& June ‘02
WTC 11 Sep 01
AUD dip,
0.4840
USD
weakens
as US
shares
fall
Oct ‘02
Moody’s upgrades
Australia to Aaa
Uridashis
lift AUD
March ‘03
S&P
upgrades
Australia
to AAA
Oil prices
spike until
Gulf War 2
ends 10
April 2003
S&P Sovereign Debt
Rating changes
AA+ 6 Dec 86
AA 24 Oct 89
AA+ 17 May 99
AAA 17 Feb 03
RBA lifts
rates 5 Nov ‘03
& 3 Dec.’ 03
Commodity
prices rising
12 December 1983:
AUD floats at
USD0.9090
9 Oct ‘04
Howard Gov’t
re-elected
Oil prices
hit $75/bbl
Aug 07
Mineral
commodity
prices at
50yr highs
AUD at 30 year
high of 1.108,
27 July 2011.
US sub-prime
Problems
Aug 07 on
USD weaker
Fed cuts rates
24 Nov 07
Rudd Gov’t
elected
Oil prices hit
$142/bbl
AUD collapses
as USD rises on
Sub-prime crisis
RBA cuts
rates
3 Sep 08, to
8 Apr 09
Commodity
prices
slump.
AUD low of
USD0.6010
on 27 Oct
08
Sep 08
Lehman Bros
collapse, US
Fed cuts to
zero, Dec 08.
USD falls as
Fed does
Quantitative
Easing, Mar 09
Commodities
& shares
recover
strongly
RBA lifts
rates
Oct 09 to Nov 10
World bond
markets sell-off on
US inflation fears
US & EU growth
data weakens,
USD up.
RBA cuts rates
on 1 Nov ,
6 Dec. 2011,
then May & Jun
‘12
Page 26
26
AUD Forecasts – peak in December?
Exchange ratesAUD/USD AUD/JPY AUD/EUR AUD/GBP AUD/NZD AUD/CHF
Mar-12 1.03 86 0.78 0.65 1.26 0.93
Jun-12 1.02 82 0.81 0.65 1.28 0.97
Sep-12 1.03 81 0.84 0.66 1.26 1.01
Dec 12(f) 1.05 83 0.84 0.66 1.27 1.01
Mar 13(f) 1.04 83 0.82 0.65 1.25 0.98
Jun 13(f) 1.04 84 0.80 0.64 1.24 0.96
Dec 13(f) 1.04 85 0.79 0.63 1.27 0.95
Dec 13(f) 1.04 86 0.79 0.63 1.27 0.95
Page 27
27
CBA TEI & THE CASH RATE
3.8
4.4
5.1
5.7
6.4
7.0
Jul-97 Jul-99 Jul-01 Jul-03 Jul-05
-8
-5
-2
2
5
8
Cash
rate
(lhs)
CBA TEI*
(adv 9 mnths ,rhs)
%pa %pa
* Deviat ion from trend
CBA Australian Economic Forecasts - October 2012 Fiscal Years Calendar Years
2008/09 2009/10 2010/11 2011/12 2012/13 2013/14 2007 2008 2009 2010 2011 2012 2013
(a) (a) (a) (a) (f) (f) (a) (a) (a) (a) (a) (f) (f)
Economic Activity
Private final demand 0.1 1.0 3.3 6.8 5.3 4.6 6.9 3.0 -0.4 2.0 5.5 6.1 5.3
Of which: Household spending 0.1 2.5 3.1 3.7 3.3 3.3 5.6 1.9 1.0 2.9 3.3 4.0 3.1
Dwelling investment -1.5 1.2 3.0 -3.3 -0.2 4.8 2.0 2.7 -4.4 4.1 1.3 -5.1 4.9
Business investment 2.2 -5.2 6.1 22.1 13.0 8.1 14.9 9.4 -4.7 -1.5 17.1 16.9 12.2
Public final demand 3.7 6.6 3.1 0.7 0.4 0.2 3.4 6.8 0.7 8.7 0.1 1.9 -0.9
Domestic final demand 0.9 2.3 3.3 5.3 4.2 3.6 6.1 3.9 -0.2 3.5 4.2 5.1 3.9
Inventories (contrib to GDP) -0.7 -0.1 0.5 0.2 0.1 0.0 0.8 -0.3 -0.7 0.4 0.4 0.1 0.1
GNE 0.2 2.3 3.8 5.5 4.2 3.6 6.9 3.5 -0.9 3.9 4.6 5.2 4.0
Exports 1.7 5.3 0.4 3.7 5.0 5.2 3.2 3.8 2.1 5.9 -1.3 5.1 5.9
Imports -3.3 5.6 10.4 11.8 6.6 7.8 12.6 11.2 -8.6 14.1 11.5 7.8 7.7
Net exports (contrib to GDP) 1.0 -0.1 -2.0 -1.8 -0.6 -0.9 -1.6 -1.4 2.2 -1.5 -2.7 0.0 0.0
GDP 1.4 2.3 1.9 3.4 3.7 3.0 4.7 2.5 1.4 2.5 2.1 3.9 3.6
Prices & Wages
CPI 3.1 2.3 3.1 2.3 2.6 2.7 2.3 4.4 1.8 2.8 3.4 1.7 2.9
Underlying CPI 4.4 3.3 2.6 2.3 2.7 2.8 3.0 4.6 3.8 2.8 2.6 2.2 2.9
AWOTE 5.5 5.6 4.2 4.4 3.0 3.8 4.8 4.8 5.7 4.9 4.4 3.6 3.3
WPI 4.1 3.0 3.8 3.6 3.8 3.9 4.0 4.2 3.6 3.3 3.7 3.7 3.9
Real h/hold disposable income 7.4 1.0 3.8 3.5 2.7 3.0 7.7 4.2 5.9 1.0 4.4 3.0 2.7
Labour Market
Employment 1.6 1.4 2.9 0.7 1.1 1.8 3.1 2.8 0.7 2.7 1.7 0.7 1.5
Unemployment rate 4.9 5.5 5.1 5.2 5.5 5.3 4.4 4.3 5.6 5.2 5.1 5.3 5.5
External Accounts
Current Account: $bn -36.7 -56.1 -33.3 -40.8 -68.4 -77.8 -69.8 -54.2 -52.4 -38.8 -32.5 -57.7 -73.6
% of GDP -2.9 -4.3 -2.4 -2.8 -4.4 -4.8 -6.2 -4.4 -4.2 -2.9 -2.3 -3.9 -4.6
Page 28
28
All Investors: Unless otherwise noted, all data is sourced from Australian Bureau of Statistics material. (www.abs.gov.au) The Commonwealth Bank of Australia ABN 48 123 123 124 AFSL 234945 (the “Bank”, is incorporated in Australia with limited liability. Commonwealth Securities Limited ABN 60 067 254 399 AFSL 238814 ("CommSec"), is a wholly owned, but non-guaranteed, subsidiary of the Bank and is incorporated in Australia with limited liability.
Please view our website at www.research.commbank.com.au for more information. The Bank and its subsidiaries, including CommSec, Commonwealth Australia Securities LLC, CBA Europe Ltd and Commonwealth Research, are domestic or foreign entities or business areas of the Commonwealth Bank Group of Companies
(CBGOC). CBGOC and their directors, employees and representatives are referred to in this Appendix as “the Group”. This report is published solely for informational purposes and is not to be construed as a solicitation or an offer to buy any securities or financial instruments. This report has been prepared without taking account of the objectives, financial situation and capacity to bear loss, knowledge, experience or needs of any specific person who may receive this report. No member of the Group
does, or is required to, assess the appropriateness or suitability of the report for recipients who therefore do not benefit from any regulatory protections in this regard. All recipients should, before acting on the information in this report, consider the appropriateness and suitability of the information, having regard to their own objectives,
financial situation and needs, and, if necessary seek the appropriate professional, foreign exchange or financial advice regarding the content of this report. We believe that the information in this report is correct and any opinions, conclusions or recommendations are reasonably held or made, based on the information available at the time of its compilation, but no representation or warranty, either expressed or implied, is made or provided as to accuracy, reliability or completeness of any statement
made in this report. Any opinions, conclusions or recommendations set forth in this report are subject to change without notice and may differ or be contrary to the opinions, conclusions or recommendations expressed elsewhere by the Group. We are under no obligation to, and do not, update or keep current the information
contained in this report. The Group does not accept any liability for any loss or damage arising out of the use of all or any part of this report. Any valuations, projections and forecasts contained in this report are based on a number of assumptions and estimates and are subject to contingencies and uncertainties. Different assumptions and estimates could result in materially different results. The Group does not represent or warrant that any of these valuations, projections or forecasts, or any of the
underlying assumptions or estimates, will be met. Past performance is not a reliable indicator of future performance. The Group has provided, provides, or seeks to provide, investment banking, capital markets and/or other services, including financial services, to the companies described in the report and their associates. This report
is not directed to, or intended for distribution to or use by, any person or entity who is a citizen or resident of or located in any locality, state, country or other jurisdiction where such distribution, publication, availability or use would be contrary to law or regulation or which would subject any entity within the Group to any registration or licensing requirement within such jurisdiction. All material presented in this report, unless specifically indicated otherwise, is under copyright to the Group. None of the
material, nor its content, nor any copy of it, may be altered in any way, transmitted to, copied or distributed to any other party, without the prior written permission of the appropriate entity within the Group. In the case of certain products, the Bank or one of its related bodies corporate is or may be the only market maker. The Group, its
agents, associates and clients have or have had long or short positions in the securities or other financial instruments referred to herein, and may at any time make purchases and/or sales in such interests or securities as principal or agent, including selling to or buying from clients on a principal basis and may engage in transactions in a manner inconsistent with this report.
All investors – Analyst Certification: Each research analyst, primarily responsible for the content of this research report, in whole or in part, certifies that with respect
to each security or issuer that the analyst covered in this report: (1) all of the views expressed accurately reflect his or her personal views about those securities or issuers; and (2) no part of his or her compensation was, is, or will be, directly or indirectly, related to the specific recommendations or views expressed by that research analyst in the report. The analyst(s) responsible for the preparation of this report may interact with trading desk personnel, sales personnel and other constituencies for
the purpose of gathering, synthesizing, and interpreting market information. Directors or employees of the Group may serve or may have served as officers or directors of the subject company of this report. The compensation of analysts who prepared this report is determined exclusively by research management and senior management
(not including investment banking). No inducement has been or will be received by the Group from the subject of this report or its associates to undertake the research or make the recommendations. The research staff responsible for this report receive a salary and a bonus that is dependent on a number of factors including their performance and the overall financial performance of the Group, including its profits derived from investment banking, sales and trading revenue.
Important Disclosures and Disclaimer