Page 1
GROWTH, STRUCTURE AND TRIBOLOGICAL PROPERTIES OF ATOMIC
LAYER DEPOSITED LUBRICIOUS OXIDE NANOLAMINATES
Benedict Anyamesem Mensah, B.S., M.S.
Dissertation Prepared for the Degree of
DOCTOR OF PHILOSOPHY
UNIVERSITY OF NORTH TEXAS
December 2010
APPROVED:
Thomas W. Scharf, Major Professor Richard Reidy, Committee Member Jincheng Du, Committee Member Witold Brostow, Committee Member Nigel Shepherd, Committee Member Narendra Dahotre, Chair of the
Department of Materials Science and Engineering
Costas Tsatsoulis, Dean of the College of Engineering
James D. Meernik, Acting Dean of the Robert B. Toulouse School of Graduate Studies
Page 2
Mensah, Benedict Anyamesem, Growth, structure and tribological properties of
atomic layer deposited lubricious oxide nanolaminates. Doctor of Philosophy (Materials
Science and Engineering), December 2010, 176 pages, 7 tables, 56 figures, 132
references.
Friction and wear mitigation is typically accomplished by introducing a shear
accommodating layer (e.g., a thin film of liquid) between surfaces in sliding and/or
rolling contacts. When the operating conditions are beyond the liquid realm, attention
turns to solid coatings. Solid lubricants have been widely used in governmental and
industrial applications for mitigation of wear and friction (tribological properties).
Conventional examples of solid lubricants are MoS2, WS2, h-BN, and graphite; however,
these and some others mostly perform best only for a limited range of operating
conditions, e.g. ambient air versus dry nitrogen and room temperature versus high
temperatures. Conversely, lubricious oxides have been studied lately as good potential
candidates for solid lubricants because they are thermodynamically stable and
environmentally robust. Oxide surfaces are generally inert and typically do not form
strong adhesive bonds like metals/alloys in tribological contacts. Typical of these oxides
is ZnO. The interest in ZnO is due to its potential for utility in a variety of applications.
To this end, nanolaminates of ZnO, Al2O3, ZrO2 thin films have been deposited at
varying sequences and thicknesses on silicon substrates and high temperature (M50)
bearing steels by atomic layer deposition (ALD). The top lubricious, nanocrystalline ZnO
layer was structurally-engineered to achieve low surface energy {0002}-orientated grain
Page 3
that provided low sliding friction coefficients (0.2 to 0.3), wear factors (range of 10-7 to
10-8 mm3/Nm) and good rolling contact fatigue resistance. The Al2O3 was intentionally
made amorphous to achieve the {0002} preferred orientation while {101}-orientated
tetragonal ZrO2 acted as a high toughness/load bearing layer. It was determined that the
ZnO defective structure (oxygen sub-stoichiometric with growth stacking faults) aided in
shear accommodation by re-orientating the nanocrystalline grains where they realigned to
create new friction-reducing surfaces. Specifically, high resolution transmission electron
microscopy (HRTEM) inside the wear surfaces revealed in an increase in both partial
dislocation and basal stacking fault densities through intrafilm shear/slip of partial
dislocations on the (0002) planes via a dislocation glide mechanism. This shear
accommodation mode mitigated friction and prevented brittle fracture classically
observed in higher friction microcrystalline and single crystal ZnO that has potential
broad implications to other defective nanocrystalline ceramics. Overall, this work has
demonstrated that environmentally-robust, lubricious ALD nanolaminates of
ZnO/Al2O3/ZrO2 are good candidates for providing low friction and wear interfaces in
moving mechanical assembles, such as fully assembled rolling element bearings and
microelectromechanical systems (MEMS) that require thin (~10-200 nm), uniform and
conformal films.
Page 4
Copyright 2010
by
Benedict Anyamesem Mensah
ii
Page 5
iii
ACKNOWLEDGEMENTS
I would like to express my deepest gratitude to my major professor, Dr. Thomas
W. Scharf, for all the support and guidance he offered me during the course of my study
here at UNT. The knowledge I have gained from him is invaluable and I feel privileged
to have had the opportunity to work under his supervision. I also want to express my
appreciation to Drs. Rick Reidy, Jincheng Du, Nigel Shepherd and Witold Brostow for
serving on my dissertation committee. Their suggestions and immense contributions
improved this work tremendously. To Nancy Bunce and Dr. Dave Diercks, (CART)
thank you so much for the tool training. I would like to express my thanks to my
colleagues from the LAMMA group (Hamid, Anchal, Jon-Erik, Kyle and Wei Lun) for
the help on instrumentation and problem discussions. You guys really rock! This work
would not have happened without my friends at UNT, Eric, Ghare, Nelson, Carl, Arun,
Antarikish, Mohammed, Fan Lin, Drs. Minghang, Ming Ti, Sonny and Koffi, thanks for
all your assistance throughout this study and my stay at UNT.
I could not have come this far without the love and support of my family, to my
wife Akos and kids (Maureen and Josiah) thanks for understanding and motivating me to
achieve this aim. Furthermore, I would like to thank my mum Margaret and my in-laws
for the moral and prayer support. The Mathis family cannot be left out; your support to
me has been immeasurable. I love you all. Finally, I would like to thank God almighty for
giving me the strength and ability to achieve my target, I will forever be grateful.
Page 6
TABLE OF CONTENTS
Page
ACKNOWLEDGEMENTS ............................................................................................... iii
LIST OF TABLES ...............................................................................................................ix
LIST OF FIGURES .............................................................................................................x
CHAPTER
1 INTRODUCTION .......................................................................................1
1.1 Historical Perspective ............................................................................1
1.2 Motivation ..............................................................................................2
1.2.1 Transition Metal Dichalcogenides ................................................5
1.2.1.1 Molybdenum Disulfide (MoS2) and Tungsten Disulfide
(WS2).................................................................................5
1.2.1.2 Doped MoS2 and WS2 .......................................................6
1.2.2 Carbon-Based Materials ................................................................7
1.2.2.1 Graphite.............................................................................7
1.2.2.2 Diamondlike Carbon (DLC) .............................................8
1.2.2.3 Nanocrystalline Diamond ...............................................10
1.2.3 Polymers .....................................................................................11
1.2.4 Soft Metals ..................................................................................12
1.3 Contributions of Dissertation ...............................................................16
1.4 Dissertation Overview .........................................................................17
iv
Page 7
Page
1.5 Chapter References ..............................................................................18
2 OVERVIEW OF S OLID LUBRICANT FRICTION AND WEAR
NANOCRYSTALLINE OXIDE C ERAMIC AND ATOMIC LAYER
DEPOSITION ............................................................................................21
2.1 Solid Lubricant Tribology (Friction and Wear) ...................................21
2.1.1 Friction ........................................................................................21
2.1.2 Wear ............................................................................................25
2.1.3 Role of Solid Lubricants .............................................................28
2.2 Oxide Ceramics ....................................................................................28
2.2.1 Tribological Behavior of Bulk Microcrystalline Oxide
Ceramics .....................................................................................30
2.2.2 Plastic Deformation in Nanocrystalline Oxides ..........................32
2.2.3 Lubricious Oxide Materials ........................................................38
2.3 Atomic Layer Deposition .....................................................................41
2.3.1 ALD Oxide Films .......................................................................47
2.3.2 ALD ZnO ....................................................................................48
2.3.3 ALD ZrO2 ...................................................................................51
2.3.4 ALD Al2O3 ..................................................................................52
2.4 Chapter References ..............................................................................55
3 EXPERIMENTAL PROCEDURE ............................................................60
3.1 Substrate Cleaning (Silicon Wafer, M50 Steel) ...................................60
v
Page 8
Page
3.2 Film Deposition ...................................................................................61
3.3 Film Characterization ...........................................................................64
3.3.1 Ellipsometry ................................................................................64
3.3.2 Heat Treatment Furnace ..............................................................65
3.3.3 Atomic Force Microscopy ..........................................................65
3.3.4 X-ray Diffraction ........................................................................65
3.3.5 Pin-on-disk (POD) Tribometer Test ...........................................66
3.3.6 Rolling Contact Fatigue Test ......................................................70
3.3.7 Optical Microscopy .....................................................................72
3.3.8 Profilometery ..............................................................................72
3.3.9 Scanning Electron Microscopy and Focused-Ion Beam
Microscopy and Micromachining ...............................................72
3.3.10 Transmission Electron Microscopy and Energy Dispersive X-
ray Spectroscopy ........................................................................73
3.3.11 X-ray Photoelectron Spectroscopy ...........................................73
3.3.12 Auger Electron Spectroscopy ...................................................74
4 ATOMIC LAYER DEPOSITION OF LUBRICIOUS ZnO/ZrO2 AND
ZnO/ Al2O3/ZrO2 NANOLAMINATE FILMS ON SILIC ON
SUBSTRATE .............................................................................................75
4.1 Nanolaminate Film Condition Selection ..............................................75
4.1.1 ZnO/Al2O3/ZrO2 One Trilayer Surface Morphology ..................76
vi
Page 9
Page
4.1.2 ZnO/Al2O3/ZrO2 One Trilayer Nanolaminate Film
Composition ................................................................................78
4.1.3 ZnO/Al2O3/ZrO2 One Trilayer Nanolaminate Films
Microstructure .............................................................................82
4.2 Cross-Sectional TEM Analysis of the Unworn Nanolaminate Films ..90
4.3 ZnO/Al2O3/ZrO2 One Trilayer Nanolaminate Films Tribological
Behavior ...............................................................................................96
4.3.1 As-Deposited Friction Test Results ............................................96
4.3.2 400oC Annealed Friction Test Results ........................................98
4.3.3 1000oC Annealed Friction Test Results ....................................100
4.4 Chemical Imaging of Wear Tracks with Auger Electron
Spectroscopy ......................................................................................105
4.5 Cross-Sectional TEM Behavior of Worn One Trilayer Films ...........113
4.5.1 As-Deposited One Trilayer .......................................................114
4.5.2 400oC Annealed One Trilayer ...................................................119
4.5.3 1000oC Annealed One Trilayer .................................................121
4.6 ZnO/ZrO2 Nanolaminates ..................................................................124
4.6.1 Nanolaminate Films Microstructure .........................................125
4.6.2 Tribological Behavior ...............................................................127
4.6.3 Cross-Sectional TEM Behavior of Unworn/Worn 8 Bilayer
Nanolaminate Film....................................................................129
vii
Page 10
viii
Page
4.7 Chapter Summary ..............................................................................132
4.8 Chapter References ............................................................................138
5 LUBRICIOUS ATOMIC LAYER DEPOSITED NANOCRYSTALLINE
ZnO/ Al2O3/ZrO2 NANOLAMINATES ON M50 STEEL SUBSTRATES,
RODS AND CUPS ..................................................................................141
5.1 Introduction ........................................................................................141
5.2 Microstructure of the Nanolaminate Film..........................................142
5.3 Cross-Sectional Analysis of the Nanolaminate Film .........................144
5.4 Tribological Behavior of the Nanolaminate Film ..............................148
5.5 Cross-Sectional Behavior of Worn Nanolaminate Film ....................153
5.6 Solid Lubrication Mechanism in the Nanocrystalline ZnO ...............156
5.7 Tribological Behavior of the Nanolaminate in Dry Nitrogen ............159
5.8 Rolling Contact Fatigue (RCF) Test of the Nanolaminate Film ........162
5.9 Chapter Summary ..............................................................................167
5.10 Chapter References ..........................................................................171
6 CONCLUSIONS AND FUTURE WORK ..............................................172
6.1 Conclusions ........................................................................................172
6.2 Future Work .......................................................................................175
Page 11
LIST OF TABLES
Page
3.1 Deposition conditions for growing ZnO/ Al2O3/ ZrO2 one trilayer nanolaminate ..62
3.2 Deposition conditions for growing ZnO/ZrO2 two and eight bilayer nanolaminate62
3.3 POD test design settings ..........................................................................................68
3.4 RCF testing conditions .............................................................................................71
4.1 Table of the FWHM and grain sizes of the ZnO/Al2O3/ZrO2 one trilayer
nanolaminate films ..................................................................................................86
4.2 Grain sizes in nanometers of ZnO/ZrO2 2 and 8 bilayers nanolaminate films ......125
5.1 Partial dislocation density in as-deposited, annealed and inside wear track of the
(0002) ZnO plane ..................................................................................................157
ix
Page 12
x
LIST OF FIGURES
Page
2.1 Schematic of a hemi-spherical pin sliding on a coated substrate. Tribology is a
system’s property, principally governed by contact mechanics and tribochemical
(chemistry induced by sliding) reactions .................................................................22
2.2 Linear regression fits for friction coefficient as a function of inverse Hertzian
pressure fitted to μ=(τo/P
H)+α with values of shear strength (τ
o) shown for three
low friction, environmentally-robust coatings: Si3N
4 on DLN, UNCD coated Si
3N
4
on UNCD, and Si3N
4 on MoS
2/Sb
2O
3/Au in both dry nitrogen and humid air [T.W.
Scharf private communication]. ...............................................................................24
2.3 Schematic illustration of wear mechanism in a conventional brittle oxide and a
ductile nanocrystalline oxide film. From reference 23 ............................................39
2.4 ZnO structure (wurtzite structure) ...........................................................................50
2.5 Low-pressure forms of ZrO2. Red and Blue speres are O and Zr atoms respectively.
Image adapted from Romanes30 dissertation from Prof. Jincheng Du .....................52
3.1 An image of the Savannah 100 ALD system with the accompanying software, used
for all the nanolaminate depositions. (Source: Cambridge Nanotech Inc) ..............63
3.2 Schematic illustration of a) Hertzian contact between spheres, b) Hertzian contact
between a sphere and an elastic material, with an increase in contact area .............68
3.3 Schematic of three ball on rod RCF machine ..........................................................71
4.1 AFM surface scan of 1-trilayer nanolaminate film with scan size of 5 X 5 µm. As
deposited (left), ex-situ annealed in air at 400oC (middle) and 1000oC (right) .......77
4.2 A graph of the temperature of anneal versus the surface roughness parameters of
one trilayer nanolaminate .........................................................................................77
4.3 XPS depth profile results of ZnO/Al2O3/ZrO2 nanolaminate film deposited on Si
Page 13
xi
Page
substrate (a) as-deposited, (b) annealed at 400oC and (c) annealed at 1000oC (d)
Zr 3d5/2 peak montage after 1000oC anneal .................................................... 79 & 80
4.4 GIXRD analysis of ZnO/Al2O3/ZrO2 nanolaminate films with θ-2θ scans of as-
deposited and annealed films ...................................................................................84
4.5 (0002) pole figure of as-deposited film. Color level corresponds to x-ray intensity
counts .......................................................................................................................85
4.6 A graph that shows an increase in grain size of ZnO (0002) grain with the increase
of temperature of anneal ...........................................................................................87
4.7 XTEM bright-field images for 1 trilayer nanolaminates (left) as deposited, (middle)
400oC annealed and (right) 1000oC annealed (b) 1000oC annealed
ZrO2/Al2O3/ZnO interface ........................................................................................93
4.8 XTEM results of unworn 1000oC annealed one trilaer film revealing the
microstructure and layer composition .......................................................................94
4.9 XTEM chemical analysis showing chemical maps of unworn 1000oC annealed one
trilayer nanolaminate film .........................................................................................95
4.10 Coefficient of Friction measurements of the as-deposited ALD grown one trilayer
nanolaminate. (a) 50 gram load with SS440 C ball (b) 100 gram load with SS440 C
steel ball (c) 50 gram load with Si3N4 ball and (d) 100 gram load with Si3N4 ball ..97
4.11 Coefficient of Friction measurements of the 400oC annealed ALD grown one
trilayer nanolaminate. (a) 50 gram load with SS440 C steel ball, (b) 50 gram load
with Si3N4 ball, (c) 100 gram load with Si3N4 ball and (d) 250 gram load with
Si3N4 ball ..................................................................................................................99
4.12 Coefficient of Friction measurements of the 1000oC annealed ALD grown one
trilayer nanolaminate. (a) 25 gram load (b) 50 gram load and (c) 100 gram load.
Si3N4 ball was used as the counterface material during the friction test ................101
4.13 Optical microscope images of the Si3N4 balls used to test the COF. From left is
the 25 gram, 50 gram and 100 gram load pin balls respectively ...........................102
Page 14
xii
Page
4.14 Calculated wear factors of the wear tracks (a) As-deposited, (b) 400oC annealed
and (c) 1000oC annealed nanolaminates one trilayer ..............................................104
4.15 Secondary electron image and Auger images (Fe, O and Zn) of 100 gram load
wear track with SS440 C steel ball of as-deposited one trilayer .............................106
4.16 Secondary electron image and Auger images (Si, O and Zn) of 100 gram load
wear track with Si3N4 ball of as-deposited one trilayer ..........................................107
4.17 XPS high resolution scan of iron peak ....................................................................109
4.18 Secondary electron image and Auger images (Zn and Al) of the surface of 1000oC
annealed trilayer film ..............................................................................................111
4.19a Secondary electron image and Auger maps of Zn, Al, Si and an overlayed map
of 100 gram load wear track with Si3N4 ball of 1000oC annealed one trilayer
film .........................................................................................................................112
4.19b Auger maps of Zr and an overlayed Zn, Al and Zr of 100 gram load wear track
with Si3N4 ball of 1000oC annealed one trilayer film .............................................113
4.20 HRSEM image of one trilayer of 100 gram load with Si3N4 pin ball showing
location of cross-sectional FIB-cut .........................................................................114
4.21 XTEM image of as-deposited worn one trilayer.....................................................115
4.22 XTEM micrograph of worn one trilayer film, the amorphous layer shows the worn
ZnO .........................................................................................................................117
4.23 XTEM micrograph of worn as-deposited one trilayer film showing (top) ZnO
basal stacking faults along the [0001] growth direction, (bottom) ZnO partial
dislocations on the (0002) basal plane ....................................................................118
4.24 XTEM image of 400oC annealed worn one trilayer. Insert image shows a
magnified micrograph of one of the ZnO nanocolumnar grains near the surface
where the presence of defects and shearing of the columnar grains are observed .120
4.25 XTEM micrograph of worn 400oC annealed one trilayer film showing ZnO low
angle grain boundary defects present in the ZnO layer ..........................................121
Page 15
xiii
Page
4.26 XTEM image of 1000oC annealed worn one trilayer .............................................122
4.27 XTEM results of worn 1000oC annealed one trilayer nanolaminate film revealing
the microstructure and layer composition ...............................................................123
4.28 XTEM chemical analysis showing chemical maps of worn 1000oC annealed one
trilayer nanolaminate film .......................................................................................124
4.29 X-ray diffraction of (a) 2 bilayer ZnO/ZrO2 and (b) 8 bilayer ZnO/ZrO2
nanolaminate coating at room temperature and ex situ annealed 400oC for 2
hours ........................................................................................................................126
4.30 Coefficient of Friction measurements of (a) 2 bilayer ZnO/ZrO2 and (b) 8 bilayer
ZnO/ZrO2 nanolaminate coating at room temperature and ex situ annealed 400oC
for 2 hours ...............................................................................................................128
4.31 Cross-sectional TEM of unworn ZnO/ZrO2 8 bilayer nanolaminate coating.
Platinum was deposited to protect the coating from cross-sectional milling ..........130
4.32 XTEM of worn ALD ZnO/ZrO2 8 bilayer nanolaminate coating. Arrow points to
worn ZnO. Insert shows a magnified area in the box .............................................131
5.1 XRD measurements of ALD deposited ZnO/Al2O3/ZrO2/Al2O3 nanolaminate film
on M50 steel substrate before and after anneal .......................................................143
5.2 XTEM bright field image of unworn ZnO/Al2O3/ZrO2/Al2O3 nanolaminate film
grown on M50 steel ................................................................................................146
5.3 Magnified XTEM image showing the interface between the ZnO layer and the Pt
layer of the unworn ZnO/Al2O3/ZrO2/Al2O3. There is the presence of basal stacking
faults (white arrows) along the [0001] growth direction ........................................147
5.4 Coefficient of friction measurements of the ZnO/Al2O3/ZrO2/Al2O3 nanolaminate
films grown on M50 steel. (Top) as-deposited nanolaminate (bottom) 400oC
annealed nanolaminate film ....................................................................................149
5.5 Linear regression fits for friction coefficient as a function of inverse Hertzian
pressure for as-deposited and 400oC nanolaminate films ........................................151
Page 16
xiv
Page
5.6 Calculated wear factors of the 100 and 250 gram loads for as deposited (black) and
400oC annealed nanolaminate films .........................................................................152
5.7 XTEM bright field image of a worn ZnO/Al2O3/ZrO2/Al2O3 nanolaminate grown
on M50 steel substrate .............................................................................................154
5.8 Magnified XTEM image of the ZnO layer showing the presence of stacking faults
in the [0001] direction ..............................................................................................154
5.9 XTEM images of the ZnO layer with their corresponding FFT diffraction pattern
and the Fourier-filtered image for (a) {0002} basal plane and (b) {01-10} prismatic
plane .........................................................................................................................156
5.10 Intrafilm shear velocity accommodation mode where a friction-induced
subsurface controlled by the material’s microstructure aids in shear accommodation
(prevents brittle fracture) .........................................................................................159
5.11 COF measurements in dry nitrogen of the as-deposited and 400oC annealed
ZnO/Al2O3/ZrO2/Al2O3 nanolaminate film deposited on M50 steel .......................160
5.12 High resolution SEM images of as-deposited and 400oC annealed unworn and
worn (in dry nitrogen) ZnO/Al2O3/ZrO2/Al2O3 nanolaminate films deposited on
M50 steel ..................................................................................................................161
5.13 Microscopic images showing the ZnO/Al2O3/ZrO2/Al2O3 nanolaminate film
deposited on M50 cups. The arrows points to the wear tracks ................................163
5.14 XTEM image of ZnO/Al2O3/ZrO2/Al2O3 nanolaminate film on CrN/Cr/M50 steel
cup. Insert is HRSEM image of the location of cross-sectional FIB-cut .................164
5.15 XTEM image of worn ZnO/Al2O3/ZrO2/Al2O3 nanolaminate film on CrN/Cr/M50
rod, this was after 6 million cycles ..........................................................................165
5.16 (a) Magnified XTEM image of worn ZnO layer showing the presence of stacking
faults. (b) Fourier-filtered image of another ZnO layer after RCF test showing the
presence of stacking faults .......................................................................................166
Page 17
CHAPTER 1
INTRODUCTION
1.1 Historical Perspective
Friction is defined as the force that helps in resisting the relative lateral motion of
solid surfaces or fluid layers in contact. It has been known and studied for ages. The laws
of friction have a rich history. The theories, deductions and experiments of scientific
geniuses Leonardo da Vinci (1452-1519), Isaac Newton (1643-1727), Guillaume
Amontons (1663-1705), and Charles Coulomb (1736-1806) give the world its first
intellectual insights into the world of friction.1 Leonardo da Vinci, ca. 1500, realized how
important friction was for the working of machines and according to his notebooks, he
found that friction is independent of contact area and frictional resistance of a body is
about 1/4 of its weight (both of which are generalizations). In 1699, French physicist
Guillaume Amontons, who was unaware of da Vinci's work, published his own work on
friction. Attempting to explain friction, he theorized that friction is caused by surface
roughness. The peaks of one surface lay in the valleys of the adjoining surface, and
Amontons believed that friction is the force required to pull the peaks up the other
surface until they clear. He rediscovered the laws of friction for dry sliding between two
flat surfaces (1st law: friction force is proportional to normal force and 2nd law: magnitude
of friction force does not depend on the apparent area of contact). Several years later,
French physicist Charles Augustin de Coulomb (1785) verified Amontons’ observations
1
Page 18
and postulated another friction law: the frictional force is independent of velocity once
motion starts. He also studied the difference between static friction and kinetic friction.
As to the cause of friction, Coulomb theorized that at least part of the frictional force
might result from cohesion of molecules of the two sliding surfaces. Many developments
occurred over the years until 1950 when Francis Bowden and David Tabor (Cavendish
Laboratory, Cambridge University, UK) elucidated many of the current mechanisms for
reduction of friction and wear; as examples, using soft coatings and adherent molecular
and lubricant surface layers.2,3 It should be noted that the aforementioned laws of friction
are empirical in nature and there are cases in which they do not apply. For example,
Chapter 5 shows an example where the friction force for nanocrystalline zinc oxide
(ZnO) coatings does not increase linearly with normal force as predicted by Amontons;
instead, it follows a normal force to the -1/3 power, which is consistent with the Bowden
and Tabor analysis for Hertzian contacts.
1.2 Motivation
Solid and liquid lubricants are substances that are introduced between two moving
surfaces to reduce friction, which results in wear reduction and overall improved
efficiency.4 Hence in situations where friction needs to be mitigated, lubricants have been
used to minimize interfacial contacts. The first evidence of society using lubricants was
from the Egyptians, whom used water to help lubricate sleds that carried massive stone
monuments and later from the Romans whom used rags dipped in animal fat (lard) to
lubricate wagon wheels.2 In more recent times mankind has replaced these kinds of
2
Page 19
natural lubricants with synthetic oils and greases from petroleum distillates due to their
efficiency in modern machinery.
Unfortunately liquid-based lubricants have limitations which make them not
applicable to the ever increasing demand for future extreme applications. Some of these
limitations include (but not limited to) the fact that they
• Are likely to degrade or decompose at high temperatures or under high radiation
fluxes
• Cannot be used in high vacuum environments or inert atmospheres (e.g. outer
space)
• Can solidify or congeal at low temperatures, or volatize in high-vacuum
environments5
Due to these technological challenges and demanding applications, in the past several
years solid lubricants are being increasingly employed in extreme environments (e.g.,
high temperatures, ultrahigh vacuum) as a solution to areas where the liquid lubricants
are not applicable. Solid lubricants are materials which despite being in the solid state are
able to reduce friction between two surfaces sliding against each other without the need
for a liquid media.6 The process of solid lubrication has been described with many
names; these including “dry lubrication, dry-film lubrication, solid lubrication, and solid-
film lubrication”, which all imply that the process occurs under non-liquid conditions.
Therefore in a broad sense, lubrication by solids embraces any process where a
lubricating solid is present between the contacting materials.5
3
Page 20
Specifically, solid lubricants generally have the following advantages over liquid
lubricants:
• Higher stability and better tribological properties in extreme cyclic conditions,
such as high-temperatures (> 500oC) to cryogenic temperatures (< oC) operation,
ultrahigh vacuum (10-9 to 10-10 torr) to ambient pressure and ambient air (high
humidity) to dry nitrogen (low humidity) environments
• Higher order of effectiveness at high loads and slow speeds
• Liquid lubricants are sometimes not appropriate due to migration and aging
(liquid can settle leaving some parts unprotected)
• Provide design simplification because lubrication distribution systems and seals
are not required
The following can be considered as disadvantages:
• Do not have the ability to self-heal or replenish in the tribological contact
• Can eventually wear away over time
• In some lubrication regimes, such as hydrodynamic lubrication, they have higher
friction and resultant wear
• Have high coefficient of friction and wear than for hydrodynamic lubrication
• Their color may be undesirable, such as with graphite and carbon nanotubes5
Individual solid lubricants that are currently available mostly perform best only
for a limited range of operating conditions. For example, environment plays a significant
role in determining the tribological performance of thin films and coatings that are
designed to mitigate friction and wear. Coatings that give extremely low friction and
4
Page 21
long wear life in one environment can fail to do so in a different environment. There are
many classes of solid lubricating materials in both bulk and coating form: (a) transition
metal dichalcogenides such as MoS2 and WS2, (b) carbon-based materials like graphite,
diamond-like carbon, nanocrystalline diamond, (c) polymers, such as
polytetrafluoroethylene, PTFE, and (d) soft metals like silver, tin, indium, gold and their
alloys. Barring a few exceptions, most of these materials can be applied as thin coatings
on tribological components (bearings, seals, magnetic hard drives, etc.) to reduce friction,
wear and debris generation.
1.2.1. Transition Metal Dichalcogenides
1.2.1.1. Molybdenum Disulfide (MoS2) and Tungsten Disulfide (WS2)
Among the various members of the transition metal dichalcogenides family of
compounds, MoS2 and WS2 are well known for their solid lubricating behavior and are
widely used in practical applications. Their lubricating behavior stems from their
intermechanical weakness which is intrinsic to their crystal structure. For example, MoS2
crystallizes in the hexagonal structure where a sheet of molybdenum atoms is sandwiched
between two hexagonally packed sulfur layers with a high c/a ratio (c=12.29Å,
a=3.16Å). The bonding within the S-Mo-S sandwich is covalent, while weak Van der
Waals forces hold the sandwich together resulting in interlamellar mechanical weakness.
Thus, under a shearing force the basal planes slide over one another by intracrystalline
slip and transfer to the rubbing counterface. The main mechanisms for imparting low
interfacial shear are: a) creation of the (0002) basal plane by separating the weakly
bonded sandwiches and subsequent reorientation parallel to the sliding direction, and b)
5
Page 22
the development of a transfer film on the counterface to accommodate interfacial sliding.
The ability of MoS2 and WS2 to form transfer films on the counterface implies that is not
necessary to coat both surfaces of the sliding couple; coating one contacting surface
would suffice to generate low friction after the initial run-in period. Also, it is not
necessary to have fully crystalline films with the preferred parallel crystallographic
texture. Several experimental studies confirmed that friction would induce crystallinity
into MoS2 and WS2 films that lack long range order, and orient the (0002) planes parallel
to the sliding direction during the run-in period. Tungsten disulfide also behaves in a
similar fashion, but it is more expensive to synthesize compared with the naturally
occurring molybdenite. However, WS2 is thermally stable to approximately 500 to
550ºC, while the performance of MoS2 begins to deteriorate above 400ºC.7,8 Both MoS2
and WS2 coatings exhibit extremely low friction coefficients (μ~0.02 or less) and long
wear life (several million sliding cycles) when employed in either dry inert gas or in
ultrahigh vacuum.9 However, when sliding in humid air, dangling or unsaturated bonds
on the edge of basal planes react with moisture and oxygen in the environment to form
tribooxidation products, such as MoO3 and WO3, resulting in higher friction (0.15-0.2)
and extremely short wear life.10
1.2.1.2. Doped MoS2 and WS2
There is an increasing demand for environmentally robust solid lubricant coatings
that can adapt themselves to different.11 For instance, even if the targeted application is
friction mitigation in space, often times the satellites and satellite launch vehicles wait for
extended periods of time in humid coastal environments prior to launch, potentially
6
Page 23
exposing the moving mechanical assemblies to humidity. In view of this, there have been
major studies aimed at developing multi-phase materials known as adaptive lubricants
and chameleon coatings.12 A number of metal or oxide dopants in MoS2 have also been
successfully tried. Notable examples of dopants include: Ti, Al, Ni, Au, Pb, PbO, and
Sb2O3. The presence of these dopants can lead to increased coating density, hardness and
oxidation resistance in humid environments compared to pure MoS2. Amongst these,
Sb2O3 and Au doped MoS2 films12,13,14 and Ti doped MoS2 films15 are gaining acceptance
as robust coatings for commercial use, including for applications in satellites.
1.2.2 Carbon-Based Materials
1.2.2.1 Graphite
Graphite is also a layered solid with a hexagonal lattice and high c/a ratio (c =
6.71Å, a = 2.46Å).10 Similar to MoS2, the carbon atoms in their basal planes are held
with strong covalent bonds while the basal planes themselves are held together by weak
Van der Waals cohesive forces, resulting in interplanar mechanical weakness. The
presence of water vapor in the environment and crystal defects are believed to facilitate
the interlamellar shearing of graphite crystals. These basal planes exhibit low surface
energies and have little adhesion amongst them. However, when the basal plane becomes
damaged, high energy edge sites of the lamellae are exposed and bond strongly to other
edge sites causing increased adhesion. Low friction is maintained when these reactive
edge sites are neutralized (passivated) by the adsorption of water, or other condensed
vapors.10 Unlike the case of MoS2 and WS2, graphite needs moisture, or adsorbed gases,
in the environment (>100 ppm) - they either act as intercalants or passivate the dangling
7
Page 24
covalent bonds, or both, to lubricate. In vacuum and in dry environments, graphite
without additives exhibits high friction - a phenomenon known as “dusting,” first
observed in the late 1930s when graphite brushes in aircrafts experienced accelerated
wear at high altitudes. The most widespread use of graphite (besides electrical contact
brushes) in anti-friction applications is in metal- and polymer-matrix self lubricating
composites as ‘built-in’ solid lubricant. Sometimes graphite is also applied as a resin
bonded coating.
1.2.2.2. Diamondlike Carbon (DLC)
DLC coatings are typically amorphous with short range ordered phases of mixed
sp3-type tetrahedral bonding (diamond hybridization) and sp2-type trigonal bonding
(graphitic hybridization). These are known to exhibit an unusual combination of
tribological and mechanical properties: low friction coefficients and low wear rates,
relatively high hardness, and high elastic modulus.16 DLC materials doped with hydrogen
(~10–50 at.%) are commonly referred to as hydrogenated DLC. Alternatively, DLC can
be doped with S, Si and SiOx, as well as transition metals, such as Cr, W and Ti, which
form nanoscale hard metal carbide phases, to improve their mechanical behavior and
wear resistance. The friction coefficients of DLC coatings range from 0.001 to 0.5
depending upon the test conditions (i.e., contact stress, sliding velocity, temperature) and
the environment. In addition, the chemical bonding and hydrogen content of the coatings
profoundly influence the friction coefficient. For instance, hydrogen-free DLC coatings
work best in humid air where low friction coefficients (~0.1) can be achieved for long
durations, while hydrogenated coatings perform better in dry or inert gas environments.
8
Page 25
Synthesizing one single DLC material to achieve low friction in both dry and
humid environments can be a challenging task. Recent research shows promise for
environmentally-robust tribological nanocomposite coatings, such as diamondlike
nanocomposite (DLN), whose structure has been conjectured to consist of two
amorphous interpenetrating networks, a diamondlike (a-C:H) network and a quartzlike
(a-Si:O) network with minimal bonding between the two networks.17 The mutual
stabilization of these networks prevents the growth of graphitic carbon at high
temperatures as well as serves to enhance the adhesion and reduce the internal stress to
approximately −0.5 GPa. The composition of DLN can vary but is typically around (CH
0.15)0.7(SiO0.3)0.3.
There are many similarities in the tribological behavior of DLN and MoS2. For
instance, DLN (as well as many other DLCs) transfer a thin layer of material from the
coating to the counterface, known as a transfer film. Thus, it is not necessary to coat both
surfaces of the friction couple. Secondly, DLN also exhibits non-Amontonian behavior
with friction coefficient decreasing with increasing Hertzian contact stress. Chemical
mapping by Time-of-Flight Secondary Ion Mass Spectroscopy (ToF-SIMS) aided by
Automated eXpert Spectral Image (AXSIA) software showed that the transfer film in dry
nitrogen was predominantly a mixture of long range carbon and hydrogenated carbon
while in humid air it was composed of mostly silicon oxide species.18 It appears that by
forming transfer films of long range carbon and hydrogenated carbon in dry nitrogen, and
predominantly silicon oxide species in humid air, DLN is able to adapt itself to both dry
and humid environments, thus becoming an environmentally-robust low friction coating.
9
Page 26
Besides the inherent tribological behavior and the environmental effects discussed
above, coating-substrate interface plays a critical role in governing the coating
performance. For instance, DLCs are known to have adhesion issues with substrate
materials that contain non-carbide forming elements. In such cases, a thin Ti adhesion
layer is typically applied prior to depositing DLC. Focused ion beam (FIB) microscopy
and finite element analysis modeling (FEM) are important tools to study coating-
substrate interface reliability. FIB-sections of wear scars are routinely made to visualize
friction-induced subsurface deformation and to validate FEM.18,19 For example, when
contact stresses are increased beyond a limit that the substrate begins to plastically yield,
Hertzian elastic contact theory is no longer valid. This underscores the need to design
multilayer coating architecture (e.g., a hard coating sandwiched between DLN and the
softer substrate) to withstand higher operating stresses.
1.2.2.3. Nanocrystalline Diamond
Diamond films offer many attractive properties such as high hardness, stiffness,
thermal conductivity and high resistance to wear. Diamond when applied as a coating
with ultrananocrystalline structure, i.e., ~3-5 nm grains, is referred to as
ultrananocrystalline diamond, or UNCD. UNCD exhibits low surface roughness (~13 nm
RMS) and low friction in both dry nitrogen and humid air. Like MoS2/Sb2O3/Au and
DLN coatings, the friction coefficients of UNCD (self-mated configuration) decreased
with increase in Hertzian contact stress. However, unlike MoS2/Sb2O3/Au and DLN
coatings, the friction coefficients and interfacial shear strengths are lower in humid air
than in dry nitrogen, which may be due to adsorbed water passivating the dangling bonds
10
Page 27
on the UNCD surfaces.20 Furthermore, it is desirable to coat both surfaces of the friction
couple and use it in self-mated configuration to avoid wear of the uncoated counterface.21
1.2.3 Polymers
Among polymeric materials, polytetrafluoroethylene (PTFE) is well known for its
antifriction property.10 This follows from its smooth molecular profile and low
intermolecular cohesion.22 PTFE has no unsaturated bonds and is not easily polarized.
During sliding contact it forms a thin transfer film of itself on the counterface, like the
previously mentioned solid lubricant coatings. Unfortunately, the low intermolecular
cohesion responsible for easy drawing of molecular chains out of the crystalline portions
of the polymer, which gives rise to low friction (~0.1 against a steel counterface), results
also in unacceptable amounts of wear.23,24 Thus, it is impossible to achieve the desired
combination of low friction and wear using PTFE alone. Without sacrificing the
characteristic low friction of PTFE, its wear resistance can be improved (by up to a factor
of 1000) by adding fillers to the PTFE matrix.24 The improved wear performance of
filled PTFE may be due to the formation of a continuous and strongly adhering of
transfer film on the counterface. PTFE also shows decreasing friction coefficients with
increasing contact stress, similar to other solid lubricants. PTFE is used as a matrix in
self-lubricating composites as well as solid lubricant fillers (fibers and powders) in
composites, e.g., electroplated Ni-PTFE coatings, for low friction applications. However,
attempts to deposit thin coatings of PTFE by physical vapor deposition techniques often
result in cross-linking the polymer and loss of its antifriction characteristics.
11
Page 28
1.2.4. Soft Metals
Soft metals, such as lead, tin, indium, silver and gold when applied as thin films
on relatively hard substrates can result in low shear strengths and hence low friction. The
widespread use of Pb, Sn and In is in bearing alloys. Examples include Babbit metals
based on needle shaped intermetallics in a tin-rich matrix, leaded bronzes containing
islands of lead in a bronze matrix and Al-Sn alloys. These are applied as thick overlays
in steel backings to fabricate the bearings. Silver is sometimes used as a filler in high
temperature self-lubricating and composites.24,25 Thin layers of soft metal can either
provide shear accommodation or their low melting eutectics can result in melt lubrication
at asperity contacts.
CaF2, BaF2, PbO, and B2O3 are other solid lubricants that also provide lubrication
at high temperatures, since their shear strength decreases at these high temperatures just
like the soft metals. But after melting, they become glass-like and are highly prone to
cracking when used again at low temperatures.26 Accordingly, better solid lubricants that
can perform over a wide range of extreme conditions, have low friction coefficient and
good wear resistance are necessary.
Oxides have been studied lately as good potential candidates for solid lubrication
because they are thermodynamically stable in air and even at elevated temperatures.
Oxide surfaces are generally inert and typically do not form strong adhesive bonds like
metals in tribological contacts. The inability of single crystal and microcrystalline oxides
to deform plastically or shear prevents them from obtaining low friction, as well as
forming friction reducing third-body films on wear surfaces and the wear debris formed
12
Page 29
from them is usually abrasive. That is, due to their brittle nature at room temperature,
there has been little attention given to oxides as possible candidates as solid lubricants.
Studies by Karch et al.27 determined that if the grain size of conventional polycrystalline
ceramics (oxides included) can be reduced down to a few nanometers, it would become
ductile. They concluded that, the ductility seemed to originate from the diffusional flow
of atoms along the intercrystalline interfaces. Schoitz et al.28 with the help of computer
simulations also reported that grain boundary sliding was in large parts responsible to the
plastic deformation in nanocrystalline metal with a minor contribution from dislocation
activity in the grains. It was therefore realized that plastic deformation in ceramics could
be exhibited by nanocrystalline films at low temperatures. The grain size refinement was
applied by Zabinski et al.29 in their quest of studying the use of ZnO as a solid lubricant
over a wider range of temperatures. They reported that thin film nanocrystalline grain
size zinc oxide has high potential to be lubricous material because it is relatively soft,
ductile and the chemical stoichiometry and microstructure can be controlled to introduce
defects into the film. Their tribological sliding measurements showed a friction
coefficient of ~0.2 while bulk ZnO film exhibited coefficient of friction values of ~0.7-
0.8 at room temperature. As the grain sizes increased and approached that of
conventional oxides especially with the increase in coating thickness, the coefficient of
friction also increased and lubricity is eventually lost. Romanes30 addressed the issue of
growing a thick film and maintaining the nanometer grain size based on the Elam et al.31
hypothesis that by alternating ZnO and a second oxide in a nanolaminate configuration,
the nanometer grain size could be preserved. Romanes reported on the crystal structure
13
Page 30
and tribological behavior of ZnO/Al2O3 nanolaminate; in particular the effect of growth
temperature and their interfacial density. The nanolaminate films were deposited by an
atomic layer deposition (ALD) technique. Therefore, the motivation of this research is to
determine what combination and sequence of ALD deposited nanolaminates of ZnO,
aluminum oxide (Al2O3) and zirconium oxide (ZrO2) (high fracture toughness ceramic)
will provide the best tribological behavior based on engineering the nanolaminate
structure and tailoring its structural defects. In addition, the dissertation will focus on the
effect of how ex-situ annealing changes the nanolaminate crystal structure and
tribological (friction and wear) properties.
As the thickness of thin films continues to be scaled down, deposition tools that
can coat with high-quality and ultra thin films are required. Typical chemical vapor
deposition (CVD) or physical vapor deposition (PVD) techniques are difficult to achieve
conformal and uniform films with the appropriate thickness, and they are also not capable
of coating structures with high aspect ratios (buried interfaces/shadowed surfaces). ALD
is currently considered as one of the most promising thin film deposition techniques for
enabling nanoscale device fabrication. ALD is suitable for manufacturing inorganic
material layers with thickness down to a fraction of a monolayer. The ALD technique
offers unprecedented thickness control, quality, uniformity and material properties of the
monolayer films. It has the capability to coat extremely complex shapes with a conformal
material layer of high quality capability unique among thin-film deposition techniques.
Due to these unique properties, ALD is finding more applications.32,33,34
14
Page 31
The nanolaminate solid lubricant will be grown on Si and M50 high temperature
bearing steel with more details in Chapter 3. The M50 bearing steels will be used for high
temperature rolling contact fatigue (RCF) applications in order to study the lifetime of the
coated nanolaminate film. RCF results in surface damage when stress is repeatedly
applied where two bodies roll on one another. It is a family of damage phenomena like
cracking or pitting/delamination that are limited to the near-surface layer of bodies in
rolling contact.35 It is responsible for the failure of rolling element bearings, gears, and
camshafts. Due to increased demands and harsher extreme operation conditions (i.e.,
higher temperatures, contact pressures, severe environmental conditions that can lead to
corrosion, oxidation and erosion) than before, new solid lubricants that can meet these
challenges are needed.36 There are two key processes that govern RCF: crack initiation
and crack propagation which are related to the characteristics of the surface quality, stress
distributions and lubrication conditions. But the main factor that causes RCF failure
presently is the surface crack defects.37 In order to prevent crack initiation and
propagation, a tough ceramic oxide with a very high elastic modulus is required; ZrO2 is
one of the toughest ceramics at low temperatures. ZrO2 was used as a high toughness/-
load bearing layer, which shown in chapter 4 helped prevent any crack initiation and
propagation in the nanolaminate film. Additionally, the topmost lubricous nanocrystalline
ZnO layer was structurally-engineered to achieve low surface energy, textured (0002)-
orientated grains, which provided low sliding friction coefficient and wear factors. This
ZnO texture was achieved by depositing an amorphous Al2O3 layer beneath the ZnO
layer.
15
Page 32
Therefore this study is aimed at how the film texture/structure influence the
friction and wear properties. The deformation mechanism that is associated with the low
coefficient of friction values is quantified. The friction and wear reducing mechanism in
ZnO was studied by focused-ion beam high resolution scanning electron microscopy
(FIB/HRSEM) and high resolution transmission electron microscopy (HRTEM) analysis
inside worn surfaces and subsurfaces..
1.3 Contributions of Dissertation
This work is aimed at providing the following answers to three important
questions:
a. How does ALD processing determine the ZnO/ZrO2 and ZnO/Al2O3/ZrO2
nanolaminate defective structure and how this structure affects tribological
properties?
b. How are the structure-property interrelationships affected by ex situ annealing of
the nanolaminates?
c. Is nanoscale plasticity observed and if so what is (are) the plastic deformation
mechanism(s) of the nanocrystalline ZnO layer after sliding and rolling (RCF)?
This will be accomplished by using HRSEM/FIB and HRTEM analyses that can
provide a site specific investigation of the tribologically-altered surface and
subsurfaces.
16
Page 33
1.4 Dissertation Overview
This dissertation deals with the ALD synthesis of ZnO, Al2O3 and ZrO2
nanolaminates, their structural and tribological properties. It has six main chapters. This
chapter (Chapter 1), provides a broad introduction to the genesis of friction, lubrication
and the potential of the use of oxides as solid lubricants. The motivation for this study is
also provided here. Chapter 2 discusses an overview of tribology, solid lubrication
mechanism and the most recent studies on potential solid lubricants to be used in extreme
conditions. This chapter also discusses the basic features of ALD, its benefits/limitations
and a detailed ALD process for growing ZnO, Al2O3 and ZrO2. Chapter 3 describes and
discusses the experimental procedures and characterization techniques. Chapter 4
discusses the deposition of ZnO/Al2O3/ZrO2 and ZnO/ZrO2 nanolaminates on silicon
substrate, the resultant structure and the role of defects in controlling the tribological
properties of the films. In Chapter 5, a parallel study of ZnO/Al2O3/ZrO2 nanolaminate
film deposited on M50 high temperature bearing steel substrates is presented. Chapter 6
outlines with the conclusions based on the experimental results of the preceding chapters,
as well as recommendations for future work. Each chapter ends with a list of works that
were referenced.
17
Page 34
1.5 Chapter References
1 Dowson, D., History of Tribology, 2nd edition, Wiley, (1998).
2Bhushan, B., Introduction to Tribology, John Wiley & Sons, NY. (2002).
3 Khonsari, M. M., Booser, R. E., Applied Tribology: Bearing Design and Lubrication,
John Wiley & Sons, NY. (2001).
4 Totten, G.E., Westbrook, S.R., and Shah, R.R., Fuels and Lubricants handbook:
Technology, Properties, Performance and Testing, Vol 1, ASTM Manual Series; MNL 37
(2003)
5 R. L. Jentgen. IEEE Transactions on Parts, Hybrids, and packaging, Vol. PhP-7, No. 2,
June (1971)
6 Ludema, K.C., Friction, Wear and Lubrication:A Textbook in Tribology, CRC Press
LLC, FL, (1996)
7 Brainard, W.A., NASA TN D5141 (1969)
8 Sliney, H.E., Trib. Int. 15, 303 (1982)
9 Braithwaite, E.R., Solid Lubricants and Surfaces, Clarendon, Oxford, (1964) 139,
10 Prasad S.V., and Zabinski, J.S., Nature, 387 (1997) 761
11 Muratore, C., and Voevodin, A.A., Annu. Rev. Mater. Res., 39 (2009) 297
12 Hilton, M.R., and Fleischauer, P., Surf. Coat. Technol. 54-55 (19920 435
13 Zabinski, J.S., Donley, M.S., Walck, S.D., Schneider, T.R., and McDevitt, N.T., Trib.
Trans. 38 (1995) 894
14 Scharf, T.W., Kotula P.G., and Prasad, S.V., Acta Materialia, 58 (2010) 4100-4109
15 Teer, D.G., Wear 251 (2001) 1068
18
Page 35
16 Erdemir, A., and Donnet, C., eds., Tribology of Diamond-like Carbon Films:
Fundamentals and Applications, Springer, 2008
17 Scharf, T.W., Ohlhausen, J.A., Tallant, D.R. and Prasad, S.V., Journal of Applied
Physics, 101 (2007) 063521-1 -063521-11
18 Prasad, S.V., Michael, J.R., and Christenson, T.R., Scripta Mat. 48 (2003) 255
19 Jungk, J.M., Michael, J.R., and Prasad, S.V., Acta Mat. 56 (2008) 1956
20 Konicek, A.R., Grierson, D.S., Gilbert, P.U.P.A., Sawyer, W.G., Sumant, A.V., and
Carpick, R.W., Phys. Rev. Lett. 100 (2008) 235502
21 Grierson, D. S., Sumant, A.V., Konicek, A.R., Abrecht, M., Birrell, J., Auciello, O.,
Carlisle, J.A., Scharf, T.W., Dugger, M.T., Gilbert, P.U.P.A., and Carpick, R.W., J. Vac.
Sci. Technol. B 25 (2007) 1700
22 Briscoe B. J., and Tabor, D., Wear, 34 (1975) 29
23 Bahadur, S., and Tabor, D., Wear, 98(1984) 1
24 Dellacorte C., and Sliney, H.E., Lubric. Eng., 48 (1992) 877
25 DellaCorte, C., Edmonds, B.J., and Benoy, P.A., NASA TM-210944, (2001)
26 Zabinski, J. S., Sanders, J. H., Nainaparampil, J. and Prasad, S. V., Tribology Letters, 8
(2002)103-116
27 Karch, J., Birringer, R., Gleiter, H., Nature 330 (1987)556-558
28 Schiotz, J., Di Tolla, F. D. and Jacobsen, K. W., Nature 391 (1998) 561
29 Zabinski. J. S., Corneille, J., Prasad, S. V., McDevitt, N. T. and Bultman, J. B., J.
Mater. Sci. 32 (1997) 5313-5319
30 Romanes, M., PhD Dissertation, Uni. of N. Texas (2008)
19
Page 36
20
31 Elam, J. W., Sechrist, Z. A. and Gordon, R. G., Thin Solid Films 414 (2002) 43-55
32 Becker, S. J., PhD Dissertation, Harvard University (2002) 9
33 Puurunen, R. L., J. of Applied Physics 97 121301 (2005)
34 Kim, H., Lee, B. H. and Maeng, J. W., Thin Solid Films 517 (2009) 2563-2580
35 Stewart, R. and Ahmed, R., Wear 253 (2002) 1132-1144
36 Erdemir, A., Rolling-contact fatigue and wear resistance of hard coatings on bearing
steel substrates. In: presented at 19th Int. Conf. on Metallurgical Coatings and Thin Films
(April 1992)
37 Wereszczak, A.A., Wang, W., Wang, Y., Hadfield, M., Kanematsu, W., Kirkland, T.P.,
and Jadaan, O.M., http://info.ornl.gov/sites/publications/files/Pub2425.pdf
Page 37
CHAPTER 2
OVERVIEW OF SOLID LUBRICANT FRICTION AND WEAR
NANOCRYSTALLINE OXIDE CERAMICS AND ATOMIC LAYER DEPOSITION
2.1 Solid Lubricant Tribology (Friction and Wear)
The word ‘tribology’ is derived from the Greek word tribos, meaning rubbing or
sliding. Tribology is the science and technology of interacting surfaces in relative motion.
It encompasses every aspect of friction, lubrication and wear. Tribology is an
interdisciplinary field. Rather complex surface interactions in a tribological interface
require knowledge of various disciplines, such as materials science/engineering,
mechanical engineering, chemistry, physics, solid mechanics, and rheology.
2.1.1. Friction
Key to tribology is the frictional force, F, which is the lateral resistance
encountered when two surfaces are in relative motion with each other. There is a
relationship between the frictional force and the force or load acting normal to the
direction of motion (L), known as the coefficient of friction (COF) or µ
(2.1)
LFCOF =)(μ
The COF is not a material’s intrinsic property but rather a system’s property since it is a
function of the applied load, interfacial temperature, sliding velocity and environment.
21
Page 38
Usually, high COF is undesirable; however, it is essential in certain areas such as car tires
that provide traction on the road and screws to hold construction materials together.
According to the classical theory of Bowden and Tabor,1 friction force, F, is a
product of the contact area (A) and the shear strength (τ) of the lubricant material (see
Figure 2.1). Thus, the friction coefficient, μ, can be expressed by:
(2.2) ατττμ +====•
H
o
H PPLA
LF
where L is the normal force (load); PH is the mean Hertz pressure; τo is the interfacial
shear strength, a ‘velocity accommodation parameter’ which is a property of the
interface; and α represents the pressure dependence of the shear strength. The constant
‘α’ is the lowest attainable friction coefficient for a given friction couple. In principle, a
hard material with a soft skin ought to provide low friction coefficient by reducing το and
increasing PH (low A).
Figure 2.1: Schematic of a hemi-spherical pin sliding on a coated substrate. Tribology is a system’s property, principally governed by contact mechanics and tribochemical (chemistry induced by sliding) reactions.
22
Page 39
For a ‘sphere-on-flat’ elastic contact, which is known as the Hertzian elastic
contact model, this friction coefficient can be expressed as:
(2.3) απτμ +⎟
⎠⎞
⎜⎝⎛= − 3/1
3/2
43 L
ER
o
where R is the sphere radius and E is the equivalent Young’s modulus. Instead of the
Amontonian first law of friction, where μ is independent of L, the Bowden and Tabor
analysis for Hertzian contacts predicts,
(2.4)
3/1−∝ Lμ
Thus, when contact deformation is elastic, the friction coefficient will decrease with
increasing normal load (or mean Hertz pressure). The linear relationship between L-1/3
and μ (Eq. 2.3) has been experimentally verified for a number of solid lubricant coatings
(see Figure 2.2).
23
Page 40
Figure 2.2: Linear regression fits for friction coefficient as a function of inverse Hertzian pressure fitted to μ=(τ
o/P
H)+α with values of shear strength (τ
o) shown for three low
friction, environmentally-robust coatings: Si3N
4 on DLN, UNCD coated Si
3N
4 on UNCD,
and Si3N
4 on MoS
2/Sb
2O
3/Au in both dry nitrogen and humid air [T.W. Scharf private
communication].
For thin and soft coatings, the pressure is primarily supported by the substrate and
increasing the substrate modulus and hardness will decrease the contact area for a given
normal load. Thus, the ideal scenario for achieving low friction is to have an elastically
stiff and hard substrate support the normal load and keep the contact area small, while the
surface coating provides shear accommodation and reduces junction strength, until the
substrate begins to yield and plastically deform.
24
Page 41
Friction does not just rely on physical and mechanical properties of individual
materials that come into contact; instead, as mentioned earlier, it is a system’s property
involving interactions within pairs of contacting surfaces and between them and the
environment. Many tribological contacts result in transfer of material from the coating
surface to the counterface (such as the hemispherical pin shown schematically in Figure
2.1), plus surface chemical reactions with the surrounding environment, resulting in wear
surfaces whose chemistry is significantly different from the bulk. Environment plays a
significant role in determining the tribological performance of coatings that are designed
to mitigate friction. Coatings that give extremely low friction and long wear life in one
environment can fail to do so in a different environment.
2.1.2. Wear
Wear is the surface damage or removal of material from one or both of two solid
surfaces. It occurs when solid surfaces are in sliding, rolling or impact motion relative to
one another. First, during relative motion, material on the contacting surface may be
displaced so that properties of the solid body, at least at or near the surface, are altered,
but little or no material is actually lost. Later, material may be removed from a surface
and may result in the transfer to the mating surface or may break loose as a wear particle.
Thus, wear damage often precedes actual loss of material. It should be emphasized that
damage due to material displacement on a body, with no net change in weight or volume,
also constitutes wear. Wear, as previously discussed friction, is not a material property,
but rather a system response. Operating conditions, such as contract stress, environment,
25
Page 42
and velocity, also affects interfacial wear. In addition, it is not necessarily true that high-
friction interfaces exhibit high wear rates and vice versa.
Wear is the major cause of material wastage and loss of mechanical performance,
thus any reduction in wear can result in considerable economical savings. There is a
process by which wear volume loss occurs, known as the wear mechanism or mode. If
wear particles are formed, even though these may greatly influence the wear mechanism
and wear rate, wear volume loss will occur only if the particles are lost from the local
surface. Matthews et al.2 categorized wear mechanisms into two groups; mechanical wear
mechanisms and physical-chemical wear mechanisms.
Mechanical wear mechanisms include:
• Ploughing/cutting by abrasion, erosion, etc, whereby (micro)chips of material
are formed through ploughing of a harder surface (or third body) in a softer
one. Abrasive wear occurs when asperities of a rough, hard surface or hard
particle slide on a softer surface and damage the surface by plastic
deformation or fracture.
• Extraction of material by adhesive wear, in which wear particles are formed
by being pulled out from the surface. Adhesion (or bonding) occurs at the
surface roughness asperity (protrusion) contacts at the interface, and these
contacts are sheared during sliding, which may result in detachment of a
fragment from one surface (usually the softer) and adhering to the other
surface (the harder one). Subsequently, the transferred fragments may form
loose particles (ejected or re-circulated back and forth in the contact).
26
Page 43
• Plastic deformation/compaction of material by combination of abrasive and
adhesive wear, in which material on the surface is plastically deformed and
flowing away from the contact area or compacted within the contact area to
potentially form a third body (transfer film). If the wear tribo-couple consists
of a hard and soft material, then the hard asperities or hard particles result in
the plastic flow of the softer material.
Physical-chemical wear mechanisms include:
• Chemical wear in which volume is lost by chemical reaction. Oxidative and/or
corrosive wear may also occur where the oxidized or corroded material
(layer), respectively, are subsequently lost. Thus chemical wear requires both
chemical reaction (corrosion and/or oxidation) and interfacial contact.
• Physical wear in which volume is lost through dissolution, diffusion or
evaporation.
Other wear mechanisms/modes include fatigue wear, such as rolling contact fatigue
discussed in Chapter 5, impact/erosive wear, and fretting (oscillatory wear). In practice,
different combinations of mechanisms will occur together, so that the above mechanisms
rarely occur independently. During the course of the wear process, the relative
contributions of these mechanisms change in time as a result of changes in the local
conditions within the tribological system. This may be regarded as the single largest
problem with wear prediction, thus predicting how the system will change in time and,
therefore, how the nature and contribution of each acting wear mechanism will change.
27
Page 44
2.1.3 Role of Solid Lubricants
Finally, lubrication by solid is also defined as the process employed to reduce
wear of one or both surfaces in contact by transmitting frictional stresses between the
opposing surfaces. Solid lubricants are applied to separate the two surfaces and reduce
their friction and wear, sometimes accomplished by forming a protective third body
transfer film. When the surfaces of two bodies are in close proximity to each other, they
first come into contact at the peaks commonly known as asperities. During the relative
motion between the two surfaces, friction may be experienced between the asperities of
the different surfaces and the resulting energy dissipation will be due to the interaction of
these asperities. This interaction could result in either plastic or elastic deformation based
on the applied stress and material properties of the surface. A changes as the interaction
between the surfaces continues, this is because the contact conditions continue to change
due to the plastic deformation. According to equation 2.2, with the change in the A, the
COF will also change. The primary purpose of a lubricant is to separate these contacting
surfaces (asperities) and thereby mitigate friction and wear.
2.2 Oxide Ceramics
Oxide ceramic materials are formed when a metal reacts with oxygen. They can
either form a covalent bond or ionic bond depending on the difference in
electronegativities (EN). Based on Pauling’s ionicity fraction, similar EN between the
metal and oxygen will result in more covalent bonding character versus a larger
difference in EN, will result in more ionic bonding character. There are two forms of
oxide ceramics: the single and the multicomponent oxides. The multicomponent oxides
28
Page 45
refer to those that contain more than one cation type in the structure and the single oxides
have only one cation type in the structure (binary oxides). In general, both ionic and
covalent bonds have the tendency to have large bond and lattice energies; the large
bond/lattice energies allows these materials to exhibit high strength, high hardness,
chemical and thermal resistance. Traditional oxide ceramics (micro/macrocrystalline and
single crystals) are excellent engineering materials for demanding applications requiring
these characteristics, but they exhibit inherent brittleness at low temperatures, and, hence
they have very low resistance to loads (i.e. low fracture strength and toughness). This low
strength is due to the strong bonds between the metal and oxygen, thus it is difficult for
dislocations to move to cause any crystalline slip in micro/macrocystalline and single
crystal oxides in addition to very few number of slip systems and large Burgers vectors.
Brittle fracture is the typical failure mode in these materials. This occurs when a critical
stress is reached at a weak point (flaw) and a micro-crack is formed and rapidly travels
throughout the material, causing failure. Very little or no plastic deformation occurs in
the surrounding areas of the crack. When cracks propagate in oxide ceramics, large wear
particles that are abrasive are normally formed during sliding contacts. High friction and
significant wear by a third body abrasive wear mechanism are observed during the sliding
and this leads to device or equipment failure.30
Even though, oxide ceramics have low fracture toughness at ambient
temperatures, their demand in the area of tribological applications is increasing. They
have been used as mechanical seals, prosthetic devices and ball bearings as well as
becoming reliable materials for a wide range of applications in extreme conditions.
29
Page 46
However due to their brittleness, there is always a significant amount of wear associated
with their use. Thus at both ambient and elevated temperatures, if oxide ceramics could
be engineered to plastically deform during sliding without any catastrophic failure, they
could become very reliable materials for a wide range of tribological applications.30
2.2.1 Tribological Behavior of Bulk and Microcrystalline Oxide Ceramics
Materials that have grain sizes less than 100 nanometers in all dimensions are
considered as nanocrystalline materials. On the other hand, if the grain size of a ceramic
material is more than 1 micron, they are considered to be bulk oxide ceramics. Bulk
oxide ceramics typically have polycrystalline crystal structures and often times are not
reliable for many tribological applications under dry sliding conditions. Both the friction
and wear coefficients of bulk oxide ceramics are too high to be practical for most
tribological applications. Several investigators have concluded that microfracture is by
far the greatest source of wear in bulk oxide ceramic materials.3,5 This is because, unlike
metallic materials, most ceramics show essentially no sign of plastic elongation. The
inherent brittleness of these materials is thought to originate from their usually limited
number of slip systems available for plastic flow and the inherent difficulty of dislocation
glide in their structures. This is the reason for the abrasive nature of the wear debris. A
major cause of microfracture in bulk oxide ceramics is related to internal volume defects.
Despite all the technological advances made in their fabrication, bulk oxide ceramics still
contain many internal defects (e.g., flaws, voids, inclusions, weak grain boundaries).
During sliding contact, these defects act as stress concentration points. Under the
30
Page 47
influence of normal and tangential forces, micro-cracks can initiate from these defects,
where dislocations may sometimes pile up and thus block slip-band propagation.4
Rainforth reviewed the wear behavior of bulk oxide ceramics and categorized
wear in bulk oxide ceramics into two regimes (i.e. mild or severe).5 Most ceramics
exhibit a wear transition from mild to severe wear, at some critical load. This transition is
characterized by an increase in wear, often several orders of magnitude, and is associated
with the onset of brittle fracture at the surface. Hence at the severe regime, there is a
rapid failure. More studies are conducted at the transition from mild to severe wear in
order to prevent its occurrence. The mild wear regime is defined by the smoothing of the
worn surface and the formation of third body transfer films. In order to increase the
resistance to fracture in oxide ceramics, structural engineering is needed by refining grain
size, adding defects, etc. Rainforth has targeted three strategies with this approach: (a)
reduction in grain size with improved density in an attempt to reduce the flaw size within
the material; (b) formation of duplex structures, and, (c) improvement in toughness by a
transformation toughening mechanism with applicability to zirconia. All these strategies
were looked into in this dissertation at the nanoscale regime. In the case of (a), all the
crystalline films exhibited nanoscopic grain sizes. With respect to (b), a duplex geometry
was processed using ZnO/ZrO2 and ZnO/Al2O3/ZrO2 nanolaminates. For (c), ZrO2 was
implemented as a relatively high toughness/load bearing layer in order to prevent brittle
crack formation in the nanolaminates. All of these approaches will be further discussed in
this dissertation.
31
Page 48
2.2.2 Plastic Deformation in Nanocrystalline Oxides
In general, when a material is mechanically stressed, it will exhibit the following
sequence in response: elastic deformation, plastic deformation, and fracture. In the case
of elastic deformation, when stresses are no longer applied, the deformation is reversed
and the material returns to its original shape. On the other hand, if the deformation is not
reversible when a stress is no longer applied, plastic deformation occurs. In this case,
there is a change in the material’s structure over all size and length scales, e.g. from
atomic bonds broken to dislocation glide to grain boundary (GB) deformation/sliding.
The plastic deformation behavior is from the motion of a number of individual
dislocations on specific crystal lattice planes along certain directions (slip systems), and
just like in mechanical loading, is relevant in tribological contacts where there is
crystalline slip.
At room temperature, oxide ceramics are brittle, which is due to difficulty in
dislocation motion (slip) because a) nearest neighbors of like charge (cations and anions)
resist motion (repulsion), b) larger Burgers vector slip distances, and (c) there are few
total slip systems (made up of partial dislocations with smaller slip steps). Unlike metals
whose ductility is directly related to the ease of dislocation, the bonding in ceramic
oxides makes slipping process difficult and the dislocations are essentially immobile.6
Furthermore, larger grain size oxide ceramics have poor ductility due to the
aforementioned limited number of slip systems and it is difficult to activate them without
the introduction of thermal energy in these materials. Thus plastic deformation is rarely
observed in oxide ceramics at ambient temperature. The question now is how can oxide
32
Page 49
ceramics be made to exhibit significant plastic deformation under tribological stresses at
both low and high temperatures without brittle fracture?
Ductility in nanocrystalline ceramics was first reported by Gleiter et al.7, who
observed that TiO2 and CaF2 plastically deform at low temperatures by reducing their
grain size to a few nanometers. They confirmed that this ductility seemed to have
originated from the diffusional flow of atoms along the intercrystalline interfaces. Gleiter
et al. concluded that the diffusional creep rate of a polycrystalline material may be
enhanced by reducing the crystal grain size and by increasing the grain boundary
diffusivity. Schiotz et al.8 with the help of computer simulations also reported that most
of the plastic deformation occurring in nanocrystalline copper (with possible implications
to nanocrystalline ceramics) was due to a large number of small “sliding” event of atomic
planes at the grain boundaries with only a small fraction of the deformation being caused
by dislocation activity in the grains. Their theory is a critical grain size, d, which is also
known as the cross-over grain size, is responsible for the mechanism change from
dislocation motion (Hall-Petch) to grain boundary motion (inverse Hall-Petch). These
two studies proposed that the Inverse Hall-Petch effect, in which the deformation
happens along nanocrystalline grain boundaries instead of the classical microcrystalline
Hall-Petch effect, in which the deformation classically happens by yield stress was
responsible for the observed plastic deformation. For conventional grain size materials
(1-100 µm diameter) the empirical Ha c tion predicts that ll-Pet h equa
(2.5)
33
Page 50
where σy is the yield strength, σo is a friction stress below which dislocations will not
move in a single crystal, k is a constant and d is the grain size. Thus as the grain size is
refined, the strength increases as d-1/2 and can, potentially, reach very high values as there
is a greater total grain boundary area to stop dislocation slip thereby increasing the
strength of the material. Once the grain size of materials are reduced to the nanoscale,
these materials may deform by the inverse Hall-Petch phenomena in which there is grain
boundary activity so that finer grained materials would be softer and more deformable.
Differences from the classical Hall-Petch behavior at the nanoscale are not unexpected
since the traditional explanations for this behavior involve a large array of dislocations
piled up at the grain boundary. The length of such a pile-up is of the order of magnitude
of the grain diameter. At nanoscale grain sizes, applied stresses required approach or
exceed theoretical strength. At these small grain sizes, the dislocation forces are sufficient
to eliminate dislocations by moving them into the grain boundaries.9
This inverse Hall-Petch effect has generated controversy with only a few sets of
results obtained to date, which are all for metals. Koch9 and coworkers concluded in 2001
that, at the time of their work, only two experimental data sets (Erb et al.10 and Narayan
et al.11) truly demonstrated the inverse Hall-Petch effect. Their findings were that, most
of the experiments that reported the inverse Hall-Petch effect had samples that exhibited
clear artifacts and there were also problems with the accurate determination of grain size
and its distributions. Nanocrystalline metals of aluminum,12 copper13 and nanocolumnar
nickel14 have been studied by computer simulations and the inverse Hall-Petch effect was
observed in these materials. In general, there is a growing consensus that the apparent
34
Page 51
anomalous dependence of yield stress on grain size can be rationalized by the activation
of deformation mechanisms taking place at the grain boundary which compete with
crystal plasticity and become the dominant operative dissipative deformation mechanism
when grain sizes are sufficiently small.15
In 1998, Muller et al.16 analyzed the plasticity of nanocrystalline ZrO2 prepared
by a laser evaporation. The grain size of the ZrO2 was determined to be in the range of 57
and 110 nm. In their study to determine the applicability of these nanoscale powders for
producing ceramics with nanocrystalline microstructure, a uniaxial pressing and
pressureless sintering of yttria partially stabilized tetragonal (YTZ) to a density of more
than 98% determined that, this powder shows a superplastic behavior. In 1999,
Sagalowicz et al.17 studied the microstructure and defects of wurtzite isostructures ZnO
and AlN thin films. Both films exhibited the {0002}- preferred orientation, or c-axis
basal plane orientation. They also reported ZnO exhibited a high density of both planer
defects and dislocations (double and single stacking faults of 1012 cm-2 in density), but
not AlN (due to small grain size). They concluded that a large x-ray diffraction peak
width (> 0.3o) was exhibited by the (0002) plane, which originates from non uniform
strain or lattice imperfections. These lattice imperfections include large angle grain
boundaries, planer defects and dislocations.
Ovid’ko18 and coworkers in 2007 reported that, GB sliding emanates to the
formation of dipoles of edge disclinations (linear rotational defects). The strengths of the
formed disclinations are equal in magnitude to the misorientation angles of the tilt
boundaries involved in GB sliding, and the dipole arms (the distance between the
35
Page 52
disclinations forming a dipole) are equal in magnitude to the displacements of the
corresponding GBs. In 2008, they19 proposed a model that described the influence of GB
sliding on crack growth in nanocrystalline ceramics. This was based on the fact that
brittleness in nanocrystalline ceramics decreases due to grain boundary sliding. Thus the
GB sliding caused by an external stress and by concentrated stresses near the crack tip
brings about the formation of an array of disclination dipoles, which can partially relieve
the elastic stresses near the crack tip. GB sliding can increase the critical crack length
(above which the catastrophic growth of cracks begin), and hence increase the fracture
toughness of the ceramic. They concluded that, the increase in the critical crack length
and the related improvement of the fracture toughness are very significant at small
nanograin sizes and misorientation angles of GBs. In 2007, Mo et al.20 in their quest to
enhance ductility and toughness in nanocrystalline ceramics at high strain-rates used
computer simulations based on molecular dynamics (MD). This technique is suited for
the study of high strain-rate limits of deformation and to unravel its atomistic details.
They performed MD simulations to elucidate the tensile deformation mechanism of
nanocrystalline SiC at a strain rate of 108 s-1. Their study revealed a suppressed cavitation
in the absence of diffusion and in the absence of dislocation activity in the grains. This
suppressed cavitation is primarily due to the reduction of the grain size and governed by
plastic flow along GBs, which delays localization of deformation. They showed in their
work that nanocrystalline SiC exhibits increased ductility and toughness without
compromising its strength. Jian et al.21 in 2008 studied the nanomechanical behavior of
pulsed laser deposited (PLD) ZnO thin films that were deposited on different substrates.
36
Page 53
They demonstrated that even though the normal load was increased from 0.02 to 5 mN
during a friction test, the coefficient of friction almost remained constant into the early
period for three of the substrates [(0001) 6H-SiC, c-sapphire, a-sapphire]. The COF for
these films were 0.31, 0.28 and 0.25 respectively. With the increase in load, they reported
that despite the increase in plastic deformation of ZnO, which might have resulted in
grooving during scratch, no cracking of the thin films took place. They associated the
small fluctuations in the COF values to point-on orientation of the tip, the layered
structure of the thin films or nanoscale fracture events that might have occurred during
the test. However, they acknowledged that there was no catastrophic wear or
delamination of the thin films, thus the COF values corresponded to a mild wear regime.
Lin et al.22 in 2009 also reported on ZnO thin films that were prepared by a sol-
gel method both on glass and silicon substrates. They studied the interrelationships
between crystal structure, surface morphology and the tribological behavior of these films
by annealing them to different temperatures (450 to 800oC). They observed an increase in
grain size with an increase in annealing temperature by measuring the broadening of the
ZnO (0002) peak. They also mentioned that the (0002) peak shifted with the temperature
increase, which was correlated to the existence of residual stress between the ZnO film
and the silicon substrate. The tribological behavior of the films was determined by using
a normal load of 0.5 gf from a Si3N4 ball. The as deposited films on glass had higher COF
than the annealed films with COF values ranging from 0.61 to 0.36. On Si substrates, the
COF of as deposited and 450oC were much higher compared to the films annealed at
higher temperatures with the COF ranging from 0.52 to 0.24. The relatively high friction
37
Page 54
for the as deposited film and the 450oC film was associated with abrasive plowing of the
wear debris present at the sliding interface. They concluded that at relatively low
annealing temperatures, the transformation of the film microstructure was insufficient to
result in the improvement of mechanical properties (hardness and elastic modulus).
Based on the current literature, it has been demonstrated that normal brittle
polycrystalline ceramics could become ductile if their grain size is reduced to tens of
nanometers and less. In this dissertation, this phenomenon is used in the promotion of
lubricity and plasticity in nanocrystalline ZnO coatings subjected to tribological contacts
as well as using advanced characterization techniques to determine the chemical and
structural mechanisms responsible for friction and wear.
2.2.3 Lubricious Oxide Materials
Normal oxide films made of metallic adhesives have little or no capacity of self-
lubrication at ambient temperatures due to their high brittleness and large amounts of
faceted wear debris. At ambient temperatures, it is very difficult to activate any
dislocation motions since ions of like charges repel motion and Burger vector (unit of
slip) distances are large, hence these oxides are unable to plastically deform and are
brittle. Their surfaces are generally inert and typically do not form strong adhesive bonds
like metals in tribological contacts. But at high temperatures (> 0.5 Tmelting), oxides have
been used as solid lubricants due to their ability to plastically deform. Bulk,
microcrystalline ZnO films are known to have very high COF (µ ~ 0.7), as reported by
Zabinski et al.23 who also determined that PLD ZnO films exhibit low COF ~ 0.2 and
long wear lives greater than 106 cycles at room temperature. The films were highly
38
Page 55
textured, with the (0002) plane being the most dominant peak. The ZnO films exhibit
columnar grains with widths of ~20 nm and also contained subgrains within the columns
(defective mosaic substructure). They concluded that the stoichiometry and
microstructure of the ZnO films could be controlled by adjusting the substrate
temperature (low T) and oxygen partial pressure during the pulsed-laser deposition. They
also suggested that this study could be repeated for other oxides to provide good
tribological properties at room temperature. In 2000, they24 proposed that the mechanism
for the increase in plasticity was due to the reduction of the grain size within the oxide
coating as shown in Figure 2.3.
Conventional Brittle Oxide Ductile Oxide Film
Figure 2.3: Schematic illustration of wear mechanisms in a conventional brittle oxide and a ductile nanocrystalline oxide film.23
In 2008, Romanes30 reported low coefficient of friction values of approximately
0.22 after 10,000 cycles for ZnO/Al2O3 nanolaminates deposited by atomic layer
deposition at different deposition temperatures. All friction measurements were done at
room temperature under low loads of 10 and 25 grams. The nanolaminate films deposited
at temperatures of 200, 250 and 300oC were varied from 1 bilayer to 64 bilayers with the
39
Page 56
Al2O3 and ZnO layers alternating. The Al2O3 layer was deposited first on a silicon
substrate followed by the ZnO layer. She proposed that laminating the ZnO with Al2O3
was beneficial for the enhancement of the low surface energy (0002) preferred orientation
thus suppressing other competing higher surface energies such as the (10-10) and (10-11)
grains. Romanes concluded that, the 8-bilayers deposited at 200oC exhibited the lowest
coefficient of friction (~0.19) and this was due to the low surface energy (0002) preferred
orientation, smaller grain size (< 20 nm), sufficient thickness of the top ZnO layer and the
ability of the Al2O3 layers to aid in load transfer and act as a pathway to dissipate energy
in preventing crack formation. The 16 and 64 bilayers showed the highest coefficient of
friction values among all the nanolaminates. Romanes work made use of high resolution
transmission electron microscope to study plastic deformation mechanisms inside the
wear tracks. She observed that during sliding, there is a reorientation of the
nanocrystalline surface layer that contributes to the friction reduction. This velocity
accommodation mode was shown to be the result of progressive refinement of the ZnO
grains that proceeds from crystalline to amorphous. This layer is soft, ductile and easily
smears along the wear track resulting in lower interfacial shear and hence low friction.
It is obvious that nanocrystalline grain size oxide ceramics could be considered as
very good candidates to be lubricious at low temperatures. More detailed structural and
chemical studies need to be carried out to determine friction and wear mechanism in
lubricious oxides.
40
Page 57
2.3 Atomic Layer Deposition
Atomic layer deposition (ALD) is a variant of the chemical vapor deposition
(CVD) technique, suitable for manufacturing ultra-thin films with thickness down to a
fraction of a monolayer. ALD was developed and introduced worldwide under the name
of atomic layer epitaxy (ALE) in the late 1970s by Suntola and co-workers.25 The
motivation behind its development was the desire to make thin electroluminescent
(TFEL) flat panel displays. But after its successful introduction, ALD has found various
applications (during the 1990s and 2000s) in the areas of compound semiconductors
(especially the III-V compounds), solar cells, microelectronics, optics, protective
applications, and gas sensors. Currently, ALD is considered as one of the most promising
thin film deposition techniques for enabling nanoscale device fabrication. The major
driving force for the recent increase is a direct consequence of the ever-scaling down of
device dimensions and the increasing aspect ratios in microelectronic devices. This is
also demonstrated by a rapidly increasing number of new materials, processes and reactor
designs as well as users in both industry and academia.
ALD has the capability to coat extremely complex shapes with a conformal
material layer of high quality capability unique among thin-film deposition techniques.
The technique offers unprecedented control of thickness, uniformity, quality and material
properties monolayer films that are very thin. One of the features of ALD technology that
distinguishes it from other thin film deposition techniques is its self-limiting nature. The
chemistry is such that the entire surface is reacted to completion, disallowing further
reactions to continue to take place.26,27,28
41
Page 58
ALD growth is in the form of a cyclic process where there is a sequential use of
self terminating gas-solid reactions. This growth is based on the following unique
features:
• A self-terminating reaction of the first reactant (reactant A)
• Evacuation or purging of the non-reacted reactants and the gaseous reaction by-
products
• A self-terminating reaction of the second reactant (reactant B)
• Evacuation or purging of the reactants and byproduct molecules from the chamber
with inert gas
Steps 1 - 4 are known as a reaction cycle. Steps 1 and 3 are normally referred to as half
reactions of an ALD reaction. One ALD reaction cycle adds a given amount of material
to the surface, referred to as the growth per cycle (GPC). To grow a material layer,
reaction cycles are repeated until the desired amount of material has been deposited.29
ALD and CVD may have many similarities but there is a clear distinctive feature of the
ALD which lies in the self-limitation for precursor adsorption and alternate, sequential
exposure of precursors and reactants. In other words, in contrast to other deposition
techniques, ALD proceeds through self-limitation in reactions between chemicals and
substrates. As the film growth proceeds in a self-limiting manner, each cycle deposits
exactly the same amount of material, and thus the film thickness may be accurately
controlled simply by the number of deposition cycles. For example, for AB binary
material, these half reactions will generally follow:
42
Page 59
1st reaction: surface + AB(g) surface: A + B(g)
2nd reaction: surface: A + CD(g) surface: AC + D(g)
One ALD cycle is illustrated in the two half reactions above. Ideally, one reaction cycle
will add a given amount of AC to the deposited film. A desired thickness of the material
can be deposited by the number of required cycles. ALD can also be used to deposit
single elements, in such situations the 2nd reaction maybe a pulse of sacrificial precursor,
a plasma exposure or a thermal spike to take away unwanted molecules from the surface
allowing it to be reactive for the next 1st reaction. Both nitrogen and argon are used as
purging and carrier gas to separate the two half reactions.30 The purge (or evacuation)
period removes all the excess precursor molecules and volatile byproducts leaving only
the reacted AC amount on the surface.32 ALD cycle times range from sub second to many
seconds depending on sample geometry and chemistry.
ALD’s unique features allow the growth of highly conformal films with accurate
thickness over large areas. The ALD benefits are listed below:
• Accurate and simple thickness control
• Large-area compatibility
• Large-batch compatibility
• Excellent conformality
• No problems with inconsistent vaporization rates of solid precursors
• Good reproducibility
• Straight forward scale-up
• Capability to produce sharp interfaces and superlattices
43
Page 60
• Possibility to interface modification
• Favors precursors highly reactive toward each other, thus enabling effective
material utilization
• High quality materials are obtained at low processing temperatures, and
• Capability to prepare multilayer structures in a continuous processing temperature
window.32
Most of the ALD processes reported are based on the above described exchange
reactions between molecular precursors. Another possible reaction type is additive with
elemental precursors but because only a few metals are volatile enough, the applicability
of these reactions is limited. In majority of the ALD processes reported, the reactions are
activated only thermally under isothermal conditions. The alternate pulsing is definitely
the most characteristic feature of ALD but almost as distinctive is the self-limiting
growth mechanism. However, some deviations from the absolutely self-limited growth
conditions may be accepted with certain precautions. A common misconception is that
ALD growth always proceeds in a layer-by-layer manner, but this is often not the case as
only a fraction of a monolayer may be deposited in each cycle. Reasons for the less than a
monolayer per cycle growth are the limited number of reactive surface sites, and the
steric hindrances between bulky ligands in the chemisorption layer. Another
misconception is that ALD would produce atomically smooth films. This indeed may
often be the case with epitaxial or amorphous films, but the nucleation and grain growth
involved in the formation of polycrystalline films usually leads to a measureable surface
roughness which increases along with film thickness. Practice has shown that ALD made
44
Page 61
films often, though of course not always, possess superior quality as compared with films
made by other methods at the corresponding temperatures. This can be related to the fact
that in ALD each monomolecular layer reaction step is given enough time to reach
completion while in other methods the continuous growth may prevent this by covering
the unreacted species with new deposits. Many ALD processes may be performed over a
relatively wide temperature range. Therefore, a common growth temperature is often
found for different materials, thereby making it possible to deposit multilayer structures
in a continuous manner.
The major limitation of ALD is evidently its slowness since at best, only a
monolayer of the film is deposited per one cycle. Growth rates of 100-300 nm/hr
obtained are very typical. However, the low growth rate does not mean low productivity.
The low growth rate is compensated for by the good large-batch and large-area
processing capabilities of ALD. Additionally, due to the continuous down scaling in
dimensions, film thicknesses have shrunk down to a level wherein ALD is competitive
with other deposition techniques. One other limitation to the widespread use of ALD has
been the lack of good and cost-effective processes for some important materials. Some of
these materials include metals, Si, SiO2, Si3N4 and several ternary and multicomponent
materials. There is also the limitation of the number of compatible precursor compounds.
For a precursor to be ALD compatible, there are some general requirements for a good
ALD precursor which include the following:
• Sufficient volatility at the deposition temperature
• No self-decomposition (thermally stable) allowed at the deposition temperature
45
Page 62
• Aggressive and complete reactions
• No etching of/and not soluble in the film or substrate material
• No dissolution into the film or substrate
• Un-reactive volatile byproducts
• Sufficient purity
• Availability at a reasonable price
• Easy to synthesize and handle
• Nontoxic and environmentally friendly.31,32
According to the principles of ALD, each gas-solid reaction must be saturating by nature,
and must be allowed to saturate on the surface. The type of saturation gas-solid reactions
that may result in the bonding of the compound reactant onto a solid surface is classified
as follows.
a. Ligand exchange
b. Dissociation and
c. Association
These mechanisms can occur simultaneously until saturation is reached. But of these
three mechanisms, ligand exchange would often be preferred, because its equilibrium can
be driven towards the product by removing the gaseous reaction products. When a
compound reactant chemisorbs on a solid substrate, saturation of the surface with
adsorbed species is typically caused by either of two factors; steric hindrance of the
ligands and limited number of bonding sites. The former is related to the shielding of
reactive sites by ligands of chemisorbed species making them inaccessible. This is most
46
Page 63
likely for larger precursor molecules and those having large side groups. The latter occurs
when the number of bonding sites on the surface is less than required for achieving a full
ligand coverage. Although space remains on the surface, no accessible bonding sites are
available.31
2.3.1 ALD Oxide Films
ALD oxide film studies have often dealt with growth mechanism investigations,
but also structural properties of the films have been of interest. ALD is generally suited
for the deposition of oxide thin films and overlayers for various applications. ALD oxide
films have found industrial applications as dielectrics in electroluminescent thin film
displays, but in the future gate oxides for MOSFET transistors will also perhaps be
processed by ALD. The oxide films are deposited when an oxygen source is reacted with
a volatile metal source, water is most frequently used as the oxygen source. Other oxygen
sources that are employed include H2O2, O2, O3 as well as oxygen plasma. Ozone is a
strong oxidizer producing dense films and furthermore for some weakly reactive
precursors, such as the β-diketonates, ozone (or H2O2) remains the only alternative to
obtain the metal oxides and at the same time reduce the impurities to a reasonable
level.32,15 There has also been a multicomponent oxides deposited by ALD, examples are
SrTa2O6 or ferroelectric SrBi2Ta2O9 which were deposited by plasma enhanced ALD
(PEALD). In this study, however, the concentration is on binary oxides namely ZnO,
ZrO2 and Al2O3.
47
Page 64
2.3.2 ALD ZnO
Zinc oxide (ZnO) is one of the typical transparent conducting oxides with a
number of attractive characteristics. It is a direct and wide bandgap semiconductor
material (Eg = 3.4 eV) and has a variety of potential applications. Zinc oxide crystallizes
in three forms: hexagonal wurtzite (B4 type), shown in figure 2.4, cubic zincblende, and
the rarely observed cubic rocksalt. The wurtzite structure is most stable and thus most
common at ambient conditions. The zincblende form can be stabilized by growing ZnO
on substrates with cubic lattice structure. In both cases, the zinc and oxygen are
tetrahedrally coordinated. The rocksalt structure is only observed at relatively high
pressures ~10 GPa. The hexagonal lattice (space group P63mc) has lattice parameters a =
0.3296 and c = 0.52065 nm. The structure of ZnO can be simply described as a number of
alternating planes composed of tetrahedrally coordinated O2- and Zn2+ ions, stacked
alternately along the c-axis. The tetrahedral coordination in ZnO results in non-central
symmetric structure and it is responsible for the piezoelectricity and spontaneous
polarization. It is also a key factor in crystal growth, etching and defect generation. The
four most common face terminations of wurtzite ZnO are the polar Zn terminated (0001)
and O terminated (000-1) faces (c-axis oriented), and the non-polar (11-20) (a-axis) and
(10-10) faces which both contain an equal number of Zn and O atoms. The most common
polar surface is the basal plane.33,34
Many deposition techniques have been employed to synthesize ZnO thin films.
Some of these techniques include RF sputtering technique, physical vapor deposition
technique (PVD), pulsed laser deposition (PLD) technique, and atomic layer deposition
48
Page 65
(ALD) technique.35,36,37,38,39 Among these various techniques of ZnO film deposition,
ALD can deposit a film in a surface‐controlled manner with layer‐by‐layer growth.
Several metal precursors have been employed in synthesizing ALD ZnO, these include
dimethyl zinc, zinc chloride, zinc acetate and diethyl zinc. Of all these, diethyl zinc
(DEZ, Zn(CH2CH3)2) is the most common precursor used, which was also employed in
this dissertation. As an oxygen source, to react with the volatile metal source, water
(H2O) is most frequently used. Other oxygen sources used include H2O2, O2, O3 as well
as oxygen plasma. Ozone (H2O2) is a strong oxidizer producing dense films, furthermore
for some weakly reactive precursors, such as β-diketonates. Ozone remains the only
alternative to obtain the metal oxides and at the same time reduce the impurities (reaction
by products) to a reasonable level.40
49
Page 66
Figure 2.4: ZnO structure (wurtzite structure).
Deposition temperature plays a very important role in what crystal orientation is the most
dominant when growing ZnO film by ALD technique. For temperatures less than 200oC,
(10-10) texture is observed, and at temperatures of 200oC or higher, (0002) texture is
observed.41,42,43 The two half reaction that occur for ALD ZnO when DEZ and H2O are
used are found below:
ZnOH† + Zn(CH2CH3)2 ZnOZn(CH2CH3)† + C2H6(g)
ZnOZn(CH2CH3)† + H2O ZnOH† + C2H6(g)
Where † indicates surface species.
50
Page 67
2.3.3 ALD ZrO2
Zirconium oxide (ZrO2) is an extensively studied material from both theoretical
and experimental points of view. This is due to its excellent chemical and physical
properties and important applications, which has positioned it as one of the most
important ceramic materials in modern technology.44 Due to its low thermal conductivity,
high refractive index and high ionic conductivity, ZrO2 has been used in areas such as
thermal barrier coatings, high-temperature optical filters, oxygen sensors and fuel cells
applications. It also has a high modulus and the toughest among ceramics at low
temperatures when stabilized tetragonal phase is present. At ambient pressure the pure
ZrO2 has three phases (these are shown in figure 4.3): monoclinic, tetragonal and cubic.
At high-temperature it has the cubic structure (space group Fm3m), which transforms to
the tetragonal form (space group P42/nmc) at about 2570 K. At approximately 1400 K
ZrO2 passes to the monoclinic phase (space group P21/c). With increasing external
pressure (between 3-15 GPa)45 the monoclinic phase transforms into an orthorhombic
phase. The tetragonal and cubic phases of ZrO2 could be stabilized by (a) doping them
with other oxides such as MgO, Co, and Y2O3, (b) making the grains very small, (c)
growing as thin films, and (d) using substoichiometric composition. Depending on the
doping concentration, ZrO2 remains cubic or tetragonal even at room temperature.46
51
Page 68
Figure 2.5: Low-pressure forms of ZrO2. Red and Blue spheres are O and Zr atoms respectively.30
The crystal structure for ALD deposited ZrO2 is sensitive to the precursors used,
growth temperature and film thickness.47 In this study, Zr(nMe2)4 and water were used as
the zirconium and oxygen precursors respectively. The two half reactions that occur for
ALD ZrO2 when Zr(nMe2)4 and H2O are used are found below:
ZrOH† + Zr(NMe2)4 ZrOZr(NMe4)† + NMe2H7 (g)
ZrOZr(NMe2)† + H2O ZrOH† + NMe2H7 (g)
Where † indicates surface species.
2.3.4 ALD Al2O3
Aluminum oxide (Al2O3) in its bulk state is one of the most widely used materials
in the family of engineering ceramics. It is known as a refractory material with good
chemical stability, extremely high hardness and relatively high thermal conductivity.
52
Page 69
Especially for the alumina thin films. These properties are very useful in technological
applications in areas such as micro and opto-electronics, sensor techniques and
catalysis.48 The most common form of crystalline Al2O3, α-aluminium oxide, is known as
corundum. Corundum has a trigonal Bravais lattice with a space group of R-3c. There are
some emerging metastable alumina’s, these includes the γ, δ, η, θ, κ, β, and χ
polymorphs, and they have been growing in importance.49 A variety of vacuum
deposition techniques have been used to prepare Al2O3 films and ALD is one of such
techniques. ALD deposited Al2O3 is the most studied deposited film by this technique. It
is well known that applying ALD technique to prepare Al2O3 films, good quality
amorphous thin film could be obtained below its crystallization temperature of ~500oC.
However, the preparation conditions determine the growth morphology and
microstructure of the films thus changing their physical and chemical properties.
Few metal precursors have been explored in synthesizing ALD Al2O3. These
metal precursors include aluminum chloride (AlCl3)1, tris-diethylamino aluminum
(TDEAA)50, and trimethylaluminium (TMA, Al(CH3)3)51. Of all these, TMA is the most
common precursor used, this was also employed in this work. As an oxygen source, to
react with the volatile metal source, water (H2O) is most frequently used; O3 is also
sometimes used with TMA.52 Other oxygen sources used include H2O2, O2, O3 as well as
oxygen plasma. The TMA/H2O ALD process has been studied as a nearly ideal ALD
process because the GPC is high (30-40% of a monolayer). The two half reactions that
occur for ALD Al2O3 when TMA and H2O are used are found below:
AlOH† + Al(CH3)3 AlOAl(CH3)† + CH4 (g)
53
Page 70
AlOAl(CH3)† + H2O AlOH† + CH4 (g)
Where † indicates surface species. Al2O3 films grown by ALD are insulating, amorphous
and smooth,53 the surface of chemistry is also favorable to growth on a wide variety of
substrates including oxides, nitrides, metals, semiconductors54 and polymeric55 surfaces.
TMA decomposes at temperatures above 300oC thus ALD Al2O3 is normally grown
below 300oC which is below the crystallization temperature.56 In this dissertation, the
growth temperature was set at 200oC.
54
Page 71
2.4 Chapter References
1 Bowden, F. P., and Tabor, D., The Friction and Lubrication of Solids, Clarendon,
Oxford, 1986, Part 1.
2 Matthews, A., Franklin, S. and Holmberg, K., J. Phys. D: Phys. 40 (2007) 5463-5475
3 S. M. Weiderhorn, S. M., Annu. Rev. Mater. Sci., 14(1984)373-403
4 Erdemir, A., Friction and Wear of Ceramics, chapter 7
5 Rainforth, W. M., J. Mater. Sci. 39 (2004) 6705-6721
6 Gumbsch, P., Taeri-Baghbadrani, S., Brunner, D., Sigle, W. and Ruhle, M., Physical
Review Letters, 87, 8 (2001)
7 Karch, J., Birringer, R. and Gleiter, H., Nature 330, 10 (1987) 556-558
8 Schiotz, J., Di Tolla, F. D. and Jacobsen, K. W., Nature 391 (1998) 561
9 Koch, C.C., and Narayan, J., Mat. Res. Soc. Symp. Vol. 634 (2001)
10 Erb, U., Nanostructured Mater. 6 (1995) 533-538
11 Narayan, J., Koch, C.C., Zhang, X. and Venkatesan, R., Unpublished results, (2000)
12 Yamakov, V., Wolf, D., Salazar, M., Phillpot, S.R. and Gleiter, H., Acta Materialia
(2001) 2713-2722
13 Schoitz, J., Di Tolla, F.D. and Jacobsen, K.W., Nature 391 (1998) 561-563
14 Farkas, D. and Curtin, W.A., Materials Science and Engineering A, 412 (2005) 316-
322
15 Jerusalem, A., MSc. Thesis, Massachusetts Inst. of Tech. (2004)
16 Muller, E., Oestreich, Ch., Popp, U., Michel, G. and Rendtel, A., Journ. Of Anal. Chem
(1998) 361: 594-597
55
Page 72
17 Laurent Sagalowicz, Glen R. Fox, Marc-Alexandre Dubois, Claude A. P. Muller, Paul
Muralt and Nava Setter, Journal of the European ceramic society 19 (1999) 1427-1430
18 I.A. Ovid’ko and A.G. Sheinerman, Appl. Phys. Lett. 90, 171 927 (2007)
19 I.A. Ovid’ko, N.V. Skiba, and A.G. Sheinerman, Physics of the Solid State 50(2008) 7
20 Yifei Mo and Izabela Szlufarska, Appl Phys Letters 90, 181926 (2007)
21 Jian, S.-R., Teng, I.-J., Yang, P.-F., Lai, Y.-S, Lu, J.-M, Chang, J.-G., and Ju, S.-P.,
Nanoscale Res Lett (2008) 3:186-193
22 Lin, L.-Y., Kim, D,-Y., Thin Solid Films 517 (2009) 1690-1700
23 Zabinski, J.S., Corneille, J., Prasad, S.V., McDevitt, N.T. and Bultman, J.B., Journal of
Materials Science 32 (1997) 5313-5319
24 Zabinski, J.S., Sanders, J.H., Nainaparampil, J. and Prasad, S.V., Tribology Letters 8
(2000) 103-116
25 Suntola, T., and Antson, J., U.S. Patent No. 4,058,430, 15 November 1977
26 Ritala, M. and Leskela, M., Atomic Layer Deposition (Handbook of Thin Film
Materials, edited by H.S. Nalwa) Vol. 1 Academic Press. 2002.
27 Kim, H., Lee, H. and Maeng. –J. W., Thin Solid Films 517 (2009) 2563-2580
28 Becker, S. J., PhD Dissertation, Harvard University (2002)
29 Puurunen, R.L., Journal of Applied Physics 97, 121301 (2005)
30 Romanes, M., PhD Dissertation, Uni. of N. Texas (2008)
31 Puurunen, R.L., Chemical Vapor Deposition 2003, 9, No. 5
32 Leskela, M. and Ritala, M., Thin Solid Films 409 (2002) 138-146
33 Dulub, O., Boatner, L. A. and Diebold, U., Surf. Sci. 519 (2002) 201
56
Page 73
34 Meyer, B. and Marx, D., Phys. Rev B 67 (2003) 035403
35 Yoon, G., Yim, M., Kim, D., Ling, M. and Chai, D., Journal of Vacuum Science
Technology. A 22(1, 2004)
36 Gao, W. and Li, Z., Ceramics International 30 (2004) 1155-1159
37 Helmersson, U., Latteman, M., Bohlmark, J., Ehiasarian, A. P. and Gudmundsson, J.
T., Thin Solid Films 513 (2006) 1-24
38 Christoulakis, S., Suchea, M., Katharakis, M., Katsarakis. N., Koudoumas, E. and
Kiriakidis, G., Rev. Adv. Mater. Sci. 10 (2005) 331-334
39 Kucheyev, S. O., Biener, J., Wang, Y. M., Baumann, T. F., Wu, K. J., Buuren, Van T.,
Hamza, A. V., and Satcher, J. H., Elam, J. W. and Pellin, M. J., Applied Physics Letters
86, 0831008 (2005)
40 Niinisto, L., Paivasaari, J., Niinesto, J. and Nieminen, M., Phys. Stat. Sol. A 201, 7
(2004) 1443-1452
41 Pung, S. Y., Choy, K. L., Hou, X. and Shan, C., Nanotechnology 19 (2008) 435609
42 Makino, H., Miyake, A., Yamada, T., Yamamoto, N, and Yamamoto, T., Thin Solid
Films 517 (2009) 3138-3142
43 Godlewski, M., Guziewicz, E., Luka, G., Krajewski, T., Lukasiewicz, M., Wachnicki,
L., Wachnicka, A., Kopalko, K., Sarem, A. and Dalati, B., Thin Solid Films 518 (2009)
1145-1148
44 Torres-huerta, A. M., Vargas-Garcia, J.R., Dominquez-Crespo, M.A. and Romero-
Serrano, J.A., Journal of Alloys and Compounds 483 (2009) 394-398
57
Page 74
45 Terki, R., Bertrand, G., Aourag, H. and Coddet, C., Materials Science in
Semiconductor Processing 9 (2006) 1006-1013
46 Sternik, M. and Parlinski, P., The Journal of Chemical Physics 122 (2005) 064707
47 Aarik, J., Aidla, A., Mandar, H., Uustare, T. and Sammelsleg, V., Thin Solid Films 408
(2002) 97-103
48 Krumov, E., Mankov, V. and Starbova, K., Journal of Optoelectronics and Advanced
Materials Vol. 5, No. 3 (2003) p. 675 - 678
49 Paglia, G., Ph. D. Dissertation, Curtin Univ. of Technology, Perth (2004)
50 Katamreddy, R., Inman, R., Jursich, G., Soulet, A. and Takoudis C., J. Mater. Res.,
Vol. 22, No. 12 (2007)
51 Lu, H.L., Ding, S.J., Chen, W., Zhang, D.W. and Wang, L.K., J. Mater. Res., Vol. 22,
No. 5 (2007)
52 Granneman, E., Fischer, P., Pierreux, D., Terhorst, H. and Zagwijn, P., Surface &
Coatings Technology 201 (2007) 8899-8907
53 Elam, J. W. Sechrist, Z. A. and George, S. M. Thin Solid Films, 414 (2002) 43-55.
54 Groner, M. D., Elam, J. W., Fabreguette, F. H., and George, S. M., Thin Solid Films,
413 (2002) 186-197.
55 Elam, J. W., Wilson, C. A., Schuisky, M., Sechrist, Z. A., and George, S. M., Journal
of Vacuum Science & Technology B, 21 (2003) 1099-1107.
58
Page 75
59
56 Burgess Jr., D.R., Maslar, J.E., Hurst, W.S., Moore, E.F., Kimes, W.A., Fink, R.R. and
Nguyen, N.V., Characterization and Metrology for ULSI Technology 2005
Page 76
60
CHAPTER 3
EXPERIMENTAL PROCEDURE
In this chapter, the procedures used for sample preparation, film deposition and
characterization will be discussed. The instruments used in the experiments belong to
UNT’s Materials Science and Engineering Department and the Center for Advanced
Research and Technology (CART) at The University of North Texas, Denton. The
operations and procedure manuals can be located on the CART webpage
(http://cart.unt.edu).
3.1 Substrates Cleaning (Silicon Wafer, M50 Steel)
P-type silicon substrates which were cut into smaller pieces (approximately 1 in x
1 in) and mirror polished M50 Steel coupons that were obtained from Timken Company,
Canton, OH were used as the substrates. Prior to the nanolaminates film deposition, the
silicon (100) substrates were ultrasonically cleaned in acetone, methanol and deionized
water for five minutes each. In the case of the mirror polished M50 steel coupons, they
were ultrasonically degreased in soap and DI water for 10 minutes. This was followed by
5 minutes of acetone, methanol and DI water cleaning respectively, all with
ultrasonication. The substrates were blown dry with high purity nitrogen gas.
Page 77
61
3.2 Film Deposition
ZnO/Al2O3/ZrO2 trilayer and ZnO/ZrO2 bilayers were deposited on both cleaned
silicon and M50 substrates by using the Cambridge NanoTech Savannah 100 viscous
flow hot wall single wafer ALD reactor. On depositing the ZnO/Al2O3/ZrO2 one trilayer
film on the silicon substrate, the ZrO2 was deposited first on the silicon with native oxide,
this was followed by the Al2O3 and the ZnO was the final layer to be deposited. In the
case of the M50 steel coupons, the nanolaminates were deposited in the order of
ZnO/Al2O3/ZrO2/Al2O3. Al2O3 was the first to be deposited and this was followed by the
ZrO2. Another layer of Al2O3 layer was deposited before the ZnO was finally deposited.
The ZnO/ZrO2 bilayer films were only deposited on silicon substrate. Two separate types
(2 and 8 bilayers) of the ZnO/ZrO2 were deposited. The ZrO2 was deposited first on the
silicon with native oxide followed by the ZnO layer. This was repeated until the required
number of bilayers were acheived. The ZnO is always the top surface layer. The ZnO and
Al2O3 were deposited at 200oC and the ZrO2 deposited at 250
oC. Figure 3.1 shows the
ALD reactor and the computer control interface. The operation of the ALD is controlled
by the LabView software. But inserting or removing of substrate from the deposition
chamber or turning on and off of the precursors are controlled manually. The deposition
chamber has a reactor space of 100 mm in diameter x 6mm deep. Table 3.1 provides a
description of the experimental conditions for the ZnO/Al2O3/ZrO2 one trilayer film
while Table 3.2 describes the conditions for the ZnO/ZrO2 bilayers.
Page 78
62
Table 3.1: Deposition conditions for growing ZnO/ Al2O3/ ZrO2 one trilayer
nanolaminate.
Table 3.2: Deposition conditions for growing ZnO/ZrO2 two and eight bilayer
nanolaminates.
Page 79
63
Figure 3.1: An image of the Savannah 100 ALD system with the accompanying software,
used for all the nanolaminate depositions. (Source: Cambridge Nanotech Inc).
In the ZrO2 film deposition, Tetrakis (dimethylamido) zirconium(IV) “Zr(NMe2)”
from Sigma Aldrich and de-ionized water were used as the chemical precursors to
provide Zr and O sources to the growing surface. The Al2O3 film was deposited by using
Trimethyl Aluminum “(TMA) as the Al precursor, the precursor that was used in the case
of ZnO is Diethyl Zinc “(DEZ)” as the Zn precursor. The metal organic and the de-
ionized water precursors were alternatively pulsed into the reactor using N2 as a carrier
gas. In order to prevent gas-phase reaction which is caused by intermixing of the
precursors, the reactor was purged with research grade nitrogen gas after each precursor
pulse. The flow rate for the N2 gas is 20 sccm. Inside the chamber, the base pressure was
Page 80
64
maintained at approximately 0.5 torr. The Zr(NMe2) precursor was set at 75oC, with the
precursor valve temperature also set at 115oC, the stop valve tee and bellows
temperatures were set at 150oC. These settings as well as the deposition parameters such
as, duration of the metal organic and de-ionized water pulses, purge time between
precursor pulses, number of cycles, inner disk/substrate and the outer disk temperature
were all controlled by the LabView software. After substrate is loaded, a wait time of 10
minutes is allowed for the chamber and substrate conditions to reach equilibrium before
the pulsing is started.
The samples are removed from the vacuum chamber after the deposition and it is
allowed to cool down in air before storing them in the desicator.
3.3 Film Characterization
3.3.1 Ellipsometry
A J A Woollam Variable Angle Spectroscopic Ellipsometer (VASE) was used to
measure the thickness of the ZnO, Al2O3 and ZrO2 films. Measurements were between
400 and 1200 nm under 65o, 70
o and 75
o incidence angle. The VASE is equipped with a
Czerny-turner scanning monochomator with a focal length of 160 mm and an effective
aperture ratio of f/4.5. The wavelength dependence of the refractive index film and
extinction coefficients were modeled using the Wvase32 software that accompanied the
instrument.
Page 81
65
3.3.2 Heat Treatment Furnaces
Thermal annealing was undertaken by using the Barnstead Thermolyne 48000
Furnace. The samples were annealed at 400 and 1000oC for duration of 2 hours. All
thermal annealing of the samples were done under atmospheric pressure, after anneal the
samples were allowed to air cooled.
3.3.3 Atomic Force Microscopy
To determine the surface topography and roughness of the as deposited and
annealed nanolaminates, an atomic force microscope (AFM) was used. All the samples
were studied using the Veeco Nanoscope III Scanner Probe microscope AFM. All the
imaging were done in the tapping mode, with silicon cantilever probes (Tap300-10 from
Budget Sensors) of 300 kHz resonating frequency. The sizes of the scanned areas were
typically 5 µm x 5 µm, the scans were done at three different areas on the sample. These
values were averaged out and used as the average roughness of the deposited film.
3.3.4 X-ray Diffraction
In order to identify the phases and assess the possible texture crystallographic
orientation in both the as deposited and the annealed nanolaminate films, a Rigaku
Ultima III diffractometer was used in the grazing angle incidence XRD (GIXRD) in the
parallel beam mode using a thin film stage and a scintillation detector. CuKα x-rays with
a wavelength of 0.154 nm were generated at 40 kV and 44 mA. Scans were done between
20-90o 2theta, most of the settings were kept at constant values: 5
o incident angle, 0.05
o
step size, 2 degree/min scan speed, 10 mm divergence height limiting slit, 0.5o incident
side Soller slit, open attenuator, 0.5o diffracted side parallel beam (PB) slit, and open
Page 82
66
sizes for all divergence, scattering and receiving slits (DS/SS/RS). Jade v7.0 software
was used to process and analyze the scan results for GIXRD.
According to the Debye-Scherrer equation,
(3.1)
(Bauer et al., 1978) which relates the crystal size to the broadening of the diffraction
peaks, the grain sizes of the deposited crystals were determined. From the equation, λ is
characteristic CuKα wavelength of 0.154 nm, B is the full-width at half maximum
(FWHM) of the broadened diffraction line on the 2θ scale (radians) and θ is the angle
(Bragg angle) between the incident beam and sample plate in the XRD machine. When
the FWHM of a peak is measured, the resultant breadth is a product (convolution) of the
actual material and the instrument, this is known as the instrumental broadening. Thus in
order to determine the actual FWHM of the material, the instrumental broadening
FWHM must be removed. The FWHM of the instrument has been identified from the x-
ray diffraction spectrum of single crystalline Si wafer to be 0.0016049 (radians). Thus if
the observed peak of the material has a width of WFWHM, and the width due to
instrumental effect is Winstr, then the new width used in determining the crystallite size
Wsample is given by:
(3.2)
3.3.5 Pin-on-Disc (POD) Tribometer Test
The coefficients of friction (COF) of the films were determined by using the
Falex (Implant Sciences) ISC – 200 pin-on-disk (POD) tribometer. This pin-on-disk
tribometer measures the sliding friction coefficient on planar surfaces. The deposited
Page 83
67
nanolaminate films (thin film disk) were rotated under the pin counterface materials
which were held in a stationary position by a cantilever beam. In order to generate a point
contact between the pin and the disk, a vertical (normal) load is applied. Si3N4 (H = 22
GPa) and SS 440 C (H = 10 GPa) pins/balls with 1/8 inch (3.2 mm) diameter
(ceramic/ceramic and metal/ceramic respectively) were used as the counterface materials.
The coefficients of friction were calculated throughout the test by taking the ratio of the
tangential load, measured by a strain gauge transducer, to the normal load. The tests were
performed in unidirectional sliding mode under normal loads that were of 25, 50, 100 and
250 grams at room temperature and lab air (~ 40% relative humidity). Table 3.3 provides
the experimental POD test protocol used for the nanolaminate films. The pins were
cleaned with acetone, methanol and DI water respectively prior to performing any test.
The POD tests were repeated at least two times on a particular film. However, the radius
was changed as well as the total number of cycles to reach the same distance (200 m)
travelled by the pin. The revolutions per minute (RPM) is also adjusted whenever the
radius is changed in order to keep the linear speed constant at 2.2 cm/s for all the POD
tests.
Page 84
68
Table 3.3: POD Test Design Settings
Set Normal Load (g) Pin Material Replicates
Nanolaminates on Si
substrate (As-deposited and
Annealed)
25, 50, 100 Stainless Steel
(SS440C) Si
3N
4
≥ 2
Nanolaminates on M50
Steel substrate (As-
deposited and Annealed)
25, 50, 100, 250
Si3N
4
≥ 2
In order to assess the tribological behavior of the films, the Hertzian Theory of
Elastic Deformation was used to determine the contact parameters. This theory relates the
circular contact area of a sphere with a plane (or more general between two spheres) as
depicted in figure 3.2 to the elastic deformation properties of the nanolaminates.
Figure 3.2: Schematic illustration of a) Hertzian contact between spheres, b) Hertzian
contact between a sphere and an elastic material, with an increase in contact area.
Page 85
69
Considering two bodies with radii of curvature RI and R
II that are in contact, the contact
radius, a, is given by
*
+
(3.3)
where L is the applied normal force (load), R is the relative radius of the contact and E*
is the combined Young’s modulus of the two materials. R and E* are defined below.
(
)
(3.4)
where RI and R
II are the radii of the contacting surfaces, e.g. radii of pin and disc. The
radius is considered positive for convex surface and negative for a concave surface. For
radii with flat surfaces, infinity is normally used.
(3.5)
where ν is the Poisson’s ratio and E1 and E2 are the elastic modulus of the contacting
materials. For a circular (point) contact, the mean pressure (Pm) is given by;
(3.6)
The maximum pressure (Hertz pressure), Pmax occurs at the center of the contact and this
is given by
(3.7)
In analyzing the tribological behavior of solid coatings, the kinetic friction coefficient
defined as the ratio of the frictional force and the applied load, i.e.
(3.8)
Page 86
70
was applied. The frictional force, F, is expressed as a product of the actual contact area
(A) and the shear strength of the lubricant material that has to be overcome in order to
slide (τ), Aτ as shown in figure 3.3. Bowden and Tabor (1986) assumed that in order for
the bodies to slide relative to each other
a. The asperities should plastically deformed and
b. The interfacial stress component should correspond to the shear strength of the
soft material τcrit.
3.3.6 Rolling Contact Fatigue Test
The rolling contact fatigue (RCF) machine was used to determine the life of
rotating cylindrical test specimens (3/8” diameter rod) subjected to various material,
lubricant, and load conditions. The springs on the test head were used to transmit a load
of 1.5 GPa through the cups to the three ½” diameter balls. The three 52100 steel
(uncoated) balls are driven by the rod and rotate around the rod. 8 to 10 drops of MIL-L-
23699 synthetic based oil lubricant is supplied by drip feeding onto the top of the rod.
The rod rotates at a speed of 3600 rpm and the test runs until a spall develops and/or the
coating fails. Figure 3.4 shows a schematic diagram of a three ball on rod RCF machine
and table 3.4 provides the conditions under which the test was undertaken.
Page 87
71
Table 3.4: RCF Testing Conditions
Figure 3.3: Schematic of three ball on rod RCF machine.
Page 88
72
3.3.7 Optical Microscopy
A Nikon Eclipse ME600 optical microscope was used to capture the images of the
pin surfaces and the wear tracks at 10X, 20X and 50X magnifications after POD testing.
The images were analyzed by the NIS-Elements BR2.30 software.
3.3.8 Profilometer
A Veeco Dektak 150 Profilometer was used to measure the wear track depths and
cross-sectional areas removed after the pin-on-disk tests. The cross-sectional area data
were used to calculate the wear factor of the worn area. The stylus pin used had a radius
of 12.3 µm radius, a force of 100 µg was applied with scan lengths between 800 and
1200 µm.
3.3.9 Scanning Electron Microscopy and Focused-ion beam microscopy and
Micromachining
A FEI-Nova Dual Beam Scanning Electron Microscopy/Focused Ion Beam
(SEM/FIB) was used for evaluations of both the unworn and worn surfaces and the debris
after the POD testing. Cross-sectional TEM specimens preparation was also performed
with the dual beam focused ion beam inside the SEM. The micromachining technique
was done by using Ga ions in the FIB to prepare the specimens of <100 nm thickness and
approximately 10 – 20 µm long cross-section. Before the specimens were
micromachined, three different techniques for protecting the surface of the nanolaminate
films were undertaken. First, a ~50 nm thin layer of electron beam Pt was deposited at
3kV, 4.3 nA, this was followed by a 500 nm ion beam Pt at 10 kV, 0.1 nA and finally, a 1
µm ion beam Pt at 30 kV, 0.12 nA. Rough milling was done at 30 kV starting at 7 nA
Page 89
73
spotsize and progressively decreased to 50 pA as the foil is thinned down to electron
transparency i.e. <100 nm. A 5 kV, 70 nA cleaning/final thinning step was done to
eliminate ion damage from the specimen. After the cut with the Ga ion beam, the
specimen was then transferred via an Omniprobe nanomanipulator and attached onto a 3-
mm TEM Cu grid. In order to remove carbon and other impurities from the specimens
surfaces prior to being introduced into the TEM chamber, the specimens were cleaned
with Ar plasma.
3.3.10 Transmission Electron Microscopy and Energy Dispersive X-ray Spectroscopy
An FEI Co. Tecnai G2 F20 S-Twin Schottky field-emission Scanning
Transmission Electron Microscopy (S/TEM) was used to characterize the structure, ZnO
lattice d-spacing, and ZnO grain orientation inside and outside the wear tracks. The
STEM was operated at 200 kV.
3.3.11 X-ray Photoelectron Spectroscopy
The stoichiometry and composition of the nanolaminates were determined by PHI
5000 Versaprobe X-ray Photoelectron Spectrometer system. The XPS system is equipped
with a monochromatic Al Kα1 x-ray source of 1486.6 eV (hν). The elemental
composition of the surface of the films were acquired by operating the X-ray source at
10.9 W with a pass energy of 58.7 eV, 45o take-off angle and 0.5 eV/step scan rate.
Additionally, an Ar+ gun was used to sputter clean the top 1.2 nm of the films to remove
adventitious carbon, and subsequently extract the chemical bonding information from
below the original surface. The depth profiling was done with intermittent ion sputtering
Ar+ ion beam at 1 kV raster-scanned over a 2 mm x 2 mm area of the sample for a
Page 90
74
predetermined time of 60 s followed by a core level spectra acquisition. The depth profile
samples were characterized using a 200 µm x-ray spot at 50 W power. A PHI MultiPakTM
software was used to fit the curves and smooth both the elemental composition and depth
profile line shapes.
3.3.12 Auger electron spectroscopy
Surface analysis with auger electron spectroscopy (AES) was performed inside of
the wear tracks. This was done to analyze the chemical composition inside the wear
tracks. The AES analysis was performed with a PHI 670xi Scanning Auger Nanoprobe
(SAN) working at 10 - 20 keV and a beam current of 10 nA. The SEM attached with the
SAN was used to obtain the micrographs with magnifications of up to 14000X by using
raster scanning with a highly focused electron beam. Using the same raster scan, with a 2
point acquisition method and a 512 resolution, the SAN was used to produce elemental
composition maps of the wear tracks. A PHI MultiPakTM
software was used for the
compositional analysis of the mapped wear tracks.
Page 91
75
CHAPTER 4
ATOMIC LAYER DEPOSITION OF LUBRICIOUS ZnO/Al2O3/ZrO2 AND
ZnO/ZrO2 NANOLAMINATE FILMS ON SILICON SUBSTRATE
In this chapter, the experimental results and discussion of the various processing,
structure and properties of ZnO/Al2O3/ZrO2 one trilayer and ZnO/ZrO2 2 and 8 bilayers
nanolaminate films deposited on silicon substrate by ALD are presented. It should be
noted that the characterization follows a top-down approach, where the surface is
characterized first going down towards the substrate. The post-tribotest characterization is
preceded by the as deposited and annealed nanolaminate characterization. Based on the
results, the ZnO/Al2O3/ZrO2 one trilayer nanolaminate films have the best potential to be
used as a solid lubricant in load bearing and high temperature applications. These results
findings are summarized at the end of the chapter.
4.1 Nanolaminate film condition selection
The nanolaminate films were deposited on Si wafers to study the role of structure
in controlling the tribological properties (coefficient of friction and wear factor).
Approximately 200 nm thickness nanolaminate film was deposited with different layer
combinations under varying deposition conditions. The crystal structure and coefficient
of friction (COF) results on various nanolaminate thin films were first considered to
identify what combination and deposition conditions resulted in lower friction and wear
Page 92
76
factor.1 Based on the COF and the wear factors, it was identified that the ZnO/Al2O3/ZrO2
nanolaminate film possessed the best properties.
4.1.1 ZnO/Al2O3/ZrO2 One Trilayer Surface Morphology
AFM was used to study the surface roughness of the as deposited and annealed
nanolaminate films. Figure 4.1 shows the AFM images of 1-trilayer of the as-deposited,
ex-situ annealed in air at 400oC and 1000
oC nanolaminate films. The deposition
conditions for these films were previously outlined in Table 3.1. The images indicate that
there is increase in the surface roughness as the nanolaminate films are annealed at
1000oC, the as-deposited nanolaminate film has the smoothest surface followed by the
400oC film. Figure 4.2 shows a plot of the surface roughness (RMS) verses temperature
of anneal, this plot also indicates an increase in the height range of the asperities (Z-
range) as the annealing temperature is increased. The as-deposited nanolaminate film has
the lowest height range, this is followed by the 400oC with the 1000
oC having the highest
height range. This is in accordance with the RMS data for these three conditions.
Page 93
77
Figure 4.1: AFM surface scan of 1-trilayer nanolaminate film with scan size of 5 X 5 µm.
As-deposited (left), ex-situ annealed in air at 400oC (middle) and 1000
oC (right).
0
20
40
60
80
100
120
140
160
180
164.10
±0.17
22.07
±0.36 3.45
±0.07
3.17
±0.015
31.02
±0.67
1000450
Rou
ghn
ess
(nm
)
Temperature of Anneal (oC)
Z-range
RMS
As Deposited
26.74
±0.64
Figure 4.2: A graph of the Temperature of Anneal versus the Surface Roughness
Parameters of One Trilayer Nanolaminates.
Page 94
78
4. 1. 2 ZnO/Al2O3/ZrO2 One Trilayer Nanolaminate Film Composition
XPS was used to analyze the chemical composition of the one trilayer
nanolaminate films. It was determined that the as-deposited Zn:O composition was 57:43
atomic percentage. ZnO should demonstrate a 50:50 zinc-to-oxygen atomic percentage
ratio, thus the ZnO layer exhibits oxygen deficient stoichiometry that would suggest
oxygen vacancies, or conversely zinc rich (zinc interstitials). After annealing the
nanolaminate to 400oC, the ZnO layer became closer to stoichiometric with values of
53:47 indicating some surface oxidation. At 1000oC annealing, there is the presence of
both Zr and Al in the surface composition. The presence of these two elements at the
surface indicates that there is either a diffusion of the Zn into the underneath layers or Zn
evaporation. This may also explain why the AFM analysis indicated a very rough surface
after the 1000oC anneal.
Page 95
79
(a)
(b)
Figure 4.3: XPS depth profile results of ZnO/Al2O3/ZrO2 nanolaminate film deposited on
Si substrate (a) As-deposited, (b) annealed at 400oC.
bam0103_1.PRO: Depth profile of dep 31 on M50 after sputter clean Yudong
2010 May 5 Al mono 49.3 W 200.0 µ 45.0° 58.70 eV 7.3448e-001 max
Fe2p3/Area1
0 50 100 150 200 250 3000
10
20
30
40
50
60
70
80
90
100bam0103_1.PRO
Sputter Time (min)
Ato
mic
Con
cent
ratio
n (%
)
O1s
Zn2p3
Zr3d
Al2p
Fe2p3
Page 96
80
(c)
(d)
Figure 4.3: XPS depth profile results of ZnO/Al2O3/ZrO2 nanolaminate film deposited on
Si (c) annealed at 1000oC. (d) Zr 3d5/2 peak montage after 1000
oC anneal.
Page 97
81
In Figure 4.3a, the XPS depth profile of the as-deposited nanolaminate film
confirms the oxygen deficiency in the ZnO, Al2O3 and ZrO2 layers. The depth profile for
the nanolaminate film annealed at 400oC showed similar atomic concentrations as the as-
deposited film. This is shown as Figure 4.3b. In Figure 4.3c, the depth profile for the
1000oC annealed film shows the presence of high concentration of Al on the surface
while there is a very low concentration of Zr on the surface. Even though there is Zn on
the surface, it is observed that there is diffusion of Zn into the other layers, a high
concentration of Zn was observed sitting on top of the Si substrate. Figure 4.3d indicates
the Zr 3d5/2 montage. It is observed from the plot that, the 3d5/3 peak is shifting from the
right towards the left as sputter time increases. After 50 minutes of sputtering, the binding
energy of the 3d5/2 spectra is ~ 181.9 eV, this increased steadily to 183.9 eV after 180
minutes of sputtering. There have been several studies on the peak shift on the shift of the
3d5/2 spectra. It has been related to change in the Zr oxidation state, thus with the Zr
cations mainly present in the valence four oxidation state (Zr4+
), can change to Zr3+
and
Zr2+
due to the Zr cations filling interstitial states during the thermal aneal. This is
observed when there is a peak shift of more than 1 eV which was observed in the
montage above (Figure 4.3d).28
It is also observed that, there is difference in the atomic
percentages of the high resolution scan and the depth profile; this could be attributed to
the preferential sputtering of oxygen by the argon during the depth profiling.2
Page 98
82
4.1.3 ZnO/Al2O3/ZrO2 One Trilayer Nanolaminate Films Microstructure
The XRD spectra (with incident angle = 5o) of the ALD deposited nanolaminate
films on silicon are shown in Figure 4.4. For all the conditions, the XRD spectra show
that ALD ZnO film crystallizes in the hexagonal wurtzite structure grains with strong
(0002) diffraction peak implying that most of the c-axis of ZnO grains are arranged
perpendicular to the substrate surface. The spectra also shows peaks for ZrO2, with the as
deposited and 400oC annealed nanolaminates exhibiting tetragonal crystal structure. The
peak that is dominant in these nanolaminate films is the (101) peak. In the case of the
1000oC annealed nanolaminate film, the crystal structure changes from tetragonal to
monoclinic and the most dominant peak is the (-111). There were no peaks that could be
attributed to the Al2O3 and aluminum-zinc oxide (AZO, ZnAl2O4), thus the Al2O3 is an
amorphous layer.
The XRD scans of the as-deposited and annealed nanolaminate films, which
shows peaks corresponding to hexagonal ZnO (wurtzite structure), tetragonal and
monoclinic ZrO2 are based on indexed PDF#01-089-7102, PDF#01-070-7304 and
PDF#01-070-8739, respectively. The ZnO (0002) peak was detected at ~34.5o 2θ, the
ZrO2 (101) and (110) peaks at ~30.6o and ~35.3
o 2θ respectively and the ZrO2 (-111) peak
at 28.4o. No Al2O3 peaks were detected in the films. ZnO crystallites are clearly (0002)
preferentially orientated or textured. Figure 4.5 shows the corresponding ZnO (0002)
pole figure for the as-deposited film, which confirms the highly (0002) out-of-plane
fibrous texture. The most favorable growth directions of ZnO crystals are (0001), (0110)
and (2-1-10), out of these, (0001) is the fastest growth direction.3,4
Thus (0002) texture,
Page 99
83
otherwise called c-axis orientation, is commonly observed in ZnO films because the c-
plane perpendicular to the substrate normal is the most densely packed and
thermodynamically preferred in the wurtzite structure.5 ZnO films that are grown on glass
and amorphous substrates also exhibit the c-axis orientation.6 A (0002) texture has been
shown to promote good tribological properties in PLD ZnO, so promoting its growth in
the nanolaminates is productive for tribological applications.7
Page 100
84
30 40 50 60 70 80 90
Inte
nsit
y (a
.u)
2
1000oC Anneal
400oC Anneal
As DepositedZrO2
(111)M
ZrO2
(101)T
ZrO2
(101)T
ZnO
(0002)
(0002)
ZnO
(0002)ZnO
ZrO2
(110)T
ZrO2
(110)T
ZrO2
(102)
ZrO2
(-111)M
(a)
28 30 32 34 36 38 40
ZrO2
(102)M
Inten
sity (
a.u)
2
As-Deposited
400oC Anneal
1000oC Anneal
ZrO2
(101)T
(0002)ZnO
ZrO2
(110)T
ZrO2
(-111)M
(b)
Figure 4.4: GIXRD analysis of ZnO/Al2O3/ZrO2 nanolaminate films with θ - 2θ scans of
as-deposited and annealed films.
Page 101
85
Figure 4.5: ZnO (0002) pole figure of as-deposited film. Color level corresponds to x-ray
intensity counts.
With annealing at 400oC, it was determined that the intensity of (0002) diffraction
peak increased and the full width at half maximum (FWHM) became slightly narrower.
The increase of diffraction intensity and narrowing of FWHM are related to the enhanced
crystallinity and increased grain size, respectively. At 1000oC annealing, there was a
further reduction in the FWHM with a decrease in intensity. The decrease in intensity is
due to the diffusion of the ZnO nanocrystalline layer into the other layers. The values of
FWHM for (0002) diffraction peaks were 0.45o, 0.41
o and 0.37
o for the as-deposited,
Page 102
86
400oC and 1000
oC annealed films, respectively. In addition, it is clear that there is no
peak shift due to annealing (Figure 4.4b), this means that the as-deposited and annealed
films have no detectable built-in lattice strain.8
The narrowing of the peaks with increase in annealing temperatures can be related
to the increase in grain size by the Debye-Scherrer formula (Section 3.3.4). The raw
FWHM values were corrected by subtracting the instrumental broadening value that was
identified from the x-ray diffraction spectrum of single crystalline silicon wafer to be
0.0016049 radians (section 3.3.4).9 Table 4.1 shows the FWHM and the calculated grain
sizes of the as deposited, 400oC and 1000
oC annealed films respectively. The grain size is
illustrated in Figure 4.6.
Table 4.1: Table of the FWHM and grain sizes of the ZnO/Al2O3/ZrO2 One Trilayer
Nanolaminate Films
FWHM (o) of (0002)
ZnO Plane
Grain Size (nm) of
(0002) ZnO Plane
As-Deposited 0.45 27.8 ± 0.74
400oC Annealed 0.41 34.1 ± 1.04
1000oC Annealed 0.37 49.8 ± 0.74
Page 103
87
As Deposited 400 1000
25
30
35
40
45
50
Temperature of Anneal (oC)
Gra
in S
ize
(nm
)
Figure 4.6: A graph that shows an increase in grain size of ZnO (0002) grain with the
increase of temperature of anneal.
From the XRD data and as already mentioned, the sandwiched Al2O3 between the
ZnO and the ZrO2 layers is amorphous. It has been reported elsewhere that the
amorphous Al2O3 layer grown beneath a thin ZnO film helps in achieving the (0002)
preferred orientation of the ZnO thin film. Thus the a-Al2O3 layer suppresses growth of
(1010) and (1011) ZnO grains. According to Romanes,10
Al2O3 deposited underneath a
ZnO layer exhibited a better (0002) reflection than when ZnO was deposited on
amorphous SiO2 native oxide. Thus it is right to conclude that the Al2O3 promotes the
growth of (0002) oriented grains.
Page 104
88
The XRD data also confirms that tetragonal and monoclinic ZrO2 is crystalline
with (101) and (-111) textures, respectively. The (101) peaks were detected at ~30.6
while the (-111) peak was detected at 28.4oC on the 2 theta axis. The mean grain size of
tetragonal (101) ZrO2 before and after 400oC anneal on silicon was ~15.9 nm. There was
no change in the grain size after anneal. The relatively high toughness ALD ZrO2 should
act as a load bearing layer (at moderate contract stresses) and as a pathway to dissipate
energy to prevent cracking between the bilayers. The phase transformation of ZrO2 from
tetragonal to monoclinic due to thermal anneal has been observed by other groups.
Various studies have shown this effect in tetragonal thin films with grain sizes of
approximately 50 or less nanometers. From Figure 4.4, it was observed that, the as-
deposited and 400oC annealed films both possessed a tetragonal ZrO2 phase, but when the
nanolaminate film was annealed at 1000oC, the tetragonal ZrO2 transformed to
monoclinic. Zhu et al.11
observed this behavior when they deposited ZrO2 by a PLD
technique in 20 Pa O2 ambient at various substrate temperatures ranging from 400oC to
700oC on n-Si wafers. With substrate temperature of 400 and 500
oC, tetragonal (101)
ZrO2 diffraction peaks were observed, but at 700oC substrate temperature, both
monoclinic (022) and tetragonal (101) peaks were observed. In 2001, Ji et al.12
produced
ZrO2 coatings by reactive dc magnetron sputter deposition technique. When the crystal
structure of the coatings were characterized, it was determined that at 500oC of annealing,
there was no phase transformation of t-ZrO2, but when the film was annealed at 750oC,
small (11-1) and (111) monoclinic peaks were observed beside the (111) tetragonal peak.
At higher annealing temperatures, i.e. 850oC to 1050
oC, the monoclinic peaks greatly
Page 105
89
increased and the (111) tetragonal peak intensity rather decreased which indicated further
transformation of the metastable tetragonal phase. Liu et al.13
also studied this effect by
using a rapid thermal annealer, it was also observed that above 750oC, there is a resulting
mixture of monoclinic and tetragonal ZrO2 peaks. The monoclinic content (Vm) in the
films were calculated based on the temperature of anneal. They observed an increase in
the monoclinic content with increasing annealing temperature. They attributed this effect
to the crystallite size of their ZrO2 particles (48 nm). Their reason was that because the
ZrO2 thin films were composed of very small crystallites, they will have a large fraction
of surface regions. This transformation effect was first reported by Garvie14
in 1965, he
determined that, ZrO2 films with maximum grain sizes of 30 nm demonstrated a
tetragonal phase up to approximately 500oC. Above 800
oC, a complete transformation
occurs and they demonstrate monoclinic phase. But at the intermediate temperatures,
partial transformation occurs, and a two-phase region is observed. Garvie postulated that
the two phases (monoclinic and tetragonal) are in equilibrium at 300oC when the ZrO2
crystallite size is 30 nm. The total free energies of these two phases can be expressed as
(4.1)
(4.2)
Where α is the molar free energy (cal/mol) of ZrO2 in the form of a large single crystal, β
is the surface energy (cal/cm2) and S is the molar surface (cm
2/mole). The subscripts m
and t stand for monoclinic and tetragonal phases, respectively. Thus under the condition
of small crystallite size, surface energy plays an important role and dictate any structural
change since the surface area per unit volume is large.15
Garvie also reported that high
Page 106
90
temperature tetragonal phase has a surface energy (βt) of about 770 erg/cm2, lower than
the stable monoclinic phase (βm) at room temperature, 1130 erg/cm2. Therefore, although
αt < αm at a temperature below 1100oC, the tetragonal phase may still be energetically
favored giving a small enough crystallite size and thus a large enough S/V ratio. As the
crystallite size increases with increasing annealing temperature, S/V ratio decreases
accordingly and the monoclinic phase, the low temperature stable phase of bulk ZrO2,
finally appears. In the ZnO/Al2O3/ZrO2 nanolaminate film, the ZrO2 grain size is
approximately 15 nm, thus this phase transformation effect confirms what has been
observed by other groups.
4.2 Cross-sectional TEM analysis of the unworn nanolaminate films
Figure 4.7 shows a bright-field cross-sectional transmission electron micrograph
(XTEM) images of as deposited and annealed unworn ALD ZnO/Al2O3/ZrO2 one trilayer
nanolaminate film on a silicon substrate. In order to protect the region of interest from ion
beam damage prior to the FIB milling, electron and ion beam assisted Pt were first
deposited. From these images, it is evident that;
a. There is a distinct and sharp interfaces that exists between the ZnO, Al2O3, and
the ZrO2 layers.
b. Both the ZnO and the ZrO2 layers are crystalline, and they exhibit columnar
grains grown to layer thickness as demonstrated by the XRD results.
c. The Al2O3 film is amorphous, and this confirms why there were no Al2O3
reflections in the XRD data.
Page 107
91
d. At 1000oC anneal, there is a significant reduction in the ZnO layer, the ZnO film
diffused through the other layers and mostly settled underneath the ZrO2 layer.
Thus the diffusion of ZnO that was observed in the XPS depth profile is
confirmed by the XTEM image. HRTEM also showed a phase transformation of
the amorphous Al2O3 to a crystalline corundum structure, but this was not
observed on the XRD. The thickness of the Al2O3 is very small and this is below
the detection limit of the XRD. There was also the intermixing of ZnO and Al2O3
films near the surface.
e. There is also a phase transformation in the ZrO2 columnar grains at 1000oC
anneal. In the as deposited and 400oC anneal ZrO2 layers, the structure is more
columnar but at 1000oC, the grains are more box-like. XRD confirmed that this is
a tetragonal to monoclinic phase transformation.
f. There is an increase in thickness of the ZrO2 layer at 1000oC anneal, this could be
related to the phase transformation since the unit cell for a monoclinic structure is
larger than the unit cell of the tetragonal structure due to the high packing density
of the monoclinic cell.
g. There is also an increase in the native SiO2 thickness due to the 1000oC anneal.
This increase could be attributed to the diffusion of oxygen through the grain
boundaries of the ZrO2 nanofilm stack which resulted in this significant SiO2
interfacial growth from ~2 nm to ~50 nm.16
h. In Figure 4.7b, the 1000oC annealed ZnO/Al2O3/ZrO2 interface shows that the
amorphous Al2O3 has transformed to crystalline. This was not observed in the
Page 108
92
XRD due to the small thickness of the Al2O3. In order to determine the
composition of this layer, the d-spacing of the crystals were measured and
compared to various XRD PDFs. The d-spacing matched the (111) of ZnAl2O4
ternary compound. The measured d-spacing value was ~4.65 Å. This observation
suggests that there is a reaction between the ZnO and Al2O3 layers, thus this layer
is not homogenous.
Page 109
93
Figure 4.7: XTEM bright-field images for 1 trilayer nanolaminates (left) as deposited,
(middle) 400oC annealed and (right) 1000
oC annealed. (b) ZrO2/Al2O3/ZnO interface.
In order to determine the cross-sectional composition of the 1000oC annealed
films, a couple of chemical EDS analysis were carried out on the unworn sample. Figure
4.8 shows the results of the EDS line scan chemical profile which indicates the
compositional variation of the cross-section, the profile is also shown below. From the
Page 110
94
EDS line chemical profile scan, a few observations were made: there is the presence of
ZnO on the surface of the film, and the ZnO diffusion that was observed by the XPS
depth profile and TEM micrograph is also confirmed. It is also observed that the ZrO2 is
sandwiched between the two ZnO layers. The diffusion of the ZnO through the ZrO2
layer confirms that phase transformation (from tetragonal to monoclinic) that was
observed by the XRD. Thus with this transformation, enough space (low packing factor)
was created for the ZnO to diffuse through. The Al2O3 count that was picked on the line
scan was very minimal.
Figure 4.8: XTEM results of unworn 1000oC annealed one trilayer nanolaminate film
revealing the microstructure and layer composition.
In order to determine whether the Al2O3 was present, EDS chemical mapping was
undertaken. Figure 4.9 shows the XTEM image and EDS chemical mapping of the area in
the red box. The individual maps indicate the presence of Si, Al, Zn and Zr. The
observations that were made by the AES surface mapping are confirmed in this cross-
sectional compositional mapping. Thus the surface of the one trialyer nanolaminate film
Page 111
95
after 1000oC anneal shows the presence of both Zn and Al on the surface. Even though
most of the Al is beneath the ZnO layer, there are some areas that indicate the presence of
Al on the surface. Another important observation that was confirmed with this
compositional map is the diffusion of ZnO through the ZrO2 layer. This is also observed
in the map. There is some intermixing of the diffused ZnO and the native SiO2 layers.
Figure 4.9: XTEM chemical analysis showing chemical maps of unworn 1000oC
annealed one trilayer nanolaminate film.
Page 112
96
4.3 ZnO/Al2O3/ZrO2 One Trilayer Nanolaminate Films Tribological Behavior
The friction coefficient measurements of the nanolaminate films were conducted
by using the Falex (Implant Sciences) ISC-200 pin-on-disk tribometer. Tests were set to
run to approximately 140 - 200 m with a friction limit of 1.6. When the friction
coefficient reaches this friction limit, the test would terminate. For each test, the
rotational speed was adjusted to a constant sliding speed of 2.2 cm/s. All tests were
performed in a unidirectional sliding mode. A 3.175 nm diameter Si3N4 or SS440 C steel
balls were used as the counterface to the nanolaminate films.
4.3.1 As-Deposited Friction Test Results
Typical friction behavior curves are shown in Figure 4.10, the plots indicates
coefficient of friction (COF) as a function of unidirectional sliding distance (m) for the as
deposited one trilayer nanolaminate film. All tests went to completion of 200 m total
distance without reaching 1.6 the COF limit set for the tribometer.
In plots (a) and (b), an SS440 C steel ball was used as the counterface material
during the friction test. A 50 gram load was used as the hanging weight in plot (a) while
100 gram load was used for the plot (b). The COF of the 50 and 100 gram loads reached
steady state friction values of approximately 0.22 and 0.27 respectively. The 50 gram
load run started with COF of < 0.2 but increased steadily until it reached the steady state.
In the case of the 100 gram load run, the COF started at approximately 0.25, test 1
increased to 0.35 before it reduced to the steady state while test 2 decreased in COF to <
0.2 and steadily increased to 0.3.
Page 113
97
0 50 100 150 200
0.0
0.2
0.4
0.6
0.8
Coef
fici
ent
of
Fric
tion
Distance (m)
Test 1
Test 2(a)
0 50 100 150 200
0.0
0.2
0.4
0.6
0.8 (b)
Coeff
icie
nt
of
Fric
tion
Distance (m)
Test 1
Test 2
0 50 100 150 200
0.0
0.1
0.2
0.3
0.4
0.5
0.6
0.7
0.8
0.9
(c)
Coeff
icie
nt
of
Fric
tion
Distance (m)
Test 1
Test 2
0 50 100 150 200
0.0
0.1
0.2
0.3
0.4
0.5
0.6
0.7
0.8
0.9
(d)
Coeff
icie
nt
of
Fric
tion
Distance (m)
Test 1
Test 2
Figure 4.10: Coefficient of Friction measurements of the as-deposited ALD grown one
trilayer nanolaminate. (a) 50 gram load with SS440 C ball (b) 100 gram load with SS440
C steel ball (c) 50 gram load with Si3N4 ball and (d) 100 gram load with Si3N4 ball.
In the case of plots (c) and (d), a Si3N4 ball was used as the counterface material during
the friction test. A 50 gram load was used as the hanging weight in plot (c) while 100
gram load was used for the plot (d). The COF of the 50 and 100 gram loads reached
steady state friction values of approximately 0.34 and 0.26 respectively. In both cases the
friction started a little lower and increased steadily to the steady state friction. There was
increase in the COF for the test 2 of the 100 gram load at certain points. This anomaly
could be due to some debris falling into the wear track. The decrease in the COF with
Page 114
98
increase in applied load is confirmed by the Bowden and Tabor theory, i.e. COF
decreases with increase in applied load for a sphere on flat contact.
It should be noted that under the same conditions, i.e. same load and running
distance, the SS440 C steel ball provided a little lower COF than the Si3N4 ball. The
increase could be attributed to the properties (hardness) of these two balls. Si3N4 is
known to be a very tough ceramic with hardness of 9 on the Mohs scale while the SS440
steel ball has a less strong bonding (metallic bonding) and a hardness of 6.5 on the Mohs
scale. Due to this toughness properties of the Si3N4 material, the interfacial stress is
expected to be high (Bowden and Tabor theory) than that of the SS440 C steel ball, thus
during unidirectional sliding it is expected that COF of the Si3N4 should be higher than
the SS440 C steel ball.
4.3.2 400oC Annealed Friction Test Results
Figure 4.11 shows a comparison of the COF plots of the 400oC annealed one
trilayer films. All tests went to completion of 140 and 200 m in distance respectively
without reaching the 1.6 COF limit set for the tribometer. In plot (a), an SS440 C steel
ball was used while a Si3N4 was used for plots (b) through (d). In plots a and b, a 50 gram
load was used as the hanging weight, in plot c, a 100 gram load was used while in plot d,
a 250 gram load was used.
Page 115
99
0 30 60 90 120
0.0
0.2
0.4
0.6
0.8
(a)
C
oeff
icie
nt
of
Fric
tion
Distance (m)
0 50 100 150 200
0.0
0.2
0.4
0.6
0.8
Coeff
icie
nt
of
Fric
tion
Distance (m)
Test 1
Test 2(b)
0 50 100 150 200
0.0
0.2
0.4
0.6
0.8
Coeff
icie
nt
of
Fric
tion
Distance (m)
Test 1
Test 2(c)
0 50 100 150 200
0.0
0.2
0.4
0.6
0.8
Coef
ficie
nt
of
Fri
cti
on
Distance (m)
Test 1
Test 2(d)
Figure 4.11: Coefficient of Friction measurements of the 400oC annealed ALD grown
one trilayer nanolaminate. (a) 50 gram load with SS440 C steel ball, (b) 50 gram load
with Si3N4 ball, (c) 100 gram load with Si3N4 ball and (d) 250 gram load with Si3N4 ball.
The steady state COF of plot (a) is approximately 0.45, while plots b through d
have steady state COF of approximately 0.27, 0.23 and 0.18. Two important observations
from the data above is that firstly, for the Si3N4 ball 400oC annealed films, the COF data
values achieved were lower than the as deposited under similar conditions. Secondly,
there is a decrease in the steady state friction with increase in the applied load. This trend
Page 116
100
is observed in both the as-deposited and the 400oC annealed samples. This is in
agreement with the Bowden and Tabor (equation 3.10) Hertzian contact model.
4.3.3 1000oC Annealed Friction Test Results
Figure 4.12 shows the effect of high temperature anneal prior to friction test. All
the tests went to completion of 200 m distance without reaching the 1.6 COF limit set for
the tribometer. A Si3N4 ball was used in all the friction tests, in plot (a) a 25 gram load
was applied, test 1 started with a very high COF but stabilized to approximately 0.6, test
2 started with a lower COF but also stabilized at approximately 0.45. With 50 gram load
(plot b), the steady state COF is approximately 0.5, when a 100 gram load (plot c) is
applied, the steady state friction reduced to approximately 0.3. It should be noted that the
COF trend also follows the Hertzian contact model, which is as load increases the low
COF is observed. In comparing the COF data for the three conditions above, the 1000oC
anneal are comparably higher than the 400oC anneal and the as-deposited nanolaminate
one trilayer.
Page 117
101
0 50 100 150 200
0.0
0.1
0.2
0.3
0.4
0.5
0.6
0.7
0.8
0.9
(a)
C
oef
ficie
nt
of
Fric
tio
n
Distance (m)
Test 1
Test 2
0 50 100 150 200
0.0
0.1
0.2
0.3
0.4
0.5
0.6
0.7
0.8
0.9
(b)
Coef
fici
ent
of
Fri
ctio
n
Distance (m)
Test 1
Test 2
0 50 100 150 200
0.0
0.1
0.2
0.3
0.4
0.5
0.6
0.7
0.8
0.9
(c)
Co
effi
cie
nt
of
Fric
tio
n
Distance (m)
Test 1
Test 2
Figure 4.12: Coefficient of Friction measurements of the 1000oC annealed ALD grown
one trilayer nanolaminate. (a) 25 gram load (b) 50 gram load and (c) 100 gram load.
Si3N4 ball was used as the counterface material during the friction test.
The increase in the COF after 1000oC anneal could likely due to many reasons;
the increase in the (0002) grain size during the heat thermal treatments. As confirmed by
the XRD data, the (0002) peaks become narrower with increase in the annealing
temperature. With the narrowing of peaks, the grain size increases according to the
Debye Scherrer formula. There was an observation of the mixing of the ZnO and Al2O3
layers near the surface, this could be a hard phase and may lose the lubricity properties,
this will also contribute to the increase in the COF. Another important observation that
Page 118
102
was made is the loss of significant amount of lubricious ZnO on the surface. Since the
ZnO was acting as the lubricating layer, loosing this layer is just like wearing off the
layer with time during sliding. Finally, the transformation of the ZrO2 from tetragonal to
monoclinic could also contribute to the increase in friction as this is a transformation
toughening. Figure 4.13 confirms that there is a toughening mechanism going on with the
1000oC annealed trilayer. There is significant amount of wear on the ball, thus the
annealed trilayer is forming a hard coating which is wearing off the ball. Smaller amounts
of transferred film were observed on the balls, this transferred film is not thought to be
lubricious, and it could be a mixture of the film from the ball and the wear track. There is
also an increase in the worn area of the Si3N4 ball with increase in the applied load.
Figure 4.13: Optical microscope images of the Si3N4 balls used to test the COF. From left
is the 25 gram, 50 gram and 100 gram load pin balls respectively.
Another aspect of tribological behavior that was studied was to determine the
amount of material removed during the friction test. In order to measure the volume of
material removed, the wear surface was recorded by a stylus profilometer. The worn area
was measured in at least five different locations and the wear volume was calculated from
the mean value of each wear track. The wear factor was determined by using the equation
Page 119
103
(4.3)
where V is the wear volume, L the normal force and D is the sliding distance.17
The wear
factor is a tribological property to measure the wear behavior of the films, in which a low
wear factor represents a good wear resistance.
Figure 4.14 shows the wear factors that were obtained for the above nanolaminate films.
Figure 4.14a shows the wear factors for the as-deposited nanolaminate film. It was
determined that the SS440 C steel ball produced less wear than the Si3N4 ball wear tracks.
In Figure 4.10b, the 400oC annealed samples indicate a slightly higher wear factors. The
1000oC annealed films have the highest wear factors with the wear factors increasing
with increase in applied load. From Figure 4.13, it was observed that the area of the worn
pin increases with the applied load. This has effect on the wear factor that was calculated.
This is because the worn area of the nanolaminate trilayer also increased as the applied
load increased, thus, the volume of the worn area also increases with increasing applied
load. With an increase in worn volume, there is an increase in the wear factor.
The wear factors of each condition are approximately an order of magnitude
larger than the wear factors of the next condition. A wear factor on the order of 10-3
is
considered severe wear, while 10-5
is considered as mild wear and 10-6
and 10-7
are
considered low wear. Based on these regimes, all of the above coatings are in the low
wear regime.18
It should be noted that there is a direct correlation between the COF and
the wear factor, as observed in this case, the wear factor increase with increase in COF.
The obtained results show that the wear factor values compare very well to other solid
lubricant coatings (MoS219
and diamond-like nanocomposite (DLN)20
) in dry
Page 120
104
environment.
3.75E-8
± 2.3E-9 3.4E-8
± 4.4E-9
6.9E-8
± 1.7E-8
4.1E-8
± 5.7E-9
50 g
Wea
r Fac
tor (m
m3 /Nm)
SS440 C Ball
Si3N
4 Ball
100 g
(a)
4.0E-07
±2.8E-07
250 g100 g
50 g
SS440 C Ball
Si3N4 Ball
1.31E-07
±1.43E-08
3.6E-07
±1.2E-07 3.3E-07
±1.2E-07
Wea
r Fac
tor (m
m3 /Nm)
(b)
(c)
4.80E-6
± 8.6E-7
4.00E-6
± 1.0E-6
2.68E-6
± 3.9E-7
100 g25 g 50 g
Wear
Facto
r (mm
3 /Nm)
Si3N
4 Ball
Figure 4.14: Calculated wear factors of the wear tracks (a) As-deposited, (b) 400oC
annealed and (c) 1000oC annealed nanolaminates one trilayer.
Page 121
105
4.4 Chemical imaging of wear tracks with auger electron spectroscopy
During pin-on-disk test, there is a lot of film transfer either from the pin ball into
the wear track or from the wear track onto the pin ball. The transferred film (third body)
could enhance or deteriorate the lubrication mechanism, this makes the chemical
composition of the wear track very important to be studied. With regards to this, the
chemical composition inside the wear track is expected to be different from the outside
due to the transferred film. In order to analyze the chemical composition inside the wear
tracks, a high spatial resolution chemical imaging was done by mapping the wear tracks
using the detected auger electrons. Due to the surface sensitivity and small analysis
volume of auger electron spectroscopy (AES), it is known to be one of the ideal
analytical techniques for a chemical compositional and mapping characterization of
submicron particles. The small analysis volume ensures that the ratio of signal generated
by the particles to signals originating from the surrounding materials is favorable even
down to particles sizes of nanometers. AES’s higher sensitivity for light elements also
ensures that no elements will be missed by this technique (with exception of hydrogen or
helium).
Figures 4.15 and 4.16 shows SEM images and chemical maps of as deposited
sample. In Figure 4.15, a 100 gram load with SS440 C pin ball as deposited tilayer film
wear track was analyzed. The mapped elements included iron, zinc and oxygen, the
individual element maps shows a high concentration of both zinc and oxygen which
resulted from the ZnO deposited film. There is also iron present in some parts of the wear
track, the overlayed map indicates a yellow color which is a mixture of red and green
Page 122
106
colors (iron and oxygen). The iron present in the wear track is a transferred film from the
SS440 C steel ball. The Figure 4.16 also shows another wear track with 100 gram load
and a Si3N4 pin ball as deposited trilayer film, it is observed once again that there is a
high concentration of zinc and oxygen that resulted from the deposited ZnO.
Figure 4.15: Secondary electron image and Auger images (Fe, O and Zn) of 100 gram
load wear track with SS440 C steel ball of as-deposited one trilayer.
Page 123
107
Figure 4.16: Secondary electron image and Auger images (Si, O and Zn) of 100 gram
load wear track with Si3N4 ball of as-deposited one trilayer.
There are also streaks of silicon inside the wear track that forms SiO2 with the
oxygen. This is obvious in the overlayed map, where the yellow streaks indicate the SiO2
inside the wear track. In comparing the above two figures, it is observed that the
concentration of iron inside the wear track is higher than that of silicon. This is because
the Si3N4 ball is harder than SS440 C ball, thus less film is worn from the Si3N4 ball into
the wear track than the SS440 C ball. Both wear tracks did not show any sign of the
presence of either aluminum or zirconium, this confirms that the ZnO film is not worn
out after the 200 m run.
Page 124
108
Due to the high wear of SS440 C steel ball, it is prudent to determine if the iron
oxide has any influence on the friction coefficients that were recorded. It has been
reported that γ-Fe2O3 films have relatively low friction coefficient (~0.25) while Fe3O4
has a high friction coefficient (~0.6).21
Thus the iron oxide that was forming in the wear
track could have a lot of influence on the COF behavior of the one trilayer films. In order
to determine the iron oxide type present inside the wear track, an XPS high resolution
scan was undertaken. Since both Fe2O3 (a=0.8350 nm) and Fe3O4 (a=0.8396 nm) have
nearly the same lattice parameters from the cubic inverse spinel structure, the possibility
of the presence of either compounds could not be ruled out by XRD patterns only.22,23
Thus to obtain more evidence, XPS analysis was required. From a typical Fe2p XPS
spectrum, a remarkable observation is made of the two compounds, that is a broadening
of Fe2p3/2
peak (~711 eV) and the appearance of a shoulder (~709 eV) on the high-energy
side of Fe2p1/2
peak (~724), which are all characteristics of Fe2+
in Fe3O4. Another striking
feature of the spectrum is that, there is a satellite line that is situated at about 719 eV,
which is a characteristic of Fe3+
in γ-Fe2O3.24,25
Page 125
109
Figure 4.17: XPS high resolution scan of iron peak.
Figure 4.17 shows a high resolution deconvoluted iron peak XPS scan, the major
peaks present are Fe2p3 and Fe2p1. It is obvious from this figure that there is no shoulder
peak around 709 eV but there is a satellite peak around 719 eV. Thus it could be
concluded that the iron present in the wear track forms γ-Fe2O3. As already mentioned the
COF for γ-Fe2O3 is low and may influence that of the ZnO film. Hence in chapter 5 only
the Si3N4 ball was used as the counterface during the COF test.
As already discussed in figure 4.3c, the XPS depth profile of the 1000oC annealed
trilayer film indicated the presence of both zinc and aluminum on the surface of the film.
Figure 4.18 shows the SEM image and an auger chemical map of the surface of the
1000oC annealed trilayer film. The surface confirms the presence of both zinc and
aluminum as observed in the XPS depth profile. The zinc is color coded red while
Page 126
110
aluminum is green, and the overlayed plots shows both are present on the surface. Figure
4.19 also shows the SEM images and auger chemical maps of inside the wear track of a
100 gram load and Si3N4 ball of the 1000oC annealed one trilayer film. In Figure 4.19a,
the map indicates the presence of zinc (red), aluminum (green) and silicon (blue). The
overlayed plot shows a streak of zinc across the wear track while the bottom part is
dominated by silicon, there are spots of aluminum near the top of the map. The presence
of silicon could be as a result of the Si3N4 ball wearing and leaving traces inside the wear
track or it could be as a result of Si from the substrate. The zinc present inside the wear
track is also believed to have resulted from the diffused zinc during the thermal anneal.
These assumptions will be studied with XTEM EDS chemical composition line scan and
compositional mapping. In order to determine whether there is zirconium present inside
the wear track, another map was done.
Page 127
111
Figure 4.18: Secondary electron image and Auger images (Zn and Al) of the surface of
1000oC annealed trilayer film.
Figure 4.19b shows an auger chemical map for zirconium (blue) and an overlayed
map of zinc (red), aluminum (green) and zirconium (blue). The presence of zirconium
inside the wear track is obvious in the overlayed map. Thus it could be concluded that at
1000oC anneal, there is an intermixing of layers, and this is not appropriate for
lubrication. Finally, it was observed that most of the zinc and aluminum on the surface
were worn out during the friction of friction test.
200 WT.7.sem: survey of out of WT CART
2010 May 24 20.0 kV 0 FRR
SEM
1 µm
0.5
00 µ
mSEM
Page 128
112
Figure 4.19a: Secondary electron image and Auger maps of Zn, Al, Si and an overlayed
map of 100 gram load wear track with Si3N4 ball of 1000oC annealed one trilayer film.
Page 129
113
Figure 4.19b: Auger maps of Zr and an overlayed Zn, Al and Zr of 100 gram load wear
track with Si3N4 ball of 1000oC annealed one trilayer film.
4.5 Cross-sectional TEM Behavior of Worn One Trilayer Films
Recall from reference 17 that peak broadening (FWHM ≥ 0.3o) by XRD has been
linked to growth defects (lattice imperfection): low/high angle grain boundaries, non-
uniform strain, dislocations and stacking faults that lie on the (0002) basal plane. Thus it
is necessary to perform a TEM cross sectional analysis inside the wear tracks of the one
trilayer films to elucidate if any of these growth defects are responsible for the solid
lubrication mechanisms that were observed for the lubricity in the nanocrystalline oxide.
If the lubrication mechanism is not due to any of these growth defects, the XTEM
analysis can help establish what other mechanisms that might be taking place during the
friction test.
Figure 4.20 shows a HRSEM image of the as deposited one trilayer 50 gram load
with Si3N4 ball which indicates the location of the FIB cut. The FIB cut was done at the
center of the wear track and in the direction of the pin on disk sliding.
0.500 µm
0.5
00 µ
m
20.0kV
0.500 µm5/28/10
Zr1
0.5
00 µ
m
0.500 µm
20.0kV
0.500 µm5/28/10
Zn1+Al2+Zr1
Page 130
114
Figure 4.20: HRSEM image of one trilayer of 100 gram load with Si3N4 pin ball
showing location of cross-sectional FIB-cut.
4.5.1 As-deposited One Trilayer
Figure 4.21 shows the cross-sectional TEM (XTEM) image of as-deposited worn
wear track of 50 gram load with Si3N4 ball. This is after 100 m sliding distance, and
based on this and the unworn images shown in Figure 4.7, several observations can be
made on the effect of the cyclic sliding. As observed in Romanes10
work, there were
micro-cracks after the load was applied on the ZnO, no micro-cracks (no brittle fracture)
were observed in this trilayer after the 200 m sliding distance even though higher loads
and longer sliding distances were undertaken in this work. This could be attributed to the
Page 131
115
presence of the ZrO2 layer which is serving as a load bearing layer in this case. No
cracks/micro-cracks were observed in any of the other loads that were tested.
Figure 4.21: XTEM image of as-deposited worn one trilayer.
The amount of ZnO that was worn out after such a long run is very minimal, thus
very low wear is inside the wear track. Comparing the worn versus unworn once again
shows some evidence of grain re-orientation and bending of the ZnO grains near the top
Page 132
116
of the worn trilayer. This shows that some form of plastic deformation occurred in the
ZnO layer during sliding. In Figure 4.22, a magnified view of the ZnO with applied stress
of 100 gram which has produced the wearing of the film is shown. It is apparent to note
that the top part of the ZnO layer has transformed from columnar to mix-amorphous-
crystallite layer, this makes it easy for the film to accommodate interfacial shearing. The
plastic deformation occurring in the nanocrystalline ZnO layer contributes to the
continuous decrease from crystalline to amorphous. Hence for this nanolaminate, the
applied stress was being used to transform the columnar grains to progressively smaller
crystals and eventually to amorphous ZnO, and shearing the ZnO layer across the surface
to accommodate the sliding motion of the ball, i.e. the velocity accommodation mode is
intrafilm shear.
Page 133
117
Figure 4.22: XTEM micrograph of worn one trilayer film, the amorphous layer shows the
worn ZnO.
Page 134
118
Figure 4.23: XTEM micrograph of worn as-deposited one trilayer film showing (top)
ZnO basal stacking faults along the [0001] growth direction, (bottom) ZnO partial
dislocations on the (0002) basal plane.
Page 135
119
Figure 4.23 top shows XTEM inside the one trilayer wear track (Si3N4 ball at 50g
load). It is observed that the microstructure of the nanolaminate is dominated by stacking
faults that are bordered by partial dislocations (PD). The basal stacking faults (BSFs) are
connected to the unfaulted crystals by these PDs. The BSF may originate from incoherent
boundaries between adjacent columnar grains or condensation of vacancies or interstitial,
so that a missing or extra (0002) plane will be introduced into the lattice. It should also be
noted that the {0002}-basal planes are low surface energy planes and have low stacking
fault energies (SFE), while the {10-10}-prismatic and {10-11}-pyramidal planes are high
surface energy planes and have high SFEs.26
Thus, it is not surprising that in Figure 4.23
(top) that BSFs are present along the {0002}-basal planes. The identification of these
dislocations is confirmed by Figure 4.23 (bottom) which demonstrates that each PD
corresponds to additional (0002) plane.
4.5.2 400oC Annealed One Trilayer
The cross sectional TEM micrograph of the worn 400oC annealed one trilayer
film is shown in Figure 4.24. Once again it is observed that only the ZnO layer
experiences any form of deformation. The deformation observed in the 400oC annealed
sample is very similar to that of the as-deposited sample. There was no brittle fracture or
any micro-cracks in any of the deposited layers after the sliding. There is minimal
thinning of the ZnO layer, hence, very low wear was observed inside the wear track.
There was also some nanocolumnar grain bending near the top of the worn trilayer. The
insert shows the presence of some plastic deformation near the top of the ZnO layer. The
increased amount of plastic deformation which are likely to be dislocations (red arrows)
Page 136
120
is known to enhance the lubricity in oxide ceramics.
Figure 4.24: XTEM image of 400oC annealed worn one trilayer. Insert image shows a
magnified micrograph of one of the ZnO nanocolumnar grains near the surface where the
presence of defects and shearing of the columnar grains are observed.
As previously stated, the broadening of the peak (FWHM ≥ 0.3o) has been linked
to growth defects such as low/high angle grain boundaries. In this case, since the
columnar grains form low angle grain boundaries, this (0002) peak broadening is not due
to high angle grain boundaries, which means the other defects may be operative. Figure
4.25 shows a low angle grain boundary in the ZnO film that was observed. This low
angle grain boundary may be one of the contributors of the (0002) peak broadening in the
ZnO layer.
Page 137
121
Figure 4.25: XTEM micrograph of worn 400oC annealed one trilayer film showing ZnO
low angle grain boundary defects present in the ZnO layer.
4.5.3 1000oC Annealed One Trilayer
In Figure 4.26, an XTEM image of the 1000oC annealed one trilayer nanolaminate
inside wear track with 100 gram load is shown. It is observed that part of the cross-
section is undeformed while the top part of the film has undergone some form of
deformation. There is an intermixing of the layers near the top of the film with no
difference between the ZnO, Al2O3, ZrO2 and Si. It is also observed that part of the ZrO2
layer has also deformed with its particles present in the intermixed layer. The undeformed
part of the film includes part of the ZrO2 layer, the diffused ZnO, and the SiO2 layers.
This intermixing layer may have been caused by the applied stress from the pin ball
where the stress causes the film underneath it to undergo this deformation. Recall that this
Page 138
122
behavior (intermixing of layers) was not observed in both the as-deposited and the 400oC
annealed films.
4.26: XTEM image of 1000oC annealed worn one trilayer.
Figures 4.27 and 4.28 illustrate the chemical composition and mapping
respectively of the wear track by EDS technique. In Figure 4.27, the line scan indicates
the presence of ZrO2 near the top of the film with ZnO underneath it. There is an
Page 139
123
intermixing layer on top of the ZrO2 which is a result of the applied stress. The counts on
the intermixed layer is low and shows the presence of Si which is as a result of the Si3N4
ball that was used as the counter surface during the friction test. In the EDS
compositional maps shown on Figure 4.28, the area under box one in the XTEM image
was mapped out. The presence of Si is confirmed in this map as well. Thus during the
friction test, there is a wearing of the pin ball, and the film is transferred into the wear
track. This confirms that this coating is a very hard film. One other important observation
that was made from Figure 4.28 is that there is very little ZnO near the top of the film.
This suggests that all the ZnO film is worn out during the friction test and negates the
possibility of using this trilayer as a solid lubricant at such a high temperature. Finally the
intermixing of the diffused ZnO and the native SiO2 is again observed in the
compositional map.
Figure 4.27: XTEM results of worn 1000oC annealed one trilayer nanolaminate film
revealing the microstructure and layer composition.
Page 140
124
Figure 4.28: XTEM chemical analysis showing chemical maps of worn 1000oC annealed
one trilayer nanolaminate film.
4.6 ZnO/ZrO2 nanolaminates
Other nanolaminates were also deposited by ALD in order to study their friction
and wear behavior. ZnO/ZrO2 two and eight bilayers were studied, and their results are
summarized in this section. These systems were studied in order to determine if the
absence of the Al2O3 layer would influence the tribological properties of the ZnO layer.
Recall that the presence of Al2O3 beneath the ZnO layer enhances the texturing of the
(0002) plane and thus reduces the friction.
Page 141
125
4.6.1 Nanolaminate Films Microstructure
Figure 4.29 shows the XRD spectra (with incident angle = 5o) of the ALD as
deposited and annealed nanolaminates. The XRD data confirms that both 2 and 8 bilayers
exhibited a hexagonal wurtzite crystal structure with strong (0002) diffraction peak for
the ZnO film and a tetragonal crystal structure with (101) texturing for the ZrO2 film. The
(0002) texture, otherwise called c-axis orientation, is commonly observed in ZnO films
because the c-plane perpendicular to the substrate normal is the most densely packed and
thermodynamically preferred in the wurtzite structure.
Figure 4.29a shows the XRD data for the two bilayer nanolaminates while Figure
4.29b also shows the XRD data for the eight bilayer nanolaminates. In comparing the two
plots, it is observed that in both cases, the peak intensity of the as-deposited
nanolaminates is smaller than that of the 400oC two hours annealed nanolaminate film.
This suggests that annealing enhances crystallinity as observed in Section 4.1.3. It is
again observed that the (0002) ZnO peak of the two bilayer nanolaminate film exhibits a
strong intensity than the eight bilayer nanolaminate films.
Table 4.2: Grain sizes in nanometers of ZnO/ZrO2 2 and 8 bilayers nanolaminate films.
Conditions As-deposited Grain Size (nm) 400oC Annealed Grain Size
(nm)
2 Bilayers 23.1 ± 0.88 34.6 ± 0.55
8 Bilayers 12.7 ± 0.41 12.5 ± 0.34
Page 142
126
20 30 40 50 60 70 80 90
ZnO
(10-13)
ZrO2
(211)
ZrO2
(112)
ZnO
(102)
ZrO2
(110)
ZrO2
(101)
ZnO
(002)
Inten
sity (
a.u)
2
As deposited
400oC Anneal
(a)
20 30 40 50 60 70 80 90
ZnO
(10-13)
ZrO2
(112)
ZnO
(0002)
Inten
sity (
a.u)
2
As deposited
400oC AnnealedZrO
2
(101)
(b)
Figure 4.29: X-ray diffraction of (a) 2 bilayer ZnO/ZrO2 and (b) 8 bilayer ZnO/ZrO2
nanolaminate coating at room temperature and ex situ annealed 400oC for 2 hours.
The FWHM of the (0002) ZnO peaks is observed to widen with increase in the
number of bilayers. This suggests, according to the Debye-Scherrer relationship, that the
grain size decreased with increasing number of bilayers, this may be thickness related.
Table 4.2 shows the grain sizes of the (0002) ZnO peak computed according to the
Debye-Scherrer relationship for both 2 and 8 bilayers. The grain size for the 8-bilayer
Page 143
127
nanolaminate indicates that, there is no grain growth due to the thermal annealing as
observed in the other films. This could suggest that due to the stronger nature of the ZrO2
layers, they are preventing any grain growth in the ZnO layers. It should also be noted
that there is no phase transformation from tetragonal to monoclinic neither is there any
ZnO (0002) or ZrO2 (101) peak shift due to thermal annealing thus no lattice strain is
observed in these nanolaminates.
4.6.2 Tribological Behavior
Figure 4.30 shows the tribological behavior of the 2 and 8 bilayer nanolaminate
films. All the tests were done with 50 gram load SS440 C pin ball. It is observed that all
the tests reached the 200 m distance without exceeding the 1.6 COF limit. According to
Figure 4.30a (2 bilayer) friction plots, it is observed that the 400oC annealed test has the
lowest COF with a steady state friction of ~0.22. The as-deposited film test exhibited a
lot of noise with a steady state friction of ~ 0.3.
Page 144
128
0 50 100 150 200
0.0
0.2
0.4
0.6
0.8
Coe
ffic
ient
of F
rict
ion
Distance (m)
As-Deposited
400oC Annealed
0 50 100 150 200
0.0
0.2
0.4
0.6
0.8
Coe
ffic
ient
of F
rict
ion
Distance (m)
As-Deposited
400oC Annealed
Figure 4.30: Coefficient of Friction measurements of (a) 2 bilayer ZnO/ZrO2 and (b) 8
bilayer ZnO/ZrO2 nanolaminate coating at room temperature and ex situ annealed 400oC
for 2 hours.
In Figure 4.30b, the as-deposited test show a steady state friction of ~0.3, and the
400oC annealed test showed a very high friction of ~0.6 which reduced to ~ 0.45 at the
Page 145
129
later stage of the test, this test did not attain a steady state. It could be concluded that the
2 bilayer nanolaminate film exhibited better tribological behavior than the 8 bilayer
nanolaminate film. Recall from the XRD results (Table 4.1) that the 8 bilayer
nanolaminate films had smaller grain size than the 2 bilayer. Thus, it can be concluded
that, the tribological behavior of the ZnO film is directly related to the (0002) grain size.
There is a limitation to how low the grain size can be in order to obtain a very good wear
behavior.
4.6.3 Cross-sectional TEM Behavior of Unworn/Worn 8 Bilayer Nanolaminate Film
In order to study the mechanisms that contributed to the friction behavior of these
films, a cross sectional TEM was undertaken for the 8 bilayer as deposited nanolaminate
film. Figure 4.31 shows a bright field cross-sectional TEM image of a ~140 nm thick
ZnO/ZrO2 8 bilayers nanolaminate coating on silicon substrate with its ~2 nm thick
native SiO2 layer. It is evident from this image that distinct and sharp interfaces exist
between the crystalline ZnO (~10 nm thick) and ZrO2 layers (7 nm thick). Both layers
exhibited nanocolumnar grains growing to layer thickness. This is confirmed by the XRD
data (4.29).
Page 146
130
Figure 4.31: Cross-sectional TEM of unworn ZnO/ZrO2 8 bilayer nanolaminate coating.
Platinum was deposited to protect the coating from cross-sectional milling.
Figure 4.32 shows the XTEM image of the worn 8 bilayers nanolaminate coating
after the 200 m distance test. The image shows that only the top ZnO layer has
experienced deformation among the 16 individual layers. Also shown is a non-uniform
layer (up to ~10 nm thickness) just below the protective Pt layer. The arrow in the figure
points to a region where this layer is absent and shows slight thinning (wear) of the ZnO
Page 147
131
layer.
Figure 4.32: XTEM of worn ALD ZnO/ZrO2 8 bilayer nanolaminate coating. Arrow
points to worn ZnO. Insert shows a magnified area in the box.
The insert shows a magnified view of these top layers taken from the box located
in the Figure 4.32. It is apparent that the non-uniform layer is amorphous which could
either be from the native oxide, Fe2O3, on the SS440 C steel ball (adhesive wear) and/or
this layer has undergone a stress-induced transformation from columnar structure to
amorphous ZnO. There was no visible transfer film accumulated on the steel ball surface.
Furthermore, no micro-cracks were observed among any of the layers even in the
deformed top ZnO layer that suggests that the bilayers were effective in dissipating the
energy required to initiate a crack.
It is also possible that the crystalline to amorphous stress-induced transformation
ZrO2
ZnO
Pt
ZrO2
ZnO
ZnO
a-layer
Pt
Page 148
132
was accompanied by volume expansion due to less efficient atomic packing. The mixed
amorphous-crystallite nature of this transformed layer makes it easy to accommodate
interfacial shear. The plastic deformation process appears to be the continuous decrease in
crystal size due to the applied cyclic stress until eventual amorphization. Hence, for this
nanolaminate, the applied energy was being used to (a) transform the columnar grains to
progressively small crystals and eventually to amorphous ZnO, and (b) in shearing the
transformed ZnO layer across the surface to accommodate the sliding motion of the ball,
i.e., the velocity accommodation mode is intrafilm shear.27
Unlike most solid lubricants, such as graphite, DLC, and WS2, oxides are
thermodynamically stable compounds with minimal grain coarsening, and should
perform well over a wide range of environmental conditions such as thermal cycling as
evident by the aforementioned 400oC anneal. From all the results provided above, it can
be concluded that the ZnO/Al2O3/ZrO2 one trilayer nanolaminate film produced better
COF data and understandable wear mechanism, hence, it was deposited on high speed
M50 steels. The lubricous oxide nanolaminates will be demonstrated as good solid
lubricants for thrust ball bearings and high vacuum rolling contact fatigue testing in the
next chapter.
4.7 Chapter Summary
ZnO/Al2O3/ZrO2 trilayer and ZnO/ZrO2 bilayers nanolaminate films were
deposited on Si substrate by Atomic Layer Deposition, the nanolaminate films were ex
situ annealed at 400oC and 1000
oC for 2 hours. The following observations were
subsequently made after characterization and testing:
Page 149
133
a. The surface roughness increased with increase in annealing temperature. This was
later confirmed by XRD that the increase in roughness is due to increase in grain
size according to the Debye-Scherrer formula.
b. XPS was able to determine the Zn:O composition ratio for the as-deposited and
annealed films. It was observed that the as deposited film has a higher Zn
composition than the 400oC annealed film. Thus after anneal, the ZnO became
closer to stoichiometry indicating that there is some surface oxidation after
anneal. After 1000oC anneal, analysis showed the presence of both Zn and Al on
the surface (confirmed by AES mapping) which indicates that there is either
diffusion of Zn into the other layers or evaporation of Zn from the surface. XPS
depth profiling and XTEM analysis confirmed Zn diffusion had taken place.
c. The grown ZnO and ZrO2 layers are nanocrystalline while the Al2O3 layers are
amorphous. XRD and AFM analysis showed that annealing the films resulted in
increases in the grain size of the ZnO film and not so for the ZrO2 films. This
change was related to an increase in the intensity and narrowing of the (0002)
ZnO and (101) ZrO2 peaks after thermal anneal, thus, the increase in grain size
according to the Debye-Scherrer formula.
d. At 1000oC of thermal anneal, XRD also demonstrated that there was a phase
transformation in the ZrO2 film. The film transformed from tetragonal to
monoclinic ZrO2. The phase transformation from tetragonal to monoclinic was
attributed to the grain size of ZrO2 crystallites. Crystalline ZrO2 with grain sizes
of 50 or less nanometers have been known to undergo this transformation at
Page 150
134
temperatures close to 1000oC.
e. XTEM analysis of the unworn films indicated very distinct and sharp interfaces
between the layers. This is one of the advantages of ALD technique. It also
confirmed the crystallinity of ZnO and ZrO2 layers and the amorphization of the
Al2O3 layers. After 1000oC anneal, the XTEM image confirmed the diffusion of
ZnO through the Al2O3 and the ZrO2 layers. The native SiO2 with thickness of ~2
nm was shown to have increased to ~40 nm, this resulted from the diffusion of
oxygen through the nanolaminate stack. The phase transformation of the ZrO2 that
was observed by the XRD analysis was also confirmed in the TEM image and
thus an increase in thickness of this layer was also observed.
f. Tribotests on the as-deposited and annealed one trilayers showed that the in the in
the tests that Si3N4 ball was used, the 400oC annealed tests exhibited lower
friction compared to the as-deposited films. Increase in applied load also
exhibited a reduction in the steady state COF which is in agreement with the
Bowden and Tabor model. Both of the as-deposited and 400oC annealed films
exhibited better COF and wear factor values than the 1000oC annealed film. The
1000oC annealed samples produced COF of ~ 0.45, and this poor friction behavior
was partly attributed to the increase in the grain size of the (0002) ZnO film, the
ZrO2 phase transformation, diffusion of the ZnO through the other layers and the
intermixing of the ZnO and Al2O3 layers. Thus the trilayer nanolaminate film is a
good solid lubricant at room temperature and moderate temperatures, but may not
have good properties to be used at very high temperatures (1000oC).
Page 151
135
g. AES mapping inside the wear track indicated the presence of film worn from the
pin ball inside the wear tracks. As-deposited and 400oC annealed films showed
only ZnO and film from the pin ball inside the wear track. The 1000oC annealed
film showed the presence of ZnO, Al2O3, ZrO2 and film from the Si3N4 ball inside
the wear track. This confirmed that, the thin ZnO layer did not wear out in the
case of the as-deposited and 400oC annealed films, this was confirmed by XTEM
analysis. For the 1000oC annealed film, AES mapping confirmed that the unworn
surface had both ZnO and Al2O3 present, mapping inside the wear track indicated
that there is a mixture of all the layers inside the wear track and may cause
abrasive wear which contributed to the high COF that was observed.
h. XTEM analysis of the worn surface showed grain re-orientation and bending of
the ZnO grains near the top of the layer. This indicates that there is some form of
plastic deformation occurring in the ZnO layer during sliding. The top of the ZnO
film also shows a transformed ZnO layer from columnar to mix-amorphous-
crystallite layer which makes it easy for the film to accommodate interfacial
shearing hence low friction. Interfacial sliding with this friction induced surface
layer aids in shear accommodation and prevents brittle fracture. The
microstructure of the ZnO layer is dominated by stacking faults that are bordered
by partial dislocations (PD). These basal stacking faults resulted from the
incoherent boundaries between adjacent columnar grains or condensation of
vacancies or interstitials. Because of the low surface energy of the (0002) ZnO
basal planes, they have low stacking fault energies (SFE) compared to other
Page 152
136
planes such as prismatic and the pyramidal planes thus stacking faults are easier
to form on the (0002) basal planes than any of the planes. For the 1000oC
annealed wear tracks, there was an intermixing of the top layers due to the applied
stress. EDS compositional mapping indicated the presence of Si on the top layer
which confirms the wearing of the pin ball during the friction test. Finally, it was
observed that there was no ZnO present near the top of the film, thus all the ZnO
was worn out and the interfacial shearing that was observed in the previous films
was not present in the 1000oC annealed films. This concludes that, due to the
hardness of this coating, it cannot act as a good solid lubricant.
i. In the ZnO/ZrO2 bilayer nanolaminates, the XRD confirmed that both layers were
crystalline and the as-deposited bilayers had smaller grain sizes than the 400oC
annealed samples. The 8 bilayers nanolaminate films comparatively had a smaller
grain size compared to the 2 bilayers nanolaminate films. This was attributed to
reduced thickness of the deposited layers, as thickness can influence grain growth.
The 8 bilayers nanolaminate films grain size remained the same after 400oC
anneal, this resulted from the stronger nature of ZrO2 layers that prevented any
grain growth in the ZnO layer.
j. Tribotest indicated a low COF for the 2 bilayer nanolaminate films than the 8
bilayer nanolaminate films. This was observed for both as deposited and 400oC
annealed nanolaminate films. This resulted from the limitation of the thickness of
the ZnO layer which influenced how large the (0002) grain sizes can grow.
k. XTEM unworn and worn images for the 8 bilayers nanolaminate films showed
Page 153
137
that there were sharp interfaces between all the layers, and only the top ZnO film
was worn during the tribotest. No microcracks were observed among any of the
layers even in the deformed top ZnO layer, thus the bilayers were effective in
dissipating the energy required to initiate any crack. There was some mixed
amorphous-crystallite on the top ZnO layer which makes it easy to accommodate
interfacial shear. Thus the applied energy was used to
i) Transform the columnar grains to progressively small crystals and
eventually to amorphous ZnO
ii) In shearing the transformed ZnO layer across the surface to
accommodate the sliding motion of the ball, i.e. the velocity
accommodation mode is Intrafilm shear.
Thus ALD lubricious ZnO/Al2O3/ZrO2 and ZnO/ZrO2 nanolaminates are good
candidates for providing low friction interfaces. In the next chapter, the ZnO/Al2O3/ZrO2
one trilayer nanolaminate film will be deposited on high speed M50 steel coupons to
demonstrate its lubrication properties in high vacuum rolling contact fatigue testing.
Page 154
138
4.8 Chapter References
1 Rainforth, W. M., J. Mater. Sci. 39 (2004) 6705-6721
2 Suh, S., Miinea, L. A., Hoffman, D. M., Zhang, Z. and Chu, W. –K., Journal of
Materials Science Letters 20 (2001) 115-118
3 Gao, P.X., and Wang, Z.L., J. Appl. Physics 97 (2005) 044304
4 Li, W.J., Shi. E.W., Zhong, W.Z., and Yin, Z.W., J. Cryst. Growth 203 (1999) 186
5 Park, S.K., Lee, Y.E., Journal of Material Science 39 (2004) 2195-2197
6 Claeyssens, F., Feeman, C.L., Allan, N.L., Sun, Y., Ashfold, M.N.R., Harding, J.H., J.
matter. Chem. 15 (2005) 139-148
7 Zabinski, J.S., Sanders, J.H., Nainaparampil, J., Prasad, S.V., Tribology Letters 8
(2000) 103-116
8 Zhang, P.F., Liu, X.L., Wei, H.Y., Fan, H.B., Liang, Z.M., Jin, P., Yang, S.Y., Jiao,
C.M., Zhu, Q.S., and Wang, Z.G., J. Phys. D: Appl. Phys. 40 (2007) 6010-6013.
9 Kim, T.-S., Kim, H.S., Kim, T.-G., Jeong, H.G., Hong, S.-J., Journal of Alloys and
Compounds 483 (2009) 593-596
10 Romanes, M., PhD Dissertation, Uni. of N. Texas (2008)
11 Zhu, J., and Liu, Z.G., Appl. Phys. A 78, (2004) 741-744
12 Ji, Z., and Rigsbee, J.M., Journal of American Ceramic Society, 84 (12) (2001) 2841-
2844
13 Liu, W.-C., Wu, D., Li, A.-D., Ling, H.-Q., Tang, Y.-F., and Ming, N.-B., Applied
Surface Science 191 (2002) 181-187
14 Garvie, R.C., The Journal of Physical Chemistry 69 (4) (1965) 1238-1243
Page 155
139
15 Kao, A.S., and Gorman, G.L., Journal of Applied Physics 67 (8) (1990) 3826-3834
16 Ginestra, C.N., Sreenivasan, R., Karthikeyan, A., Ramanathan, S., and McIntyre, P.C.,
Electrochemical and Solid State Letters, 10 (10) (2007) B161-B165
17 Crammer, D.C., Journal of Material Science, 20 (1985) 2029-2037
18 Rainforth, W.M., Journal of Material Science, 39 (2004) 6805-6721
19 Singer, I.L., Macroscopic and Microscopic Processes. Dordrecht, Netherlands: Kluwer
Academic; 1992, 237
20 Scharf, T.W., and Singer, I.L., Tribology Transactions 45 (2002) 363-371
21 Chen, M,-M., Lin, J., Wu, T,-W, and Castillo, G., Journal of Applied Physics 63 (8)
(1988) 3275-3277
22 Liu, H., Jiang, E.Y., Zheng, R.K., and Bai, H.L., Phys. Stat. Sol. (a) (201) 4 (2004)
739-744
23 Tiwari, S., Prakash, R., Choudhary, R.J., and Phase, D.M., Journal of Applied Physics
D 40 (2007) 4943-4947
24 Gao, Q., Chen, F., Zhang, J., Hong, G., Ni, J., Wei, X., and Wang, D., Journal of
Magnetism and Magnetic Materials 321 (2009) 1052-1057
25 Pan, L., Zhang, G., Fan, C., Qiu, H., Wu, P., Wang, F., and Zhang, Y., Thin Solid
Films 473 (2005) 63-67
26 Yan, Y., Dalpian, G.M., Al-Jassim, M.M., and Wei, S.-H., Physical Review B 70
(2004) 193-206
27 Doll, G.L., Mensah, B.A., Mohseni, H, and Scharf, T.W., Journal of Thermal Spray
Technology, 19 (1-2) (2010) 510-516
Page 156
140
28 van Hassel, B.A., and Burggraaf, A.J., Applied Physics A 52 (1991) 410-417
Page 157
CHAPTER 5
LUBRICIOUS ATOMIC LAYER DEPOSITED NANOCRYSTALLINE
ZnO/Al2O3/ZrO2/Al2O3 NANOLAMINATES ON M50 STEEL SUBSTRATES, RODS
AND CUPS
5.1 Introduction
M50 steel a derivative of high speed steels (HSS) is very useful in high-
temperature mechanical applications such as in thrust ball bearings of aircrafts and high-
temperature vacuum rolling contacts. The major alloy elements consist of Mo, Cr and V
with dispersed impurities such as Si, C, Mn and Ni.1 Due to the extreme operational
conditions for these bearing elements such as high rotational speeds and high
temperatures, a good lubrication mechanism is required to further improve the friction
and wear during the steel to steel contacts.2
Lubrication at high temperatures (300-1000oC) presents a lot of challenges for the
tribology community.3 Liquid lubricants have been used but at elevated temperatures,
these conventional liquid lubricants have a marked effect on bearing life and load
carrying capacity, and they are also not capable in operating effectively in the hostile
bearing environments. This is because at the extreme environmental conditions,
conventional liquids lose their lubricious behavior and thermally degrade. The most
common lattice-layered solid lubricants like graphite and molybdenum disulfide also
oxidize quickly and degrade above ~ 350oC. On the other hand, non-layered solid
lubricants such as inorganic fluorides (CaF2, BaF2) and metal oxides (PbO, TiO, NiO) can
141
Page 158
operate at high temperatures due to their low shear strength, high ductility and because
they are chemically stable in the presence of air.4 However, all these materials have their
disadvantages and may not correspond to the ideal lubricant which can operate at room
temperature as well as elevated temperatures both in air and in vacuum.
For this study, a solid lubricant nanolaminate film consisting of
ZnO/Al2O3/ZrO2/Al2O3 deposited on M50 substrates by ALD technique is investigated.
The premise of this nanolaminate film is that a solid lubricant layer will function as a
break-in (conditioning) layer for a CrN-M50 steel rolling interface where the CrN would
otherwise abrade (damage) the uncoated steel raceways. The lubricous, nanocrystalline
ZnO layer was structurally-engineered to achieve low surface energy (0002)-oriented
grains, this provided low sliding friction coefficient. The amorphous Al2O3 layer
contributed to achieve this preferred orientation while the crystalline ZrO2 structure acted
as a high toughness/load bearing layer. The final layer which is another Al2O3 served as
an adhesion layer between the M50 steel and the ZrO2 layer.
5.2 Microstructure of the Nanolaminate Film
Following the ALD deposition of the ZnO/Al2O3/ZrO2/Al2O3 nanolaminate film,
XRD analysis was performed to investigate the crystal structure of both the as-deposited
and the 400oC 2 hours post deposition annealed film and this is shown in Figure 5.1. The
XRD pattern shows the presence of ZnO, ZrO2 and the M50 steel substrate. This
confirms that the ZnO and the ZrO2 thin films are both crystalline while the Al2O3 film is
amorphous as determined in the previous chapter. It was also found that the (0002)
diffraction peak is the highly orientated ZnO peak. This confirms that the hexagonal close
142
Page 159
packed (wurtzite crystal structure) ZnO structure film is orientated on the c-axis and the
ZrO2 columnar grains are tetragonal (derivative of fluorite crystal structure). It is also
seen that the diffraction peak (0002) of the annealed film also becomes highly intense
thus the crystal quality is improved as observed in chapter 4. Once again the FWHM of
the 400oC annealed sample became slightly narrower compared to the as-deposited film
implying that there is a small increase in grain size.
20 30 40 50 60 70 80 90
ZrO2
(200)
ZrO2
(211)
ZnO
(103)ZrO
2
(301)
M50
ZnO
(002)
ZrO2
(110)ZrO2
(101)
Inte
nsity
(a.u
)
2θ
400oC, 2 hours Room Temperature
Figure 5.1: XRD measurements of ALD deposited ZnO/Al2O3/ZrO2/Al2O3 nanolaminate film on M50 steel substrate before and after anneal.
The FWHM of the ZnO (0002) peak indicated that there is broadening of the peak
in both films. Similar to the previous chapter, it is observed that the as-deposited
nanolaminates had a FWHM greater than that of the 400oC annealed film, thus the grain
143
Page 160
size of the 400oC annealed film is larger than the as-deposited film. It should be noted
that the (0002) diffraction peak for the thin films was not shifted with the 400oC anneal,
thus there is no residual stress at the interphase of the ZnO film and the Al2O3 film.5
5.3 Cross-sectional Analysis of the Nanolaminate Film
Figure 5.2 shows an XTEM bright field image of approximately 300 nm thick
ZnO/Al2O3/ZrO2/Al2O3 nanolaminate grown on M50 steel. As observed in the previous
chapter, there is a sharp interface between all the layers. There is no decohesion between
the M50 steel substrate and the Al2O3 adhesion layer, thus, the Al2O3 is bonded very well
with the substrate. As observed by the XRD analysis, both of the Al2O3 layer are seen to
be amorphous while the ZnO and the ZrO2 are crystalline and form columnar grains
through to the top of the film.
Recall that the ZnO (0002) peak broadening (FWHM ≥ 0.3o)6 is linked to growth
defects (lattice imperfections), in Figure 5.3, a magnified XTEM image of the ZnO layer
shows the presence of defect(s) in the as-deposited film. The defects (represented by
white arrows) are determined to be stacking faults. It was determined that the density of
the basal stacking faults (BSF) in the ZnO films is fairly high. These stacking faults are
easily recognizable due to the changes in the stacking sequence of the (0001) planes, and,
according to Gerthsen et al.7, stacking faults may originate from the precipitation and
condensation of Zn interstitials or O vacancies so that a missing or extra (0002) plane
will be introduced into the lattice. Compared to the other planes, the (0002) basal plane
are low surface energy planes and thus have low stacking fault energy. For example, the
SFE of the ZnO {0002} plane was computed by a Vienna Ab-initio Simulation Package
144
Page 161
(VASP) to be ~ 24 mJ/m2 while that for {10-10} prismatic plane was also determined to
be ~ 427 mJ/m2. Thus the energy required to create stacking faults on a prismatic plane is
approximately twenty times higher than that of a basal plane, this makes it very difficult
for stacking faults to form on prismatic planes than on basal planes of ZnO crystal
structure. The type of stacking faults that are formed in the {0002} basal planes are type I
intrinsic, which is ABAB|CBCB.
145
Page 162
Figure 5.2: XTEM bright field image of unworn ZnO/Al2O3/ZrO2/Al2O3 nanolaminate film grown on M50 steel.
146
Page 163
Figure 5.3: Magnified XTEM image showing the interface between the ZnO layer and the Pt layer of the unworn ZnO/Al2O3/ZrO2/Al2O3. There is the presence of basal stacking faults (white arrows) along the [0001] growth direction.
Other groups have attributed the high stacking fault density in their ZnO layers to
other reasons. For example, Sun et al.8, related the high density stacking faults in their
ZnO to their deposition conditions. According to Sun’s group ZnO films grown by island
nucleation with lateral extension on a substrate surface will produce a film with a
147
Page 164
columnar structure and incoherent grain boundaries with stacking faults originating from
these incoherent boundaries between adjacent columnar grains during the growth. In this
study, the high stacking fault density is attributed to the low stacking fault energy on the
{0002} planes and the broadening of the (0002) peak.
5.4 Tribological Behavior of the Nanolaminate Film
The plots in Figure 5.4 shows the sliding coefficient of friction (COF), µ as a
function of unidirectional sliding distance for the as-deposited and 400oC annealed
nanolaminate. A Si3N4 ball (R = 1.6 mm) was used at room temperature of ~ 40% RH.
All tests went to completion of 200 m total distance without reaching 1.6 the COF limit
set for the tribometer. For the as-deposited (top figure) nanolaminate film, the steady
state friction coefficients were approximately 0.342, 0.282, 0.248 and 0.16 for the 25, 50,
100 and 250 gram loads respectively. All the loads maintained steady state friction from
the start to finish of the tribotest except the 100 gram load test. This test exhibited high
COF (0.34) at the run in and reduced to its steady state after approximately 60 m sliding
distance. For the 400oC annealed nanolaminate film (Figure 5.4 bottom), the steady state
friction varied from approximately 0.232, 0.177, 0.136 and 0.122 for the loads of 25 to
250 grams respectively. The 100 and 250 loads maintained their steady state friction for
the entire test while the 25 and 50 gram loads started with low COF and rose steadily to
their respective steady states.
148
Page 165
0 5 0 1 0 0 1 5 0 2 0 00 .0
0 .1
0 .2
0 .3
0 .4
0 .5
0 .6
0 .7
0 .8
0 .9
Coe
ffic
ient
of F
rict
ion
D i s t a n c e ( m )
2 5 G r a m 5 0 G r a m 1 0 0 G r a m 2 5 0 G r a m
0 5 0 1 0 0 1 5 0 2 0 00 .0
0 .1
0 .2
0 .3
0 .4
0 .5
0 .6
0 .7
0 .8
0 .9
Coe
ffic
ient
of F
rict
ion
D is ta n c e (m )
2 5 G ra m 5 0 G ra m 1 0 0 G ra m 2 5 0 G ra m
Figure 5.4: Coefficient of friction measurements of the ZnO/Al2O3/ZrO2/Al2O3 nanolaminate films grown on M50 steel. (Top) as-deposited nanolaminate (bottom) 400oC annealed nanolaminate film.
149
Page 166
From Figure 5.4, it is evident that the steady state friction for the as deposited
nanolaminate films were higher compared to the 400oC annealed nanolaminate films.
Figure 5.5 shows a linear regression for steady state friction coefficient (µss) versus the
inverse mean hertzian pressure for both as-deposited and 400oC annealed nanolaminate
films. The plot shows that the steady state friction decreases as the applied normal load
increases in both as-deposited and 400oC annealed films. This trend is in good agreement
with the Hertzian contact model (L-1/3) as proposed by Bowden and Tabor (equation
3.10). This trend was also observed in chapter 4. The Hertzian contact model showed
that, µ = L-0.32 for the as-deposited and µ = L-0.28 for the 400oC annealed films. These
values are all in agreement with the friction coefficients, thus for low µss, τo is expected to
also decrease. The τo that was observed for the as-deposited and 400oC annealed
nanolaminate trilayers were 181 MPa and 107 MPa, respectively. Such interfacial shear
strength has been observed for similar solid lubricants.
150
Page 167
0.0 0.5 1.0 1.5 2.0 2.50.0
0.1
0.2
0.3
0.4
annealed 400°C as-deposited
slope=151 M Pa (τo)α=0 .021
μ=L -0.32
HSS PL
ALF ττμ ===
•
slope=97 M Pa (τo)α=0 .013
Inverse M ean H ertzian Pressure, 1/P H (1/G Pa)
Stea
dy-s
tate
Fri
ctio
n C
oeff
icie
nt, m
ss
μ=L -0.28
Figure 5.5: Linear regression fits for friction coefficient as a function of inverse Hertzian pressure for as-deposited and 400oC nanolaminate films.
The low friction that is exhibited by this nanolaminate films could be assigned to
the ZnO crystal structure (0002) textured plane. Thus the nanocrystalline grains are prone
to reorientation during sliding contact, where they can realign to create new surfaces that
are rich in defects. The textured (0002) ZnO film with nanocolumnar structure is able to
deform plastically.9 As already mentioned, the 400oC annealed nanolaminates film
comparatively has low friction coefficient, this is linked to the increase in the (0002) peak
intensity as observed in the XRD plot.
151
Page 168
250 g
Wea
r Fa
ctor
(mm
3 /Nm
)
3.2E-8±1.12E-8
7.3E-8±2.8E-8
7.68E-8±2.05E-8
Wea
r Fa
ctor
(mm
3 /Nm
)
As-deposited 400oC Anneal
2.02E-7±8.2E-8
100 g
Figure 5.6: Calculated wear factors of the 100 and 250 gram loads for as deposited (black) and 400oC annealed nanolaminate films.
The wear factors calculated using surface profilometry traces is shown in Figure
5.6. It should be noted that only the 100 and 250 gram loads are presented in this study,
as there were a lot of inconsistencies in the 25 and 50 gram load measurements. All the
wear factor values were in the 10-7 to 10-8 mm3/Nm range which is considered as the low
wear regime as was the case in the previous chapter. Another observation was that, the
400oC annealed films exhibited slightly lower wear factors than the as-deposited film and
this is in agreement with the friction coefficients. Thus it could be concluded that this
152
Page 169
nanolaminate film exhibits very good wear behavior at both room and elevated
temperatures.
5.5. Cross-sectional Behavior of Worn Nanolaminate Films
Figure 5.7 shows the cross-sectional micrograph of the worn
ZnO/Al2O3/ZrO2/Al2O3 nanolaminate film with 100 gram load. From the image it is
observed that there is no evidence of any brittle fracture (cracking) in the ZnO film after
200 m of sliding distance. Thus the ZrO2 layer which is acting as a load bearing layer is
able to prevent crack through the nanolaminates. The amount of ZnO that was worn out
after such a long run is very minimal, thus, very low wear is observed inside the wear
track. It is also observed that there is some plastic deformation occurring in the ZnO
nanocrystalline layer. The presence of plastic deformation is observed near the top
portion of the ZnO layer with evidence of bending (area in blue box) of the
nanocolumnar grains of the ZnO. In Figure 5.8, a magnified XTEM image of the area in
the blue box in Figure 5.7 is shown. This (Figure 5.8) confirms the presence of basal
stacking faults on the (0002) plane. The basal stacking fault density increases with sliding
(multiple slip of partial dislocations by a dislocation glide mechanism). The plastic
deformation occurring in the nanocrystalline ZnO layer contributes to the continuous
decrease from crystalline to amorphous.
153
Page 170
Figure 5.7: XTEM bright field image of a worn ZnO/Al2O3/ZrO2/Al2O3 nanolaminate grown on M50 steel substrate.
Figure 5.8: Magnified XTEM image of the ZnO layer showing the presence of stacking faults in the [0001] direction.
154
Page 171
In order to determine if the dislocations observed are only occurring on the (0002)
plane, a Fast Fourier Transform (FFT) diffraction pattern was undertaken. Figure 5.9a
shows the XTEM image of the ZnO layer with the (0002) basal plane with its
corresponding FFT diffraction pattern and the Fourier-filtered image. There are obviously
observable dislocations present in the ZnO (0002) plane. The corresponding electron
diffraction pattern (FFT image) of single columnar grain near the surface shows that the
{0002} basal planes are streaked along the [2-1-10] beam direction, which is consistent
with the presence of planar defects (stacking faults) running normal to the [2-1-10]
direction. The identification of these dislocations is confirmed in the corresponding
Fourier-filtered image using the {0002} diffractions spots, which demonstrate that each
PD (shown by arrows) corresponds to one additional (0002) plane. The BSF density
increases with sliding, there are multiple slip of PDs which occurs by a dislocation glide
mechanism. In the Figure 5.9b, an XTEM image of the ZnO {01-10} prismatic plane
with its corresponding FFT diffraction pattern and the inverse Fourier-filtered image are
shown. It is observed from the XTEM image that there was no presence of any
subsurface plastic deformation in the nanocolumnar grains after the frictional contact.
The corresponding FFT diffraction pattern shows that the {01-10} prismatic planes are
not streaked along [2-1-10] beam direction, which is consistent with the fact that there are
no planer defects (stacking faults) running normal to the [2-1-10] direction. This is
confirmed by the corresponding Fourier-filtered image using the {01-10} diffraction
spots, which translates to no prismatic stacking faults in the worn subsurface (due to its
high SFE). This is very important since there is only basal slip (no interacting slips
155
Page 172
systems) which translates to low interfacial shear strength (friction). Thus as observed
with the VASP computation of the SFE, Figure 5.9 confirms that planer defects could not
be generate after applying stress on the prismatic plane due to the high SFE on this plane.
Thus in order to enhance lubrication of ZnO film, it is very important that the ZnO crystal
structure is dominated by the (0002) plane.
Figure 5.9: XTEM images of the ZnO layer with their corresponding FFT diffraction pattern and the Fourier-filtered image for (a) {0002} basal plane and (b) {01-10} prismatic plane.
5.6 Solid Lubrication Mechanism in the Nanocrystalline ZnO
In order to study the influence of stacking faults on the friction coefficient of the
ZnO/Al2O3/ZrO2/Al2O3 nanolaminate films, it was necessary to analyze the samples from
156
Page 173
inside and outside of the wear track. In regards to this, the partial dislocation density was
quantified for the as-deposited film, 400oC annealed film and inside the wear track of the
annealed film, this is provided in Table 5.1. The partial dislocation density was calculated
by counting the number of defects on each micrograph divided by the area of the
micrograph. Approximately 40 micrographs were analyzed for each of the above
conditions. Based on the calculation, it was observed that the partial dislocation density
inside the wear track was the highest, this was followed by the partial dislocation density
in the 400oC annealed nanolaminate film. The as-deposited nanolaminate exhibited the
lowest partial dislocation density.
Table 5.1: Partial dislocation density in as-deposited, annealed and inside wear track of the (0002) ZnO plane.
ALD 1-Trilayer Nanolaminate PD Density (cm-2)
As-deposited 1.5 x 10¹¹
Annealed 6.5 x 10¹¹
Annealed inside wear track 1.2 x 10¹²
The as-deposited nanolaminate film exhibited low density of partial dislocations
because the entire stacking faults in this film is growth related and not due to any applied
stress. Thus the {0002}-basal planes are low surface energy planes and they have low
stacking fault energies (SFE)10, recall that basal stacking faults are more likely to be
present along the (0002) plane. On the other hand, prismatic and pyramidal planes have
157
Page 174
high surface energy planes and have high SFEs. It is therefore very difficult for stacking
fault defects to form in these planes. As observed in Figure 5.9b, there were no
dislocations present on the prismatic plane even after stress was applied. In the 400oC
annealed nanolaminate film, the partial dislocation density increased because ZnO has an
open structure and favorable coordination number, this permits Zn to freely move to
different positions in the crystal lattice and accommodate external atoms as substitutes.
The nanolaminate film was annealed in air; thus the diffusion of oxygen atoms into the
ZnO crystal structure is enhanced and this acts as substitute atoms inside the structure.
The ideal stacking sequence of the ZnO structure is disrupted which results in additional
stacking faults. Finally, after friction test, the partial dislocation density increased once
again inside the ZnO (0002) basal plane for the annealed film, this was attributed to the
fact that subsurface basal stacking faults were activated to promote intrafilm shear/slip in
the ZnO (0002) basal planes. The sliding induced plastic deformation was possible when
basal stacking faults were sheared resulting in an intrafilm shear velocity accommodation
mode as shown in Figure 5.10. This subsurface aids in shear accommodation (prevents
brittle fracture). The high stacking fault density inside the wear track is indicative of the
fact that high defect concentration enhances the reduction in the friction coefficient. Thus
activating subsurface basal stacking faults will promote intrafilm shear/slip and improve
friction. The slip of the partial dislocations is likely to result from a dislocation glide or
climb process. It is evident that the individual nanocolumnar ZnO grains are plastically
sheared (that is localized nanocrystalline plasticity that is “single crystal” additive and
158
Page 175
accumulates to the micro-scale). High resolution SEM analysis indicates a ductile
layering and smearing inside the wear tracks.
Figure 5.10: Intrafilm shear velocity accommodation mode where a friction-induced subsurface controlled by the material’s microstructure aids in shear accommodation (prevents brittle fracture).
5.7 Tribological Behavior of the Nanolaminate in Dry Nitrogen
Recall from the introduction that most of the available solid lubricants today
mostly perform best under a limited range of environmental/climatic conditions. Thus the
environments play a major role in determining the tribological performance of solid
lubricants. One of the reasons of oxides being good potential candidates for solid
lubricant is because they are thermodynamically stable materials, thus, oxide lubricants
will not degrade but can provide low friction and long life in more than one environment.
With regards to this, the tribological behavior of the ZnO/Al2O3/ZrO2/Al2O3
nanolaminate film was studied in dry nitrogen with less than 1% RH and 10 ppm O2 at
159
Page 176
room temperature. A Si3N4 ball with radius of 1.6 mm was used, a normal load of 100
grams was applied with a sliding distance of 16 m.
0 2 0 0 0 4 0 0 0 6 0 0 0 8 0 0 0 1 0 0 0 00 .0
0 .1
0 .2
0 .3
0 .4
0 .5
0 .6
0 .7
0 .8
0 .9
1 .0
C y c le s
Fric
tion
Coe
ffici
ent
a s - d e p o s ite d a n n e a le d 4 0 0 C , 2 h o u r s
Figure 5.11: COF measurements in dry nitrogen of the as-deposited and 400oC annealed ZnO/Al2O3/ZrO2/Al2O3 nanolaminate film deposited on M50 steel.
Figure 5.11 shows the friction coefficient plot that was performed in dry nitrogen.
Both as-deposited and 400oC annealed films exhibited low COF. The as-deposited
nanolaminate film showed steady state friction of approximately 0.29 while the 400oC
annealed nanolaminate film produced steady state friction of approximately 0.27. It
should be mentioned that these COF values are similar to the ones that were observed in
ambient air.
160
Page 177
Figure 5.12: High resolution SEM images of as-deposited and 400oC annealed unworn and worn (in dry nitrogen) ZnO/Al2O3/ZrO2/Al2O3 nanolaminate films deposited on M50 steel.
A high resolution SEM images of the unworn and worn surfaces of both the as-deposited
and 400oC annealed nanolaminate films are provided in Figure 5.12. It is observed from
this figure that both nanolaminate films did not exhibit any form of brittle fracture
(cracks). The surface deformation observed is due to the ductile layering and smearing as
161
Page 178
seen in the images. This ductile layering is as a result of the removal of a (0002) basal
plane layer and layer transformation from crystalline to amorphous preventing any brittle
fracture. This is very consistent with what was observed when the tests were performed
under ambient conditions. Thus it could be concluded that the dry nitrogen or lack of
atmospheric pressure did not have any major impact on the tribological properties of the
nanolaminate films.
5.8 Rolling Contact Fatigue (RCF) Test of the Nanolaminate Film
The ZnO/Al2O3/ZrO2/Al2O3 nanolaminate solid lubricants were deposited on
CrN/Cr/M50 steel cups while ZnO/Al2O3/ZrO2 nanolaminate film was deposited on
CrN/Cr/M50 steel cylindrical rods for rolling contact fatigue (RCF) test. This was done in
order to determine the lifetime of the nanolaminate film coated on the rotating cylindrical
specimen. Three 52100 (uncoated) steel balls with Hertzian contact pressure of 1.5 GPa
applied were used to roll against the rod and the cups, Figure 5.13 shows the RCF wear
tracks inside the cups. Figure 5.13 shows that the nanolaminate film was successfully
deposited on the cups and after the RCF test, there is a wear track that is microscopically
visible. Different RCF cycles were performed on the cups and rods, the cycles included
10,000, 20,000, 1.3 million and 1.6 million, this was done in order to study the rate of
wear.11 Thus the wear was analyzed after each of these cycles to determine if the coated
nanolaminate is still present.
162
Page 179
Figure 5.13: Microscopic images showing the ZnO/Al2O3/ZrO2/Al2O3 nanolaminate film deposited on M50 cups. The arrows points to the wear tracks.
In Figure 5.14, a cross-sectional TEM image of the top part of the cup is shown. The
cross sectional TEM cut was performed on the non-polished top surface of the cup
(shown as an insert), that is not inside the polished race were the three balls roll, hence
there is some high, intrinsic roughness in the TEM micrograph of the layers. The image
shows that all the deposited layers are present and the layers actually mimics the surface
roughness of the CrN layer that was present prior to the nanolaminate deposition. It is
once again observed that the ZnO and ZrO2 layers are crystalline while the Al2O3 layer is
amorphous.
163
Page 180
Figure 5.14: XTEM image of ZnO/Al2O3/ZrO2/Al2O3 nanolaminate film on CrN/Cr/M50 steel cup. Insert is HRSEM image of the location of cross-sectional FIB-cut.
After the 6 million cycles run, a FIB cut was undertaken on the ZnO/Al2O3/ZrO2 +
CrN/Cr/M50 rod. Figure 5.15 shows the XTEM image of the worn area on the rod after 6
million cycles. Wear was only observed in the top ZnO layer and the wear was non-
uniform. There was no evidence of any brittle fracture (cracking). Thus the ALD
164
Page 181
deposited nanolaminate film on the rods (Figure 5.15) and cups (not shown) survived
under all the RCF cycles (10000, 20000, 1.3 million and 6 million). The whitish
amorphous layer on top of the ZnO layer could be the lube (ML-L-23699) that was
dropped 8-10 times per minute into the wear tracks during the test or a tribochemical
wear that was transferred from the 52100 steel balls thus forming Fe2O3 layer. Further
chemical analysis needs to be done to determine the exact composition of this amorphous
layer.
Figure 5.15: XTEM image of worn ZnO/Al2O3/ZrO2/Al2O3 nanolaminate film on CrN/Cr/M50 rod, this was after 6 million cycles.
A magnified XTEM image of the ZnO layer exhibits (0002) orientation with stacking
fault defects present. The arrows in the red boxes of figure 5.16a show the presence of the
165
Page 182
stacking faults near the surface of the ZnO layer. The stacking faults that are exhibited in
the (0002) plane are bordered by partial dislocations (PDs). The basal stacking faults are
connected to the unfaulted crystal by the PDs. Thus during the RCF testing, there is slip
of the PDs hence creating a higher density of the BSFs. The presence of stacking faults is
observed better in Figure 5.16b, this figure shows one of the filtered images of the ZnO
layer. The identification of these dislocations is confirmed in Fourier-filtered images
using (0002) diffraction spots, which demonstrate that each PD corresponds to one
additional (0002) plane. These stacking faults are shown by the arrows in the images.
Figure 5.16: (a) Magnified XTEM image of worn ZnO layer showing the presence of stacking faults. (b) Fourier-filtered image of another ZnO layer after RCF test showing the presence of stacking faults.
It can be concluded that the ALD deposited ZnO/Al2O3/ZrO2/Al2O3 nanolaminate solid
lubricant on CrN/Cr/M50 steel could function as a break-in (conditioning) layer for a
166
Page 183
CrN/steel rolling interface where the CrN would otherwise abrade the uncoated steel
raceways.
5.9 Chapter Summary
Conformal and uniform ALD ZnO/Al2O3/ZrO2/Al2O3 nanolaminate films have
been successfully deposited on M50 substrates, cups and rods. The following are the
conclusions based on the nanolaminate’s structural characterization and tribological
behavior.
a. XRD analysis showed that the deposited ZnO and ZrO2 layers were crystalline
while the Al2O3 was amorphous. The ZnO nano-layer film was highly textured on
the (0002) plane and this is known to enhance lubrication. The FWHM of the
(0002) peak was determined to be greater than 0.3o, this behavior has been linked
to growth defects such as high/low angle grain boundary, stacking faults etc. It
should be mentioned that these observations were also made when the
nanolaminate layers were deposited on a silicon substrate (Chapter 4).
b. XTEM analysis of the unworn nanolaminate confirmed the crystallinity of the
ZnO and the ZrO2 with Al2O3 being amorphous. Both the ZnO and ZrO2 crystal
structures exhibited nanocolumnar grain growth through thickness. At high
magnification, basal stacking faults were observed in the (0002) plane, the high
density of BSF were growth defects. A Vienna Ab-initio Simulation Package
(VASP) calculation confirmed that the energy required to create stacking fault
defects is approximately ten times lower on the (0002) plane than the (01-10)
167
Page 184
prismatic plane. Thus stacking faults are more likely to form on the (0002) basal
plane than the prismatic plane.
c. Tribological studies showed low friction coefficients and wear factors for both as-
deposited and 400oC annealed nanolaminate films. 400oC annealed film exhibited
lower friction and wear factor values than the as-deposited nanolaminates. This
was attributed to the increase in intensity of the (0002) basal plane XRD peak
after the thermal anneal which suggests that the annealing enhanced the (0002)
grain growth. A linear regression fit for friction coefficient as a function of
inverse Hertzian pressure showed that both as-deposited and 400oC annealed
films followed the Bowden and Tabor relation. That is the friction coefficient
decreases with increase in applied load.
d. After the tribotest, XTEM analysis was done inside the wear track to determine
the effect of the applied stress on the deposited nanolaminate. No cracks were
observed after the 200 m sliding distance and the amount of ZnO worn out was
very minimal considering the traveling distance. Due to the applied stress,
evidence of bending in the nanocolumnar grains of the ZnO layer was observed.
FFT diffraction patterns and Fourier-filtered images for the (0002) basal plane
and (01-10) prismatic plane confirmed the VASP calculation that even after
tribotest, stacking fault defects could not be created in the prismatic planes but
rather only in the basal plane.
e. The mechanism by which the ZnO layer acts as a good solid lubricant was studied
and it was observed that inside the wear tracks, the density of BSF is very high
168
Page 185
compared to the annealed unworn nanolaminate films, the as-deposited
nanolaminate film had the lowest BSF density. The high concentration of BSF in
the ZnO layer of the wear track is attributed to the sliding induced plastic
deformation due to the shearing of the layers resulting in an intrafilm shear
velocity accommodation mode. This subsurface is thought to aid in shear
accommodation thus preventing brittle fracture.
f. A tribotest was undertaken in dry nitrogen in order to determine the effect of
extreme environment on the nanolaminate film. It was observed that the
tribological behavior exhibited under the dry nitrogen is similar to that exhibited
under ambient environmental conditions. HRSEM analysis also showed that there
were no brittle fracture inside the wear track, the only surface deformation that
was observed was due to the ductile layering and smearing. Thus the
nanolaminate solid lubricant is capable in performing under dry nitrogen
conditions.
g. The nanolaminate was successfully deposited on CrN/Cr/M50 cups and rods for
rolling contact fatigue test. After 6 million cycles, XTEM analysis showed that
only part of the ZnO layer had worn off. No cracks or brittle fracture was
observed on the nanolaminate film coated rod. A white layer that is on top of the
ZnO layer could not be analyzed to determine whether it was from the applied
lube or an iron oxide layer from the 52100 steel balls. Magnified XTEM inside
the wear track showed that there was high concentration of stacking faults in the
169
Page 186
(0002) plane and these are bordered by partial dislocations. The high stacking
fault density is enhancing the lubrication mechanism and thus reducing friction.
In conclusion, it has been shown that it is feasible to generate lubricious oxides
through microstructural control at the nanometer level. The ALD deposited
nanolaminates are good candidates for providing low friction, wear and good rolling
contact fatigue resistance in moving mechanical assemblies that require thin (~10-300
nm), uniform and conformal solid lubricant films.
170
Page 187
171
5.10 Chapter References
1 Decaudin, B., Djega-Mariadassou, C., Cizeron, G., Journals of Alloys and compounds
226 (1995) 208-212.
2 Trivedi, H. K., Gerardi, D.T., Rosado, L., Lubrication Science (8) 3 (2006) 211-232.
3 Mulligan, C.P., Gall, D., Surface and Coatings Technology 200 (2005) 1495-1500.
4 Zabinski, J. S., Sanders, J. H., Naimaparampil, J., Prasad, S. V., Tribology Letters 8
(2000) 103-116.
5 Lin, L. –Y., Kim, D. –E., Thin Solid Films 517 (2009) 1690-1700.
6 Sagalowicz, L., and Fox, G.R., Journal of Materials Research, 14 (1999) 1876
7 Gerthsen, D., Litvinov, D., Gruber, T., Kirchner, C., Wasag, A., Appl. Phys. Letters 81
(21) (2002) 3972 – 3974.
8 Sun, H. P., Pan, X. Q., Du, X. L., Mei, Z. X., Zeng, Z. Q., Xue, Q. K., Appl. Phys.
Letters (85) 19 (2004) 4385 – 4387.
9 S. V. Prasad, J. S. Zabinski, J. J. Nainaparamil, Journal of Material Science Letters, 10
(2000) 1979-1981
10 Yan, Y., Physical Review B, 70 (2004) 193-206
11 Wereszczak, A.A., Wang, W., Wang, Y., Hadfield, M., Kanematsu, W., Kirkland, T.P.,
and Jadaan, O.M., http://info.ornl.gov/sites/publications/files/Pub2425.pdf
Page 188
CHAPTER 6
CONCLUSIONS AND FUTURE WORK
6.1 Conclusions
The major aim of this study was to determine that the ZnO/Al2O3/ZrO2 and
ZnO/ZrO2 nanolaminates deposited by Atomic Layer Deposition technique can perform
as good lubricous oxide films by exhibiting certain behaviors that allow these films to
absorb the applied stress without showing any catastrophic failure and generating any
wear debris at different temperatures and environmental conditions. Based on the
experimental results, conclusions and future works are summarized in this chapter. In the
case of the ZnO/Al2O3/ZrO2 trilayer nanolaminate films that were deposited on Si
substrates, low friction coefficient values were achieved and no catastrophic failures were
observed due to the following reasons:
1. Ex-situ annealing of the ALD nanolaminate films exhibited grain coarsening
with increase in the annealing temperature. This effect was very obvious at the
1000oC temperature films where there was an increase in both friction and
wear values.
2. The (0002) basal plane orientation of the ZnO layer has the lowest surface
energy which lowers the friction while the (101) prismatic plane has higher
surface energy. Thus the lubricous ZnO layer was achieved because the
172
Page 189
(0002) ZnO orientation has low stacking fault energies compared to the
prismatic plane and can accommodate interfacial shear which tends to exhibit
plastic deformation while the other planes exhibit brittle fracture.
3. The presence of ZrO2 layer acted as a load bearing layer by being able to
withstand the high stress that was applied thus preventing any cracks through
the nanolaminate films.
4. The thinning of the ZnO layer after 1000oC anneal was due to the phase
transformation of the ZrO2 layer from tetragonal to monoclinic, this allowed
the diffusion of the ZnO into the ZrO2 layer. This prevented any good
tribological behavior and the nanolaminate film became a very hard coating
and thus losing its lubricious behavior.
For the ZnO/ZrO2 two and eight bilayers nanolaminate films, the two bilayer film
exhibited good wear and friction behavior as compared to the eight bilayer films at both
room and 400oC annealing temperatures. The reason for this trend are that, the thickness
of the top layer ZnO was too thin for the eight bilayer film compared to the two bilayer
films. Film thickness in this case influenced the grain growth of the (0002) basal plane
thus fewer stacking faults were able to be generated in the eight bilayer film to help
reduce the friction.
When the ZnO/Al2O3/ZrO2/Al2O3 nanolaminate films were deposited by ALD on
M50 substrates, cups and rods, lower friction and wear factor values were observed. The
observations that were made during the tests are summarized below:
173
Page 190
1. The as-deposited nanolaminate film had lower density of stacking fault
compared to the annealed film while the inside the worn area of the annealed
nanolaminate film exhibited the highest concentration of stacking faults. The
high stacking fault density contributed immensely to the reduction in the
friction coefficient and wear factor.
2. High stacking fault energy was computed for the prismatic plane of the ZnO
layer while the basal plane stacking fault energy was very low. The energy
required to create stacking faults in a prismatic plane is too high and even
after friction test, no stacking faults were observed in the prismatic planes.
3. The 400oC annealed nanolaminate films exhibited lower friction coefficient
than the as-deposited nanolaminate films. This was shown in a linear
regression fit for the friction coefficient verses the inverse Hertzian pressure.
All the nanolaminate films followed the Bowden and Tabor relation, which is
there was a decrease in friction coefficient with an increase in the applied
load.
4. Tribotest inside a dry nitrogen chamber also exhibited good friction
coefficient values which were comparable to the ones tested in atmosphere.
Hence lack of atmospheric pressure will not have any major impact on the
tribological properties of the nanolaminate films.
5. Rolling contact fatigue test on the nanolaminate films deposited on CrN/M50
rods showed wear only in the ZnO layer after 6 million cycles, the wear was
non-uniform and not much wear debris was observed. Thus the nanolaminate
174
Page 191
ALD solid lubricant could function as a break-in (conditioning) layer for a
CrN/steel rolling interface where the CrN would otherwise abrade the
uncoated steel raceways.
The nanolaminate films have been successfully deposited on various substrates by
the ALD technique. The growth, structural and tribological investigations has
demonstrated that by structurally engineering the ZnO layer to conform to the (0002)
basal plane, the nanolaminate become both lubricous and exhibit low wear factors at both
room and elevated temperatures. The low friction coefficients, wear factors and good
rolling contact fatigue resistance that were observed is due to the nanoscale sliding-
induced plastic deformation which became possible when the basal stacking faults were
sheared resulting in an intrafilm shear velocity accommodation mode. This sub-surface
aids in shear accommodation thus preventing brittle fracture. Thus, it is feasible to
generate lubricous oxides through Microstructural control at the nanometer level. In
addition, the ALD ZnO/Al2O3/ZrO2 nanolaminate films are good candidates for
providing low friction, wear and good rolling contact fatigue resistance in moving
mechanical assemblies that require thin (~10 – 300 nm), uniform and conformal solid
lubricant films.
6.2 Future Work
Future work on the oxide lubricants should include but not limited to the
following:
1. For high temperature (1000oC) applications, the ZrO2 layer should either be
replaced or stabilized in the tetragonal phase in order to prevent the ZrO2
175
Page 192
176
phase change from tetragonal to monoclinic which is a transformation
toughening mechanism.
2. The newly replaced toughness bearing layer and the other layers should be
structurally and tribologically investigated at high temperatures in order to
determine if the ZnO layer can withstand these high temperatures.
3. Three-dimensional atom probe (3DAP) should be used to investigate the oxide
superlattices of the ZnO/Al2O3/ZrO2 and ZnO/ZrO2 nanolaminate films to
help understand the nanostructure and compositional interfaces.
4. With the success achieved in the friction and rolling contact fatigue tests,
Timken Company can implement this deposition procedure to function as a
break-in (conditioning) layer for a CrN-M50 steel rolling interface where the
CrN would otherwise abrade (damage) the uncoated steel raceways. This run
in interface can now only be used at room and moderate temperatures.


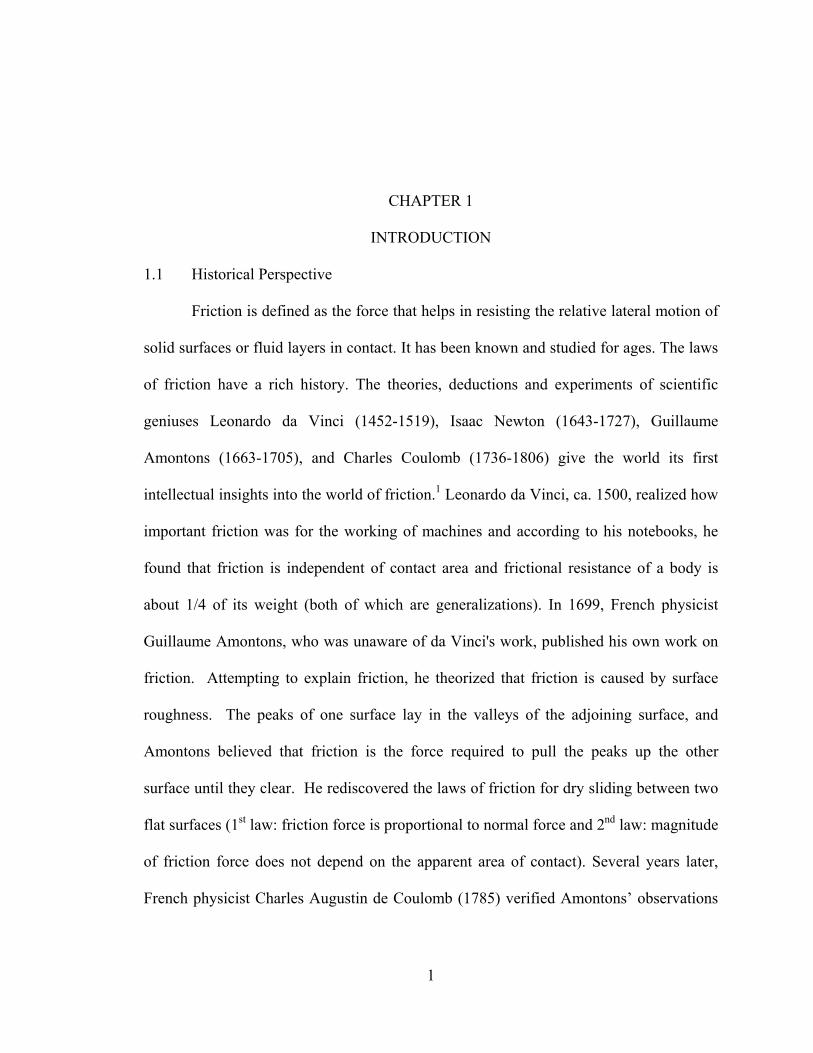
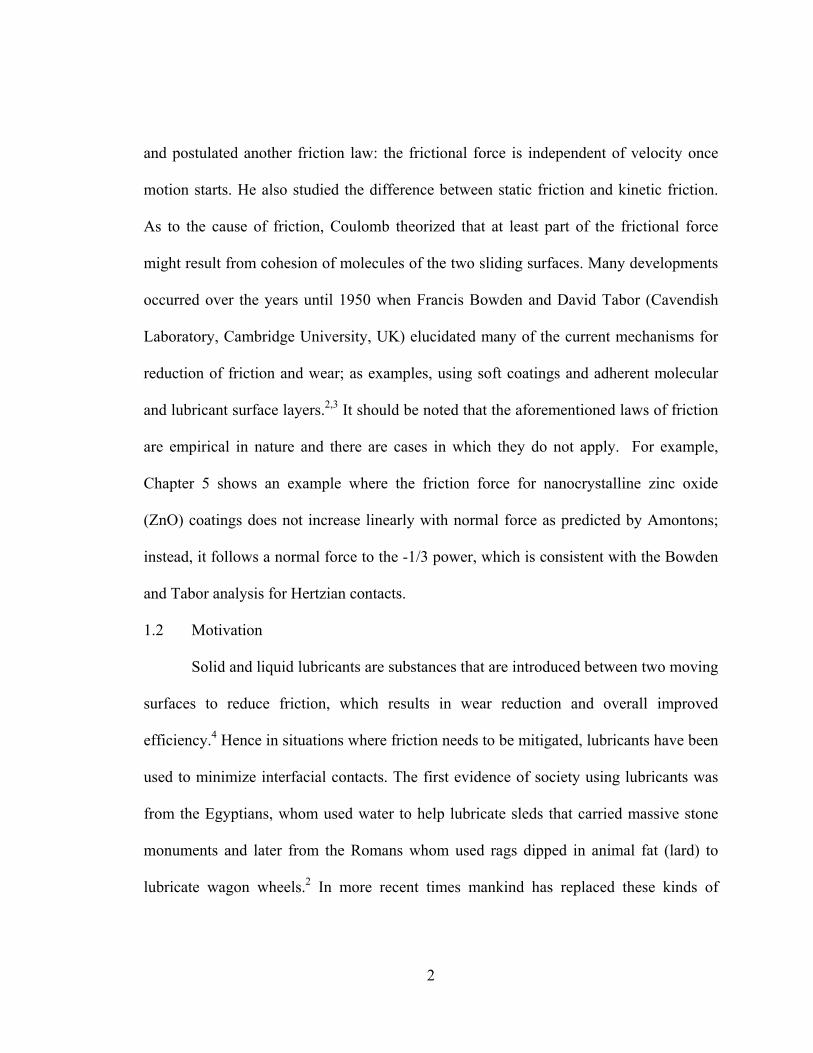


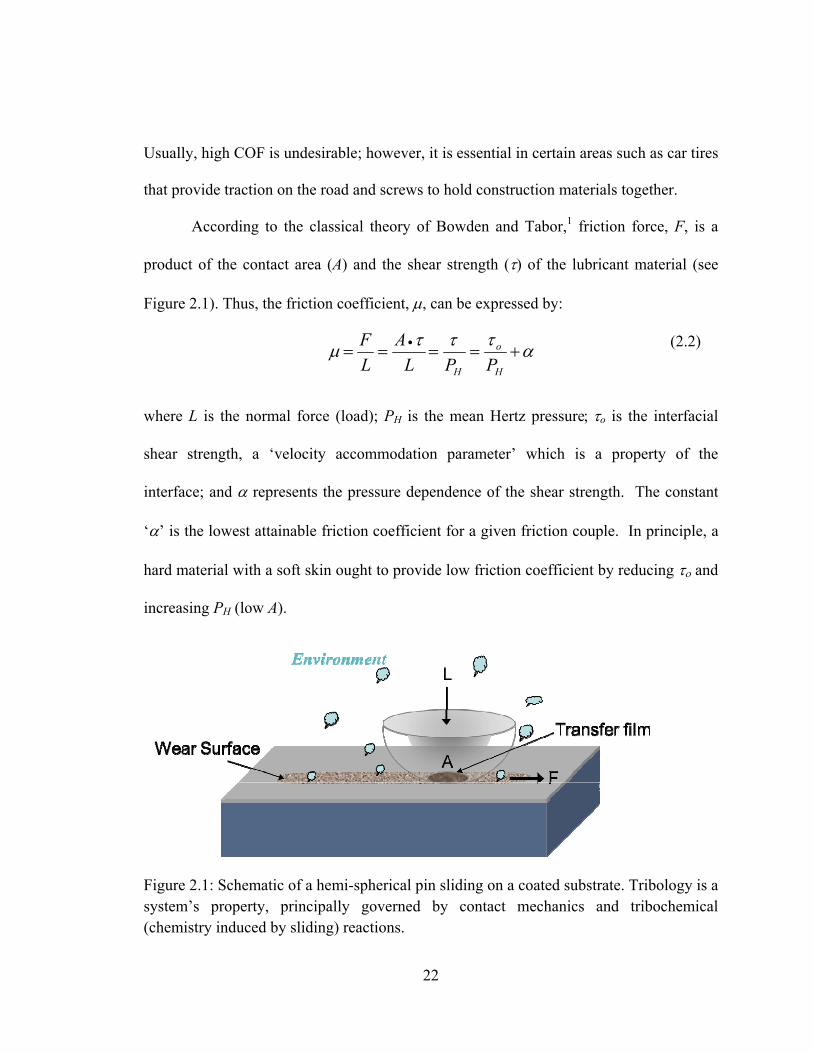

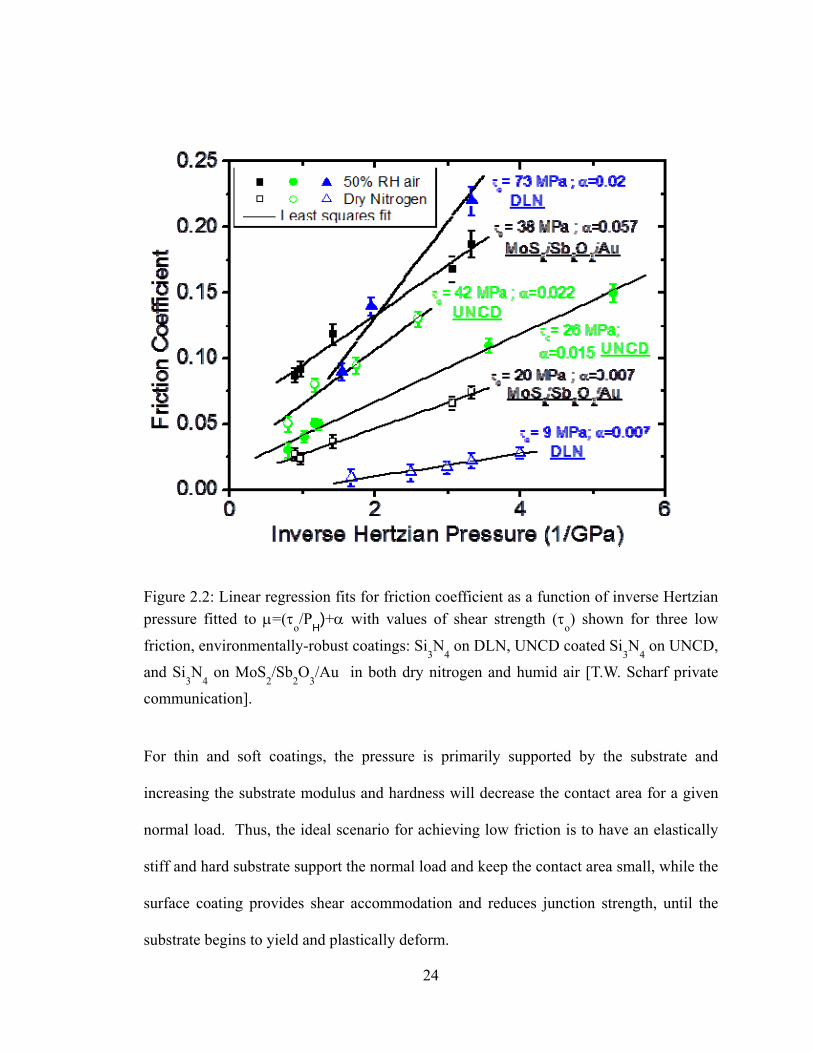


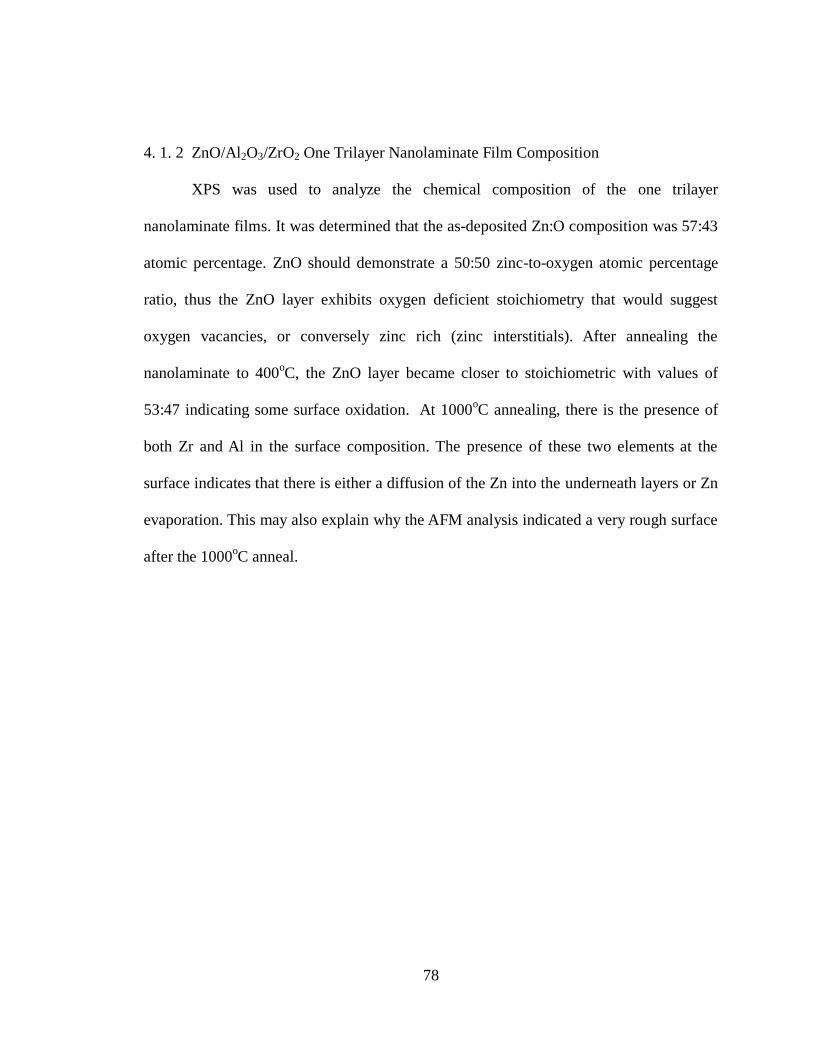
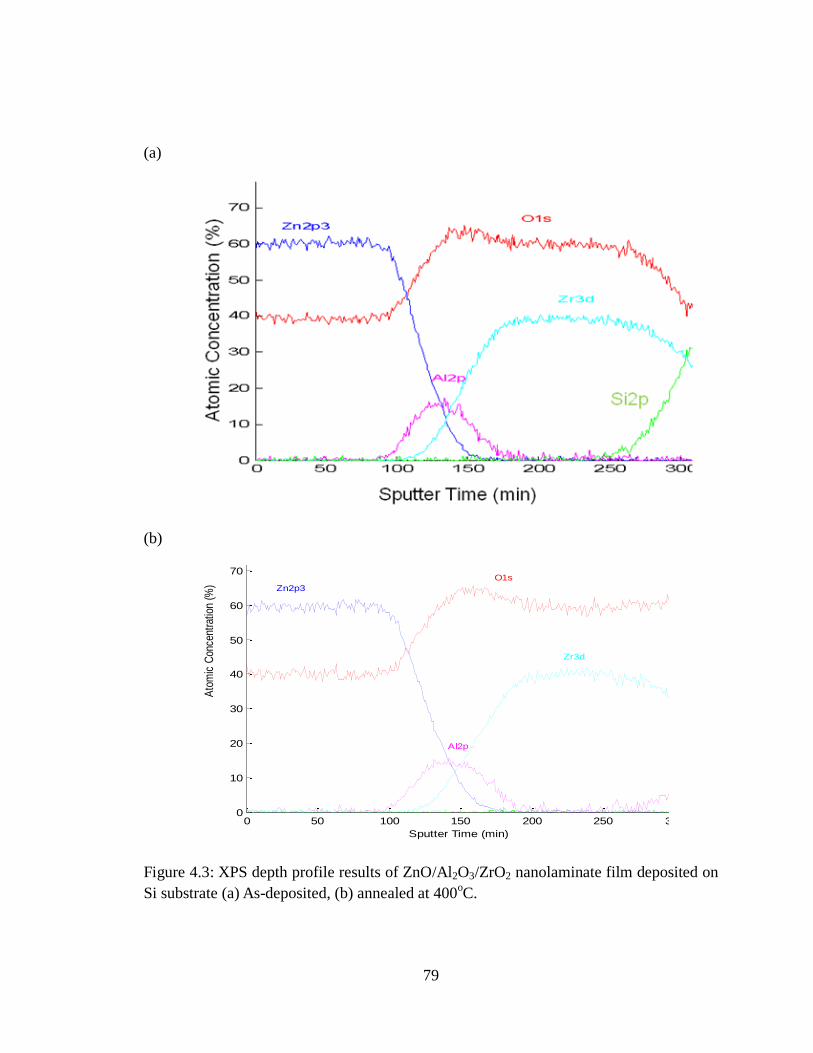


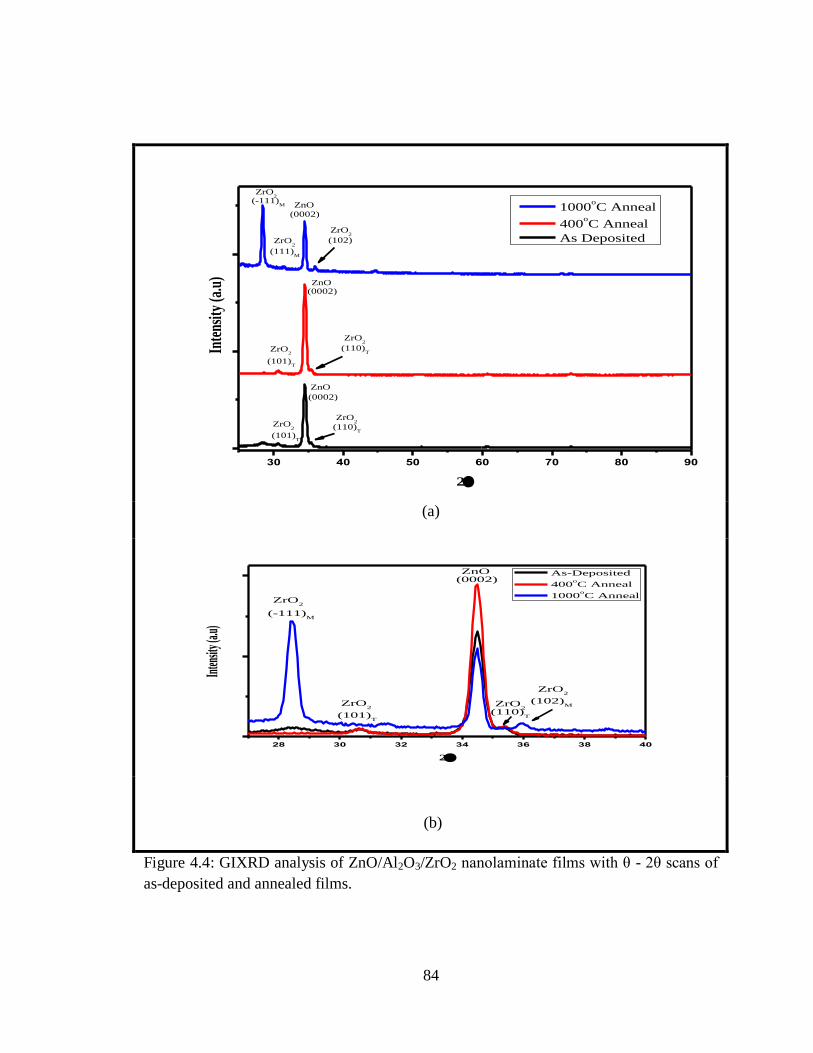
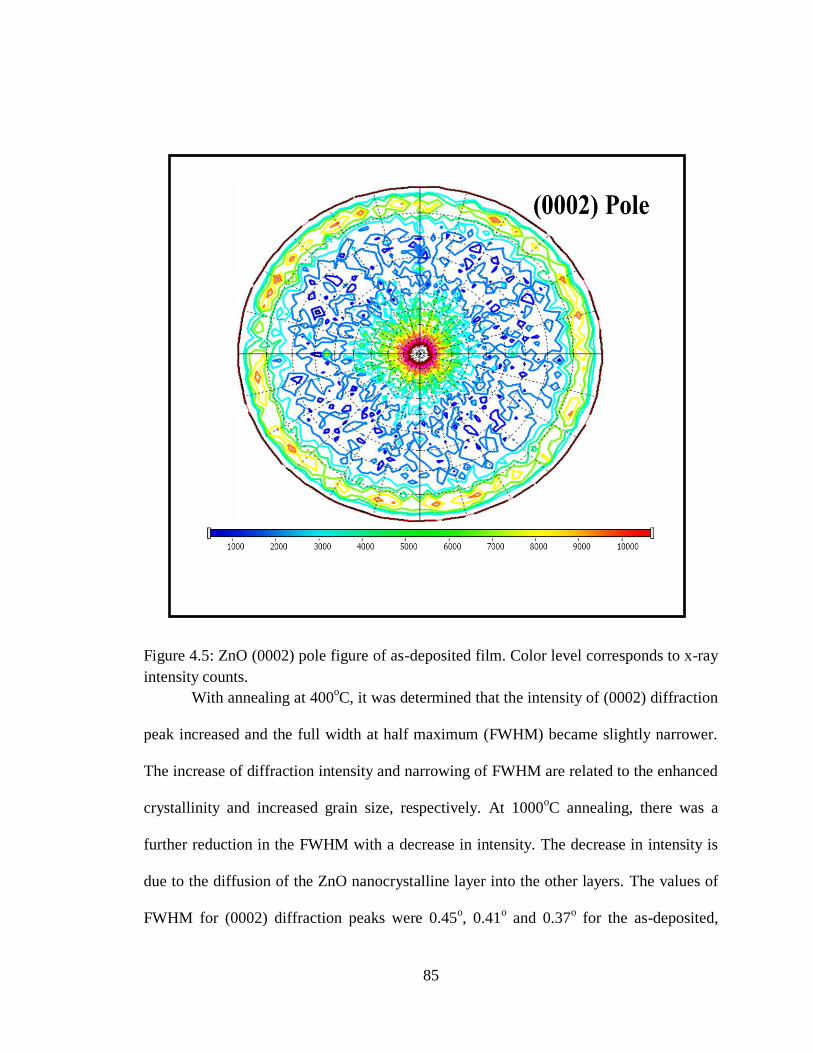
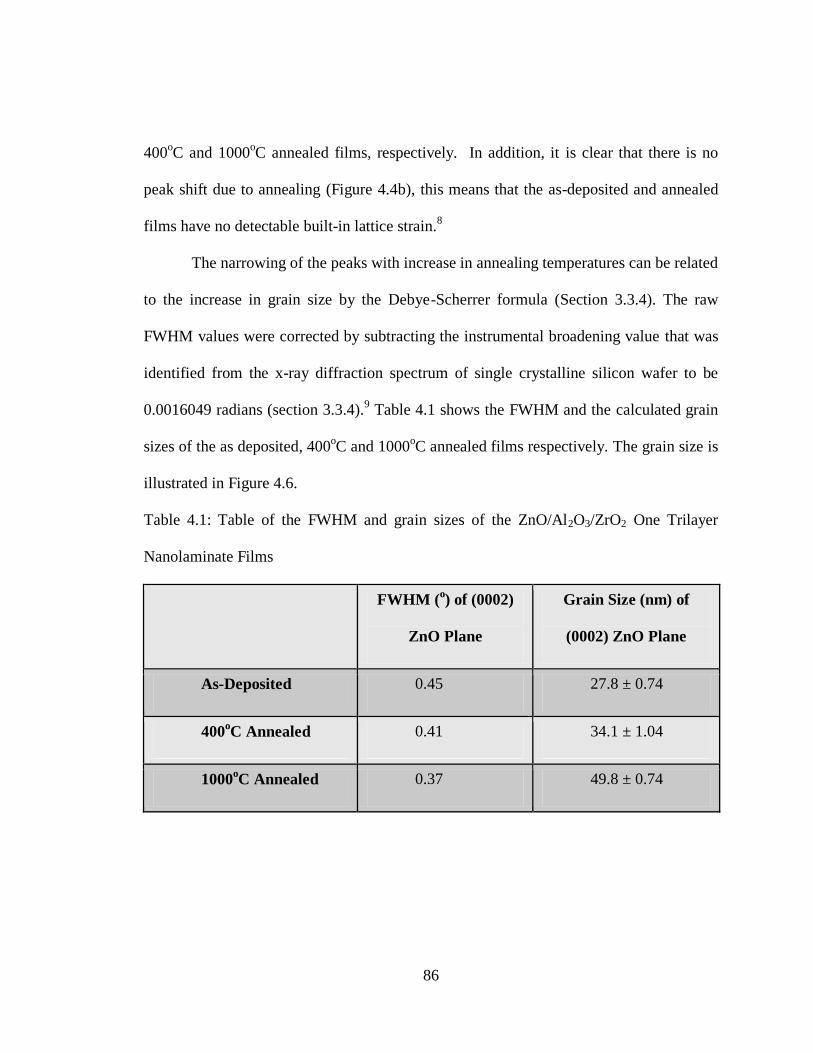
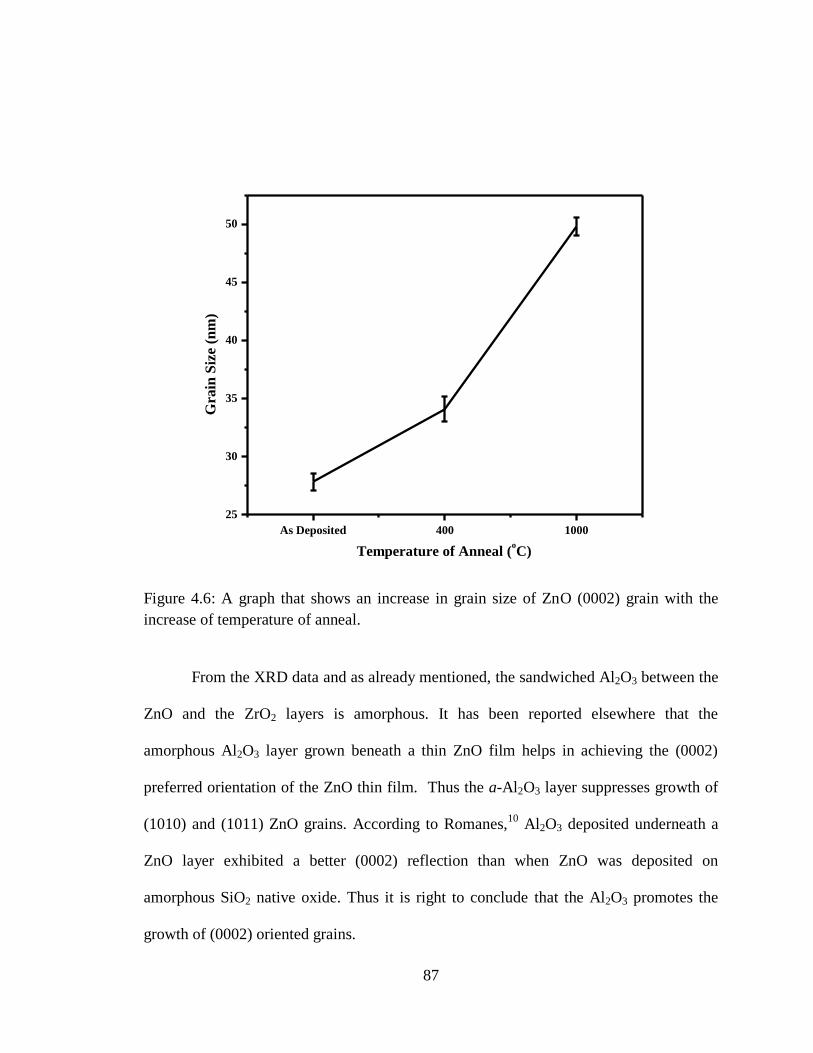

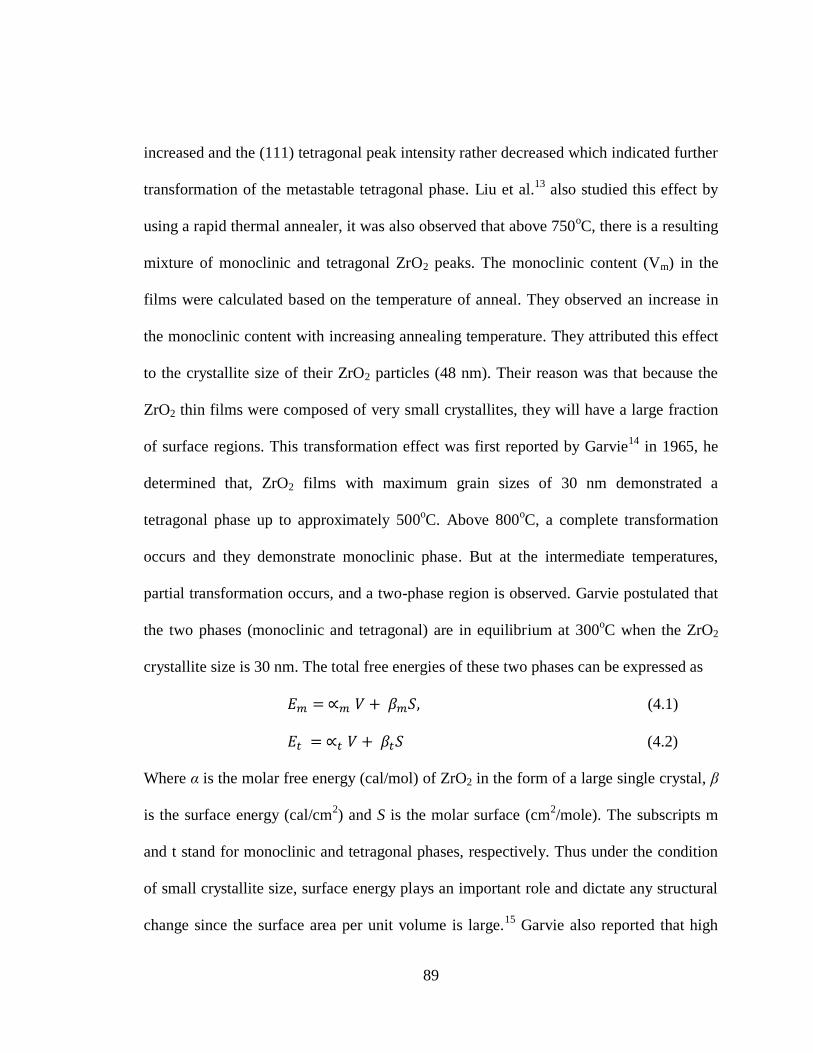


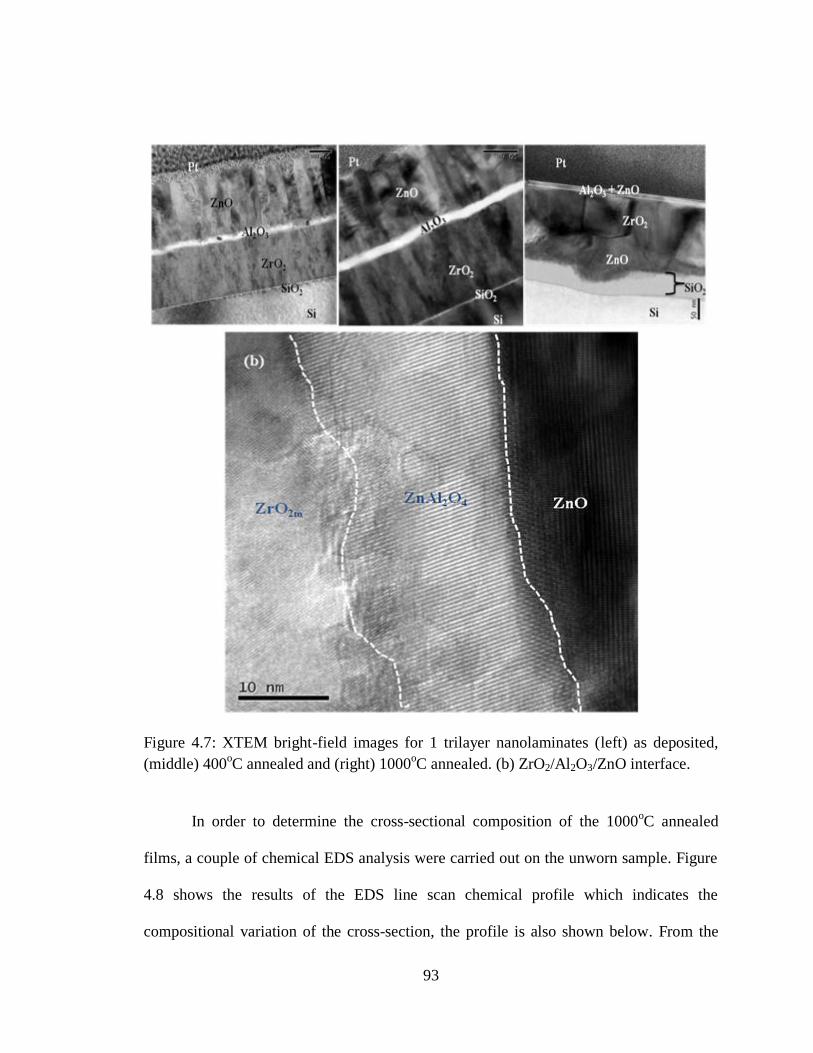
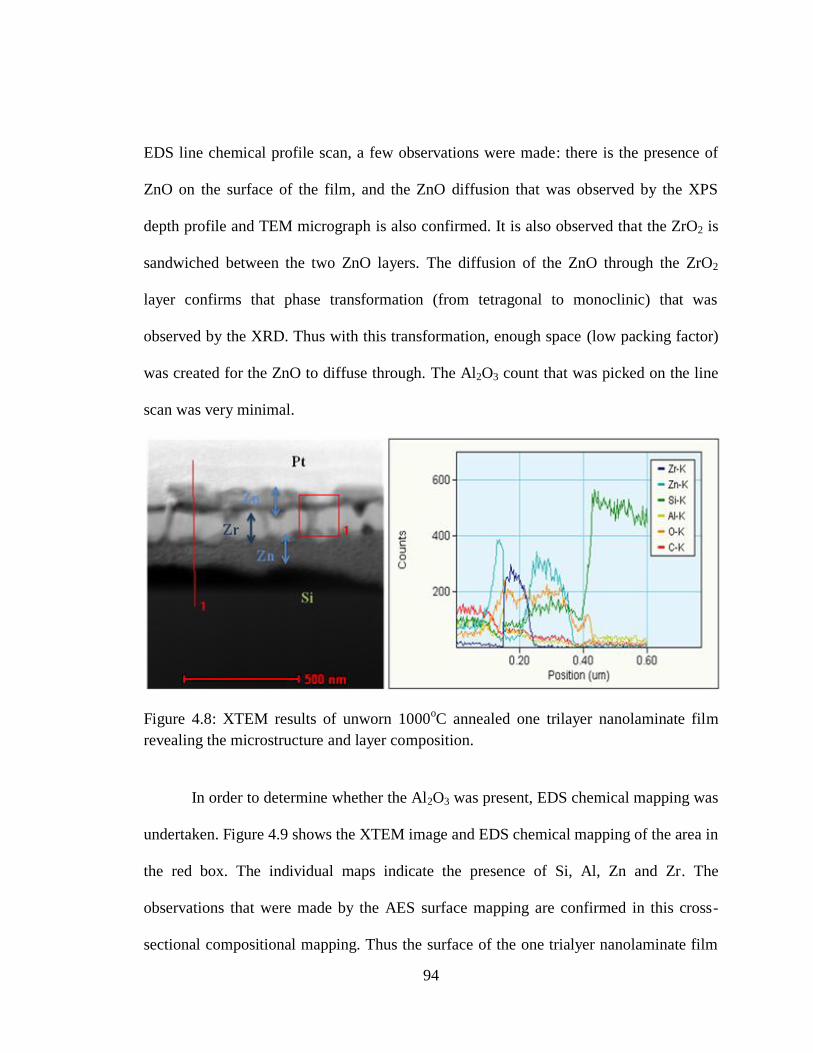
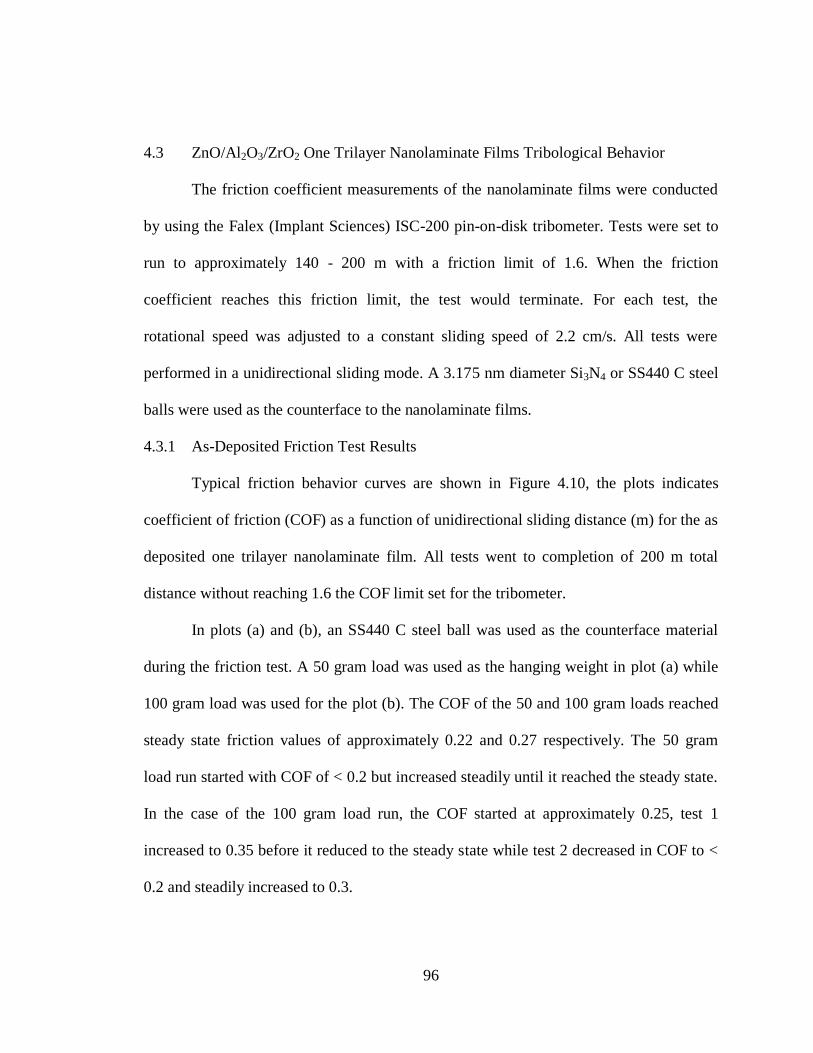
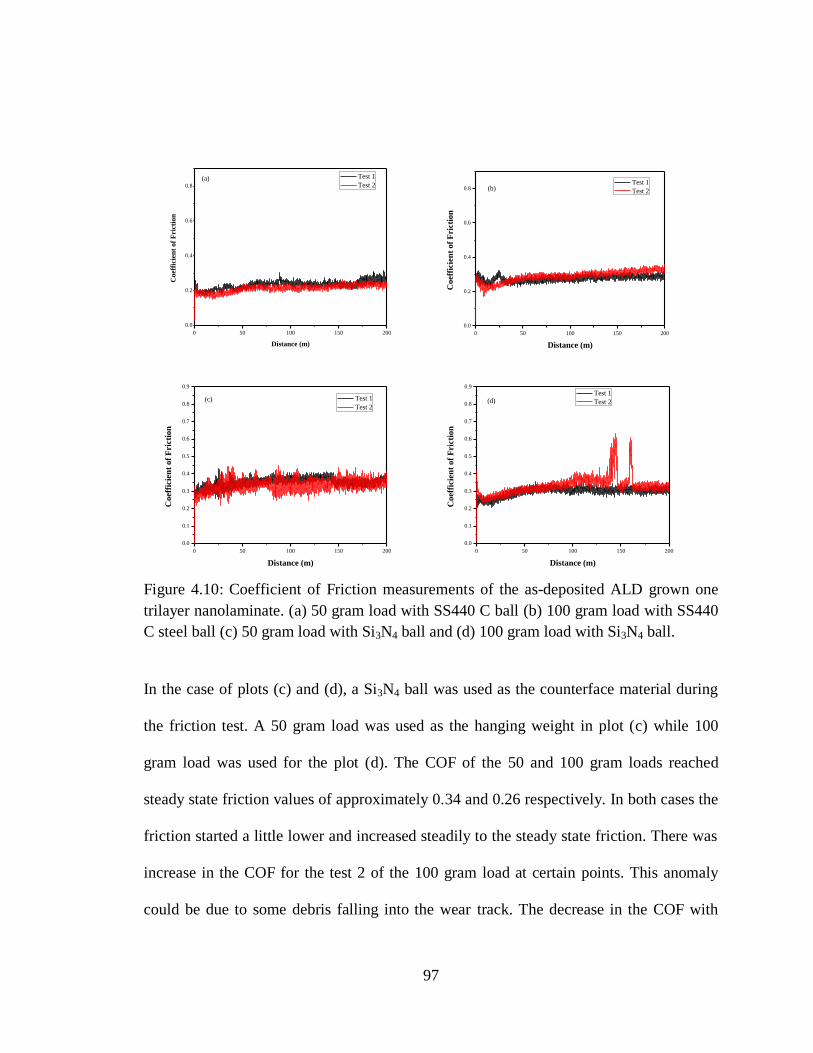
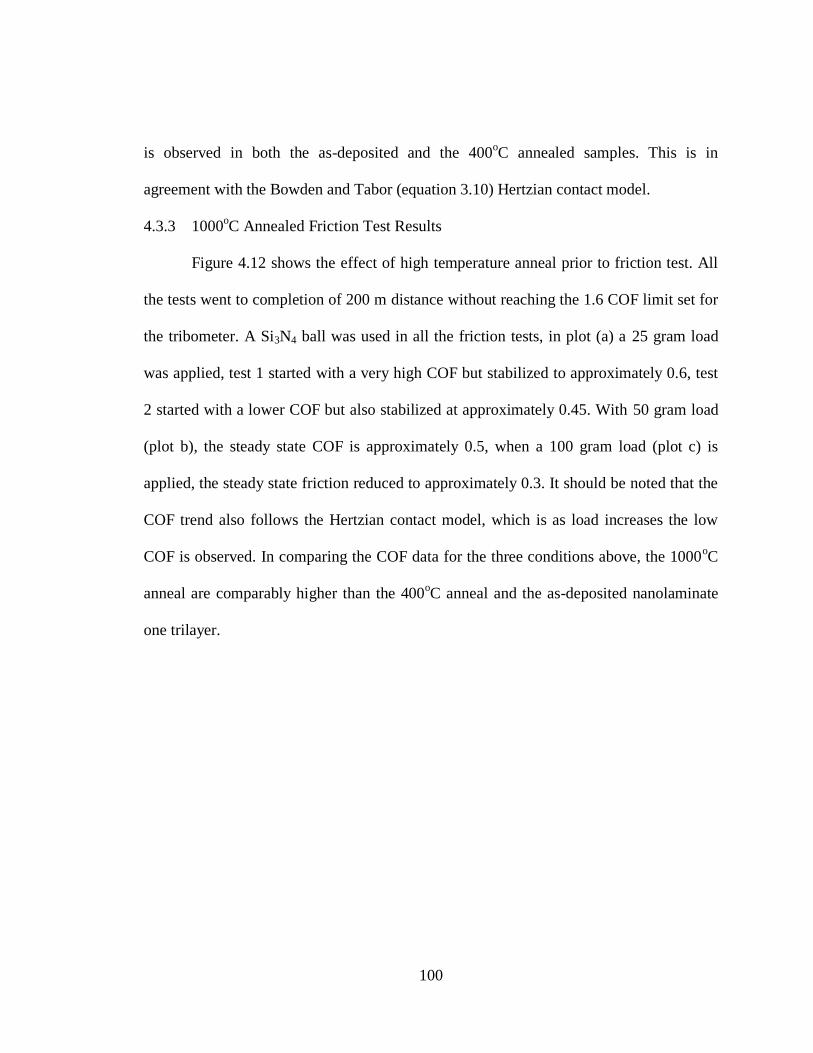

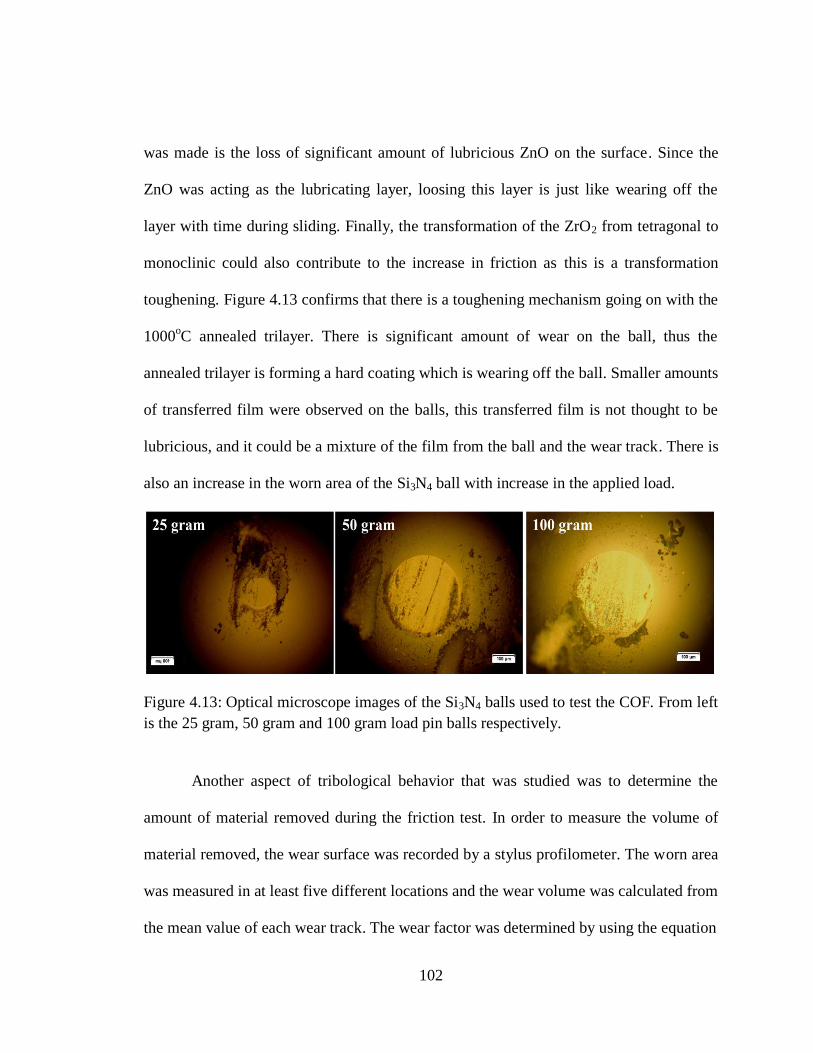


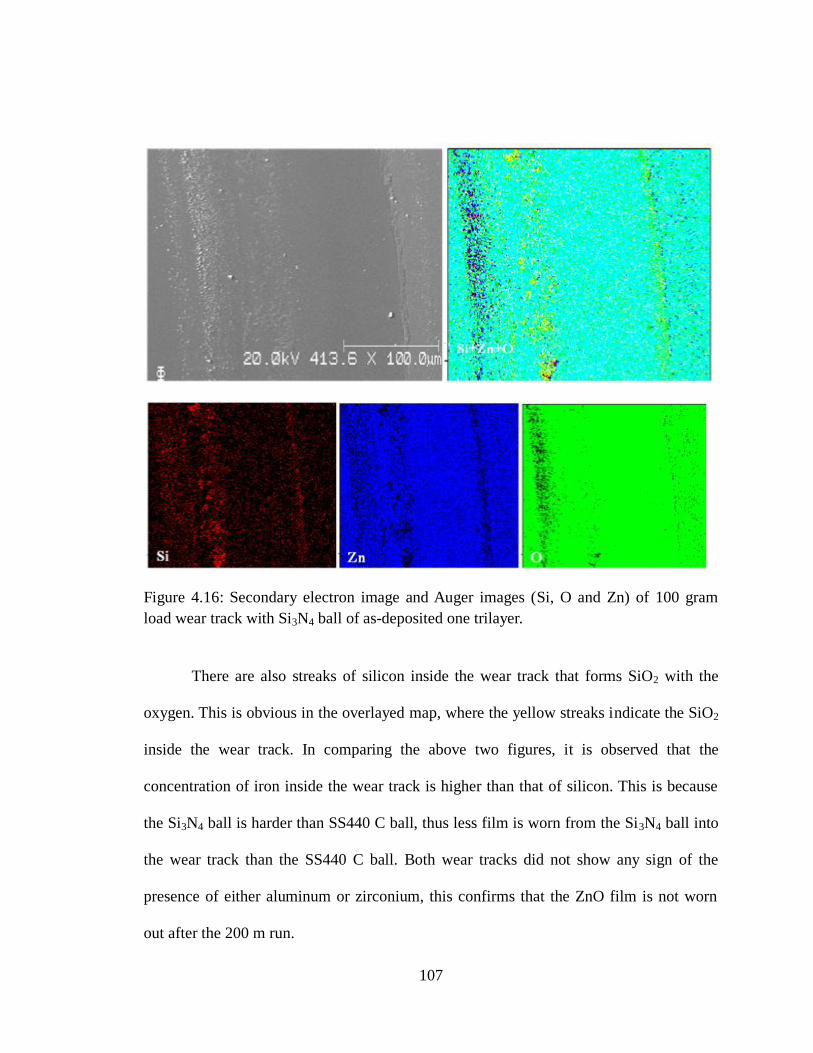

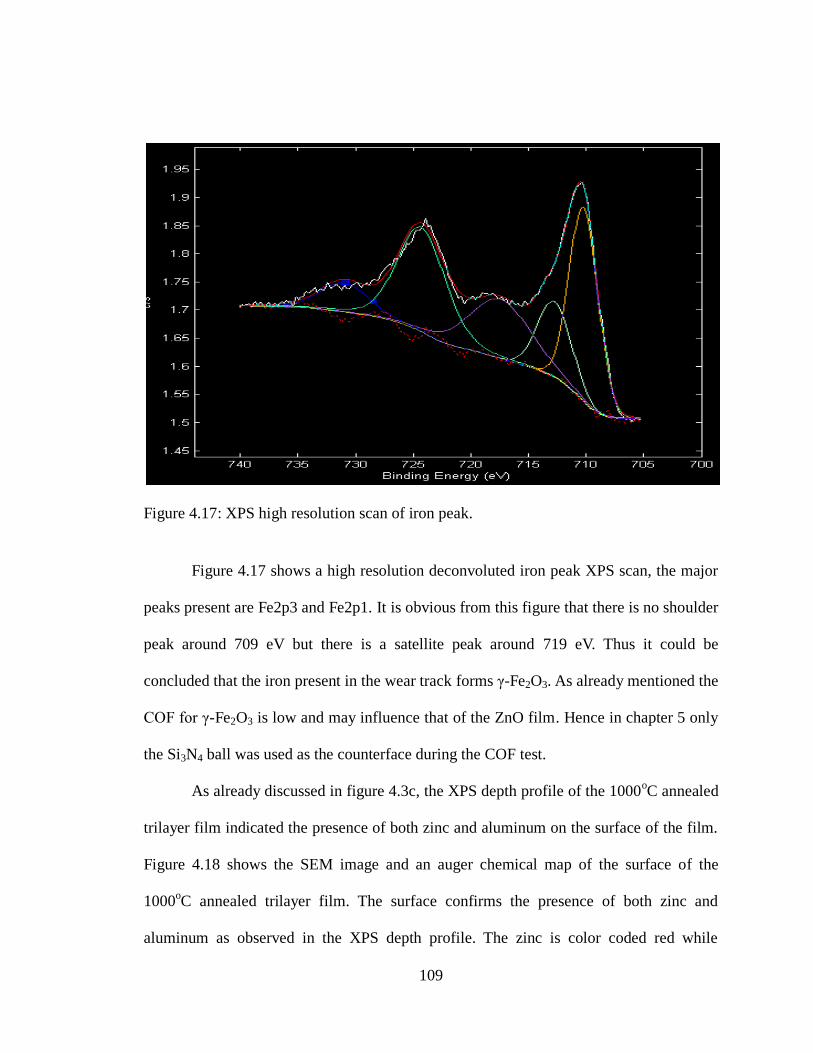


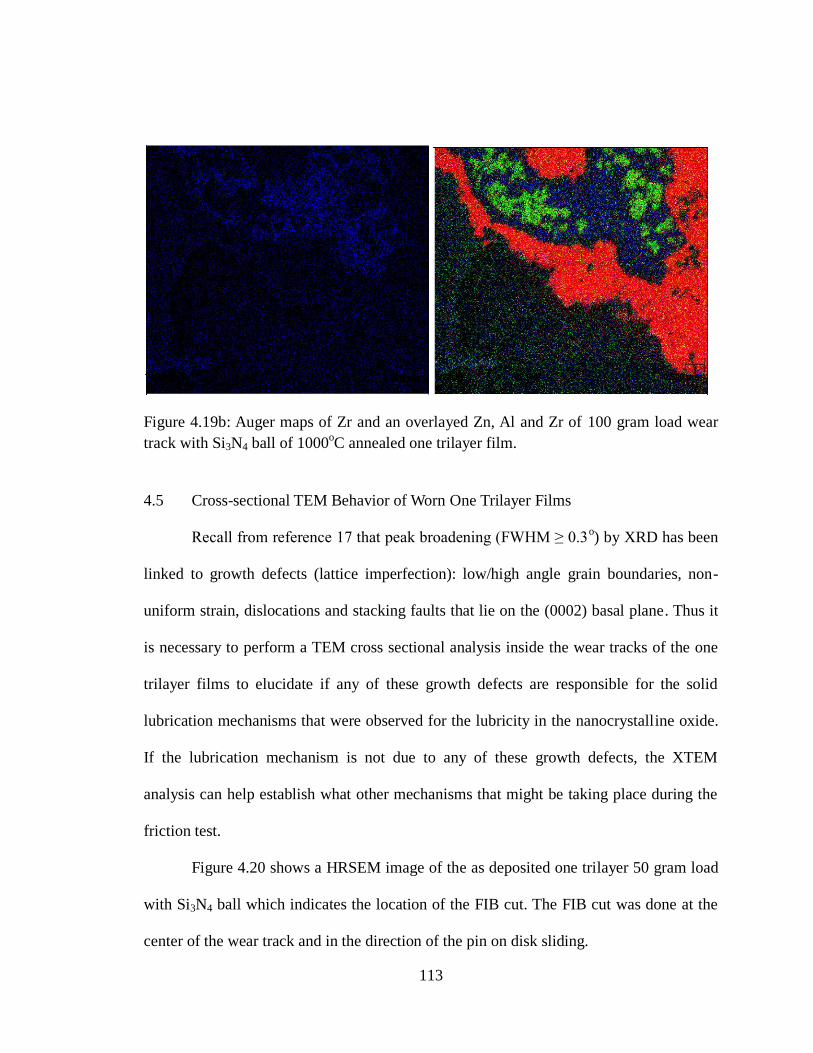


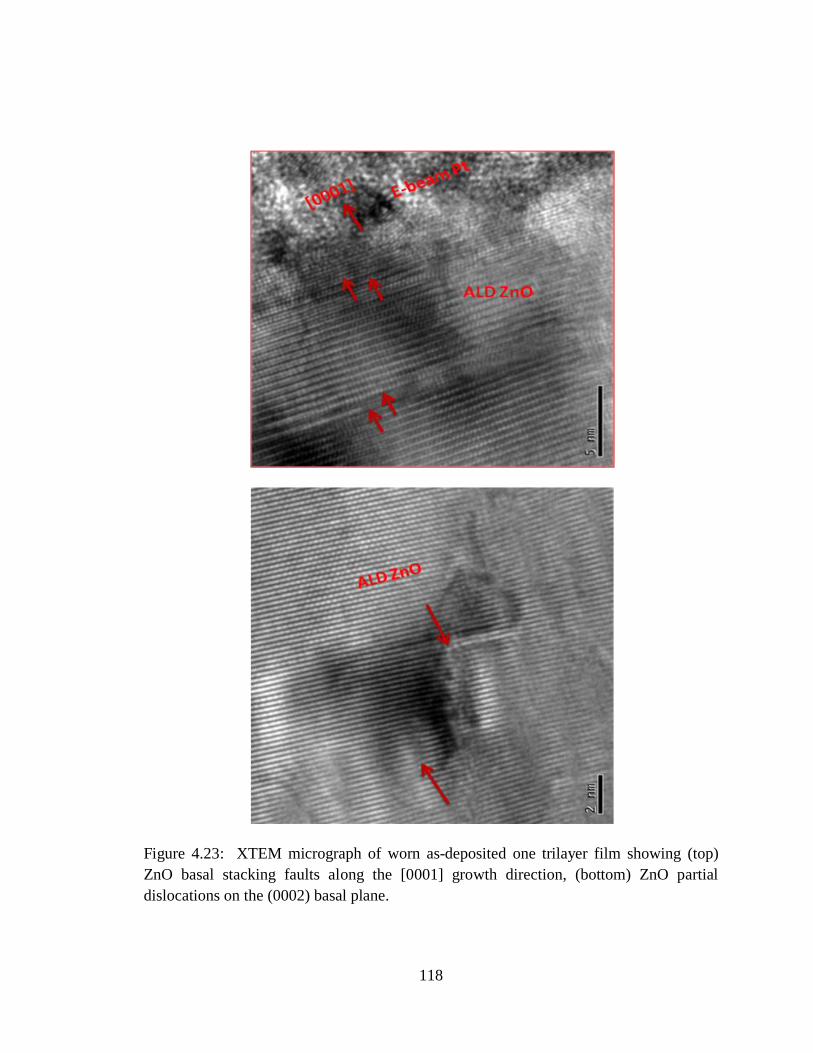
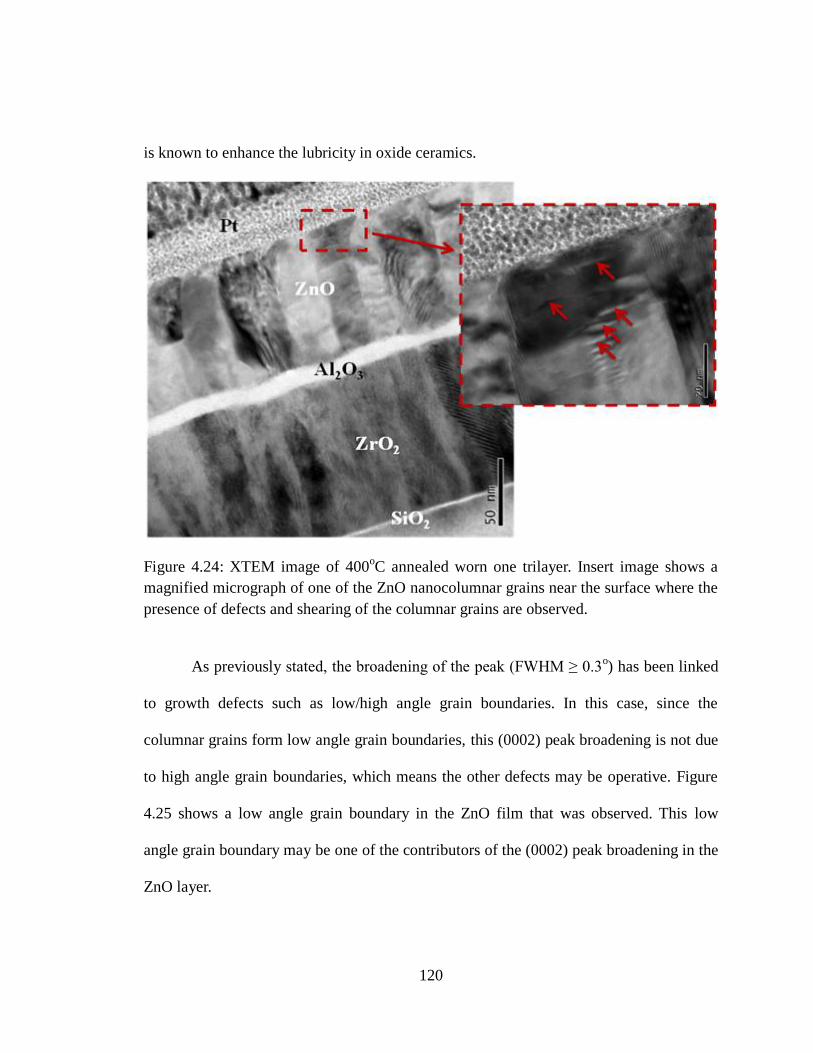
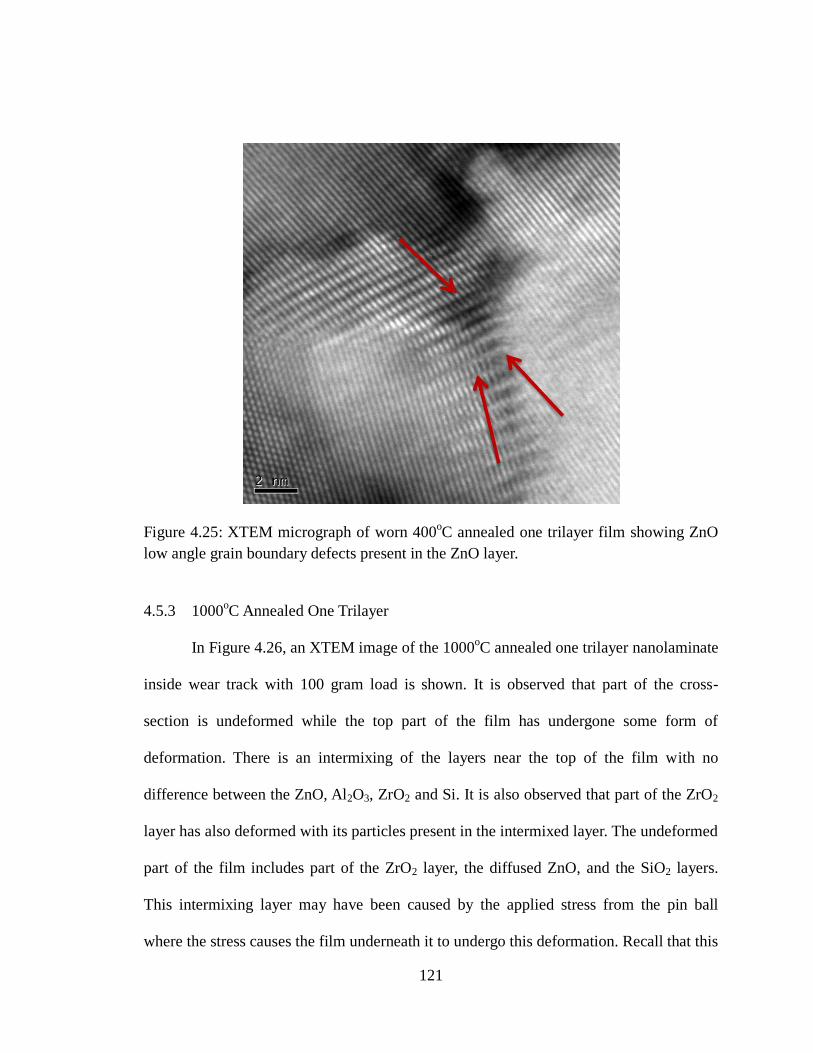


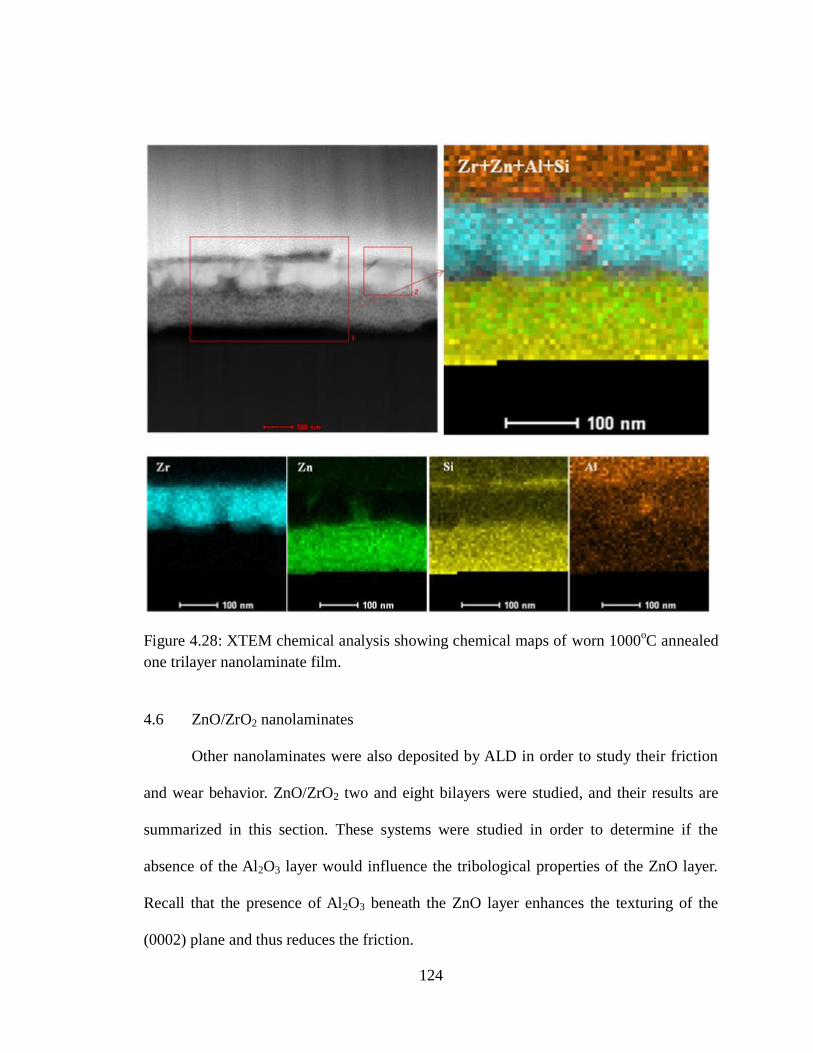
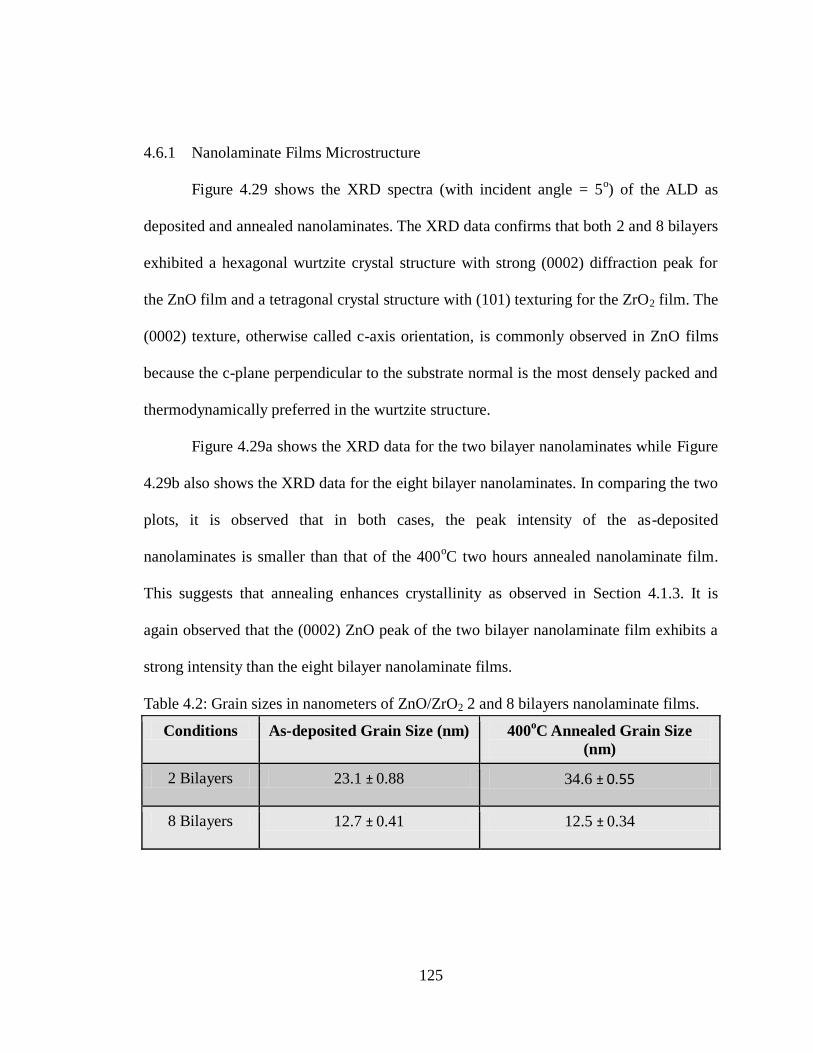


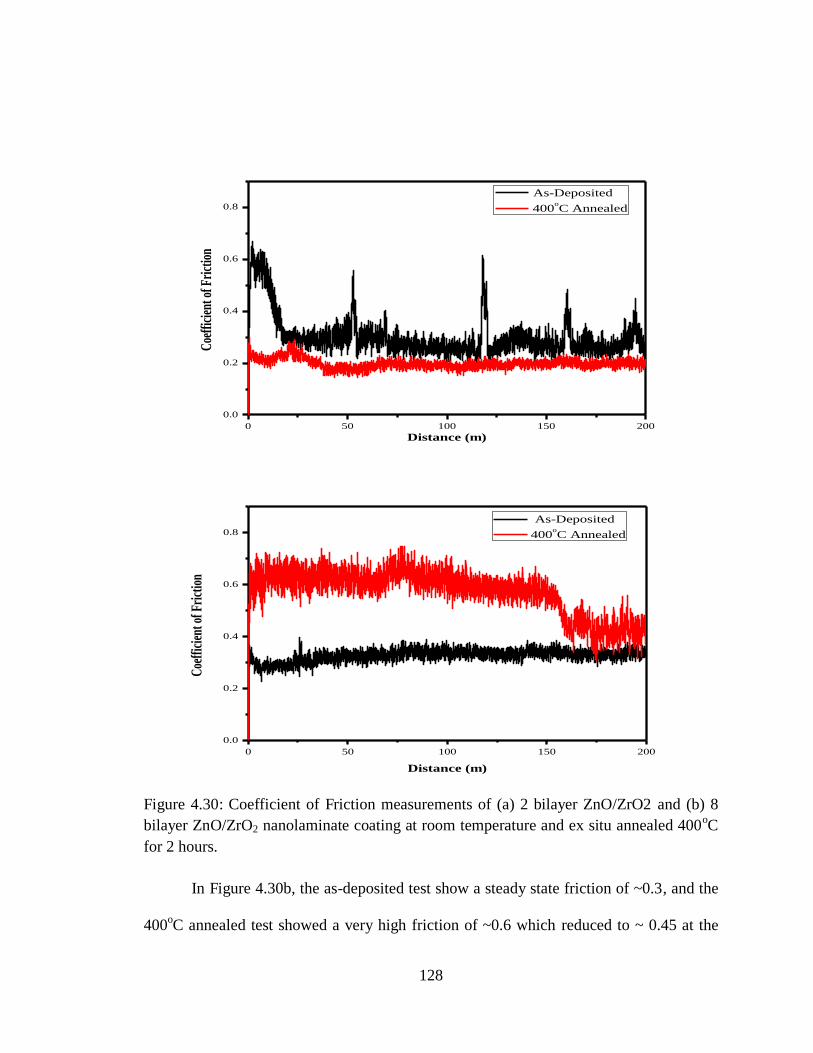


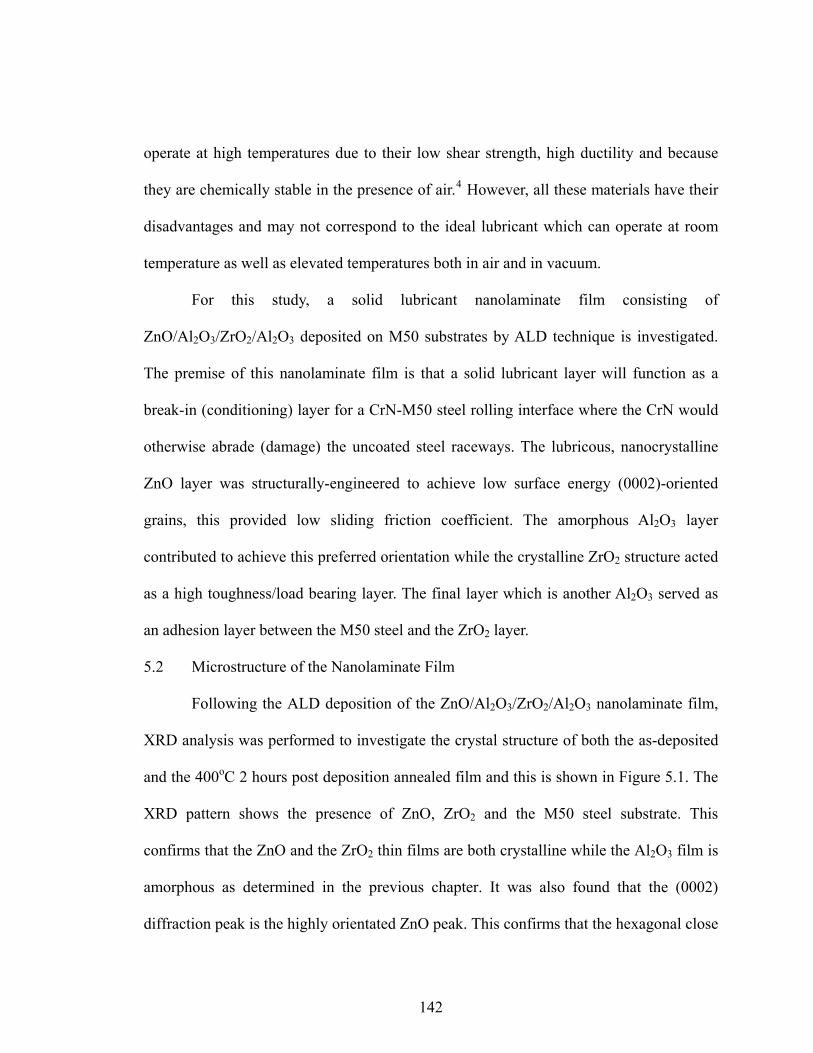

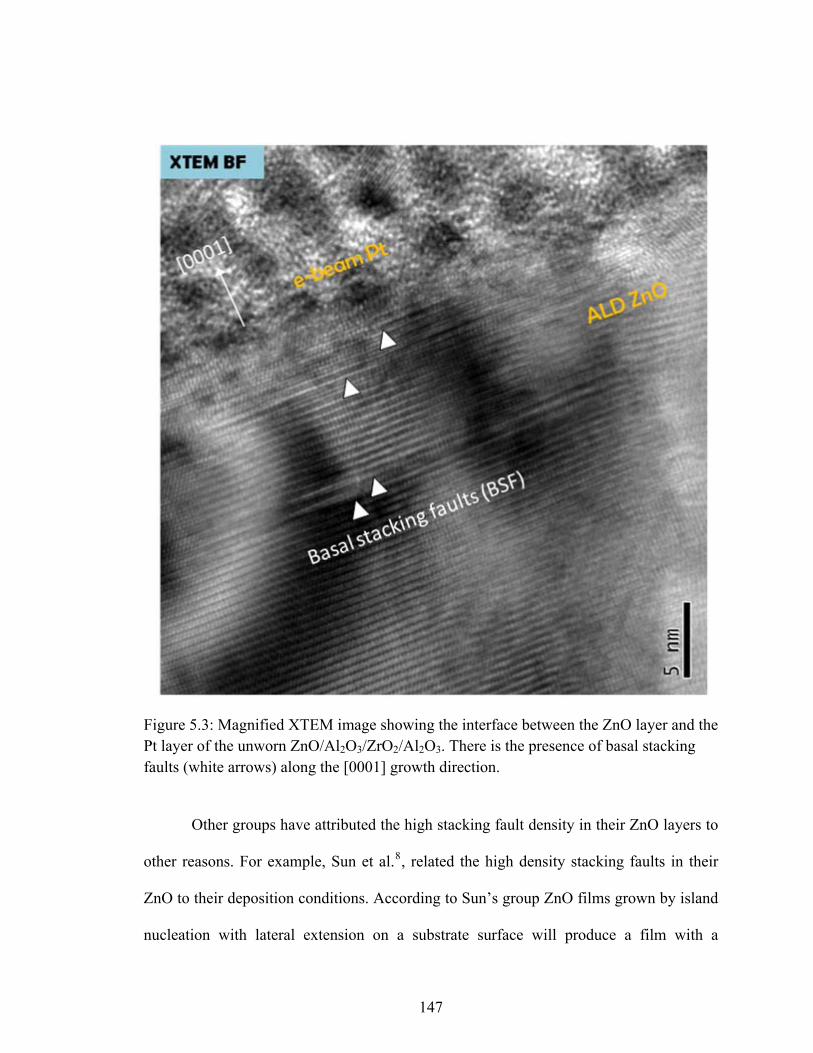


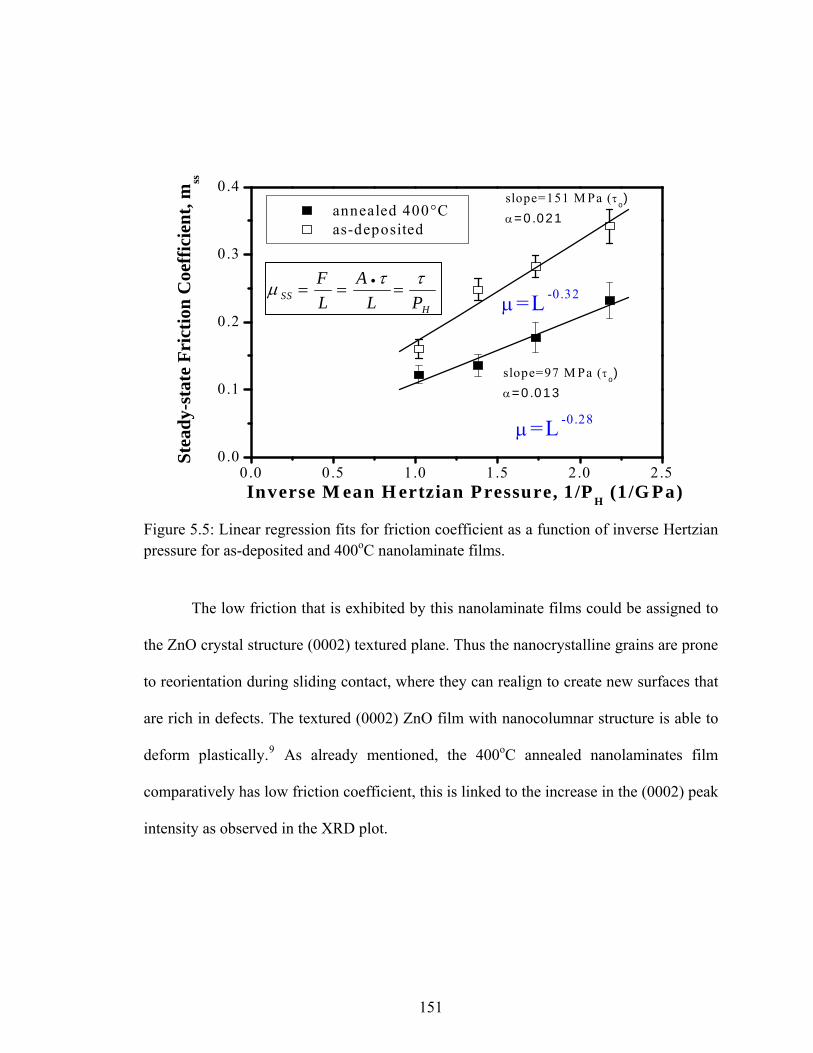


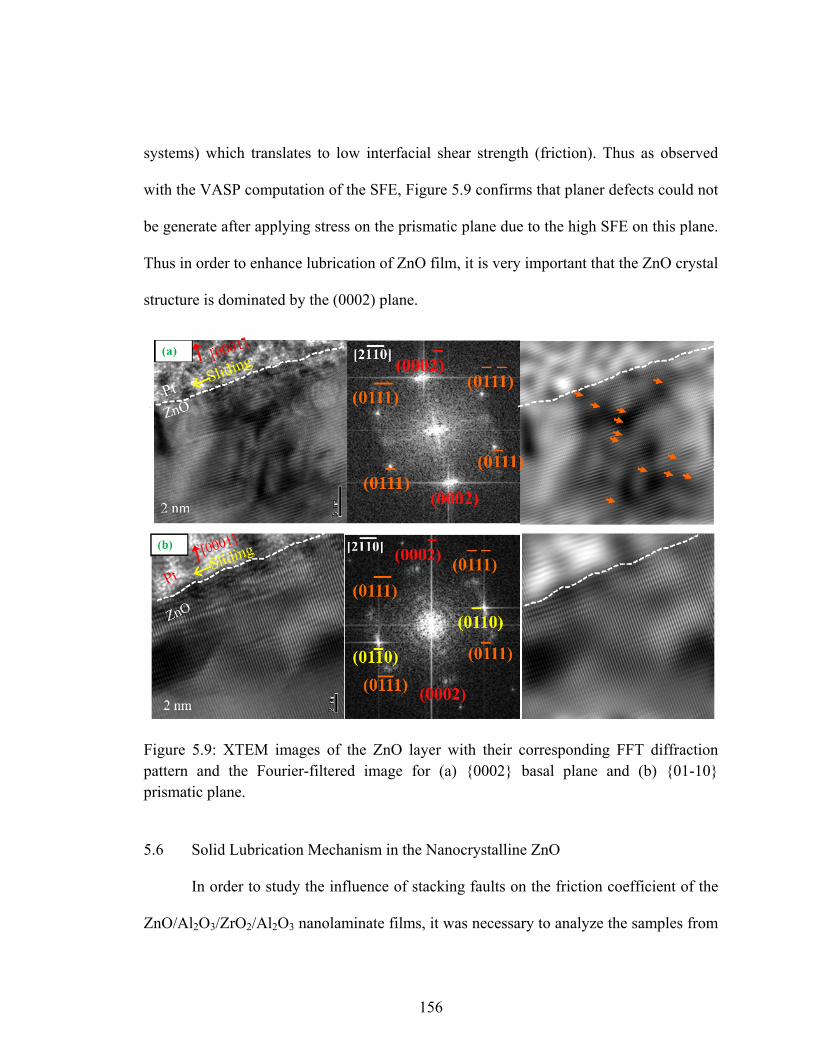
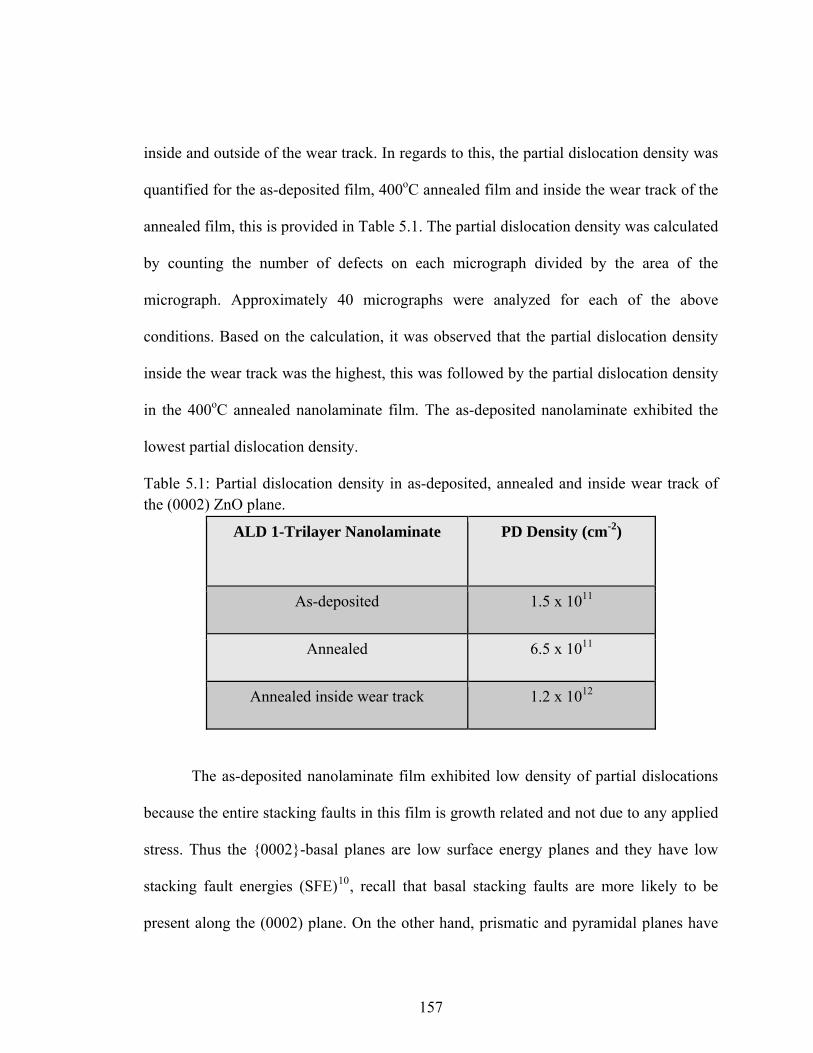

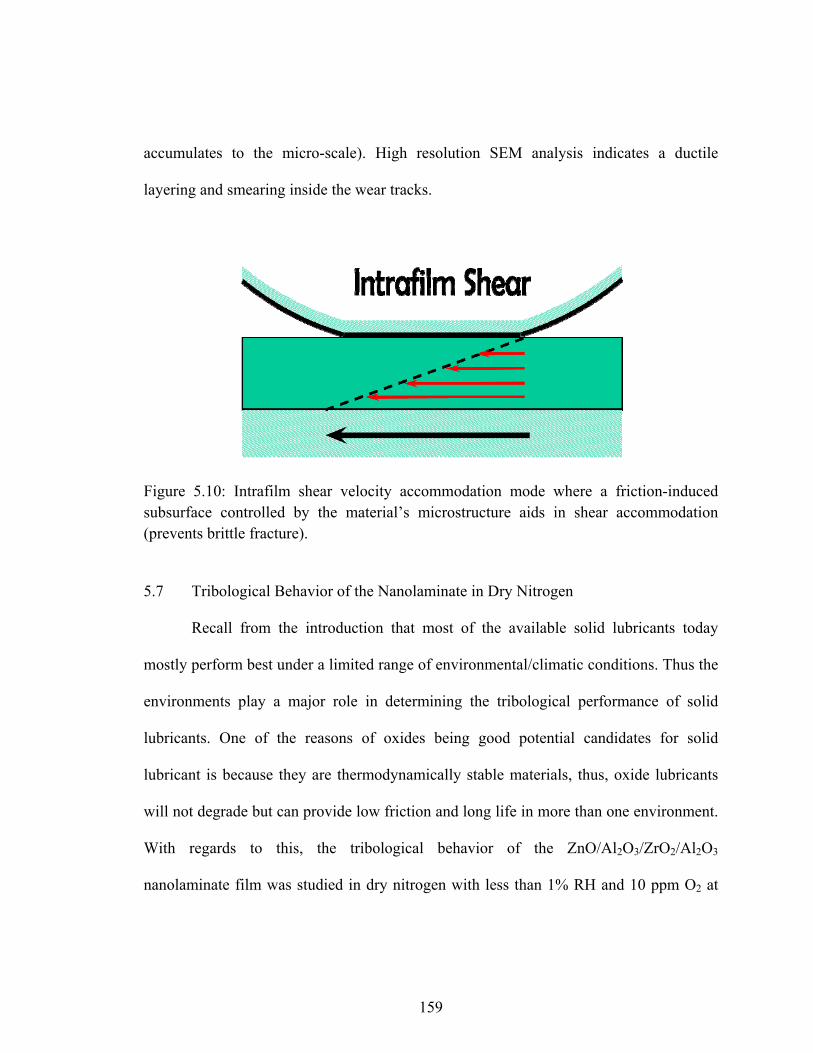

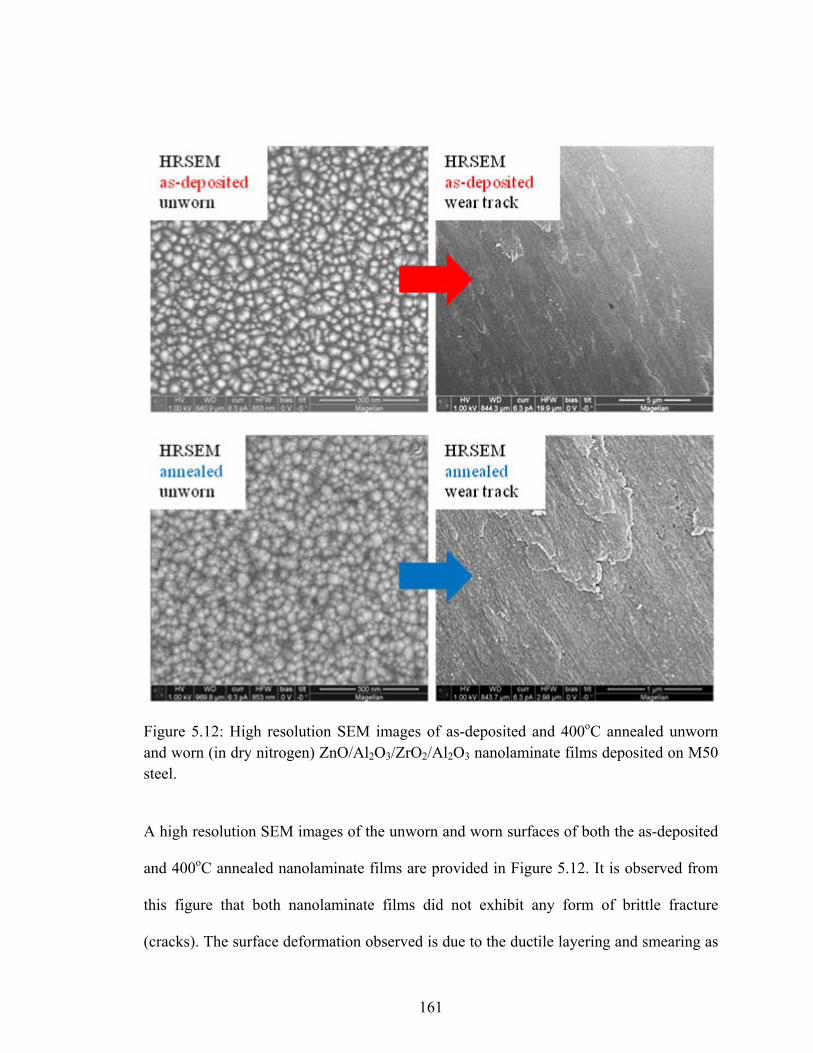
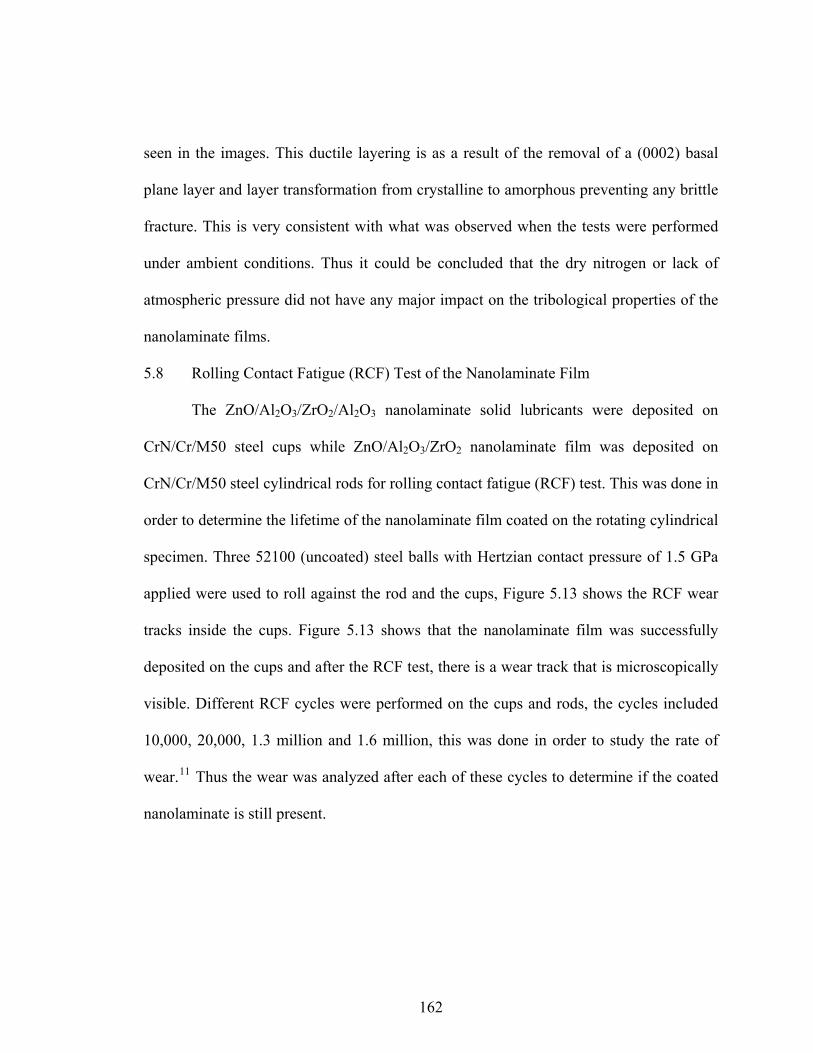
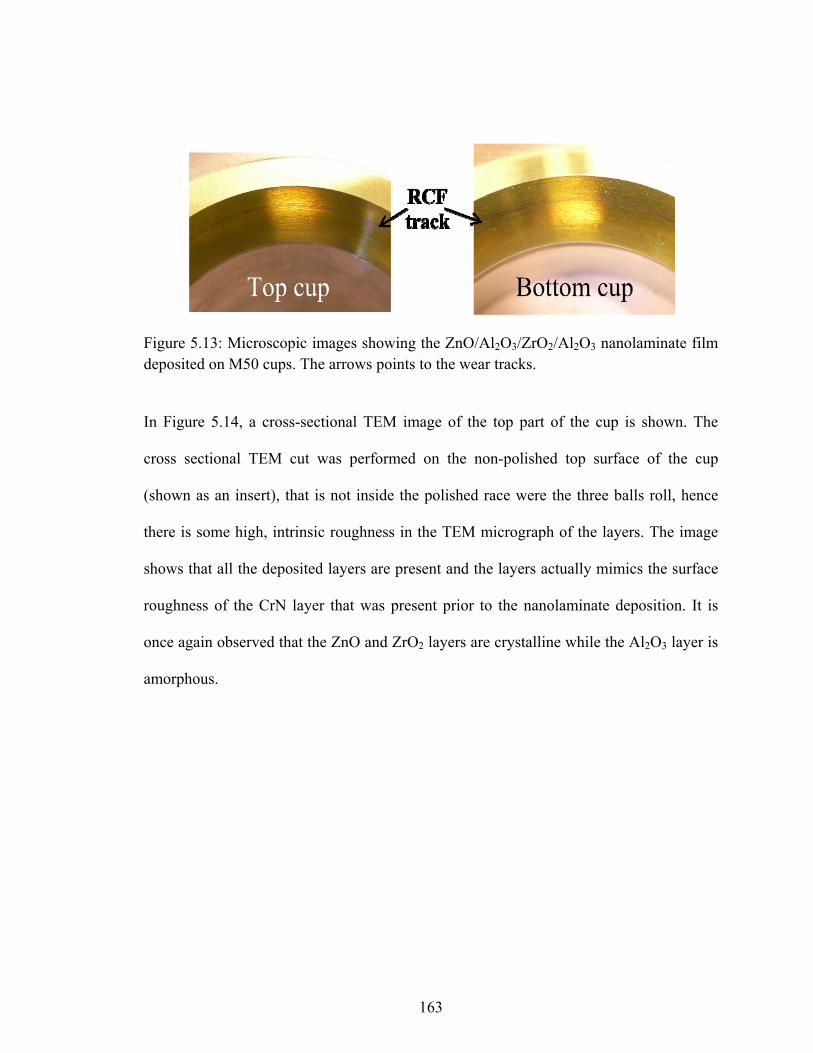
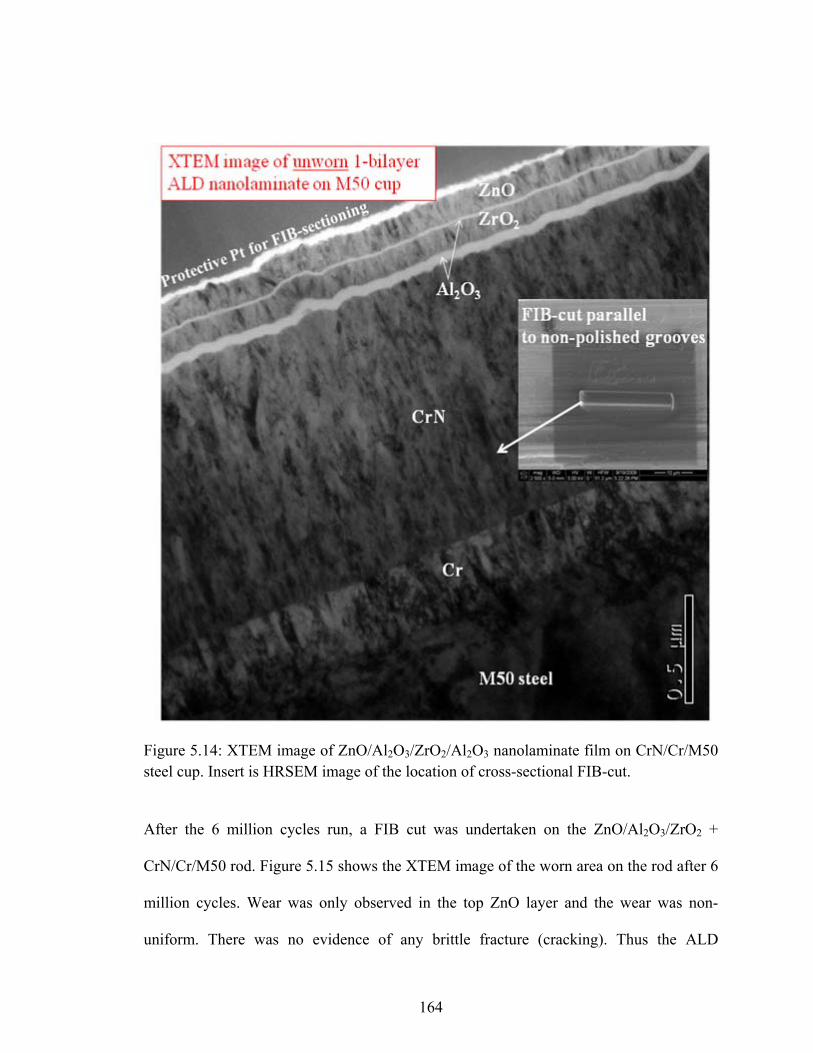


![5. Tribological Properties of Nanometric Atomic Layer … · 2015-02-02 · nitriding [16], and Atomic Layer Deposition [17]. ... temperature processes were chosen in order to ...](https://static.documents.pub/doc/80x56/5cd4f3e088c993de288d7055/5-tribological-properties-of-nanometric-atomic-layer-2015-02-02-nitriding.jpg)


