GRUNFELD, DESIDERIO, OFFICES: NEW YORK ¯ BOSTON LOS ANGELES ¯ WASHINGTON, D.C. AFFILIATED OFFICES: SHANGHAI ¯ BEIJING LEBOWITZ, SILVERMAN ~:~ COUNSELORS AT LAW I~01 NEWYORK AVENUE, N.W. ¯ SUITE 650 WASHINGTON, DC i~0005 TEL (;~02) 783-6881 BY I-lAND U.S. Department of Commerce Central Records Unit, Room 1870 14th St. & Pennsylvania Ave, NW. Washington, DC 20230 August 1, 2005 KLESTADT LLP FAX (;’OP) 783-0405 Attention: Joseph A. Spetrini Acting Assistant Secretary for Import Administration Re: Corrm~ents on the Department’s Labor Calculation Methodology Dear Acting Assistant Secretary Spetrini: These comments are filed on behalf of Grunfeld Desiderio Lebowitz Silverman & Klestadt, LLP ("GDLSK") in response to the U.S. Department of Commerce’s request for comment on the NME labor calculation methodology, as published in 70 Fed. Reg. 37,761 (June 30, 2005). An original and six copies of GDLSK’s comments are attached. These comments were also submitted by email.
Transcript
GRUNFELD, DESIDERIO,
OFFICES:
NEW YORK ¯ BOSTON
LOS ANGELES ¯ WASHINGTON, D.C.
AFFILIATED OFFICES:
SHANGHAI ¯ BEIJING
LEBOWITZ, SILVERMAN ~:~COUNSELORS AT LAW
I~01 NEWYORK AVENUE, N.W. ¯ SUITE 650
WASHINGTON, DC i~0005
TEL (;~02) 783-6881
BY I-lANDU.S. Department of CommerceCentral Records Unit, Room 187014th St. & Pennsylvania Ave, NW.Washington, DC 20230
August 1, 2005
KLESTADT LLP
FAX (;’OP) 783-0405
Attention: Joseph A. SpetriniActing Assistant Secretary for ImportAdministration
Re: Corrm~ents on the Department’s Labor Calculation Methodology
Dear Acting Assistant Secretary Spetrini:
These comments are filed on behalf of Grunfeld Desiderio Lebowitz Silverman &
Klestadt, LLP ("GDLSK") in response to the U.S. Department of Commerce’s request for
comment on the NME labor calculation methodology, as published in 70 Fed. Reg. 37,761 (June
30, 2005).
An original and six copies of GDLSK’s comments are attached. These comments were
responds to the United States Department of Commerce’s ("Department" or "DOC")
request for comment on the NME labor rate calculation methodology, published in 70
Fed. Reg. 37,761 (June 3’0, 2005).
Factual Background
On June 30, 2005, the Department of Commerce published a request for comment
on the nonmarket economy ("NME") labor rate calculation methodology. While the
Federal Register notice provides a summary of the calculation methodology in general,
the Department failed to :mention the impetus behind the request for comment. As such,
we begin with the facts.
Pursuant to 19 C.F.R. 351.408(c)(3), Commerce determines the surrogate value
for labor by using a regression-based analysis of the observed relationships between
wages and national income in market economy countries to estimate wage rates for NME
countries.l The regulation states, in its entirety:
Labor. For labor, the Secretary will use regression-based wage rates reflective ofthe observed relationship between wages and national income in market economycountries. The Secretary will calculate the wage rate to be applied in nonmarketeconomy proceedings each year. The calculation will be based on current data,and will be made available to the public.
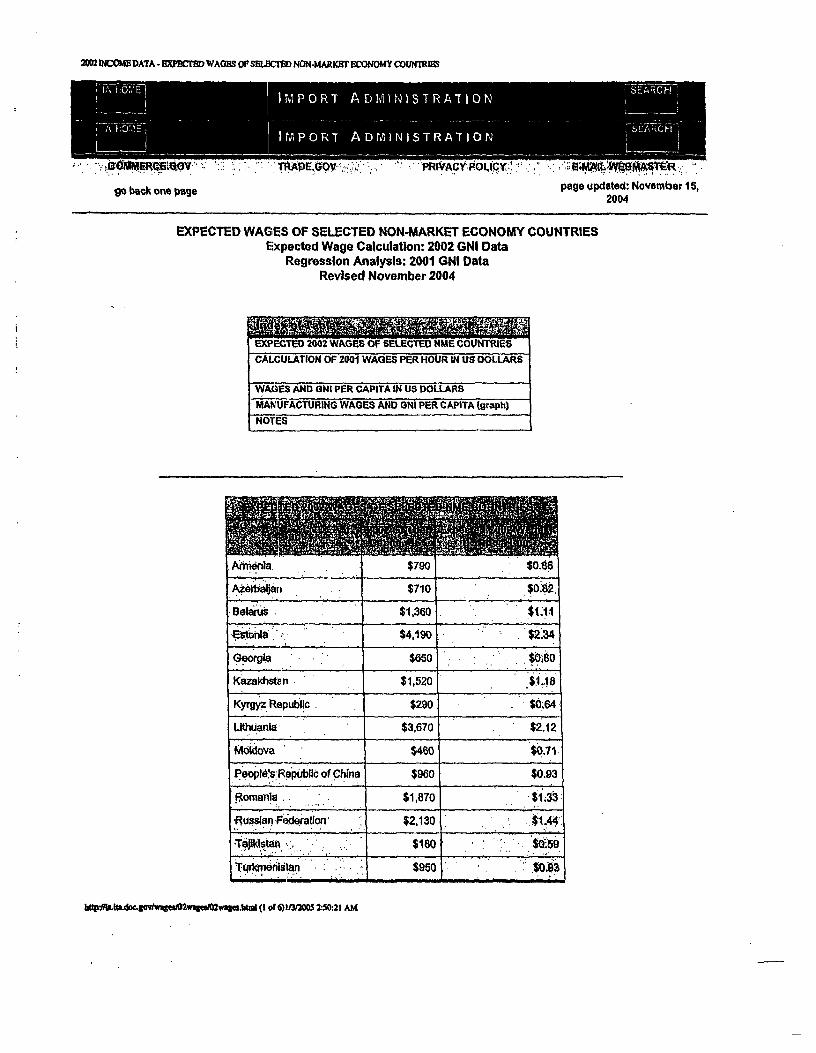
On October 6, 2004, the Department made its annual revision to the NME labor rate
calculation and posted updated 2002 wage and Gross National Income ("GNI") data.2
That information was posted on the Department’s website at
http://ia.ita.doc.gov/wages/index.html. The Department stated that the updated expected
wage rate for China, based on the new 2002 information, was $0.93~hour.
GDLSK argued in Wooden Bedroom Furniture from the PRC and Frozen and
Canned Warmwater Shrimp from the PRC that this regression analysis labor calculation
was improper because it :relied on Chinese GNI data, which Commerce deems
"unreliable" due to China’s non-market economy status. Se___ge Allied Pacific’s Case Brief
at pp. 37-39 (Oct. 19, 201)4). In addition, GDLSK noted that Commerce’s updated labor
calculation contained calculation errors and that it did not appear to utilize all available
2002 wage rate and GNI information.3 Id__~. GDLSK argued that, should the Department
continue to value labor u:fing its regression analysis based on wage rates and GNI for
countries throughout the world, it must disclose additional information and correct
specific errors in its calculation. Id__~. at 39-42. Finally, GDLSK noted that - simply using
the countries Commerce .acknowledged were included in its calculation - the 2002 data
should have yielded a surrogate labor value for China of $0.72 per hour rather than $0.93.
Id.
2 GNI was previously known as GNP (Gross National Product).3 The Department had no’I disclosed documentation underlying the Department’s data
points, it did not reveal t~te "X-Coefficient" or the "Constant" for the updated labor ratecalculation as it had done in past-years’ updates, and most importantly, the 2002 wagedata actually yielded an hourly rate of $0.72/hour, not $0.93/hour as stated by theDepartment. See Allied Pacific Case Brief_. at 39-40. Allied Pacific provided Commercewith a worksheet displaying its correction of the Department’s error. See id. at Exhibit 6.
2
On approximately November 1, 2004, Commerce removed from its web site the
back-up information for its original 2002 labor rate calculation. On November 15, 2004,
Commerce released a revised 2002 wage rate calculation. However, this revised
calculation removed the 2002 wage rate data and replaced it with the 2001 data from the
previous year. The Department continued to reach the $0.93/hour wage rate for China by
combining 2001 wage rate data and 2001 per-capita GNI data with 2002 GNI data for
China. Sere Commerce’s Notes on its surrogate wage rate calculation at
http://ia.ita.doc.gov/wage, s/index.html. The Department mixed 2001 and 2002 data
despite the fact that 2002 data was readily available. Commerce had never previously
mixed data from separate years, and it provided no explanation for this deviation in its
methodology.
In notes accomp~aying its revised labor rate calculation, Commerce stated that it
relied on wages reported in the Yearbook of Labor Statistics 2002 (Chapter 5B),
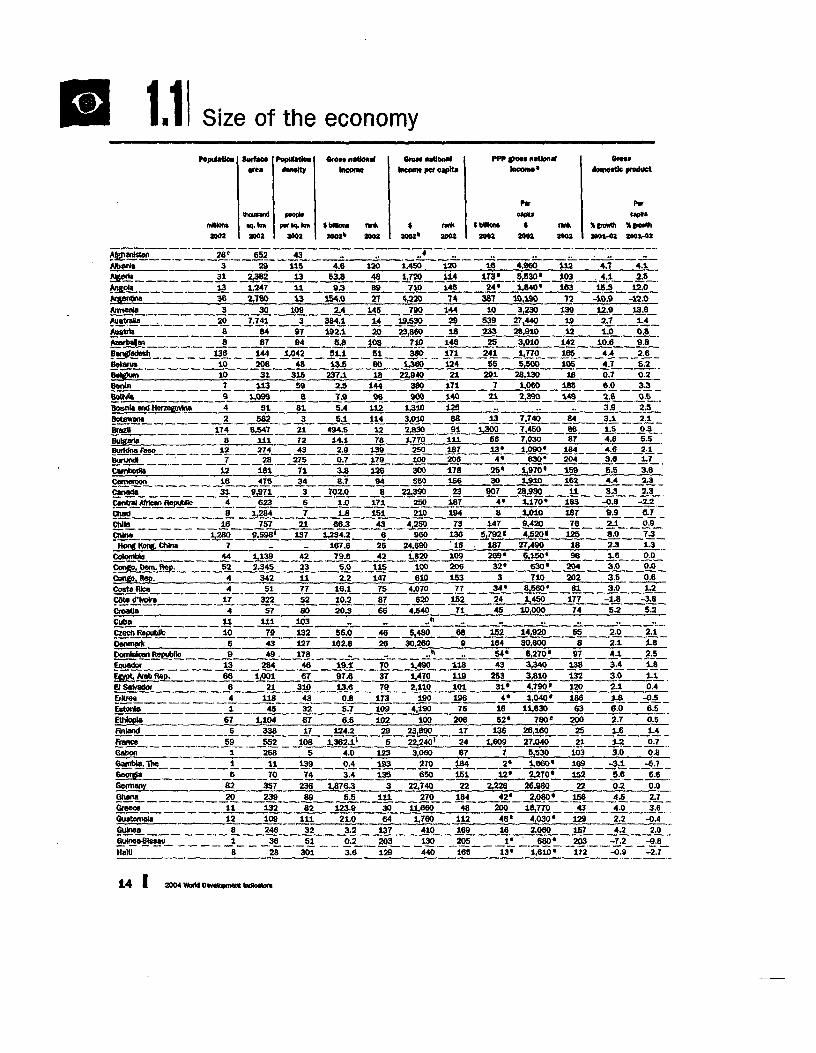
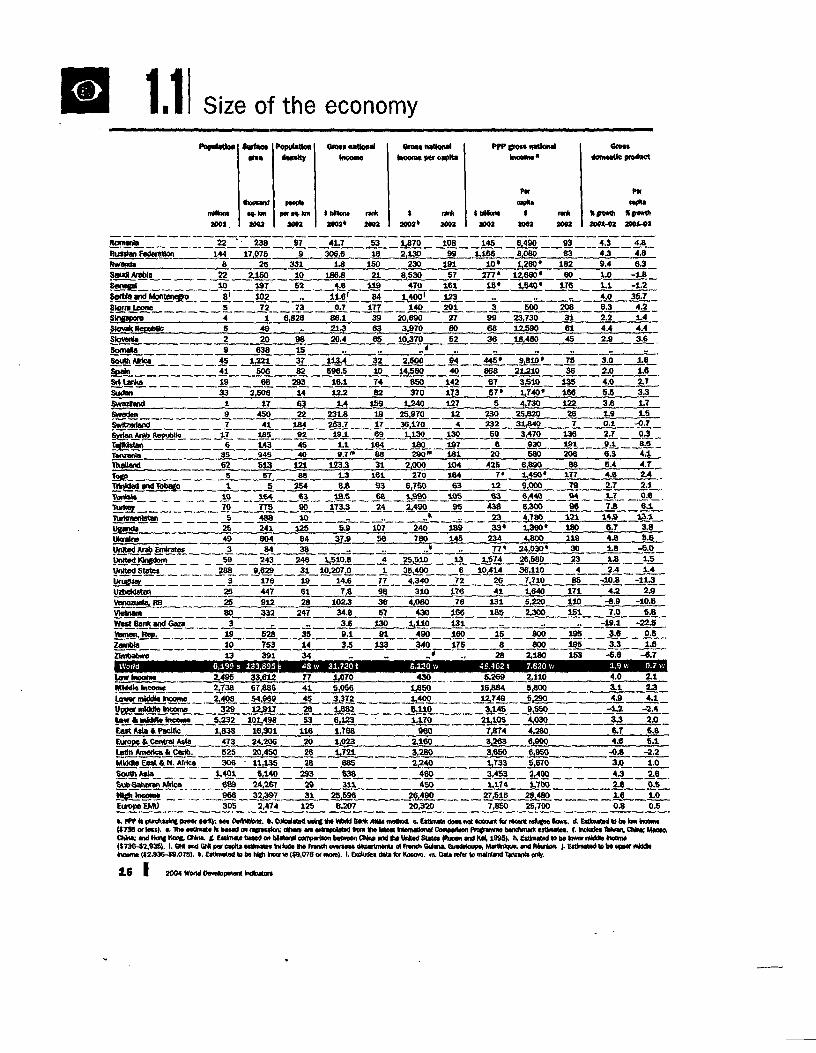
published by the ILO, which includes wage rates from 1996-2001. Id___~. Per-capita GNI
for 2001 for market econ,~my countries was taken from the 2003 World Development
Indicators, and per-capita, 2002 GNI for China was taken from the 2004 World
Development Indicators, published by the World Bank. Id_.~. However, Commerce failed
to mention that 2002 per-capita GNI data was available from the 2004 World
Development Indicators, and 2002 wage data was available from the Yearbook of Labor
Statistics 2003 or the ILO’s website.4 Thus, the very same sources Commerce used for
its hybrid 2001/2002 calculation would have enabled Commerce to perform the
calculation based solely on the more current 2002 data, as it had originally claimed to do.
4 Wages by country for Chapter 5B (manufacturing wages) are available on-line at the
ILO’s website, at http://l~tborsta.ilo.org/.
In its Final Determination in both Furniture and Shrimj2, the Department
explained that it needed raore time "to determine an accurate construction of a new
dataset and to conduct a new regression analysis." Id___~. at 18. However, Commerce did
not explain why it required more time to review this particular calculation, and it did not
state how much time would be required.
The Department’s labor calculation was appealed to the Court of International
Trade in both the Furniture and Shrimt~ cases. In both cases, the Department consented
to a remand on this issue, stating "[u]pon further review of this issue, it appears that
Commerce’s calculation ,~f the labor wage rate may be erroneous and in need of
recalculation." Allied Pacific v. United States, Court No. 05-00056; See also, Dorbest
Ltd., Rui Feng Woodwork (Dongguan) Co., v. United States, Court No. 05-0003; ~
SKF v. United States, 254 F. 3d 1022 (Fed. Cir. 2001) (a remand is appropriate when the
agency has doubts about the correctness of its decision.).5
Finally, on June 30, 2005, the Department published a request for comment on the
wage calculation methodology. The request, however, makes no mention of its errors in
the calculation of the 20132 Chinese labor rate. Instead, the request gives background
information about how tPte wage calculation is made in general and proposes new NME
wages for 2003.
~ Despite requesting a remand in these appeals and acknowledging errors in its calculation, the Departmenthas continued to use the "revised" 2002 labor calculation based on the 2001 data in each Chinese case sinceFurniture, including the final results of Administrative reviews.
Proposed Modifications
The Department’s 2003 Wage Rate Calculation Should Include All Available Data
The Department’s proposed 2003 wage rate calculation remains flawed because it
does not use all available wage and GNI information.
As discussed above, Commerce states on its website that it obtains country-wide
labor rates from the Yearbook of Labor Statistics, and that it obtains per capita GNI data
from World Development Indicators. See Commerce’s Notes regarding its regression
based labor calculation at http://ia.ita.gov/wages.html. The 2003 data set used in
Commerce’s calculations contain per-capita GNI and wage data from 52 market economy
countries.6 Id.__~. However, the Yearbook of Labor Statistics and the World Development
Indicators include per-capita GNI and wage data for numerous other countries that
Commerce did not use in its calculation. In fact, these two sources contain the necessary
information meeting the Department’s criteria for 66 countries.7 Commerce, however,
inexplicably ignored the available 2003 data from 14 of the 66 countries.8
Commerce has off’ered no explanation for the exclusion of this available data from
these additional 14 countries, and its omission directly conflicts with Commerce’s
justification for adopting the regression based calculation. When adopting its regulation
6 For the 2003 calculation, the Department dropped the Dominican Republic, Algeria and
Kenya because ILO wage., rate data were not available for these countries in the instantdataset. Commerce also dropped Zimbabwe because 2003 GNI data were not available.7 The Department requires that each country’s wage data is no more than 6 years old.
The Department also requires that each country has available a consumer price index.See Request for Comment on Calculation Methodology, 70 Fed. Reg. 37761 (June 30,2005).8 Per capita GNI and wage data from the past six years were also available for the
following countries that Commerce did not use in its calculation: Albania, Cambodia,Czech Republic, Denmark, Hungary, Indonesia, Iran, Kazakhstan, Kuwait, Latvia,Macedonia, Mongolia, Slovakia and Uruguay.
for use of a regression ba:sed wage rate, the Department stated, "we believe that more
data is better than less data" and "the regression-based approach will yield a more
accurate result" because it relies on multiple countries. Notice of Final Rule Making, 62
Fed. Reg. at 27,367. Cle~u’ly if more data is better than less data the Department should
use the information from the 14 other countries whose data is available from the same
sources.
In addition, it is widely accepted that the omission of available data in a
regression analysis results in biased and distorted results. See, e.g., JAN KMENTA,
ELEMENTS OF ECONOME’~RICS at 341-344 (1971). See also, Report of Daniel W. Klett,
included as Exhibit 1 to this letter; Report of Dr. Tapan K. Nayak, included as Exhibit
2. Thus, the exclusion of data from certain countries cannot be reconciled with
Commerce’s use of a reg~ession-based calculation. This fact is especially pertinent in the
instant case since Commerce’s methodology purports to calculate a "worldwide"
relationship between was;es and GNI. The calculation cannot be said to be "worldwide"
if 14 out of the 66 countr:ies whose data is published in the sources used by the
Department are omitted without justification.
Furthermore, the ]Department’s error cannot be explained away by arguing that its
choice of 52 countries is a random sampling. First, in any random sampling, "standard
errors decrease as sample., size increases." Report of Dr. Tapan K. Nayak, included as
Exhibit 2. As such, using the data from 66 countries would lead to more accurate results
than using 52 countries. Second, record evidence indicates that the 14 countries the
Department disregarded were not excluded randomly because these countries have been
disregarded without expl~ation in prior years as well. See
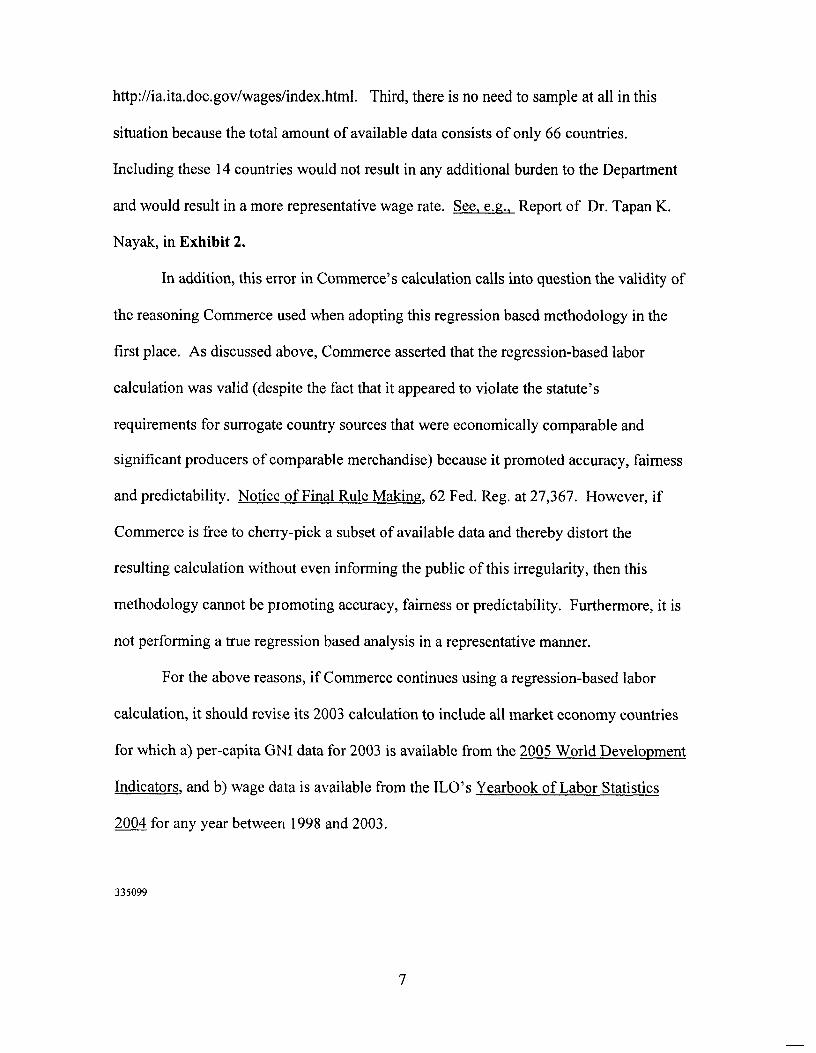
http://ia.ita.doc.gov/wages/index.html. Third, there is no need to sample at all in this
situation because the tota]i amount of available data consists of only 66 countries.
Including these 14 countries would not result in any additional burden to the Department
and would result in a more representative wage rate. See, e.g., Report of Dr. Tapan K.
Nayak, in Exhibit 2.
In addition, this error in Commerce’s calculation calls into question the validity of
the reasoning Commerce used when adopting this regression based methodology in the
first place. As discussed above, Commerce asserted that the regression-based labor
calculation was valid (despite the fact that it appeared to violate the statute’s
requirements for surrogate country sources that were economically comparable and
significant producers of comparable merchandise) because it promoted accuracy, fairness
and predictability. Notice of Final Rule Making, 62 Fed. Reg. at 27,367. However, if
Commerce is free to cherty-pick a subset of available data and thereby distort the
resulting calculation without even informing the public of this irregularity, then this
methodology cannot be promoting accuracy, fairness or predictability. Furthermore, it is
not performing a true regression based analysis in a representative manner.
For the above reas,~ns, if Commerce continues using a regression-based labor
calculation, it should revise its 2003 calculation to include all market economy countries
for which a) per-capita GNI data for 2003 is available from the 2005 World Development
Indicators, and b) wage da.ta is available from the ILO’s Yearbook of Labor Statistics
200~4 for any year between 1998 and 2003.
335099
Exhibit 1
Rolmrt of Daniel W. Klett, PrincipalCapital Trade, Incorporated
Dcpaxtmcnt of Commeme NME Wage Methodology
I. Introduction
I have bccn retained by Grunfeld Desiderio to provide an opinion on the statistical
reliability of the most r~ccnt regression-based methodology used by the Department of
Commerce ("Commeros") to value non-market-economy (NME) wage rates. My
background is included as Attachment I to this report.
Pursuant to 19 CFR 351.408(c)(3), the Department relies on rogreasion analysis of
the observed relationships between wages and national income in market economy
countries to estimates wage rates for non-market economy counaics in anfidumping duty
investigations. This re,relation also states that "The calculation will be based on current.
data, and will be made available to the public." In its response to comments on this
proposed change to its methodology for valuing NME wage rates, the Department stated
that "In general, wc bcliicvc that more data is better than less data, and that averaging of
multiple data points (or regression analysis) should lead to more accurate results in valuing
any factor of productiott.t
The most recent estimates by Commerce for NME wages is based on a regression
of market economy 2001 wages and per capita Gross National Income (GNI), the results of
which are applied to 2002 per capita GNI for NMEs to estimate NME wages.2 Previous
estimates reliexi on contemporan .�~..us years for both market economy and NME data.3
There are two issues addressed below regarding the methodology for the current
estimates ofNN~ wag¢;s. First, why is Commerce relying on 2001 markct economy data
t 62 FR 27367 (May 19, 1997).2 See Attachment 2, a PDF version of the November 15, 2004 updates of NME wages for 2002.~ See htlp://ia.ita~.doc,gov/w~gc.s/index.html, accessed on January 3, 2005,
1
when more current data are available, and is it appropriate to apply the regression results
from 2001 market economy data to 2002 NME GHI data7 Second, why are datapoin~
from some market economies for which data are available excluded from the regression
analysis~ and what does this mean for the reliability of the statistical results?
II. Reliance on Non-Current 2001 Market Economy Data
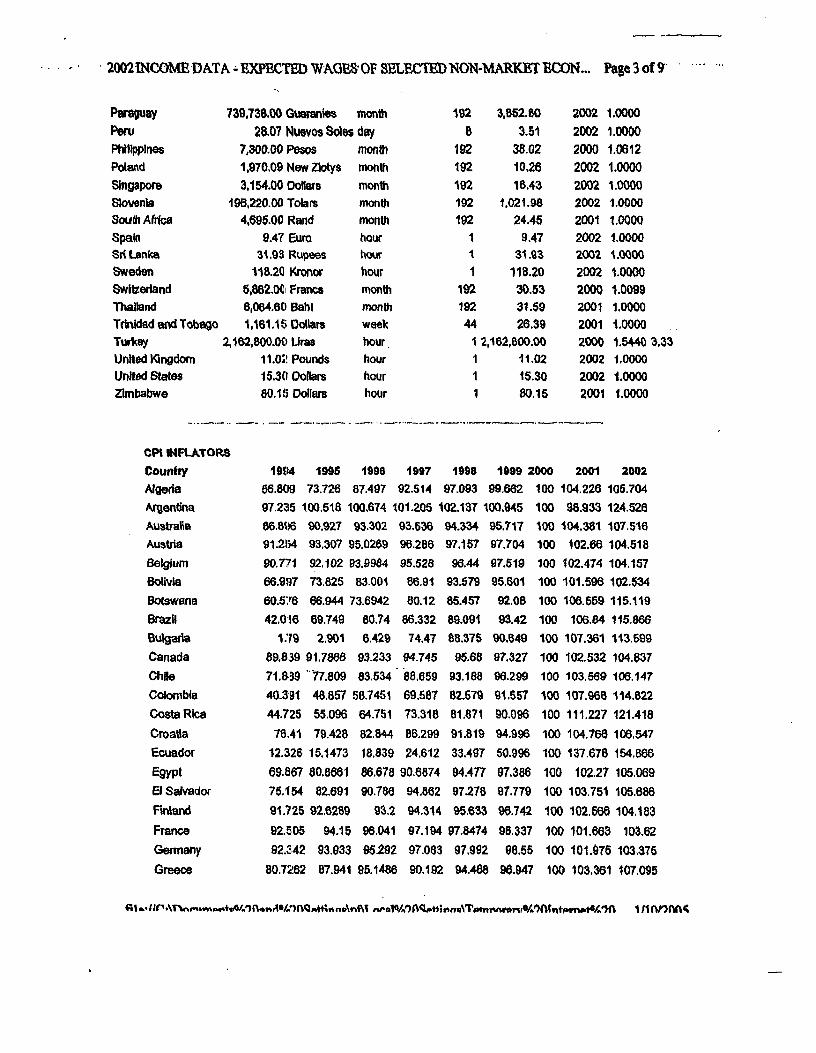
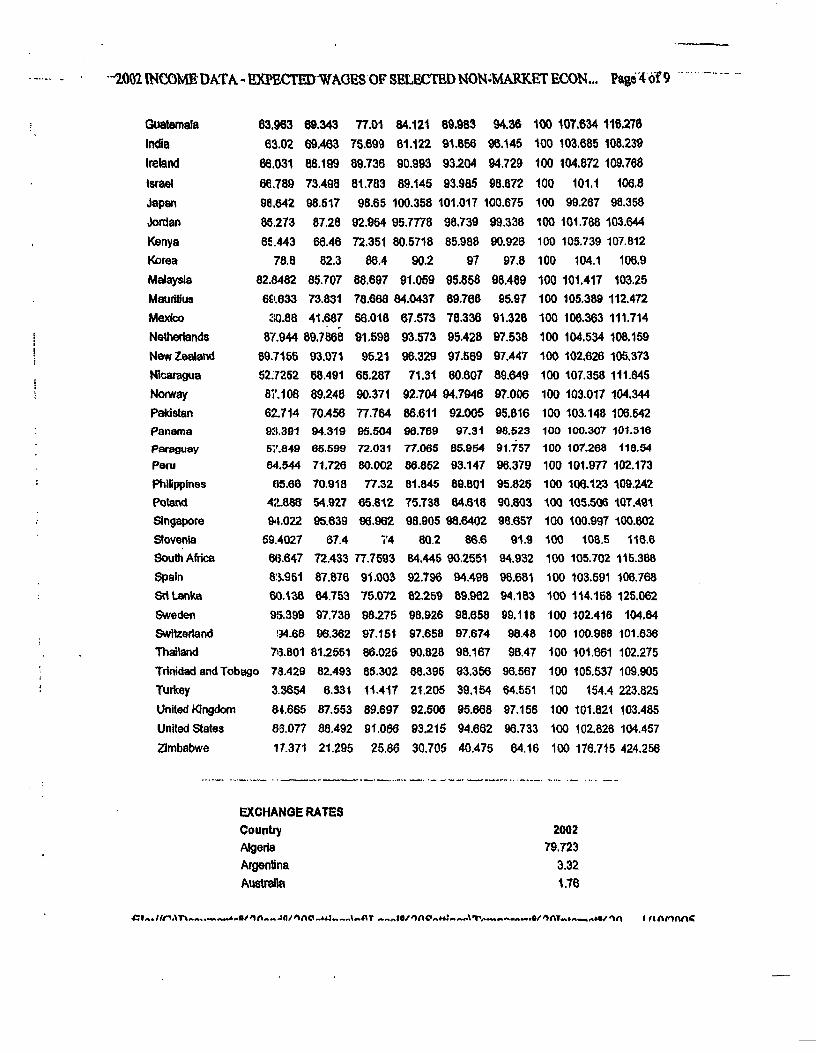
In notes supporting its calculations, Commerce reports that it has relied on wages
reported in the yearbook of.Labour Stati.stics. 2092 (Chapter 5B), published by the ILO. It
states that it included repotted wage rates for the years 1996 to 2091, Data for years prior
to 2001 are inflated to 2001 based on consumer price indices of the I.ntematio.nal ,Financial
Statistics Online Service. Per capita GNI for 2001 for market economy countries was from
the 2003 3Vo~ld.D.ev.e.lopment Indicators, and per capita 2002 GNI for NMEs was from the
2004 World D~velopm_ent Indietors, published by the World Bank.4
Commerce provides no rationale for why it has relied on 2001 data for the market
economy regression, when data are available for 2002 per capita GNI from the 2004 World
Development Indicators_, and for many countries 2002 wages from the Yearbook of Labour
Statistics 2003 or the ILO’s website,s This runs counter to the Department’s own
regulations that the annual re-calculation of the wage rote be based on "current data."
Furthermore, application of the 2001 market-economy regression results to 2002 NME per
capita GNI is an apples-to-oranges comparison that departs (with no explanation given
since 2002 market economy data are available) from how NME wages were estimated in
4 See Attachment 2.s See Attachment 3 Table 1. i from the World.De.vel0pme~t Indicato~. Commerce did present 2002 data formarket economy wages and per capita GNI in a prior estimate on its website posted in October 2004, butthese data were withckawu after a critique by t~pottdents i~ the investigation involving furniture from Chinawhich could not replicate the ,Commerce results. Wages by country for Chapter 5B {manufacturing wages)ate available on-line at the ID3’s website, ate. Data from this source is included inAttachment 4, which has been~ modified to exclude lines other titan ’~otal" wages.
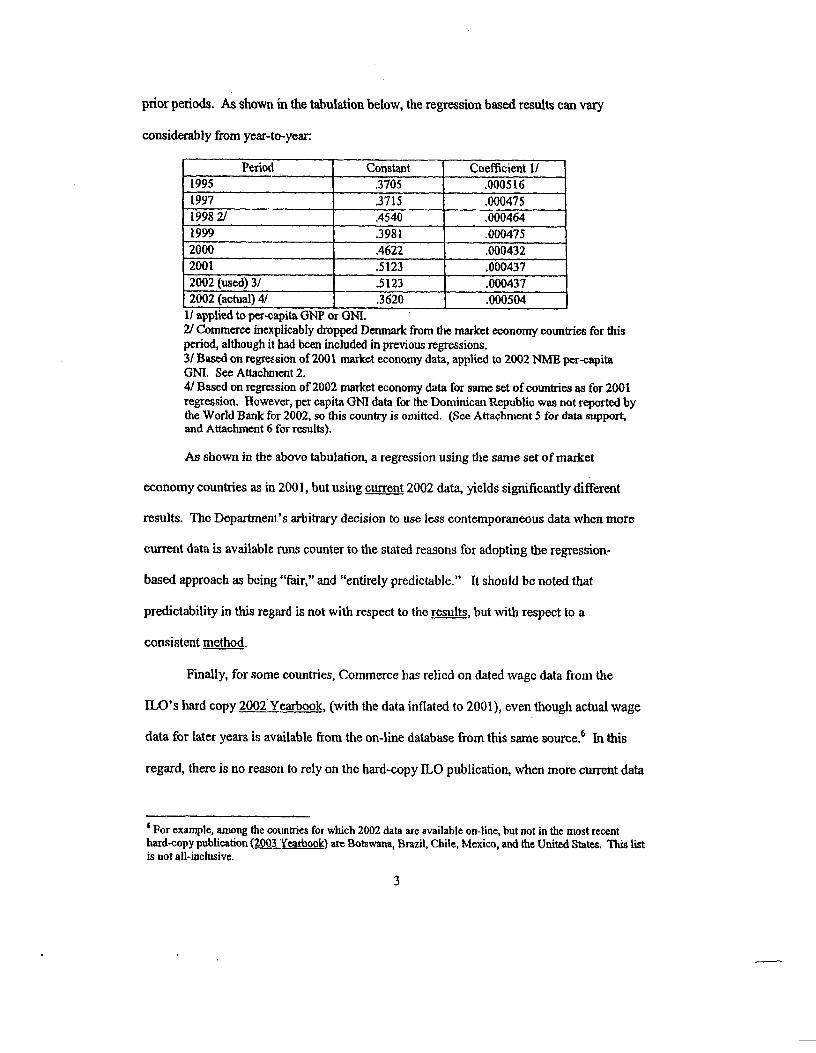
prior periods. As shown in the tabulation below, the regression based results can vary
1/applied to per-capita GIqP or GNI.2/Commerce inexplicably dropped Denmark from the market economy cotmtdes for thisperiod, although il had been included in previous regressions.3/Based on regre~zion of 2001 market economy data, applied to 2002 NME per-capitaGNI. See Attaelmlent 2.4/Based on regression of 2002 market economy data for same set of eountriea as for 2001regression. However, per capita GNI data for the Dominican Republic was not report~ bythe World Bank for 2002, so this country is omitted. (See Attachment 5 for data support,and Attachment 6 for results).
As shown in the above tabulation, a regression using the same set of market
economy countries as in 2001, but truing curren_._.__[ 2002 data, yields significantly different
results. The Department’s arbitrary decision to use less contemporaneous data when more
current data is available runs counter to the stated reasons for adopting the regression-
based approach as being "fair," and "entirely predictable." It should be noted that
predictability in this regard is not with respect to the result____._~s, but with respect to a
consistent method.
Finally, for some countries, Commerce has relied on dated wage data from the
IT,O’s hard copy 2002 Yearbook, (with the data inflated to 2001), even though actual wage
data for later years is available from the on-line database from this same source.6 In this
regard, there is no reason to rely on the hard-copy ILO publication, when more current data
* For example, among the countries for which 2002 data are available on-line, but not in the most recenthard-copy publication (2003 ’t’eathook) are Botswana, Brazil, Chile, Mexico, and the United States. This listis not all-inclusive.
are available from this stone source on the ILO website. Reliance on the wcbsite data will
not result in Commerce continuously having to update its estimates when/if more current
data are made available on-line, since it is dear that its estimates arc re-calculated only on
an annual basis. There it; no reason to not rely on the most up-to-date data available when
the estimates arc made, particularly give the Department’s regulations that the estimates be
based on "current" data. The online data is available to all potential respondents around
the world who have intemet access, thereby allowing respondents to have access to the
same data as the DOC, thereby enabling theau to better predict the annual wage rate
calculation.
III. Commerce Has lu-bi.trarily ~elected a Subset of Market Economy Data,....WM.’.chDistorts its Results and Undercuts the Representativeness of the DOC’s CalculatedWorldwide Relationship Between Wages and Db~.
In its notes to its NME wage rate calculations for 2002, Commerce states that "the
selection of countries was based upon the availability of wage data as reported in the
Yearbook of Labor Statit;fi~cs 2002." The notes also state that countries reporting wages
for the years 1996 to 2001 are included in the analysis, In its latest calculation, Commerce
relied on per-capita GNI and wage data from 56 market economy countries.7 However,
ther~ arc a significant number of market economy countries that were excluded from the
analysis, where per-capila GNI was available from the _W_orMDevelopment Indicators and
manufacturing wage data were available from the ILO. These countries are:
AlbaniaBangladeshCambodia
Czech Repubii~KuwaitLatvia
Saudi ArabiaSerbia & M~nteuegro
SlovakiaSwaziland
7 See Attachmem 2. The note, indicate that it used eounlzies where &t~ were available from 1996 to the year
at issue. Where the most rectum wages were for a year prior to that for which the regression was applied, thewages were inflated based on consumer price indices. As discussed in the section above, there is no basis forrelying on the 2002 yearbook of,Labour Statistics when more current data ate available from tile 2003Yearbook, and on the ILO’s website.
Denmark Macedonia Uruguay: : Mon o a ......
[ . Hungary Portugal .Indonesia . [. Rwanda
"* Kazakstan received market e~onomy status in 2001 so should be in the list of
market economy countries for a 2002 regression-based analysis of wages.
There is no reason why data from these countries should be excluded, given
Commeree’s position that "more data is better than less data" when supporting its use of
the regression-based methodology.8 Furthermore, the exclusion of these datapoints from
the analysis seriously uttdermines the reliability of the results for statistical reasons. It is
well known that the resttlts of a regression with missing values is biase(l.9 In fact, the
distortion can be confir~aed by evaluating the results with and without data from these 22
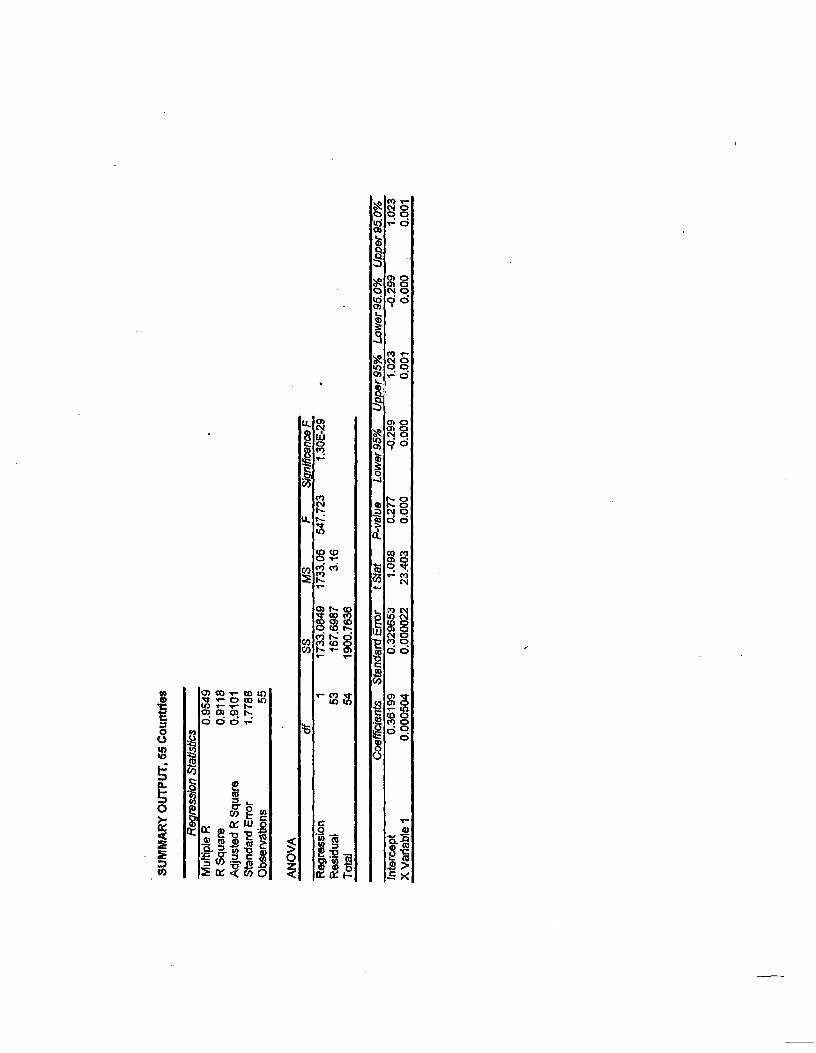
countries, as shown in the following tabulation (based un 2002 market economy wage and
per capita GNI data):to
- Constant GNI Coefficient ....
77 Countries .045 .000533
Since the DOC’s methodology purports to calculate a worldwide relationship
between wages and G~ using only a subset of countries for which data is available does
not yield a representative relationship. As demonstrated above, using the 2002 wage and
GNI data from the countries selected by the Dec versus all countries for which data are
available yields a differettt result. Thus, the Department’s use of only a subset of the
countries for which data. are available does not yield a correlation between wage and GNI
for all countries for whi,~h data is available. Any resulting estimated surrogate wage rate
t 62 FR 27367 (May 19, 1997).9 See. e.g., Elements of Ecovometrie. Jan Kments, 1971, at 341-344 (see Attachraent 7).to See Attachment 5 fo~ data and Attachment 6 for results.~’ There is no 2002 per capita GNI data available for the Dominican Republic in the most recent WorldDevelopment Report, which is why wc include only 55 of the 56 countries that the Department used based on2001 dat~
using the results of a regression calculation based on only a subset of available datapoints
is therefore based on a statistically unrepresentative ealculatiorL
W. Conclusion
For the above reasons, Commerce should revise its 2002 wage rates for NME’s
based on using 2002 per capita GNI data from the 2004 ~orld Development Ind.i.eators,
and the most current wage rate data from the ILO 0uard copy and on-line), inflated to 2002
when necessary. Commerce should also include in its regression-based wage analysis all
market economy countries for which: a) per capita GNI data for 2002 is available from the
World Development Indicators, and b) wage data is available from the ILO for any year
between 1996 and 2002.
D~aiei W\Klett" Date
6
Attachment I
D E
DANIEL W. KLETT
EDUCATION
1985, M.A., Ecor~omics, Georgetown University1976, B.A., Economies, College of the Holy Cross
EXPERIENCE
Mr. Klett is a principal wilh Capital Trade, Incorporated. His background is in internationaleconomics and trade regulation, wi~ specific expertise in assessing the economic impact ofimports on U.S. ind~s~ics and consumers. He has participated in studies involving U.S. exportcontrol rvgulafions, direct foreign investment in the United States, and financial analysis of themember companies of an international consortium.
Economic Analysis
Mr. Klctt’s experience in economic analysis of international trade issues includes:
¯ Analysis of impact of imports on competing U.S. industry, including use ofexisting ecc,nomic models, econometric analysis of time series data, and testimony
¯ Estimation of impact of trade restrictions on consumers¯ Economic analysis relating to domestic industry issues in Section 337
investigations at the U.S. International Trade Commission, and expert testimony¯ Statistical analysis to support arguments made to the Department of Commerce in
antidumping investigations
Case Experiefice - U.S. International Trade Commission:
¯ Framing Stock from the UK¯ Softwood Lumber t~om Canada¯ Uranium¯ Flat Panel Displays from Japan¯ Cement (lapan, Mexico, Vcnczaela)¯ Industrial Nit~ocellulosc¯ Atlantic Salmon from Norway¯ Silicon Metal from Brazil¯ Aspheric Ophthalmoscopy Lenses from Japan¯ Honey from China¯ Pencils from China¯ Bulk Diltiazem (Section 337)
Case Experience - U.S. International Trade Commission (cont.):
Page 2
¯ Polyvinyl Alcohol (Japan, Korea, Taiwan, PRC)* Salinomycin Biomass (Section 337)¯ Rebar from Turkey¯ Pasta from ]Italy and Turkey. Stainless Stsel Wire Rod* Wheat Gluten (Section 201)* EEPROMs (Section 337)* Titanium Sponge (Changed Circumstance Review)
Cut-to-Length Carbon Steel PlateFerrosilico~ (Changed Circumstance Review)Roller Chains from Japan (Sunset Review)Color Pic~re Tubes (Sunset Review)
* Silicon Metal (Sunset Review)¯ Various carbon steel products¯ Table Grap~s from Chile¯ Steel Wire l~tope¯ Ammonium Nitrate (Russia, Ukraine)¯ L~ge Diameter Line Pipe¯ Low-Enriched Uranium¯ Automotive: Replacement Glass from China¯ Oil Country Tubular Goods¯ DRAMs from Korea¯ Urea Ammonium Nitrate¯ Shrimp¯ Outboard Motors from Japan
Case Experience -, U.S. Department of Commerce:
¯ Industrial Nitrocellulose from Seven Countries¯ Atlantic Sa~Imon from Norway¯ Kiwifruit firm New Zealand¯ Man-Made Fiber Sweaters from Korea¯ Potassium Permanganate from Spain and China.¯ Asphcdc Ophthalmoscopy Lenses from Japan¯ Flat-Rolled Carbon Steel Products from various countries¯ Oil Count/Tubular Goods from various countries¯ Stainless Sl:cel Bar from India
Sebacic Acid from China
DANIEL W. KLETT Page 3
Other Projects
Mr. KI_ ett has participated in other international trade-related projects, including:
¯ Consumer cost study for Japanese semiconductor companies involved in an ECantidumping proceeding.Analysis of the impaot ofU.S, national security export controls on theintemati6nal business slrategies of U.S. high-technology companies.
¯ Assistance to a Swiss manufacturer in assessing the feasibility of setting upmanufacturing facilities in the United States, and site location.
¯ Analysis of the financial condition of Airbus members, in the context of statesupport anti commercial conditions.
¯ Section 30!t investigation involving modified wheat starch f~om the EU (on behalfof EU grain industry).
Prior Experience
Prior to forming Capital Trade, Incorporated, Mr. Klett was a Vice President with ICFConsulting Associates (1990-92), and a supervisor at Coopers & Lybrand (198%90).
From 1979 to 1987, Mr. Klett was an economist at theU.S. Intemalional TradeCommission, first in the Oftiee of Economics (1979-1986) and then as the economicadvisor to four Administrative Law ludges (1986-1987) involved in Section 337proceedings.
From 1977 to 1979, Mx. K|ett served as a Peace Corps volunteer in Sierza Leone,teaching economk;s at the high school junior to introductory university levels.
PROFESSIONAL AFFIU[ATIONS
American Economic Association
PUBLICATIONS AND CONFERENCES
"The U.S. Tariff Act, Section 337: Off-Shore Assembly and the Domestic Industry," Join’hal ofWorld Trade Law, May-June 1986.
"Price Sensitivity and 1TC Injury Determinations: A Matter of Definition," (with T. Schneider)Joumal of World Trade, April 1994.
"Proposed Changes Conc.m’ning Import Duties and Domestic Indirect Tax Rebates--Conformityto the GATT, and Benefits to the Peruvian Export Sector," Presented at Foro International SobreDevolution de Impuestos y Drawback a Las Exportaeiones, Lima, Peru, August, 1994.
Attachment 2
200~ INCOME DATA - l~v~’l~ WAOI~ O1~ SE!J~.CII~) NONoMARIO~ ECONOMY COON’flI]I~
go b~ck one page page updated: November t5,2004
EXPECTED WAGES OF SELECTED NON-MARKET ECONOMY COUNTRIESExpected Wage Calculation: 2002 GNI Data
Regression Analysis: 2001 GNI DataRevised November 2004
EXPECTEO 2002 WAGES OF SELECTED NME COUNTRIE~
CALCULATION OF 200t WAGES PER HOUR IN U800LLARS
WAGES AND GNI PER CAPITA IN US DOLLARSMAhtUFACTURING WAGES AND GI~I"PER CAPiTA(graph)
* Applicable only to review periods tha( predate (he effective date of graduation to mad(et-e~,onomy status(Estonia (01/01R3); Lithuania (OlR1R,~;); Romania (0tl01/03); and Russia (04/01/02); Kazakl~tan (1010110t)).
* * On November 8, 2002, the Department determined that Vietnam will be treated as a non-marks( economy country forpurposes of antldumplng duty and countervailing proceedings (see Memorandum lot Faryar Shirzad, ~tldump|ng DutyInvestigation of Certain Frozen Fish Fillets from the Socialist Republic of Vietnam-Determination of Market Economy Status (A-
~ 0 ~ 0 0 0 0 01~ 0 ,-- . glololololololol~lolo o o ~ ~ o ~
~ : : ’o: o o o ~ o ~g o o o l,~ ~ ~lolololglol~lol~lglololololololo ~
Sou,~: I.~ma~¢ ~an¢al Sta~’,~,~c~ o~ e~ IMF.
1.(11(
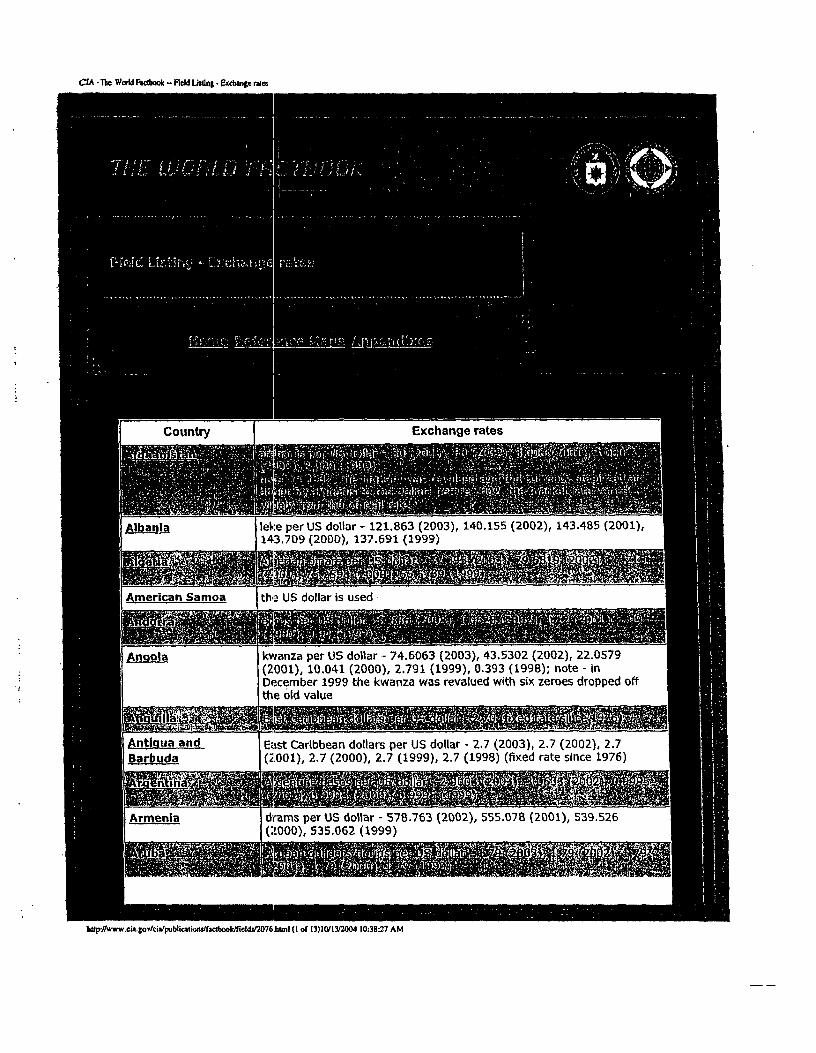
Country Exchange rates
Albania leke per US dollar - 121.863 (2003), 140.155 (2002), 143.485 (2001),143,709 (2ODD), 137.691 (1999)
American Samoa th,.= US dollar is used
kwanza per US dollar .- 74.6063 (2003), 43.5302 (2002), 22.0579(2001), 10.041 (2000), 2.791 (1999), 0.393 (1998); note - inDecember 1999 the kwanza was revalued wiLh six zeroes dropped off:the 01d value
An__~ua andBarbuda
East Caribbean dollars per US dollar - 2.7 (2003), 2.7 (2002), 2.7(2:001), 2.7 (2000), 2.7 (1999), 2.7 (1998) (fixed raLe since 1976)
d~ams per US dottar - 578.763 (2002), 555.078 (2001), 539.526(2000), 535.062 (1999)
Mlp:/lwww.¢ia.gov/eia/public~tiom/f=cebook~ckl~2076,Mml (I of 13)I0/I~2004 10:38"27 AM
Australia Australian dollars per US dollar - 1.5419 (2003), 1.8406 (2002), 1.9334(2001), 1.7248 (2000), 1.55 (1999)
Azerbaijani manats per US dollar Y4,910.73 (2003), 4,860.82 (2002),4,656.58 (2001), 4,474.15 (2000), 4,120.17 (1999)
Bahrain Bahraini dinars per US do(lar - 0.376 (2003), 0.376 (2002), 0.376(2001), 0,376 (2000), 0.376 (1999)
Barbados Barbadian dollars per US dollar - 2 (2003), 2 (2002), 2 (2001), 22000), 2 (~1999)
euros per US dollar - 0.886 (2003), 1.0626 (2002), 1.1175 (2001),1.0854 (2000), 0.9386 (1999)
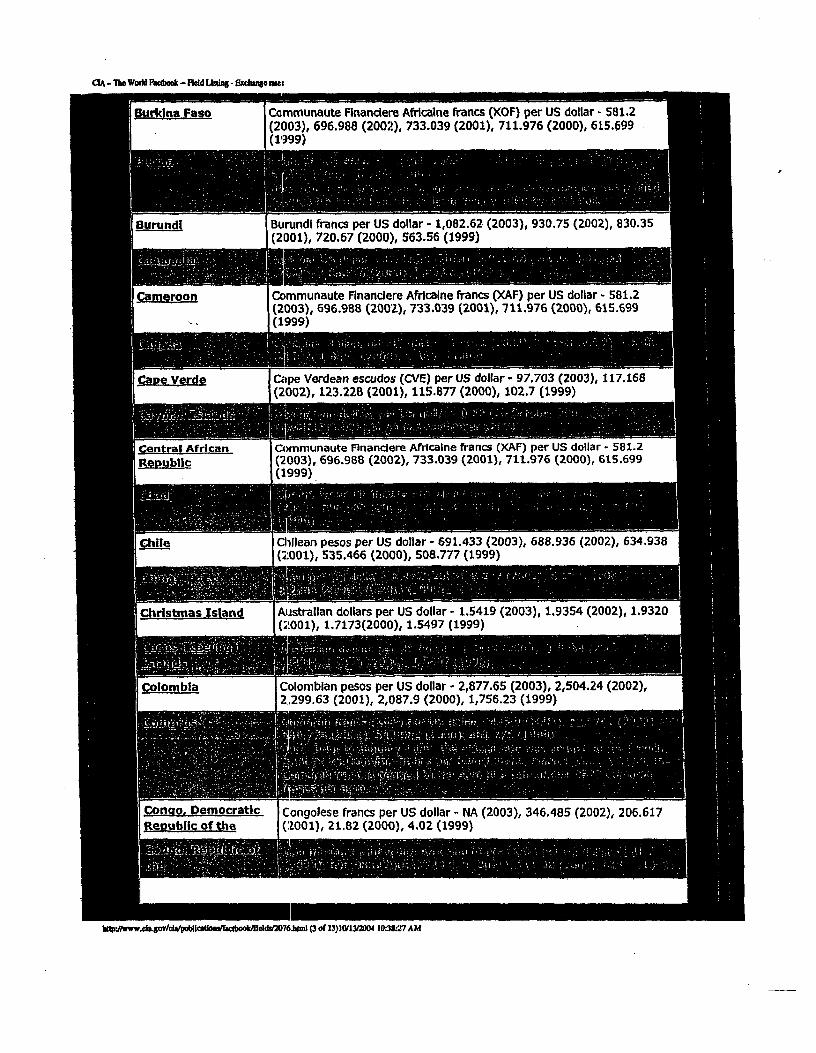
Benin Communaute Financiere AfrlcBine francs (XOF) per US dollar - 581.?-(2003), 696.988 (2002), 733.039 (2001), 711.976 (2000), 615.699
Bhutan ngultrum per US dollar - 46.$806 (2003), 48.6103 (2002), 47.1864(2001), 44.9416 (2000)~ 43.0554 (1999)
Bosnia and markB per US dollar - 1.7329 (2003), 1.7329 (2002), Z.1857 (2001),2.1244 (2000), 1.B37]L ([999)
Brazil reals per US dollar - 3.0771 (2003), 2.9208 (2002), 2.3577 (2001),1.8301 (2000), 1.8147 (1999)note: from October 1994 through 14 .lanuary 1999, the official rate wasdetermined by a managed float; since 15 January 1999, the official ratefloats independently with respect to the US dollar
Brunei Brunelan dollars per US dollar - 1.7422 (2003), t.7906 (2002), 1.79172001), 1.724 (2000), 1.695 (1999)
Commurkaute Rnandere Afrlcaine francs (XOF) per US dollar - 581,Z(2003), 696.988 (2002), 733.039 (2001), 711.976 (2000), 61.5.6991999)
Bu~rundi francs per US dollar - 1,082.62 (2003), 930.75 (Z002), 830.35(2001), 720.67 (2000), 563.56 (1999)
Communaute Rnandere Africalne francs (XAF) per US dollar - 581.2(2003), 696.988 (2007.), 733.039 (Z001), 711.976 (2000), 615.699(1999)
C~pe Verdean escudos (CVE) per US dollar - 97.703 (2003), 117.168i (2002), 123.228 (2001), 115.877 (2000), 102.7 (1999)
Communaute Rnanclere Africalne francs (XAF) per US dollar - 581.2(2003), 696.988 (2002), 733.039 (2001), 7i-1.976 (2000), 615.699(1999).
Chilean pesos per US dollar o 691.433 (2003), 688.936 (2002), 634.938(~001), 535.466 (2000), 508,777 (1999)
Australian dollars per US dollar - 1.5419 (2003), 1.9354 (2002), 1.9320(;!001), 1.7173(2000), 1.5497 (1999)
Colombian pesos per US dollar - 2,877.65 (2003), 2,504.24 (2002),2,299.63 (2001), 2,087.9 (2000), 1,756.23 (1999)
Con o Democratic Congolese francs per US dollar - NA (2003), 346.485 (2002), 206.617J~l~g~_g~fLf~ (’.Z001), Zt.SZ (2000), 4.02. (1999)
New Zealand dollars per US dollar - 1.72:29 (2003), 2.1622 (2002),2.3776 (2001), 2.1863 (2000), 1.8886 (1999)
Cote d’Ivoire CommunauLe FInanciere Afdc~lne francs (×OF) per US dollar -(2003), 696.988 (200Z), 733.039 (2001), 711.976 (2000), 615.699
i(1999)
Cuba Cuban pesos per US dollar - 1.0000 (nonconvertlble, offldal rate, forinternational transactions, pegged to the US dollar); convertible pesosold for domestic use at a rate of 27 pesos per US dollar by theGovernment of Cuba (2002)
Czech Republic koruny per US dollar - 28.209 (2003), 37_.7385 (2002), 38.0353 (2001),38.5984 (2000), 34.5692 (1999)
D_D.tibouti Djiboutlan francs per US dollar - 177.721 (2003), 177.721 (2002),177.721 (2001), 177.721 (2000), 177.721 (1999)
Dominica~ Oominican pesos per US dollar- 30.8307 (2003), 18.6098 (2002),! 16,9516 (2001), 16.41.5 (2000), 16.0331 (1999)
Ecuador Ecuador formally adopted the US dollar as legal tender in March 2000
ElSalvador the US dollar is the legal tender
Eritrea r~akfa {EP, N) per US dollar - NA (2003), 13.9582 (7.002), lt.3095(2001), 9.5 (2000), 7.6 (1999)
bin- per US dollar - NA (2003), 8.5678 (2002), 8.4575 (2001), 8.2173(2000), 7.9423 (1999)note: since 24 October 2001 exchange rates are determined on a dailybasis via interbank transacUons regulated by the Central Bank
t~p’Jlwwwcit,|ovlddp~biicatk~Jftct~okffi=ddd2076.1~ml (4 of I~,)|0/I ~/’~004 10:39:27 AM
C[A- 1~ Wedd Fzclbook -- Reid
Faroe Islands :Danish kroner per US dollar - 6.5877 (2003), 7.89 (2002), 8.323,12001), 8.083 (2000), 6.976 (1999)
Finland euros per US dollar .- 0.886 (2003), 1.0626 (2002), 1.1175 (2001),1.0854 (2000), 0.9386 (1999)
French Guiana ~Euros per US dollar .- 0.886 (2003), 1.0626 (2002), 1.1175 (2001),1,0854 (2000), 0,9386 (1999)
Gabon Communaute Flnanclere Afficaine francs (XAF) per US dollar - 581,2(2003), 696.988 (2002), 733.039 (2001), 711.976 (2000), 615.699[1999)
Gaza StriJ~ ,new Israeli shekels per US dollar - 4,55 (2003), 4.74 (2002), 4,21(2001), 4.08 (2000), 4.14 (1999)
euros per US dollar - 0.886 (2003), 1.0626 (ZOO2), 1.1175 (2001),1.0854 (2000), 0.9386 (1999)
Gibraltar Gibraltar pounds pelt US dollar - 0.0661 (2002), 0,6944 (2001), 0.6596(2000), 0.6180 (1999), 0.6037 (1998); note - the Gibraltar pound Is atpar with the British pound
Greenland Danish kroner per US dollar - 6.5877 (2003), 7.8947 (2002), 8.323(2001), 8.083 (2000), 6.976 (1999)
euros per US dollar - 0.886 (2003), 1.06Z6 (2002), 1.1175 (2001),1.0854 (2000), 0.9386 (1999)
Guatemala quetzales per US dollar - 7.9409 (2003), 7.8216 (2002), 7.8586 (2001),7.7632 (2000), 7.3856 (1999)
Guinea Guinean francs per US dollar - NA (2003), 1,975.84 (2002), 1,950.56(2001), 1,746.87 (2000), 1,387.4 (1999)
blllWh~w,da.govlcidl~bllc~doR~hclbootJfidd.V~O’t6.K~l (~ of I:I)I0/13f~004 10:3I:27 AM
Guyanese dollars per US; dollar - NA (2003), 190.665 (2002), 187.321(2001), 182.43 (2000), 177.995 (1999)
eurDs per US dollar- 0.886 (2003),1.1324 (2002), 1.1175 (2001),1,0B54 (2000), 0.9386 (1999)
Hong Kong dollars per US dollar - 7.7868 (2003), 7.7989 (2002),7.7988 (2001), 7.7912 (2000), 7.7575 (1999)
Iceland Icelandic kronur per US dollar - 76.709 (ZOO3), 91,6617 (ZOOZ),97.4246 (2001), 78.6159 (2000), 72.3353 (1999)
~_pdonesla Indones|an rupiahs per’ US dollar - 8,577.I3 (2003), 9,311.19 (2002),10,260.B (2001), 8,421.77 (2000), 7,B55.15 (1999)
New Iraqi dinars per US dollar - 1,890 (second half, 2003)
new Israeli shekels per US dollar - 4.5541 (2003), 4.7378 (2002),4.2057 (2D01), 4.0773 (2000), 4.1397 (1999)
_Jamaica Jamaican dollars per US dollar - 57.7409 (2003), 48.4159 (2002),45.9962 (2001), 42.7011 (2000), 39.0435 (1999)
Jersey pounds par US dollar - 0.6661 (2002), 0.6944 (2001), 0.659(;(2000), 0.6180 (1999); the Jersey pound is at par with the Britishpound
t:e~,ge per US dollar- -. 149.576 (7-003), 153.2.79 (2002.), 146.736 (2001),142.133 (2000), 119.52.3 (1999)
MIp../AvWw.cia.,~ov/cia/public~dondfac~boddOd~,f2076.h,~l (6 o/" 13)1~1Y’~04 IO:38:27 AM
Klr!bati
Korea South
Australian dollars per US dollar - 1.5419 (2003), 1.8406 (2002), 1.9334~ (2001), 1.7248 (2000), 1.55 (1999)
South Korean won per US dollar o 1,191.61 (2003), 1,251.09 (2002),1,290.99 (2001), 1,130.96 (2000), 1,188.82 (1999)
sore:; per US dollar - 43.6484 (2003), 46.9371 (2002), 48.378 (2001),47.7038 (2Q0(~), 39.0077 (1999)
lati per US dollar - 0.5715 (2003), 0.6182 (2002), 0.6279 (2001),0.6065 (2000), 0.5852 (1999)
malotl per US dollar - 7.5648 (2003), 10.5407 (2002), 8.6092 (2001),6,939B (2000)~ 6.1095 (1999)
Libyan dinars per US dollar - 1.2929 (2003), 1.2707 (2002), 0.6051(2001), 0.4994 (2000), 0.3936 (1999)
lital per US dollar - 3.061)9 (2003), 3.677 (2002), 4 (2001), 4 (2000), 4i(1999)
patacas per US dollar - 8.0212 (2003), 8.0334 (ZOOZ), 8.033S (2001),8.02.59 (2000), 7.9919 (1999)
Halagasy francs per US dollar - 6,2.10 (Z003), 6,831.96 (2002),6,588.49 (2001), 6,767..4B (2000), 6,283.77 (1999)
ringglts per US dollar - 3.8 (2003), 3.8 (2002), 3.8 (2001), 3.8 (2000),3.8 (1999)
Mall Co~munaute Financiere Africaine francs (XOF) per US dollar - 581,2(2003), 696.988 (2002’), 733.039 (300/~), 711.976 (ZOO0), 615.699(~999)
Man Isle of Manx pounds per US dollar - 0.612.5 (2_003), 0.6661 (3002), 0.6944(2001), 0.6596 (2000), 0.6]80 (1999); the Manx pound is at par withthe British pound
euros p~r US doilar- 0,8860 (2003), $.062.6 (3002.), 1.11751.0854 (2000), 0.9386 (1999); French francs per US dollar - 5.8995
Mauritius Mauritian rupees per US dollar - 27.90:15 (2003), 29.962 (2002),29,12.93 (2_001), 2.6,2496 (2000), 35.1858 0.999)
.Mexico Mexican pesos per US dollar - 10.789 (2003), 9.656 (20OZ), 9.342.3(2001), 9.4556 (2000), 9.5604 (1999)
.Noldova lel per US dollar - 13.9449 (3003), 13.5705 (3002_), i2_.8651 (2.001),12.4342 (2000), 10.51.58 (1999)
New Zealand ~ew Zealand dollars per US dollar - 1.7229 (2003), 2.t622 (2002),2.3788 (2001), 2.2052 (2000), LSB96 (1999)
Communaute Financlere Africaine francs (XOF) per US dollar - 581.2(2003}, 696.966 (2002), 733.039 (2005), 75t.976 (2000), 655.699(1999)
Niue New Zealand dollars per US dollar2.3776 (2001), 2.1863 (2000), 1.8886 (1999)
~Northern MarianaIslands the US dollar is used
Oman Omanl rials per US dollar - 0.3845 (2003), 0.3845 (2002), 0.38452001), 0.3845 (2000),, 0.3845 (t999)
_Palau the US dollar is used
Pa ua New uinea kina per US dollar - 3.5635 (2003), 3.8952 (2002), 3.38B7 (2001),2:7822 (2000), 2.5708 (1999)
Peru nuevo sol per US dollar - 3.4785 (2003), 3.5165 (2002), 3.5068 (2001),3.49 (2000), 3.3833 (1999)
.Pitcairn Islands. N,~-w Zealand dollars per US dollar - 1.7229 (2003), 2.162 (2002),2.3776 (2001), 2.1863 (2000), 1.8886 (1999)
euros per US dollar - 0.886 (2003), 1.0626 (2002), 1.1175 (2001),1.0854 (2000), 0.9356 (1999)
Qatar Qatarl rials per us dollar - 3.64 (2003), 3.64 (2002), 3.64 (2001), 3.64(2000), 3.64 (1999)
Mlp:llwww.c’**.govlcialpublicadonsltacdx~J~eldsr2oT(..hlml (9 of 13)lOll 3r200410:38:27 AM
Romania lei per US dollar - 33,,200.1 (2003), 33,055.4 (2002), 29,060.8 (2001),21,708.7 (2000), 15,332.8 (1999)
francs per US dollar - 537.658 (2003), 476.327 (2002),~42.80! (2001), 389.696 (2000), 333.942 (1999)
Saint Kitts and East Caribbean dollars per US dollar - 2.7 (2003), 2.7 (2002), 2.7(2001), 2.7 (2000), 2.7 (1999)
Saint Pierre and euros per US dollar - 0.886 (2003), 1.0626 (2002), 1.0626 (2001),]..08540 (2000), 0.9:3863 (1999)
Samoa tala per US dollar - 2.9732 (2003), 3.3763 (2002), 3.478 (2001),3.2864 (2000), 3.0132 (1999)
Sao Tome and dobras per US dollar - 9,347.58 (2003), 9,088.32 (2002), 8,842.11(2001), 7,978.17 (2000), 7,118.96 (1999)
Communaute Financiere Africaine francs (XOF) per US dollar - 581.2(2003), 696.988 (2002), 733.039 (2001), 711.976 (2000), 615.699f,1999)
Seychelles rupees per US dollar - 5.4007 (2003), 5.48 (2002), 5.8575(2001), 5.7138 (2000), 5.3426 (.1999)
Singapore dollars per US dollar - 1.7422 (2003), 1.7906 (2002), 1.7917
, I12001), 1.724 (2000), 1.695 (1999)
Slovenla I:olars per US dollar - 207.099 (2003), 240.248 (2002), 242.749 (2001),222.656 (2000), 181.769 (1999)
lt~:/l***.ci~.Sovl¢lWpuldiado~lf=cllx#J6d4.trt.076.1~l~l (10 of 13)10/1~/2004 10:38:27 AM
Somali shillings per US dollar - 11,000 (November 2000), 2,6201999), 7,50(~ (November 1997 est.), 7,000 (January 1996
est.), 5,000 (1 Januaw 1995)note: the Republic of Somaliland, a self-declared Independent: countrynot recognized by any foreign government, Issues its own currency, theSomaliland shilling
euros per US dollar - 0.B86 (2003), 1.0626 (2002), 1.1175 (2001),1.0854 (2000), 0;9386 (1999)
Smlanese dinars per US dollar - 260.983 (2003), 263.306 (2002),2.’iS.702 (2001), 257.122 (2000), 252.55 (1999)
Norwegian kroner per US dollar - 7.0802 (2003), 7.9838 (2002), 8.9917, (2001), 8.8018 (2000), 7.7992 (1999)
Sweden Swedish kronor per US dollar- 8.0853 (2003), 9.7371 (2002), 10.3291(~001), 9.1622 (2000), 8.2624 C~999)
Syrian pounds per US dollar - (Officlal rate): 11.225 (2003), 11.225i;!002), 11.225 (2001), 11.225 (2000), 11.225 (1999), (Free market
49.65 (2001), 49.4 (2000), 51.7 (1999)
TaJikistani somoni per US dollar - 3.0614 (2003), 2.7641 (2002), 2.3722(2001), 2.0763 (2000), 1.2378 (1999)~te: the new unit of exchange was introduced on 30 October 2000,with one somoni equal to 1,000 of the old Tajikistanl rubles
baht per US dollar - 41.4846 (2003), 42.9601 (2002), 44.4319 (2001),4~).1118 (2000), 37.8137 (1999)
Tokelau qew Zealand dollars per US dollar - 1.7229 (2003), 2.154 (2002),Z.3776 (2001), 2.1863 (2000), 1.8886 (1999)
Trinidad and Toba o Trinidad and Tobago dollars per US dollar - 6.2929 (2003), 6.2487(2002), 6.2332 (2001), 6.2998 (2000), 6.2989 (1999)
Turkilsh liras per US dollar o NA (2003}, 1,507,230 (2002), 1,225,590(2001), 625,218 (2000), 418,783 (1999), 151,865 (1997)
T_~urks and CaicosIslands the US dollar is used
Ugandan shillings per US dollar - 1,963.72 (2003), 1,797.55 (2002),1,755.66 (2001), 1,644.48 (2000), 1,454.83 (1999)
United ArabE___mirates
Emh’atl dirhams per US ,dollar - 3.67 (2003), 3.6725 (2002), 3.6725(2001), 3.6725 (2000), 3.6725 (1999)
United States British pounds per US dollar - 0.6139 (2003), 0.6661 (2002), 0.6944(2001), 0.6596 (2000), 0.6180 (1999), Canadian dollars per US dollar1.4045 (2003), 1.5693 .(2002), 1.5488 (2001), 1.48S1 (2000), 1.4857(1999), ]apanese yen per US dollar - 116.08 (2003), 125.39 (2002),121.53 (2001), 107.77 (2000), 113.91 (1999), euros per US dollar -0.8866 (2003), 1.0626 (2002), 1.1175 (2001), 1.08540 (2000),
.0.93863 (1999)
Uzbekistan Uzbekistani sums per US dollar - 115.9 (2003), 125.3 (2002), NA(2001), 236.608 (2000), 124.625 (1999)
Venezuela bolivares per US dollar - 1,607.79 (2003), 1,160.95 (2002), 723.666(2001), 679.96 (2000), 605.717 (1999)
Vir in Islands the US dollar is used
West Bank new Israeli shekels per US dollar - 4.5541 (2003), 4.7378 (2002),4.2.057 (2001), 4,0773 (2000), 4.1397 (1999); 3ordanlan dinars per USdollar - fixed rate of 0.7090 (from 1996)
il~’Jlwvnv.cia.gov/cia/publicado~gfactbooklfcld.d2076.Mml (12 of 13)10/13/’2004 10:38:27 AM
Attachment 6
Attachment 7
I
II
2002 INCOME DATA- EXP|~CTED WAGES OF BELF_.L-q’ED NON-MARKET ECON... P~g~ 1 of 9
t~ tt~ae IMPORT ADMINISTRATION SEARCH
¢,OKqNi~CE.GOV "t’RAOE.GOV P~A~ PO~ ~ W~R
~PEC~ WAGES OF SE~CTE~ HOH~RK~ ECO~OM~ COUHTRIE~2~2 IHGOME DATA
Index of TablesE~:TEO :~0O~ W,~E$ OF $ELECTED eea~
EXPECTED 2002 WAGES OF SELECTED NME COUNTRIES
Counby 2002 GNI per Expe~mi 2002 Wages,Capita, U6,$ USa per Hour
NOTES:* GNI per.msplta for Zimbabwe was estimated for Year 2002by Wodd t)evetopment ~ndicetors, The World Bank.
General:The selection of counties was based upon the availability of wage data as reported inthe Yearbook of Labour Statistics 2003, International Labour Organisation, (Geneva:2003); ~ GNP data ~ reported in World Dey~lopmcm Indicators, The World Bank,(W~gton, DC: 20o4).
Wag~:Wage rates are reported in the Yearbook of Labg.~./~.t~tig, j~, ILO, (Geneva:2003), Chapter 5B: Wages in Manufacturing. The years of the reported wage ratesrange from 1997 to 20~3. Wages reported prior to 1996 and after 2002 are excludedfrom the analysis.
Wages reported by ILO are in most cases based on cash payments received fromemployers on a regular basis. In addition to remuneration for normal working hours,cost-of-living allowances and other regularly paid sllowances are included in wages.Wages do not inolude remuneration for overtime, bonuses and gratuities, familyallowanees, or other so¢tal security payments made by the employer. See Yearbook ofLahore Statistics 2003 for fuzther discussion of wage data.
Where monthly or daily wages are Oven, hourly wages are calculated assuming 24working days per month, 5.5 working days per week, 8 working hours per day.
200~ INCOME DATA - EXPECTED WAOE$ OFSELECTED NON~ ECON...
Inflator:Wages are infla~ed, ~e ~he brae y~ ~ ~t 20~, ~i~ con~er ~ce ~dex dam~ ~ ~te~tim~ci~ S~tics,~ne Sere, ~t~o~ Mone~F~ (hap:/~,~f.o~, Do~oad~ July 9, 20~). ~e inflator rate ~ c~tat~ bydi~d~g ~e co~er ~ ~d~ fo~ 2~2 by ~e ~r price ~x for the¯ e ~ge ra~ w~ rep~3~
Exchange rates:Exchange rates are expressed as foreign currenoy per one U.S. dollar. For the majorityof the countries in thi~’analysis, the exchange mcs used are as reported in_In_tema~ tional Fintmc~iel Statistics Opaline 8~ic~e.
Wages for Austria, ~,’lgium, Ireland and the Netherlands were ~eported in schillil~gs,Belgian francs, poundls and guilders, respectively. These wages were concerted toeuros ~sing the European Central Bank’s conversion rates made effective on January!, 1999 (hRp:l/www.e~:b,lnt). blo wage data used for these couRtries was reporteglbefore 1999.
National Income:GNI per capita is reported in World Development lndicatom, The World Bank,(Washington, DC: 2004). See t " for further information.
World Development l[ndicators did not have a Gbll per capita figure available forZimbabwe so it supplied an estimate for 2002.
Analym:Regression based on .ordinary least squares method.
Exhibit 2
Report of Dr. Tapan K. Nayak, Ph.D.
Department of Commerce NME Wage Estimation
I Introduction
I have been retained by Grunfield, 1-)esiderio, Lebowitz, Silverman and Klestadt
LLP to provide an expert opinion on the appropriateness of the statistical regression used
by the Department of Commerce (DOC) to estimate non-market-economy (NME) wage
rates using market econornies’ per capita Gross National Income (GNI) and hourly labor
rates. My professional background is included is appended to this report.
Regression analysis is a statistical methodology for relating a variable of interest,
called the dependent (or response) variable:, to one or more independent (or predictor)
variables. The objective is to use the observed data to build a regression model, or
prediction equation, which can then be used to describe, predict, or control the dependent
variable on the basis of the independent variable(s). For example, a company may use
regression analysis to model the relationship between sales and advertising expenditure,
and then use that to decide’, how much they should spend for advertising.
A simple linear regression model relates a response variable (Y) and a single
independent variable (X) by postulating that the mean value of the response variable,
E(Y), varies with the value of the independent variable following an unspecified linear
pattern, i.e.,
E(Y) = 13o + 13~X.
The values of 130 and ~1, c~lled the regression parameters, are estimated from the observed
data. The actual value of Y would be different from the mean value E(Y), and the data
points would scatter arourtd the regression line.
Many textbooks~ present the specific methods and formulas for calculating the
estimates, making predictions or model evaluation using a regression analysis.
II. Application of Regression Analysis by DOC for Estimating NME Wage Rates
The Department of Commerce applies a regression analysis to estimate the wage
rates of NME countries in antidumping du.ty investigations. For its proposed 2003
calculation, DOC modeled wage rate (Y) as a function of per capita GNI (X) using a
simple linear regression model. In other words, DOC is using the observed relationship
between GNI and wage rates in countries throughout the world to predict or estimate the
wage rates in NME countries based on their respective GNI. The model parameters were
estimated using hourly wages and per capita GNI of 52 market economy countries, and
the method of ordinary least squares.2 The wage rates for the NME country is then
estimated by plugging-in its per capita GNI in the estimated regression equation, as
described above.
III. Bias Due to Arbitrary Data Selection by DOC
For estimating the regression equation, DOC used 52 countries whose wage data
are available in the Yearbook of Labor Statistics 2004, published by the International
Labor Organization, and whose GNI data was available from the 2005 World
~ See, e.g., Applied Linear Regression Models, M. H. Kunter, C. J. Nachtsheim, and J. Neter, 2004, andApplied Regression Analysis, N. R. Draper, and H. Smith, 1998.z See discussion below on ordinary least squares.
2
Development Indicators, published by the World Bank. However, the DOC ignored,
without an explanation, many other countries whose GNI and wage data are also
contained in the same sources.
As is well known, statistical estimates are not expected to be fully accurate, and
they change from sample ’to sample. There are two aspects of estimation errors. One is
"bias", which is under or over-estimation "on the average." The other one is variation of
the estimates from sample to sample, which is measured technically by "standard error."
The total error is often measured by "mean squared error", which is the sum of the
squares of bias and standard error.
In general, the least square method (used by DOC) yields unbiased estimates (i.e.,
no systematic under or ow~r-estimation) of the regression parameters provided that the
assumed model is correct and that the data being utilized has been selected by a random
sample. In addition, the standard errors decrease as sample size increases. The
Department of Commerce also recognizes the fact that estimates based on a larger sample
size are better, as evidenced by their statement: "In general, we believe that more data is
better than less data, and that averaging of multiple data points (or regression analysis)
should lead to more accurate results in valuing any factor production.’’3 Thus, one would
expect more reliable estimates if more countries are included in the regression analysis
for estimating NME wage rates.
Therefore, the most serious concern about the DOC analysis stems from the fact
that the Department excluded 14 countries that have data that meets the Department’s
selection criteria (i.e. countries with wage data that is not more than 6 years old, and for
which there is consumer p:rice indexes available) and whose data is available from the
3 Notice of Final Rule Making, ,52 Fed. Reg. 27296 at 27,367 (May 19, 1997).
same sources already being used by DOC. These market economy countries that the
DOC excluded were not excluded randomly, as these countries have previously been
excluded.4 Given that the Department has’. not excluded these countries through a random
sampling, the DOC results are biased.
More importantly, sampling of the available data is employed when dealing with
large amounts of data points. Given the small size of the data set available for this
regression analysis, random sampling will not result in a more accurate representation of
the relationship between wages and GNI. Furthermore, given that the universe of
available data would be complete with the inclusion of these 14 additional countries,
there is no valid reason for the Department to exclude these countries’ data. Thus, DOC
should revise its 2003 wage rate estimates for NME countries by recalculating its
regression equation inclu~]ing the 14 countries excluded for no reason.
4 This has been the case for at least the last four years.
4
Tapan K. Nayak
Department of StatisticsGeorge Washington University
B.Sc. (Honors in Statistics), University of Calcutta, Calcutta, India, 1976.M. Stat., Indian Statistical Institute, Calcutta, India, 1979.Ph.D., University of Pittsburgh, Pittsburgh, U.S.A., 1983.Ph.D. Dissertation, written under the supervision of Professor C. R. Rao, entitled,"Applications of Entropy Functions in Measurement and Analysis of Diversity."
Awards and Honors:
Elected member of the International Statistical Institute, 1996.Recipient of ASA/USDA-NASS Senior Research Fellowship, July 1997 - August 1998.Recipient of Mellon Predoctoral Fellowship, University of Pittsburgh, Pittsburgh, 1982 - 1983.Secured top position in B.Sc. (Honors in Statistics), University of Calcutta, Calcutta, India, 1976.Recipient of Merit Scholarship, Govt. of India, 1969 - 1973.Ranked First in Higher School Certificate Examination, Visva-Bharati, Santiniketan, India, 1973.Recipient of National Scholarship, Govt. of India, 1973 - 1976.
Professional Record:
Professor and Chairman, Aug. 2001 - Present; Professor, Sept. 1997 - Present; Associate Professor,June 1989 - August 1997; Assistant Professor, June 1984 - May 1989; Visiting Assistant Professor,Sept. 1983 - May 1984, Department of Statistics, George Washington University, Washington, DC20052.
ASA/USDA-NASS Senior Research Fellow, National Agricultural Statistics Service, ResearchDivision, 3251 Old Lee Highway, Fairfax, VA 22030, July 1997 - August 1998.
Visiting Scientist, Division of Theoretical Statistics and Mathematics, Indian Statistical Institute,Calcutta, India, September 1990 - December 1990.
Teaching/Research Assistant, Mathematics and Statistics Department, University of Pittsburgh,Pittsburgh, Sept. 1980 - Aug. 1983.
Lecturer, R.K.M.R. College, Narendrapur, India, Nov. 1979 - Aug. 1980.
Research Publications:
T.K. Nayak. On Diversity Measures Based on Entropy Functions. Commun. Statist.- Theory Meth.(1985), 14(1), 203-215.
C.R. Rao, and T.K. Nayak. Cross Entropy, Dissimilarity Measures and Characterizations ofQuadratic Entropy. IEEE Transactions on Information Theory, (1985), IT-3 l, 589-593.
T.K. Nayak. Sampling Distributions in Analysis of Diversity. Sankhya, (1986), B 48, 1-9.
J.L. Gastwirth, T.K. Nayak, and A.M. Krieger. Large Sample Theory for the Bounds on the Giniand Related Indices of Inequality Estimated from Grouped Data. Journal of Business & EconomicStatistics, (1986), 4, 269-273.
T.K. Nayak. An Analysis of Diversity Using Rao’s Quadratic Entropy. Sankhya, (1986), B 48,315-330.
T.K. Nayak. Multivariate Lornax Distribution: Properties and Usefulness in Reliability Theory.Journal of Applied Probability, (1987), 24, 170-177.
T.K. Nayak. Estimating Population Size by Recapture Sampling. Biometrika, (1988), 75, 113-120.
T.K. Nayak. Testing Equality of Conditionally Independent Exponential Distributions. Commun.Statist.- Theory Meth. (1988), 17(3), 807-820.
T.K. Nayak. A Note on Estimating the Number of Errors in a System by Recapture Sampling.Statistics & Probability Letter,~r, (1989), 7, 191-194.
T.K. Nayak, and D.N. Naik. Estimating Multinomial Cell Probabilities Under Quadratic Loss. TheStatistician, (1989), 38, 3-10.
T.K. Nayak. Minimum Varial~ce Unbiased Estimation of Software Reliability. Probability in theEngineering and Informationa,! Sciences, (1989), 3, 335-340.
J.L. Gastwirth, T.K. Nayak, m~d J.L. Wang. Statistical Properties of Measures of Between GroupIncome Differentials. Journal of Econometrics, (1989), 42, 5-19.
T.K. Nayak, and J.L. Gastwirth. The Use of Diversity Analysis to Assess the Relative Influence ofFactors Affecting the Income Distribution. Journal of Business & Economic Statistics, (1989), 7,453-460.
T.K. Nayak. Estimation of Location and Scale Parameters Using Generalized Pitman NearnessCriterion. Journal of Statistical Planning and Inference, (1990), 24, 259-268.
T.K. Nayak. Estimating the Number of Component Processes of a Superimposed Process.Biometrika, (1991), 78, 75-81.
P.K. Sen, T.K. Nayak, and R. Khattree. Comparison of Estimators of a Dispersion Matrix UnderGeneralized Pitman Nearness Criterion. Commun. Statist.- Theory Meth. (1991), 20(11), 3473-3486.
T.K. Nayak. Comments on "Bayesian Pitman Closeness" by Ghosh, M. and Sen, P.K. Commun.Statist.- Theory Meth. (1991), ?.0(11), 3679-3684.
T.K. Nayak, and R.S. Harikar. On Estimating the Number of Errors in Computer Software.Sankhya, (1991), B 53,275-287.
T.K. Nayak. On Statistical Analysis of a Sample from a Population of Unknown Species. Journalof Statistical Planning and Inference, (1992), 31, 187-198.
T.K. Nayak, and M.C. Christman. Effect of Unequal Catchability on Estimates of the Number ofClasses in a Population. Scan&’navian Journal qfStatistics, (1992), 19, 281-287.
T.K. Nayak. On Estimating tN~ Total Rate of the Unobserved Processes. Statistics & ProbabilityLetters, (1993), 17,351-354.
M.C. Christman, and T.K. Nayak. Sequential Unbiased Estimation of the Number of Classes in aPopulation. Statistica Sinica, (1994), 4, 335-352.
J.L. Gastwirth, and T.K. Nayak. Statistical Measures of Racially Identified School Systems.Jurimetrics Journal, (1994), 34, 173-192.
T.K. Nayak. Pitman Nearness .Comparison of Some Estimators of Population Variance. AmericanStatistician, (1994), 48, 99-102.
T.K. Nayak. On Randomized Response Surveys for Estimating a Proportion. Commun. Statist.-Theory Meth. (1994), 23(11), 3303-3321.
T.K. Nayak. Estimating the Parameter of a Selected Population. Calcutta Statist. Assoc. Bulletin,(1995), 45, 93-101.
J.L. Gastwirth, and T.K. Nayak. Statistical Measures of Economic Discrimination Useful inEvaluating Fairness. Proceedings of the Section of Govt. Statist. of the American StatisticalAssociation, (1995), 87-94.
A. Dewanji, T.K. Nayak, and P.K. Sen. Estimating the Number of Components of a System ofSuperimposed Renewal Processes. Sankhya, Ser. A, (1995), 57, 486-499.
T.K. Nayak. On Estimating the Conditional Probability of Discovering a New Species. Commun.Statist.- Theory Meth. (1996), 25(9), 2039-2056.
T.K. Nayak, and J.L. Gastwirth. The Peters-Belson Approach to Measures of Economic and LegalDiscrimination. In Advances ir.~ the Theory and .Practice of Statistics: A Volume in Honor of SamuelKotz, eds. Norman L. Johnson, and N. Balakrishnan, New York: John Wiley, (1997), pp. 587-601.
J.L. Gastwirth, and T.K. Nayak. Statistical Aspects of Cases Concerning Racial Discrimination inDrug Sentencing: Stephens v. State and US. v. Armstrong. J. Criminal Law and Criminology,(1997), 87(2), 583-603.
T.K. Nayak. On Equivariant Estimation of the Location of Elliptical Distributions Under PitmanCloseness Criterion. Statistics & Probability Letters, (1998), 36, 373-378.
T.K. Nayak. Statistical Approaches to Modeling and Estimating Software Reliability. In Frontiersin Reliability, eds. Asit P. Basu., Sujit K. Basu, and Shyamaprasad Mukhopadhyay, London: WorldScientific, (1998), pp. 271-281.
J.L. Gastwirth, and T.K. Nayak. Comments on ;’Tests of Significance for Lorenz Partial Orders"by J.A. Bishop and J.P. Formby. In Handbook on lncome Inequality Measurement, ed. JacquesSilber, Boston: Kluwer Acadenaic Publishers, (1999), pp. 336-339.
T.K. Nayak. On Best Unbiased Prediction and Its Relationships to Unbiased Estimation. Journalof Statistical Planning and Inference, (2000), 84, 171-189.
T.K. Nayak, and S. Kundu. Calculating and Describing Uncertainty Propagation in RiskAssessment: The Bayesian Apl?roach. Human and Ecological Risk Assessment, (2001), 7(2), 307-328.
J.L. Gastwirth, and T.K. Nayak. Law and Environmental Statistics. In Encyclopedia ofEnvironmetrics, Vol. 2, ed. Abctel H. EI-Shaarawi and Walter W. Piegorsch, New York: Wiley,(2002), pp. 1142-1146.
T.K. Nayak, and S. Kundu. Some Remarks on Generalizations of the Likelihood Function and theLikelihood Principle. In Advances on Theoretical and Methodological Aspects of Probability andStatistics, ed. N. Balakrishnan, New York: Taylor and Francis, (2002), pp. 199-211.
T.K. Nayak. Rao-Cramer Type Inequalities for Mean Squared Error of Prediction. AmericanStatistician, (2002), 56(2), 102-106.
R. Modarres, T.K. Nayak, and J.L. Gastwirth. Estimation of Upper Quantiles Under Model andParameter Uncertainty. Computational Statist. and Data Analysis, (2002), 39, 529-554.
T.K. Nayak. Finding Optimal Estimators in Survey Sampling Using Unbiased Estimators of Zero.Journal of Statistical Planning and Inference, (2003), 114, 21-30.
E1-Baz, A., and T.K. Nayak. Efficiency of Composite Sampling for Estimating a LognormalDistribution. Environmental and Ecological Statistics, (2004), 11,283-294.
Book Reviews:
Review of Statistical Significance: Rationale, Validity and Utility by Siu L. Chow. Technometrics,(1998), 40, 161-162.
Review of Theory of Point Estimation (2nd ed.) by E.L. Lehmann and George Casella. Journal ofStatistical Planning and Inference, (2001), 93, 323-324.
Ph. D. Students Supervised:
Mary C. Christman. Thesis: ",On Estimation of the Number of Classes in a Population" (1993).
Christopher L. Moriarity. (Co-advisor) Thesis: "Statistical Properties of Statistical Matching"(2001).
Abeer EI-Baz. Thesis: "Some Contributions to Statistical Prediction Theory" (2004).
Professional Service:
Associate Editor, Communica~’ions in Statistics - Theory and Methods, 2002-present.
Associate Editor, Communications in Statistics - Simulation and Computation, 2002-present.
Guest Editor of Sankhya, Set. ,4, Vol. 64(2), (2002); a special issue in honor of Professor C.R. Rao.
Reviewer, Mathematical Reviews, 1995 - present.
Member, Review Panel for ew.luating research grant proposals submitted to Bureau ofTransportation Statistics (2001 ).
Organizing Committee member of the international conference "Statistics: Reflections on the Past,Visions for the Future" (in hon,3r of Professor C.R. Rao’s 80th birthday) held in San Antonio,Texas, during March 16 - 20, 2000.
Methodology Program Chair, Washington Statistical Society, 1991-1992.
Methodology Section Chair, Washington Statistical Society, 1992-1993.
Treasurer, International Indian ;Statistical Association, 1997-1999.
Reviewer of research proposals for agencies such as NSF, EPA.
University Service:
Member, Faculty Senate Committee on Faculty Development and Support, 1993-1994.Member, Junior Scholar Research Incentive Award Committee, 1994-1995.
Member, Dean’s Council, 2000-2003.
Departmental Service:Chairman, 2001 - present.Ph.D. Committee, Chair, since 1991; member, since 1983.Tenure and Promotion Review Committee, Chair, 1996-1997; member, 1992-1993, & 1995-1996.Departmental representative to the University (Gelman) Library, 1985-1990.Faculty Search Committee, 1991-1992, 1993-1994, 1996-1997, 1998-1999.Served as a reader or examiner of a dozen or more Ph.D. dissertations.
Research Grants:
Junior Scholar Research Incentive Program Award, George Washington University, 1986.
University Research Grant, George Washington University, 1988.
IPA (Intergovernmental Personnel Act) assignment. Funded by National Agricultural StatisticsService, July 1997 - August 1 !)98
Co-PI on a cooperative research agreement with the Office of Waters of the US EnvironmentalProtection Agency, 1999-2001.
Statistical Methods in Marketing Research. (PI), Capital One Services, Inc., 2004-2005.