29
The Archipelago Economy : Unleashing Indonesia’s Potential Syndicate 5 Andy Eko (29114083) Eka Taruna (29114095) Kamilius Tegun (29114101) Prayogi Purnapandhega (29114106) Satam (29114111)
| Date post: | 08-Feb-2017 |
| Category: |
Business |
| Upload: | prayogi-purnapandhega |
| View: | 79 times |
| Download: | 0 times |

The Archipelago Economy : Unleashing Indonesia’s
Potential
Syndicate 5Andy Eko (29114083)
Eka Taruna (29114095)Kamilius Tegun (29114101)
Prayogi Purnapandhega (29114106)Satam (29114111)

The Archipelago Economy: Unleashing Indonesia’s Potential - McKinsey Report, September 2012
Indonesia By 2030Indonesia Today
Challenges:1.Productivity improvement2.Uneven distribution of growth3.Infrastructure and resource constraints
Favorable Population
2Source: Ministry of Finance Presentation on Feb 28, 2013
15.2
21.4
26.2
27.0
28.1
28.9
34.8
37.7
38.6
43.0
53.5
54.1
73.3
51.2
58.8
55.4
47.6
45.5
46.1
53.9
32.8
33.9
38.5
27.1
32.0
20.6
3.2
1.5
3.1
5.6
0.8
3.1
0.7
3.3
2.4
2.2
0.8
0.5
30.4
18.3
15.4
19.8
25.6
21.9
10.6
26.2
25.2
16.3
18.6
13.9
7.0
Taiwan
Hong Kong
Japan
Australia
Philippines
South Korea
Singapore
Vietnam
Thailand
Malaysia
Indonesia
India
China
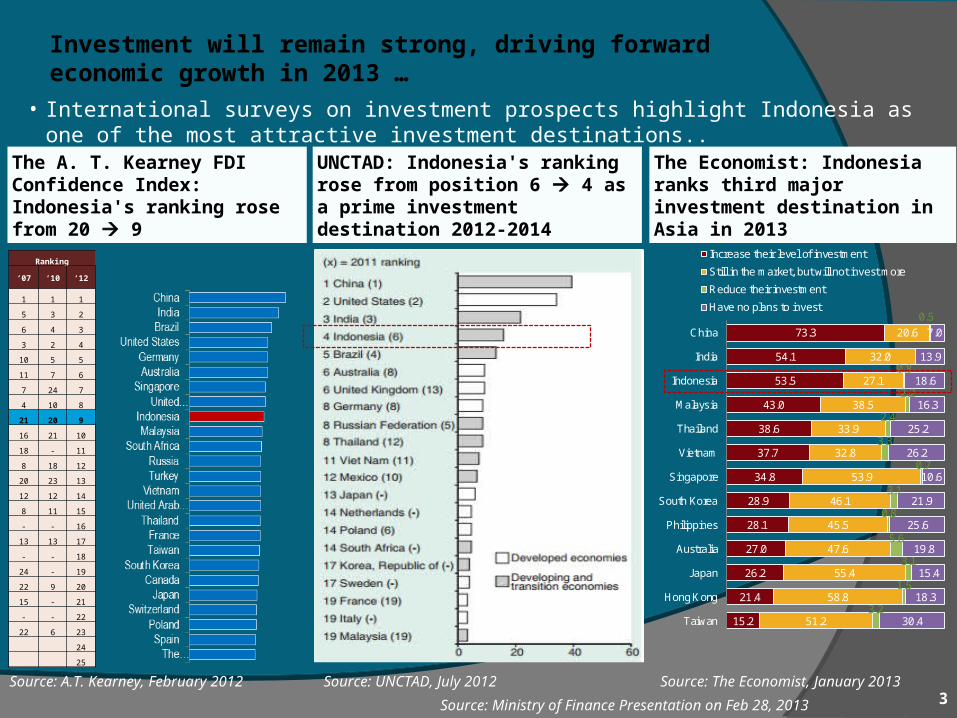
Increase their level of investmentStill in the market, but will not invest moreReduce their investmentHave no plans to invest
The A. T. Kearney FDI Confidence Index: Indonesia's ranking rose from 20 9
• International surveys on investment prospects highlight Indonesia as one of the most attractive investment destinations..
Investment will remain strong, driving forward economic growth in 2013 …
UNCTAD: Indonesia's ranking rose from position 6 4 as a prime investment destination 2012-2014
The Economist: Indonesia ranks third major investment destination in Asia in 2013
Source: A.T. Kearney, February 2012
Source: UNCTAD, July 2012 Source: The Economist, January 2013 3
Ranking
‘07 ‘10 ‘12
1 1 1
5 3 2
6 4 3
3 2 4
10 5 5
11 7 6
7 24 7
4 10 8
21 20 9
16 21 10
18 - 11
8 18 12
20 23 13
12 12 14
8 11 15
- - 16
13 13 17
- - 18
24 - 19
22 9 20
15 - 21
- - 22
22 6 23
24
25
Source: Ministry of Finance Presentation on Feb 28, 2013
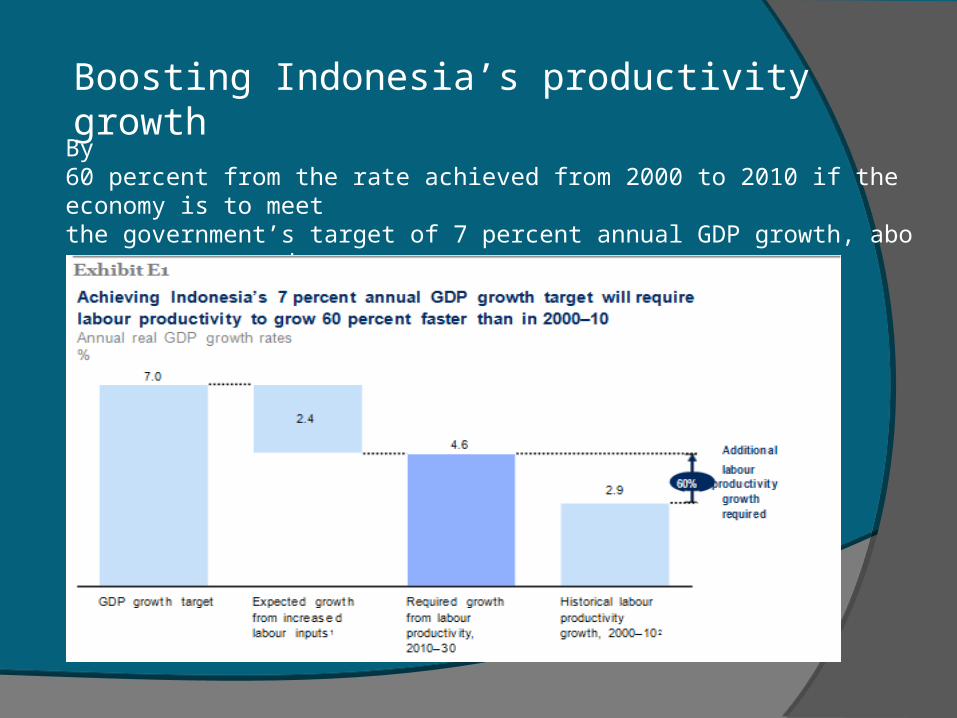
By 60 percent from the rate achieved from 2000 to 2010 if the economy is to meetthe government’s target of 7 percent annual GDP growth, above current trendgrowth of between 5 and 6 percent
Boosting Indonesia’s productivity growth
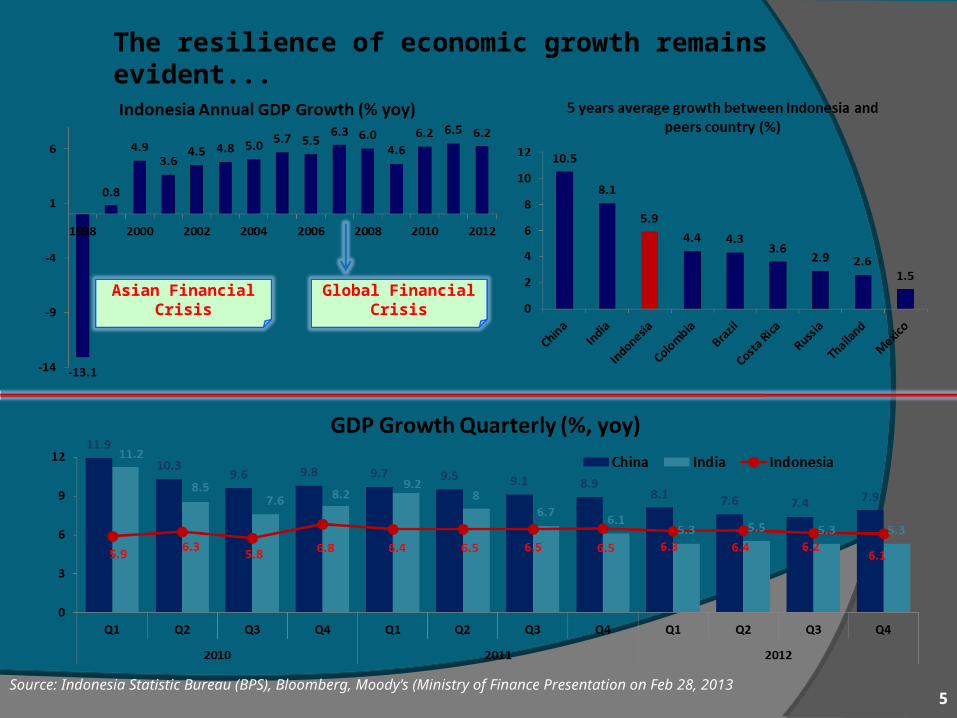
The resilience of economic growth remains evident...
Source: Indonesia Statistic Bureau (BPS), Bloomberg, Moody’s (Ministry of Finance Presentation on Feb 28, 20135
Global Financial Crisis
Asian Financial Crisis
The majority of Indonesia’s productivity gain has come not from a shift ofworkers from lower-productivity agriculture into more productive sectors, butfrom productivity improvements within sectors. The three sectors making contributions to this productivity improvement are : 1.wholesale and retail trade; 2.transport equipment and apparatus manufacturing; 3.transport and telecommunications. Annual average growth of Indonesia is 6.4 % since 2002, compared with Jakarta’s 5.8 %.
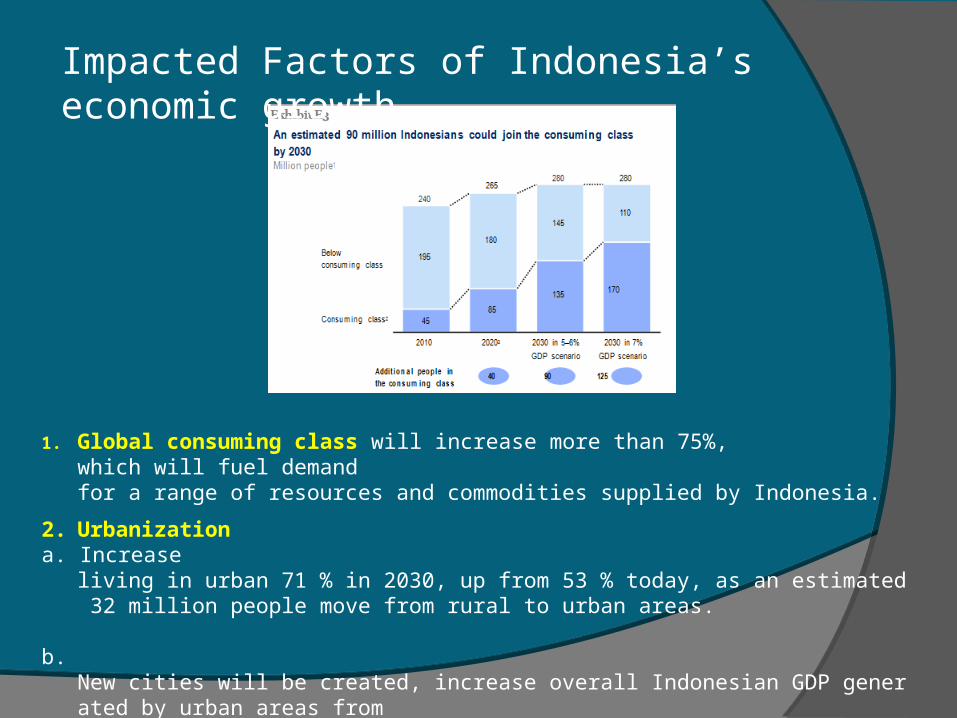
1. Global consuming class will increase more than 75%, which will fuel demand for a range of resources and commodities supplied by Indonesia.
Impacted Factors of Indonesia’s economic growth
2. Urbanization a. Increase
living in urban 71 % in 2030, up from 53 % today, as an estimated 32 million people move from rural to urban areas.
b. New cities will be created, increase overall Indonesian GDP generated by urban areas from
an estimated 74 % today to 86 % in 2030.

3. Growing working age populationIndonesia’s young and expandingpopulation could total 280 million by 2030, up from 240 million today
. 4. Emerging digital and technology driven nation
Green technologies could also dramatically change the resourcemarket in coming years. For instance, Indonesia is home to 40 perce
nt of theworld’s potential geothermal energy sources. If fully exploited, these
couldgenerate up to 24 terawatt hours a year—
roughly equivalent to 70 percent ofJakarta’s annual energy consumption today.


1. Transform consumer services • Telecommunications and broadband Internet• In financial services, regulation• In retail trade, limiting competition• In transportation, poor or insufficient infrastructure
2. Boost productivity in agriculture and fisheries • Increased demand due to global consumer growth • Environmental concern and urbanization
are both reasons that increases in production need to come from more intensive production systems rather than more extensive land use.
• In agriculture, if Indonesia pursued three approaches—boosting yields, shifting production into high-value crops, and reducing post-harvest and value-chain waste—Indonesia could become a large net exporter of agriculture products, supplying more than 130 million tons to the international market.
Indonesia’s Economy Faces Several Challenges— And Action In Four Areas Will Be Critical To Addressing Them :
3. Build a resource-smart economy•Maximize its energy supply from unconventional sources such as next-generation biofuels, geothermal power, and biomass, and to more productively extract, convert, and use natural resources such as energy, steel, and water.
•Using more efficient methods to generate power, improving transportation, and retrofitting and constructing more energy-efficient buildings could together reduce 2030 energy demand by as much as 15 percent.4. Invest in skill building•In order to achieve our base-case projection of between 5 and 6 percent annual GDP growth, demand estimation for semi-skilled and skilled workers will increase from today’s level of 55 million to 113 million by 2030, a rise of almost 60 million workers.
•Increasing skilled workers by : 1. Raise the standard of teaching
significantly, with an emphasis on attracting and developing great teachers;
2. Develop a more demand-driven curriculum; and 3. Create new, flexible education pathways.

BUSINESS $1.8 TRILLION OPPORTUNITY ƒ
1.Consumer services. With an additional 90 million consumers expected inIndonesia, consumer spend in urban areas could increase at 7.7 percent ayear to become a $1.1 trillion business opportunity by 2030.
2. ƒAgriculture and fisheries. Revenue from agriculture and fisheries could
increase at a rate of 6 percent per year to reach $450 billion by 2030.Revenue from production could increase to $250 billion. The downstrea
mfood and beverages industry could develop into a $180 billion opportun
ity,while upstream activities, such as machinery, fertilizer, and seeds could
offeradditional annual potential of $10 billion and total potential of $20 billio
n a year.
3. Resources. In 2030, the Indonesian energy market could be worth about
$270 billion. New sources of energysuch as geothermal and bio-
fuels could grow rapidly at rates of more than10 percent a year to become over a $60 billion market. However, the la
rgestpotential of an estimated $150 billion is likely to continue to come from
oil, gas,and coal.
4. ƒHuman capital. There is a large opportunity in private education, demand
for which could potentially increase four-fold from $10 billion a year to an
estimated $40 billion in 2030.

Five myths about Indonesia’s recent
growth
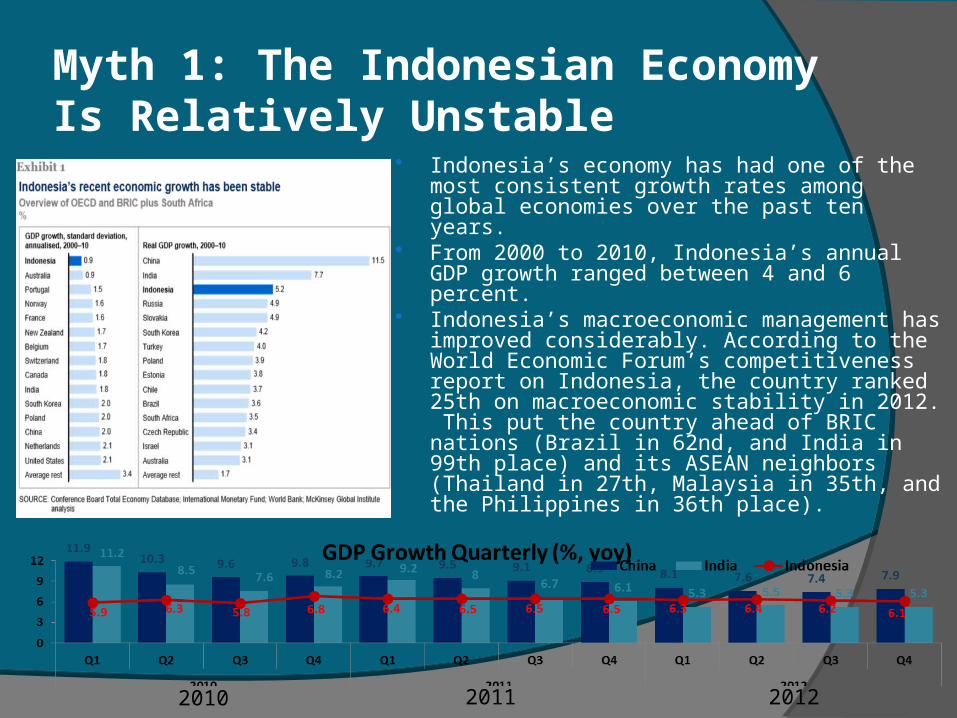
Indonesia’s economy has had one of the most consistent growth rates among global economies over the past ten years.
From 2000 to 2010, Indonesia’s annual GDP growth ranged between 4 and 6 percent.
Indonesia’s macroeconomic management has improved considerably. According to the World Economic Forum’s competitiveness report on Indonesia, the country ranked 25th on macroeconomic stability in 2012. This put the country ahead of BRIC nations (Brazil in 62nd, and India in 99th place) and its ASEAN neighbors (Thailand in 27th, Malaysia in 35th, and the Philippines in 36th place).
Myth 1: The Indonesian Economy Is Relatively Unstable
2010 2011 2012

Myth 2: Economic Growth Centre Almost Exclusively On Jakarta
Some assume that Indonesia’s growth comes almost entirely from its capital city, but this is not entirely correct. Indonesia’s growth comes almost entirely from its capital city, but this is not entirely correct.
Jakarta (Jabodetabek) is indeed the major contributor to Indonesia’s economic output, accounting between 1/5 and 1/4 of total.

Myth 3: Indonesia Follows The Asian Tigers’ Export-Driven Growth Model
• The so-called Asian Model – driven by investment and exports – is not ubiquitous. Indonesia is a case in point.
• In Indonesia, exports generate 35% of GDP.
• With only 11% non-commodity exports, Indonesia is lack of manufacturing export sector.
• Relatively high share of domestic consumption – insulated the economy during the global downturn or crisis.

Myth 4: Resources are the economy’s main driver
• Indonesia is the world’s largest producer and exporter of palm oil, the second-largest exporter of coal, and the second-largest producer of cocoa and tin.
• Palm oil, coal, and oil & gas remain critical to Indonesia’s trade balance as they represent 68% of export.
• Given the fluctuations in resource prices, the sensitivity of the trade balance of resource exports remains a source of concern.
• Indonesia coal prices fell by 10% in 2012 – one explanation for the country trade deficit.
*) Fluctuations in global resource prices could result in instability in Indonesia’s currency and even risk the stability of the economy as a whole.

Myth 5: Growth Has Come Largely from an Expanding Workforce
• Contrary to conventional wisdom, improving productivity, rather than a higher number of workers, has been the most important driver of Indonesia’s recent growth.
• Labor productivity has grown at a rate of almost 3 percent a year over the past decade, among the highest rates observed in ASEAN countries.

• 75% of 1.8 billion global consuming class over the next 15 year will be in Asia GDP tend to grow together with the urbanization.
• The growth of Asia region will rise the Indonesia’s export.
• Demands for resources and commodities from Indonesia
• Other potential economic activities is tourism.• Export of manufactured goods.
Indonesia In The Heart Of Resurgent Asia
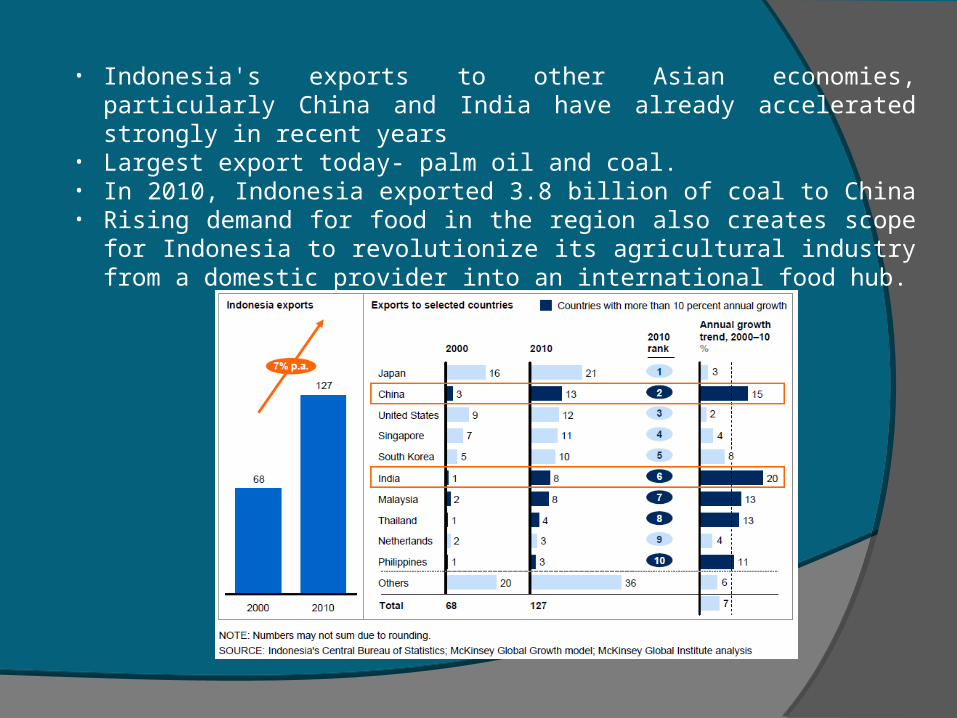
• Indonesia's exports to other Asian economies, particularly China and India have already accelerated strongly in recent years
• Largest export today- palm oil and coal. • In 2010, Indonesia exported 3.8 billion of coal to China • Rising demand for food in the region also creates scope for
Indonesia to revolutionize its agricultural industry from a domestic provider into an international food hub.
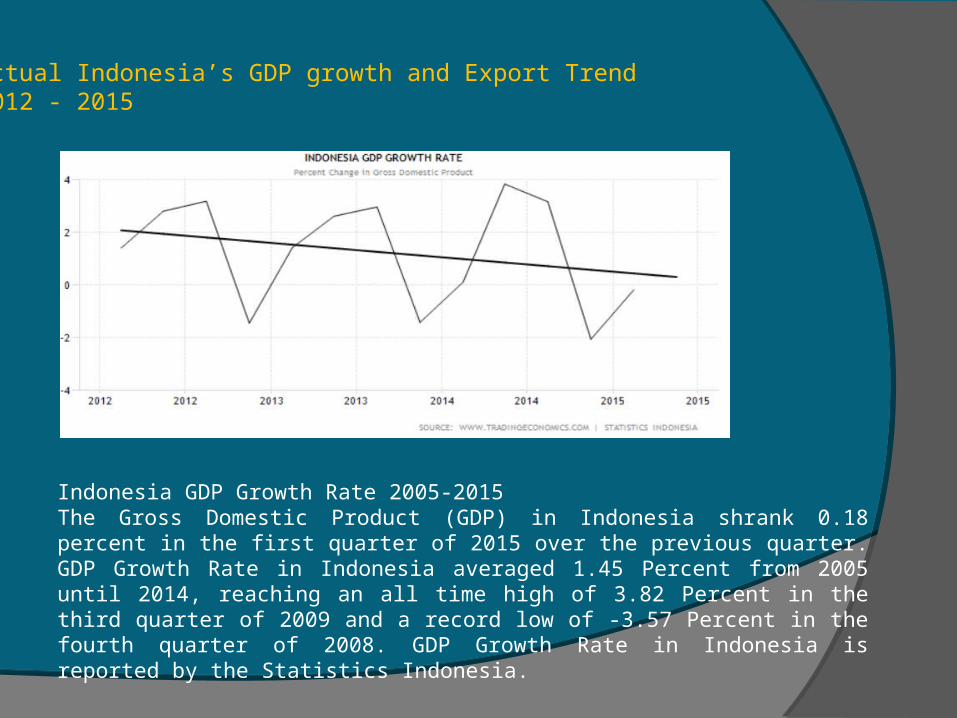
Actual Indonesia’s GDP growth and Export Trend2012 - 2015
Indonesia GDP Growth Rate 2005-2015 The Gross Domestic Product (GDP) in Indonesia shrank 0.18 percent in the first quarter of 2015 over the previous quarter. GDP Growth Rate in Indonesia averaged 1.45 Percent from 2005 until 2014, reaching an all time high of 3.82 Percent in the third quarter of 2009 and a record low of -3.57 Percent in the fourth quarter of 2008. GDP Growth Rate in Indonesia is reported by the Statistics Indonesia.

Actual Indonesia’s GDP growth and Export Trend2012 - 2015
Indonesia Exports 1960-2015Exports in Indonesia decreased to 13083.70 USD Million in April of 2015 from 13634.70 USD Million in March of 2015. Exports in Indonesia averaged 3785.25 USD Million from 1960 until 2015, reaching an all time high of 18647.83 USD Million in August of 2011 and a record low of 30 USD Million in January of 1961. Exports in Indonesia is reported by the Statistics Indonesia.
Future Mid-Sized Middleweights: Batam (Sumatra), expected to grow 6.4 percent per annum. The city is
benefitting from the SIJORI (Singapore-Johor-Riau), Growth Triangle that was started in 1989.
a) Signed a MoU on a Free Trade Zone that includes Batam and Bintan.
b) Offers foreign investors incentives, include a liberal tax regime and streamlined official administration.
Pekanbaru (Sumatra), The city’s economy has been one of the fastest growing over the past ten years, with a 9.8% compound annual growth rate fuelled by the commodity boom. Pekanbaru’s GDP will grow at an average of 7.3% a year to 2030.
Makasar (Sulawesi), The trade centre of eastern Indonesia. Over the past ten years, Makasar economy has grown at a 9% a year, largely due to productivity growth. Expected that the city will maintain rapid GDP growth of 7.1% a year.
24-24
Around 90 percent of the urban areas whose economies are growing faster than 7 percent per annum will be outside the island of javaThree cities that could double the populations from around one million today to about 2 million by 2030 are Batam, Pekanbaru and Makassar
Indonesia Could Take advantage of Disruptive Technologies
Opportunities Presented by disruptive or Game Changing Technologies Developments in digital communications, and In the resources field.
World Development Indicators There were 220 millions registered mobile subscription in Indonesia (2010). The Internet is becoming mainstream. The majority of Indonesian internet users are relatively new to medium. Growing number of organizations using digital media an opportunity to shape
online behavior.

A Customer survey developed to understand changing consumer behavior across digital experiences.
Indicating Indonesian enthusiasm for, and ease with digital applications. Indonesia has a solid platform from which to launch e-commerce.
(5% of internet users engage in e-commerce). Expected to rise as consumer confidence in the reliability and risk protection of
credit card transactions improves. Improve Access: Providers of Public goods like as health and education might
also use digital media. Digital Technologies are not the only ones showing promise for Indonesia.
Green Technologies could dramatically change the country’s resource markets. (renewable energies, with the largest geothermal resources in the world).
The Digital Consumer Asia Survey

Strong Growth Internet Access
Research in Asia shows that: Indonesia’s (1%) broadband penetrations lags behind that of its peers. Vietnam, for instance has more than 4% broadband penetration.
(in low and middle-income countries, every 10% points increase in broadband penetration accelerate economic growth by 1.4% points). - more than in high income countries and more than is the case with other telecommunication services).
Indonesia’s Consuming Class
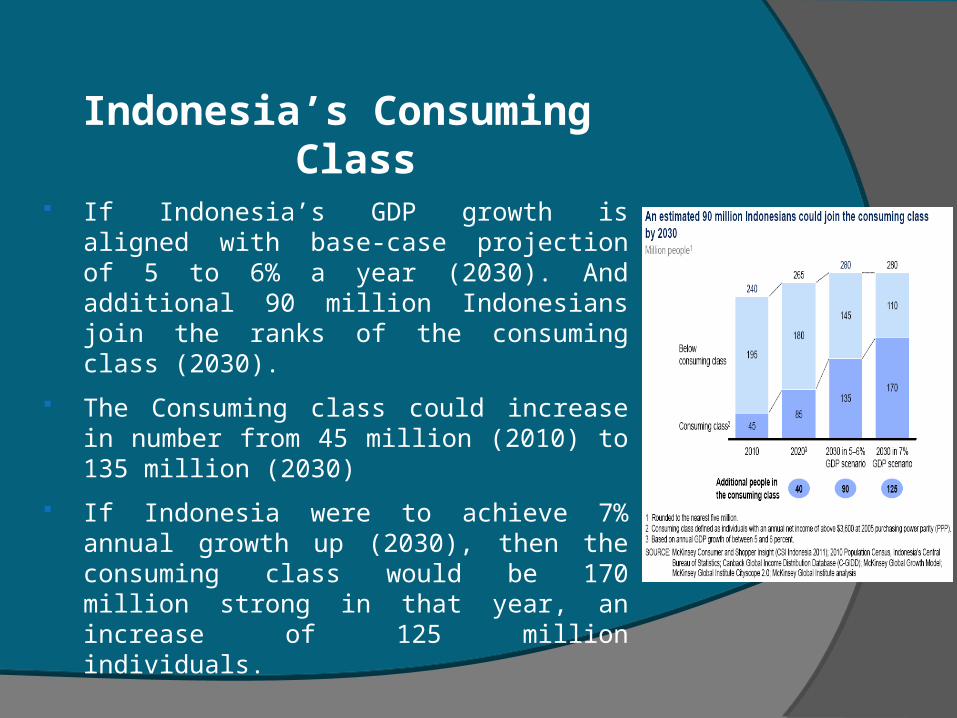
If Indonesia’s GDP growth is aligned with base-case projection of 5 to 6% a year (2030). And additional 90 million Indonesians join the ranks of the consuming class (2030).
The Consuming class could increase in number from 45 million (2010) to 135 million (2030)
If Indonesia were to achieve 7% annual growth up (2030), then the consuming class would be 170 million strong in that year, an increase of 125 million individuals.