48
Grupo LALA, S.A.B. de C.V. INVESTOR RELATIONS PRESENTATION December, 2016

Grupo LALA, S.A.B. de C.V.
INVESTOR RELATIONS PRESENTATION
December, 2016

1949 1980 1990 2000 2010 2015

ABOUT US

WHO WE ARE
LALA is a Mexican Company focused in thehealthy and nutritious food industry with over65 years of experience in the production,innovation and marketing of milk and dairyproducts under the highest quality standards.LALA operates 22 production plants and 164distribution centers in Mexico, CentralAmerica and United States, and is supportedby more than 34,000 employees. LALAoperates one of the largest chilled distributionnetworks in the region, with 6,500+ deliveryroutes. Our product portfolio includes over 600SKUs under 56+ brands, which are available atmore than 550,000 points-of-sale.
“Nourishing your life is our passion”
“To be the favorite dairy company in the Americas”
MISSION
VISION
4

OUR FOOTPRINT
MexicoUnited StatesGuatemalaHondurasEl SalvadorNicaraguaCosta Rica
5

OUR PRODUCTS

MILK
7 Milk: Pasteurized, UHT and functional milks, pasteurized and UHT dairy-based beverages, and powdered milk.

OTHER DAIRY PRODUCTS
8 Other Dairy Products: Cream, butter, cream-based spreads, yoghurt, cheese, ice cream and desserts.

BEVERAGES AND OTHERS
9 Beverages and Others: Beverages, juices, cold cuts and other income.

COMSUMPTION & DAIRY OUTLOOK
“Investing today to capture Mexico´s future growth opportunities”

CONSUMER OUTLOOK
11
Today’s market trends and consumption are movingtowards foods and beverages categories that havefunctional benefits.
More than half the consumers across allgenerations are willing to pay a premium forproducts that provide health benefits.
The reinvention of dairy as a completely natural foodplays an important role in this consumer trend.
Creating new products that appeal to the health trendis not enough—marketing, processing technology and
convenience are important factors to be consider.

(1) Central America includes: Costa Rica, Dominican Republic, Guatemala, Nicaragua and other Central America / Caribean countries.(2) Others includes: Ecuador, Bolivia, Uruguay, Venezuela and other South America Countries.
Source: Euromonitor, Company information.
World Dairy Market value is ~US$550 billion.
The U.S., Mexico and Central America represents 58.0% of total Americas Dairy Market.
Americas Dairy Market it´s projected to grow by ~US$16 billion in next 5 years.
AMERICAS DAIRY MARKET
12
TOTAL AMERICAS DAIRYMARKET VALUE IS ~US$160 BILLION
Brazil México
46%
USA
24%
Brazil
9%
8%
México
Canada
3% Central America2% Others
3% Colombia
2% Argentina
1% Peru
2% Chile

“Sustainable Growth Strategy”
LALA 2016 STRATEGIC PRIORITIES

ACCELERATING ORGANIC GROWTH IN MEXICO
On-trend products and packing innovation
World-Class go-to market execution
New marketing campaign
14

ON-TREND PRODUCTS AND PACKING INNOVATION
15
LALA 100
Since the introduction of LALA 100 only 3 monthsago the fresh milk category has reached doubledigit growth (10.5% vs P8´15) with 85% of thegrowth coming from LALA 100.
*Considering the data reported by Nielsen in their ScanTrack service for the Fresh Milk category (without milk formula). Growth comparingP8 2016 vs P8 2015 in Total Mexico. Weighted distribution considered as the maximum reached since launch (June 2016)
Innovation capable of changing the habits of consumers

ON-TREND PRODUCTS AND PACKING INNOVATION
16
CHEESE
• New resealable technology• Shredded and slice presentation• Non-lactose
NUTRI LECHE PANELA CHEESE
• Leverage Nutri Leche franchise to increase product offering among emerging consumers

ON-TREND PRODUCTS AND PACKING INNOVATION
17
LALA SEMILLAS
• Super food seeds• Low sugar and fat content

ON-TREND PRODUCTS AND PACKING INNOVATION
18
NUTRI LECHE
• Top-five consumer brand in Mexico• Annual sales above US$1 billion• Nutri umbrella brand to increase product
offer among low-incomes classes

99%
98%
99%
75%
89%
85
39
37
27
20
Source: Kantar Worldpanel 20151. Penetration based on number of households that purchase a brand;2. Frecuency of purchase (# of times per year)
MEXICO TOP FIVE CONSUMER BRANDS
19
FREQUENCYPLACE BRAND PENETRATION
The Largest Healthy FoodCompany in Mexico
Classified among Mexico´s top five consumer brands.

DEVELOPING INTERNAL CAPABILITIES
20
ARIBA Software implementation
STRATEGIC PROCUREMENT
Improve Customer Service
SALES & OPERATIONAL PLANNING
Structure and location
SHARED SERVICE STRUCTURE
2Pre-sale Motorcycle
Secondary Distribution Vehicle
Handheld Device
+900 distribution routes with pre-sale

EXPAND & CONSOLIDATE CENTRAL AMERICA OPERATIONS
Distribution Capacity
Raw milkSupply assurance
Production Capacity
New Central America headquarters in Panama
Production Plant San Ramón Alajuela, Costa Rica
Costa Rica agreement with Florida Bebidas adds:
21

M&A AND ALLIANCES
22
OPPORTUNITIES
The Americas
Dairy & Dairy alternatives
Infrastructure, brands, value- added categories and talent.
LALA OPERATES IN 7 COUNTRIES
REGION
MARKET
ADDING
Our Strategy Follows
a Disciplined Process

LALA U.S. PORTFOLIO
23
“Building brands to grow the business”

LALA U.S. PRODUCTION FACILITIES
24
OMAHA, NEBRASKA
FLORESVILLE, TEXAS
SINTON, COLORADO
• Drinkable Yoghurt• Spoonble Yoghurt
• Sour Cream
• ESL Milk• Cultured
• ESL Milk

25
While blended yoghurt is declining, drinkable is growing
double digit
“Drinkable yoghurt represents 9.0% of the total yoghurt category value in the U.S.”
Source: IRI; US MULO (MULti-Outlet) 26 Weeks Ending 8-28-16
91% Yoghurt
(Blended)
9% YoghurtDrinks
+11.5%
(1.7)%
U.S. YOGHURT CATEGORY OVERVIEW
+$3.88B USD
LALA U.S. YOGHURT MARKET

LALA U.S. PREMIUM MILK
26
Jersey Cows less than 10% of milk supply
Natural Milk Higher ProteinHigher CalciumSimple IngredientsRicher, Creamier Texture
“Right Time for Promised Land National Expansion”

Sept. 2016ACV: 64.0%
16,796 STORES
Presence in Big Retailers
with nationwide exposure
27
;LALA yoghurt brand is growing twice (21.2%) as fast as the drinkable yoghurt category
LALA U.S. is the Brand Leader in Adult Drinkable Yoghurts and the #2 in total
Drinkables which includes kids
Source: IRI; US MULO (MULti-Outlet) 26 Weeks Ending 8-28-16
LALA U.S. PRESENCE

CAPEX INVESTMENTS 2016
A total investment of +3,000mm MXN
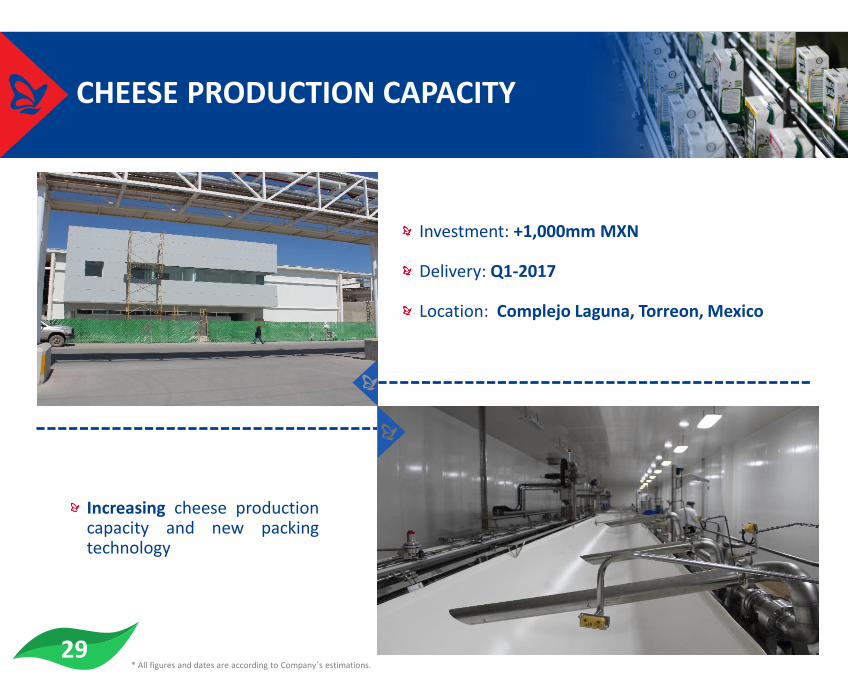
CHEESE PRODUCTION CAPACITY
29
Investment: +1,000mm MXN
Delivery: Q1-2017
Location: Complejo Laguna, Torreon, Mexico
* All figures and dates are according to Company´s estimations.
Increasing cheese productioncapacity and new packingtechnology

WHITE BASE CAPACITY (YOGHURT)
30
Investment: +250mm MXN
Delivery: Q4-2016
Location: Complejo Irapuato, Irapuato, Mexico
* All figures and dates are according to Company´s estimations.
Increase of production capacity andnew topping technology

WATER TREATMENT PLANT
Investment: +100mm MXN
Delivery: Q3-2016
Location: Complejo Laguna, Torreon, Mexico
New facility for water treatment
31

NEW PASTEURIZATION PLANT, NORTH MEXICO
32
Construction of a new state of the art pasteurization facility
* All figures and dates are according to Company´s estimations.
Investment: +300mm MXN
Delivery: Q2-2017
Location: Cd. Obregon, Mexico

AUTOMATED INDUSTRIALWAREHOUSE
33
Investment: +200mm MXN
Delivery: Q3-2016
Location: Complejo Irapuato, Irapuato, Mexico
* All figures and dates are according to Company´s estimations.
New automated industrial warehouse to increase storage capacity100% Refrigerated capacityUp to 23,000 storage positions

NANO FILTRATION - LALA 100 MILK
34
Investment: +200mm MXN
Delivery: Q3-2016
Location: Aguascalientes, Mexico
* All figures and dates are according to Company´s estimations.
Production capacity using Nano-Filtration TechnologyThe first production line withPET packing material in Mexicoand Central America

NEW TETRA PAK EQUIPMENT OF 1.5L UHT PRODUCTS
35
Investment: +100mm MXN
Delivery: Q4-2016
Location: Aguascalientes, Mexico
* All figures and dates are according to Company´s estimations.
New equipment andtechnology for Tetra Pakpacking of 1.5L for UHTproducts

OTHER INVESTMENTS
36 * All figures and dates are according to Company´s estimations.
Investment: +300mm MXN
New UHT Multi-Packing Complejo Laguna - Torreon, Mexico
Increase of production capacity Guadalajara, Mexico
Increase cooler space at point of sale

37
KEY FINANCIAL INFORMATION

FINANCIAL RESULTS (P&L)
Income Statement(1) 3Q-15 % 3Q-16 % Growth
Net Sales $ 12,176 100.0% $13,701 100.0% 12.5%
Gross Profit 4,714 38.7% 5,055 36.9% 7.2%
Operating Income 1,404 11.5% 1,048 7.7% (25.3)%
EBITDA(2) 1,695 13.9% 1,483 10.8% (12.5)%
Net Income 976 8.0% 753 5.5% (22.8)%
1. Company Data, in Mexican Pesos. (´000)2. EBITDA=Earnings Before Interest, Taxes, Depreciation and Amortization.
38
3 MONTHS ENDED SEPTEMBER 30, 2016
SALES BY TRADE CHANNELS 2016
57.0% 43.0%

SALES BY SEGMENT
39
Segment 3Q-15 3Q-16 % Variation
Milk $ 7,883 $8,595 9.0%
Other Dairy Products 3,690 4,385 18.8%
Beverages and Other 603 721 19.6%
62.7% 32.0% 5.3%
1. Company Data, in Mexican Pesos. (´000)

3Q-2016 NET SALES BRIDGE
(*) Company Data, in Mexican Pesos. (´000)(1) Organic: Volume and pricing.(2) CAM: Guatemala, Nicaragua & Costa Rica.(3) Inorganic: Additional sales from acquisitions.
40
$798
6.5%$179
1.5%$548
4.5%
YEAR-ON-YEAR GROWTH
3M ended September 30th,2016
(1) (3) (3)
(2)

41
3Q-2016 EBITDA MARGIN BRIDGE
13.9%
10.8%
ONE-OFFSHORT-TERM ONGOING
IMPACTS
(2)
3M ended September 30th, 2016
YEAR-ON-YEAR CONTRACTION (bps)
(*) Company Information, (bps) basis points.(1) FX (Peso/Dollar): Exchange rate depreciation effect over total COGS exposure.(2) CAM: Guatemala, Nicaragua & Costa Rica.(2) CAM Integration: Extraordinary effects from production consolidation & Venezuela sales short-fall.(3) Net dilutive effect from consolidating 2 months of the US Branded Business.(4) Corporate Restructure: One-offs from headcount reduction, Shared Services provisions & others.
(1) (3) (4)

YEAR TO DATE RESULTSHIGHLIGHTS
1. Company Data, in Mexican Pesos. (´000)2. EBITDA=Earnings Before Interest, Taxes, Depreciation and Amortization.
42
5,008 5,260
9M-15 9M-16
2,919 2,965
9M-15 9M-16
35,65339,113
9M-15 9M-16
9 MONTHS ENDED SEPTEMBER 30, 2016
NET SALES (1)
(MXN$mm)
100.0% 100.0%
EBITDA (2)
(MXN$mm)NET INCOME (1)
(MXN$mm)
Margin
14.0% 13.4% 8.2% 7.6%
Margin Margin

Source: Company InformationRatios are calculated in local currencyFigures in Mexican Pesos (´000)
3Q-15 3Q-16
Total Debt (MXN$mm)
Cash (MXN$mm)
$58
$2,268
$6,263
$10,071
STRONG FINANCIAL POSITION
AS OF SEPTEMBER 30,
43
Key Metrics 3Q-15 3Q-16
Net Debt / EBITDA (1.5)x (0.6)x
EBITDA / Interest Paid 527.9x 371.5x
EARNINGS PER SHARE $1.46 $1.59
Financial Position 2015 2016
Total Assets $34,354 $39,773
Cash 10,071 6,263
Total Liabilities 9,318 12,265
Shareholder Equity 25,035 27,508

30.00
32.00
34.00
36.00
38.00
40.00
42.00
44.00
46.00
48.00
17
-11
-15
13
-12
-15
08
-01
-16
03
-02
-16
29
-02
-16
26
-03
-16
21
-04
-16
17
-05
-16
12
-06
-16
08
-07
-16
03
-08
-16
29
-08
-16
24
-09
-16
20
-10
-16
Source: Company Information, Bolsa Mexicana de Valores, Analyst Research.
SHAREHOLDERS STRUCTURE
2,475,932,111 shares
LALA B OVERVIEW
44
(22.7)%
SHARE PRICE DECLINED YTD
US$5.7mm
AVERAGE DAILY LIQUIDITY 2016
November 14th, 2016 (LALA B)
OWNERSHIP
STRUCTURE
55.0% Control Trust
21.4% Free Float
1.1% Others
22.5% Underwriting
Trust
$30.86
14
-11
-16

DISCLAIMER
This material does not constitute an offering document. This material was prepared solely for informational purposes and is not to beconstrued as a solicitation or an offer to buy or sell any securities. Any offering of securities will be made solely by means of an offeringmemorandum, which will contain detailed information about the Company and its business and financial results, as well as its financialstatements.
Securities may not be offered or sold in the United States unless they are registered or exempt from registration under the U.S. SecuritiesAct of 1933, as amended.
This presentation includes forward-looking statements or statements about events or circumstances which have not yet occurred. Wehave based these forward-looking statements largely on our current beliefs and expectations about future events and financial trendsaffecting our businesses and our future financial performance. These forward-looking statements are subject to risk, uncertainties andassumptions, including, among other things, general economic, political and business conditions, both in Mexico and in Latin America as awhole. The words “believes”, “may”, “will”, “estimates”, “continues”, “anticipates”, “intends”, “expects”, and similar words are intendedto identify forward-looking statements. We undertake no obligations to update or revise any forward-looking statements because of newinformation, future events or other factors.
In light of these risks and uncertainties, the forward-looking events and circumstances discussed in this presentation might not occur.Therefore, our actual results could differ substantially from those anticipated in our forward-looking statements.
No representation or warranty, either express or implied, is provided in relation to the accuracy, completeness or reliability of theinformation contained herein. It should not be regarded by recipients as a substitute for the exercise of their own judgment. We and ouraffiliates, agents, directors, employees and advisors accept no liability whatsoever for any loss or damage of any kind arising out of the useof all or any part of this material.
45
This material does not give and should not be treated as giving investment advice. You should consult with your ownlegal, regulatory, tax, business, investment, financial and accounting advisers to the extent that you deem it necessary,and make your own investment, hedging and trading decision based upon your own judgment and advice from suchadvisers as you deem necessary and not upon any information in this material.

46
CONTACT INFORMATION
Investor RelationsEnrique González+52 (55) 9177 [email protected]
Forward-looking statementsThis document contains certain assumptions, projections andforward-looking statements regarding the Company’s financialsituation, operative results and information, Grupo LALA’sbusiness and that of its subsidiaries as well as with regards tothe Company’s related plans and objectives. This executivesummery does not constitute a public securities offering onbehalf of LALA and is intended to be used for informationalpurposes only.
Stock InformationGrupo LALA has been traded under the ticker ‘LALA B’ on the Bolsa Mexicana de Valores (BMV) since October 16, 2013.
For more information: www.grupolala.com

“Nourishing your life is our passion”

http://www.grupolala.com/en1_Inversionistas?id=1


![1.5L 4-CYL - VIN [E]...1.5L 4-CYL - VIN [E] 1994 Toyota Paseo 1994 ENGINES Toyota 1.5L 4-Cylinder Paseo NOTE: For repair procedures not covered in this article, see ENGINE OVERHAUL](https://static.documents.pub/doc/80x56/5e9e94aeab46e3479946735d/15l-4-cyl-vin-e-15l-4-cyl-vin-e-1994-toyota-paseo-1994-engines-toyota.jpg)


