104
GRUPPO DE ECCHER 2011
GRUPPO DE ECCHER 2011
RIZZANI DE ECCHER S.P.A.
Via Buttrio, 36
33050 Cargnacco (UD) Italy
Tel. +39 0432 6071
Fax +39 0432 522336
Joint Stock Company incorporated in Italy
Share Capital
Euro 20,000,000.00 fully paid up
Member, Udine Chamber of Commerce
Registration no.115684
Department of Foreign Trade UD 002577
Companies Register of Udine
Tax ID & VAT Number IT00167700301
rizzanideeccher.com


1
Annual Report and Consolidated Financial Statements for the Financial Year 2011(1st January – 31st December)
During the Financial Year under reviewno material changes have occurredthat require corrections or adjustmentsto the Annual Reports of preceding years.The 2011 Annual Report was approved by theShareholders’ Annual General Meetingheld in Udine, Italy on 14th June 2012.
This Annual Report was printed in 2500 copies in July and circulated to shareholders and the public, including the financial community, employees of the company,main customers and suppliers.
For further information:[email protected]
Table of Contents
3 Letter from the Chairman
4 2011 at a glance
10 History
13 Strategies
15 Organisation
18 Quality is Innovation
20 Sustainable Development
23 Areas of business activity
24 General Building
28 Infrastructures
31 Engineering and Special Equipment for Bridges and Viaducts
32 Real Estate Development
33 Focus
45 Management Report
50 Notes to the 2011 Annual Report
51 Contents of the Consolidated Financial Statements
56 Balance Sheet Analysis
68 Income Statement Analysis
71 Independent auditors’ report
73 Consolidated Financial Statements
81 Appendices
89 Statutory Financial Statements of the Parent Company
3
LETTER FROM THE CHAIRMAN OF THE BOARD OF DIRECTORS
Dear Shareholders,
Notwithstanding an increase in order backlog, the continuing economic
and financial crisis that erupted globally in 2008 and the political upheavals
of the spring of 2011 in the Mediterranean basin have caused a temporary
reduction in Group turnover.
At € 359 million, the revenues marks a decrease of 26% as opposed to 2010,
which is mostly due to the cancellation or delays of important overseas
projects owing to the unfavourable global economic situation. Conversely,
operating income (EBIT) of € 21,7 million and net profit of € 14.7 million
emphasise an excellent performance.
The order backlog, notwithstanding the cancellation of contracts in Libya and
(partially) in Kuwait, increased from € 1,641 million to € 1,979 million, of
which roughly 1/3 in Italy and 2/3 abroad. This should be enough to ensure
the comeback in the next years to the levels of production of 2010 at least.
This Annual Report and the enclosed Financial Statements have been drawn
according to principles of transparency, independence, accuracy, complete-
ness and reliability. These principles will provide any reader (whether mem-
bers of the public, the financial community, customers, suppliers or Group
employees) with a fair and accurate picture of results achieved.
In closing, I would like to convey my sincere thanks to our employees for
their commitment and hard work towards the attainment of our corporate
objectives. I would also like to thank all our business and financial partners
for their continued support and contributions towards the Group’s success.
The Chairman
Marco de Eccher
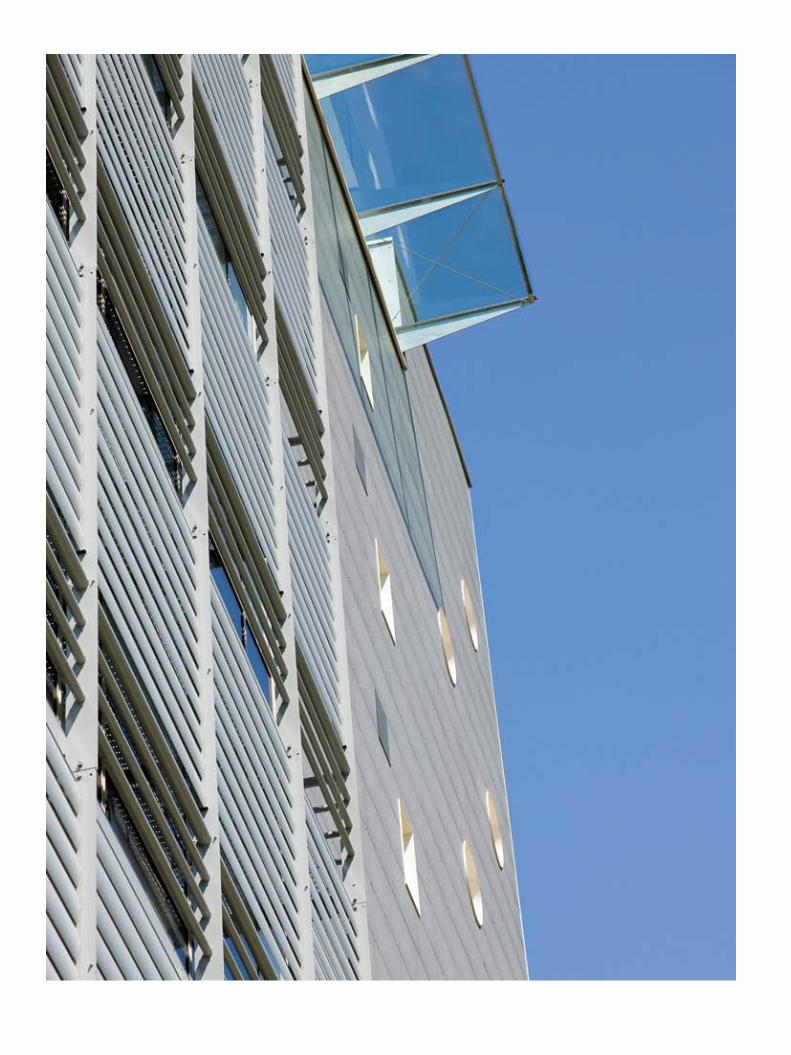
Preceding page:Office building Santa Monica, Udine (Italy)

4
2011 AT A GLANCE
As evidenced by the foregoing data, the economic and financial
position of the Group remains excellent from a structural
standpoint, with EBITDA and EBIT marking yet a slight
reduction in absolute terms but a significant increase relative
to revenues, and – more importantly – with a significant
improvement of the Group net financial position (inclusive of
short term and long-term debt relating to an ongoing leasing
contract), which is a positive € 80.6 million (as opposed to
€ 61.5 million in 2010). The sum of net current assets (NCA)
and net short term financial position (NFP) is € 45.8 million
(as opposed to € 26.8 million in 2010) and the corresponding
ratio is 1.15. The constant improvement of such financial
indicators over the preceding years bears testimony to the
Group’s ability to negotiate construction contracts that allow
for operational and financing needs to be funded directly by
payments from clients (advances and progress payments).
20102007
483,724
(447,761)35,963
7.4%(10,201)
25,7625.3%(947)
24,814(8,419)16,396
2,87313,523
80%23,724
2011
358,930
(326,249)32,681
9.1%(11,022)
21,6596.0%2,762
24,421(6,271)18,150
3,45314,697
67%25,719
488,618
(444,089)44,529
9.1%(7,653)36,876
7.5%95
36,971(13,268)
23,703531
23,172
70%30,825
492,628
(463,386)29,243
5.9%(6,773)22,470
4.6%(4,738)17,732(5,286)12,446
98111,465
74%18,238
2008
408,668
(377,270)31,398
7.7%(5,460)25,938
6.3%(2,355)23,583(7,387)16,196
69915,497
74%20,957
2009
Total revenues*
Total costs of production*Gross operating income (EBITDA) **% EBIDTA Depreciation and amortizationOperating income (EBIT)% EBITFinancial income/(expenses) and valuation adjustment of investmentsProfit or (loss) before income taxes (EBT)Income taxProfit or (loss) for the financial periodMinority share of profit for the financial periodConsolidated Group profit or (loss) for the financial period
Share value of production from overseasCash flow ***
* extraordinary income/charges included** EBITDA is conventionally calculated as the earning before depreciation and amortization, net financial income/(expenses), valuation adjustment of investment and income tax. Since the composition of EBITDA is not defined by the reference accounting standards, the criterion for its determination applied by the Group might not be consistent with that used by others and therefore not be comparable.*** consolidated Group profit + depreciation and amortization
economic and financial indicators[Euro thousand]
92,27691,209
163,396254,605199,132113,601312,733
(58,128)4,9881,2436,231
27,917108,497
23,357(103,937)
27,917
45,8091.15
82,43670,056
193,859263,915187,475122,395309,870
(45,955)4,5993,9798,578
27,90389,38111,228
(72,706)27,903
26,7511.09
38,77252,084
239,188291,272201,720
84,032285,752
5,5205,695
16,53722,232
22,06053,454
7,500(38,894)
22,060
44,4141.16
31,59576,652
194,949271,601178,031122,559300,591
(28,990)5,5042,1687,672
(5,067)58,762
9,100(72,929)
(5,067)
43,9391.15
70,86061,332
156,276217,608160,956106,207267,163
(49,555)4,9793,3308,309
12,99676,031
9,034(72,069)
12,996
22,5141.08
**** negative number = positive net short term financial position / positive number = negative short term financial position
Total non current assetsInventoryAccounts receivable Total current assetsDebts and other payables Advances from customersTotal current liabilities
Net current assets (NCA)Employees' severance indemnityProvision for contingencies and other liabilities Total non current liabilities
Net capital investedShareholders' equityNet medium and long term financial position Net short term financial position (NFP) ****
Total shareholders' equity and net financial position
NCA + NFPCurrent ratio

5
2010
25.8
13.5
23.2
36.9
2007 2008 2009
22.5
25.9
11.5
15.5
2010
80%
70%74%
74%
483.7
2011
358.9
67%
488.6
2007
492.6
2008
408.7
2009 2011
21.7
14.7
Revenues(millions of Euros)
= revenues = percentage generated abroad
net profit= EBIT
Income from operations (millions of Euros)
=
2007 2008 2009 2010
0.1 0.10.02
0.3
19.5 20.4
48.3
43.4
15.1
30.8 29.4
25.0
2007 2008 2009 2010
= ROI= ROE
2011
0
13.516.4
2011
Financial charges as a % of revenues Profitability [%]
2007 2008 2009 2010
2160
364 349
1219 793350801
1583
1142 1151
3771783
2007 2008 2009
11691081 1072
1641
92%
77%
68%
2010 2011
82%
1979
2011
439746
1185
= order book= percentage abroad
Number of employees = employees abroad= employees in Italy
Order book (millions of Euros)
66%
6
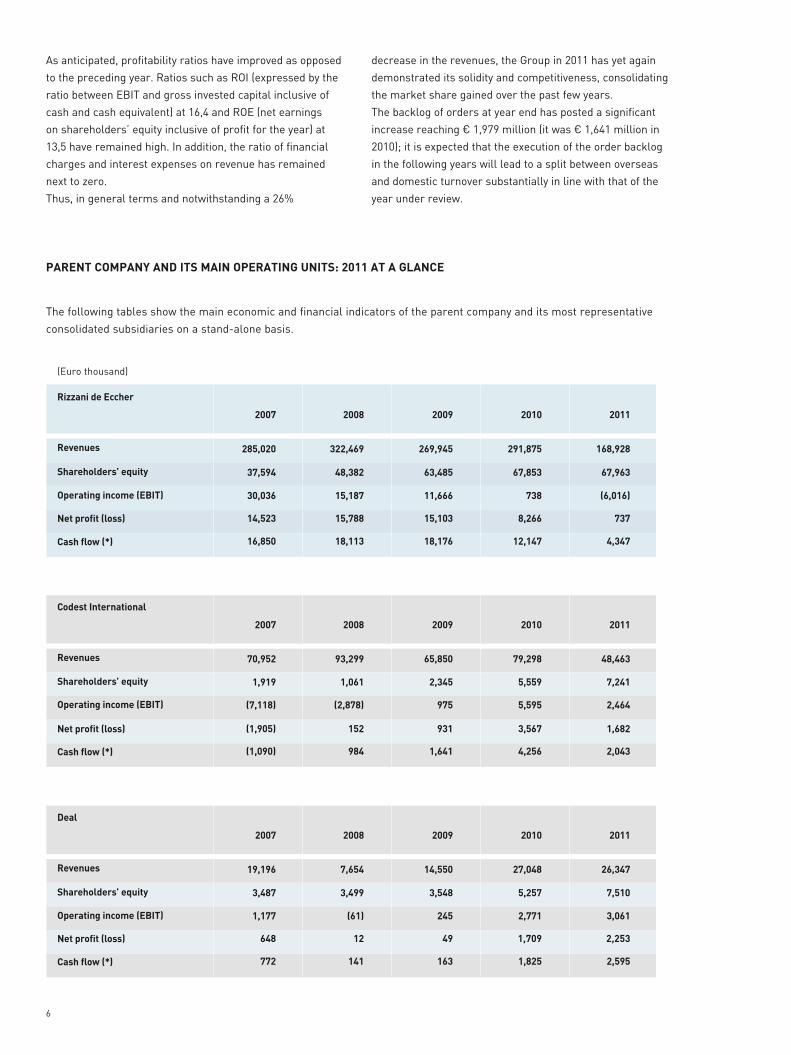
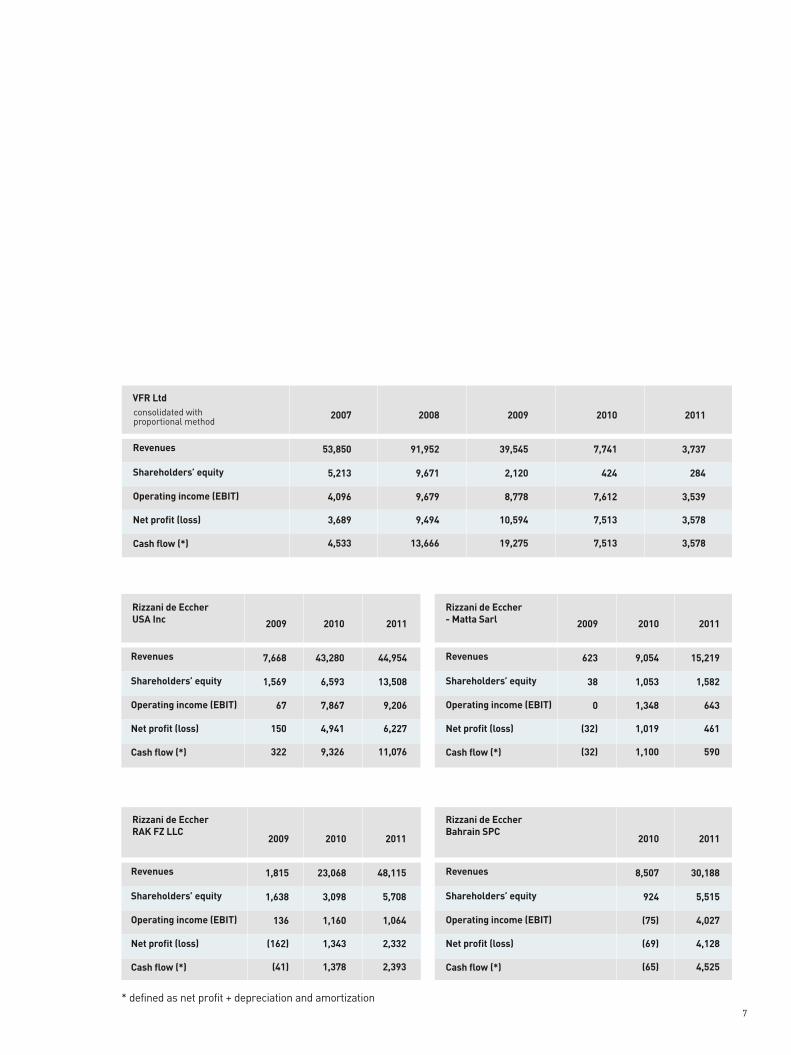
The following tables show the main economic and financial indicators of the parent company and its most representative
consolidated subsidiaries on a stand-alone basis.
PARENT COMPANY AND ITS MAIN OPERATING UNITS: 2011 AT A GLANCE
2009
269,945
63,485
15,103
18,176
11,666
2010
291,875
67,853
8,266
12,147
738
2007
285,020
37,594
14,523
16,850
30,036
2008
322,469
48,382
15,788
18,113
15,187
Rizzani de Eccher
2008
7,654
3,499
12
141
(61)
2009
14,550
3,548
49
163
245
2010
27,048
5,257
1,709
1,825
2,771
2007
19,196
3,487
648
772
1,177
Deal
2009
65,850
2,345
931
1,641
975
2010
79,298
5,559
3,567
4,256
5,595
2007
70,952
1,919
(1,905)
(1,090)
(7,118)
2008
93,299
1,061
152
984
(2,878)
Codest International
2011
168,928
67,963
737
4,347
(6,016)
2011
26,347
7,510
2,253
2,595
3,061
2011
48,463
7,241
1,682
2,043
2,464
Revenues
Shareholders’ equity
Net profit (loss)
Cash flow (*)
Operating income (EBIT)
Revenues
Shareholders’ equity
Net profit (loss)
Cash flow (*)
Operating income (EBIT)
Revenues
Shareholders’ equity
Net profit (loss)
Cash flow (*)
Operating income (EBIT)
As anticipated, profitability ratios have improved as opposed
to the preceding year. Ratios such as ROI (expressed by the
ratio between EBIT and gross invested capital inclusive of
cash and cash equivalent) at 16,4 and ROE (net earnings
on shareholders’ equity inclusive of profit for the year) at
13,5 have remained high. In addition, the ratio of financial
charges and interest expenses on revenue has remained
next to zero.
Thus, in general terms and notwithstanding a 26%
decrease in the revenues, the Group in 2011 has yet again
demonstrated its solidity and competitiveness, consolidating
the market share gained over the past few years.
The backlog of orders at year end has posted a significant
increase reaching € 1,979 million (it was € 1,641 million in
2010); it is expected that the execution of the order backlog
in the following years will lead to a split between overseas
and domestic turnover substantially in line with that of the
year under review.
(Euro thousand)
7
2008
91,952
9,671
9,494
13,666
9,679
2009
39,545
2,120
10,594
19,275
8,778
2010
7,741
424
7,513
7,513
7,612
2007
53,850
5,213
3,689
4,533
4,096
VFR Ltd
2011
44,954
13,508
6,227
11,076
9,206
Rizzani de Eccher USA Inc
Rizzani de Eccher- Matta Sarl
2009
7,668
1,569
150
322
67
2010
43,280
6,593
4,941
9,326
7,867
2011
15,219
1,582
461
590
643
2011
3,737
284
3,578
3,578
3,539
2010
9,054
1,053
1,019
1,100
1,348
2009
623
38
(32)
(32)
0
Revenues
Shareholders’ equity
Net profit (loss)
Cash flow (*)
Operating income (EBIT)
Revenues
Shareholders’ equity
Net profit (loss)
Cash flow (*)
Operating income (EBIT)
Revenues
Shareholders’ equity
Net profit (loss)
Cash flow (*)
Operating income (EBIT)
consolidated with proportional method
2011
48,115
5,708
2,332
2,393
1,064
Rizzani de Eccher RAK FZ LLC
Rizzani de Eccher Bahrain SPC 2011
30,188
5,515
4,128
4,525
4,027
2010
8,507
924
(69)
(65)
(75)
2010
23,068
3,098
1,343
1,378
1,160
2009
1,815
1,638
(162)
(41)
136
Revenues
Shareholders’ equity
Net profit (loss)
Cash flow (*)
Operating income (EBIT)
Revenues
Shareholders’ equity
Net profit (loss)
Cash flow (*)
Operating income (EBIT)
* defined as net profit + depreciation and amortization
8
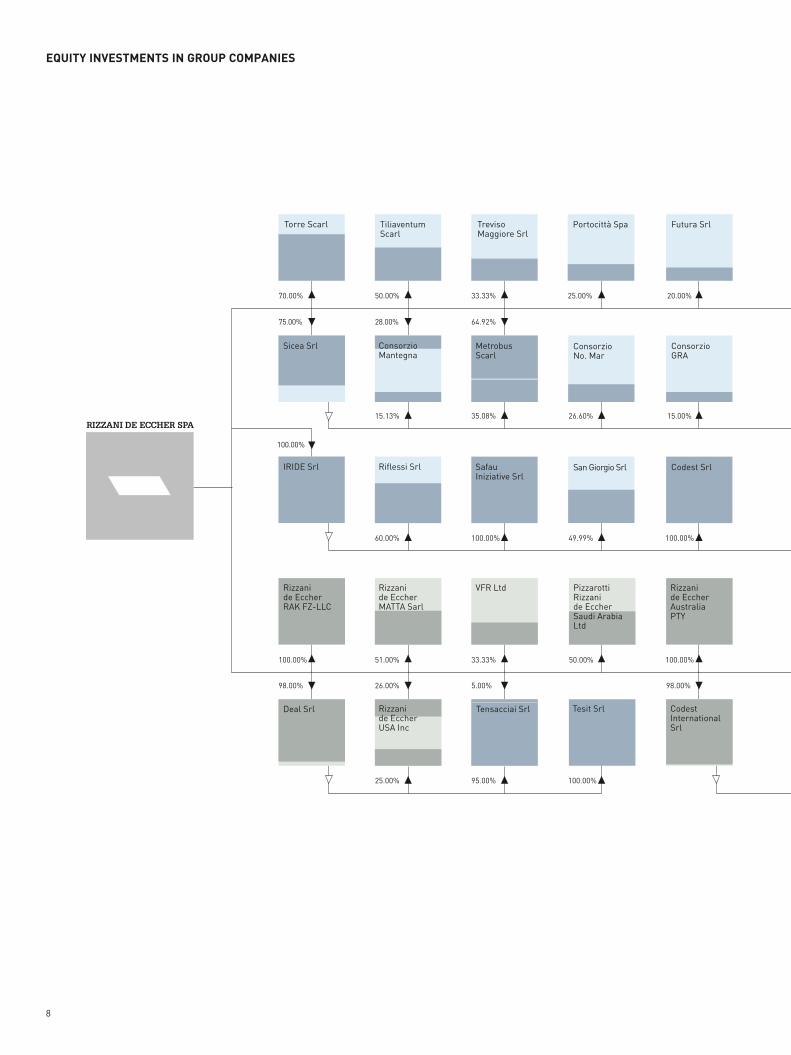
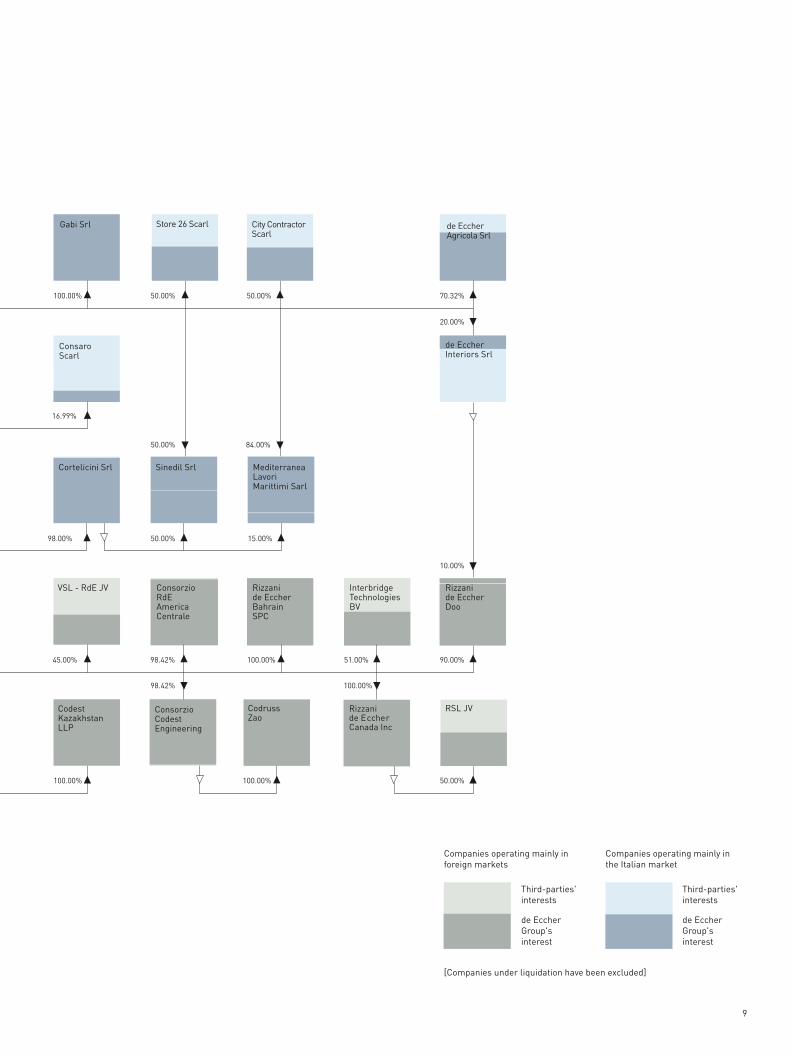
EQUITY INVESTMENTS IN GROUP COMPANIES
25.00%
Tiliaventum Scarl
26.00%
51.00%
Rizzani de EccherMATTA Sarl
28.00%
50.00%
15.13%
60.00%
Riflessi Srl
Rizzanide EccherUSA Inc
ConsorzioMantegna
26.60%
25.00%
Portocittà Spa
50.00%
PizzarottiRizzani de EccherSaudi ArabiaLtd
49.99%
San Giorgio Srl
Tesit Srl
100.00%
ConsorzioNo. Mar
20.00%
Futura Srl
98.00%
100.00%
Rizzani de EccherAustralia PTY
15.00%
100.00%
Codest Srl
CodestInternationalSrl
ConsorzioGRA
64.92%
33.33%
Treviso Maggiore Srl
33.33%
VFR Ltd
35.08%
5.00%
100.00%
Safau Iniziative Srl
Tensacciai Srl
MetrobusScarl
95.00%
IRIDE Srl
75.00%
70.00%
98.00%
100.00%
Rizzani de EccherRAK FZ-LLC
100.00%
Deal Srl
Torre Scarl
Sicea Srl
9
de EccherGroup'sinterest
Third-parties'interests
de EccherGroup'sinterest
Companies operating mainly inthe Italian market
Companies operating mainly inforeign markets
[Companies under liquidation have been excluded]
Third-parties'interests
50.00%98.00% 15.00%
100.00%
50.00%
20.00%
70.32%
10.00%
de EccherInteriors Srl
100.00%
Gabi Srl de Eccher Agricola Srl
50.00%100.00%
100.00%98.42%
98.42% 100.00% 51.00% 90.00%45.00%
Consorzio RdE AmericaCentrale
Rizzani de EccherBahrainSPC
InterbridgeTechnologiesBV
VSL - RdE JV Rizzani de EccherDoo
16.99%
ConsaroScarl
50.00%
City Contractor Scarl
50.00% 84.00%
Store 26 Scarl
Cortelicini Srl Sinedil Srl Mediterranea LavoriMarittimi Sarl
RSL JVConsorzioCodestEngineering
CodrussZao
Rizzani de EccherCanada Inc
CodestKazakhstanLLP
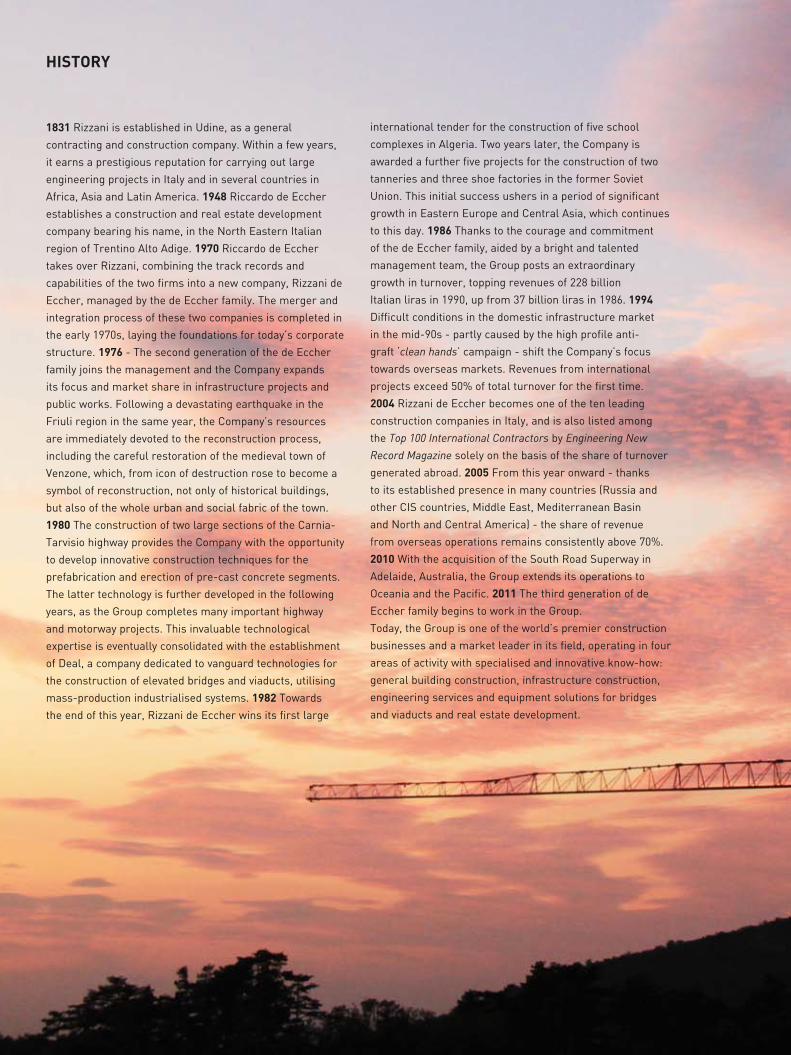
international tender for the construction of five school
complexes in Algeria. Two years later, the Company is
awarded a further five projects for the construction of two
tanneries and three shoe factories in the former Soviet
Union. This initial success ushers in a period of significant
growth in Eastern Europe and Central Asia, which continues
to this day. 1986 Thanks to the courage and commitment
of the de Eccher family, aided by a bright and talented
management team, the Group posts an extraordinary
growth in turnover, topping revenues of 228 billion
Italian liras in 1990, up from 37 billion liras in 1986. 1994
Difficult conditions in the domestic infrastructure market
in the mid-90s - partly caused by the high profile anti-
graft ‘clean hands’ campaign - shift the Company’s focus
towards overseas markets. Revenues from international
projects exceed 50% of total turnover for the first time.
2004 Rizzani de Eccher becomes one of the ten leading
construction companies in Italy, and is also listed among
the Top 100 International Contractors by Engineering New
Record Magazine solely on the basis of the share of turnover
generated abroad. 2005 From this year onward - thanks
to its established presence in many countries (Russia and
other CIS countries, Middle East, Mediterranean Basin
and North and Central America) - the share of revenue
from overseas operations remains consistently above 70%.
2010 With the acquisition of the South Road Superway in
Adelaide, Australia, the Group extends its operations to
Oceania and the Pacific. 2011 The third generation of de
Eccher family begins to work in the Group.
Today, the Group is one of the world’s premier construction
businesses and a market leader in its field, operating in four
areas of activity with specialised and innovative know-how:
general building construction, infrastructure construction,
engineering services and equipment solutions for bridges
and viaducts and real estate development.
HISTORY
1831 Rizzani is established in Udine, as a general
contracting and construction company. Within a few years,
it earns a prestigious reputation for carrying out large
engineering projects in Italy and in several countries in
Africa, Asia and Latin America. 1948 Riccardo de Eccher
establishes a construction and real estate development
company bearing his name, in the North Eastern Italian
region of Trentino Alto Adige. 1970 Riccardo de Eccher
takes over Rizzani, combining the track records and
capabilities of the two firms into a new company, Rizzani de
Eccher, managed by the de Eccher family. The merger and
integration process of these two companies is completed in
the early 1970s, laying the foundations for today’s corporate
structure. 1976 - The second generation of the de Eccher
family joins the management and the Company expands
its focus and market share in infrastructure projects and
public works. Following a devastating earthquake in the
Friuli region in the same year, the Company’s resources
are immediately devoted to the reconstruction process,
including the careful restoration of the medieval town of
Venzone, which, from icon of destruction rose to become a
symbol of reconstruction, not only of historical buildings,
but also of the whole urban and social fabric of the town.
1980 The construction of two large sections of the Carnia-
Tarvisio highway provides the Company with the opportunity
to develop innovative construction techniques for the
prefabrication and erection of pre-cast concrete segments.
The latter technology is further developed in the following
years, as the Group completes many important highway
and motorway projects. This invaluable technological
expertise is eventually consolidated with the establishment
of Deal, a company dedicated to vanguard technologies for
the construction of elevated bridges and viaducts, utilising
mass-production industrialised systems. 1982 Towards
the end of this year, Rizzani de Eccher wins its first large

Nella pagina a fianco:Palazzo Tergesteo, Trieste
13
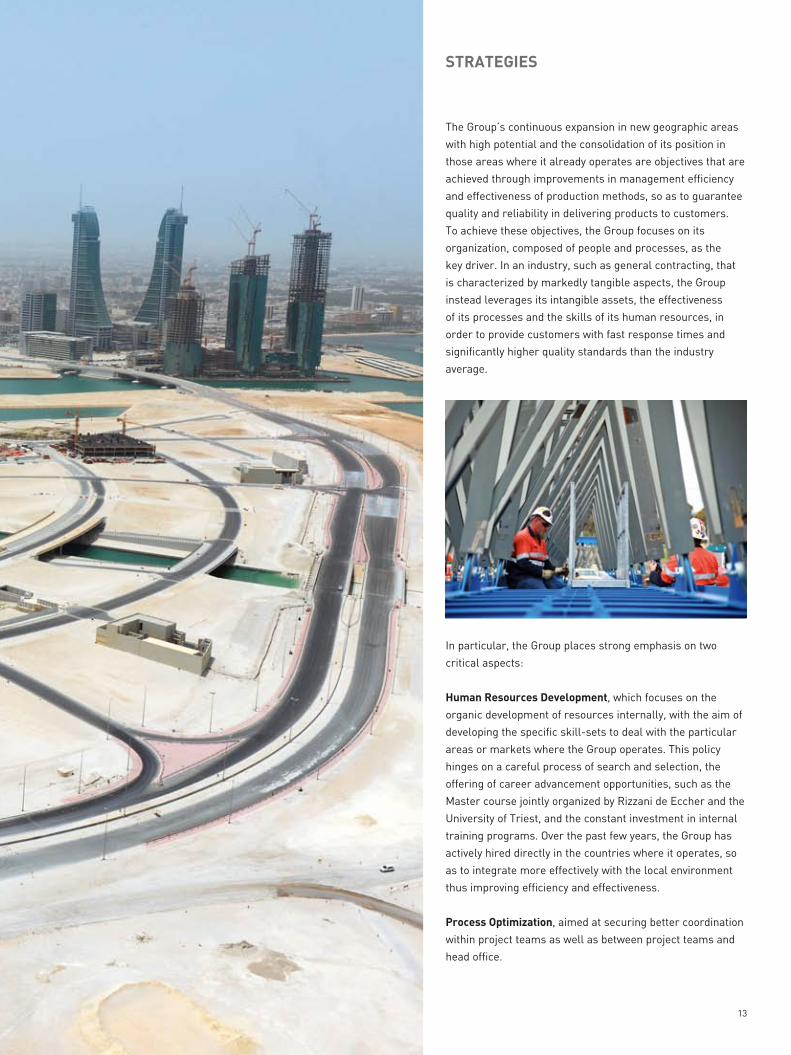
The Group’s continuous expansion in new geographic areas
with high potential and the consolidation of its position in
those areas where it already operates are objectives that are
achieved through improvements in management efficiency
and effectiveness of production methods, so as to guarantee
quality and reliability in delivering products to customers.
To achieve these objectives, the Group focuses on its
organization, composed of people and processes, as the
key driver. In an industry, such as general contracting, that
is characterized by markedly tangible aspects, the Group
instead leverages its intangible assets, the effectiveness
of its processes and the skills of its human resources, in
order to provide customers with fast response times and
significantly higher quality standards than the industry
average.
In particular, the Group places strong emphasis on two
critical aspects:
Human Resources Development, which focuses on the
organic development of resources internally, with the aim of
developing the specific skill-sets to deal with the particular
areas or markets where the Group operates. This policy
hinges on a careful process of search and selection, the
offering of career advancement opportunities, such as the
Master course jointly organized by Rizzani de Eccher and the
University of Triest, and the constant investment in internal
training programs. Over the past few years, the Group has
actively hired directly in the countries where it operates, so
as to integrate more effectively with the local environment
thus improving efficiency and effectiveness.
Process Optimization, aimed at securing better coordination
within project teams as well as between project teams and
head office.
STRATEGIES
14
15
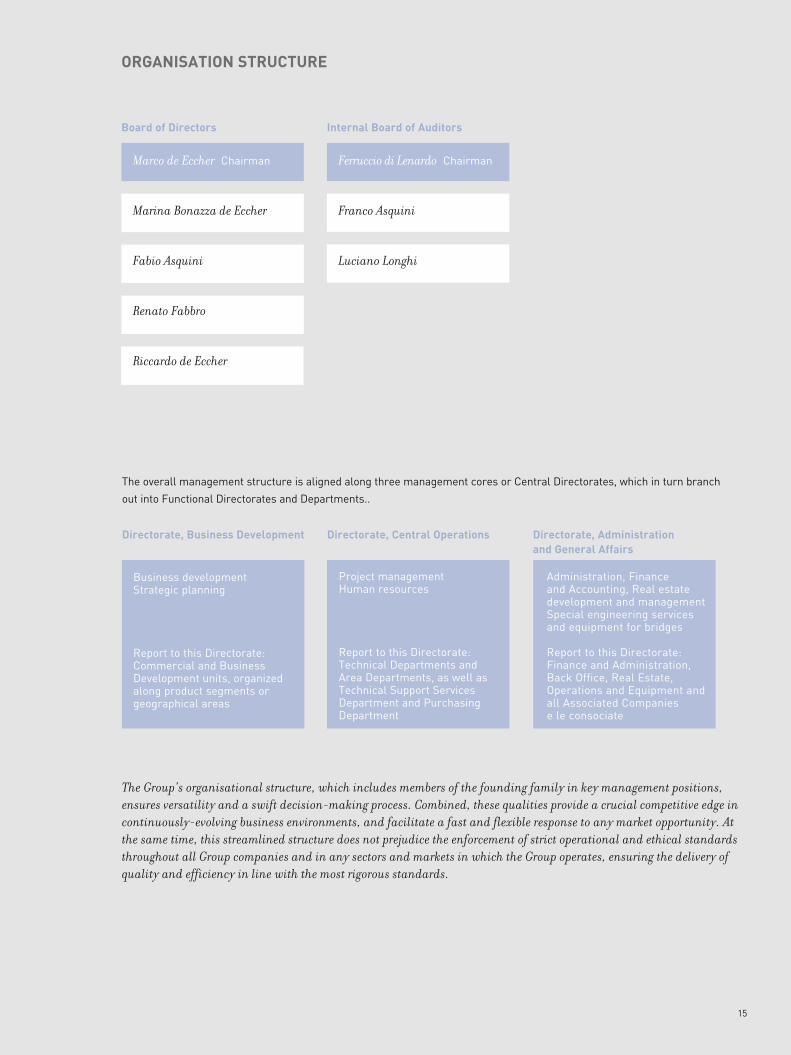
Directorate, Business Development Directorate, Central Operations Directorate, Administration and General Affairs
Board of Directors
Ferruccio di Lenardo Chairman
Franco Asquini
Luciano Longhi
Internal Board of Auditors
Project managementHuman resources
Report to this Directorate: Technical Departments and Area Departments, as well as Technical Support Services Department and Purchasing Department
Administration, Finance and Accounting, Real estate development and managementSpecial engineering services and equipment for bridges
Report to this Directorate: Finance and Administration, Back Office, Real Estate, Operations and Equipment and all Associated Companiese le consociate
Business developmentStrategic planning
Report to this Directorate: Commercial and Business Development units, organized along product segments or geographical areas
ORGANISATION STRUCTURE
The overall management structure is aligned along three management cores or Central Directorates, which in turn branch
out into Functional Directorates and Departments..
The Group’s organisational structure, which includes members of the founding family in key management positions,
ensures versatility and a swift decision-making process. Combined, these qualities provide a crucial competitive edge in
continuously-evolving business environments, and facilitate a fast and flexible response to any market opportunity. At
the same time, this streamlined structure does not prejudice the enforcement of strict operational and ethical standards
throughout all Group companies and in any sectors and markets in which the Group operates, ensuring the delivery of
quality and efficiency in line with the most rigorous standards.
Marco de Eccher Chairman
Marina Bonazza de Eccher
Fabio Asquini
Renato Fabbro
Riccardo de Eccher
16
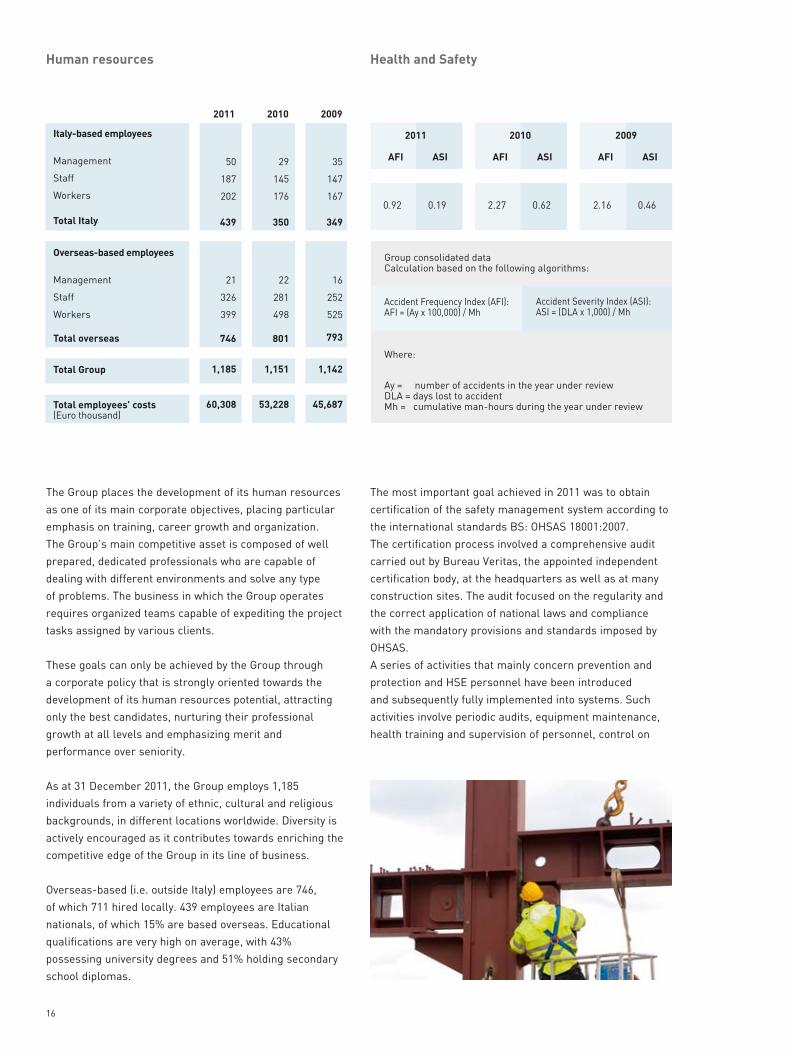
Health and Safety
The most important goal achieved in 2011 was to obtain
certification of the safety management system according to
the international standards BS: OHSAS 18001:2007.
The certification process involved a comprehensive audit
carried out by Bureau Veritas, the appointed independent
certification body, at the headquarters as well as at many
construction sites. The audit focused on the regularity and
the correct application of national laws and compliance
with the mandatory provisions and standards imposed by
OHSAS.
A series of activities that mainly concern prevention and
protection and HSE personnel have been introduced
and subsequently fully implemented into systems. Such
activities involve periodic audits, equipment maintenance,
health training and supervision of personnel, control on
Human resources
The Group places the development of its human resources
as one of its main corporate objectives, placing particular
emphasis on training, career growth and organization.
The Group’s main competitive asset is composed of well
prepared, dedicated professionals who are capable of
dealing with different environments and solve any type
of problems. The business in which the Group operates
requires organized teams capable of expediting the project
tasks assigned by various clients.
These goals can only be achieved by the Group through
a corporate policy that is strongly oriented towards the
development of its human resources potential, attracting
only the best candidates, nurturing their professional
growth at all levels and emphasizing merit and
performance over seniority.
As at 31 December 2011, the Group employs 1,185
individuals from a variety of ethnic, cultural and religious
backgrounds, in different locations worldwide. Diversity is
actively encouraged as it contributes towards enriching the
competitive edge of the Group in its line of business.
Overseas-based (i.e. outside Italy) employees are 746,
of which 711 hired locally. 439 employees are Italian
nationals, of which 15% are based overseas. Educational
qualifications are very high on average, with 43%
possessing university degrees and 51% holding secondary
school diplomas.
2009
AFI ASI
0.462.16
AFI ASI
2010
0.622.27
AFI ASI
2011
0.190.92
Ay = number of accidents in the year under reviewDLA = days lost to accidentMh = cumulative man-hours during the year under review
Where:
Group consolidated dataCalculation based on the following algorithms:
Accident Frequency Index (AFI):AFI = (Ay x 100,000) / Mh
Accident Severity Index (ASI):ASI = (DLA x 1,000) / Mh
2011
29
145
176
350
22
281
498
801
1,151
53,228
50
187
202
439
21
326
399
746
1,185
60,308
20092010
35
147
167
349
16
252
525
793
1,142
45,687
Italy-based employees
Management
Staff
Workers
Total Italy
Overseas-based employees
Management
Staff
Workers
Total overseas
Total Group
Total employees’ costs(Euro thousand)

17
subcontractors and suppliers, as well as internal controls,
audit and review of implemented activities, with periodic
redefinition of objectives. This commitment finds reflection
in the drastic decrease in the number of reported injuries
during the year under review. In addition, the great majority
of reports involved light injuries.
Similarly, despite numerous inspections conducted by
regulatory bodies and supervisory authorities (ASL,
CPT, INAIL and Labour Department) no penalties or
prescriptions have been imposed in connection with the
building site operations of the Group. These results
represent a starting point from which to progress further
and ensure that the certifications are maintained, while
aiming for the continuous decline of reported accidents.
To achieve these objectives, the Group places the emphasis
on the training of personnel at all levels, as the best means
to raise the awareness of workers, supervisors and all
people involved in business processes on the risks and
critical issues associated with their job. For this reason,
2011 saw the commencement of the important training
programmes, which will continue throughout 2012. These
programmes will also introduce new concepts (related to
communication and staff management) and strengthen the
assessment of specific risks.
The foregoing concepts are numerically reported in the
accident frequency and severity indices in the table
of page 16.
Training and career development
Over the course of 2011 the Group has continued to
implement its knowledge-based programmes and training
courses, both internal and external, which are specifically
aimed at younger employees. Funds from the European
Social Fund (ESF) have been drawn to finance Project
Management, language and software courses. Great efforts
have been placed upon career development from within
the organization, and dedicated training programmes have
been put in place with the following objectives:
_development of technical engineering skills;
_development of management and organizational skills; and
_team-building and group bonding.
To assess needs and design training plans, role analyses have
been carried out by using appropriate tools, and these have
proved particularly useful. This process, with a view to increasing
staff motivation, also highlighted the possibility of undertaking
organizational changes to ensure improvements in efficiency and
a more complete response to growing market demands.
The Masters Degree course in Project Management – Advanced Applications in the Construction Industry remains
the flagship initiative. The course, which is now at its seventh
edition, is yielding excellent results in terms of applications
and recruiting opportunities. Alumni who have been hired
by the Group have risen to prominent positions in Italy and
abroad as project managers, finance managers, technical
office and project control specialists. The course is organized
in conjunction with the Universities of Triest and Udine and is
taught by faculty professors as well as reputed professionals
with proven track records in the engineering and construction
field, of which senior Rizzani de Eccher managers account
for about 50% and offer an unrivalled patrimony of insights
and experiences. The course curriculum complements theory
with practice, in the form of internships in construction sites
in Italy and abroad. With the 2011 edition, the number of
alumni who are now employed by the Group has risen to 28.
The collaboration with Academia is extended to agreements
with outside faculties for personnel training and to senior
managers of the Group holding professorships at the faculties
of engineering at the Universities of Udine and Padua.
18
To compete in the field of complex constructions requires thorough planning of all activities, careful optimisation of
resources and strict quality control. The main factors contributing to the Group’s success are the unending commitment to
investing in innovation, stringent quality control systems and the professionalism and dedication of its employees.
The emphasis and sensitivity placed on quality control
management has allowed the Group to improve consistently
on its qualitative benchmarks fulfilling stringent engineering
and architectural specifications, ensures constantly high
quality standards and achieving optimal levels of clients’ satisfaction. Rizzani de Eccher is a long-dated member
of UNI (the Italian National Agency for the unification of
production standards) which positions it at the forefront
of all new developments in production and quality control
techniques. In many occasions, this commitment to
performance has won the Group commendations as well as
performance fees. The Group’s constant focus on innovation
and its rich pool of technical knowledge in the infrastructure
sector has allowed Rizzani de Eccher to become a world
leader in the design and engineering of special equipment
for the construction of bridges and viaducts. The continuous
research and development activities of the design team of
Deal Srl have allowed this Group to expand its range of
products, which find application in other industrial sectors
where tailor-made solutions and customised equipment are
particularly appreciated.
A wide range of successful partnerships and affiliations
with other major international contractors (e.g. Bovis Lend
Lease, Cemea Investments Ltd, Six Construct Co. Ltd, John
Holland Pty Ltd, OHL Obrascon Huarte Lain SA) testify to
the status of Rizzani de Eccher as a robust and reliable
partner. These ties also represent solid stepping stones
towards the future growth of the Group in the global arena.
Another noteworthy development has been the year-end
acquisition by Deal Srl of majority control of Tensacciai
Srl and Tesit Srl, two companies operating in the design,
fabrication and installation of cable-stays, components
for tensile structures and post-tensioning systems. These
acquisitions constitute a valuable addition and complement
to the product range of Deal Srl and the Group, besides
representing a further step towards the realisation of an
integrated technological pole acting as depositary of the
Group’s know-how.
The quality policy pursued by the Group has led to the
following certifications and attestations:
Rizzani de Eccher Spa
_ISO 9001 Certification, certified 12 February 1999,
attested by Bureau Veritas Italia Spa in relation to Design
and Construction of civil engineering works, industrial
buildings, bridges, viaducts and transport infrastructure
works
_SOA Certification no. 6462/16/00 attested by SOA Nord Est
_Accreditation as pre-qualified General Contractor with
the Italian Ministry of Transportation and Infrastructure
no. 332/11 of 5 April 2011
_ BS OHSAS 18001:2007 Certification (health and
workplace safety management system) of 5 July 2011
by Bureau Veritas Italia Spa in respect of Design and
construction of civil and industrial engineering works,
bridges, viaducts and other transport infrastructure works
_ ISO 14001:2004 Certification (environment protection
system) of 28 September 2011 by Bureau Veritas Italia
Spa in respect of Design and construction of civil and
industrial engineering works, bridges, viaducts and other
transport infrastructure works
Deal Srl
_ISO 9001 Certification of 21 April 2005, attested
by Bureau Veritas Italia Spa in respect of Design,
QUALITY IS INNOVATION
19
construction, installation and operation of heavy
lifting equipment, including special equipment for the
construction of bridges, such as overhead gantry cranes,
pre-cast girder launching equipment, special elevated
formwork, cable-stayed erection equipment, post-
tensioning systems, caissons and other equipment for the
off-shore sector; design and engineering of bridges and
viaducts for road, railways or urban mass rapid transit
systems
Tensacciai Srl
_ISO 9001 Certification of 4 December 1999 by Bureau
Veritas Italia Spa in respect of Design, fabrication and
installation of cable-stay systems, post-tensioning
systems, rock anchors, ground anchors and associated
equipment and accessories; structural refurbishments
Sicea Srl
_ISO 9001 Certification certified on 30 July 2002, attested
by IGQ in respect of All activities and processes for
the construction, restoration and recovery of civil and
industrial buildings; architectural restoration of heritage
sites; construction and maintenance of roads; general
urbanization works
_SOA Certification no. 9688/16/00 attested by SOA Nord Est
Codest International Srl
_GOST P ISO 9001 Certification of 28 September 2006,
attested by Tektoplan - MosCert CMK, in respect of
All activities and processes for the provision of technical
and design services, site preparation and all construction
of buildings of any category; general civil and building
works; finishing and rendering; consulting and design
services for architectural and building purposes
Gabi Srl
_ISO 9001:2008 Certification (Quality Management
System) of 9 September 2009, attested by Bureau
Veritas Italia Spa in respect of Construction of tunnels,
underground works and roads
_SOA Certification n. 6929/16/00 attested by SOA
Nord Est
Torre Scarl
_ISO 14001:2004 Certification (Environment Protection
System) of 25 October 2011, attested by Bureau
Veritas Italia Spa, in respect of Management and
coordination of all activities associated with the provision
of goods and services by the consortium contractors of the
‘Torre’ high-rise building for Banca Intesa Sanpaolo Spa
in Torino
20
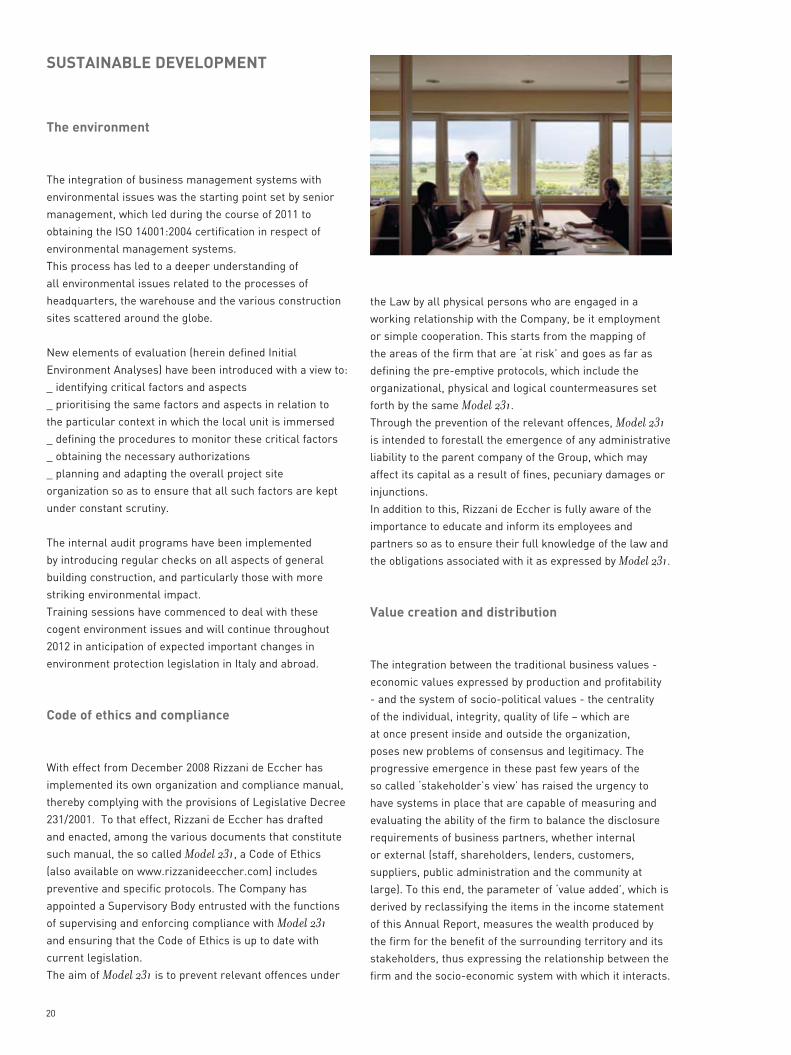
The environment
The integration of business management systems with
environmental issues was the starting point set by senior
management, which led during the course of 2011 to
obtaining the ISO 14001:2004 certification in respect of
environmental management systems.
This process has led to a deeper understanding of
all environmental issues related to the processes of
headquarters, the warehouse and the various construction
sites scattered around the globe.
New elements of evaluation (herein defined Initial
Environment Analyses) have been introduced with a view to:
_ identifying critical factors and aspects
_ prioritising the same factors and aspects in relation to
the particular context in which the local unit is immersed
_ defining the procedures to monitor these critical factors
_ obtaining the necessary authorizations
_ planning and adapting the overall project site
organization so as to ensure that all such factors are kept
under constant scrutiny.
The internal audit programs have been implemented
by introducing regular checks on all aspects of general
building construction, and particularly those with more
striking environmental impact.
Training sessions have commenced to deal with these
cogent environment issues and will continue throughout
2012 in anticipation of expected important changes in
environment protection legislation in Italy and abroad.
Code of ethics and compliance
With effect from December 2008 Rizzani de Eccher has
implemented its own organization and compliance manual,
thereby complying with the provisions of Legislative Decree
231/2001. To that effect, Rizzani de Eccher has drafted
and enacted, among the various documents that constitute
such manual, the so called Model 231, a Code of Ethics
(also available on www.rizzanideeccher.com) includes
preventive and specific protocols. The Company has
appointed a Supervisory Body entrusted with the functions
of supervising and enforcing compliance with Model 231
and ensuring that the Code of Ethics is up to date with
current legislation.
The aim of Model 231 is to prevent relevant offences under
the Law by all physical persons who are engaged in a
working relationship with the Company, be it employment
or simple cooperation. This starts from the mapping of
the areas of the firm that are ‘at risk’ and goes as far as
defining the pre-emptive protocols, which include the
organizational, physical and logical countermeasures set
forth by the same Model 231.
Through the prevention of the relevant offences, Model 231
is intended to forestall the emergence of any administrative
liability to the parent company of the Group, which may
affect its capital as a result of fines, pecuniary damages or
injunctions.
In addition to this, Rizzani de Eccher is fully aware of the
importance to educate and inform its employees and
partners so as to ensure their full knowledge of the law and
the obligations associated with it as expressed by Model 231.
Value creation and distribution
The integration between the traditional business values -
economic values expressed by production and profitability
- and the system of socio-political values - the centrality
of the individual, integrity, quality of life – which are
at once present inside and outside the organization,
poses new problems of consensus and legitimacy. The
progressive emergence in these past few years of the
so called ‘stakeholder’s view’ has raised the urgency to
have systems in place that are capable of measuring and
evaluating the ability of the firm to balance the disclosure
requirements of business partners, whether internal
or external (staff, shareholders, lenders, customers,
suppliers, public administration and the community at
large). To this end, the parameter of ‘value added’, which is
derived by reclassifying the items in the income statement
of this Annual Report, measures the wealth produced by
the firm for the benefit of the surrounding territory and its
stakeholders, thus expressing the relationship between the
firm and the socio-economic system with which it interacts.
SUSTAINABLE DEVELOPMENT

21
The value added is presented in two different dimensions:
_scheme of calculation of value added, which emerges
from comparing income and costs at each intermediate
level;
_scheme of distribution of value added comprising of the
sum of the remunerations received by stakeholders.
The value added to different stakeholders is identified as
follows:
_remuneration of human resources: it includes direct and
indirect remunerations of all those who have a working
relationship with the Group;
_remuneration of the public administration: it includes
direct and indirect taxes paid by the Group;
_remuneration of debt capital: it includes interest paid to
the banking system and financial institutions;
_remuneration of equity capital: it includes dividends paid
out to shareholders;
_remuneration of the enterprise: it includes any income
set aside as reserve or retained earnings to finance future
growth;
_acts of liberality: they include and distributions of benefits
for charity purposes.
Thus it emerges that the most substantial portions of value
added go towards the remuneration of human resources
and to the society at large through taxation. This underpins
the central role of the enterprise as a contributor to
human welfare. It is worth noting the Group’s commitment
to supporting humanitarian and cultural projects, as
witnessed by contributions and donations to various non-
profit organizations.
In 2011 the Group participated in the construction of a
cold storage facility for vaccines in Abechè, Chad, through
a donation of funds to UNICEF within a programme aimed
at rehabilitating the country’s cold chain and particularly
the logistics of vaccine distribution. Proper cold storage is
essential to the effectiveness of vaccines.
The value added was determined by reclassifying the items
in the income statement of this Annual Report, using the
methodology proposed by ‘Gruppo Bilancio Sociale’ (GBS),
an association which promotes ethical standards and
principles of social responsibility in accounting practices.
2011
480,078
390,139
89,939
91,174
(10,201)
80,973
2010
1,235
353,571
260,418
93,153
4,689
97,842
(11,022)
86,820
Value added calculation(Euro thousand)
Value of production(revenues)
Costs of production
Operating value added
Extraordinary and additional income/charges
Gross value added
Amortisation and depreciation
Net value added
%2011 %
54,868
9,372
76
181
16,395
81
80,973
2010
62,254
6,744
(431)
-
18,150
103
86,820
71.7%
7.8%
(0.5%)
0.0%
20.9%
0.1%
100%
Employees' remuneration
Public administration remuneration
Debt capital remuneration
Equity capital remuneration
Retained earnings
Charitable donations
Net value added
Value added distribution(Euro thousand)
67.8%
11.6%
0.1%
0.2%
20.2%
0.1%
100%

22
Railway Line Oued Tlèlat Tlemcen
Infrastructure Algeria 1,328,000,000 25.00
Jamal Abdul Nasser StreetKuwait City
Infrastructure Kuwait 600,000,000 48.90
Al Udeid Air Force BaseDoha
General building / Infrastructure Qatar 1,340,000,000 100.00
Multifunction complex CityLifeMilan
General building Italy 250,000,000 50.00
Headquarters of Intesa SanpaoloTurin
General building Italy 246,000,000 70.00
Multifunction complex Treviso MaggioreTreviso
General building / Real estatedevelopment
Italy 173,000,000 33.33
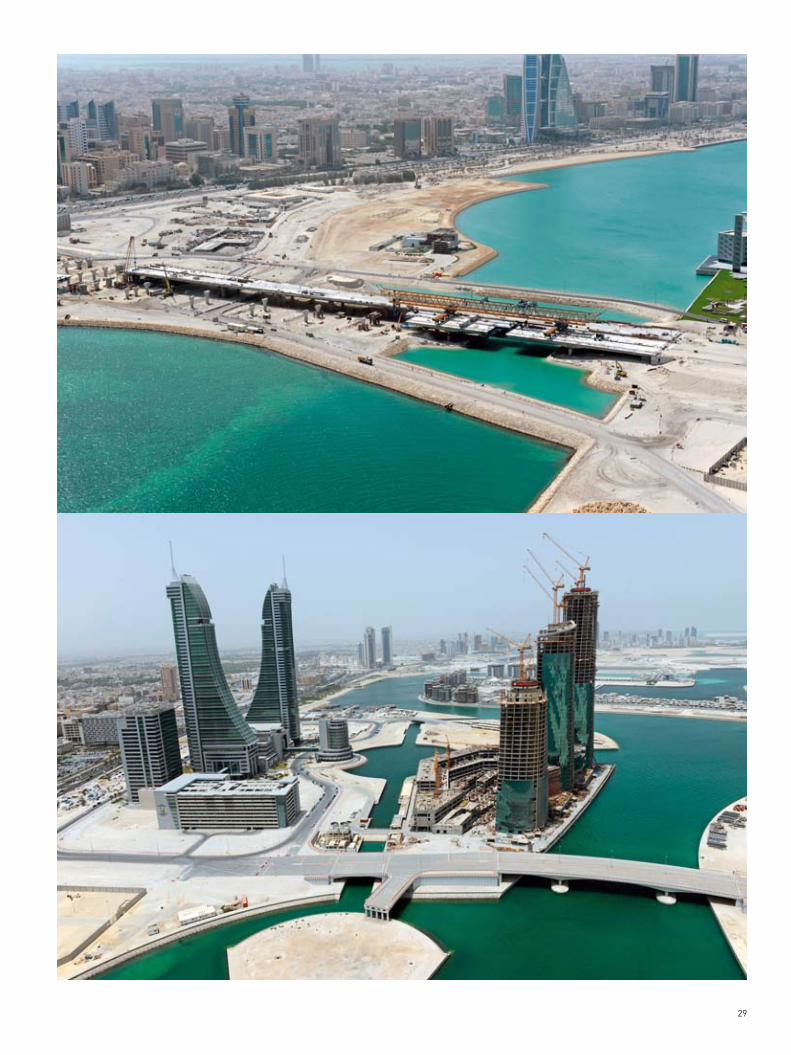
North Manama CausewayManama
Infrastructure / Special equipment /Engineering services
Bahrain 143,000,000 50.00
Residential complex Portopiccolo Sistiana - Triest
General building Italy 110,000,000 100.00
Requalification of Brescia hospital Brescia
General building / Project financing Italy 107,000,000 55.92
Summerland Hotel & ResortBeirut
General building Lebanon 103,000,000 51.00
95,000,000General buildingFour Seasons Hotel Baku
Azerbaijan 100.00
76,000,000Infrastructure works at Marjan IslandRas Al Khaimah
Infrastructure UAE 100.00
55,000,000Dulles Metrorail elevated lineWashington DC
Infrastructure USA 100.00
109,000,000Technological building for central hospitalUdine
General building / Project financing Italy 48.50
31,000,000Miami Orange Line LRTMiami
Infrastructure USA 100.00
19,000,000Banca Nazionale del LavoroMilano
General building Italy 61.44
17,900,000Residential complexAtyrau
General building Kazakhstan 100.00
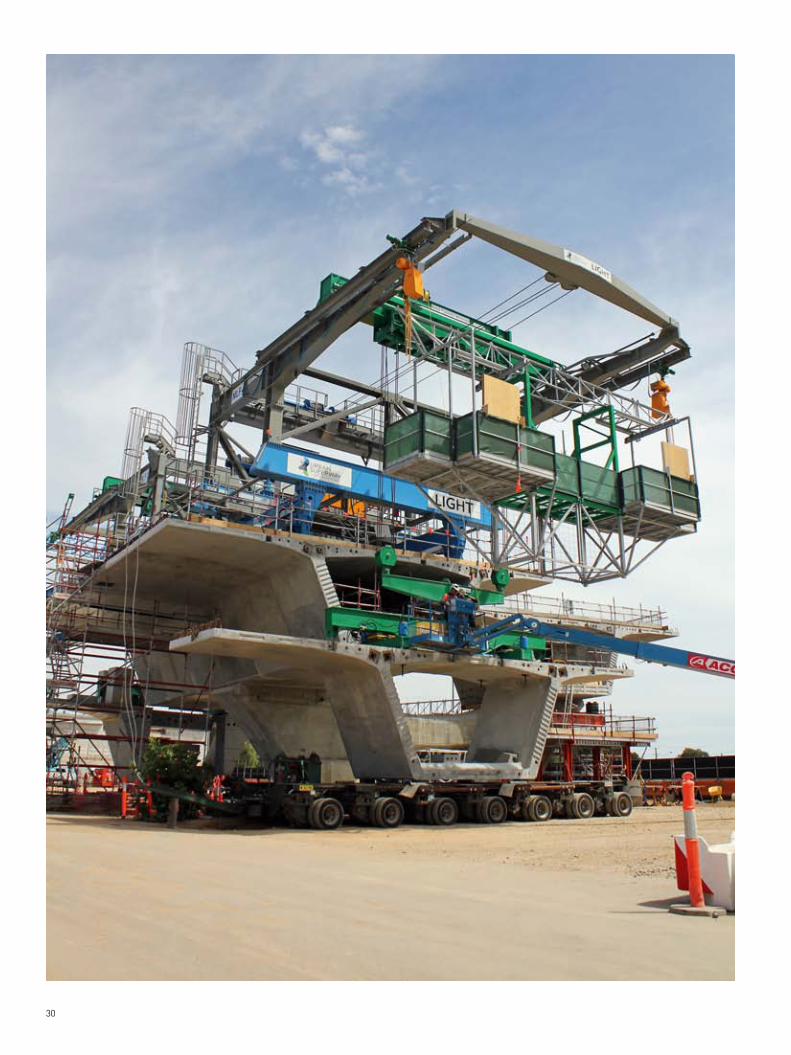
12,800,000South Road SuperwayAdelaide
Special equipment /Engineering services
Australia 100.00
State Road 826 Palmetto ExpresswayMiami
Infrastructure / Special equipment /Engineering services
USA 38,000,000 100.00
Evraz South Mill plant Rostov
General building Russia 45,000,000 100.00
Project Business area Country Amount Share %

23
AREAS OF BUSINESS ACTIVITY
Over the years, the Group has consolidated its leading position in four main areas: General Building Contracting, Infrastructure Contracting, Engineering Services and Equipment for Bridge Construction and Real Estate Development. Apart from the
specific circumstances of certain individual markets, the Group is generally involved in all of the foregoing business areas, in every
country where it is active. The Group’s well-established presence in Russia and CIS countries of Central Asia, Middle East, the
Mediterranean Basin and Central and North America, combined with the vast international experience acquired with working for
many international clients ensure a solid and dominant market position, pointing to strong growth and a stable future. The table in
the previous page illustrates the main projects underway during the period under review, according to the four areas outlined above.

24
In general building contracting, the Group is well positioned in market segments which demand increasingly high
standards of technology and quality. Since each building is unique and construction site conditions differ greatly,
each project requires specific technical skills. Over the past few years, energy efficiency has become the underlying
theme of every new project. This is accomplished through a vast range of design solutions including purpose-
built volumes, the adoption of materials and technologies that facilitate heat transmission with the outside, the
installation of energy-efficient heating/cooling systems and the recourse to renewable energy sources (solar energy,
heat pumps). Furthermore, in order to compete in high-end market niches and to maintain the expected quality
levels in the design and construction process, the Group has established a number of vertically-integrated dedicated
subsidiaries, each of which specialises in particular steps of the production and delivery process. These steps include
design, prefabrication, plant engineering and interior decoration and furnishing. These companies work in synergy
within the framework of the general contracting business of the Group. The main sectors of activity in this area are:
residential buildings, office buildings, industrial and commercial buildings, hospitals, schools, luxury hotels, large-
scale renovations and recovery of heritage sites and finally military infrastructure.
Residential buildingsThe Group has always performed well in this area, leveraging
off the market knowledge of its real estate development unit
and the track record in high-quality construction projects. In
this segment, the Group focuses on large and complex projects
with high quality standards. In early 2011 Rizzani de Eccher
commenced construction of the Portopiccolo mixed use project
in Sistiana (Triest), a contract worth in excess of € 110 million.
The project calls for the recovery of a disused quarry facing the
sea, on whose site 420 residential units, retail outlets, hotels,
bars, restaurants, a 100-berth marina and a beach resort are
to be built. In February 2011, Codest International was awarded
the contract for the construction of a residential complex in
Kazan (Tatarstan, Russian Federation) comprising of 58 villas,
a kindergarten, office and technical buildings. The contract is
worth € 19 million. In December 2011, Rizzani de Eccher has
taken over the position of Immobiliare Lombarda Spa (a Gruppo
FonSai company) in the contracting consortium, which together
with Lamaro Appalti Spa, is entrusted with the construction
of the massive CityLife mixed-use development in Milan, a
project started in 2008. The consortium had a construction
backlog of € 160 million as at the date of Rizzani de Eccher
acquisition. The backlog increased by a further € 48.5 million
in January 2012 with the award of an additional contract for the
construction of the 100 m tall Park Tower, a residential high
rise designed by renowned architect Daniel Libeskind. In the
same month, Codest International has executed an important
contract agreement related to the 2018 Moscow World Cup;
this agreement includes the construction of a commercial area
consisting of a complex of 12 buildings (2 Hyatt hotels, 4 office
buildings, 6 residential buildings, for an amount in aggregate
of € 395 million) in connection with the VTB Arena Stadium Project.
Business Areas. General building contracting
Office buildingsThe construction of modern office buildings, which is rapidly
developing in many markets, is a key focus area for the
Group, characterized by a high level of sophistication. Each
office building project requires close cooperation with highly
qualified designers to achieve an effective convergence of

25
technical requirements and functionality. Rizzani de Eccher
is engaged in the design & build of the headquarters of
banks and multinational companies, as well as government
buildings and offices in Italy and abroad, with stages of
deliveries ranging from ‘shell and core’ to complete
‘fit out’, which includes the supply and installation of
interior furnishings. During the course of 2011, construction
activities have continued on the Banca Intesa Sanpaolo office
tower in Turin, a skyscraper over 160 m tall designed by
renowned architect Renzo Piano. Rizzani de Eccher has won
the project in joint venture with Swiss contractor Implenia.
As at 31 December 2011 the € 246 million project had
reached a progress of some € 34 million.
Industrial buildings The Group’s track record in this field dates back to large
industrial projects in Italy and abroad in the second half of
1800s. In the past few decades such wealth of experience
has been put to good use as evidenced by the successful
completion of industrial buildings in Italy and abroad in
several industries and sectors, such as steel plants, textile
factories, mechanical workshops, tanneries, shoe factories,
food processing and several other industrial buildings.
During the course of 2011, Codest won the contract for a
large-scale green field project consisting of the construction
of a steel mill at Ust-Donetskiy (Rostov, Russian Federation)
for € 45 million. The mill will have a rated output capacity of
600,000 tons per annum of reinforced concrete bars (rebars)
and other steel applications for the construction industry.
The plant will utilise Siemens technology installed by Codest.
HospitalsThis is an area characterized by the rapid evolution of
functional requirements, increasingly sophisticated MEP
components and ever more specific medical equipment.
The utilization of project financing to fund the construction
and operation of hospitals is becoming ever more frequent,
which demands strong skills and commitment not just in
respect of the design and construction challenges (with
which the Group is obviously very experienced in dealing) but
also in respect of the financial and legal challenges, which
the Group has amply demonstrated to be able to negotiate
with the required professionalism. During 2011, the project-
finance scheme in respect of the expansion of the facilities
of Spedali Civili di Brescia has reached several milestones
such as the completion and opening of the new kitchen
and canteen building and commencement of works on the
new basement plate. Meanwhile, the entire project, whose
contract amount has increased to € 107 million, has reached
a progress of € 21 million at year end. As regards another
hospital project-finance, the build & operate of several
hospital facilities for S. Maria della Misericordia in Udine, an
addendum to the main contract was finalised in 2011, with
the project budget now reaching € 109 million (excluding the
remote heating network). Progress as at year end reached €
32 million. Naturally, difficult conditions in capital markets
have resulted in financial closing for the project being
postponed several times. However, Siram (a Dalkia company)
and partners have continued to provide financing for the
execution of the project in order to respect the deadlines
imposed by the public sector owner.
Luxury hotelsThe experience in the field of large scale buildings combined
with traditional craftsmanship has enabled the Group to
compete effectively in the luxury hospitality segment. Works
have drawn to a close in 2011 at the lavish Four Seasons Hotel in Baku (Azerbaijan), a contract worth € 95 million,
while they have continued apace, reaching a progress of € 25
million (on € 103 total) at the Summerland Hotel & Resort in
Beirut, a luxury property on the waterfront of South Beirut,
which shall be operated by Kempinski.
Military infrastructureInfrastructure projects for the armed forces are
characterised the world over by their sheer size and
complexity. They usually include the construction of a
number of independent structures, each designated for
highly specialised functions. Military projects also require
thorough and complex plant-engineering over vast areas, but
need practical infrastructure for rapid and easy connections.
In all these projects, planning schedules and delivery times
are notoriously inflexible, since they are tightly linked to
the movement of troops and armaments, which are in turn
classified information. The Al Udeid Air Force Base, in Qatar
continues to be the Group’s flagship project in this field also
in 2011, with an additional extension. Billed works at the
end of 2011 topped € 1.291 billion. Construction is set to be
completed in 2012 for a final amount of € 1.340 billion.

Large scale building renovations and recovery of heritage sitesThe construction track record of more than a hundred
years and the specific skills gained from the experience
of the extensive post-earthquake reconstruction of the
Friuli region in 1976 provide Rizzani de Eccher with the
knowledge capital to undertake complex restorations
on monumental buildings adopting the most innovative
technologies. Works have been completed in 2011 on
Palazzo Tergesteo, a historical building in Triest, while
the Banca Nazionale del Lavoro Headquarters project
in Piazza S. Fedele in Milan, a € 19 million contract, is
nearing completion.

28
Environment and hydraulic engineering During past decades Rizzani de Eccher has completed
important projects in this sector in Italy and abroad. Some
of the most representative projects include sewerage pipe
networks; water purification systems equipped with underwater
pipelines for offshore discharge; aqueducts and water-
supply networks and dredging works on rivers and navigable
waterways. The infrastructure project at Marjan Island in Ras al Khaimah (UAE), which covers the complete urbanization
works comprising of roads, bridges, sewerage networks, an
aqueduct, high and low voltage power lines, telephone lines and
street lighting for a grand complex of artificial islands set to
host hotels and sports facilities, reached completion in 2011 for
a total contract value of € 76 million.
Highway networks, railways, subways and mass transit light railwaysAt present Rizzani de Eccher is increasingly engaged in the
construction of railways and in particular mass transit light
railway systems in Italy and abroad. Works for the dual track
Oued Tlélat Tlemcen railway line in Algeria have finally
resumed at the end of 2011, on the basis of the revised design
requested by the client. During the course of 2011 works have
continued, reaching € 10 million progress, on the € 31 million
Orange Metro Line in Miami, while the € 55 million Dulles Corridor Metrorail Project in Washington (DC) has almost
reached completion. Both projects link existing metro lines with
the respective international airports, while the latter project
also involves Deal as the supplier of all special equipment.
Again in the USA, 2011 witnessed substantial progress on the
Palmetto Interchange in Miami (Florida), a clover-leaf junction
on 5 levels and 4 overpasses worth € 38 million, including
special equipments provided by Deal. In early 2010, Rizzani
de Eccher in association with Pizzarotti won the contract for
the enlargement to three lanes (in each direction) of the A4 Highway, comprising of a first stretch of 25 km from the Bridge over the Tagliamento River to Gonars and the Palmanova interchange for a total contract value of € 300 million, of which
one third or € 100 million is under a private finance initiative
(PFI) arranged by the builders. Unfortunately construction
is still on hold pending the definition of the public portion of
the financing. As at 31 December 2011, works on the North Manama Causeway in Bahrain have reached a progress of € 86
million on a total of € 143 million, including special equipments
provided by Deal. This is a project carried out in joint venture
with Six Construct and a local contractor, which includes a
90,000 m2 viaduct made of prefabricated segments. Finally,
construction works continue on the massive prefabrication
plant for bridge segments, which is intended to feed the two-
level upgrade of Jamal Abdul Nasser Street at Kuwait City.
This project, worth in excess of € 600 million, covers a length of
14 km length and involves 395,000 m2 of prefabricated bridge
segments. The contract is being performed in joint venture with
OHL (Spain) Trevi (Italy) and Kuwaiti contractor Boodai.
Rizzani de Eccher excels at infrastructure building and transport engineering in particular, thanks to more than one
hundred years’ experience in this field. In the past few years most of the Group’s infrastructure projects have been outside
Italy, as the Italian market is experiencing a period of recession due to funding shortages and competitive pressures on
costs. Rizzani de Eccher is also actively involved in evaluating and securing project finance for infrastructure projects.
At home and abroad, emphasis is placed on Design & Build tenders where competitive pricing is just one aspect of the
overall offer, and where design and engineering solutions play an important role.
Business Area. Infrastructures
29
30
31
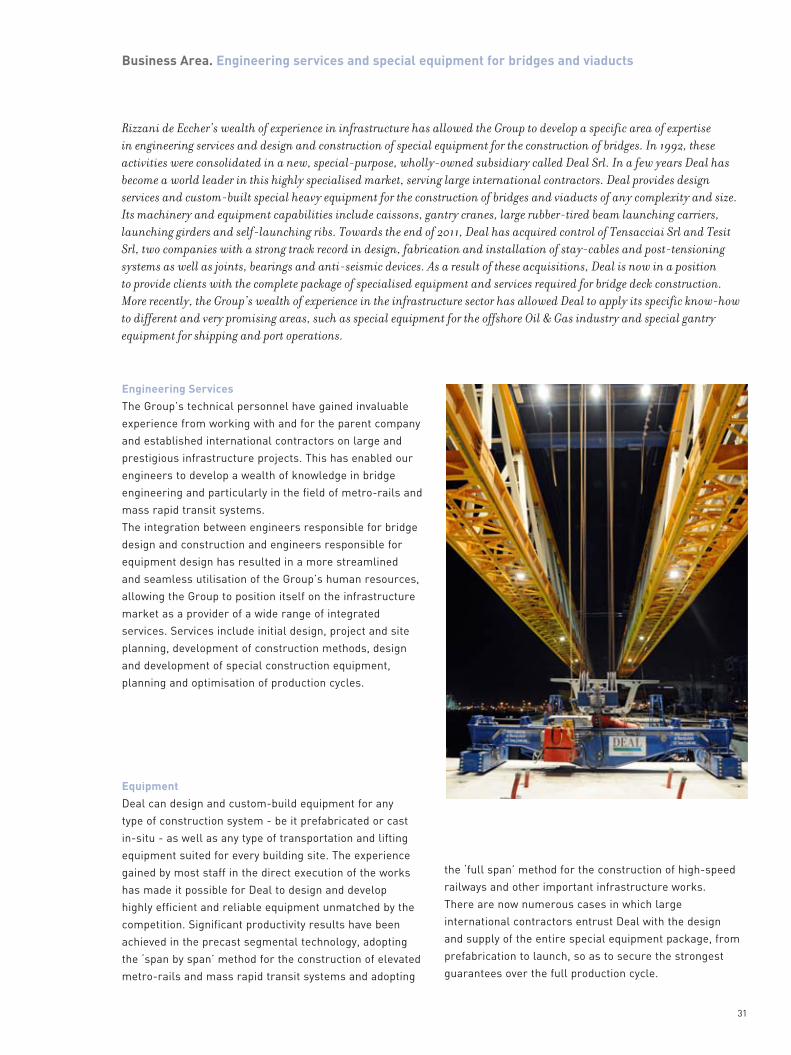
Engineering ServicesThe Group’s technical personnel have gained invaluable
experience from working with and for the parent company
and established international contractors on large and
prestigious infrastructure projects. This has enabled our
engineers to develop a wealth of knowledge in bridge
engineering and particularly in the field of metro-rails and
mass rapid transit systems.
The integration between engineers responsible for bridge
design and construction and engineers responsible for
equipment design has resulted in a more streamlined
and seamless utilisation of the Group’s human resources,
allowing the Group to position itself on the infrastructure
market as a provider of a wide range of integrated
services. Services include initial design, project and site
planning, development of construction methods, design
and development of special construction equipment,
planning and optimisation of production cycles.
EquipmentDeal can design and custom-build equipment for any
type of construction system - be it prefabricated or cast
in-situ - as well as any type of transportation and lifting
equipment suited for every building site. The experience
gained by most staff in the direct execution of the works
has made it possible for Deal to design and develop
highly efficient and reliable equipment unmatched by the
competition. Significant productivity results have been
achieved in the precast segmental technology, adopting
the ‘span by span’ method for the construction of elevated
metro-rails and mass rapid transit systems and adopting
Business Area. Engineering services and special equipment for bridges and viaducts
Rizzani de Eccher’s wealth of experience in infrastructure has allowed the Group to develop a specific area of expertise
in engineering services and design and construction of special equipment for the construction of bridges. In 1992, these
activities were consolidated in a new, special-purpose, wholly-owned subsidiary called Deal Srl. In a few years Deal has
become a world leader in this highly specialised market, serving large international contractors. Deal provides design
services and custom-built special heavy equipment for the construction of bridges and viaducts of any complexity and size.
Its machinery and equipment capabilities include caissons, gantry cranes, large rubber-tired beam launching carriers,
launching girders and self-launching ribs. Towards the end of 2011, Deal has acquired control of Tensacciai Srl and Tesit
Srl, two companies with a strong track record in design, fabrication and installation of stay-cables and post-tensioning
systems as well as joints, bearings and anti-seismic devices. As a result of these acquisitions, Deal is now in a position
to provide clients with the complete package of specialised equipment and services required for bridge deck construction.
More recently, the Group’s wealth of experience in the infrastructure sector has allowed Deal to apply its specific know-how
to different and very promising areas, such as special equipment for the offshore Oil & Gas industry and special gantry
equipment for shipping and port operations.
the ‘full span’ method for the construction of high-speed
railways and other important infrastructure works.
There are now numerous cases in which large
international contractors entrust Deal with the design
and supply of the entire special equipment package, from
prefabrication to launch, so as to secure the strongest
guarantees over the full production cycle.
32
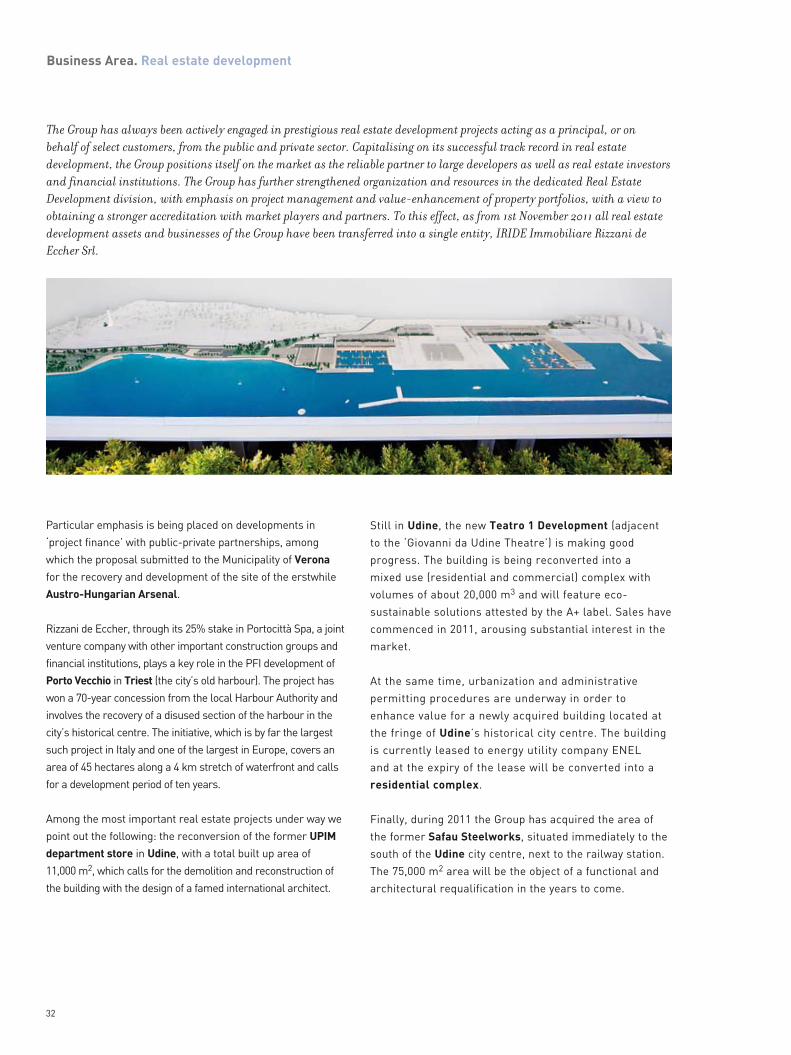
Business Area. Real estate development
The Group has always been actively engaged in prestigious real estate development projects acting as a principal, or on
behalf of select customers, from the public and private sector. Capitalising on its successful track record in real estate
development, the Group positions itself on the market as the reliable partner to large developers as well as real estate investors
and financial institutions. The Group has further strengthened organization and resources in the dedicated Real Estate
Development division, with emphasis on project management and value-enhancement of property portfolios, with a view to
obtaining a stronger accreditation with market players and partners. To this effect, as from 1st November 2011 all real estate
development assets and businesses of the Group have been transferred into a single entity, IRIDE Immobiliare Rizzani de
Eccher Srl.
Particular emphasis is being placed on developments in
‘project finance’ with public-private partnerships, among
which the proposal submitted to the Municipality of Verona
for the recovery and development of the site of the erstwhile
Austro-Hungarian Arsenal.
Rizzani de Eccher, through its 25% stake in Portocittà Spa, a joint
venture company with other important construction groups and
financial institutions, plays a key role in the PFI development of
Porto Vecchio in Triest (the city’s old harbour). The project has
won a 70-year concession from the local Harbour Authority and
involves the recovery of a disused section of the harbour in the
city’s historical centre. The initiative, which is by far the largest
such project in Italy and one of the largest in Europe, covers an
area of 45 hectares along a 4 km stretch of waterfront and calls
for a development period of ten years.
Among the most important real estate projects under way we
point out the following: the reconversion of the former UPIM department store in Udine, with a total built up area of
11,000 m2, which calls for the demolition and reconstruction of
the building with the design of a famed international architect.
Still in Udine, the new Teatro 1 Development (adjacent
to the ‘Giovanni da Udine Theatre’) is making good
progress. The building is being reconverted into a
mixed use (residential and commercial) complex with
volumes of about 20,000 m3 and will feature eco-
sustainable solutions attested by the A+ label. Sales have
commenced in 2011, arousing substantial interest in the
market.
At the same time, urbanization and administrative
permitting procedures are underway in order to
enhance value for a newly acquired building located at
the fringe of Udine’s historical city centre. The building
is currently leased to energy utility company ENEL
and at the expiry of the lease will be converted into a
residential complex.
Finally, during 2011 the Group has acquired the area of
the former Safau Steelworks, situated immediately to the
south of the Udine city centre, next to the railway station.
The 75,000 m2 area will be the object of a functional and
architectural requalification in the years to come.

Focus
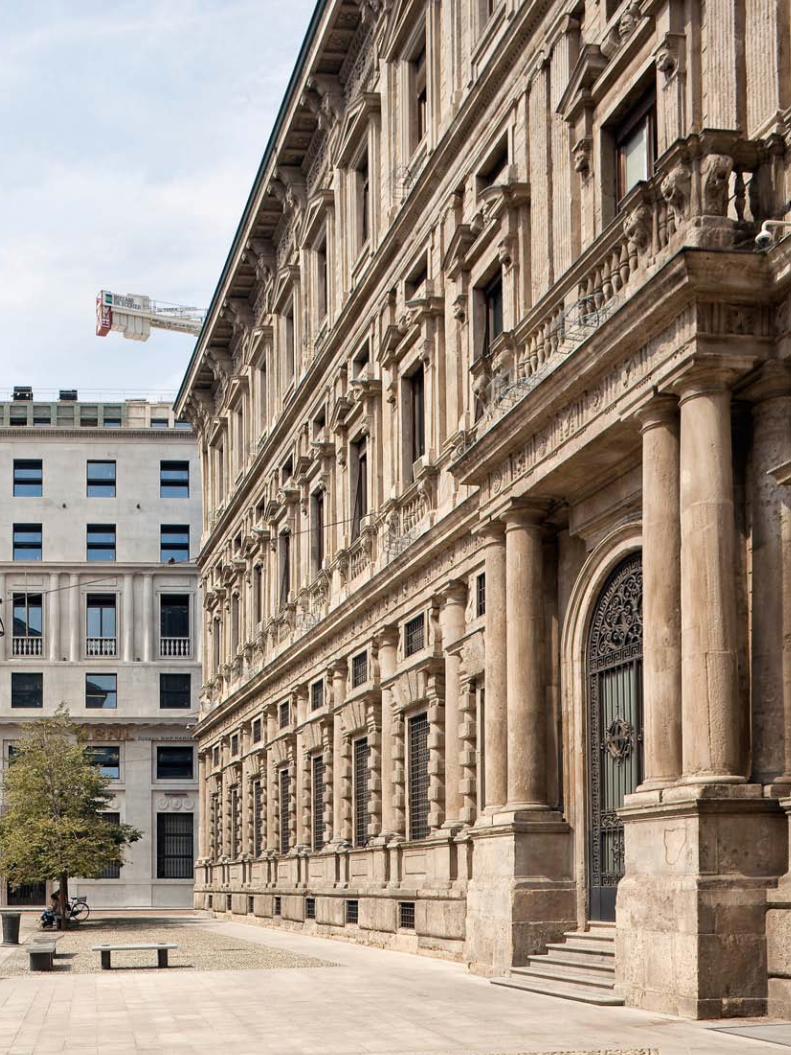
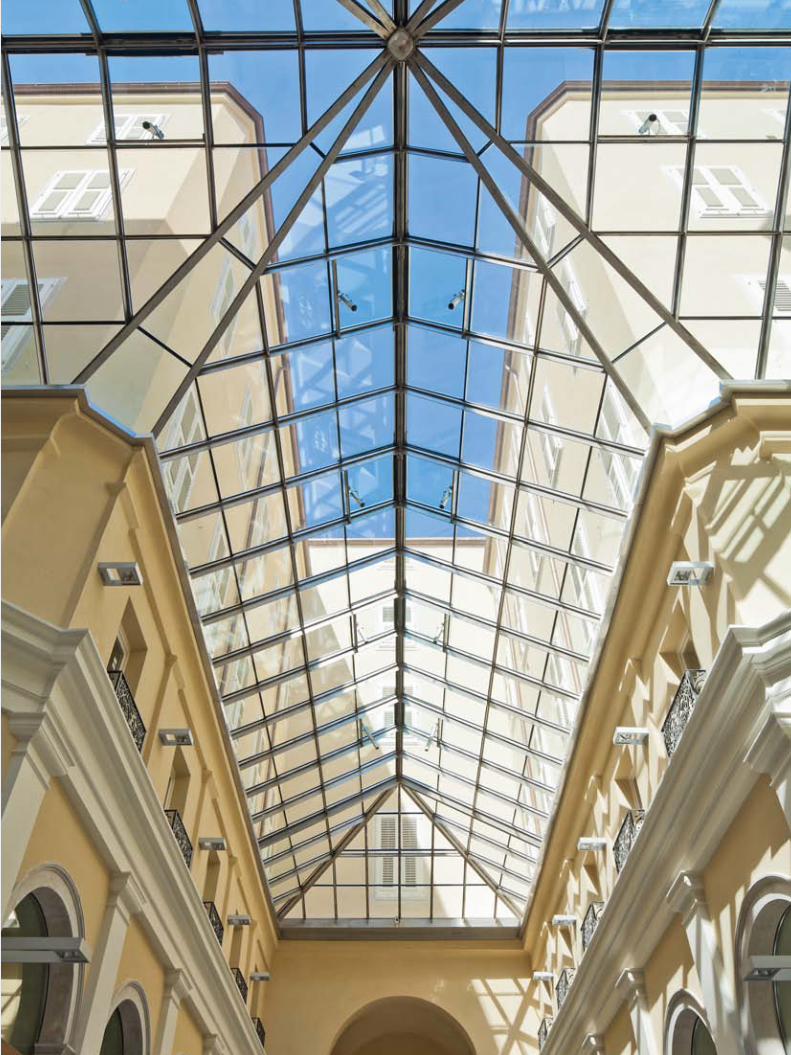
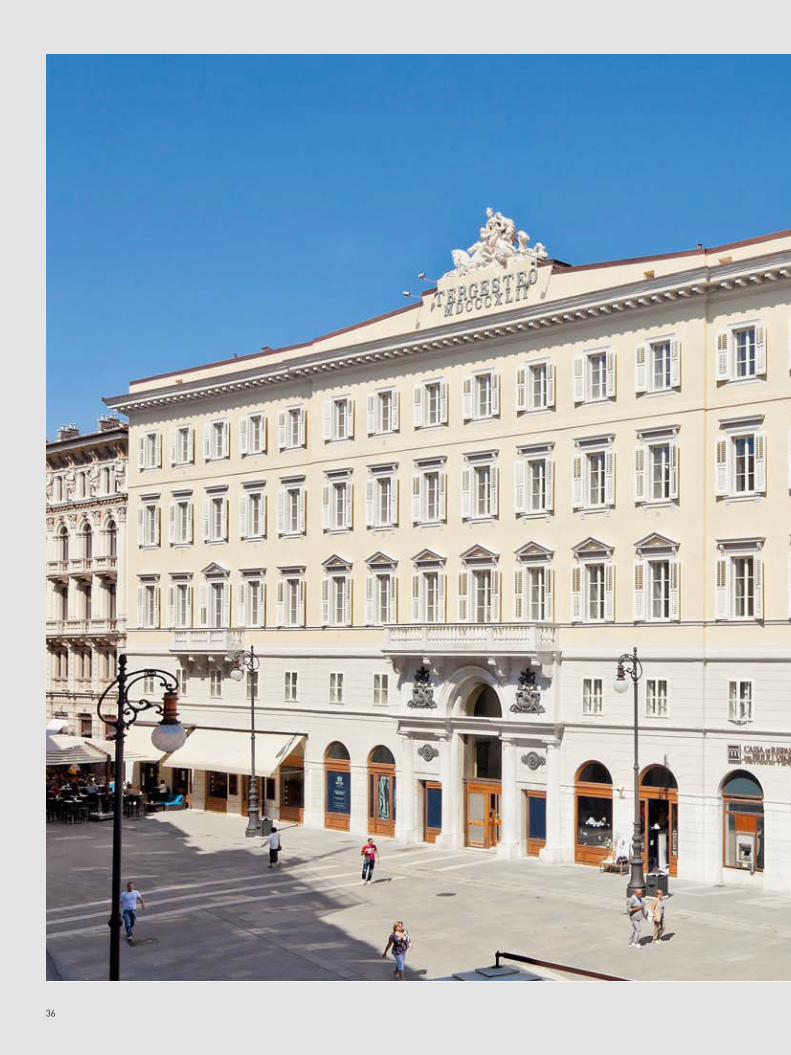
1 Palazzo Tergesteo Triest
2 Treviso Maggiore Treviso
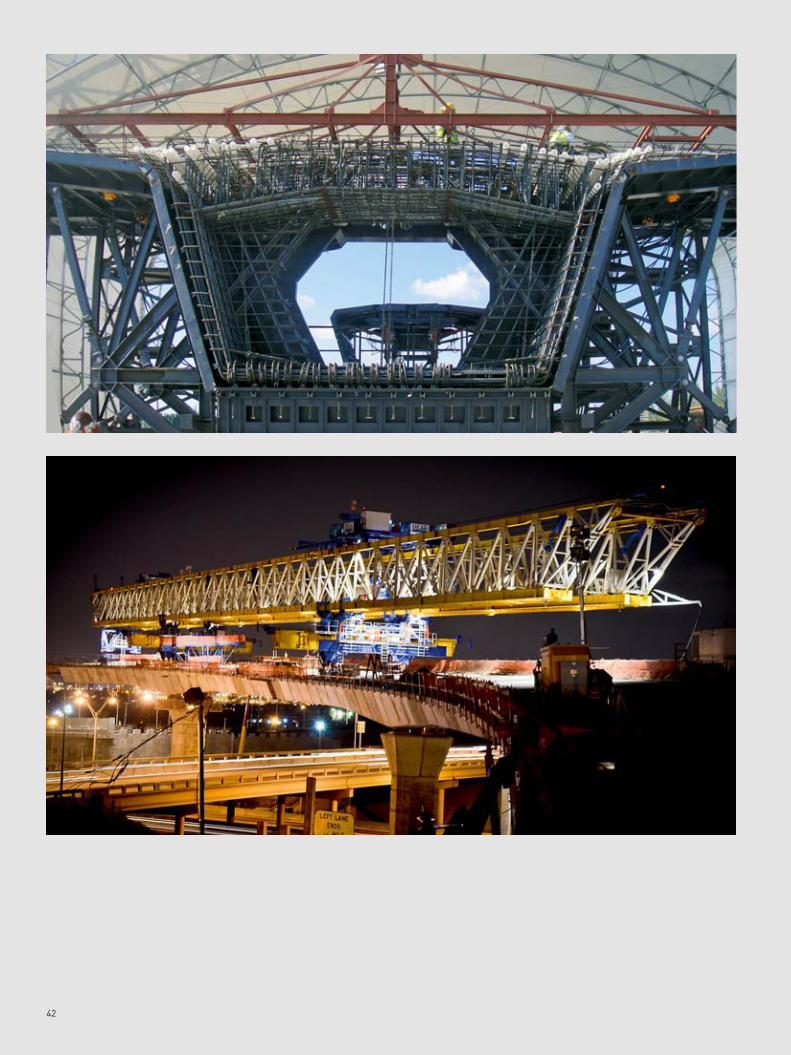
3 State Road 826 Palmetto Expressway Miami

3434
Rizzani de Eccher. Focus 1
Palazzo Tergesteo
Triest
Client: Cerep Italy U
Palazzo Tergesteo is a neoclassical building dating back to 1842 situated in the heart of Triest’s historic city centre (just a stone’s throw from Piazza Unità), which connects Piazza della Borsa (site of the former stock exchange and commercial heart of Habsburg Triest) with Piazza Verdi, the site of the renowned theatre of the same name.
Careful restoration work has brought old splendour back to the elegant neo-classical facade, the majestic entrances that lead to the gallery reconstructed in its original nineteenth century style, and the sculptures by Zandomeneghi and Bianchi. The variety of high quality materials used (marble, wood and ceramic), the use of the latest technologies and systems, the oak doors and shutters, have enhanced and made functional the building without detriment to the property’s historical charm.
The gallery, covered by a glass canopy and artfully restored, divides the building into four ‘towers’ that house 20 retail units located on the ground and mezzanine floors for a total of 4,000 m2.On the upper floors, one tower is devoted to offices, while the other three are intended for residential use.
contract amount 16,200,000
work commencement December 2008
final delivery April 2011
Volumes (excluding gallery) 53,300 m3
NLA 10,600 m2
covered area 2,440 m2
glass canopy area 640 m2
36
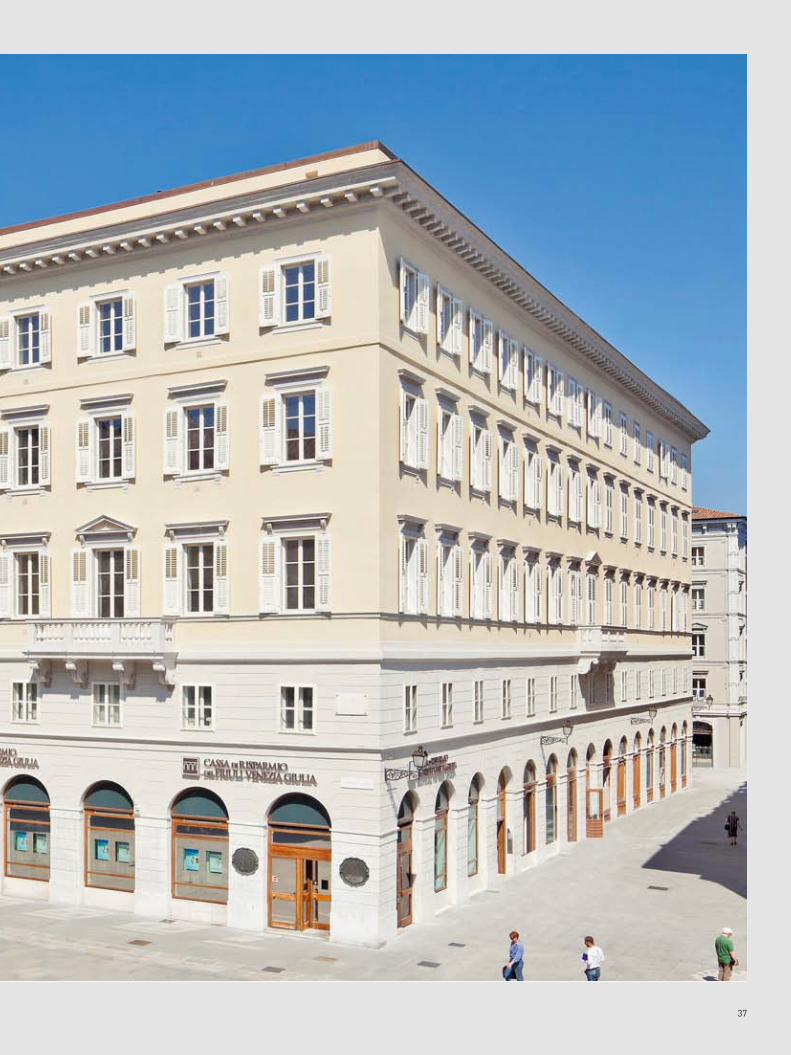
37


39
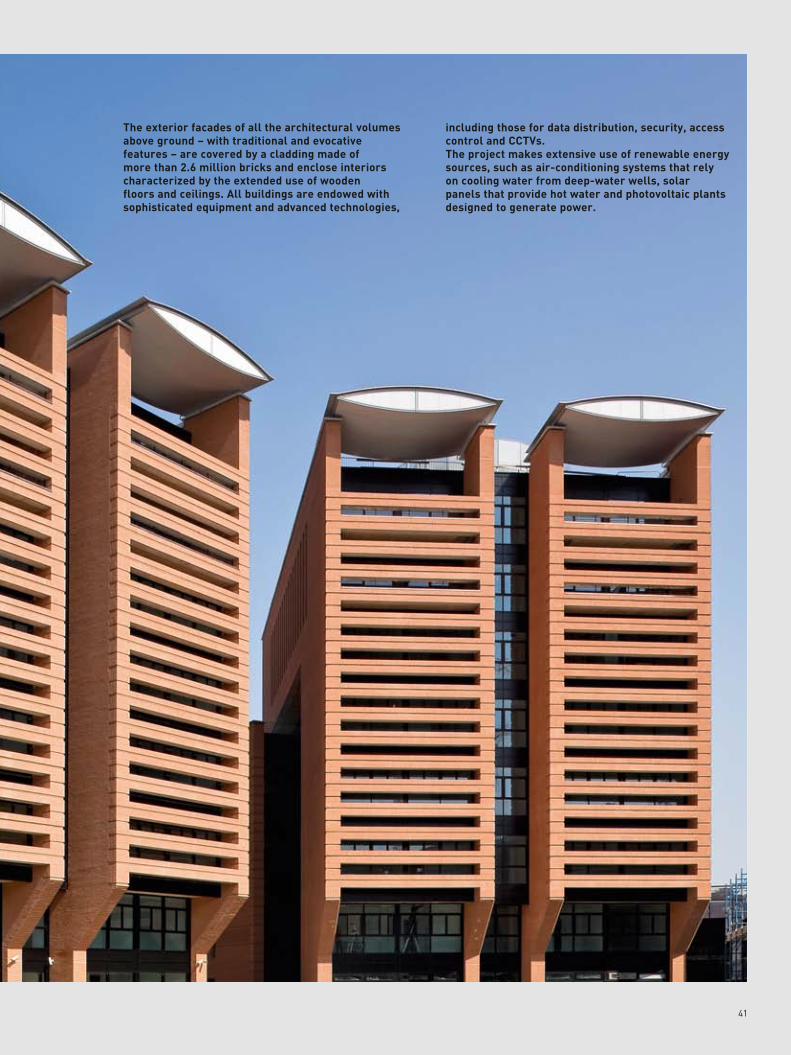
Rizzani de Eccher. Focus 2
Treviso Maggiore Treviso
Client: Fondazione Cassamarca
contract amount 173,000,000
work commencement September 2005
final delivery July 2012
total volumes 236,000 m3
area 60,000 m2
above-ground built up area 80,000 m2
below-ground built up area 55,000 m2
poured concrete 119,000 m3
reinforcement steel 16,600 t
exterior walls cladding 45,100 m2
bricks employed 2,660,000
doors and windows installed 2,430
curtain walling 15,200 m2
lifts 45
Treviso Maggiore was born just a few steps from the sixteenth century walls of Treviso, in the area where the historic factory of bricks and ceramics ‘Appiani’ has been operating since 1873.
The project, designed by the renowned architect Mario Botta with the aims of regenerating the area from an environmental and architectural perspective and linking the historic city centre with the most immediate outskirts, finds its centre of gravity in the large central square of over 11,000 m2, paved with Rosso Asiago marble and porphyry and dominated by a large marble fountain, in addition to the landscaping offered by 1,500 rose bushes.
Facing the square are 10 mixed-use buildings (office, retail and residential) of variable height between five and nine floors, a multipurpose auditorium with 500 seats and a small church. The basement, which extends for almost the entire surface of the complex, along with a parking garage located on the north end, hosts all technical installation and 2,000 parking spaces.
Treviso Maggiore was designed to become the new terminal for office and institutional buildings in the city and will host the prefecture, the police central precinct, the chamber of commerce, the manufacturers association, the confederation of craftsmen, the local tax office, another precinct for the financial police and the local headquarters of the builders association.
Arranged on the long sides of the square and complete with green areas, the residential buildings are developed on a lower area between ground floor and fourth floor, which includes 80 shops and offices, and a higher area on 4 towers, 9-storey each, yielding a total of 120 residential units. The residences include 16 duplex penthouses of 200 m2 each, with view over the Alps and the city centre to the north.

40
41
The exterior facades of all the architectural volumes above ground – with traditional and evocative features – are covered by a cladding made of more than 2.6 million bricks and enclose interiors characterized by the extended use of wooden floors and ceilings. All buildings are endowed with sophisticated equipment and advanced technologies,
including those for data distribution, security, access control and CCTVs.The project makes extensive use of renewable energy sources, such as air-conditioning systems that rely on cooling water from deep-water wells, solar panels that provide hot water and photovoltaic plants designed to generate power.
4242

4343
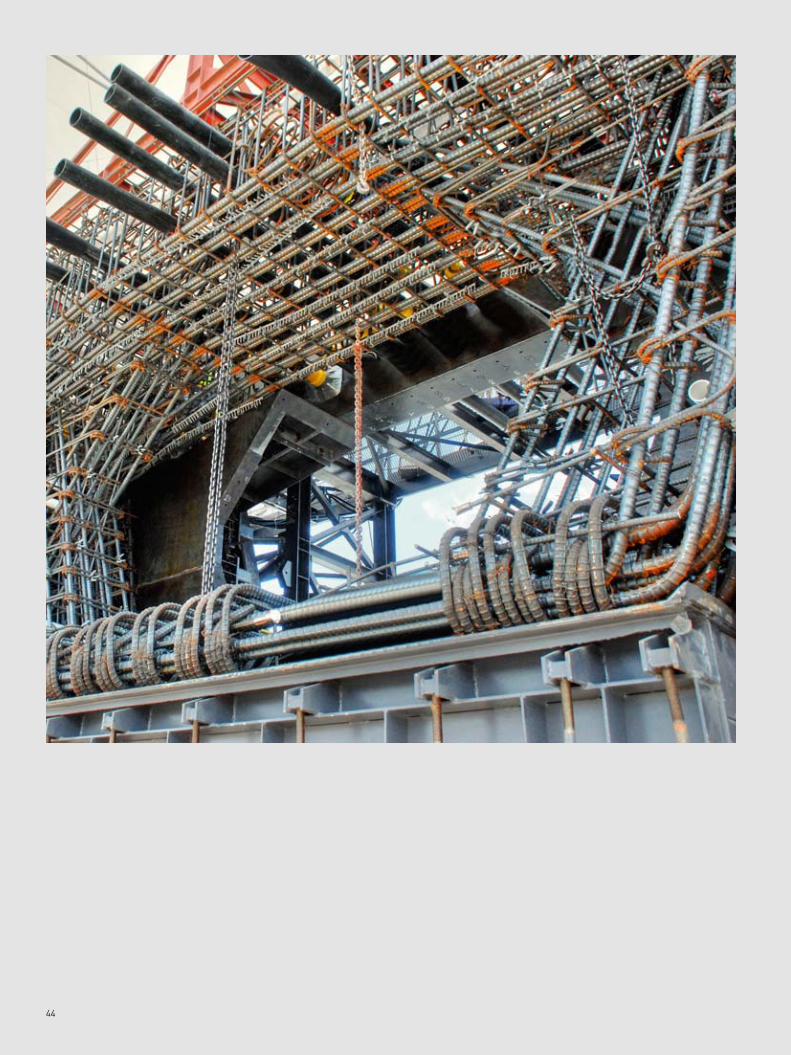
As part of a USD 558 million mega-project (the most expensive ever developed by the State of Florida) aimed at easing congestion on State Route 826 ‘Palmetto’, Rizzani de Eccher USA is currently building 4 viaducts with the pre-cast segmental method. The overlying viaducts serve as connecting ramps with State Route 836 ‘Dolphin’.
The precast segments are fabricated in the purpose-built prefabrication plant, which is the same one that had been previously served for the construction of the rapid transit Orange Line, and where two new sets of formwork dedicated to the new project have been installed.
The heavy congestion of the underlying area and the tight curvature radius of the viaducts have required special engineering solutions and the application of innovative construction methods. A particularly complex system was applied to temporary anchor between superstructure and piles.
The segments are launched by a launching beam specially designed and assembled to operate on this project. Launching activities take place mostly at night time to minimise traffic disruption.
In order to execute the project, Deal has supplied the following special equipment (worth in aggregate € 2.8 million):
_ two sets of formwork for segment prefabrication ‘balanced cantilever’ type
_ launching equipment set_ special accessories for expansion joints and pile-head
segments
Rizzani de Eccher / Deal. Focus 3
State Road 826Palmetto Expressway
Miami(Florida - USA)
Client: Florida Department of TransportationCommunity Condotte de Moya JV LLC
contract amount 38,000,000
start of segment prefabrication activities April 2011
start of segment launching activities September 2011
estimated completion of prefabrication August 2013
estimated completion of launching May 2014
total length of viaducts 2,365 m
width 14 m
minimum curvature radius 180 m
total number of prefabricated segments 783 total surface area of elevated decks 32,200 m2
concrete poured 19,000 m3
steel 2,000 tons
post-tensioning steel strands 960 tons
44

MANAGEMENT REPORT


4747
Economic and financial position
The consolidated financial statements for the accounting
period ending on 31 December 2011 show total revenues
(or value of production) of € 355.5 million (as opposed to
€ 482.6 million in FY2010), EBITDA of € 32.7 million (it was
€ 36.0 million in FY2010) and net profit of € 14.7 million
(against € 13.5 million in FY2010).
In the face of a sharp reduction in revenues (or value of
production), which was down 26.4%, the Group posted a
moderate reduction in operating profit (EBITDA) combined
with a slight improvement in net profit. This is a result that
bears testimony to Group’s ability to adjust its cost base in
relation to changes in demand deriving from such factors as
political upheavals and adverse macroeconomic conditions.
Uncertainty in the markets where the Group operates
has caused investment expenditure to stall. Tough
conditions in the construction market were exacerbated
in the second half of the financial year by the sudden, as
much as unpredictable, crisis that hit Eurozone financial
markets particularly hard. This had a significant impact
on the banking sectors and public finances of the weaker
countries of the Southern border of Eurozone, which face
mounting public debt, slowing GDP growth and rising
budget deficits.
Governments have dealt with the emergency primarily
by slashing spending and increasing taxes, wiping out
investment incentives, and naturally, this has affected the
construction market.
In the Mediterranean area, spontaneous reform movements
degenerated into political upheavals. The tragic epilogues
in countries such as Libya, Egypt and Tunisia have
contributed to destabilising the area, besides resulting
in the overall deterioration of relations between the Arab
world and the West. In particular, the Libyan crisis resulted
in the cancellation of a sizeable and prestigious project,
which had been awarded to the Group the previous year, in
partnership with other Italian companies.
Against this gloomy backdrop, only North American
markets – and specifically the United States – have kept
steady and performed, thanks to budgetary expansion
policies and the adoption of effective measures aimed at
improving competitiveness vis-à-vis other economies.
In spite of a bleak investment environment, the Group
operated in 2011 with focus, commitment and dedication,
seeking opportunities and project acquisitions in new
markets on one side, and striving for efficiency gains and
margin improvements in projects under management on
the other, which has resulted in the fairly positive financial
performance described above.
For the first time after years of constant growth, the share
of revenues from overseas operations has decreased to
66.8% (79.6% in 2010).
During the year under review, the following projects have
been acquired:
_ the construction of a mixed-use residential and
commercial complex in Moscow adjacent to a stadium
venue for the 2018 football World Cup. The complex
comprises of 12 buildings, of which 2 will be hotels under
management by Hyatt, 4 buildings will be office towers and
6 more will serve as residential buildings. The client is MC
Dynamo, a subsidiary of lender VTB Bank. The total value
for the project is ca. € 395 million;
_ the realization of a residential complex in Kazan (Russia)
for ZAO Townhouses Compound Zagorodnaya Usadba for
ca. € 19 million;
_ Rizzani de Eccher has taken over the position of
Immobiliare Lombarda Spa (a Gruppo FonSai company) in
the contracting consortium, which together with Lamaro
Appalti Spa, is entrusted with the construction of the massive
CityLife mixed-use development in Milan. The acquisition
yielded a backlog of € 202 million, which was increased by a
further tranche of € 48.5 million in January 2012.
During the year under review construction has continued
in respect of existing backlog orders, while activities have
resumed in the railway project in Algeria. However, there
have been slow-downs in projects (specifically in Eastern
Europe and in the Gulf area) essentially as a result of
clients scaling down investments in this uncertain climate.
The year-end acquisitions by Deal Srl of majority control
of Tensacciai Srl and Tesit Srl represent a new and
remarkable development. The two target companies
operate in the field of design, fabrication and installation
of cable-stays, components for tensile structures and
post-tensioning systems. These acquisitions constitute a
valuable addition to the Group and complement the product
range of Deal, besides representing a decisive step towards
the realisation of an integrated technological pole acting as
depositary of the Group’s know-how.
Management Report
4848
Management Report
In consideration of the testing macro-economic conditions
described in the foregoing sections, the outlook for
financial year 2012 calls for current revenue levels to be
maintained. Profitability however could suffer as a result of
the additional costs associated with the re-activation of the
project in Algeria and lower than expected margins from
some Italian projects.
For further comments and summary data on the Group
please see the section ‘2011 at a glance’.
Treasury shares and shares in parent companies
Rizzani de Eccher Spa does not have ownership of any of its
own shares or of shares of its controlling companies, either
directly or indirectly, through affiliated entities, trustees or
nominees.
Research and development
No expenditure for research and development occurred in
the financial year 2011 allowed to be capitalized on the basis
of accounting standards. However, Deal’s (and for the future,
Tensacciai and Tesit) technical team undertakes constant
and continuous research and technological development
activities which has enabled the Group to become a world
leader in designing and producing special machines and
equipment for the construction of bridges and viaducts. Such
costs have been accounted for in the income statement.
Financial instruments: objectives and policies of the company and description of risks
Pursuant to the provisions of art 40, section 1 and 2, sub-
section d) bis of Legislative Decree 127/1991 we report
the main risks and uncertainties to which the company is
exposed, as well as the financial transactions, securities
and instruments in which the Group is engaged or has
open positions consist of net cash and cash equivalents,
trade payables and receivables, advance payments from
customers, bank debt and leasing liabilities. We also report
that as at 31 December 2011 the Group has one IRS and
a CAP in place as a hedge over parent company financing
against interest rates volatility, a put option on dollars
and a currency option on credits in MYR. Details are listed
under the Memorandum accounts in the Notes to this
annual report.
Market risk, operational risk and price risk
The Group is chiefly engaged in the construction business,
specifically in the construction of residential buildings,
office buildings, industrial buildings, hospitals, hotels,
military infrastructure, large-scale restoration works and
large infrastructure projects such as roads, highways,
railways and subways.
Normally, Group companies operate as main contractor,
acting alone or in joint ventures. Furthermore, through
subsidiary Deal, the Group provides engineering services
such as the design and fabrication of special equipment
for the construction of bridges and viaducts. The Group is
actively present in the following countries: Italy, USA, UAE,
Qatar, Kuwait, Bahrain, Lebanon, Saudi Arabia, Russia,
Ukraine, Kazakhstan, Azerbaijan, Algeria and Australia.
The Group is therefore exposed to the general macro-
economic risk of the countries in which it operates. The
investment choices in buildings and infrastructures of
potential clients are in fact influenced by the particular
juncture in the economic cycle, whose principal variables
are gross domestic product (GDP), capital formation
rates, inflation, interest rate and exchange rate. It is
therefore possible that adverse socio-economic conditions
in operation countries may result in a slowdown or
in extreme cases in a suspension and cancellation of
contracts acquired. Moreover, the constructions carried
out imply a type of operational risk which cannot be
entirely neutralized. This is linked to the need to manage
technical complexities of the works within the contractual
terms agreed, and in different environmental and
regulatory contexts.
With regards to price risk, if the projects require the
purchase of raw materials which are subject to price
fluctuations, appropriate hedging strategies that minimize
this risk are assessed and implemented wherever and
whenever possible.
Credit risk
Credit risks consists in the Group’s exposure to potential
losses deriving from clients not fulfilling their obligations.
Although the Group operates in areas which may require
managing sovereign risk, the Group’s counterparts are
sovereign states, governmental entities or primary clients
which operate on international banks entrusted by primary
financial institutions.
Credit risk management strategies articulates in several
phases, starting from the preliminary valuation carried out
before presenting an initial offer until the negotiation of
a contract and the accurate management of the contract
itself once underwritten.
49
Liquidity risk
Liquidity risk consists in the risk that the Group’s resources
may not be sufficient to meet its obligations at the time and
mode agreed.
Management believes that the Group generates adequate
cash flow; that the maturity profile of short and medium-
to-long term liabilities is well balanced and that it matches
the corresponding maturity profile on the asset side of its
balance sheet. Management further believes that this risk
is non-existent in consideration of a net positive financial
position for the Group of over € 80 million.
Interest rate risk
Outstanding loans vary in terms of technical structure and
are equally distributed between short-term and medium-
term. Interest rates are on average at around 2.7%.
One IRS and one CAP contract are in place as at 31
December 2011. The Group engages into such contract
within the boundaries set by ordinary operations’
requirements avoiding speculative purposes.
In keeping with the Group’s general aversion to risk,
financial transactions are only dealt with prime financial
institutions and instruments which can be easily liquidated.
Foreign exchange risk
The Group’s strong international presence make it exposed
to currency risk.
The Group’s policy and overriding objective is to match the
currency of revenues with the currency of payments to local
subcontractors and suppliers. However the Group does
consider currency hedging transactions in the event that
currency mismatches arise. As reported before, as of year
end the Group is engaged in a put option for dollars and a
currency option linked to credits in MYR.
Information concerning the staff, environment and organization
In connection with the disclosure in the matters of
personnel, the environment and organization, we refer the
reader to the sections titled “Human resources”, “Safety
and health” and “Sustainable development”.
Significant events occurring after closing of the financial year
Management reports no significant events occurring after
closing of the financial year, which may have an impact on
these Consolidated Financial Statements.
Business outlook
As anticipated, also on account of the complex projects
currently being undertaken, during the course 2012
production levels will be maintained at around the
same levels of 2011, but profitability may be affected.
Management is strongly committed to limiting such impact
on profitability by reducing costs and – wherever this is
possible – actively pursuing additional revenue claims
through attentive contract management.

NOTES TO THE 2011 ANNUAL REPORT

5151
The consolidated financial statements as of 31 December
2011 provide a clear picture of the assets and liabilities
position, the financial position and the profit-and-loss
result of following companies:
_ Rizzani de Eccher Spa
_ Subsidiaries (Appendices ‘A’ and ‘B’).
The consolidated financial statements were drawn up
in accordance with the following Legislative Decrees:
no.127/91; no.213/98; no.6/03 and no.37/04, and no. 32/07.
The Group waived the exemption right contemplated by
Art. 27 (subsection 3) of Legislative Decree 127/1991 in the
matter of Corporate Disclosure.
For the purposes of consolidation, the Financial Statements
as at 31 December 2011 of the subsidiaries and associated
companies forming the Group, as drafted by their Boards
and approved or under approval by their respective
Shareholders’ Annual General Meetings, have been used.
These Financial Statements are truthfully derived from
the corresponding entries in the ledgers and books of the
Group duly kept and properly maintained in full compliance
with the provisions of Art. 2423 et seq. of the Italian Civil
Code, save for consolidation adjustments for the sake of
consistency with Group policies.
Scope of consolidation
Includes the companies and consortia listed in:
- appendix ‘A’: i.e. companies consolidated using the full
consolidation method;
- appendix ‘B’: i.e. companies consolidated using the
proportional method.
In accordance with Art. 28 (subsection 2) of Legislative
Decree no. 127/1991, the subsidiaries and associated
companies listed in appendix ‘C’ are not consolidated.
As opposed to the Consolidated Financial Statements as at
31 December 2010, during financial year 2011 the following
subsidiaries have been added to the scope of consolidation
with the full method: Tensacciai Srl, Tesit Srl, Interbridge
Technologies BV e Rizzani de Eccher Australia Pty Ltd;
City Contractor Scarl has been added to the scope of
consolidation with the proportional method.
On the other side, while until 31 December 2010 Rizzani
de Eccher Doo was consolidated using the full method
and VSL-Rizzani de Eccher JV was consolidated using
the proportional method, in the year 2011 both have been
consolidated using the equity method.
Principles and basis of consolidation
The Financial Statements of foreign subsidiaries and
associated companies have been converted into Euro using
year-end spot exchange rates for balance sheet items
and year-average exchange rate for income statement
items. The foreign currency-denominated ending balances
of overseas branches of the companies included in the
consolidation were converted using the year-end spot rate.
The following exchange rates were adopted (rounded to the
second decimal):
CONTENTS OF THE CONSOLIDATED FINANCIAL STATEMENTS

5252
USD
CAD
RUR
UAH
AED
KZH
PHP
QAR
TJS
AZN
DZD
LBP
SAR
KWD
BHD
1.39
1.38
41.57
10.55
5.11
204.10
57.54
4.80
6.27
1.04
98.42
2097.05
5.22
0.37
0.52
1.29
1.32
41.76
10.37
4.75
191.88
56.75
4.71
6.16
1.02
97.47
1949.26
4.85
0.36
0.49
CurrencyAverage rate
2011Exchange rate
31.12.2011
US Dollar
Canadian Dollar
Russian Rouble
Ukrainian Hryvnia
UAE Dirham
Kazakhstan Tenge
Philippines Peso
Qatari Riyal
Tajikistani Somoni
Azerbaijani Manat
Algerian Dinar
Lebanese Pound
Saudi Riyal
Kuwait Dollar
Bahrain Dinar
The following principles were adopted in consolidating
Financial Statements with the full consolidation method:
a. substitution of book value of equity investments held
by the parent company and by other companies within
the consolidation perimeter with the net asset value as
resulting at the date of consolidation; while assets and
liabilities of the investee companies are consolidated to
the parent company. If any gains arise as a result, these
are booked, were applicable to the assets of the subsidiary
and for the excess as a consolidation difference item.
Conversely, if a negative item arises, this is booked to
the shareholders’ equity under the entry ‘consolidation
reserve’;
b. related-party transactions giving rise to intra-group
payables-receivables and revenues-expenses are offset
against each other;
c. unrealised gains and losses arising from related-
party transactions are offset against each other in the
consolidated financial statements;
d. minority interests in the equity of consolidated companies
and their income are indicated as such in the consolidated
financial statements;
e. dividend payouts from consolidated companies to other
consolidated companies are offset against each other.
Participations in joint ventures and other companies
included in the consolidation process over which
control is exercised together with other partners were
consolidated using the proportional method, booking their
assets, liabilities and share of net income to the parent’s
consolidated financial statements pro-rata in proportion to
the percentage of ownership detained.
Accounting principles and valuation criteria
The consolidated financial statements have been prepared
in order to represent a true and fair view of the financial
position and results of operations of the companies
included in consolidation.
In the consolidated accounts, unrealised currency
translation gains from overseas branches are offset
against corresponding unrealised losses, including any tax
liability or tax credit that may arise, and then booked to the
shareholders’ equity. Conversely, unrealised translation
losses from overseas branches are booked as accruals in
the statutory accounts.
Save for the above and the financial leasing accounting
method, valuation criteria and accounting principles are
the same as adopted in the parent’s financial statements
and there have been no changes as opposed to previous
financial years.
The items of the current consolidated accounts as at
31.12.2011 are comparable to those of previous financial
years.
The main evaluation criteria adopted in the preparation of
the consolidated financial statements are detailed below.
Intangible assetsIntangibles are booked at historical cost net of cumulated
amortisation. Intangibles are amortised in proportion to
their useful life.
In the event of depreciation, loss of market value or
other diminutions of value that exceed the accounting
depreciation, intangible assets are written down based
on prudent principles. With the exception of goodwill,
depreciated assets may in future financial years be
reinstated at their original value (solely by adding back
Notes to the 2011 Annual Report

53
depreciation charges) if the circumstances warrant it.
Goodwill, that is any excess of acquisition cost over net
book value and originating from the acquisition of business
units of other companies, is booked (with the prior consent
of the Board of Auditors) on the basis of the actual cost
incurred and is amortised on a straight-line basis over a
period of 10 years, in accordance to what is deemed as its
useful life.
Incorporation, start up and development expenses are
capitalised (with the prior consent of the Board of Auditors)
on the basis of the actual cost incurred and amortised on a
straight-line basis over a period of 5 years.
Project acquisition expenses, project planning, plant
erection and site mobilisation expenses are expensed
(booked to the income statement) in proportion to the
progress payment certificates (revenues) of the specific
project to which they refer.
Fixed assetsFixed assets are entered in the financial accounts at their
purchase cost or in-house production costs. Fixed assets
are depreciated during each accounting period at assigned
rates that vary according to category and are indicated
below. The depreciation rates are determined on the basis
of their useful life and residual value, taking into account
economic and technical factors. The assigned depreciation
rates are reduced by 50% for new assets in their first year,
in accordance to the average degree of their utilization.
53
Contents of the Consolidated Financial Statements
3%
15%
20%
10%
9%
25%
25%
20%
40%
12.5%
12%
20%
Annual rateCategory
Buildings
Operating machinery and special equipment
Excavators and mechanical shovels
General systems
Photovoltaic system
Formwork and scaffolding
Light vehicles
Heavy vehicles
Miscellaneous equipment
Light constructions
Office furniture and equipment
Electronic and electromechanical office equipment
The depreciation of fixed assets of the subsidiary Rizzani
de Eccher USA Inc and Rizzani de Eccher Barhain SPC is
applied on the basis of different economic and technical
factors. These consider the specific utilisation of machinery
in the production process.
All goods of value not exceeding € 516.46 and unless
independently valued otherwise, are expensed in their year
of purchase, provided that their useful life is within the
same year. In the event of permanent depreciation, long-
term loss of market value or other permanent diminution
of value that exceed the accounting depreciation, the assets
are written down based on prudent principles. Depreciated
assets may in future financial years be reinstated at their
original value (solely reduced by depreciation charges) if
the circumstances warrant it.
Recurrent maintenance charges are booked as expenses in
the income statement. Extraordinary maintenance charges
are booked as incremental value to the assets they refer
to and depreciated pro-rata in accordance to the assets’
residual useful life.
Leased assetsAssets acquired under financial leasing contracts are
accounted for in the consolidated financial statements in
accordance with the leasing capitalization method, save for
any adjustments applicable in the event that the relevant
consolidated subsidiaries account for the same leasing
contracts under the operating leasing method. Therefore:
_leased assets are booked as fixed assets at the cost of
purchase as of the date of commencement of the leasing
contract and are regularly depreciated in accordance with
the assumed economic life of the assets;
_the outstanding obligation balances, which comprise
of leasing instalments not yet due and the residual or
redemption value of the assets, are booked as a payable in
the section ‘Amounts owed to other financiers’;
_the interest portion of leasing instalments is recognised
as an expense in the income statement in order to reflect a
flat interest rate on the outstanding principal.
InvestmentsInvestments in shares of companies and entities which are
not fully consolidated are carried at their pro-rata share
of net asset value (NAV). Other investments in companies
and entities that are of minor relevance are carried at cost,
based on purchase price or share subscription price.
Equity investments are written down in the event of long-
term loss or diminution of value, specifically in the event
5454
that the investee incurs substantial losses that are unlikely
to be reinstated by the subsequent generation of earnings.
Investment in securities are booked at cost and adjusted for
any long-term loss of value.
Written down investments may be reinstated at a higher
value in future fiscal years if the circumstances warrant it.
Other long-term investments such as loans and debentures
are valued at the net realisable value at maturity.
InventoriesRaw materials are valued at the lower of purchase cost and
net realisable value. Works in progress that have duration
of more than 12 months include works that have been
completed but have not yet received final commissioning
and are valued on the basis of their physical progress, with
the exception of works in progress by Rizzani de Eccher USA
Inc and Rizzani de Eccher Bahrain SPC, whose valuation is
made on a ‘cost to cost’ basis, as this method offers a better
representation of the specific contracts involved.
Works in progress, as attested by approved progress
certificates, are booked net of any advances already paid
by clients.
Works in progress with duration of less than 12 months are
booked on the basis of the related cumulative costs and
expenses incurred to date.
Allocations of risk reserves or general prudential
provisions arising from running projects or which are likely
to arise from completed projects under guarantee schemes
are classified under provisions for contingencies and other
liabilities on the liabilities side of the balance sheet.
Works in progress of own real estate developments are
valued with reference to their production cost calculated
by adding all imputable direct costs, and excluding indirect
costs such as selling, general, administration and interest
expenses.
Completed portions of own real estate developments are
valued at the lower of replacement cost and net realisable
value.
Receivables and payables Trade receivables are entered at their presumed realisation
value.
Overdue receivables with interests accruing until 31
December 2002 are carried at their nominal value,
integrated by penalty interest accruals in the corresponding
tax exempt fund over the same period.
Overdue receivables with interests accruing in subsequent
periods are posted at their assumed net realisation value,
while any corresponding penalty or default interest is
booked on an accrual basis only as a result of warranting
circumstances such as serving of a default notice,
favourable arbitration and court verdicts, etc. Payables and
other debts are booked at their face value.
Interest on overdue receivables is a statutory penalty
interest set by law.
Employees’ severance indemnityAccruals to the employee severance indemnity are made
on the basis of the amounts actually owed to employees at
the end of each accounting period, calculated in accordance
with relevant legislation and the applicable employment
contracts.
Management reports that pursuant to the modifications
to the employees’ severance indemnity by Law 296 of 27
December 2006 and ensuing regulations, the accruals to
the employees’ severance indemnity from 1st January
2007 onward (or any successive date) can be placed, at the
option of the employee, with the Treasury Fund at INPS
(Social Security Agency) or with private sector funds.
Accruals and deferred income/expensesAccruals and deferred income/expenses are calculated on
the basis of the accounting periods to which they refer.
Revenue and cost recognitionRevenues from the sale of materials, semi-finished and
finished goods are recognised as of the time of delivery of
goods. Revenues from the sale of services are recognised
as of the time of the completion or delivery of service.
Revenues from works in progress under contract terms
equal to or exceeding 12 months are recognised as of
the time of formal attestation in a progress certificates
endorsed by customer. Revenues from works in progress
under contract terms of less than 12 months are booked as
of the time of completion or delivery.
Variation claims are included in revenues only in the
event of deliberations and favourable arbitration verdicts,
provided that objective circumstances warranting the claim
do exist.
Costs and expenses for the purchase of goods and services
are booked with reference to the corresponding revenue
items as described above.
Income taxIncome tax for the accounting period is calculated on a time
Notes to the 2011 Annual Report
5555
Contents of the Consolidated Financial Statements
accrual basis. Tax charges are determined on the basis of
relevant tax regulations during the accounting period.
Deferred tax assets and liabilities are calculated on the
basis of any mismatch (provisional difference) between
accounting and fiscal valuations of assets and liabilities,
applying the projected tax rate presumed to be in effect
as of the time when such differences arise. Deferred
tax asset is recognised only if management is of the
reasonable opinion that they will be refunded. Deferred tax
liabilities are recognised with respect to taxable amounts
arising from accounting and tax valuation mismatches,
except in the event that management is of the reasonable
opinion that such liabilities are unlikely to arise. For this
reason, no deferred tax liabilities were set off against the
corresponding tax-exempt reserves in shareholders’ equity,
in consideration that no transactions giving rise to deferred
tax liabilities are likely to occur. The net balances between
tax assets and liabilities are offset against each other as
and whenever permitted by relevant laws.
Memorandum accountsMemorandum accounts include back-to-back guarantees
provided by the Group on behalf of subsidiaries and
associated companies not consolidated and third
party beneficiaries, in compliance with Art. 2424 of the
Italian Civil Code. They also include bank and insurance
guarantees in the form of performance bonds, retention
money guarantees and bid bonds in which the Group is an
obligor. To avoid duplications and uphold the principle of
clarity of these Financial Statements, bank and insurance
guarantees on contract advances are not included in the
memorandum accounts, but are discussed in the Notes to
this Annual Report as a comment on the relevant items of
the Financial Statements.
Derivative contractsDerivative contracts on interest rates and foreign
currencies are booked in accordance to whether they
meet the relevant regulatory requirements which qualify
derivative contracts as a hedging position.
For derivative contracts on interest rates which qualify as
hedging, only the portion of interest associated with the
periodic liquidation of the maturing contract differential is
booked. The contract fair value is indicated in the Note to
this Annual Report but it’s not reflected in the balance sheet.
For interest rate derivative contracts which do not qualify as
hedging positions and whose fair value is out of the money,
an allocation corresponding to the exposure towards the
counterparty is made in the balance sheet. If fair value is in
the money, no gain is booked in the financial statements.
For foreign currency derivative contracts qualifying as
hedging positions, the differential between spot rate and
forward rate at year-end is booked in the accounts or, in
the case of options, is booked the premium paid at the
time of subscription, distributed over the options’ life. Fair
value is indicated in the Notes to this Annual Report. Non-
hedging foreign currency derivative contracts are instead
booked as a counterparty payable if out of the money, or
counterparty receivable if in the money.
The determination of fair value of derivative contracts is
made in accordance with generally accepted valuation
methods and models. Besides fair value of derivative
contracts, the Notes to this Annual Report also includes in
the Memorandum accounts section the notional amount of
open derivative contracts as at year end.
Foreign currency transactionsForeign currency transactions are converted in Euro at the
spot exchange rate as of the date of the transaction.
Assets and liabilities in foreign currenciesAssets and liabilities denominated in foreign currencies are
converted in Euro at the year-end spot exchange rate. Any
gains or losses arising from exchange rate differential are
booked to the income statement.
Additional information
The disclosure required under the provisions of Art. 38
of Legislative Decree no. 127/1991 is provided along with
supplementary comments item by item in the same order
as they appear in the Financial Statements.
The Group has not exercised its waivers under the
provisions of Art. 29, subsection 4, of Legislative Decree no.
127/1991.
Audited financial statements
Pursuant to Art. 2409-bis of the Italian Civil Code and the
Art. 13, subsection 1, of Legislative Decree no. 39 of 27
January 2010, these Consolidated Financial Statements
have been audited by Reconta Ernst & Young Spa.
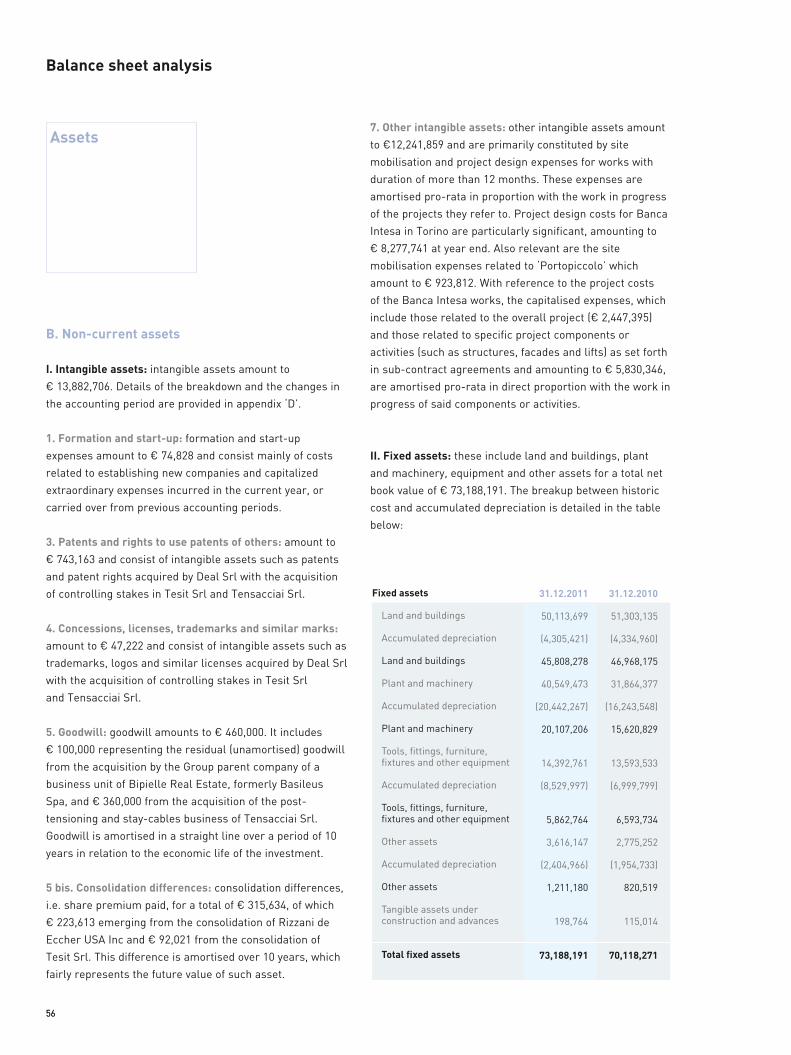
5656
Balance sheet analysis
B. Non-current assets
I. Intangible assets: intangible assets amount to
€ 13,882,706. Details of the breakdown and the changes in
the accounting period are provided in appendix ‘D’.
1. Formation and start-up: formation and start-up
expenses amount to € 74,828 and consist mainly of costs
related to establishing new companies and capitalized
extraordinary expenses incurred in the current year, or
carried over from previous accounting periods.
3. Patents and rights to use patents of others: amount to
€ 743,163 and consist of intangible assets such as patents
and patent rights acquired by Deal Srl with the acquisition
of controlling stakes in Tesit Srl and Tensacciai Srl.
4. Concessions, licenses, trademarks and similar marks: amount to € 47,222 and consist of intangible assets such as
trademarks, logos and similar licenses acquired by Deal Srl
with the acquisition of controlling stakes in Tesit Srl
and Tensacciai Srl.
5. Goodwill: goodwill amounts to € 460,000. It includes
€ 100,000 representing the residual (unamortised) goodwill
from the acquisition by the Group parent company of a
business unit of Bipielle Real Estate, formerly Basileus
Spa, and € 360,000 from the acquisition of the post-
tensioning and stay-cables business of Tensacciai Srl.
Goodwill is amortised in a straight line over a period of 10
years in relation to the economic life of the investment.
5 bis. Consolidation differences: consolidation differences,
i.e. share premium paid, for a total of € 315,634, of which
€ 223,613 emerging from the consolidation of Rizzani de
Eccher USA Inc and € 92,021 from the consolidation of
Tesit Srl. This difference is amortised over 10 years, which
fairly represents the future value of such asset.
7. Other intangible assets: other intangible assets amount
to €12,241,859 and are primarily constituted by site
mobilisation and project design expenses for works with
duration of more than 12 months. These expenses are
amortised pro-rata in proportion with the work in progress
of the projects they refer to. Project design costs for Banca
Intesa in Torino are particularly significant, amounting to
€ 8,277,741 at year end. Also relevant are the site
mobilisation expenses related to ‘Portopiccolo’ which
amount to € 923,812. With reference to the project costs
of the Banca Intesa works, the capitalised expenses, which
include those related to the overall project (€ 2,447,395)
and those related to specific project components or
activities (such as structures, facades and lifts) as set forth
in sub-contract agreements and amounting to € 5,830,346,
are amortised pro-rata in direct proportion with the work in
progress of said components or activities.
II. Fixed assets: these include land and buildings, plant
and machinery, equipment and other assets for a total net
book value of € 73,188,191. The breakup between historic
cost and accumulated depreciation is detailed in the table
below:
Assets
31.12.2011
50,113,699
(4,305,421)
45,808,278
40,549,473
(20,442,267)
20,107,206
14,392,761
(8,529,997)
5,862,764
3,616,147
(2,404,966)
1,211,180
198,764
73,188,191
31.12.2010
51,303,135
(4,334,960)
46,968,175
31,864,377
(16,243,548)
15,620,829
13,593,533
(6,999,799)
6,593,734
2,775,252
(1,954,733)
820,519
115,014
70,118,271
Fixed assets
Land and buildings
Accumulated depreciation
Land and buildings
Plant and machinery
Accumulated depreciation
Plant and machinery
Tools, fittings, furniture, fixtures and other equipment
Accumulated depreciation
Tools, fittings, furniture, fixtures and other equipment
Other assets
Accumulated depreciation
Other assets
Tangible assets under construction and advances
Total fixed assets

5757
Balance sheet analysis
31.20%
20.00%
50.00%
33.33%
33.33%
45.00%
24.50%
20.00%
1,470,164
73,729
5,000
27,340
27,463
-
-
449,399
2,053,096
1,348,273
9,963
5,000
27,340
27,463
66,098
24,500
412,597
1,921,234
Associated companies through Deal Srl (3)
de Eccher Interiors Srl (3) Store 26 Scarl
Variante di Valico Scarl under liquidation
Risalto Srl under liquidation
VSL-RdE JV (1)
Consorzio Lybia Green Way
Futura Srl (3)
Total
Associated companies
(1) Company accounted for using the equity method since 2011(2) Company full consolidated since 2011(3) Company accounted for using the equity method
The relevant transactions concerning changes in fixed
assets related to the current financial year are highlighted
in appendix ‘E’.
The increase in investments in fixed assets over the preceding
year (€ 3,069,921) is mainly attributable to the purchase of
plants and machinery necessary to carry out construction
works at the sites of Torino and Manama (Bahrain).
III. Investments: investments comprise of equity
investments, loans and securities.
1. Equity investments: equity investments amount to
€ 2,491,469 as of 31.12.2011 (as opposed to € 2,626,752 as
of 31.12.2010). A detailed breakdown of equity investments
in associated companies and companies whose accounts
are not consolidated in these financial statements is shown
in the following table.
As at year end, the Group holds ‘Other equity investments’
for an aggregate € 489,075 (as opposed to € 496,832 as of
31 December 2010). Among these, the most important is a
stake in Cantina Bertiolo, which is valued at € 389,781.
Participations in subsidiaries and associated companies
amount to € 81,160 and € 1,921,234 respectively, as follows:
2011 share
98.42%
100.00%
64.15%
90.00%
99.97%
60.00%
99.00%
100.00%
75.00%
Book value at31.12.2010
1,608
10,000
6,549
-
52,162
502
2
1
6,000
76,824
Book value at31.12.2011
1,608
10,000
6,549
4,838
52,162
1
2
-
6,000
81,160
Codruss
Safau Iniziative Srl
Peloritani Scarl under liquidation
Rizzani de Eccher DOO (1)
Consorzio RdE America Centrale
Prospettive Immobiliari Srl under liquidation
Sinedil Srl
Rizzani de Eccher Australia PTY (2)
Volturno Scarl under liquidation
Total
Subsidiary companies

58
d. Accounts receivable from other companies: for a total
€ 1,007,030 (as opposed to € 632,151 as of 31 December
2010). This item includes security deposits for € 385,698
and other loans for € 621,052. It also includes € 365.912
receivables from third party shareholders in associated
companies consolidated with the proportional method.
3. Other investments: other investments amount to €
2,074,740 (€ 4,568,042 as of 31 December 2010) and consist
of securities issued by top rated financial institutions.
C. Current assets
I. Inventories: total inventories at year end amount to
€ 91,209,861 (€ 70,056,009 as of 31 December 2010) and
are broken down as follows:
31.12.2011
252,129
165,000
417,129
31.12.2010
251,129
120,000
371,129
Peloritani Scarl under liquidation
Safau Iniziative Srl
Total
58
31.12.2011
9,420,999
7,373,372
45,654,809
11,141,797
17,618,884
91,209,861
31.12.2010
8,590,758
7,469,883
36,559,281
8,620,676
8,815,411
70,056,009
Raw materials and consumables
Works in progress and components
Contracts in progress
Finished goods and goods for resale
Advances to suppliers
Total
-
39,299
39,299
249,998
-
249,998
31.12.201031.12.2011
Borgo Sole Spa
Fressynet-Rizzani de Eccher JV
Total
b. Accounts receivable from associated companies
As described earlier in the introduction section to these Notes,
total contracts in progress are offset by cumulative advance
payments received from customers against regularly attested
and duly invoiced progress certificates in the amount of € 1,085
million (€ 1,141 million as of 31 December 2010). Advance
payments of €17.6 million mainly relate to down payments
made to sub-contractors, suppliers and professionals. The
increase is mainly due to advance payments to sub-contractors
and suppliers for the ongoing project in Lebanon. Such
advances have already been reimbursed by the client as part of
the cost plus fee contract in effect for this project.
Management would like to highlight the amount of contingent
revenues associated with pending variation claims initiated
by the parent company and several subsidiaries. As indicated
earlier, any variation claims, liquidated damages and extra-
fees are recognised as revenues upon their final ratification,
in keeping with the principles that objective circumstances
warranting the claim do exist.
II. Accounts receivable: current accounts receivable amount
to € 157,453,337 (€ 190,982,528 as of 31 December 2010).
1. Trade receivables: amount to € 139,096,468 (€
177,416,994 as of 31 December 2010) net of provisions for
bad and doubtful debts of € 2,733,814 and after deducting
€ 1,635,716 set aside as interest on overdue receivables.
The breakdown of accounts receivable is as follows: net
receivables due within 12 months € 135,746,907; net
receivables due beyond 12 months € 3,349,561. Receivables
over 12 months relate to retention monies held by clients in
connection with projects not yet formally commissioned. The
reduction in outstanding client receivables is due essentially
to the collection of significant receivables outstanding at
year-end in 2010 in respect of the Al Udeid Air Force Base, a
project which has been successfully completed.
The geographical break-down of receivables is as follows
(amounts in thousands of Euro):
2. Accounts receivable: accounts receivable amount to
€ 1,463,458 (€ 1,253,278 as of 31 December 2010). They consist
of term loans to non-consolidated subsidiaries, associated
companies and third parties. Their breakdown is as follows:
a. Accounts receivable from subsidiaries
Notes to the 2011 Annual Report
72,668
14,319
43,489
894
5,353
1,055
1,318
139,096
Italy and Europe
Russia and CIS
Middle East
Africa
North and Central America
Far East
Australia
Total

59
3. Receivable from associated companies: amount
to € 46,794 (€ 283.248 as of 31 December 2010), all
due within 12 months by associated companies that
are outside the scope of the proportional method
consolidation (because not material or because they are
valued using the equity method):
4.bis Tax credits: amount to € 12,690,017
(€ 10,504,825 as of 31 December 2010) and are broken
down as follows:
The above balances are posted net of any debt owed
in connection with the same tax and are inclusive of
the consolidation of the net tax credit/debit positions
transferred to the parent company under applicable Italian
rules and regulations in the matter of tax accounting for
consolidation.
4.ter Deferred tax assets: deferred tax assets amount to
€ 2,368,250 net of deferred tax liabilities. The previous
year the net of deferred taxes was a liability for € 728,140.
The significant increase is due to tax calculated on the
receipt of contractual claims took place in 2010, which
upon filing of the tax return, hence from a tax perspective,
have been prudently considered as taxable income, but
because their effectiveness was subject to final arbitration
award, from an accounting perspective they could not
consider as certain income and booked to the income
statement.
The following table shows movements and balances in
respect of deferred tax assets and liabilities.
31.12.2011
24,866
21,928
46,794
31.12.2010
2,120
281,128
283,248
de Eccher Interiors Srl
Store 26 Scarl
Total
59
Changes in provisions for bad and doubtful debts are
summarised below:
The write-backs of € 1,522,129 refer to the collection of a
trade receivable for € 1,297,258 in Dubai, which had been
fully provided for in earlier financial years, and for
€ 224,871 to the collection by the Group parent company of
another receivable that had been classified as doubtful in
an earlier financial year.
The amounts allocated to contingencies for bad and
doubtful receivables at year end reflect the most
conservative assessment by management on the credit
risk for the current year.
Provisions for interests on overdue receivables amount to
€ 1,635,716, having been reduced by € 12,479 as a result
of the write-back of a non-performing receivable collected
in 2011. Commencing in 2003 interest is booked with the
underlying principal on a time-accrual basis.
2. Receivable from subsidiary companies: amount to
€ 61,326 (€ 67,570 as of 31 December 2010) and are all
due within 12 months from controlled companies which
are not consolidated (because they are immaterial or
under liquidation). They are broken down as follows:
Balance sheet analysis
4,143,609
72,106
(1,522,129)
40,228
2,733,814
Opening balance
Provisions
Collections (write-backs)
Changes in consolidation area
Closing balance at year-end
1,648,195
-
(12,479)
1,635,716
Opening balance
Provisions
Collections (write-backs)
Closing balance at year end
31.12.2011
60,786
-
-
540
61,326
31.12.2010
60,786
4,627
1,872
285
67,570
Peloritani Scarl under liquidation
Rizzani de Eccher Australia PTY
Volturno Scarl under liquidation
Safau Iniziative Srl
Total
31.12.2011
3,912,099
8,777,918
12,690,017
31.12.2010
5,477,904
5,026,921
10,504,825
Corporate income tax and withholding tax
VAT receivables
Total
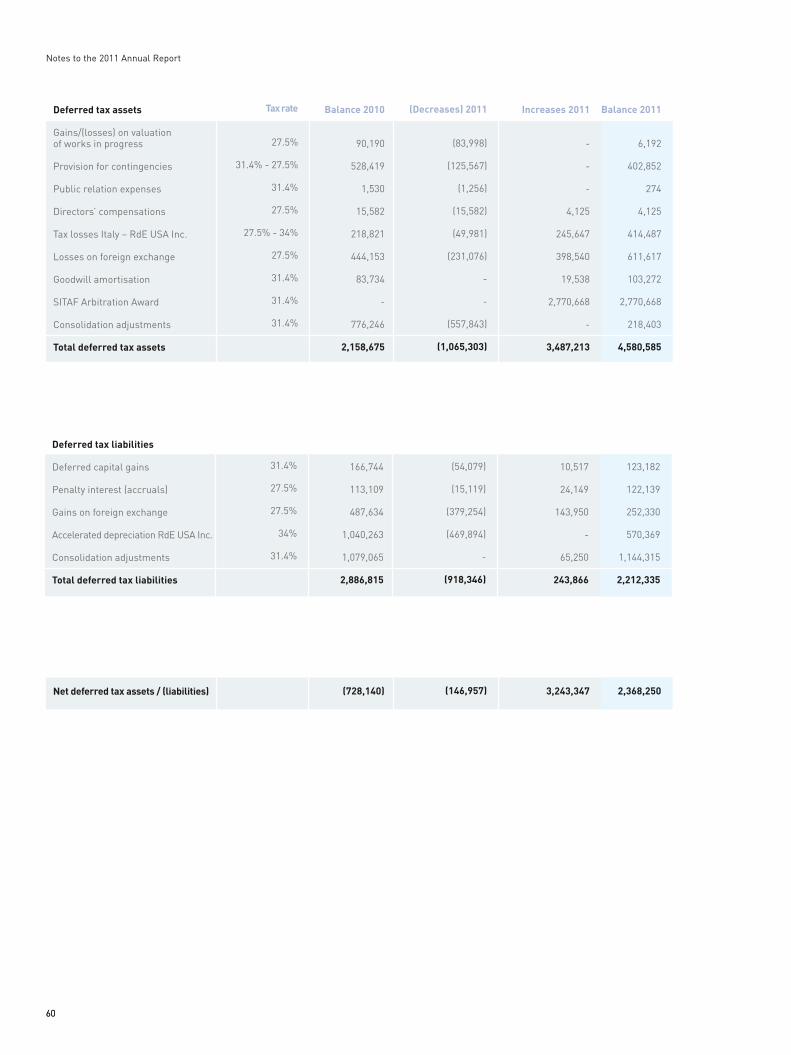
6060
Notes to the 2011 Annual Report
Tax rate
27.5%
31.4% - 27.5%
31.4%
27.5%
27.5% - 34%
27.5%
31.4%
31.4%
31.4%
Increases 2011
-
-
-
4,125
245,647
398,540
19,538
2,770,668
-
3,487,213
(Decreases) 2011
(83,998)
(125,567)
(1,256)
(15,582)
(49,981)
(231,076)
-
-
(557,843)
(1,065,303)
Deferred tax assets
Gains/(losses) on valuation of works in progress
Provision for contingencies
Public relation expenses
Directors’ compensations
Tax losses Italy – RdE USA Inc.
Losses on foreign exchange
Goodwill amortisation
SITAF Arbitration Award
Consolidation adjustments
Total deferred tax assets
Balance 2011
6,192
402,852
274
4,125
414,487
611,617
103,272
2,770,668
218,403
4,580,585
Balance 2010
90,190
528,419
1,530
15,582
218,821
444,153
83,734
-
776,246
2,158,675
3,243,347(146,957)Net deferred tax assets / (liabilities) 2,368,250(728,140)
31.4%
27.5%
27.5%
34%
31.4%
10,517
24,149
143,950
-
65,250
243,866
(54,079)
(15,119)
(379,254)
(469,894)
-
(918,346)
Deferred tax liabilities
Deferred capital gains
Penalty interest (accruals)
Gains on foreign exchange
Accelerated depreciation RdE USA Inc.
Consolidation adjustments
Total deferred tax liabilities
123,182
122,139
252,330
570,369
1,144,315
2,212,335
166,744
113,109
487,634
1,040,263
1,079,065
2,886,815

61
D. Prepayments and accrued income
Prepayments and income accruals amount to € 3,824,427
(€ 2,876,785 as of 31 December 2010). Revenue accruals
are just € 60,547 and chiefly relate to accruals of interest
on bond coupons.
Prepaid expenses are broken down as follows:
The increase in prepayments in respect of insurance pre-
mia and guarantees is primarily due to the new infrastruc-
ture project in Kuwait, which commenced in 2011, and to
the Bahrain road bridges project, which in 2011 achieved
full production.
The item ‘Other prepaid expenses’ includes € 632,404 in
respect of project costs kept in abeyance and progressively
charged to income statement proportionally to the project’s
progress and € 112,104 related to the registration fee and
concession lease for the Porto Vecchio redevelopment
project in Triest.
5. Other receivables: amount to € 3,190,482 and are
due from:
Other receivables for € 2,576,418 include € 1,293,780 in
sureties for arbitrations, € 214,036 in insurance advance
payments, € 156,094 in legal fees paid on behalf of ANAS to
be recovered, and € 912,508 in sundry receivables.
IV. Cash and cash equivalents: cash and cash equivalent
reserves are € 122,150,398 and are held as follows:
The Group’s net financial position as of 31 December 2011,
taking into account cash and cash equivalents, net of bank
loans and payables to other financial institutions (e.g. for
unpaid leasing instalments) is a positive € 80.6 million
(€ 61.5 million as of 31 December 2010).
61
31.12.2011
130,944
483,120
2,576,418
3,190,482
31.12.2010
57,884
501,929
2,150,078
2,709,891
Employees
Welfare and social security
Other
Total
31.12.2011
1,966,460
460,328
1,338,092
3,764,880
31.12.2010
1,406,929
219,725
1,148,805
2,775,459
Insurance premia and guarantees
Rents
Other prepaid expenses
Total
31.12.2011
121,654,999
495,399
122,150,398
31.12.2010
74,004,856
224,902
74,229,758
Bank deposits
Cash on hand
Total
Balance sheet analysis

6262
A. Consolidated shareholders’ equity
Liabilities
The share capital consists of 4,000,000 preferred shares
(with privileged claim over dividend distribution) with a
nominal value of € 1 each and 16,000,000 ordinary shares
with a nominal value of € 1 each.
Balance sheet items of overseas subsidiaries and associated
companies are converted in Euro at the spot exchange rate
as at year end. The corresponding income statement items
are converted at the average exchange rate for the year. The
reserve for foreign currency translation gains (losses) shows
any gain (or loss) arising from any difference between spot
exchange rate and the average exchange rate.
Shareholders’ equity includes reserves, which in the event of
distribution would form part of the Group’s taxable income.
31.12.2011
20,000,000
3,168,442
59,086,447
1,318,130
121,190
14,696,658
98,390,866
6,652,768
3,452,938
108,496,572
31.12.2010
20,000,000
2,755,131
46,453,314
129,221
67,105
13,522,831
82,927,602
3,580,236
2,872,938
89,380,776
I, Share capital, authorised, issued and outstanding
IV, Legal reserve
VII, Other reserves: extraordinary reserve
reserve for foreign currency translation gains (losses)
consolidation reserve
IX, Group profit (loss) for the financial period
Total Group shareholders’ equity
Minority share of equity
Minority share of profit (loss)
Total consolidated shareholders’ equity
These are:
_ reserve for 6 % increase according to Law 64/86,
amounting to € 10,466;
_ capital subscription reserves pursuant to Law 64/86
amounting to € 417,896;
_ reserve for subsidised interest according to Law 904/77
amounting to € 2,644,521;
_ revaluation reserve according to Law 72/83 amounting to
€ 11,092.
Changes in consolidated shareholders’ equity are shown in
appendix ‘F’.
Reconciliations of balances between shareholders’ equity
and net profit of the parent and the Group respectively, are
detailed in appendix ‘G’.
B. Provisions for contingencies and other liabilities
1. Provisions for pensions and similar obligations: amount
to € 432,713 (€ 380,454 as of 31 December 2010). It consists
of severance payments to the directors of subsidiary Deal Srl.
2. Provisions for taxation, including deferred tax liabilities: amount to € 2,212,335 and are presented in the
balance sheet after offset against deferred tax assets.
During the course of 2011, Rizzani de Eccher Spa and
subsidiary Codest International Srl became the object
of a tax audit by the Inland Revenue Office in respect of
the 2008 financial year. While Codest International Srl
had already received a formal warrant, Rizzani de Eccher
Spa is yet to receive any formal warrant or notification
as at the time of printing these Financial Statements in
respect of the afore-mentioned audit, as well as an earlier
audit carried out in 2008. In both cases, nevertheless, the
objections raised are not significant, although they are
currently being examined by the Group tax consultants.

63
It should be noted that during 2012 Codest International
lodged a claim and obtained judgment that threw out
a portion of the case under contention. The Group is
convinced of the strengths of its case and believes that no
provisions should be made against possible tax liabilities
in connection with this case.
3. Other provisions: amount to € 810,765 and consist of
provisions for contractual contingencies and default risk
associated with works in progress. Changes in provisions
for contractual and default risks are here under detailed.
The opening balance of the provisions include sums set
aside in previous years by Treviso Maggiore Srl and
VFR Ltd against future charges on contracts completed
or in progress. The charges having since been actually
incurred, the relevant share of provisions has been written
back to the income statement. The additional provision
of € 163,044 refers to maintenance charges set aside for
the Bahrain bridge project. Such additional provisions are
made proportionally to the progress of construction.
C. Employees’ severance indemnity
The employees’ severance indemnity is calculated for
each employee, pursuant to the labour and employment
contracts currently in force. The following table highlights
the movements in provisions and utilisations made during
the current year. The accrued severance payables are posted
net of any advances already paid to employees. Following
the enactment of Law No. 296 of 27 December 2006 and
subsequent legislative decrees issued in 2007 in the matter
of employee severance indemnity, the amounts accruing to
the employee severance indemnity for each employee are
- upon instruction of each employee – either deposited with
the specific treasury fund with INPS (Social Security Agency)
or placed in private sector investment funds. The amounts
to be transferred are those accrued from 1 January 2007 or
from the date of the employee’s instruction.
D. Debts and other payables
3. Amounts owed to shareholders for loans: loans from
shareholders amount to € 1,234,278 (€ 367,624 as on 31
December 2010) and consist of the third party’s portions of
shareholders loan extended to Interbridge Technologies BV,
Torre Scarl and Riflessi Srl (formerly Iride Srl), respectively.
4. Amounts owed to banks: total bank loans outstanding
at year-end amount to € 35,358,051 (€ 6,037,500 as of 31
December 2010). They consist of short term debt (due within
12 months) for € 17,696,043 and long term loans (maturity
beyond 12 months but within 5 years) for € 17,662,008.
At year-end, the weighted average cost of debt was 3%,
in line with the previous financial year. Total credit lines
from the banking system as at 31 December 2011 amount
in aggregate to € 552 million, of which € 57 million in
cash credit lines and € 495 million non-cash in the form of
guarantees and surety bonds. At year-end, the utilisation of
the non-cash lines was € 302 million in guarantees issued
and surety bonds.
63
Balance sheet analysis
2,862,094
163,044
(2,214,373)
810,765
Opening balance
Provisions
Write-backs
Closing balance at year end
Rizzanide Eccher Spa
Deal Srl
Sicea Spa
CodestInternational Srl
Consorzio Codest Engineering TrevisoMaggiore Srl
de Eccher Agricola Srl
Rizzani de Eccher USA Inc
Portocittà Spa
Torre Scarl
City Contractor Scarl
Tensacciai Srl
Tesit Srl
IRIDE Srl (Immobiliare Rizzani de Eccher Srl)
Total
Change
(162,267)
(115,076)
(27,152)
(137,274)
8,338
(3,771)
6,806
62,923
239
62,599
217,725
344,912
130,521
1,202
389,725
31.12.2011
2,662,815
891,160
67,612
292,153
66,680
30,544
59,301
143,767
239
79,871
217,725
344,912
130,521
1,202
4,988,502
31.12.2010
2,825,082
1,006,236
94,764
429,427
58,342
34,315
52,495
80,844
-
17,272
-
-
-
-
4,598,777
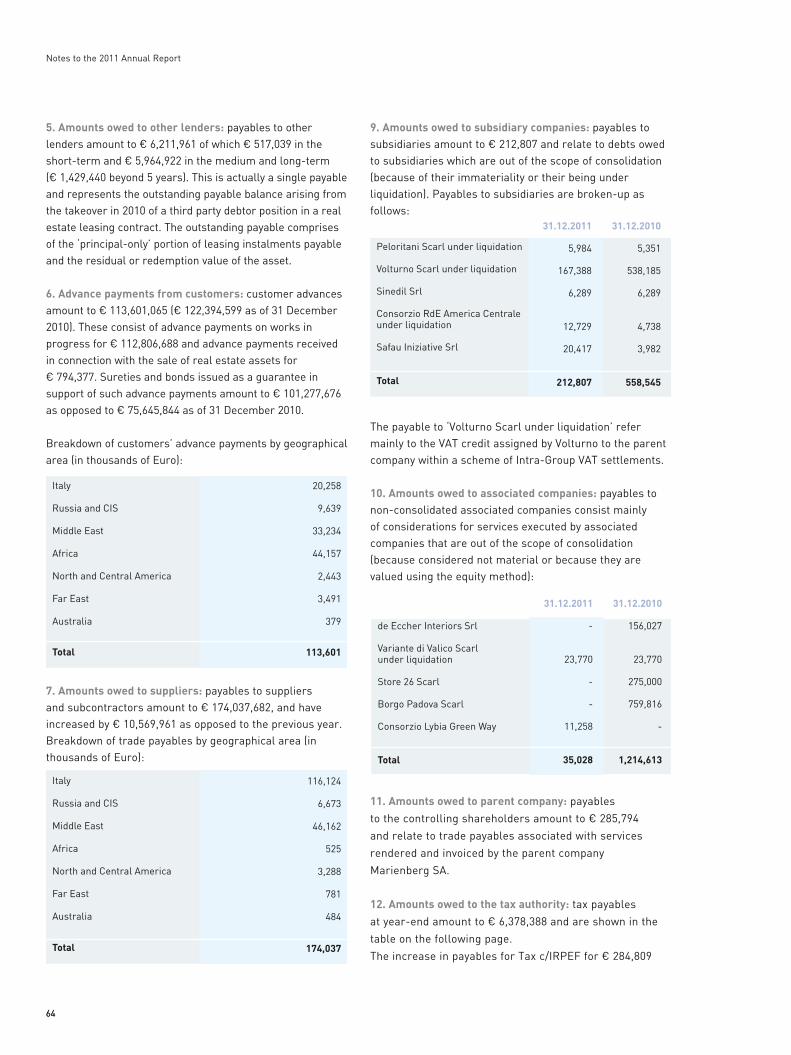
64
9. Amounts owed to subsidiary companies: payables to
subsidiaries amount to € 212,807 and relate to debts owed
to subsidiaries which are out of the scope of consolidation
(because of their immateriality or their being under
liquidation). Payables to subsidiaries are broken-up as
follows:
The payable to ‘Volturno Scarl under liquidation’ refer
mainly to the VAT credit assigned by Volturno to the parent
company within a scheme of Intra-Group VAT settlements.
10. Amounts owed to associated companies: payables to
non-consolidated associated companies consist mainly
of considerations for services executed by associated
companies that are out of the scope of consolidation
(because considered not material or because they are
valued using the equity method):
11. Amounts owed to parent company: payables
to the controlling shareholders amount to € 285,794
and relate to trade payables associated with services
rendered and invoiced by the parent company
Marienberg SA.
12. Amounts owed to the tax authority: tax payables
at year-end amount to € 6,378,388 and are shown in the
table on the following page.
The increase in payables for Tax c/IRPEF for € 284,809
64
Peloritani Scarl under liquidation
Volturno Scarl under liquidation
Sinedil Srl
Consorzio RdE America Centraleunder liquidation
Safau Iniziative Srl
Total
31.12.2011
5,984
167,388
6,289
12,729
20,417
212,807
31.12.2010
5,351
538,185
6,289
4,738
3,982
558,545
Notes to the 2011 Annual Report
de Eccher Interiors Srl
Variante di Valico Scarlunder liquidation
Store 26 Scarl
Borgo Padova Scarl
Consorzio Lybia Green Way
Total
31.12.2011
-
23,770
-
-
11,258
35,028
31.12.2010
156,027
23,770
275,000
759,816
-
1,214,613
5. Amounts owed to other lenders: payables to other
lenders amount to € 6,211,961 of which € 517,039 in the
short-term and € 5,964,922 in the medium and long-term
(€ 1,429,440 beyond 5 years). This is actually a single payable
and represents the outstanding payable balance arising from
the takeover in 2010 of a third party debtor position in a real
estate leasing contract. The outstanding payable comprises
of the ‘principal-only’ portion of leasing instalments payable
and the residual or redemption value of the asset.
6. Advance payments from customers: customer advances
amount to € 113,601,065 (€ 122,394,599 as of 31 December
2010). These consist of advance payments on works in
progress for € 112,806,688 and advance payments received
in connection with the sale of real estate assets for
€ 794,377. Sureties and bonds issued as a guarantee in
support of such advance payments amount to € 101,277,676
as opposed to € 75,645,844 as of 31 December 2010.
Breakdown of customers’ advance payments by geographical
area (in thousands of Euro):
7. Amounts owed to suppliers: payables to suppliers
and subcontractors amount to € 174,037,682, and have
increased by € 10,569,961 as opposed to the previous year.
Breakdown of trade payables by geographical area (in
thousands of Euro):
20,258
9,639
33,234
44,157
2,443
3,491
379
113,601
Italy
Russia and CIS
Middle East
Africa
North and Central America
Far East
Australia
Total
116,124
6,673
46,162
525
3,288
781
484
174,037
Italy
Russia and CIS
Middle East
Africa
North and Central America
Far East
Australia
Total
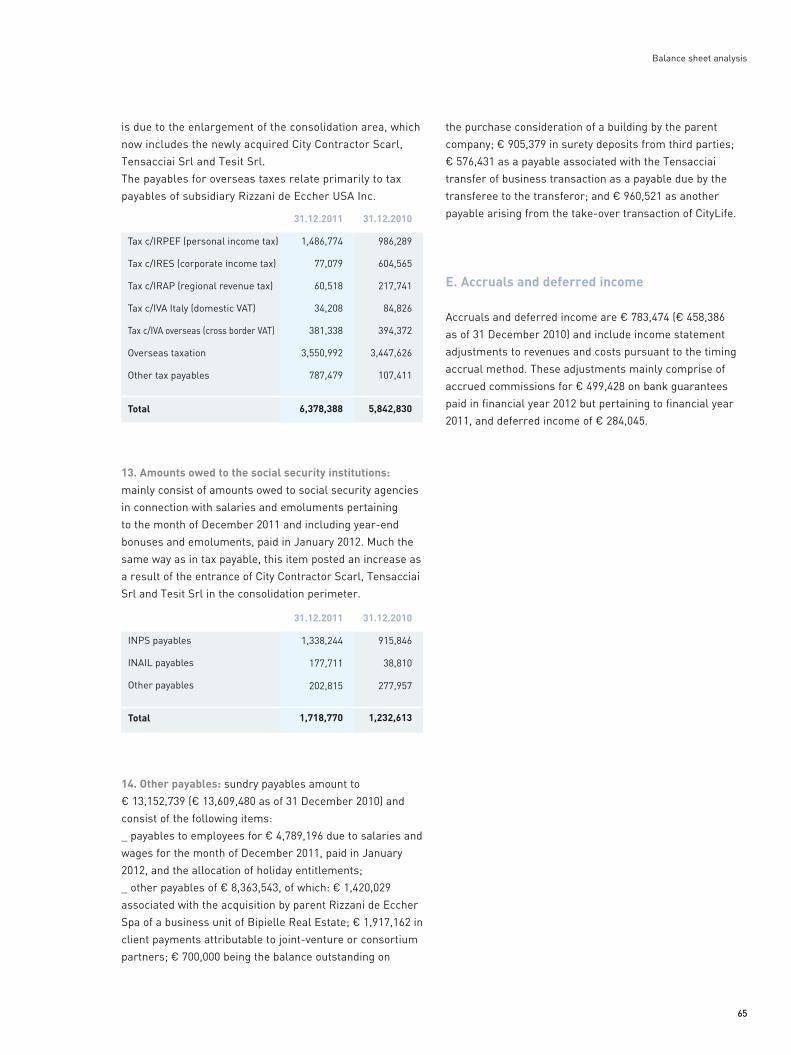
65
is due to the enlargement of the consolidation area, which
now includes the newly acquired City Contractor Scarl,
Tensacciai Srl and Tesit Srl.
The payables for overseas taxes relate primarily to tax
payables of subsidiary Rizzani de Eccher USA Inc.
13. Amounts owed to the social security institutions: mainly consist of amounts owed to social security agencies
in connection with salaries and emoluments pertaining
to the month of December 2011 and including year-end
bonuses and emoluments, paid in January 2012. Much the
same way as in tax payable, this item posted an increase as
a result of the entrance of City Contractor Scarl, Tensacciai
Srl and Tesit Srl in the consolidation perimeter.
14. Other payables: sundry payables amount to
€ 13,152,739 (€ 13,609,480 as of 31 December 2010) and
consist of the following items:
_ payables to employees for € 4,789,196 due to salaries and
wages for the month of December 2011, paid in January
2012, and the allocation of holiday entitlements;
_ other payables of € 8,363,543, of which: € 1,420,029
associated with the acquisition by parent Rizzani de Eccher
Spa of a business unit of Bipielle Real Estate; € 1,917,162 in
client payments attributable to joint-venture or consortium
partners; € 700,000 being the balance outstanding on
65
the purchase consideration of a building by the parent
company; € 905,379 in surety deposits from third parties;
€ 576,431 as a payable associated with the Tensacciai
transfer of business transaction as a payable due by the
transferee to the transferor; and € 960,521 as another
payable arising from the take-over transaction of CityLife.
E. Accruals and deferred income
Accruals and deferred income are € 783,474 (€ 458,386
as of 31 December 2010) and include income statement
adjustments to revenues and costs pursuant to the timing
accrual method. These adjustments mainly comprise of
accrued commissions for € 499,428 on bank guarantees
paid in financial year 2012 but pertaining to financial year
2011, and deferred income of € 284,045.
Balance sheet analysis
Tax c/IRPEF (personal income tax)
Tax c/IRES (corporate income tax)
Tax c/IRAP (regional revenue tax)
Tax c/IVA Italy (domestic VAT)
Tax c/IVA overseas (cross border VAT)
Overseas taxation
Other tax payables
Total
31.12.2011
1,486,774
77,079
60,518
34,208
381,338
3,550,992
787,479
6,378,388
31.12.2010
986,289
604,565
217,741
84,826
394,372
3,447,626
107,411
5,842,830
31.12.2011
1,338,244
177,711
202,815
1,718,770
31.12.2010
915,846
38,810
277,957
1,232,613
INPS payables
INAIL payables
Other payables
Total

6666
133,989,193
23,984,671
8,339,020
3,384,834
169,697,718
61,982,991
2,503,820
3,247,405
3,781,175
71,515,391
241,213,109
257,515,629
31.12.2011
125,401,510
24,442,546
4,949,653
6,361,964
161,155,673
101,305,618
-
426,801
1,197,442
102,929,861
264,085,534
264,085,534
31.12.2010
B1. banks:
performance guarantees bid bonds against release of retention notes other guarantees
Total
B2. insurance companies:
performance guarantees
bid bonds
against release of retention notes
other guarantees
Total
Total guarantees
Total memorandum accounts
The total balance of the memorandum accounts at year-
end amounts to € 257,515,629 posting a decrease of
€ 6,569,905 with respect to 31 December 2010. These
consist of the following off-balance sheet items:
A. Guarantees provided in favour of third parties:
B. Guarantees issued by third parties on behalf of Group of companies:
Memorandum accounts
31.12.2011
5,063,000
11,239,520
-
16,302,520
31.12.2010
-
-
-
-
A1. in favour of subsidiary companies
A2. in favour of associated companies
A3. in favour of other companies
Total

6767
Foreign exchange derivativesAs already stated in the section about general accounting
principles, the objective of the company is to hedge against
exchange fluctuations in respect of both receipts and
payments in foreign currency.
The following table provide details of the company’s
exposure to foreign exchange derivatives (forward currency
sale/purchase contracts and options).
It must be noted that while the two contracts above are
intended for hedging purpose, the MYR currency option
Balance sheet analysis
Amount
2,000,000
4,258,600 (*)
Currency
USD
MYR
Marketvalue
(80,710)
(32,565)
Contractdate
14.11.11
08.09.11
Euro
1,461,241
(**)
Exchangerate
1.3687
(**)
Expirydate
15.06.12
15.06.12
(*) notional amount outstanding as at 31.12.2011
(**) company pays or receives EUR funds according to the exchange rate at maturity/expiry
Forward sale
Currency option
Contract type
Nominalamount
3,000,000
3,000,000
Contractdate
29.05.09
04.06.09
Interestrate
2.12%
Euribor 3m max 2.6%
Expirydate
04.06.12
08.06.12
Interest Rate Swap
Interest Rate Swap with cap
Contract typeMarket
value
(12,403)
1,02
contract does not qualify as such from an accounting and
regulatory point of view. Therefore, the marked-to-market
value (negative) of € 32,565 is posted in the balance sheet.
Interest rate derivativesThe table below provides details of the company’s exposure
to interest rate swaps intended to hedge the company’s
underlying bank debt against a rise in interest rates. It
must be noted that such IRS contracts qualify as hedging
instruments. Therefore, no marked-to-market value is
posted in the balance sheet.
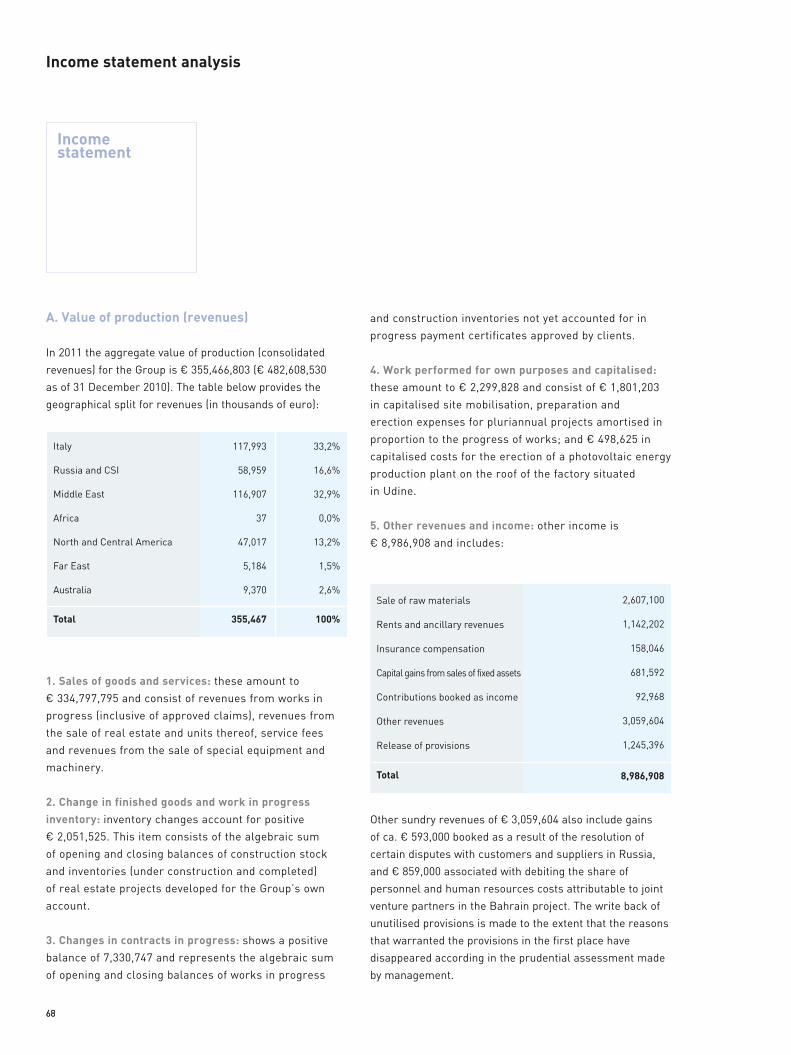
68
A. Value of production (revenues)
In 2011 the aggregate value of production (consolidated
revenues) for the Group is € 355,466,803 (€ 482,608,530
as of 31 December 2010). The table below provides the
geographical split for revenues (in thousands of euro):
1. Sales of goods and services: these amount to
€ 334,797,795 and consist of revenues from works in
progress (inclusive of approved claims), revenues from
the sale of real estate and units thereof, service fees
and revenues from the sale of special equipment and
machinery.
2. Change in finished goods and work in progress inventory: inventory changes account for positive
€ 2,051,525. This item consists of the algebraic sum
of opening and closing balances of construction stock
and inventories (under construction and completed)
of real estate projects developed for the Group’s own
account.
3. Changes in contracts in progress: shows a positive
balance of 7,330,747 and represents the algebraic sum
of opening and closing balances of works in progress
and construction inventories not yet accounted for in
progress payment certificates approved by clients.
4. Work performed for own purposes and capitalised: these amount to € 2,299,828 and consist of € 1,801,203
in capitalised site mobilisation, preparation and
erection expenses for pluriannual projects amortised in
proportion to the progress of works; and € 498,625 in
capitalised costs for the erection of a photovoltaic energy
production plant on the roof of the factory situated
in Udine.
5. Other revenues and income: other income is
€ 8,986,908 and includes:
Other sundry revenues of € 3,059,604 also include gains
of ca. € 593,000 booked as a result of the resolution of
certain disputes with customers and suppliers in Russia,
and € 859,000 associated with debiting the share of
personnel and human resources costs attributable to joint
venture partners in the Bahrain project. The write back of
unutilised provisions is made to the extent that the reasons
that warranted the provisions in the first place have
disappeared according in the prudential assessment made
by management.
68
117,993
58,959
116,907
37
47,017
5,184
9,370
355,467
33,2%
16,6%
32,9%
0,0%
13,2%
1,5%
2,6%
100%
Italy
Russia and CSI
Middle East
Africa
North and Central America
Far East
Australia
Total
2,607,100
1,142,202
158,046
681,592
92,968
3,059,604
1,245,396
8,986,908
Sale of raw materials
Rents and ancillary revenues
Insurance compensation
Capital gains from sales of fixed assets
Contributions booked as income
Other revenues
Release of provisions
Total
Income statement
Income statement analysis

69
10. Valuation adjustments: the total for this item was
€ 11,094,160 at year end (€ 10,570,450 in 2010) of which
€ 2,110,658 pertaining to amortisation of intangible assets
and € 8,911,397 pertaining to depreciation of fixed assets.
Furthermore, provisions and write-downs for bad and doubtful
receivables were made for € 72,106 (€ 370,000 in 2010).
Further details on depreciation and amortisation can be
found in appendices ‘D’ e ‘E’.
14. Other operating costs: amount to € 8,713,610 (€ 6,510,585
in 2010) and include mainly bank commissions and fees for
bank and insurance guarantees as well minor expenses as
registry fees and stamp duties, various taxes, penalties and
charges from customers, donations. These charges also
include a charge of € 2,225,982 corresponding to a delay
penalty imposed by a public client in a construction contract,
which the company strongly opposes. However the charge is
made in keeping with the principle of prudent risk assessment.
C. Financial income and expenses
Net financial income for the year is € 2,762,842, which
marks an improvement as opposed the previous year, when
the net position was negative (espenses) for € 764,190. This
improvement is primarily due to currency translation gains
from favourable exchange rates.They are detailed below
analytically.
15. Income from equity investments: is € 1,691 in 2011
(€ 1,690 in 2010) and refers primarily to income from
securities in portfolio.
16. Other financial income: amounts to € 1,957,902 (it was
€ 974,816 in 2010) and consists of:
17. Interest expenses and similar charges: interest
expenses and charges in 2011 are € 1,213,340 (it was
€ 706,602 in 2010) and consist of:
B. Costs of production
Costs of production amount in aggregate to € 336,890,318
(€ 457,755,048 in 2010). A detailed breakdown of these
items is included in the income statement.
6. Costs for raw materials, consumables and goods for sale: amount to € 68,727,215 (€ 57,017,896 in 2010)
and consist primarily of purchases of raw materials,
semi-finished products, finished products and sundry
consumables.
7. Costs for services: amount € 180,226,897 (€ 327,833,261
in 2010) and consist of expenses incurred in connection
with services rendered by third parties for sub-contracts,
design and technical consulting services, consulting
services and transportation. The significant decrease is
related to the decrease in the revenues.
8. Costs for use of assets owned by others: amount to €
6,193,732 (€ 4,885,359 in 2010) and refers to rentals and
leasing expenses.
9. Costs for employees: amount to € 60,307,766 (€ 53,227,658
of 2010). The increase in employee costs as opposed to the
preceding year is commensurate with an increase in the
average number of employees in 2011, as detailed by the
following table which provides the total number of Group
employees as at year-end and the average for 2010 and 2011.
Notes to the 2011 Annual Report
69
29
148
176
353
19
260
454
733
1,086
29
145
176
350
22
281
498
801
1,151
50
187
202
439
21
326
399
746
1,185
52
188
205
445
23
306
420
748
1,193
31.12.2011 31.12.2010Average
2010Average
2011
Employees - Italy:
Management Staff Workers
Total Italy
Employees - Overseas:
Management
Staff
Workers
Total overseas
Total
1,729,716
153,208
74,978
1,957,902
Interest income from banks and securities
Penalty interest on overdue receivables
Interest on other receivables
Total
956,706
256,634
1,213,340
Bank loans interest expenses
Interest on other debt
Total
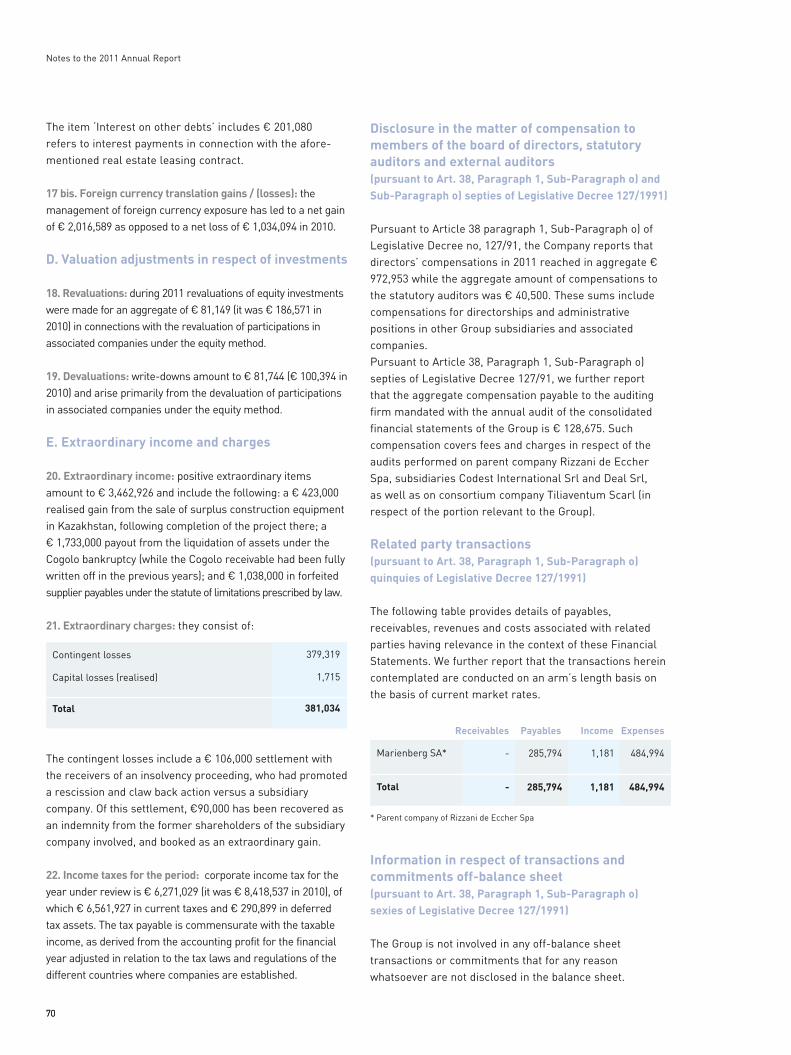
7070
The item ‘Interest on other debts’ includes € 201,080
refers to interest payments in connection with the afore-
mentioned real estate leasing contract.
17 bis. Foreign currency translation gains / (losses): the
management of foreign currency exposure has led to a net gain
of € 2,016,589 as opposed to a net loss of € 1,034,094 in 2010.
D. Valuation adjustments in respect of investments
18. Revaluations: during 2011 revaluations of equity investments
were made for an aggregate of € 81,149 (it was € 186,571 in
2010) in connections with the revaluation of participations in
associated companies under the equity method.
19. Devaluations: write-downs amount to € 81,744 (€ 100,394 in
2010) and arise primarily from the devaluation of participations
in associated companies under the equity method.
E. Extraordinary income and charges
20. Extraordinary income: positive extraordinary items
amount to € 3,462,926 and include the following: a € 423,000
realised gain from the sale of surplus construction equipment
in Kazakhstan, following completion of the project there; a
€ 1,733,000 payout from the liquidation of assets under the
Cogolo bankruptcy (while the Cogolo receivable had been fully
written off in the previous years); and € 1,038,000 in forfeited
supplier payables under the statute of limitations prescribed by law.
21. Extraordinary charges: they consist of:
The contingent losses include a € 106,000 settlement with
the receivers of an insolvency proceeding, who had promoted
a rescission and claw back action versus a subsidiary
company. Of this settlement, €90,000 has been recovered as
an indemnity from the former shareholders of the subsidiary
company involved, and booked as an extraordinary gain.
22. Income taxes for the period: corporate income tax for the
year under review is € 6,271,029 (it was € 8,418,537 in 2010), of
which € 6,561,927 in current taxes and € 290,899 in deferred
tax assets. The tax payable is commensurate with the taxable
income, as derived from the accounting profit for the financial
year adjusted in relation to the tax laws and regulations of the
different countries where companies are established.
Disclosure in the matter of compensation to members of the board of directors, statutory auditors and external auditors (pursuant to Art. 38, Paragraph 1, Sub-Paragraph o) and Sub-Paragraph o) septies of Legislative Decree 127/1991)
Pursuant to Article 38 paragraph 1, Sub-Paragraph o) of
Legislative Decree no, 127/91, the Company reports that
directors’ compensations in 2011 reached in aggregate €
972,953 while the aggregate amount of compensations to
the statutory auditors was € 40,500. These sums include
compensations for directorships and administrative
positions in other Group subsidiaries and associated
companies.
Pursuant to Article 38, Paragraph 1, Sub-Paragraph o)
septies of Legislative Decree 127/91, we further report
that the aggregate compensation payable to the auditing
firm mandated with the annual audit of the consolidated
financial statements of the Group is € 128,675. Such
compensation covers fees and charges in respect of the
audits performed on parent company Rizzani de Eccher
Spa, subsidiaries Codest International Srl and Deal Srl,
as well as on consortium company Tiliaventum Scarl (in
respect of the portion relevant to the Group).
Related party transactions (pursuant to Art. 38, Paragraph 1, Sub-Paragraph o) quinquies of Legislative Decree 127/1991)
The following table provides details of payables,
receivables, revenues and costs associated with related
parties having relevance in the context of these Financial
Statements. We further report that the transactions herein
contemplated are conducted on an arm’s length basis on
the basis of current market rates.
Information in respect of transactions and commitments off-balance sheet (pursuant to Art. 38, Paragraph 1, Sub-Paragraph o) sexies of Legislative Decree 127/1991)
The Group is not involved in any off-balance sheet
transactions or commitments that for any reason
whatsoever are not disclosed in the balance sheet.
379,319
1,715
381,034
Contingent losses
Capital losses (realised)
Total
484,994
484,994
1,181
1,181
285,794
285,794
-
-
ExpensesIncomePayablesReceivables
Marienberg SA*
Total
* Parent company of Rizzani de Eccher Spa
Notes to the 2011 Annual Report

INDEPENDENT AUDITORS’ REPORT

72
Independent auditors’ report

CONSOLIDATED FINANCIAL STATEMENTS
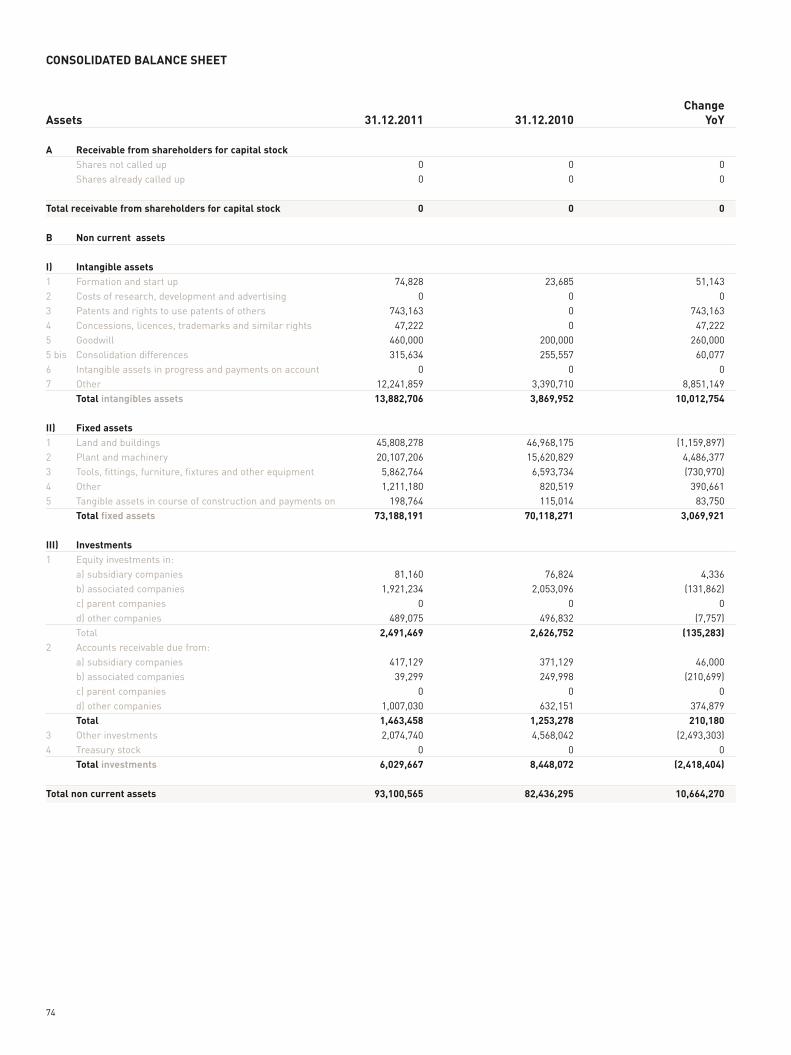
74
Assets
A Receivable from shareholders for capital stock Shares not called up
Shares already called up
Total receivable from shareholders for capital stock
B Non current assets
I) Intangible assets1 Formation and start up
2 Costs of research, development and advertising
3 Patents and rights to use patents of others
4 Concessions, licences, trademarks and similar rights
5 Goodwill
5 bis Consolidation differences
6 Intangible assets in progress and payments on account
7 Other
Total intangibles assets
II) Fixed assets1 Land and buildings
2 Plant and machinery
3 Tools, fittings, furniture, fixtures and other equipment
4 Other
5 Tangible assets in course of construction and payments on
Total fixed assets
III) Investments1 Equity investments in:
a) subsidiary companies
b) associated companies
c) parent companies
d) other companies
Total
2 Accounts receivable due from:
a) subsidiary companies
b) associated companies
c) parent companies
d) other companies
Total3 Other investments
4 Treasury stock
Total investments
Total non current assets
Change 31.12.2011 31.12.2010 YoY
0 0 0
0 0 0
0 0 0
74,828 23,685 51,143
0 0 0
743,163 0 743,163
47,222 0 47,222
460,000 200,000 260,000
315,634 255,557 60,077
0 0 0
12,241,859 3,390,710 8,851,149
13,882,706 3,869,952 10,012,754
45,808,278 46,968,175 (1,159,897)
20,107,206 15,620,829 4,486,377
5,862,764 6,593,734 (730,970)
1,211,180 820,519 390,661
198,764 115,014 83,750
73,188,191 70,118,271 3,069,921
81,160 76,824 4,336
1,921,234 2,053,096 (131,862)
0 0 0
489,075 496,832 (7,757)
2,491,469 2,626,752 (135,283)
417,129 371,129 46,000
39,299 249,998 (210,699)
0 0 0
1,007,030 632,151 374,879
1,463,458 1,253,278 210,180 2,074,740 4,568,042 (2,493,303)
0 0 0
6,029,667 8,448,072 (2,418,404)
93,100,565 82,436,295 10,664,270
CONSOLIDATED BALANCE SHEET
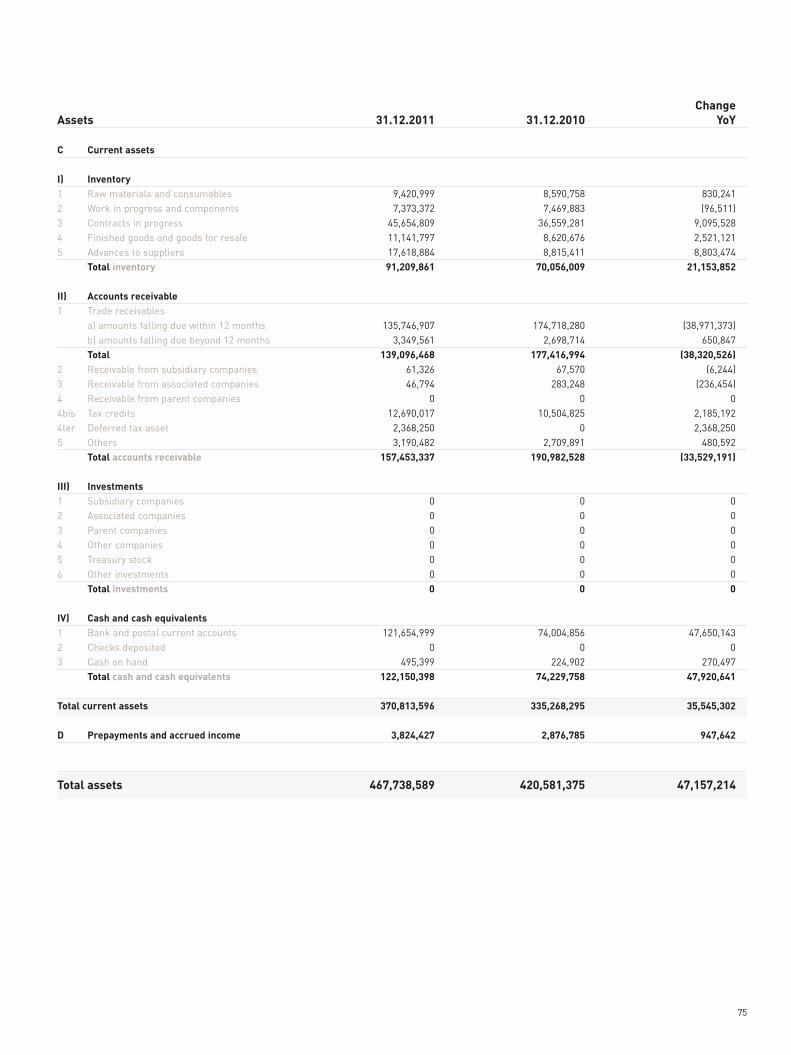
75
Assets
C Current assets
I) Inventory1 Raw materials and consumables
2 Work in progress and components
3 Contracts in progress
4 Finished goods and goods for resale
5 Advances to suppliers
Total inventory
II) Accounts receivable1 Trade receivables
a) amounts falling due within 12 months
b) amounts falling due beyond 12 months
Total2 Receivable from subsidiary companies
3 Receivable from associated companies
4 Receivable from parent companies
4bis Tax credits
4ter Deferred tax asset
5 Others
Total accounts receivable
III) Investments1 Subsidiary companies
2 Associated companies
3 Parent companies
4 Other companies
5 Treasury stock
6 Other investments
Total investments
IV) Cash and cash equivalents1 Bank and postal current accounts
2 Checks deposited
3 Cash on hand
Total cash and cash equivalents
Total current assets
D Prepayments and accrued income
Total assets
Change 31.12.2011 31.12.2010 YoY
9,420,999 8,590,758 830,241
7,373,372 7,469,883 (96,511)
45,654,809 36,559,281 9,095,528
11,141,797 8,620,676 2,521,121
17,618,884 8,815,411 8,803,474
91,209,861 70,056,009 21,153,852
135,746,907 174,718,280 (38,971,373)
3,349,561 2,698,714 650,847
139,096,468 177,416,994 (38,320,526) 61,326 67,570 (6,244)
46,794 283,248 (236,454)
0 0 0
12,690,017 10,504,825 2,185,192
2,368,250 0 2,368,250
3,190,482 2,709,891 480,592
157,453,337 190,982,528 (33,529,191)
0 0 0
0 0 0
0 0 0
0 0 0
0 0 0
0 0 0
0 0 0
121,654,999 74,004,856 47,650,143
0 0 0
495,399 224,902 270,497
122,150,398 74,229,758 47,920,641 370,813,596 335,268,295 35,545,302 3,824,427 2,876,785 947,642
467,738,589 420,581,375 47,157,214

76
Liabilities
A Consolidated shareholders' equity I Share capital, authorized, issued and outstanding
II Additional paid-in capital
III Revaluation reserve
IV Legal reserve
V Statutory reserves
VI Reserve for treasury stock owned
VII Other reserves:
- extraordinary reserve
- reserve for foreign currency translation gains (losses)
- consolidation reserve
VIII Retained earnings
IX Group profit (loss) for the financial period
Total Group shareholders' equity Minority share of equity
Minority share of profit (loss)
Total minorities’ equity
Total consolidated shareholders' equity
B Provision for contingencies and other liabilities1 Provisions for pensions and similar obligations
2 Provision for taxation, included deferred tax
3 Other provisions
Total provisions for contingencies and other liabilities
C Employees' severance indemnity
D Debts and other payables1 Debenture loans
2 Convertible debenture loans
3 Amounts owed to shareholders for loans
4 Amounts owed to banks
a) falling due within 12 months
b) falling due beyond 12 months
Total5 Amounts owed to other lenders
amounts falling due within 12 months
amounts falling due beyond 12 months
Total6 Advances from customers
7 Amounts owed to suppliers
8 Debts represented by bills of exchange
9 Amounts owed to subsidiary companies
10 Amounts owed to associated companies
11 Amounts owed to parent companies
12 Amounts owed to the tax authority
13 Amounts owed to the social security institutions
14 Other payables
Total debts and other payables
E Accruals and deferred income
Total liabilities and consolidated shareholders' equity
Change 31.12.2011 31.12.2010 YoY
20,000,000 20,000,000 0
0 0 0
0 0 0
3,168,442 2,755,131 413,311
0 0 0
0 0 0
59,086,447 46,453,314 12,633,133
1,318,130 129,221 1,188,908
121,190 67,105 54,085
0 0 0
14,696,658 13,522,831 1,173,827
98,390,866 82,927,602 15,463,264 6,652,768 3,580,236 3,072,532
3,452,938 2,872,938 580,000
10,105,706 6,453,174 3,652,532
108,496,572 89,380,776 19,115,796
432,713 380,454 52,259
0 736,100 (736,100)
810,765 2,862,094 (2,051,329)
1,243,478 3,978,648 (2,735,170) 4,988,502 4,598,777 389,725
0 0 0
0 0 0
1,234,278 367,624 866,654
17,696,043 1,031,223 16,664,820
17,662,008 5,006,277 12,655,731
35,358,051 6,037,500 29,320,551
517,039 492,757 24,282
5,694,922 6,221,764 (526,842)
6,211,961 6,714,521 (502,560) 113,601,065 122,394,599 (8,793,533)
174,037,682 163,467,721 10,569,961
0 0 0
212,807 558,545 (345,738)
35,028 1,214,613 (1,179,585)
285,794 724,742 (438,948)
6,378,388 5,842,830 535,558
1,718,770 1,232,613 486,157
13,152,739 13,609,480 (456,741)
352,226,563 322,164,788 30,061,775 783,474 458,386 325,088
467,738,589 420,581,375 47,157,214
CONSOLIDATED BALANCE SHEET
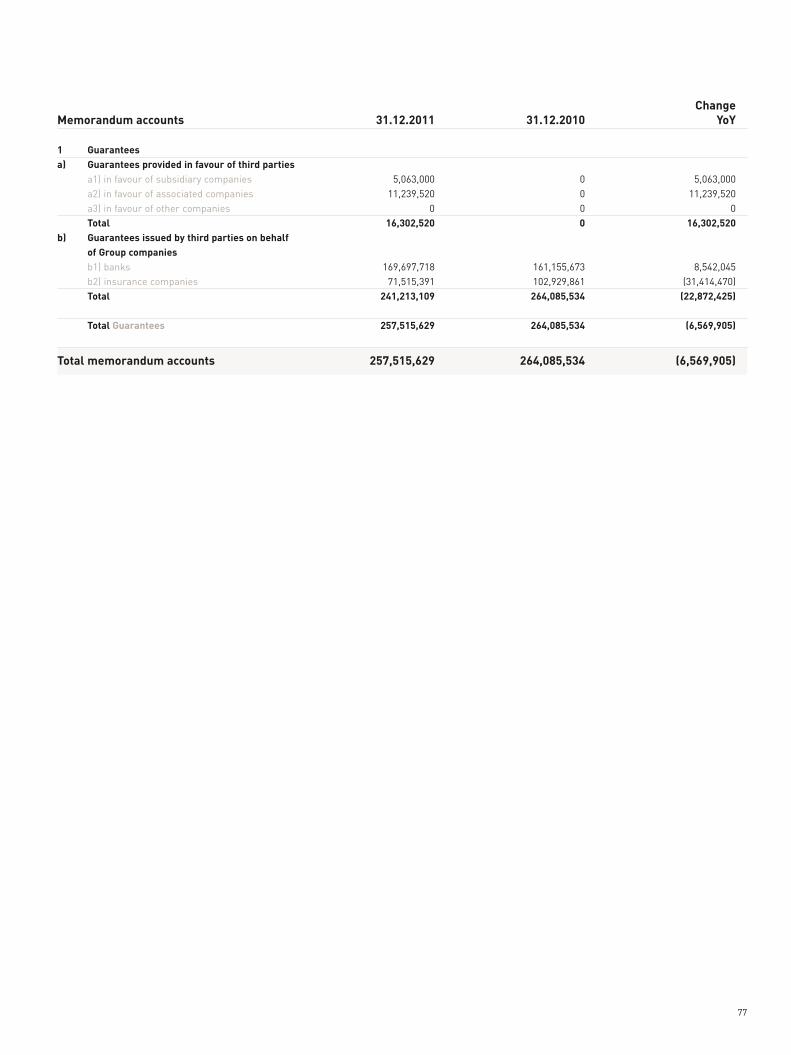
77
Memorandum accounts
1 Guarantees a) Guarantees provided in favour of third parties a1) in favour of subsidiary companies
a2) in favour of associated companies
a3) in favour of other companies
Totalb) Guarantees issued by third parties on behalf of Group companies b1) banks
b2) insurance companies
Total
Total Guarantees
Total memorandum accounts
Change 31.12.2011 31.12.2010 YoY
5,063,000 0 5,063,000
11,239,520 0 11,239,520
0 0 0
16,302,520 0 16,302,520
169,697,718 161,155,673 8,542,045
71,515,391 102,929,861 (31,414,470)
241,213,109 264,085,534 (22,872,425) 257,515,629 264,085,534 (6,569,905)
257,515,629 264,085,534 (6,569,905)
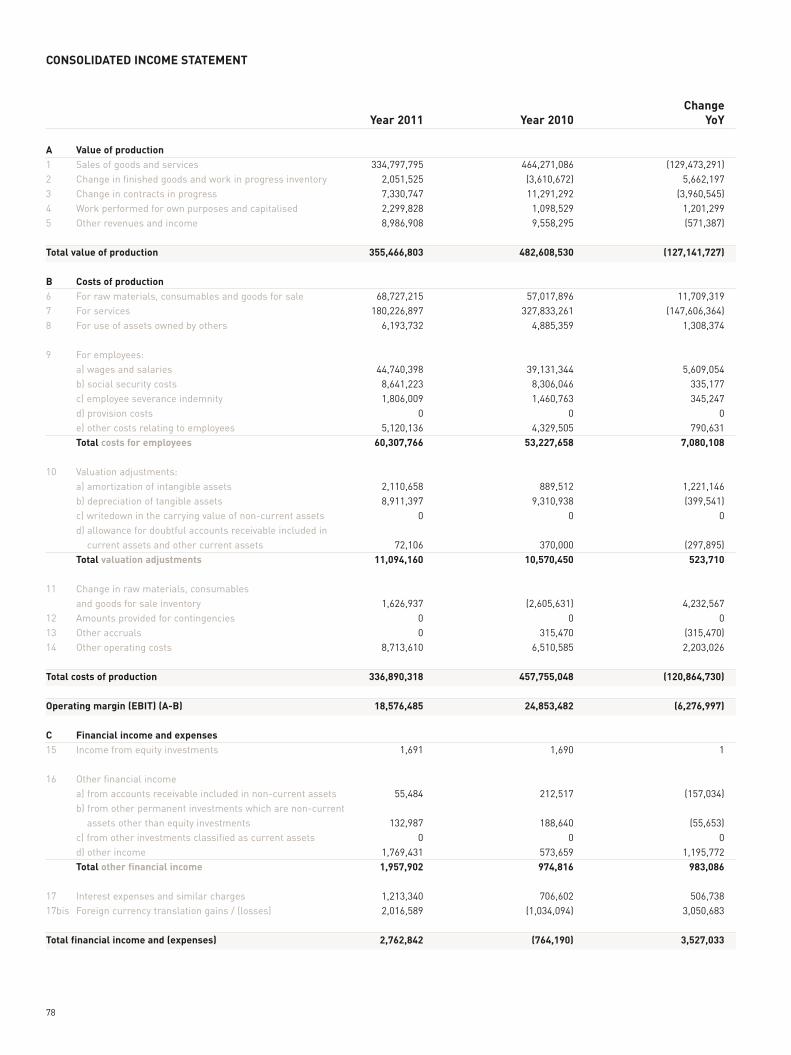
78
A Value of production1 Sales of goods and services
2 Change in finished goods and work in progress inventory
3 Change in contracts in progress
4 Work performed for own purposes and capitalised
5 Other revenues and income
Total value of production
B Costs of production6 For raw materials, consumables and goods for sale
7 For services
8 For use of assets owned by others
9 For employees:
a) wages and salaries
b) social security costs
c) employee severance indemnity
d) provision costs
e) other costs relating to employees
Total costs for employees
10 Valuation adjustments:
a) amortization of intangible assets
b) depreciation of tangible assets
c) writedown in the carrying value of non-current assets
d) allowance for doubtful accounts receivable included in
current assets and other current assets
Total valuation adjustments
11 Change in raw materials, consumables
and goods for sale inventory
12 Amounts provided for contingencies
13 Other accruals
14 Other operating costs
Total costs of production
Operating margin (EBIT) (A-B)
C Financial income and expenses15 Income from equity investments
16 Other financial income
a) from accounts receivable included in non-current assets
b) from other permanent investments which are non-current
assets other than equity investments
c) from other investments classified as current assets
d) other income
Total other financial income
17 Interest expenses and similar charges
17bis Foreign currency translation gains / (losses)
Total financial income and (expenses)
Change Year 2011 Year 2010 YoY
334,797,795 464,271,086 (129,473,291)
2,051,525 (3,610,672) 5,662,197
7,330,747 11,291,292 (3,960,545)
2,299,828 1,098,529 1,201,299
8,986,908 9,558,295 (571,387)
355,466,803 482,608,530 (127,141,727)
68,727,215 57,017,896 11,709,319
180,226,897 327,833,261 (147,606,364)
6,193,732 4,885,359 1,308,374
44,740,398 39,131,344 5,609,054
8,641,223 8,306,046 335,177
1,806,009 1,460,763 345,247
0 0 0
5,120,136 4,329,505 790,631
60,307,766 53,227,658 7,080,108
2,110,658 889,512 1,221,146
8,911,397 9,310,938 (399,541)
0 0 0
72,106 370,000 (297,895)
11,094,160 10,570,450 523,710
1,626,937 (2,605,631) 4,232,567
0 0 0
0 315,470 (315,470)
8,713,610 6,510,585 2,203,026
336,890,318 457,755,048 (120,864,730) 18,576,485 24,853,482 (6,276,997)
1,691 1,690 1
55,484 212,517 (157,034)
132,987 188,640 (55,653)
0 0 0
1,769,431 573,659 1,195,772
1,957,902 974,816 983,086
1,213,340 706,602 506,738
2,016,589 (1,034,094) 3,050,683
2,762,842 (764,190) 3,527,033
CONSOLIDATED INCOME STATEMENT
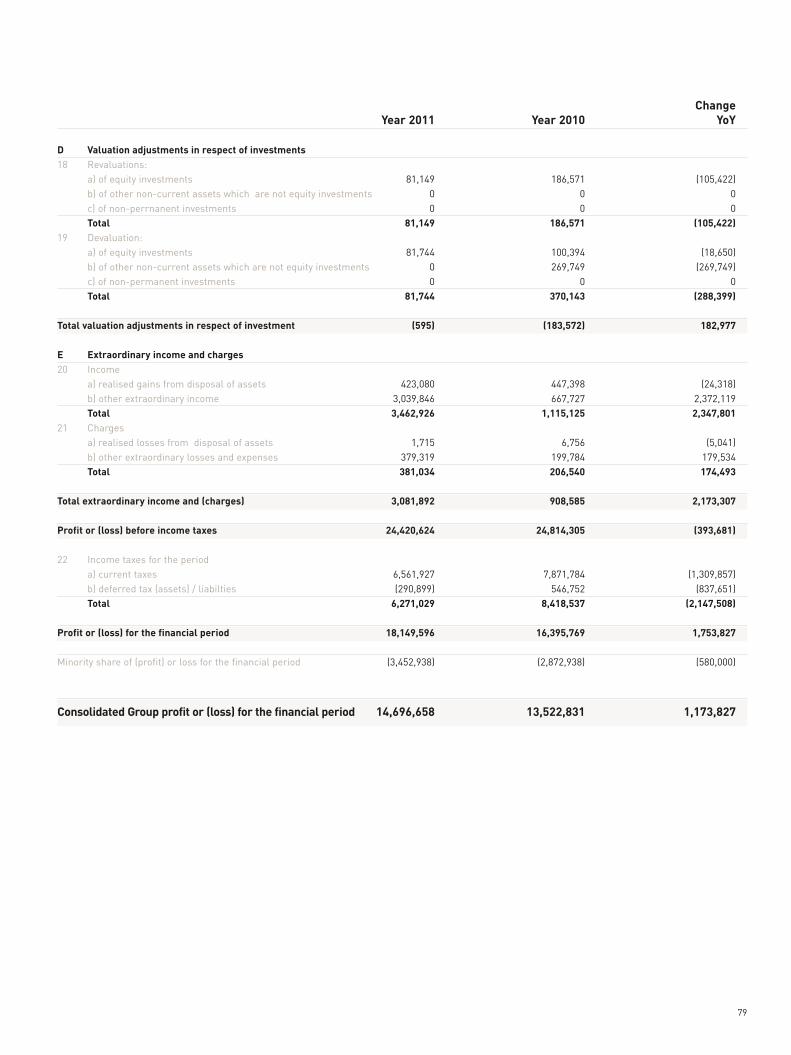
79
D Valuation adjustments in respect of investments18 Revaluations:
a) of equity investments
b) of other non-current assets which are not equity investments
c) of non-perrnanent investments
Total 19 Devaluation:
a) of equity investments
b) of other non-current assets which are not equity investments
c) of non-permanent investments
Total
Total valuation adjustments in respect of investment
E Extraordinary income and charges20 Income
a) realised gains from disposal of assets
b) other extraordinary income
Total 21 Charges
a) realised losses from disposal of assets
b) other extraordinary losses and expenses
Total
Total extraordinary income and (charges)
Profit or (loss) before income taxes
22 Income taxes for the period
a) current taxes
b) deferred tax (assets) / liabilties
Total
Profit or (loss) for the financial period
Minority share of (profit) or loss for the financial period
Consolidated Group profit or (loss) for the financial period
Change Year 2011 Year 2010 YoY
81,149 186,571 (105,422)
0 0 0
0 0 0
81,149 186,571 (105,422)
81,744 100,394 (18,650)
0 269,749 (269,749)
0 0 0
81,744 370,143 (288,399) (595) (183,572) 182,977
423,080 447,398 (24,318)
3,039,846 667,727 2,372,119
3,462,926 1,115,125 2,347,801
1,715 6,756 (5,041)
379,319 199,784 179,534
381,034 206,540 174,493 3,081,892 908,585 2,173,307 24,420,624 24,814,305 (393,681)
6,561,927 7,871,784 (1,309,857)
(290,899) 546,752 (837,651)
6,271,029 8,418,537 (2,147,508) 18,149,596 16,395,769 1,753,827
(3,452,938) (2,872,938) (580,000)
14,696,658 13,522,831 1,173,827
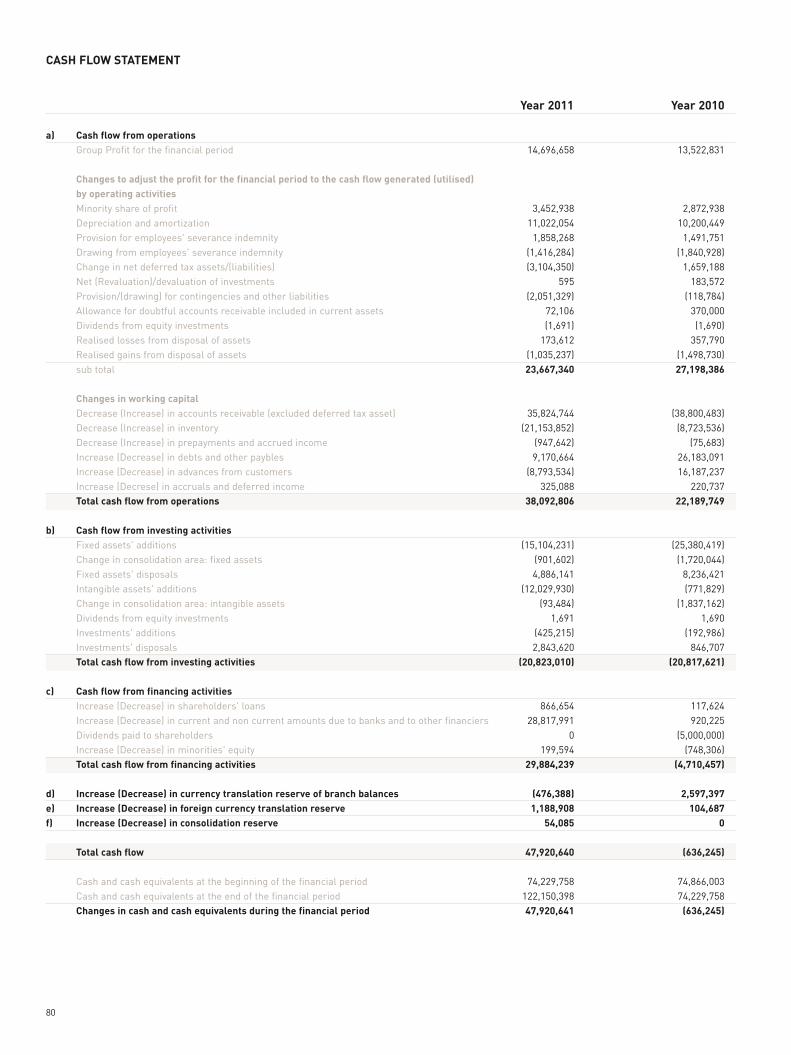
a) Cash flow from operations Group Profit for the financial period
Changes to adjust the profit for the financial period to the cash flow generated (utilised) by operating activities Minority share of profit
Depreciation and amortization
Provision for employees' severance indemnity
Drawing from employees' severance indemnity
Change in net deferred tax assets/(liabilities)
Net (Revaluation)/devaluation of investments
Provision/(drawing) for contingencies and other liabilities
Allowance for doubtful accounts receivable included in current assets
Dividends from equity investments
Realised losses from disposal of assets
Realised gains from disposal of assets
sub total
Changes in working capital Decrease (Increase) in accounts receivable (excluded deferred tax asset)
Decrease (Increase) in inventory
Decrease (Increase) in prepayments and accrued income
Increase (Decrease) in debts and other paybles
Increase (Decrease) in advances from customers
Increase (Decrese) in accruals and deferred income
Total cash flow from operations
b) Cash flow from investing activities Fixed assets' additions
Change in consolidation area: fixed assets
Fixed assets' disposals
Intangible assets' additions
Change in consolidation area: intangible assets
Dividends from equity investments
Investments' additions
Investments' disposals
Total cash flow from investing activities
c) Cash flow from financing activities Increase (Decrease) in shareholders' loans
Increase (Decrease) in current and non current amounts due to banks and to other financiers
Dividends paid to shareholders
Increase (Decrease) in minorities' equity
Total cash flow from financing activities
d) Increase (Decrease) in currency translation reserve of branch balancese) Increase (Decrease) in foreign currency translation reserve f) Increase (Decrease) in consolidation reserve Total cash flow
Cash and cash equivalents at the beginning of the financial period
Cash and cash equivalents at the end of the financial period
Changes in cash and cash equivalents during the financial period
80
CASH FLOW STATEMENT
Year 2011 Year 2010
14,696,658 13,522,831
3,452,938 2,872,938
11,022,054 10,200,449
1,858,268 1,491,751
(1,416,284) (1,840,928)
(3,104,350) 1,659,188
595 183,572
(2,051,329) (118,784)
72,106 370,000
(1,691) (1,690)
173,612 357,790
(1,035,237) (1,498,730)
23,667,340 27,198,386
35,824,744 (38,800,483)
(21,153,852) (8,723,536)
(947,642) (75,683)
9,170,664 26,183,091
(8,793,534) 16,187,237
325,088 220,737
38,092,806 22,189,749
(15,104,231) (25,380,419)
(901,602) (1,720,044)
4,886,141 8,236,421
(12,029,930) (771,829)
(93,484) (1,837,162)
1,691 1,690
(425,215) (192,986)
2,843,620 846,707
(20,823,010) (20,817,621)
866,654 117,624
28,817,991 920,225
0 (5,000,000)
199,594 (748,306)
29,884,239 (4,710,457)
(476,388) 2,597,397 1,188,908 104,687 54,085 0 47,920,640 (636,245)
74,229,758 74,866,003
122,150,398 74,229,758
47,920,641 (636,245)

APPENDICES

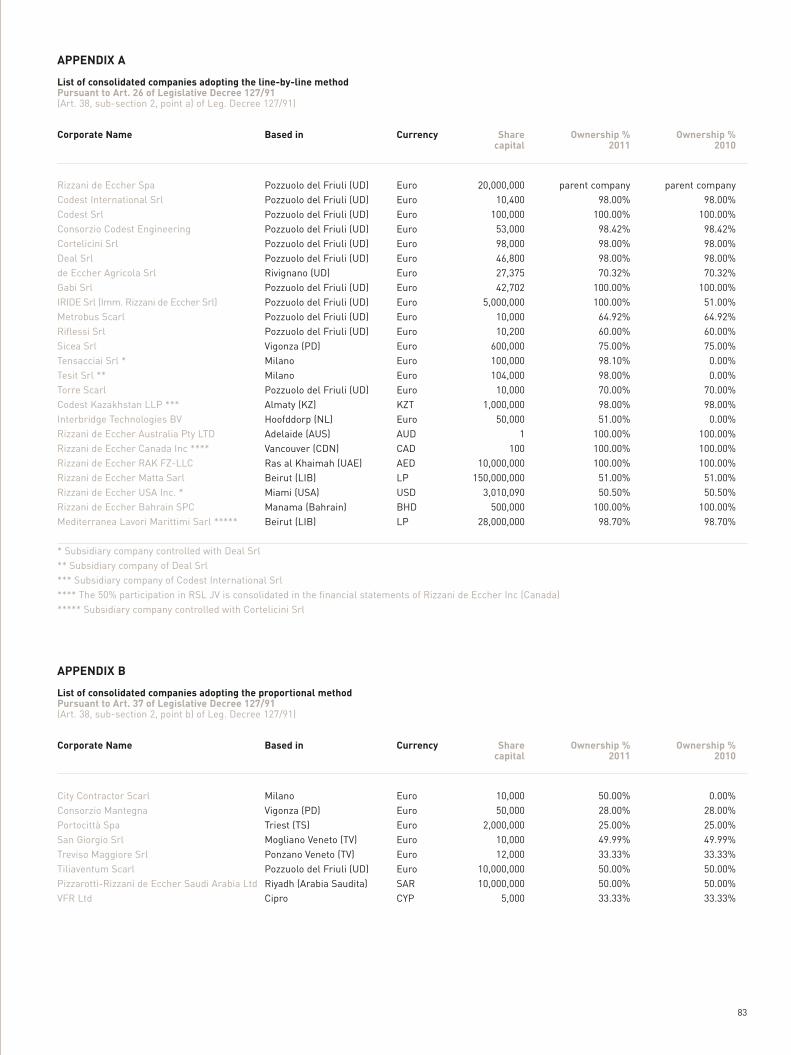
83
APPENDIX A
List of consolidated companies adopting the line-by-line method Pursuant to Art. 26 of Legislative Decree 127/91(Art. 38, sub-section 2, point a) of Leg. Decree 127/91)
Corporate Name
Rizzani de Eccher Spa
Codest International Srl
Codest Srl
Consorzio Codest Engineering
Cortelicini Srl
Deal Srl
de Eccher Agricola Srl
Gabi Srl
IRIDE Srl (Imm. Rizzani de Eccher Srl)
Metrobus Scarl
Riflessi Srl
Sicea Srl
Tensacciai Srl *
Tesit Srl **
Torre Scarl
Codest Kazakhstan LLP ***
Interbridge Technologies BV
Rizzani de Eccher Australia Pty LTD
Rizzani de Eccher Canada Inc ****
Rizzani de Eccher RAK FZ-LLC
Rizzani de Eccher Matta Sarl
Rizzani de Eccher USA Inc. *
Rizzani de Eccher Bahrain SPC
Mediterranea Lavori Marittimi Sarl *****
* Subsidiary company controlled with Deal Srl
** Subsidiary company of Deal Srl
*** Subsidiary company of Codest International Srl
**** The 50% participation in RSL JV is consolidated in the financial statements of Rizzani de Eccher Inc (Canada)
***** Subsidiary company controlled with Cortelicini Srl
Based in Currency Share Ownership % Ownership % capital 2011 2010
Pozzuolo del Friuli (UD) Euro 20,000,000 parent company parent company
Pozzuolo del Friuli (UD) Euro 10,400 98.00% 98.00%
Pozzuolo del Friuli (UD) Euro 100,000 100.00% 100.00%
Pozzuolo del Friuli (UD) Euro 53,000 98.42% 98.42%
Pozzuolo del Friuli (UD) Euro 98,000 98.00% 98.00%
Pozzuolo del Friuli (UD) Euro 46,800 98.00% 98.00%
Rivignano (UD) Euro 27,375 70.32% 70.32%
Pozzuolo del Friuli (UD) Euro 42,702 100.00% 100.00%
Pozzuolo del Friuli (UD) Euro 5,000,000 100.00% 51.00%
Pozzuolo del Friuli (UD) Euro 10,000 64.92% 64.92%
Pozzuolo del Friuli (UD) Euro 10,200 60.00% 60.00%
Vigonza (PD) Euro 600,000 75.00% 75.00%
Milano Euro 100,000 98.10% 0.00%
Milano Euro 104,000 98.00% 0.00%
Pozzuolo del Friuli (UD) Euro 10,000 70.00% 70.00%
Almaty (KZ) KZT 1,000,000 98.00% 98.00%
Hoofddorp (NL) Euro 50,000 51.00% 0.00%
Adelaide (AUS) AUD 1 100.00% 100.00%
Vancouver (CDN) CAD 100 100.00% 100.00%
Ras al Khaimah (UAE) AED 10,000,000 100.00% 100.00%
Beirut (LIB) LP 150,000,000 51.00% 51.00%
Miami (USA) USD 3,010,090 50.50% 50.50%
Manama (Bahrain) BHD 500,000 100.00% 100.00%
Beirut (LIB) LP 28,000,000 98.70% 98.70%
APPENDIX B
List of consolidated companies adopting the proportional methodPursuant to Art. 37 of Legislative Decree 127/91(Art. 38, sub-section 2, point b) of Leg. Decree 127/91)
Corporate Name
City Contractor Scarl
Consorzio Mantegna
Portocittà Spa
San Giorgio Srl
Treviso Maggiore Srl
Tiliaventum Scarl
Pizzarotti-Rizzani de Eccher Saudi Arabia Ltd
VFR Ltd
Based in Currency Share Ownership % Ownership % capital 2011 2010
Milano Euro 10,000 50.00% 0.00%
Vigonza (PD) Euro 50,000 28.00% 28.00%
Triest (TS) Euro 2,000,000 25.00% 25.00%
Mogliano Veneto (TV) Euro 10,000 49.99% 49.99%
Ponzano Veneto (TV) Euro 12,000 33.33% 33.33%
Pozzuolo del Friuli (UD) Euro 10,000,000 50.00% 50.00%
Riyadh (Arabia Saudita) SAR 10,000,000 50.00% 50.00%
Cipro CYP 5,000 33.33% 33.33%
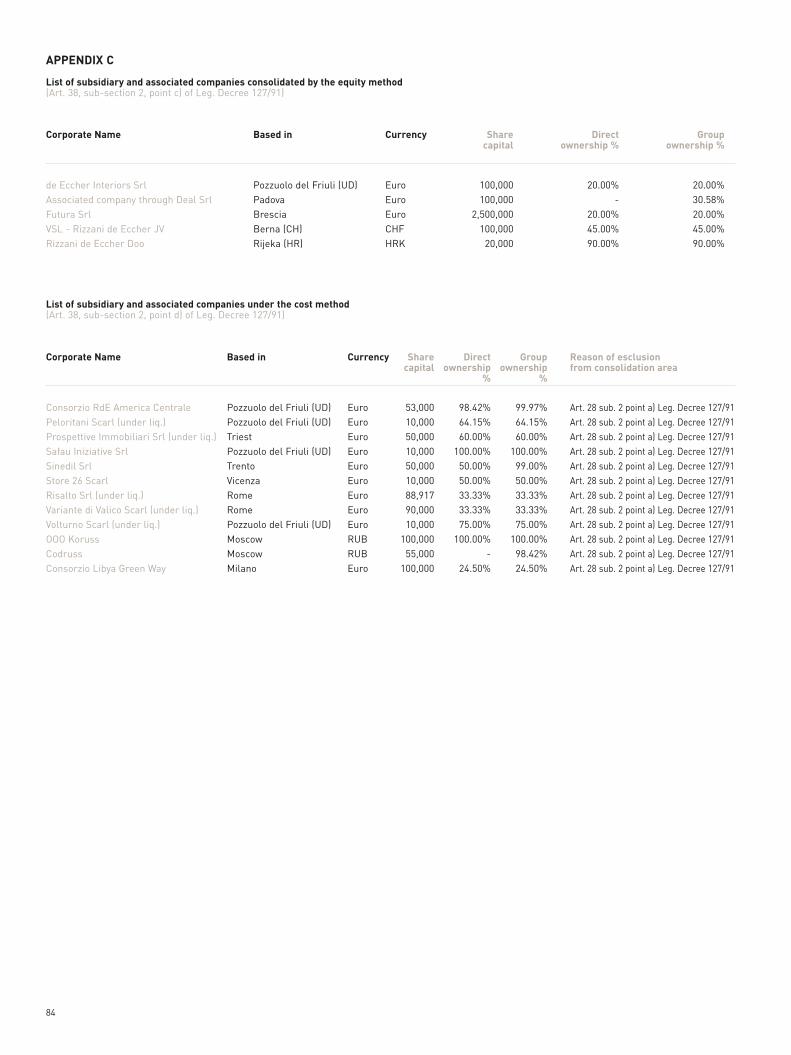
84
APPENDIX C
List of subsidiary and associated companies consolidated by the equity method(Art. 38, sub-section 2, point c) of Leg. Decree 127/91)
Corporate Name
de Eccher Interiors Srl
Associated company through Deal Srl
Futura Srl
VSL - Rizzani de Eccher JV
Rizzani de Eccher Doo
Based in Currency Share Direct Group capital ownership % ownership %
Pozzuolo del Friuli (UD) Euro 100,000 20.00% 20.00%
Padova Euro 100,000 - 30.58%
Brescia Euro 2,500,000 20.00% 20.00%
Berna (CH) CHF 100,000 45.00% 45.00%
Rijeka (HR) HRK 20,000 90.00% 90.00%
List of subsidiary and associated companies under the cost method(Art. 38, sub-section 2, point d) of Leg. Decree 127/91)
Corporate Name
Consorzio RdE America Centrale
Peloritani Scarl (under liq.)
Prospettive Immobiliari Srl (under liq.)
Safau Iniziative Srl
Sinedil Srl
Store 26 Scarl
Risalto Srl (under liq.)
Variante di Valico Scarl (under liq.)
Volturno Scarl (under liq.)
OOO Koruss
Codruss
Consorzio Libya Green Way
Based in Currency Share Direct Group Reason of esclusion capital ownership ownership from consolidation area % %
Pozzuolo del Friuli (UD) Euro 53,000 98.42% 99.97% Art. 28 sub. 2 point a) Leg. Decree 127/91
Pozzuolo del Friuli (UD) Euro 10,000 64.15% 64.15% Art. 28 sub. 2 point a) Leg. Decree 127/91
Triest Euro 50,000 60.00% 60.00% Art. 28 sub. 2 point a) Leg. Decree 127/91
Pozzuolo del Friuli (UD) Euro 10,000 100.00% 100.00% Art. 28 sub. 2 point a) Leg. Decree 127/91
Trento Euro 50,000 50.00% 99.00% Art. 28 sub. 2 point a) Leg. Decree 127/91
Vicenza Euro 10,000 50.00% 50.00% Art. 28 sub. 2 point a) Leg. Decree 127/91
Rome Euro 88,917 33.33% 33.33% Art. 28 sub. 2 point a) Leg. Decree 127/91
Rome Euro 90,000 33.33% 33.33% Art. 28 sub. 2 point a) Leg. Decree 127/91
Pozzuolo del Friuli (UD) Euro 10,000 75.00% 75.00% Art. 28 sub. 2 point a) Leg. Decree 127/91
Moscow RUB 100,000 100.00% 100.00% Art. 28 sub. 2 point a) Leg. Decree 127/91
Moscow RUB 55,000 - 98.42% Art. 28 sub. 2 point a) Leg. Decree 127/91
Milano Euro 100,000 24.50% 24.50% Art. 28 sub. 2 point a) Leg. Decree 127/91

85
APPENDIX D
Schedule of intangible assets
Formation and start upCity Contractor Scarl
Codest Srl
de Eccher Agricola Srl
Gabi Srl
IRIDE Srl (Imm.Rizzani de Eccher Srl)
Portocittà Spa
RdE Matta Scarl
Sicea Srl
Tesit Srl
Tensacciai Srl
Tiliaventum Scarl
Torre Scarl
Treviso Maggiore Srl
Sub- total
GoodwillRizzani de Eccher Spa
Tensacciai Srl
Sub- total
Patents and rights to use patents of othersDeal Srl
City Contractor Scarl
Tesit Srl
Sub- total
Concessions, licences, trademarks and similar rightsDeal Srl
Sub- total
Other Codest Kazakhstan LLP
Deal Srl
Gabi Srl
Mediterranea Lavori Marittimi Sarl
Portocittà Spa
Rizzani de Eccher Spa
Rizzani de Eccher Matta - Sarl
Rizzani de Eccher RAK FZ LLC
Rizzani de Eccher USA Inc
San Giorgio Srl
Sicea Srl
Tensacciai Srl
Tiliaventum Scarl
Torre Scarl
Treviso Maggiore Srl
Sub- total
Total intangible assets Formation and start up
Goodwill
Patents and rights to use patents of others
Concessions, licences, trademarks and similar rights
Other
Total
31.12.2010 Change in Increase Effects for currency Amortization 31.12.2011 consolidation (decrease) translation and area reclassification
- 600 - - (300) 300
1,923 - - - (481) 1,442
1,524 - - - (508) 1,016
1,410 (1,410) - - - -
600 - 11,346 - (2,569) 9,377
1,900 - - - (475) 1,425
12,272 - - 160 (2,941) 9,491
- - 4,150 - (830) 3,320
- 1,199 8,082 - (3,961) 5,320
- - 25,304 - (5,061) 20,243
2,456 - - - (614) 1,842
1,600 - - - (400) 1,200
- 123,998 75,549 - (179,694) 19,853
23,685 124,387 124,431 160 (197,834) 74,828
200,000 - - - (100,000) 100,000
- - 400,000 - (40,000) 360,000
200,000 - 400,000 - (140,000) 460,000
- - 850,000 - (170,000) 680,000
- 80,836 12,293 - (31,536) 61,593
- 1,845 - - (275) 1,570
- 82,681 862,293 - (201,811) 743,163
- - 50,000 - (2,778) 47,222
- - 50,000 - (2,778) 47,222
758 - - 157 (244) 671
18,887 - 10,849 - (13,057) 16,679
9,023 1,410 - - (3,478) 6,955
- 834 - - (172) 662
243,215 - 3,088 - (61,421) 184,881
1,766,941 - 1,285,211 737 (365,556) 2,687,333
7,186 - - 72 (1,697) 5,561
53,063 - - (2,495) (50,568) -
13,568 - 14,028 (6,993) - 20,603
- - 5,976 - (120) 5,856
145 - - - (145) -
- 8,100 27,673 102,245 (7,235) 130,783
51,000 - 182,618 - - 233,618
1,358,553 - 8,969,881 - (1,064,542) 9,263,891
123,927 (123,927) - - - -
3,646,267 (113,583) 10,499,323 93,723 (1,568,235) 12,557,493
23,685 124,387 124,431 160 (197,834) 74,828
200,000 - 400,000 - (140,000) 460,000
- 82,681 862,293 - (201,811) 743,163
- - 50,000 - (2,778) 47,222
3,646,267 (113,583) 10,499,323 93,723 (1,568,235) 12,557,493
3,869,952 93,484 11,936,047 93,883 (2,110,658) 13,882,706

86
APPENDIX E
Schedule of fixed assets
Land and buildingsde Eccher Agricola SrlIRIDE Srl (Imm.Rizzani de Eccher Srl)Rizzani de Eccher SpaRizzani de Eccher USA IncSicea SrlSub-total
Plant and machineryCity Contractor ScarlCodest International SrlCodest Kazakhstan LLPConsorzio Codest EngineeringDeal Srlde Eccher Agricola SrlMetrobus ScarlPizzarotti RdE Saudi ArabiaRizzani de Eccher Bahrain SPCRizzani de Eccher - Matta SarlRizzani de Eccher SpaRizzani de Eccher USA IncSicea SrlTensacciai SrlTesit SrlTorre ScarlTreviso Maggiore SrlVFR LtdSub-total
Tools, fittings, furniture, fixtures and other equipmentCodest International SrlConsorzio Codest EngineeringCodest Kazakhstan LLPDeal Srlde Eccher Agricola SrlInterbridge Technologies B.V.Metrobus ScarlPizzarotti RdE Saudi ArabiaRizzani de Eccher Bahrain SPCRizzani de Eccher - Matta SarlRizzani de Eccher SpaRizzani de Eccher USA IncSicea SrlTesit SrlTensacciai SrlTorre ScarlTreviso Maggiore SrlSub-total
Other City Contractor ScarlCodest International SrlCodest Kazakhstan LLPConsorzio Codest EngineeringDeal Srlde Eccher Agricola SrlMetrobus ScarlMediterranea Lavori Marittimi SarlPortocittà SpaRizzani de Eccher RAK FZ LLCRizzani de Eccher - Matta SarlRizzani de Eccher SpaRizzani de Eccher USA IncSicea SrlTesit SrlTensacciai SrlTorre ScarlTreviso Maggiore SrlSub-total
Tangible assets in course of construction and payments onIRIDE Srl (Imm.Rizzani de Eccher Srl)Portocittà SpaSub-total
Total fixed assetsLand and buildingsPlant and machineryTools, fittings, furniture, fixtures and other equipmentOtherTangible assets in course of construction and payments on
Total
31.12.2010 Change in Increase Decrease 31.12.2011 consolidation and area reclassification
5,320,145 - 11,369 - 5,331,514 - - - 20,555,890 20,555,890 44,848,809 - 164,633 (21,952,380) 23,061,062 655,392 - - 21,426 676,818 478,789 - 9,626 - 488,415 51,303,135 - 185,628 (1,375,064) 50,113,699 - 57,620 6,733 - 64,353 4,780,269 - 11,531 (2,674,509) 2,117,291 1,453,806 - 810 (1,038,202) 416,414 123,045 - - (99,459) 23,586 1,490,594 - 885,745 - 2,376,339 2,177,344 - 46,679 - 2,224,023 14,418 - - - 14,418 - - 3,880 - 3,880 21,402 3,424 1,058,159 (24,543) 1,058,442 1,051,078 - 49,334 32,742 1,133,154 12,257,512 - 3,112,900 (106,206) 15,264,206 7,623,227 - 3,520,528 (1,795,644) 9,348,111 2,641 - - - 2,641 - 2,170,324 - - 2,170,324 - 456,826 - (14,607) 442,219 45,313 - 3,370,184 - 3,415,497 454,202 - - (349,152) 105,050 369,524 - - - 369,524 31,864,376 2,688,194 12,066,483 (6,069,580) 40,549,473 1,360,292 - - (269,153) 1,091,139 78,468 - - (63,284) 15,184 2,084,197 - 1,236 (436,833) 1,648,600 113,485 - 33,440 (30,500) 116,425 - 18,058 - - 18,058 - 13,190 - - 13,190 34,203 - - - 34,203 - - 509 - 509 14,399 (3,424) 835,518 (358,397) 488,096 405,390 - 22,652 12,628 440,670 7,755,505 - 624,811 (888,199) 7,492,117 1,175,420 - 348,708 19,048 1,543,176 22,628 - - - 22,628 - 91,845 2,607 - 94,452 - 446,942 - - 446,942 502,455 - 415,949 - 918,404 47,091 - - (38,123) 8,968 13,593,533 566,611 2,285,430 (2,052,813) 14,392,761 - 158,708 21,203 - 179,911 207,796 - - (77,358) 130,438 5,390 - 4,422 (973) 8,839 23,081 - - (52) 23,029 62,623 - - - 62,623 21,769 (18,058) - - 3,711 6,630 - - - 6,630 897 - - (897) - - - 29,693 - 29,693 48,429 - - 797 49,226 82,615 - 8,572 2,537 93,724 1,785,739 - 344,599 (99,464) 2,030,874 62,847 - 45,548 1,437 109,832 234,725 - - (96) 234,629 - 99,632 1,333 - 100,965 - 291,742 - - 291,742 207,536 - 27,571 - 235,107 25,175 - - - 25,175 2,775,252 532,024 482,941 (174,069) 3,616,147 58,501 - - - 58,501 56,513 - 83,750 - 140,263 115,014 - 83,750 - 198,764 51,303,135 - 185,628 (1,375,064) 50,113,699 31,864,377 2,688,194 12,066,483 (6,069,580) 40,549,473 13,593,532 566,611 2,285,430 (2,052,813) 14,392,761 2,775,251 532,024 482,941 (174,069) 3,616,147 115,014 - 83,750 - 198,764
99,651,309 3,786,829 15,104,231 (9,671,526) 108,870,843
Note: the effect of currency translation is included in the Decrease column
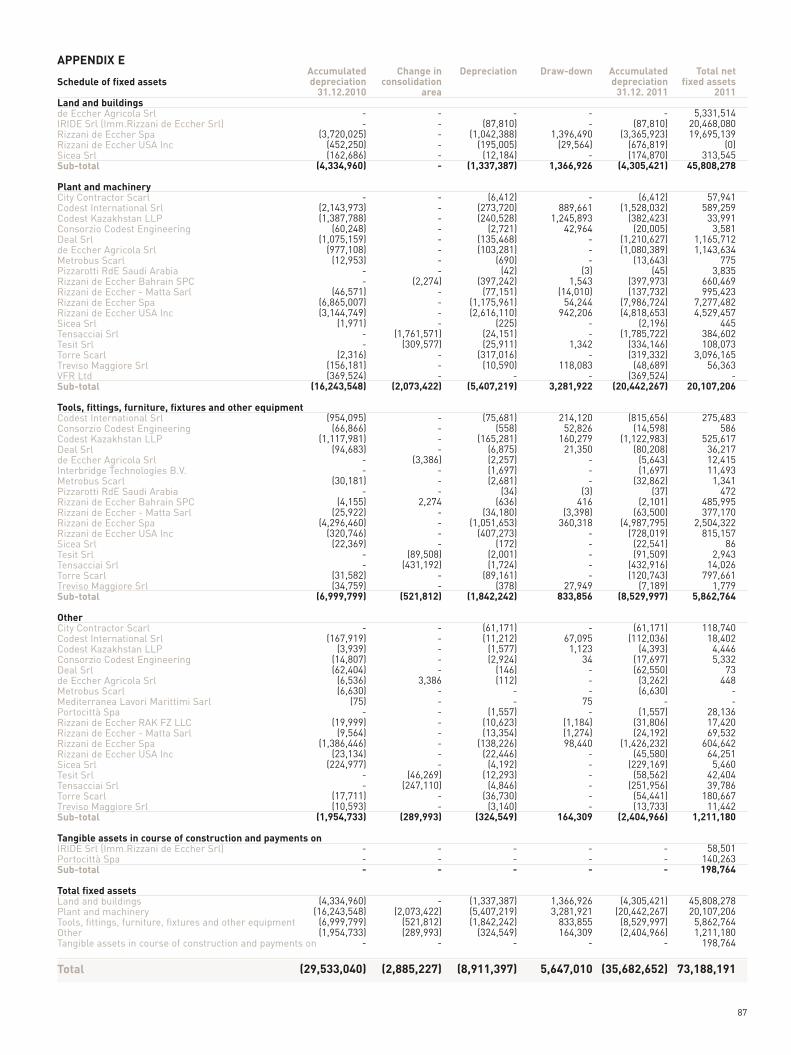
87
APPENDIX E
Schedule of fixed assets
Land and buildingsde Eccher Agricola SrlIRIDE Srl (Imm.Rizzani de Eccher Srl)Rizzani de Eccher SpaRizzani de Eccher USA IncSicea SrlSub-total
Plant and machineryCity Contractor ScarlCodest International SrlCodest Kazakhstan LLPConsorzio Codest EngineeringDeal Srlde Eccher Agricola SrlMetrobus ScarlPizzarotti RdE Saudi ArabiaRizzani de Eccher Bahrain SPCRizzani de Eccher - Matta SarlRizzani de Eccher SpaRizzani de Eccher USA IncSicea SrlTensacciai SrlTesit SrlTorre ScarlTreviso Maggiore SrlVFR LtdSub-total
Tools, fittings, furniture, fixtures and other equipmentCodest International SrlConsorzio Codest EngineeringCodest Kazakhstan LLPDeal Srlde Eccher Agricola SrlInterbridge Technologies B.V.Metrobus ScarlPizzarotti RdE Saudi ArabiaRizzani de Eccher Bahrain SPCRizzani de Eccher - Matta SarlRizzani de Eccher SpaRizzani de Eccher USA IncSicea SrlTesit SrlTensacciai SrlTorre ScarlTreviso Maggiore SrlSub-total
Other City Contractor ScarlCodest International SrlCodest Kazakhstan LLPConsorzio Codest EngineeringDeal Srlde Eccher Agricola SrlMetrobus ScarlMediterranea Lavori Marittimi SarlPortocittà SpaRizzani de Eccher RAK FZ LLCRizzani de Eccher - Matta SarlRizzani de Eccher SpaRizzani de Eccher USA IncSicea SrlTesit SrlTensacciai SrlTorre ScarlTreviso Maggiore SrlSub-total
Tangible assets in course of construction and payments onIRIDE Srl (Imm.Rizzani de Eccher Srl)Portocittà SpaSub-total
Total fixed assetsLand and buildingsPlant and machineryTools, fittings, furniture, fixtures and other equipmentOtherTangible assets in course of construction and payments on
Total
Accumulated Change in Depreciation Draw-down Accumulated Total net depreciation consolidation depreciation fixed assets 31.12.2010 area 31.12. 2011 2011
- - - - - 5,331,514 - - (87,810) - (87,810) 20,468,080 (3,720,025) - (1,042,388) 1,396,490 (3,365,923) 19,695,139 (452,250) - (195,005) (29,564) (676,819) (0) (162,686) - (12,184) - (174,870) 313,545 (4,334,960) - (1,337,387) 1,366,926 (4,305,421) 45,808,278 - - (6,412) - (6,412) 57,941 (2,143,973) - (273,720) 889,661 (1,528,032) 589,259 (1,387,788) - (240,528) 1,245,893 (382,423) 33,991 (60,248) - (2,721) 42,964 (20,005) 3,581 (1,075,159) - (135,468) - (1,210,627) 1,165,712 (977,108) - (103,281) - (1,080,389) 1,143,634 (12,953) - (690) - (13,643) 775 - - (42) (3) (45) 3,835 - (2,274) (397,242) 1,543 (397,973) 660,469 (46,571) - (77,151) (14,010) (137,732) 995,423 (6,865,007) - (1,175,961) 54,244 (7,986,724) 7,277,482 (3,144,749) - (2,616,110) 942,206 (4,818,653) 4,529,457 (1,971) - (225) - (2,196) 445 - (1,761,571) (24,151) - (1,785,722) 384,602 - (309,577) (25,911) 1,342 (334,146) 108,073 (2,316) - (317,016) - (319,332) 3,096,165 (156,181) - (10,590) 118,083 (48,689) 56,363 (369,524) - - - (369,524) - (16,243,548) (2,073,422) (5,407,219) 3,281,922 (20,442,267) 20,107,206 (954,095) - (75,681) 214,120 (815,656) 275,483 (66,866) - (558) 52,826 (14,598) 586 (1,117,981) - (165,281) 160,279 (1,122,983) 525,617 (94,683) - (6,875) 21,350 (80,208) 36,217 - (3,386) (2,257) - (5,643) 12,415 - - (1,697) - (1,697) 11,493 (30,181) - (2,681) - (32,862) 1,341 - - (34) (3) (37) 472 (4,155) 2,274 (636) 416 (2,101) 485,995 (25,922) - (34,180) (3,398) (63,500) 377,170 (4,296,460) - (1,051,653) 360,318 (4,987,795) 2,504,322 (320,746) - (407,273) - (728,019) 815,157 (22,369) - (172) - (22,541) 86 - (89,508) (2,001) - (91,509) 2,943 - (431,192) (1,724) - (432,916) 14,026 (31,582) - (89,161) - (120,743) 797,661 (34,759) - (378) 27,949 (7,189) 1,779 (6,999,799) (521,812) (1,842,242) 833,856 (8,529,997) 5,862,764 - - (61,171) - (61,171) 118,740 (167,919) - (11,212) 67,095 (112,036) 18,402 (3,939) - (1,577) 1,123 (4,393) 4,446 (14,807) - (2,924) 34 (17,697) 5,332 (62,404) - (146) - (62,550) 73 (6,536) 3,386 (112) - (3,262) 448 (6,630) - - - (6,630) - (75) - - 75 - - - - (1,557) - (1,557) 28,136 (19,999) - (10,623) (1,184) (31,806) 17,420 (9,564) - (13,354) (1,274) (24,192) 69,532 (1,386,446) - (138,226) 98,440 (1,426,232) 604,642 (23,134) - (22,446) - (45,580) 64,251 (224,977) - (4,192) - (229,169) 5,460 - (46,269) (12,293) - (58,562) 42,404 - (247,110) (4,846) - (251,956) 39,786 (17,711) - (36,730) - (54,441) 180,667 (10,593) - (3,140) - (13,733) 11,442 (1,954,733) (289,993) (324,549) 164,309 (2,404,966) 1,211,180 - - - - - 58,501 - - - - - 140,263 - - - - - 198,764 (4,334,960) - (1,337,387) 1,366,926 (4,305,421) 45,808,278 (16,243,548) (2,073,422) (5,407,219) 3,281,921 (20,442,267) 20,107,206 (6,999,799) (521,812) (1,842,242) 833,855 (8,529,997) 5,862,764 (1,954,733) (289,993) (324,549) 164,309 (2,404,966) 1,211,180 - - - - - 198,764
(29,533,040) (2,885,227) (8,911,397) 5,647,010 (35,682,652) 73,188,191

88
APPENDIX G
Reconciliation between parent company and consolidated accounts
Thousand of Euro
Statutory financial statements of the parent company
Off-set of consolidated equity investments difference between book value of equity investments and net assets value
consolidation differences
allocation of differential between purchase price and pro rata share of net assets value
foreign currency translation differences
pro rata share of profit of consolidated companies
write-down / write-up on investements in consolidated companies
Off-set of related party transactionscapital gains/losses and intercompany profit
dividends distribution including currency translation gains or losses
Adjustment due to consolidation accounting principlesforeign currency translation gain (loss) of branch balances
Other adjustmentsvaluation of investments due to application of equity method
valuation of leasing contract
Total Group consolidated shareholders' equity
Minority share of equity and profit
Total consolidated shareholders' equity
Shareholders' Profit Shareholders' Profit equity (loss) equity (loss) 2011 2011 2010 2010
67,636 737 67,853 8,266
9,961 - 2,111 20
408 (241) 348 (32)
2,357 - 2,357 -
1,318 - 129 -
16,431 16,431 14,014 14,014
- - (2,786) (2,786)
(836) 1,024 (1,860) (819)
- (3,248) - (5,086)
(494) - (646) -
1,243 (207) 1,450 (219)
367 202 165 165
98,391 14,698 83,135 13,523
10,106 3,452 6,453 2,873
108,497 18,150 89,588 16,396
APPENDIX F
Schedule of changes in consolidated shareholders' equity
Situation as of 31st December 2009
Allocation of profit for the year 2009
Dividends distribution
Change in consolidation area
Foreign currency translation gain (loss)
of branch balances
Gain (loss) on foreign currency translation
Profit (loss) for the financial period
Situation as of 31st December 2010
Allocation of profit for the year 2010
Change in consolidation area
Foreign currency translation gain (loss)
of branch balances
Gain (loss) on foreign currency translation
Profit (loss) for the financial period
Situation as of 31st December 2011
Foreign Total Minority Total currency Group Group share of consolidated Share Legal Consolidation translation Extraordinary profit sharholders' equity shareholders' capital reserve reserve reserve reserve (loss) equity and profit equity
20,000,000 2,000,000 67,105 20,197 34,113,423 15,497,625 71,698,349 4,332,879 76,031,228
- 755,131 - - 14,742,494 (15,497,625) - - -
- - - - (5,000,000) - (5,000,000) - (5,000,000)
- - - - - - - (748,306) (748,306)
- - - - 2,597,397 - 2,597,397 - 2,597,397
- - - 109,024 - - 109,024 (4,337) 104,687
- - - - - 13,522,831 13,522,831 2,872,938 16,395,769
20,000,000 2,755,131 67,105 129,221 46,453,314 13,522,831 82,927,602 6,453,174 89,380,776
- 413,310 - - 13,109,521 (13,522,831) - - -
- - 54,085 - - - 54,085 (171,821) (117,736)
- - - - (476,388) - (476,388) - (476,388)
- - - 1,188,908 - - 1,188,908 371,415 1,560,323
- - - - - 14,696,658 14,696,658 3,452,938 18,149,596
20,000,000 3,168,441 121,190 1,318,129 59,086,447 14,696,658 98,390,866 10,105,706 108,496,572

STATUTORY FINANCIAL STATEMENTS OF THE PARENT COMPANY
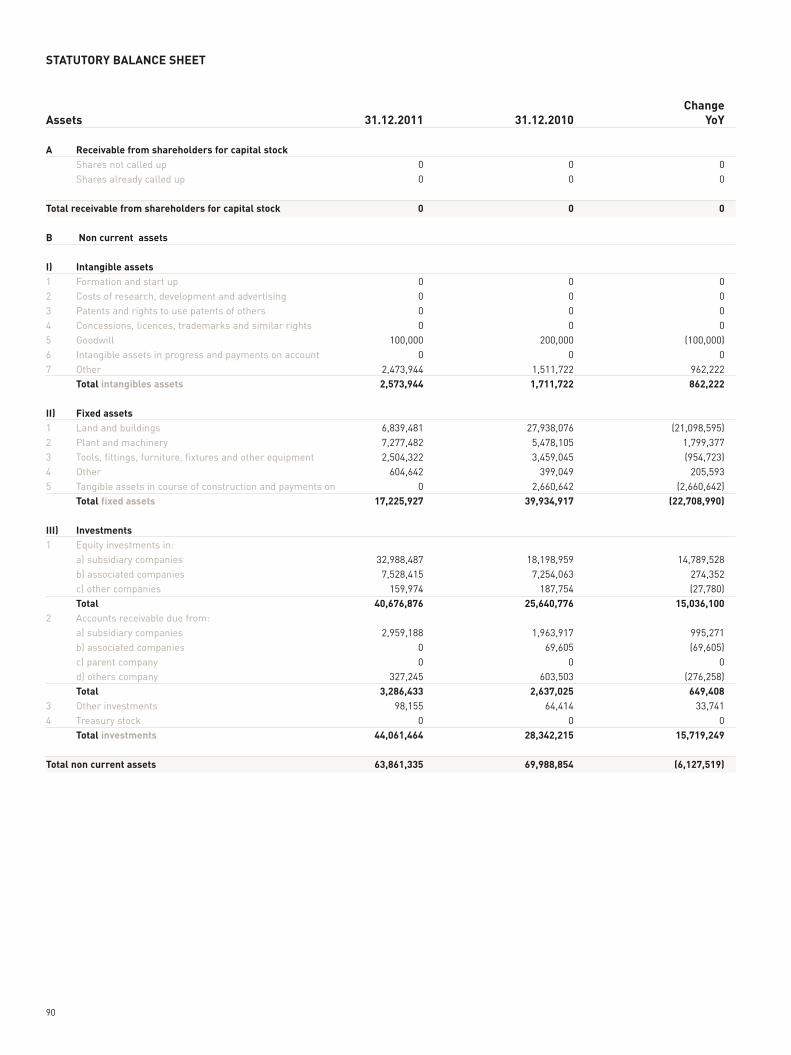
90
Assets
A Receivable from shareholders for capital stock Shares not called up
Shares already called up
Total receivable from shareholders for capital stock
B Non current assets
I) Intangible assets1 Formation and start up
2 Costs of research, development and advertising
3 Patents and rights to use patents of others
4 Concessions, licences, trademarks and similar rights
5 Goodwill
6 Intangible assets in progress and payments on account
7 Other
Total intangibles assets
II) Fixed assets1 Land and buildings
2 Plant and machinery
3 Tools, fittings, furniture, fixtures and other equipment
4 Other
5 Tangible assets in course of construction and payments on
Total fixed assets
III) Investments1 Equity investments in:
a) subsidiary companies
b) associated companies
c) other companies
Total2 Accounts receivable due from:
a) subsidiary companies
b) associated companies
c) parent company
d) others company
Total3 Other investments
4 Treasury stock
Total investments
Total non current assets
Change 31.12.2011 31.12.2010 YoY
0 0 0
0 0 0
0 0 0
0 0 0
0 0 0
0 0 0
0 0 0
100,000 200,000 (100,000)
0 0 0
2,473,944 1,511,722 962,222
2,573,944 1,711,722 862,222
6,839,481 27,938,076 (21,098,595)
7,277,482 5,478,105 1,799,377
2,504,322 3,459,045 (954,723)
604,642 399,049 205,593
0 2,660,642 (2,660,642)
17,225,927 39,934,917 (22,708,990)
32,988,487 18,198,959 14,789,528
7,528,415 7,254,063 274,352
159,974 187,754 (27,780)
40,676,876 25,640,776 15,036,100
2,959,188 1,963,917 995,271
0 69,605 (69,605)
0 0 0
327,245 603,503 (276,258)
3,286,433 2,637,025 649,408 98,155 64,414 33,741
0 0 0
44,061,464 28,342,215 15,719,249 63,861,335 69,988,854 (6,127,519)
STATUTORY BALANCE SHEET
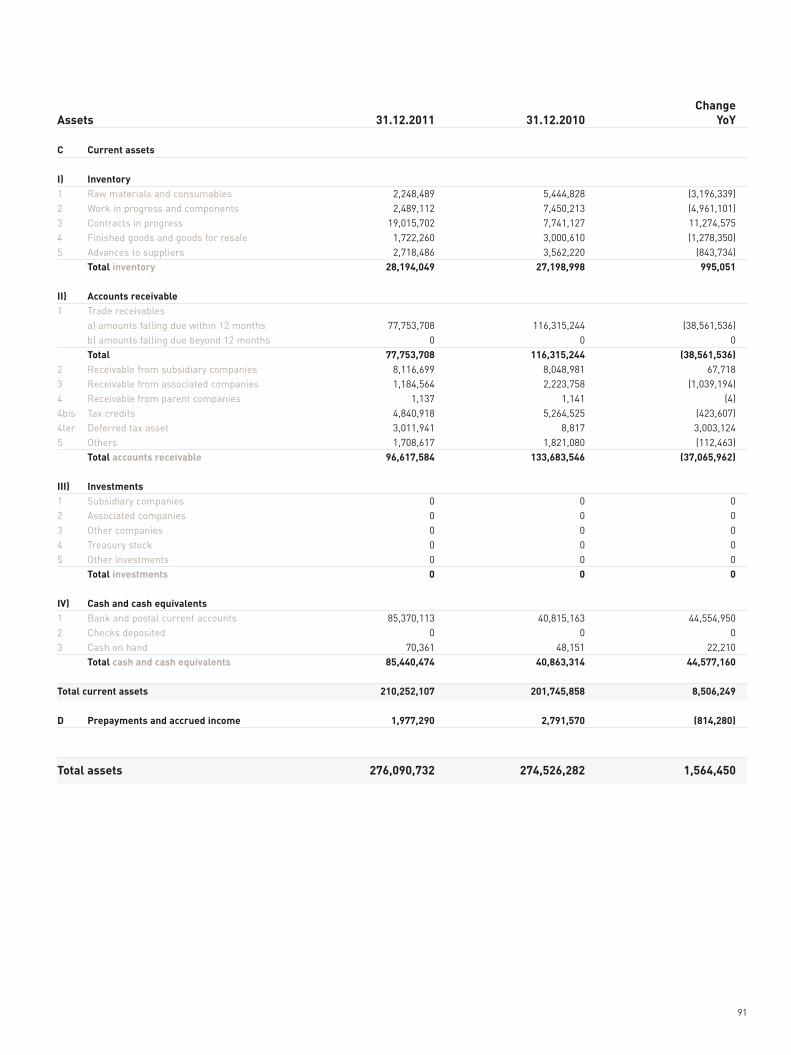
91
Assets
C Current assets
I) Inventory1 Raw materials and consumables
2 Work in progress and components
3 Contracts in progress
4 Finished goods and goods for resale
5 Advances to suppliers
Total inventory
II) Accounts receivable1 Trade receivables
a) amounts falling due within 12 months
b) amounts falling due beyond 12 months
Total2 Receivable from subsidiary companies
3 Receivable from associated companies
4 Receivable from parent companies
4bis Tax credits
4ter Deferred tax asset
5 Others
Total accounts receivable
III) Investments1 Subsidiary companies
2 Associated companies
3 Other companies
4 Treasury stock
5 Other investments
Total investments
IV) Cash and cash equivalents1 Bank and postal current accounts
2 Checks deposited
3 Cash on hand
Total cash and cash equivalents
Total current assets
D Prepayments and accrued income
Total assets
Change 31.12.2011 31.12.2010 YoY
2,248,489 5,444,828 (3,196,339)
2,489,112 7,450,213 (4,961,101)
19,015,702 7,741,127 11,274,575
1,722,260 3,000,610 (1,278,350)
2,718,486 3,562,220 (843,734)
28,194,049 27,198,998 995,051
77,753,708 116,315,244 (38,561,536)
0 0 0
77,753,708 116,315,244 (38,561,536) 8,116,699 8,048,981 67,718
1,184,564 2,223,758 (1,039,194)
1,137 1,141 (4)
4,840,918 5,264,525 (423,607)
3,011,941 8,817 3,003,124
1,708,617 1,821,080 (112,463)
96,617,584 133,683,546 (37,065,962)
0 0 0
0 0 0
0 0 0
0 0 0
0 0 0
0 0 0
85,370,113 40,815,163 44,554,950
0 0 0
70,361 48,151 22,210
85,440,474 40,863,314 44,577,160 210,252,107 201,745,858 8,506,249 1,977,290 2,791,570 (814,280)
276,090,732 274,526,282 1,564,450
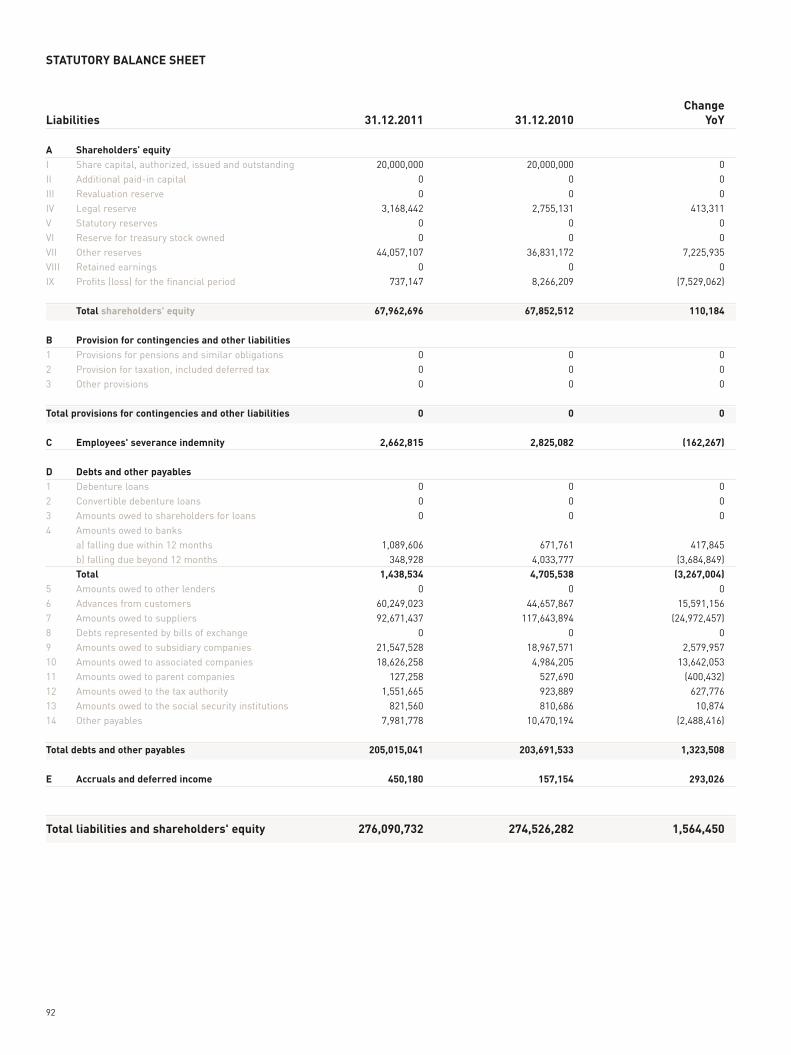
92
Liabilities
A Shareholders’ equityI Share capital, authorized, issued and outstanding
II Additional paid-in capital
III Revaluation reserve
IV Legal reserve
V Statutory reserves
VI Reserve for treasury stock owned
VII Other reserves
VIII Retained earnings
IX Profits (loss) for the financial period
Total shareholders' equity
B Provision for contingencies and other liabilities1 Provisions for pensions and similar obligations
2 Provision for taxation, included deferred tax
3 Other provisions
Total provisions for contingencies and other liabilities
C Employees' severance indemnity
D Debts and other payables1 Debenture loans
2 Convertible debenture loans
3 Amounts owed to shareholders for loans
4 Amounts owed to banks
a) falling due within 12 months
b) falling due beyond 12 months
Total5 Amounts owed to other lenders
6 Advances from customers
7 Amounts owed to suppliers
8 Debts represented by bills of exchange
9 Amounts owed to subsidiary companies
10 Amounts owed to associated companies
11 Amounts owed to parent companies
12 Amounts owed to the tax authority
13 Amounts owed to the social security institutions
14 Other payables
Total debts and other payables
E Accruals and deferred income
Total liabilities and shareholders' equity
Change 31.12.2011 31.12.2010 YoY
20,000,000 20,000,000 0
0 0 0
0 0 0
3,168,442 2,755,131 413,311
0 0 0
0 0 0
44,057,107 36,831,172 7,225,935
0 0 0
737,147 8,266,209 (7,529,062)
67,962,696 67,852,512 110,184
0 0 0
0 0 0
0 0 0
0 0 0 2,662,815 2,825,082 (162,267)
0 0 0
0 0 0
0 0 0
1,089,606 671,761 417,845
348,928 4,033,777 (3,684,849)
1,438,534 4,705,538 (3,267,004) 0 0 0
60,249,023 44,657,867 15,591,156
92,671,437 117,643,894 (24,972,457)
0 0 0
21,547,528 18,967,571 2,579,957
18,626,258 4,984,205 13,642,053
127,258 527,690 (400,432)
1,551,665 923,889 627,776
821,560 810,686 10,874
7,981,778 10,470,194 (2,488,416)
205,015,041 203,691,533 1,323,508 450,180 157,154 293,026
276,090,732 274,526,282 1,564,450
STATUTORY BALANCE SHEET
93
Memorandum accounts
1 Guarantees a) in favour of subsidiary and associated companies
b) issued by third parties in favour of the company
2 Commitments, Futuresa) outstanding leasing obligations
Total memorandum accounts
Change 31.12.2011 31.12.2010 YoY
143,094,633 183,965,865 (40,871,232)
151,356,811 159,033,917 (7,677,106)
0 6,714,521 (6,714,521)
294,451,444 349,714,303 (55,262,859)
94
A Value of production1 Sales of goods and services
2 Change in finished goods and work in progress inventory
3 Change in contracts in progress
4 Work performed for own purposes and capitalised
5 Other revenues and income
Total value of production
B Costs of production6 For raw materials, consumables and goods for sale
7 For services
8 For use of assets owned by others
9 For employees:
a) wages and salaries
b) social security costs
c) employee severance indemnity
d) provision costs
e) other costs relating to employees
Total costs for employees
10 Valuation adjustments:
a) amortization of intangible assets
b) depreciation of tangible assets
c) writedown in the carrying value of non current assets
d) allowance for doubtful accounts receivable included in
current assets and other current assets
Total valuation adjustments
11 Change in raw materials, consumables
and goods for sale inventory
12 Amounts provided for contingencies
13 Other accruals
14 Other operating costs
Total costs of production
Operating margin (EBIT) (A-B)
C Financial income and expenses15 Income from equity investments
16 Other financial income:
a) from accounts receivable included in non-current assets
b) from other permanent investments which are non-current
assets other than equity investments
c) from other investments classified as current assets
d) other income
Total other financial income
17 Interest expenses and similar charges
17bis Foreign currency translation gains and (losses)
Total financial income and (expenses)
Change Year 2011 Year 2010 YoY
149,475,319 282,084,753 (132,609,434)
2,210,436 2,334,464 (124,028)
11,274,487 2,704,502 8,569,985
1,602,114 547,214 1,054,900
4,365,697 4,203,752 161,945
168,928,053 291,874,685 (122,946,632)
17,808,712 15,811,034 1,997,678
117,440,141 245,545,027 (128,104,886)
1,493,390 1,705,012 (211,622)
16,696,078 16,150,984 545,094
4,824,454 4,825,323 (869)
1,109,828 998,488 111,340
0 0 0
2,603,218 2,454,682 148,536
25,233,578 24,429,477 804,101
423,388 364,287 59,101
3,186,756 3,146,391 40,365
0 0 0
0 370,000 (370,000)
3,610,144 3,880,678 (270,534)
3,208,250 (4,328,126) 7,536,376
0 0 0
0 0 0
6,149,857 4,093,867 2,055,990
174,944,072 291,136,969 (116,192,897) (6,016,019) 737,716 (6,753,735)
3,272,163 5,261,451 (1,989,288)
45,816 12,557 33,259
0 0 0
0 0 0
1,460,135 628,542 831,593
1,505,951 641,099 864,852
623,263 412,822 210,441
1,397,433 (30,307) 1,427,740
5,552,284 5,459,421 92,863
STATUTORY INCOME STATEMENT

95
D Valuation adjustments in respect of investments18 Revaluations:
a) of equity investments
b) of other non-current assets which are not equity investments
c) of non-perrnanent investments
Total 19 Devaluation:
a) of equity investments
b) of other non-current assets which are not equity investments
c) of non-permanent investments
Total
Total valuation adjustments in respect of investment
E Extraordinary income and charges20 Income
21 Charges
Total extraordinary income and (charges)
Profit or (loss) before income taxes
22 Income taxes for the period
a) current taxes
b) deferred tax (assets) / liabilties
Total
Profit or (loss) for the financial period
Change Year 2011 Year 2010 YoY
0 3,873,729 (3,873,729)
0 0 0
0 0 0
0 3,873,729 (3,873,729)
27,779 73,385 (45,606)
0 214,547 (214,547)
0 0 0
27,779 287,932 (260,153) (27,779) 3,585,797 (3,613,576)
990,254 400,729 589,525
18,152 111,400 (93,248)
972,102 289,329 682,773 480,588 10,072,263 (9,591,675)
(24,103) 2,056,233 (2,080,336)
(232,456) (250,179) 17,723
(256,559) 1,806,054 (2,062,613)
737,147 8,266,209 (7,529,062)

96
© Rizzani de Eccher SpaGraphic design: PolystudioFrancesco Messina with Francesca ZucchiPhotos: Archive Rizzani de Eccher, Printed: GFP.it July 2012