GSA DATA REPOSITORY 2013014 Walker et al. Appendix DR1. Location and sample maps Figure DR1. A: Location map and structural components of a basaltic fault zone: A: Simplified Faroe-Shetland tectonic elements map with location of the Faroe Islands, European Atlantic margin (modified from: Ellis et al., 2009; Moy and Imber, 2009; Walker et al., 2011a). Structural lineaments are, from SW-NE: JL, Judd; BL, Brynhild; WL, Westray; CL, Clair; GKL, Grimur-Kamban; VL, Victory; EL, Erlend; ML, Magnus. B: Simplified geological map of the Faroe Islands after Passey and Bell (2007). C: Location map for the aphyric lava unit fault rock suite. D: Location map for the aphyric dyke fault rock suite. Figure DR2. A: Overview of the Sumba fault zone (location indicated in Supplementary Figure 1C. B: Sample locations for S01 (sheet lava host rock), S02 (crackle breccia) and S05 (conglomerate host rock). C: Location map for the sheet lava I Botni (IB) samples. D: Photograph showing the location of sample IB07 (mosaic breccia). E: Overview photograph of a 30 m displacement dip slip normal fault at I Botni, as context to: F: Location of sample IB13 (cataclasite) on the principal slip surface. G: Overview of the Leynar (L) sample site, showing location of samples L01 (compound lava host rock), L02 (dyke host rock), L03 (crackle breccia), L04 (mosaic breccia) and L05 (chaotic breccia). Location shown in Supplementary Figure 1D. H: Photograph showing fault rock assemblage arrangement within the Leynar fault zone. References Ellis, D., Passey, S.R., Jolley, D.W., and Bell, B.R. 2009. Transfer zones: The application of new geological information from the Faroe Islands applied to the offshore exploration of intra basalt and sub-basalt strata, in Varming, T. and Ziska, H., eds., Proceedings of the 2 nd Faroe Islands Exploration Conference: Annales Societatis Scientiarum Færoensis, Supplementum, v. 50, p. 174-204 Moy, D.J., and Imber, J., 2009, A critical analysis of the structure and tectonic significance of rift-oblique lineaments (‘transfer zones') in the Mesozoic–Cenozoic succession of the Faroe–Shetland Basin, NE Atlantic margin: Journal of the Geological Society of London, v. 166, p. 831-844 Passey, S.R., and Bell, B.R., 2007, Morphologies and emplacement mechanisms of the lava fl ows of the Faroe Islands Basalt Group, Faroe Islands, NE Atlantic Ocean: Bulletin of Volcanology, v. 70, p. 139–156. Walker, R.J., Holdsworth, R.E., Imber, J., and Ellis, D., 2011a, Onshore evidence for progressive changes in rifting directions during continental break-up in the NE Atlantic: Journal of the Geological Society, v. 168, p. 27-48.
Transcript
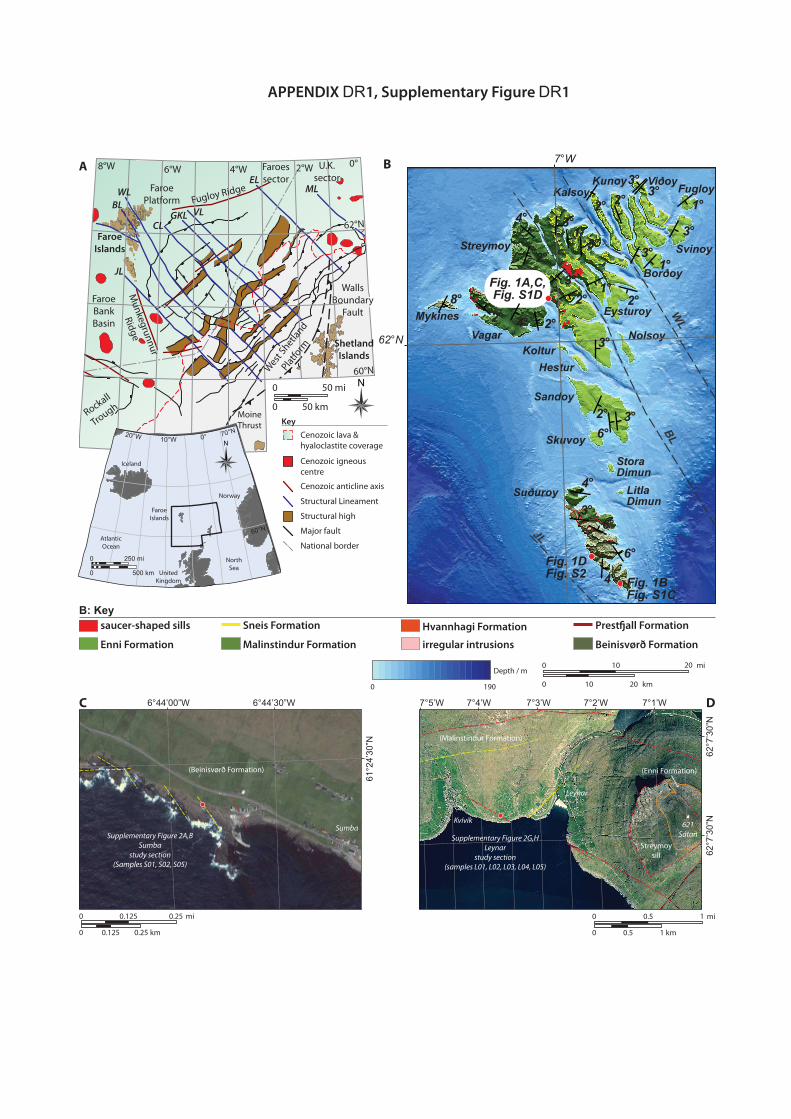
GSA DATA REPOSITORY 2013014 Walker et al. Appendix DR1. Location and sample maps Figure DR1. A: Location map and structural components of a basaltic fault zone: A:
Simplified Faroe-Shetland tectonic elements map with location of the Faroe Islands, European Atlantic margin (modified from: Ellis et al., 2009; Moy and Imber, 2009; Walker et al., 2011a). Structural lineaments are, from SW-NE: JL, Judd; BL, Brynhild; WL, Westray; CL, Clair; GKL, Grimur-Kamban; VL, Victory; EL, Erlend; ML, Magnus. B: Simplified geological map of the Faroe Islands after Passey and Bell (2007). C: Location map for the aphyric lava unit fault rock suite. D: Location map for the aphyric dyke fault rock suite.
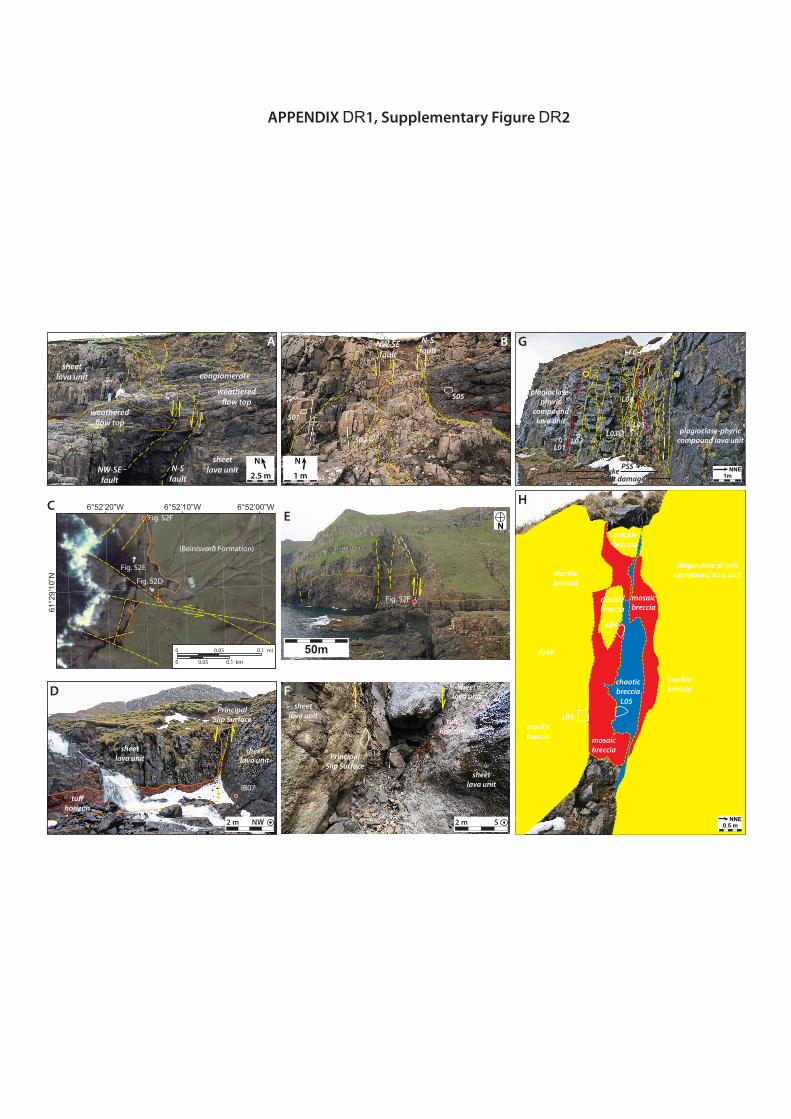
Figure DR2. A: Overview of the Sumba fault zone (location indicated in Supplementary
Figure 1C. B: Sample locations for S01 (sheet lava host rock), S02 (crackle breccia) and S05 (conglomerate host rock). C: Location map for the sheet lava I Botni (IB) samples. D: Photograph showing the location of sample IB07 (mosaic breccia). E: Overview photograph of a 30 m displacement dip slip normal fault at I Botni, as context to: F: Location of sample IB13 (cataclasite) on the principal slip surface. G: Overview of the Leynar (L) sample site, showing location of samples L01 (compound lava host rock), L02 (dyke host rock), L03 (crackle breccia), L04 (mosaic breccia) and L05 (chaotic breccia). Location shown in Supplementary Figure 1D. H: Photograph showing fault rock assemblage arrangement within the Leynar fault zone.
References Ellis, D., Passey, S.R., Jolley, D.W., and Bell, B.R. 2009. Transfer zones: The application of
new geological information from the Faroe Islands applied to the offshore exploration of intra basalt and sub-basalt strata, in Varming, T. and Ziska, H., eds., Proceedings of the 2nd Faroe Islands Exploration Conference: Annales Societatis Scientiarum Færoensis, Supplementum, v. 50, p. 174-204
Moy, D.J., and Imber, J., 2009, A critical analysis of the structure and tectonic significance of rift-oblique lineaments (‘transfer zones') in the Mesozoic–Cenozoic succession of the Faroe–Shetland Basin, NE Atlantic margin: Journal of the Geological Society of London, v. 166, p. 831-844
Passey, S.R., and Bell, B.R., 2007, Morphologies and emplacement mechanisms of the lava fl ows of the Faroe Islands Basalt Group, Faroe Islands, NE Atlantic Ocean: Bulletin of Volcanology, v. 70, p. 139–156.
Walker, R.J., Holdsworth, R.E., Imber, J., and Ellis, D., 2011a, Onshore evidence for progressive changes in rifting directions during continental break-up in the NE Atlantic: Journal of the Geological Society, v. 168, p. 27-48.
APPENDIX DR1, Supplementary Figure DR1
A
WallsBoundary
Fault
MoineThrust
FaroeIslands
JL
BLWL
CLGKL VL
MLEL
FaroePlatform Fugloy Ridge
Munkegrunnur
Ridge
West
Shetla
nd
Platfo
rm
Rockall
Trough
FaroeBankBasin
50 km0
50 mi0 N
ShetlandIslands
62°N
60°N
0°2°W4°W6°W8°W U.K.sector
Faroessector
Cenozoic lava &hyaloclastite coverage
Cenozoic igneouscentre
Cenozoic anticline axis
Structural high
Structural Lineament
Major fault
National border
Key
N
500 km0
250 mi0
10°W20°W
60°N
0° 70°N
FaroeIslands
Norway
AtlanticOcean
NorthSea
UnitedKingdom
Iceland
7°W
62°N
Viðoy
Suðuroy
Mykines
Vagar
Sandoy
Borðoy
Eysturoy
Streymoy
KalsoyKunoy
Svinoy
Fugloy
LitlaDimun
StoraDimun
Skuvoy
NolsoyKoltur
Hestur
Enni Formation Malinstindur Formation Beinisvørð Formation
For TPD permeability measurement, a sample is connected to separate upstream and downstream reservoirs that are initially at equilibrium, and only connected through the sample. One of these reservoirs is connected to a higher-pressure system via a valve, allowing the pressure to be instantaneously increased by opening and closing the valve. The sample and reservoir system are therefore isolated with a pressure difference across the sample. The pressure difference decays at a rate proportional to the permeability of the sample. Argon has been used as the pore fluid throughout the present study. The viscosity and compressibility of the pore fluid are required for permeability calculation, and since argon viscosity and compressibility are temperature and pressure dependent, these values were calculated per permeability experiment. Temperature is input by the user, as a single value for each experiment, taken from a thermometer next to the experimental apparatus. Pressure is calculated as the average of the upstream and downstream pore pressures throughout an experiment. Since compressibility varies linearly with temperature at a given pressure, the compressibility can be simply calculated by the ratio of the two for a given temperature and pressure condition.
Effective Pressure Cycling
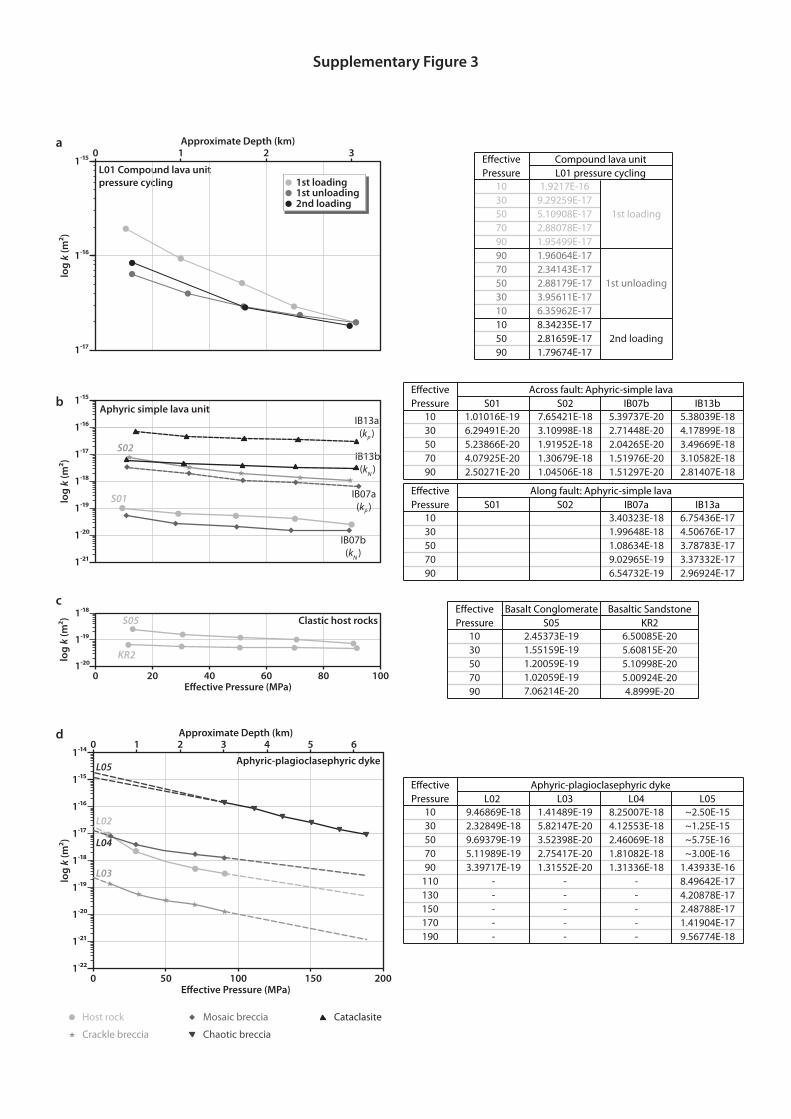
The study fault zones represent faulting at depths of 1-3 km, which are now exhumed to the surface. Exhumation reduces the effective pressure upon the rock volume, which can lead to stress-relief fracturing and an overestimation of permeability (Morrow and Lockner, 1994). Pressure cycling within the study range (i.e. 20-100 MPa confining pressure) was used here to close any stress-relief micro-fractures. During loading, permeability decreases with increasing confining pressure (Supplementary Figure 2). Permeability does not fully recover during unloading, consequently permeability at the end of the first cycle is lower than at the start. This behaviour is attributed to the initial compressive phase repairing exhumation-induced microstructural damage. Further pressure cycles closely parallel one another, and exhibit minor hysteresis that is independent of the cycle number. Pressure cycles subsequent to the first loading therefore represent the in-situ permeability, with pressure-induced elastic opening and closing of pore space effecting change in permeability. Microstructural analysis of thin sections of counterpart samples (that have not undergone laboratory pressure cycling), compared with analysis of test samples (that have undergone pressure cycling), indicates cycling has not resulted in detectable collapse of pore space, nor any new fracturing. Figure DR3. Measured experimental permeability data for the Faroe Islands fault zones and
host rocks. A: Effective pressure cycling on a compound lava unit sample, L01; Post-cycling data for (B) aphyric lava unit samples, (C) clastic host rock samples, and (D) aphyric to plagioclasephyric dyke samples.