Pharmacokinetics as applied to in vitro and animal models Pharmacokinetics Pharmacokinetics as applied as applied to to in vitro in vitro and animal models and animal models Michael R. Jacobs, MD, PhD Case Western Reserve University University Hospitals of Cleveland Cleveland, OH
Transcript
Pharmacokinetics as applied to in vitro and animal models
Pharmacokinetics Pharmacokinetics as applied as applied to to in vitroin vitro and animal modelsand animal models
Michael R. Jacobs, MD, PhDCase Western Reserve UniversityUniversity Hospitals of ClevelandCleveland, OH
TopicsTopics
In vitro pharmacodynamic models•
Post-antibiotic effects (PAE) –
effects that continue after antibiotic removal or when antibiotic concentration is subinhibitory
•
Chemostat
models –
antimicrobial effect in the presence of a varying drug concentration –
drug variation simulates variation over time of drug concentration in blood or site of infection
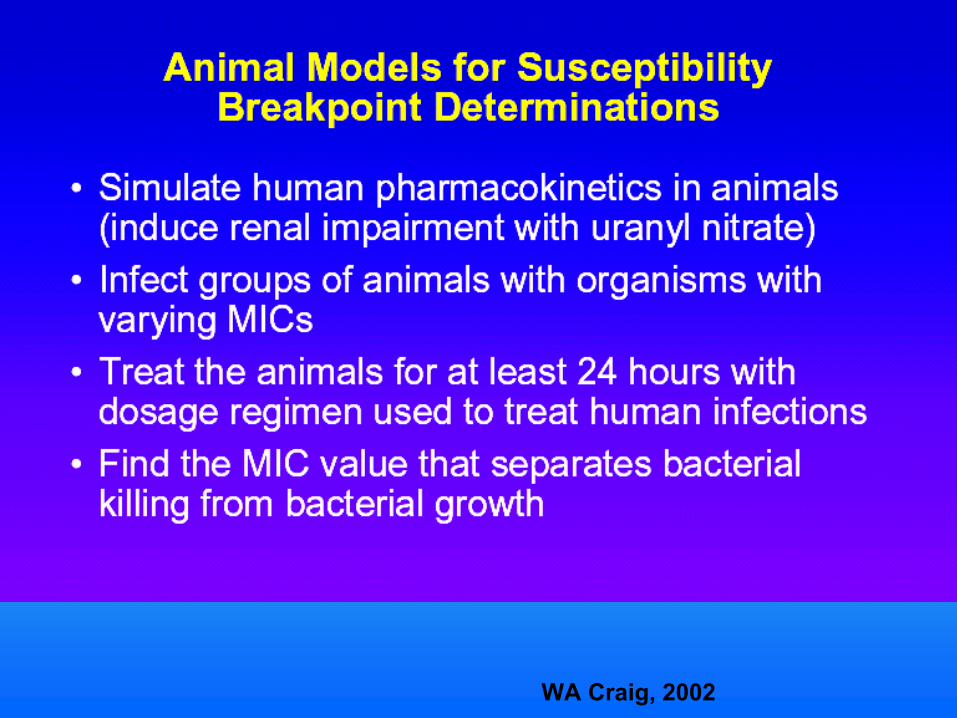
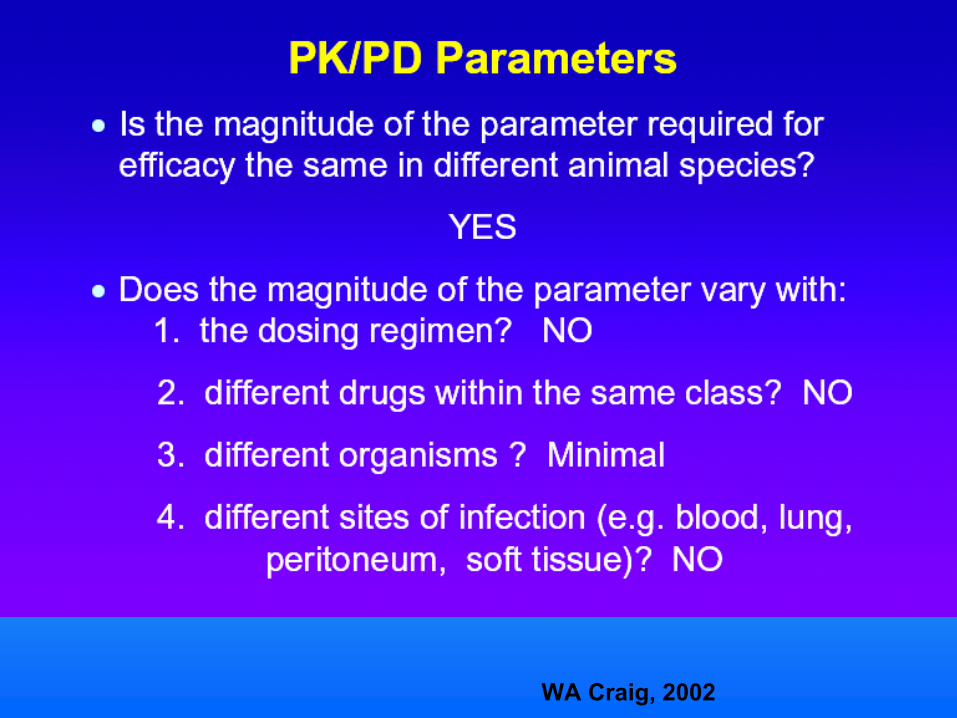
Value of animal models•
Differences between virulence of pathogens in humans vs animals
•
Difference in pharmacokinetics between humans and animals, and how these can be modified in animals
Extrapolation of results of in vitro PD models and animal models to human infections
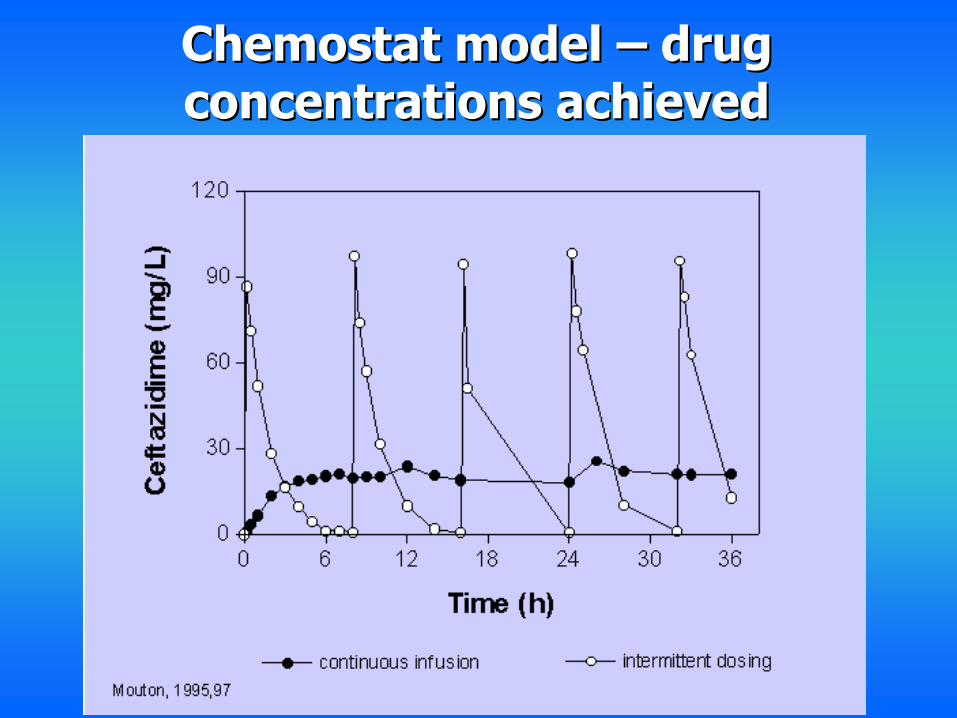
Chemostat Chemostat PK/PD modelsPK/PD modelsIn a one-compartment model the antimicrobial agent is added to a central compartment containing medium and antibioticMedium is displaced by pumping in fresh medium at a fixed rateThis simulates first order pharmacokinetic clearance and half-life and results in an exponential decrease in drug concentrationDisadvantage of this system is that bacteria are eliminated from the central compartment as well –
can be prevented using membrane
filter or compensated for mathematicallyRyback et al: Ch 3 in Antimicrobial
Pharmacodynamics
in Theory and Clinical
Prectice,
eds
Nightingale CH,
Murakawa
T, Ambrose PG. 2002. Marcel Decker, NY
P
SB
Ryback et al: Ch 3 in Antimicrobial
Pharmacodynamics
in Theory and Clinical Prectice
Chemostat Chemostat model model ––
drug drug concentrations achievedconcentrations achieved
•
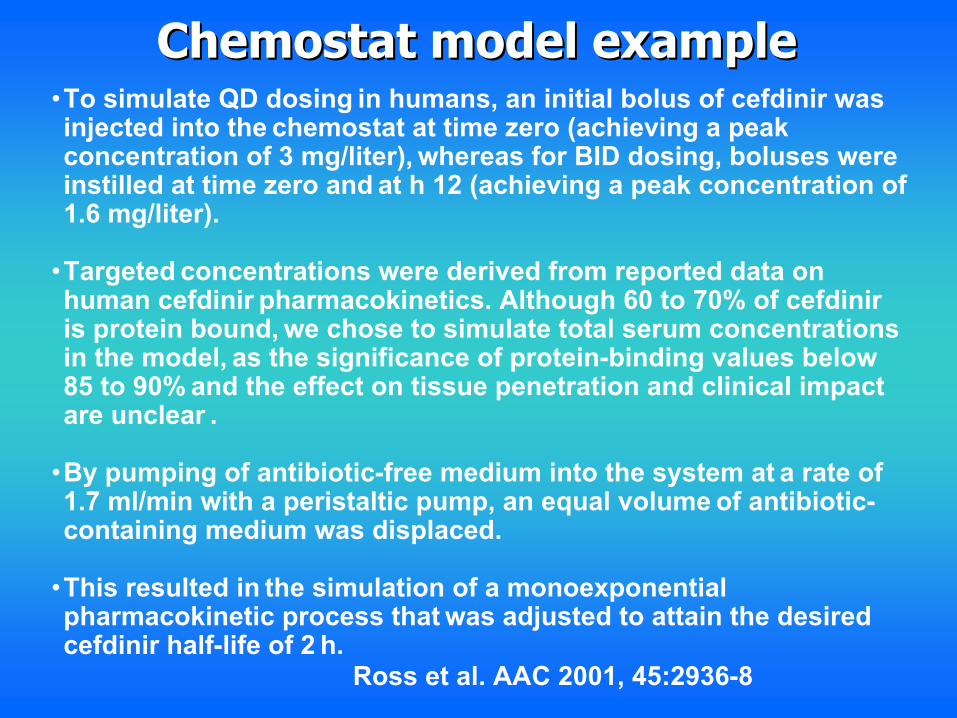
To simulate QD dosing
in humans, an initial bolus of
cefdinir
was injected into the
chemostat
at time zero (achieving a peak concentration of 3
mg/liter),
whereas for BID dosing, boluses were instilled at time zero and
at h 12
(achieving a peak concentration of 1.6
mg/liter).
•
Targeted
concentrations were derived from reported data on human
cefdinir
pharmacokinetics. Although 60
to 70% of
cefdinir
is protein bound,
we chose to simulate total serum concentrations in the model,
as the significance of protein-binding values below 85
to 90%
and the effect on tissue penetration and clinical impact are unclear
.
•
By pumping of antibiotic-free medium into the system at
a rate of 1.7
ml/min with a peristaltic pump, an equal volume
of antibiotic-
containing medium was displaced.
•
This resulted in
the simulation of a
monoexponential
pharmacokinetic process that
was adjusted to attain the desired
cefdinir
half-life of 2
h. Ross et al. AAC 2001, 45:2936-8
Chemostat Chemostat model examplemodel example
Comparison of Once-Daily versus Twice-Daily Administration of Cefdinir –
concentrations achieved in
chemostat Standard dosing –
600 mg/d or 14 mg/kg/d
0.001
0.01
0.1
1
10
-2 0 2 4 6 8 10 12 14 16 18 20 22 24
Time (h)
Con
c (u
g/m
l)
QDBID
0.120.35
Adapted from Ross et al. AAC 2001, 45:2936-8
Prediction:
For organisms with MICS of 0.25 mg/L, cefdinir
should work
BID but not QD
Prediction:
For organisms with MICS of 0.25 mg/L, cefdinir
should work
BID but not QD
HF 1746
(beta-lactamase-
producing H.
influenzae)Cefdinir MIC 0.25 mg/L
S-53 (penicillin-intermediateS.
pneumoniae) penicillin
MIC 0.25
mg/liter (D).Cefdinir
MIC 0.5 mg/L
Activity of cefdinir in chemostat at dose of 600
mg QD () and 300
mg BID () Growth controls are represented by the symbol
SP30 (penicillin-sensitiveS.
pneumoniae) penicillin
MIC <0.06 mg/liter (C).Cefdinir
MIC 0.25 mg/L
Ross et al. AAC 2001, 45:2936-8
Log 10
cfu/
ml
HF 2019
(beta-lactamase
negative H.
influenzae)Cefdinir MIC 0.25 mg/L
0.001
0.01
0.1
1
10
-2 0 2 4 6 8 10 12 14 16 18 20 22 24
Time (h)
Con
c (u
g/m
l)
BIDQD
0.120.35
Adapted from Ross et al. AAC 2001, 45:2936-8
Prediction:
For organisms with MICS of 0.25 mg/L, cefdinir
should work
BID but not QID Findings:
Cefdinir was bactericidal for 3 of 4 isolates BID and for 0/4 isolates QD
Prediction:
For organisms with MICS of 0.25 mg/L, cefdinir
should work
BID but not QID
Findings:
Cefdinir was bactericidal for 3 of 4 isolates BID and for 0/4 isolates QD
Comparison of Once-Daily versus Twice-Daily Administration of Cefdinir –
concentrations achieved in
chemostat Standard dosing –
600 mg/d or 14 mg/kg/d
CefdinirCefdinir
01020304050
60
% o
f str
ains
0.02
0.03
0.06
0.12
0.25 0.
5 1 2 4 8 16 >16
S. pneumoniae
H. influenzae
M. catarrhalis
MIC in ug/mL
Alexander Project USA 2000: S. pneumoniae (n=1362), H. influenzae (n=634),M. catarrhalis 2000 (n=206)