22
1 August 22, 2012 GSU Economic Forecasting Conference
1
August 22, 2012
GSU Economic Forecasting Conference
2
Introduction
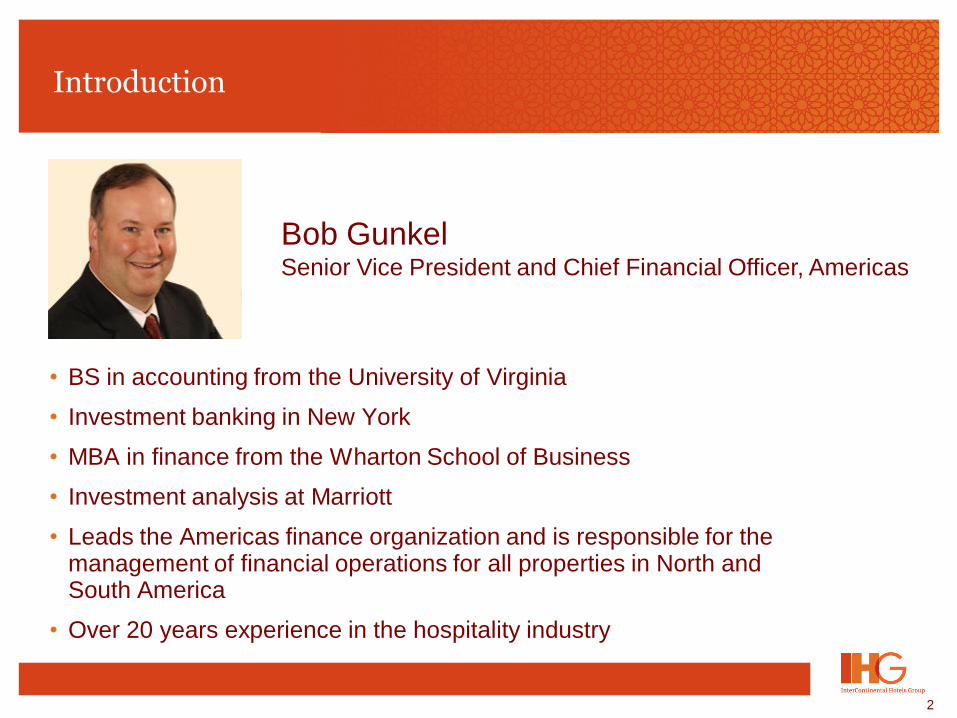
• BS in accounting from the University of Virginia
• Investment banking in New York
• MBA in finance from the Wharton School of Business
• Investment analysis at Marriott
• Leads the Americas finance organization and is responsible for the management of financial operations for all properties in North and South America
• Over 20 years experience in the hospitality industry
Bob Gunkel Senior Vice President and Chief Financial Officer, Americas
3
Agenda
1. Introduction to IHG
2. Why lodging is important to the U.S. economy and where we are in the business cycle
3. The Southeast and Atlanta’s part in the lodging industry
4. Forecasts for the future
4
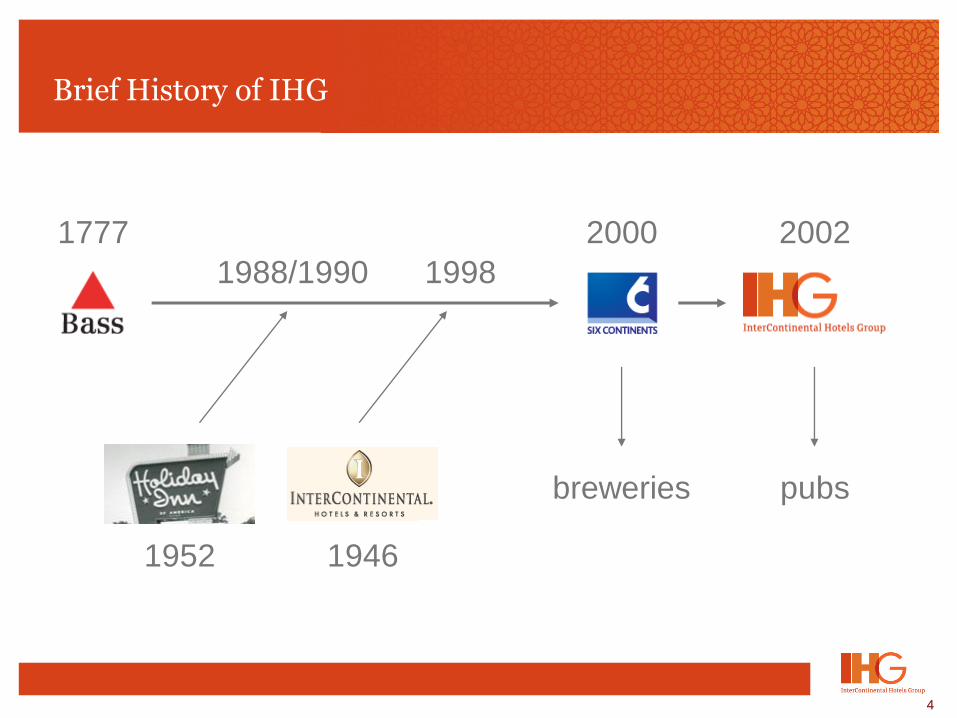
Brief History of IHG
1777
1988/1990 1998
2000 2002
breweries pubs
1946 1952
5
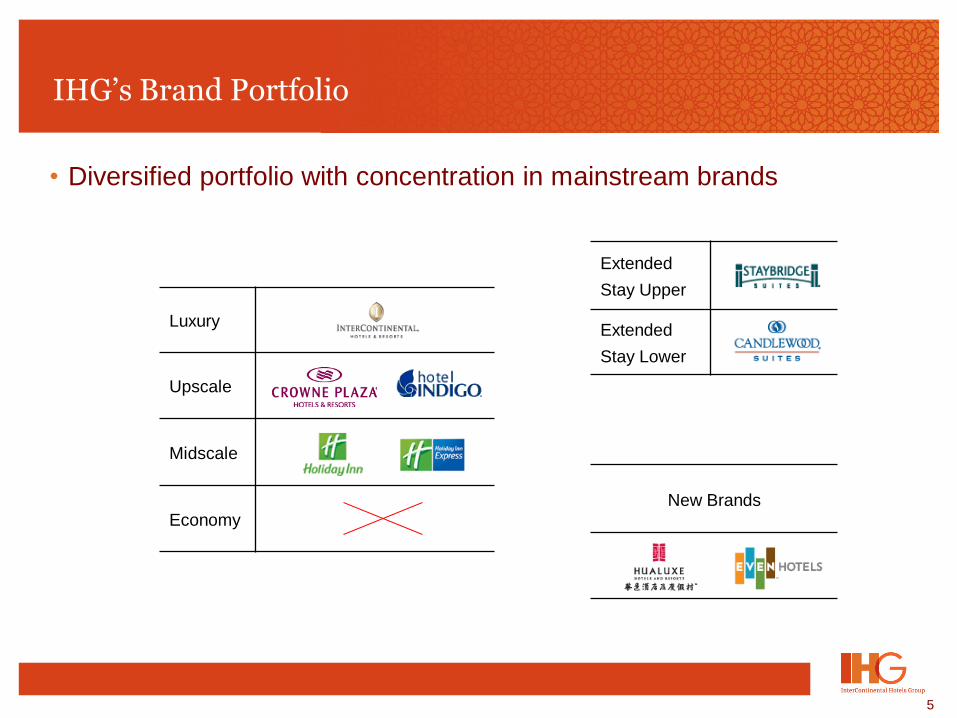
IHG’s Brand Portfolio
• Diversified portfolio with concentration in mainstream brands
New Brands
Luxury
Upscale
Midscale
Economy
Extended
Stay Upper
Extended
Stay Lower
6
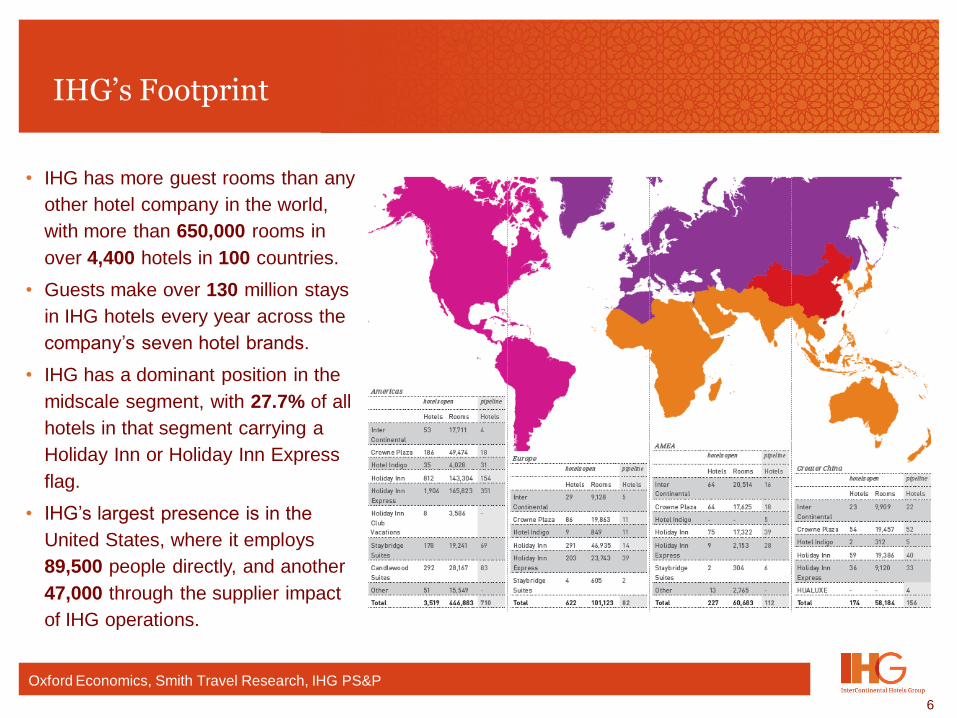
IHG’s Footprint
• IHG has more guest rooms than any
other hotel company in the world,
with more than 650,000 rooms in
over 4,400 hotels in 100 countries.
• Guests make over 130 million stays
in IHG hotels every year across the
company’s seven hotel brands.
• IHG has a dominant position in the
midscale segment, with 27.7% of all
hotels in that segment carrying a
Holiday Inn or Holiday Inn Express
flag.
• IHG’s largest presence is in the
United States, where it employs
89,500 people directly, and another
47,000 through the supplier impact
of IHG operations.
Oxford Economics, Smith Travel Research, IHG PS&P
7
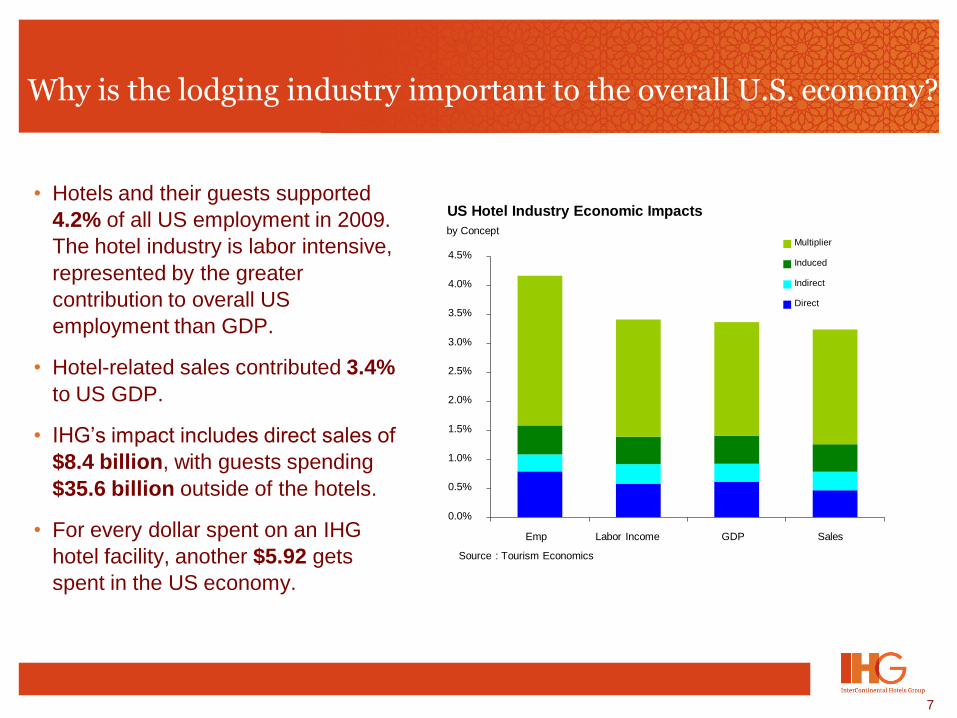
Why is the lodging industry important to the overall U.S. economy?
• Hotels and their guests supported
4.2% of all US employment in 2009.
The hotel industry is labor intensive,
represented by the greater
contribution to overall US
employment than GDP.
• Hotel-related sales contributed 3.4%
to US GDP.
• IHG’s impact includes direct sales of
$8.4 billion, with guests spending
$35.6 billion outside of the hotels.
• For every dollar spent on an IHG
hotel facility, another $5.92 gets
spent in the US economy.
0.0%
0.5%
1.0%
1.5%
2.0%
2.5%
3.0%
3.5%
4.0%
4.5%
Emp Labor Income GDP Sales
Multiplier
Induced
Indirect
Direct
US Hotel Industry Economic Impacts
by Concept
Source : Tourism Economics
8
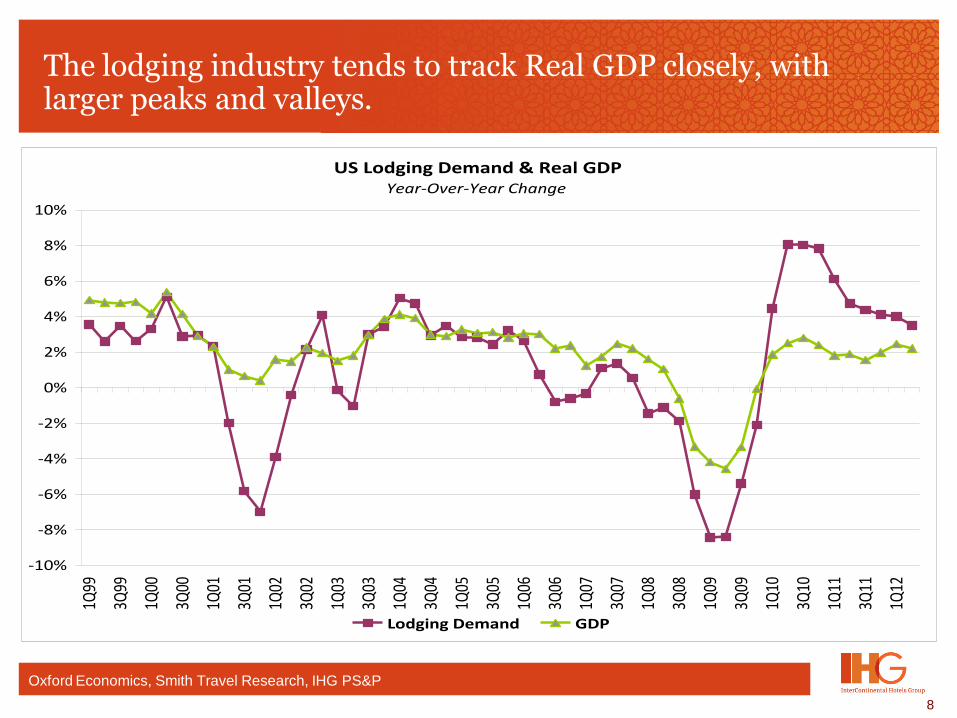
The lodging industry tends to track Real GDP closely, with larger peaks and valleys.
US Lodging Demand & Real GDPYear-Over-Year Change
-10%
-8%
-6%
-4%
-2%
0%
2%
4%
6%
8%
10%
1Q99
3Q99
1Q00
3Q00
1Q01
3Q01
1Q02
3Q02
1Q03
3Q03
1Q04
3Q04
1Q05
3Q05
1Q06
3Q06
1Q07
3Q07
1Q08
3Q08
1Q09
3Q09
1Q10
3Q10
1Q11
3Q11
1Q12
Lodging Demand GDP
Oxford Economics, Smith Travel Research, IHG PS&P
9
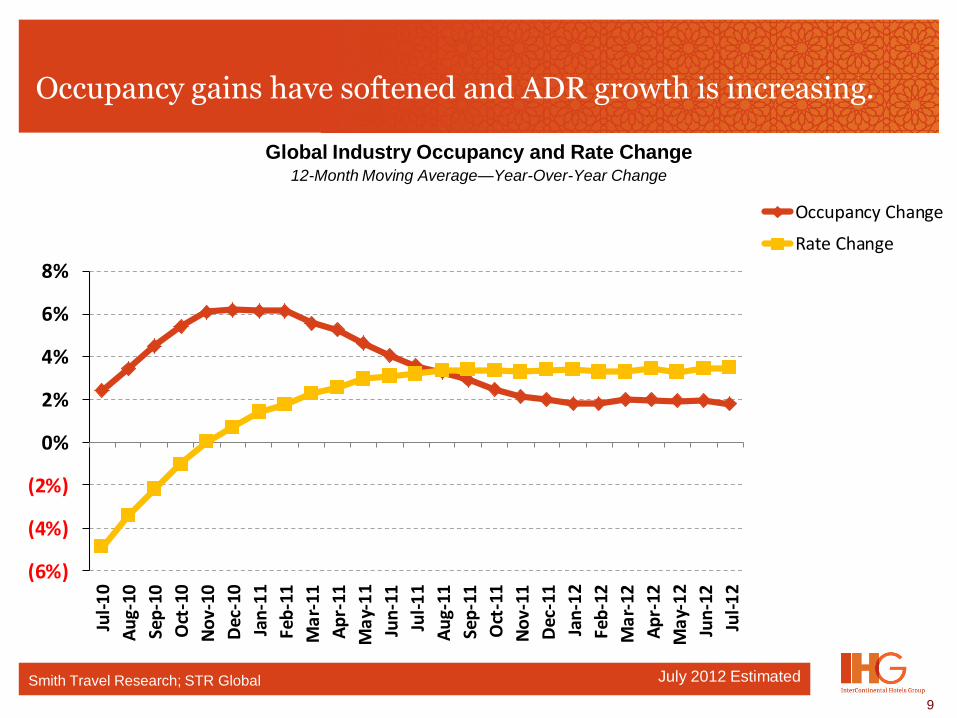
Occupancy gains have softened and ADR growth is increasing.
(6%)
(4%)
(2%)
0%
2%
4%
6%
8%
Jul-
10
Au
g-10
Sep
-10
Oct
-10
No
v-10
Dec
-10
Jan
-11
Feb
-11
Ma
r-11
Ap
r-11
Ma
y-1
1
Jun
-11
Jul-
11
Au
g-11
Sep
-11
Oct
-11
No
v-11
Dec
-11
Jan
-12
Feb
-12
Ma
r-12
Ap
r-12
Ma
y-1
2
Jun
-12
Jul-
12
Occupancy Change
Rate Change
Smith Travel Research; STR Global
Global Industry Occupancy and Rate Change 12-Month Moving Average—Year-Over-Year Change
July 2012 Estimated
10
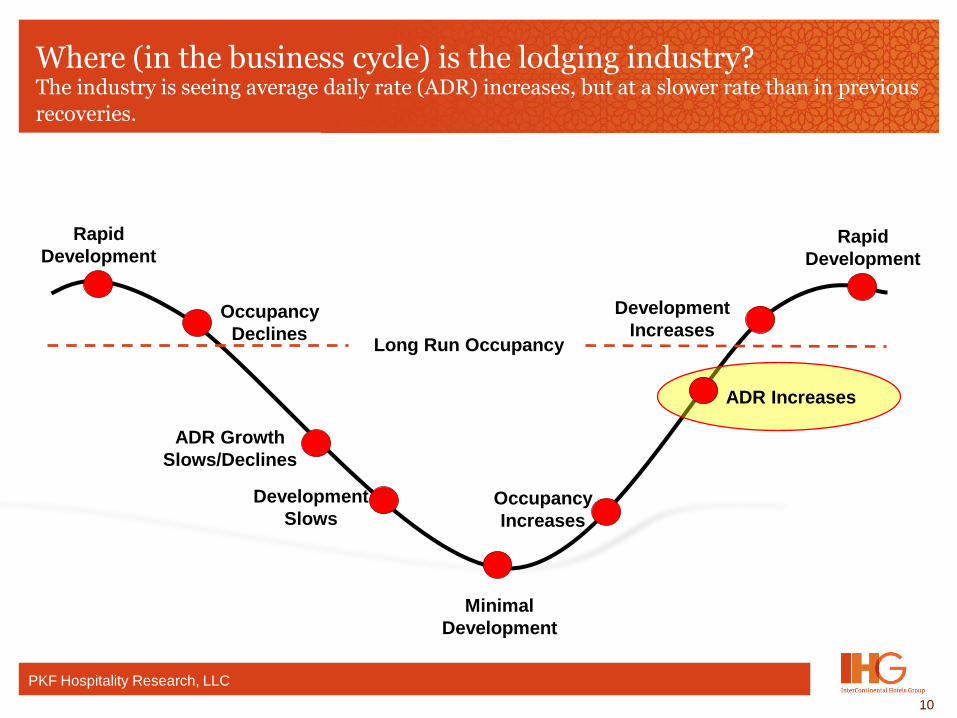
Where (in the business cycle) is the lodging industry? The industry is seeing average daily rate (ADR) increases, but at a slower rate than in previous
recoveries.
Rapid
Development
ADR Growth
Slows/Declines
Minimal
Development
Development
Increases
ADR Increases
Occupancy
Increases
Occupancy
Declines
Development
Slows
Long Run Occupancy
Rapid
Development
PKF Hospitality Research, LLC
11
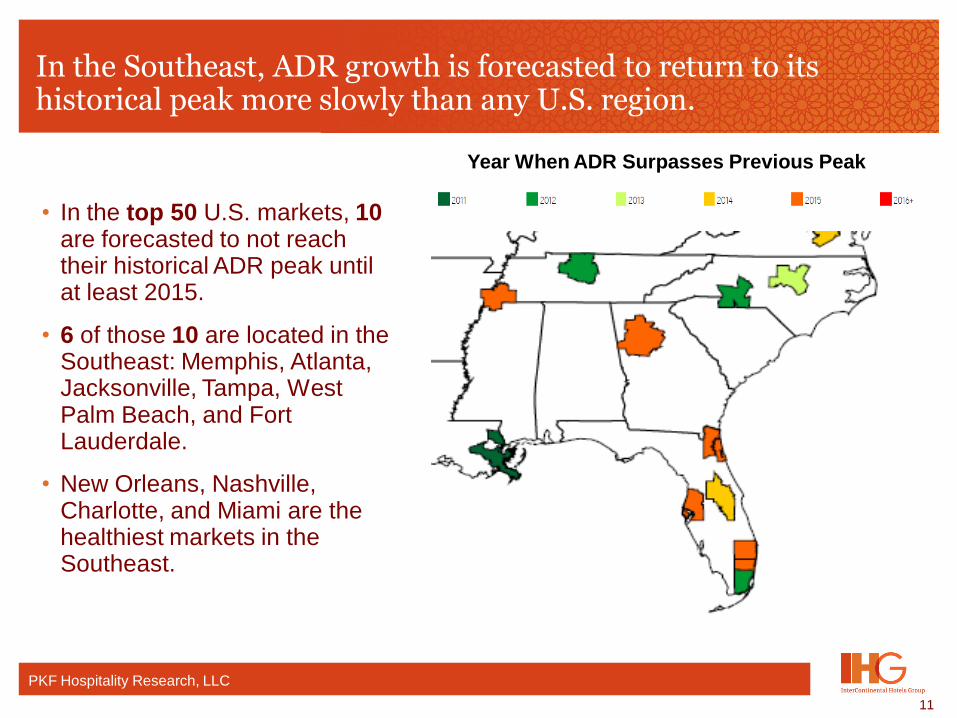
In the Southeast, ADR growth is forecasted to return to its historical peak more slowly than any U.S. region.
PKF Hospitality Research, LLC
• In the top 50 U.S. markets, 10 are forecasted to not reach their historical ADR peak until at least 2015.
• 6 of those 10 are located in the Southeast: Memphis, Atlanta, Jacksonville, Tampa, West Palm Beach, and Fort Lauderdale.
• New Orleans, Nashville, Charlotte, and Miami are the healthiest markets in the Southeast.
Year When ADR Surpasses Previous Peak
12
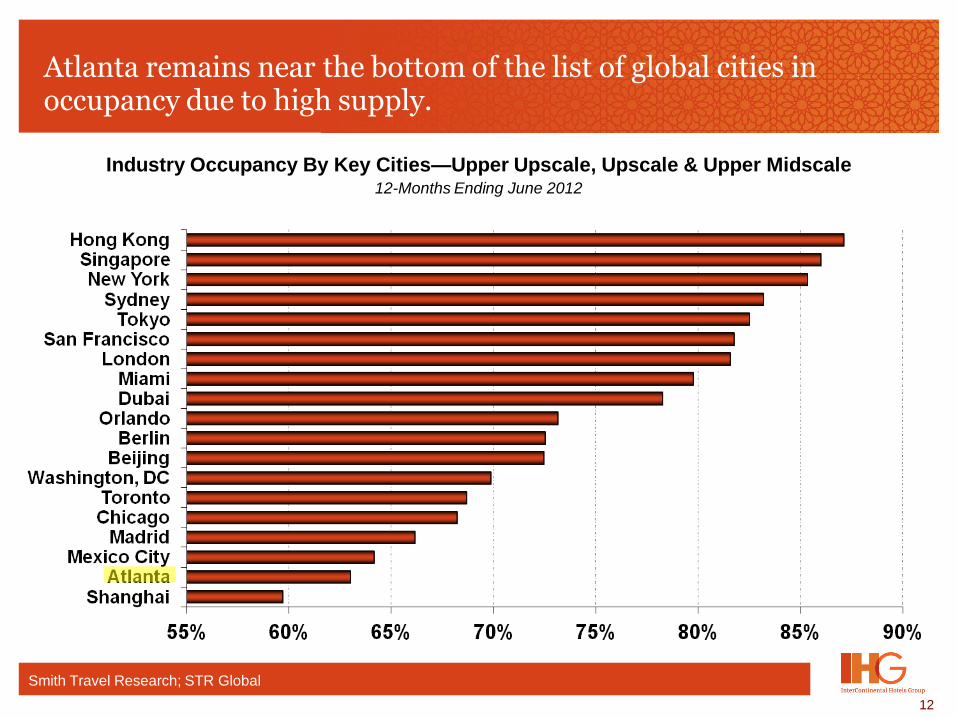
Atlanta remains near the bottom of the list of global cities in occupancy due to high supply.
Smith Travel Research; STR Global
Industry Occupancy By Key Cities—Upper Upscale, Upscale & Upper Midscale 12-Months Ending June 2012
13
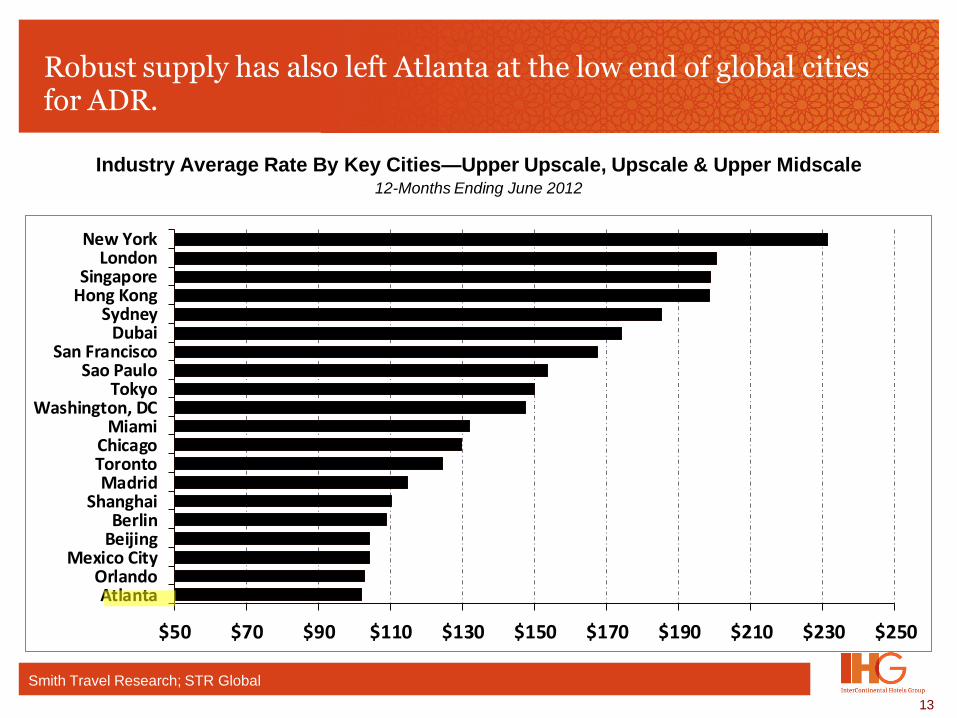
Robust supply has also left Atlanta at the low end of global cities for ADR.
Smith Travel Research; STR Global
Industry Average Rate By Key Cities—Upper Upscale, Upscale & Upper Midscale 12-Months Ending June 2012
$50 $70 $90 $110 $130 $150 $170 $190 $210 $230 $250
AtlantaOrlando
Mexico CityBeijingBerlin
ShanghaiMadrid
TorontoChicago
MiamiWashington, DC
TokyoSao Paulo
San FranciscoDubai
SydneyHong KongSingapore
LondonNew York
14
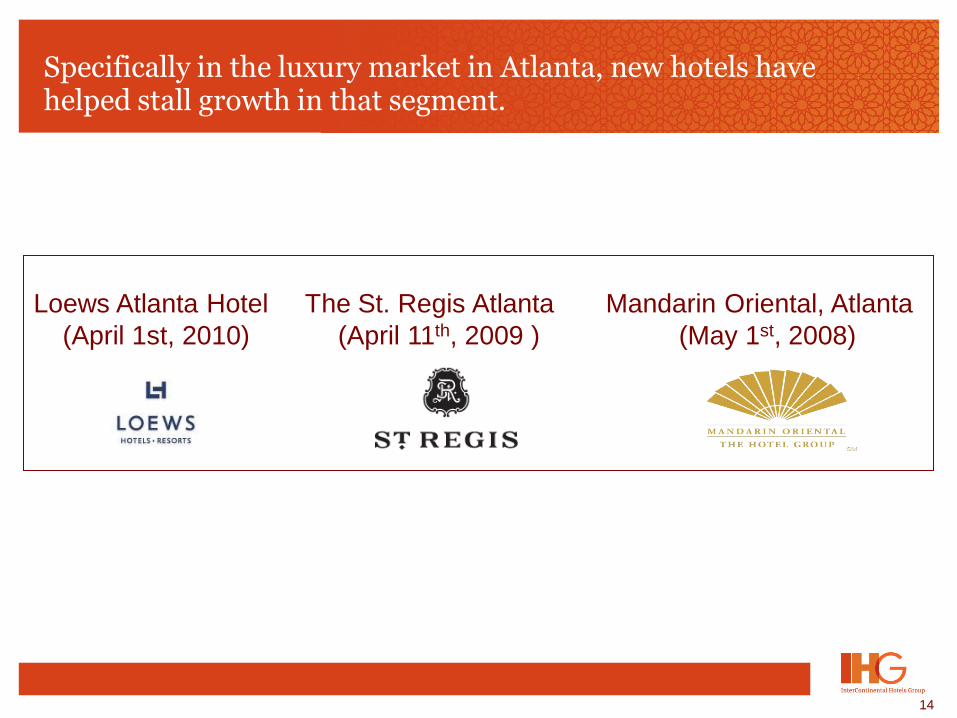
Specifically in the luxury market in Atlanta, new hotels have helped stall growth in that segment.
Loews Atlanta Hotel The St. Regis Atlanta Mandarin Oriental, Atlanta
(April 1st, 2010) (April 11th, 2009 ) (May 1st, 2008)
15
Why is much of the Southeast over-supplied (relative to other regions)?
• Pro-growth mindset
• Land availability/few “natural” barriers to entry
• Favorable zoning and entitlement process
• Good weather (longer construction “season”)
• Good airports including worldwide hub in Atlanta
(new international terminal)
• All the major brands want and need to be here
16
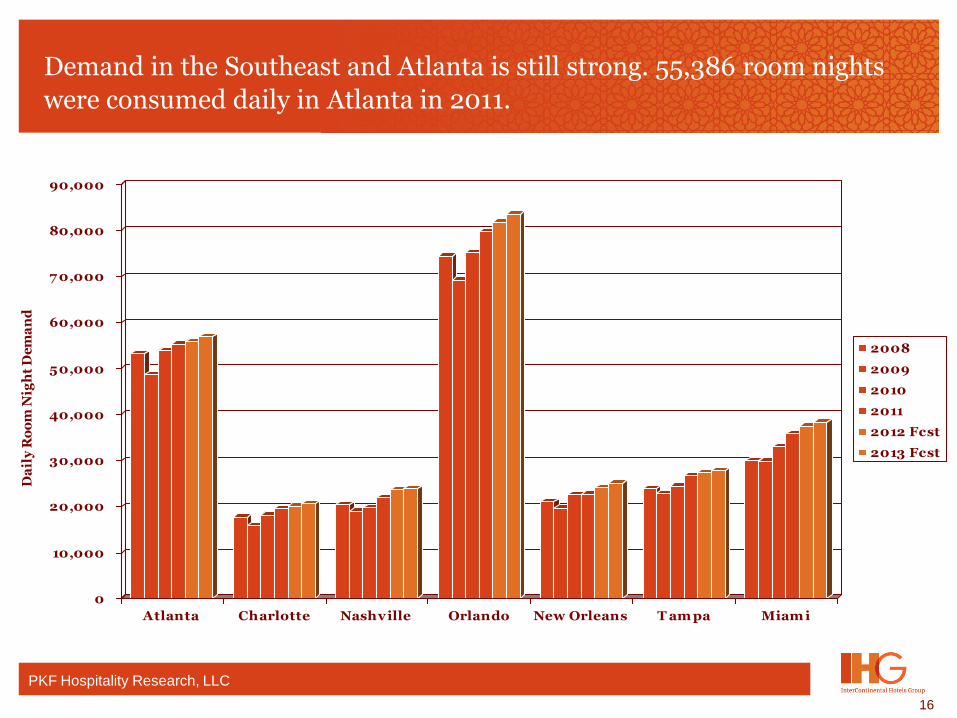
Demand in the Southeast and Atlanta is still strong. 55,386 room nights
were consumed daily in Atlanta in 2011.
PKF Hospitality Research, LLC
0
10,000
20,000
30,000
40,000
50,000
60,000
7 0,000
80,000
90,000
Da
ily
Ro
om
Nig
ht
De
ma
nd
Atlanta Charlotte Nashville Orlando New Orleans T am pa Miam i
2008
2009
2010
2011
2012 Fcst
2013 Fcst
17
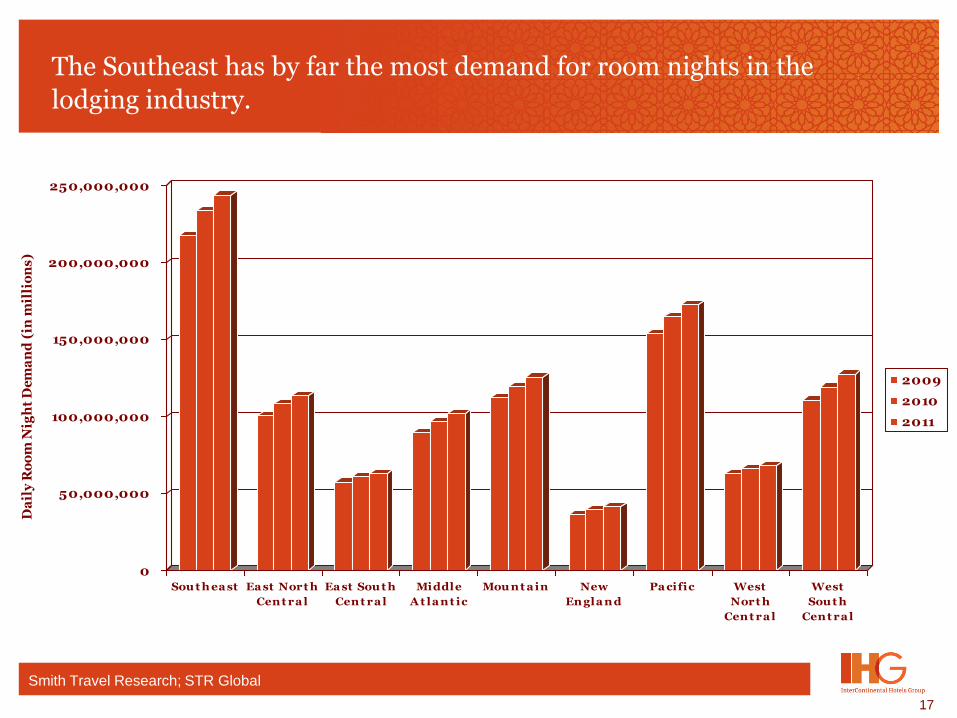
The Southeast has by far the most demand for room nights in the
lodging industry.
0
50,000,000
100,000,000
150,000,000
200,000,000
250,000,000
Da
ily
Ro
om
Nig
ht
De
ma
nd
(in
mil
lio
ns
)
Sou t h ea st Ea st Nort h
Cent ra l
Ea st Sou t h
Cent ra l
Middle
A t la nt ic
Mou nt a in New
Engla nd
Pa cific West
Nort h
Cent ra l
West
Sou t h
Cent ra l
2009
2010
2011
Smith Travel Research; STR Global
18
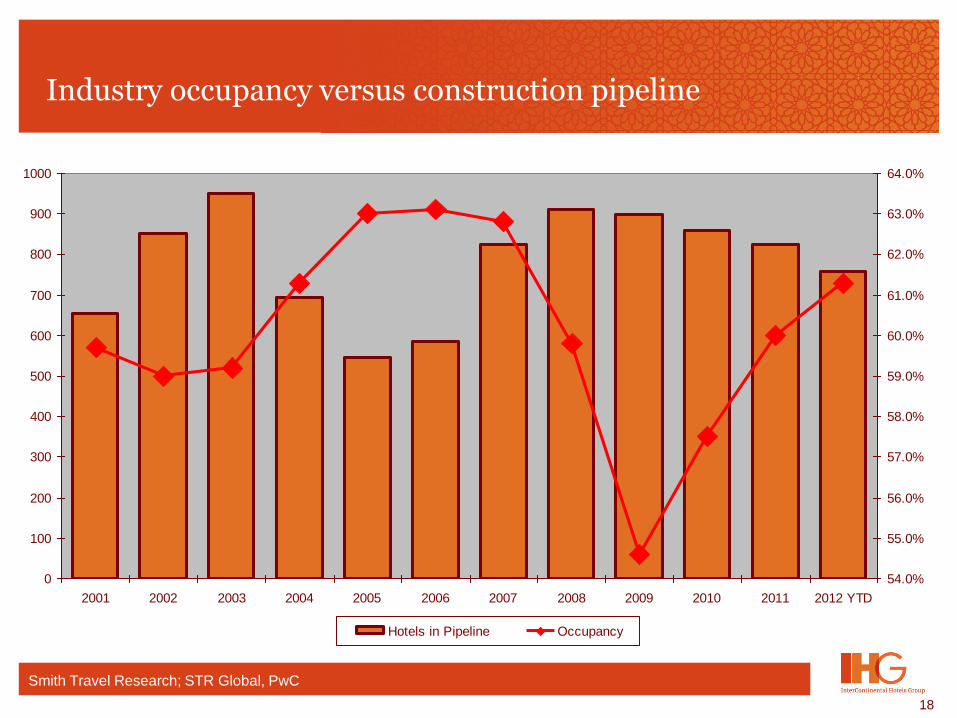
Industry occupancy versus construction pipeline
Smith Travel Research; STR Global, PwC
0
100
200
300
400
500
600
700
800
900
1000
2001 2002 2003 2004 2005 2006 2007 2008 2009 2010 2011 2012 YTD
54.0%
55.0%
56.0%
57.0%
58.0%
59.0%
60.0%
61.0%
62.0%
63.0%
64.0%
Hotels in Pipeline Occupancy
19
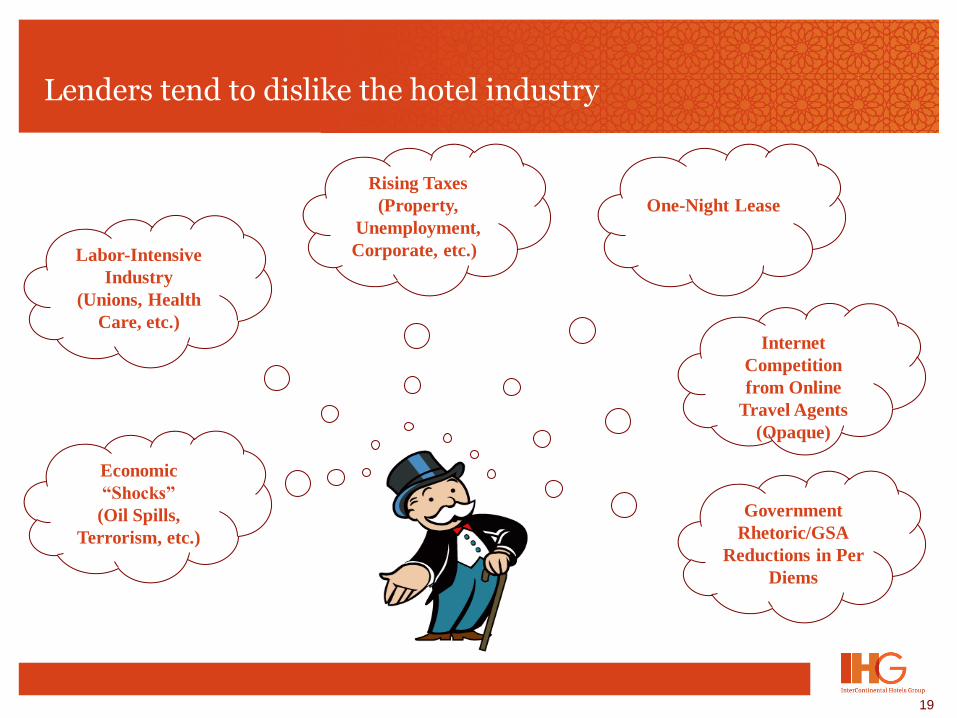
Lenders tend to dislike the hotel industry
One-Night Lease
Government
Rhetoric/GSA
Reductions in Per
Diems
Economic
“Shocks”
(Oil Spills,
Terrorism, etc.)
Rising Taxes
(Property,
Unemployment,
Corporate, etc.)
Labor-Intensive
Industry
(Unions, Health
Care, etc.)
Internet
Competition
from Online
Travel Agents
(Opaque)
20
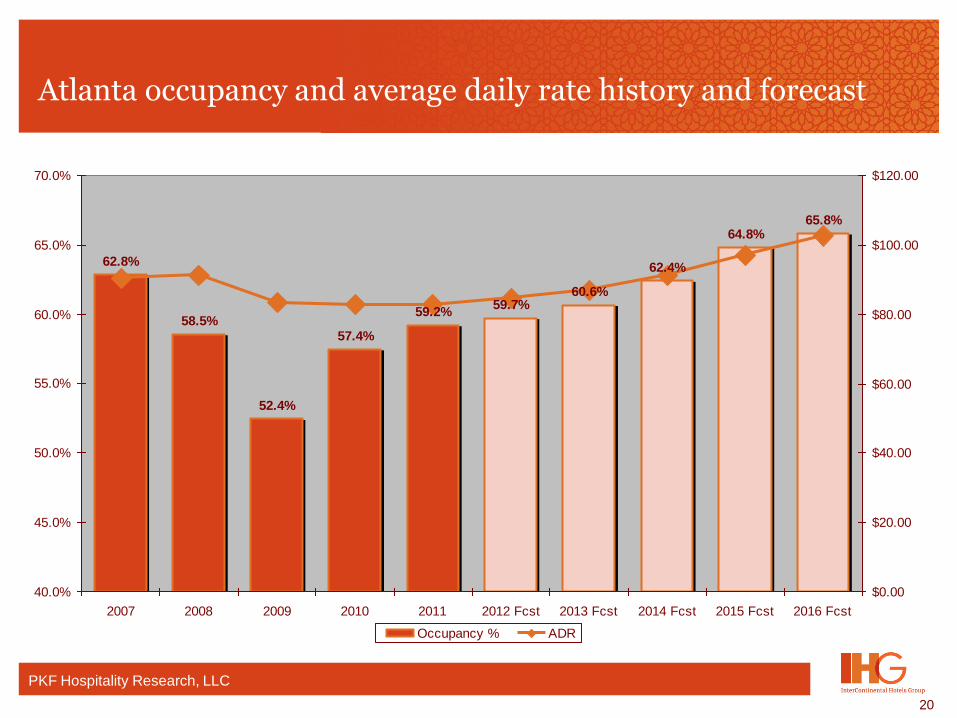
Atlanta occupancy and average daily rate history and forecast
62.8%
58.5%
52.4%
57.4%
59.2%59.7%
60.6%
62.4%
64.8%65.8%
40.0%
45.0%
50.0%
55.0%
60.0%
65.0%
70.0%
2007 2008 2009 2010 2011 2012 Fcst 2013 Fcst 2014 Fcst 2015 Fcst 2016 Fcst
$0.00
$20.00
$40.00
$60.00
$80.00
$100.00
$120.00
Occupancy % ADR
PKF Hospitality Research, LLC
21
Summary
• Lodging is a significant contributor to the U.S. economy (that cannot be off-shored or outsourced).
• The lodging industry has rebounded well since 2008.
• Atlanta is a vibrant market, but is perpetually over-supplied with available rooms.
• Slower construction growth should begin to address over-supply over the coming years.
• Very little new supply due to lender apprehension.
• Room demand forecasts for Atlanta and the Southeast are robust.

22
Questions


