1 Proceedings of ASME Turbo Expo 2014: Power for Land, Sea and Air GT2014-26771 June 16-20, 2014, Düsseldorf, Germany ENDWALL FILM COOLING USING THE STAGGERED COMBUSTOR-TURBINE GAP LEAKAGE FLOW Yang Zhang, Xin Yuan* Key Laboratory for Thermal Science and Power Engineering of Ministry of Education Tsinghua University Beijing 100084, P.R. China *Email: [email protected]ABSTRACT A key technology of gas turbine performance improvement was the increase in the turbine inlet temperature, which brought high thermal loads to the Nozzle Guide Vane (NGV) components. Strong pressure gradients in the NGVs and the complex secondary flow field had made thermal protection more challenging. As for the endwall surface near the pressure side gill region, the relatively higher local pressure and cross flow apparently decreased the film-cooling effectiveness. The aim of this investigation was to evaluate a new design, improving the film-cooling performance in a cooling blind area with upstream staggered slot, simulating the combustor-turbine leakage gap flow. The test cascades model was manufactured according to the GE-E 3 nozzle guide vane scaled model,with a scale ratio of 2.2. The experiment was performed under the inlet Mach number 0.1 and the Reynolds number 3.5×10 5 based on an axial chord length of 78 mm. The staggered slots were positioned upstream of the cascades to simulate the combustor-turbine gap leakage. The Pressure Sensitive Painting (PSP) technique was used to detect the film cooling effectiveness distribution on the endwall surface. Through the investigation, the following results could be achieved: 1 )the film-cooling effectiveness on the endwall surface downstream the slot and along the pitchwise direction increased, with the highest parameter at Z/Pitch=0.6; 2) a larger cooled region developed towards the suction side as the blowing ratio increased; 3)the advantage of the staggered slot was apparent on the endwall surface near the inlet area, while the coolant film was obviously weakened along the axial chord at a low blowing ratio. The influence of the staggered slots could only be detected in the downstream area of the endwall surface at the higher blowing ratio. INTRODUCTION The efficiency of a gas turbine increases with the increase of the turbine inlet temperature. Modern gas turbines are designed to operate at high turbine inlet temperature which is above 1600 o C, placing high thermal loads on turbine components. With adequate cooling, the lifetime of components may be extended because of lower thermal stresses on the turbine. The endwall region is considerably more difficult to cool than the blade aerofoil surfaces due to the complex secondary flow structure and strong pressure gradient in the passage. As for the film-cooling research using pressure sensitive painting (PSP), Zhang and Jaiswal [1] measured film-cooling effectiveness on a turbine vane endwall surface using the PSP technique. Using PSP, it was clear that the film-cooling effectiveness on the blade platform is strongly influenced by the platform’s secondary flow through the passage. Zhang and Moon [2] used the back-facing step to simulate the discontinuity of the nozzle inlet to the combustor exit cone. Nitrogen gas was used to simulate cooling flow as well as a tracer gas to indicate oxygen concentration, such that the film’s effectiveness by the mass transfer analogy could be obtained. An experimental study was performed by Wright et al. [3] to investigate the film-cooling effectiveness measurements by three different steady state techniques: pressure sensitive paint, temperature sensitive paint, and infrared thermography. They found that detailed distributions could be obtained in the critical area around the holes, and the true jet separation and re-attachment behaviour is captured with the PSP. Wright et al. [4] used the PSP technique to measure the film-cooling effectiveness on a turbine blade platform due to three different stator-rotor seals. Three slot configurations placed upstream of the blades were used to model advanced seals between the stator and rotor. PSP was proven to be a valuable tool in obtaining detailed film-cooling effectiveness distributions. Gao et al. [5] studied turbine blade platform film cooling with typical stator-rotor purge flow and discrete-hole film cooling. The shaped holes presented higher film-cooling effectiveness and wider film coverage than the cylindrical holes, particularly at higher blowing ratios. The detailed film-cooling effectiveness distributions on the platform were also obtained using the PSP technique. The results showed that the combined cooling scheme (slot purge- flow cooling combined with discrete-hole film cooling) was able to provide full film coverage on the platform. The measurements were obtained by Charbonnier et al. [6] applying the PSP technique to measure the coolant gas
Transcript
1
Proceedings of ASME Turbo Expo 2014: Power for Land, Sea and Air
GT2014-26771
June 16-20, 2014, Düsseldorf, Germany
ENDWALL FILM COOLING USING THE STAGGERED COMBUSTOR-TURBINE GAP LEAKAGE FLOW
Yang Zhang, Xin Yuan*
Key Laboratory for Thermal Science and Power Engineering of Ministry of Education
A key technology of gas turbine performance improvement was the increase in the turbine inlet temperature, which brought high thermal loads to the Nozzle Guide Vane (NGV) components. Strong pressure gradients in the NGVs and the complex secondary flow field had made thermal protection more challenging. As for the endwall surface near the pressure side gill region, the relatively higher local pressure and cross flow apparently decreased the film-cooling effectiveness. The aim of this investigation was to evaluate a new design, improving the film-cooling performance in a cooling blind area with upstream staggered slot, simulating the combustor-turbine leakage gap flow. The test cascades model was manufactured according to the GE-E3 nozzle guide vane scaled model,with a scale ratio of 2.2. The experiment was performed under the inlet Mach number 0.1 and the Reynolds number 3.5×10⁵ based on an axial chord length of 78 mm. The staggered slots were positioned upstream of the cascades to simulate the combustor-turbine gap leakage. The Pressure Sensitive Painting (PSP) technique was used to detect the film cooling effectiveness distribution on the endwall surface.
Through the investigation, the following results could be
achieved: 1)the film-cooling effectiveness on the endwall surface downstream the slot and along the pitchwise direction increased, with the highest parameter at Z/Pitch=0.6; 2) a larger cooled region developed towards the suction side as the blowing ratio increased; 3)the advantage of the staggered slot was apparent on the endwall surface near the inlet area, while the coolant film was obviously weakened along the axial chord at a low blowing ratio. The influence of the staggered slots could only be detected in the downstream area of the endwall surface at the higher blowing ratio.
INTRODUCTION
The efficiency of a gas turbine increases with the
increase of the turbine inlet temperature. Modern gas turbines are designed to operate at high turbine inlet temperature which is above 1600oC, placing high thermal loads on turbine
components. With adequate cooling, the lifetime of components may be extended because of lower thermal stresses on the turbine. The endwall region is considerably more difficult to cool than the blade aerofoil surfaces due to the complex secondary flow structure and strong pressure gradient in the passage.
As for the film-cooling research using pressure sensitive
painting (PSP), Zhang and Jaiswal [1] measured film-cooling effectiveness on a turbine vane endwall surface using the PSP technique. Using PSP, it was clear that the film-cooling effectiveness on the blade platform is strongly influenced by the platform’s secondary flow through the passage. Zhang and Moon [2] used the back-facing step to simulate the discontinuity of the nozzle inlet to the combustor exit cone. Nitrogen gas was used to simulate cooling flow as well as a tracer gas to indicate oxygen concentration, such that the film’s effectiveness by the mass transfer analogy could be obtained. An experimental study was performed by Wright et al. [3] to investigate the film-cooling effectiveness measurements by three different steady state techniques: pressure sensitive paint, temperature sensitive paint, and infrared thermography. They found that detailed distributions could be obtained in the critical area around the holes, and the true jet separation and re-attachment behaviour is captured with the PSP. Wright et al. [4] used the PSP technique to measure the film-cooling effectiveness on a turbine blade platform due to three different stator-rotor seals. Three slot configurations placed upstream of the blades were used to model advanced seals between the stator and rotor. PSP was proven to be a valuable tool in obtaining detailed film-cooling effectiveness distributions. Gao et al. [5] studied turbine blade platform film cooling with typical stator-rotor purge flow and discrete-hole film cooling. The shaped holes presented higher film-cooling effectiveness and wider film coverage than the cylindrical holes, particularly at higher blowing ratios. The detailed film-cooling effectiveness distributions on the platform were also obtained using the PSP technique. The results showed that the combined cooling scheme (slot purge-flow cooling combined with discrete-hole film cooling) was able to provide full film coverage on the platform. The measurements were obtained by Charbonnier et al. [6] applying the PSP technique to measure the coolant gas
2
concentration. An engine representative density ratio between the coolant and the external hot gas flow was achieved by the injection of CO2. The studies of the incidence angle effect on the flow field and heat transfer were also performed by researchers. Gao et al. [7] studied the influence of the incidence angle on the film-cooling effectiveness for a cutback squealer blade tip. Three incidence angles were investigated 0 degree at the design condition and ±5 degree at the off-design conditions. Based on the mass transfer analogy, the film-cooling effectiveness is measured with PSP techniques. It was observed that the incidence angle affected the coolant jet direction on the pressure side near tip region and the blade tip. The film-cooling effectiveness distribution was also altered.
As for blade endwall platform film-cooling research,
Yang et al. [8] used numerical simulation to predict the film-cooling effectiveness and heat transfer coefficient distributions on a rotating blade platform with stator-rotor purge flow and downstream discrete film-hole flows in a 1–1/2 turbine stage. The effect of the turbine work process on the film-cooling effectiveness and the associated heat transfer coefficients had been reported. The research by Kost and Mullaert [9] indicates that both the leakage flow of endwall upstream slots and the film-cooling ejection were strongly influenced by the endwall pressure distribution. The leakage flow and the film-cooling ejection would move towards the low pressure region where high film-cooling effectiveness was captured. The influence of the pressure distribution could also explain why the suction side is cooled better than the pressure side. Another important factor is the passage vortex moved by the pressure gradient in the cascade. It could lead the coolant to move towards the suction side. Similar results were found in the research report by Papa et al. [10]. They captured the phantom cooling phenomenon on the rotor blade suction side and the coolant was ejected form an upstream slot. The paper indicates that the coolant from the endwall would move towards the suction side and then form a triangular cooled area.
Measurements were obtained by Charbonnier et al. [11]
applying the PSP technique to measure the coolant gas concentration. An engine representative density ratio between the coolant and the external hot gas flow was achieved by the injection of CO2. The effects of rotation on platform film cooling had been investigated by Suryanarayanan et al. [12] who found that secondary flow from the blade pressure surface to the suction surface was strongly affected by the rotational motion causing the coolant traces from the holes to clearly flow towards the suction side surface. As for the investigations into combustor–turbine leakage flow, Thole’s group had made significant contributions. With investigations on a thorough and profound level, the influence of slot shape and position as well as width, had been analysed in a series of literature materials [13–15].
Oke and Simon [16] had investigated the film-cooling
flow introduced through two successive rows of slots, a single row of slots and slots that have particular area distributions in the pitchwise direction. Wright et al. [17] used a 30 degree
inclined slot upstream of the blades to model the seal between the stator and rotor. Twelve discrete film holes were located on the downstream half of the platform for additional cooling. Rehder and Dannhauer [18] experimentally investigated the influence of turbine leakage flows on the three-dimensional flow field and endwall heat transfer. In the experiment, pressure distribution measurements provided information about the endwall and vane surface pressure field and their variation with leakage flow. Additionally, streamline patterns (local shear stress directions) on the walls were detected by oil flow visualization. Piggush and Simon [19] investigated the leakage flow and misalignment effects on the endwall heat transfer coefficients within a passage which had one axially contoured and one straight endwall. The paper documented that leakage flows through such gaps within the passage could affect endwall boundary layers and induce additional secondary flows and vortex structures in the passage near the endwall.
Some recent research using PSP technology had
enlarged the horizon of endwall film cooling experiment. Zhang and Moon [20] measured film-cooling effectiveness on a turbine blade platform surface using the PSP technique. They compared two kinds of axisymmetric platform profiles, dolphin nose and shark nose. The results indicated that although the pattern of the film effectiveness distribution was quite different, the dolphin nose profile resulted in slightly higher overall film effectiveness. Krueckels et al. [21] measured film-cooling effectiveness on a turbine vanes endwall surface using the liquid crystal measurement technique. They considered the upstream gap (corresponding to the gap between the combustor and turbine) and the purge air exiting this gap in the investigations. The results had shown that the effect of the purge air needed to be taken into account for the layout of the cooling scheme. Zhang et al. [22] compared film-cooling effectiveness of two models of compound angle shaped holes on a turbine nozzle suction side surface using PSP technique, one with a compound angle in co-flow and the other in counter-flow direction to the cooling supply. The effect of the direction of the compound angle was found to be less significant compared to the compound angle effect. Liu et al. [23] used three foreign gases N2 for low density, CO2 for medium density, and a mixture of SF6 and Argon for high density to study the effect of coolant density. The film cooling increased as the density ratio increased. The reason was that greater coolant to mainstream density ratio resulted in lower coolant-to-mainstream momentum and prevented coolant to lift off.
Past research has shown that strong secondary flow can
result in changes to the local heat transfer on the endwall and platform. Many studies have investigated the effects of the blowing ratio or geometry on the endwall film cooling, indicating the flow field parameter could apparently change the injection flow trace. Few studies, however, have considered the influence of complex slot geometry on endwall film cooling. To help fill this gap, the current paper discusses the effect of leakage flow from staggered slot on the film cooling of a nozzle guide vane endwall. The factor of the blowing ratio is also considered.
3
EXPERIMENTAL METHODOLOGY
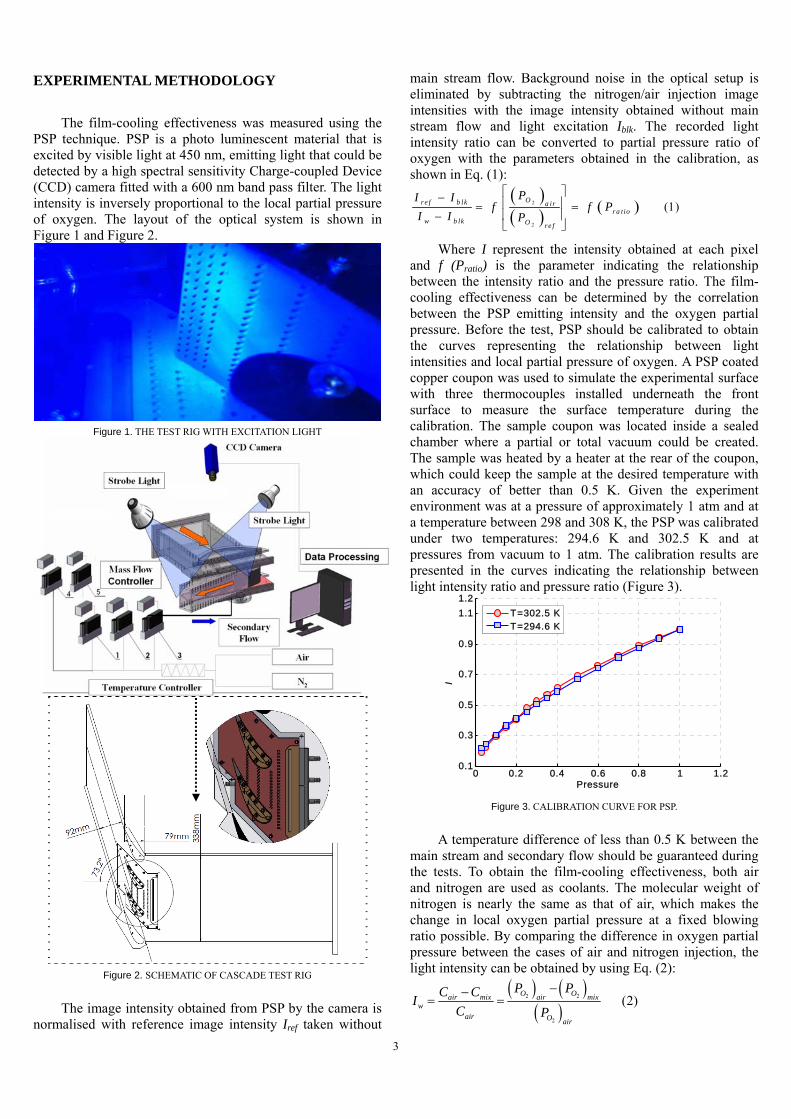
The film-cooling effectiveness was measured using the PSP technique. PSP is a photo luminescent material that is excited by visible light at 450 nm, emitting light that could be detected by a high spectral sensitivity Charge-coupled Device (CCD) camera fitted with a 600 nm band pass filter. The light intensity is inversely proportional to the local partial pressure of oxygen. The layout of the optical system is shown in Figure 1 and Figure 2.
Figure 1. THE TEST RIG WITH EXCITATION LIGHT
Figure 2. SCHEMATIC OF CASCADE TEST RIG
The image intensity obtained from PSP by the camera is normalised with reference image intensity Iref taken without
main stream flow. Background noise in the optical setup is eliminated by subtracting the nitrogen/air injection image intensities with the image intensity obtained without main stream flow and light excitation Iblk. The recorded light intensity ratio can be converted to partial pressure ratio of oxygen with the parameters obtained in the calibration, as shown in Eq. (1):
2
2
(1)Or e f b lk a ir
r a tiow b lk O r e f
PI If f P
I I P
Where I represent the intensity obtained at each pixel and f (Pratio) is the parameter indicating the relationship between the intensity ratio and the pressure ratio. The film-cooling effectiveness can be determined by the correlation between the PSP emitting intensity and the oxygen partial pressure. Before the test, PSP should be calibrated to obtain the curves representing the relationship between light intensities and local partial pressure of oxygen. A PSP coated copper coupon was used to simulate the experimental surface with three thermocouples installed underneath the front surface to measure the surface temperature during the calibration. The sample coupon was located inside a sealed chamber where a partial or total vacuum could be created. The sample was heated by a heater at the rear of the coupon, which could keep the sample at the desired temperature with an accuracy of better than 0.5 K. Given the experiment environment was at a pressure of approximately 1 atm and at a temperature between 298 and 308 K, the PSP was calibrated under two temperatures: 294.6 K and 302.5 K and at pressures from vacuum to 1 atm. The calibration results are presented in the curves indicating the relationship between light intensity ratio and pressure ratio (Figure 3).
0 0.2 0.4 0.6 0.8 1 1.20.1
0.3
0.5
0.7
0.9
1.1
1.2
Pressure
I
T=302.5 KT=294.6 K
Figure 3. CALIBRATION CURVE FOR PSP.
A temperature difference of less than 0.5 K between the main stream and secondary flow should be guaranteed during the tests. To obtain the film-cooling effectiveness, both air and nitrogen are used as coolants. The molecular weight of nitrogen is nearly the same as that of air, which makes the change in local oxygen partial pressure at a fixed blowing ratio possible. By comparing the difference in oxygen partial pressure between the cases of air and nitrogen injection, the light intensity can be obtained by using Eq. (2):
2 2
2
(2)O Oair mix air mix
wair O air
P PC CI
C P
4
The dimensionless temperature downstream of the cooling holes could be obtained using the mass and heat transfer analogy, as defined in Eq. (3):
2 2 2 2
2 2 22
(3)O O O Omix air air mix
wc O O ON air air
P P P PT TI
T T P P P
The adiabatic wall temperature is reflected by the film-cooling effectiveness, which is used as a dimensionless parameter, defined as Eq. (4), for low speed and constant property flows.
(4)aw
c c
T T T TI
T T T T
EXPERIMENTAL FACILITY
The test section consists of an inlet duct, a linear turbine cascade, and an exhaust section. The inlet duct has a cross section of 338 mm wide and 129 mm high. Not considering the ununiform effect of the outlet flow field of the combustor, the incidence angle was not selected to be the variable in the experiment. The predominant vortex in the combustor made the velocity direction in the outlet section difficult to predict. The position of the stagnation point is strongly affected by the indefinite inlet flow angle, and then in turn changes the leading edge and gill region film-cooling effectiveness distribution. During the test, the cascade inlet air velocity was maintained at 35 m/s for all the inlet flow conditions, corresponding to a Mach number of 0.1. A two times scale model of the GE-E3 guide vanes with a blade span of 129 mm and an axial chord length of 79 mm was used. For coolant air supply, compressed air is delivered to plenums located below the wind tunnel test section before being injected into the main stream, as shown in the schematic diagrams in Figure 4.
Figure 4. THE TEST SECTION WITH CHANGEABLE SLOT MODULE AND THE
ASSEMBLY DRAWING OF THE TEST SECTION
Past studies in the open literature have shown that the passage cross flow sweeps the film coolant from endwall to mid-span region due to the vortex in the passage. To reflect this phenomenon more apparently, all of the film-cooling holes are positioned in straight lines. Studies on the flat plates show that coolant from compound angle holes covers a wider
area due to jet deflection. Four rows of radial cylindrical film-cooling holes are arranged on the gill region to form full covered coolant film. Figures 5–8 show the cooling hole configurations and the geometric parameters of the blade.
Four rows of compound angle laidback fan-shaped holes are arranged on the endwall to form a full covered coolant film. Figure 7 shows the hole configurations and the blade’s geometric parameters. The first row is located upstream of the leading edge plane. The following three rows are evenly positioned inside the vane channel, with the last one located at 65% of the axial chord, downstream of the leading edge plane. The four rows of fan-shaped holes are inclined 30 degree to the platform surface and held at an angle of 0, 30, 45 and 60 degree to axial direction respectively. The laidback fan-shaped holes are featured with a lateral expansion of 10 degree from the hole-axis and forward expansion of 10 degree into the endwall surface, as shown in Figure 6. The diameter in the metering part (cylindrical part) of the shaped holes is 1 mm, and the expansion starts at 3D. Four coolant cavities are used for the four rows of holes respectively, as shown in Figure 7. (The extra coolant plenum chamber is designed to simulate the purge flow which is used as leakage flow supply in this experiment). The coolant supplied to each cavity is independently controlled by a rotameter dedicated to that cavity.
Figure 5. THE COOLANT SUPPLY PLENUM
Figure 6. THE STAGGERED SLOT AT THE ENDWALL INLET REGION
5
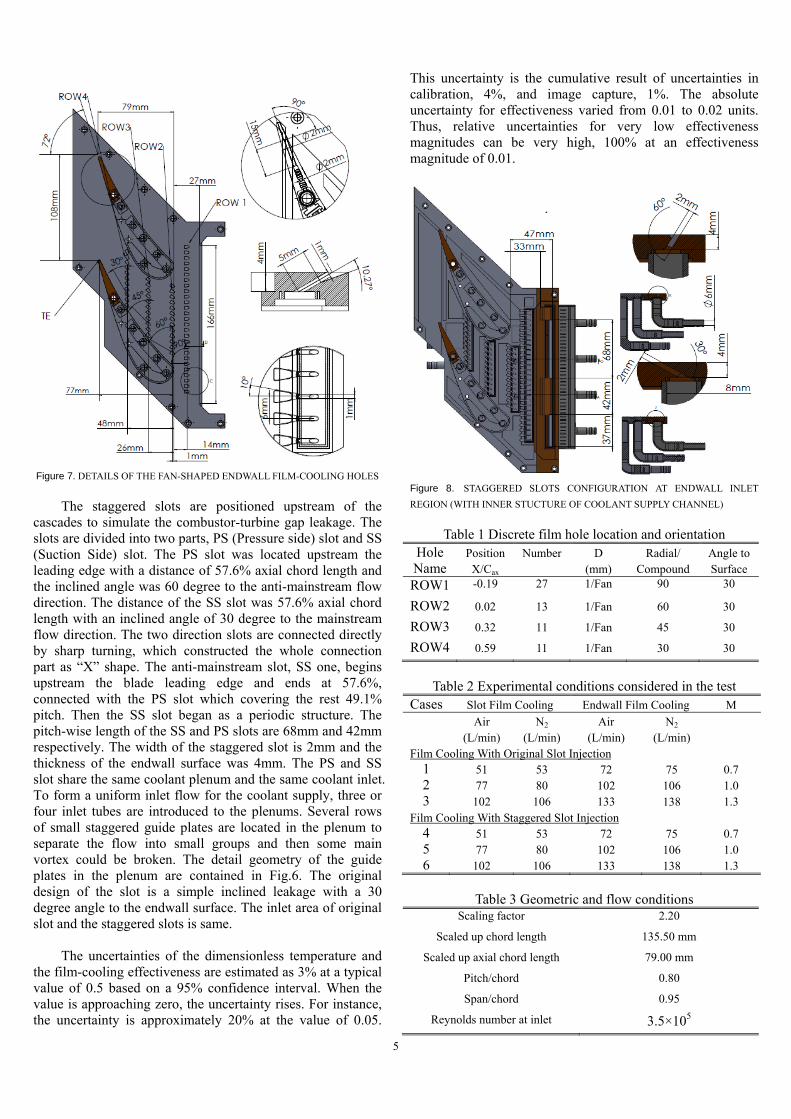
Figure 7. DETAILS OF THE FAN-SHAPED ENDWALL FILM-COOLING HOLES
The staggered slots are positioned upstream of the cascades to simulate the combustor-turbine gap leakage. The slots are divided into two parts, PS (Pressure side) slot and SS (Suction Side) slot. The PS slot was located upstream the leading edge with a distance of 57.6% axial chord length and the inclined angle was 60 degree to the anti-mainstream flow direction. The distance of the SS slot was 57.6% axial chord length with an inclined angle of 30 degree to the mainstream flow direction. The two direction slots are connected directly by sharp turning, which constructed the whole connection part as “X” shape. The anti-mainstream slot, SS one, begins upstream the blade leading edge and ends at 57.6%, connected with the PS slot which covering the rest 49.1% pitch. Then the SS slot began as a periodic structure. The pitch-wise length of the SS and PS slots are 68mm and 42mm respectively. The width of the staggered slot is 2mm and the thickness of the endwall surface was 4mm. The PS and SS slot share the same coolant plenum and the same coolant inlet. To form a uniform inlet flow for the coolant supply, three or four inlet tubes are introduced to the plenums. Several rows of small staggered guide plates are located in the plenum to separate the flow into small groups and then some main vortex could be broken. The detail geometry of the guide plates in the plenum are contained in Fig.6. The original design of the slot is a simple inclined leakage with a 30 degree angle to the endwall surface. The inlet area of original slot and the staggered slots is same.
The uncertainties of the dimensionless temperature and
the film-cooling effectiveness are estimated as 3% at a typical value of 0.5 based on a 95% confidence interval. When the value is approaching zero, the uncertainty rises. For instance, the uncertainty is approximately 20% at the value of 0.05.
This uncertainty is the cumulative result of uncertainties in calibration, 4%, and image capture, 1%. The absolute uncertainty for effectiveness varied from 0.01 to 0.02 units. Thus, relative uncertainties for very low effectiveness magnitudes can be very high, 100% at an effectiveness magnitude of 0.01.
Figure 8. STAGGERED SLOTS CONFIGURATION AT ENDWALL INLET
REGION (WITH INNER STUCTURE OF COOLANT SUPPLY CHANNEL)
Table 1 Discrete film hole location and orientation
Hole Name
PositionX/Cax
Number D (mm)
Radial/ Compound
Angle to Surface
ROW1 -0.19 27 1/Fan 90 30
ROW2 0.02 13 1/Fan 60 30
ROW3 0.32 11 1/Fan 45 30
ROW4 0.59 11 1/Fan 30 30
Table 2 Experimental conditions considered in the test
Cases Slot Film Cooling Endwall Film Cooling M
Air (L/min)
N2
(L/min) Air
(L/min) N2
(L/min)
Film Cooling With Original Slot Injection 1 51 53 72 75 0.7 2 77 80 102 106 1.0 3 102 106 133 138 1.3
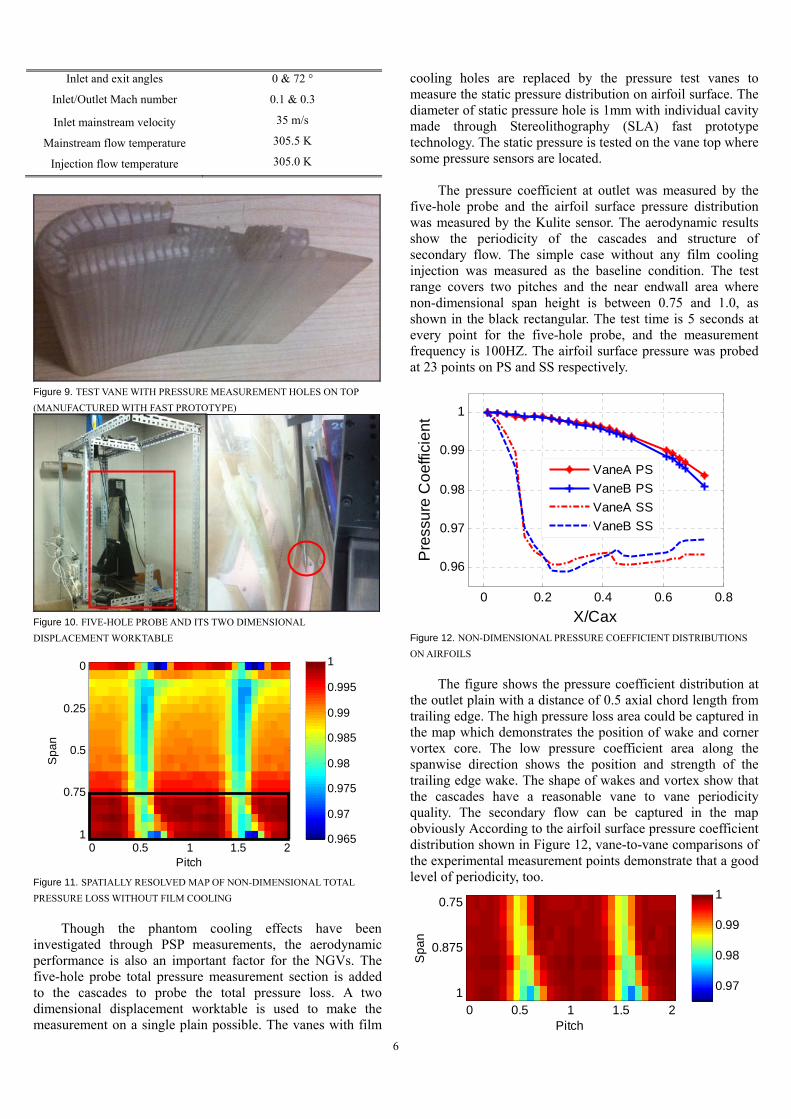
Figure 9. TEST VANE WITH PRESSURE MEASUREMENT HOLES ON TOP
(MANUFACTURED WITH FAST PROTOTYPE)
Figure 10. FIVE-HOLE PROBE AND ITS TWO DIMENSIONAL
DISPLACEMENT WORKTABLE
Pitch
Sp
an
0 0.5 1 1.5 2
0
0.25
0.5
0.75
1 0.965
0.97
0.975
0.98
0.985
0.99
0.995
1
Figure 11. SPATIALLY RESOLVED MAP OF NON-DIMENSIONAL TOTAL
PRESSURE LOSS WITHOUT FILM COOLING
Though the phantom cooling effects have been investigated through PSP measurements, the aerodynamic performance is also an important factor for the NGVs. The five-hole probe total pressure measurement section is added to the cascades to probe the total pressure loss. A two dimensional displacement worktable is used to make the measurement on a single plain possible. The vanes with film
cooling holes are replaced by the pressure test vanes to measure the static pressure distribution on airfoil surface. The diameter of static pressure hole is 1mm with individual cavity made through Stereolithography (SLA) fast prototype technology. The static pressure is tested on the vane top where some pressure sensors are located.
The pressure coefficient at outlet was measured by the five-hole probe and the airfoil surface pressure distribution was measured by the Kulite sensor. The aerodynamic results show the periodicity of the cascades and structure of secondary flow. The simple case without any film cooling injection was measured as the baseline condition. The test range covers two pitches and the near endwall area where non-dimensional span height is between 0.75 and 1.0, as shown in the black rectangular. The test time is 5 seconds at every point for the five-hole probe, and the measurement frequency is 100HZ. The airfoil surface pressure was probed at 23 points on PS and SS respectively.
The figure shows the pressure coefficient distribution at the outlet plain with a distance of 0.5 axial chord length from trailing edge. The high pressure loss area could be captured in the map which demonstrates the position of wake and corner vortex core. The low pressure coefficient area along the spanwise direction shows the position and strength of the trailing edge wake. The shape of wakes and vortex show that the cascades have a reasonable vane to vane periodicity quality. The secondary flow can be captured in the map obviously According to the airfoil surface pressure coefficient distribution shown in Figure 12, vane-to-vane comparisons of the experimental measurement points demonstrate that a good level of periodicity, too.
Pitch
Sp
an
0 0.5 1 1.5 2
0.75
0.875
10.97
0.98
0.99
1
7
Figure 13. SPATIALLY RESOLVED MAP OF NON-DIMENSIONAL TOTAL
PRESSURE LOSS WITH ENDWALL FILM COOLING, M=0.7
Pitch
Sp
an
0 0.5 1 1.5 2
0.75
0.875
10.97
0.98
0.99
1
Figure 14. SPATIALLY RESOLVED MAP OF NON-DIMENSIONAL TOTAL
PRESSURE LOSS WITH ENDWALL FILM COOLING, M=1.0
Pitch
Spa
n
0 0.5 1 1.5 2
0.75
0.875
10.97
0.98
0.99
1
Figure 15. SPATIALLY RESOLVED MAP OF NON-DIMENSIONAL TOTAL
PRESSURE LOSS WITH ENDWALL FILM COOLING, M=1.3
0 0.5 1 1.5 20.97
0.98
0.99
1
Pitch
Mea
n P
ress
ure
Coe
ffic
ient
M=0.7 M=1.0 M=1.3
Figure 16. COMPARISON OF PRESSURE LOSS NEAR ENDWALL SURFACE
WITH DIFFERENT FILM COOLING BLOWING RATIOS
The group of maps shows the pressure coefficient distributions at outlet with different endwall cooling blowing ratios. The distributions demonstrate that the total pressure loss is hardly influenced by the endwall film cooling blowing ratio. However, slight effects can be captured near the endwall surface where the non-dimensional span is between 0.75 and 1.0. As the blowing ratio increases, the total pressure loss near endwall surface is relatively higher. Simultaneously, the strength of the corner vortex and wake is not weakened by the endwall film cooling ejection. The Figure 16 shows the spanwise averaged pressure coefficient distribution along pitch direction. The curves demonstrate that with the blowing ratio increasing, the total pressure loss near endwall surface is slightly increasing. The huge amount of coolant ejection strongly mixes with the main flow, which causes the total pressure loss increases in this area. RESULTS AND DISCUSSION
Though the cascade is 2-d linear, the relative ejection direction of the coolant is different at the different positions on the endwall. The strong secondary flow causes the ejection direction to be different relative to the endwall main flow direction. The interaction between the endwall film-cooling coolant and the secondary flow, especially the passage vortex, makes the endwall near PS and stagnation line to be hardly cooled, while the different flow direction near the suction side avoids this harmful interaction. According to the contours, without the staggered slot leakage geometry the strong pressure gradient will strongly bring the coolant to the suction side, leaving an apparent uncooled area near the pressure side, especially near the stagnation line.
In the current study, five coolant cavities are used for the
slot leakage gap flow and four rows of fan-shaped endwall holes respectively. The coolant supplied to each cavity is controlled by a shared rotameter. During the test, the optical window, and the CCD camera are fixed to the same relative position so that the condition with original and staggered slot film cooling could be compared precisely. In this study, three different blowing ratios were chosen for the typical operational condition, low, medium and high cooling requirements. The blowing ratio of the coolant is varied, so the film-cooling effectiveness can be measured over a range of blowing ratios varying from M=0.7 to M=1.3 based on the mainstream flow inlet velocity.
The film-cooling effectiveness distributions and laterally averaged values at different blowing ratios are shown in Figures 17–22, of which three typical blowing ratios are chosen M=0.7, 1.0, and 1.3. The same trend could be found in the contours so that the area coverage of coolant film is larger at higher blowing ratios. Figures 17–19 show the film-cooling effectiveness distribution on the endwall surface with original and staggered slot leakage flow film cooling, while the blowing ratio is controlled at M=0.7, M=1.0 and M=1.3 respectively. With the blowing ratio increasing, the area protected by the coolant is increasing. Though the coolant could cover the main part of the endwall surface, the unprotected area near the pressure side and stagnation line is still apparent (shown with the red curve). This phenomenon represents that the strong pressure gradient in the turbine cascades, dominating the moving direction of the coolant traces. The momentum of the coolant injection is not strong enough to take the cool air into the high pressure area near the corner region (axial chord position between 0 and 0.3). A similar case could be observed near the leading edge where the coolant could only inject, apparently from the cooling holes near but not at the leading edge. The PS and SS leg of the horse shoe vortex could prevent the coolant attaching to the airfoil, creating a low film-cooling effectiveness area near the leading edge. All of the cooling holes unused on the pressure side were internally blocked, which caused the slight effect of the holes outlet geometry on the flow field being avoided in the experiment.
The left subplot in Figures 17–19 shows the film-cooling
effectiveness distributions on the endwall with original slot injection film cooling when the blowing ratio on the endwall
8
is controlled to be M=0.7, M=1.0 and M=1.3 respectively. The right subplot in Figures 17–19 shows the film-cooling effectiveness distributions on the endwall with staggered slot injection. When the blowing ratio is M=0.7, the cooled area of staggered slot is slightly larger in the middle pitch area downstream the slot, while the cooled area is restricted outside the PS corner region (red lines). At higher blowing ratios, near the PS corner region, the cooled area is relatively larger. When the blowing ratio is M=0.7, an apparent unprotected area can be found near the PS corner region and near stagnation line region for original slot case, while this area is covered by staggered slot injection coolant at the blowing ratio of M=1.0. The right subplot in Figure 19 shows the film-cooling effectiveness distributions on the endwall surface with staggered slot injection when the blowing ratio is controlled to be M=1.3. Similar to the medium blowing ratio case, the high film-cooling effectiveness area near PS and stagnation line is obviously larger than the baseline case with original slot.
Although valuable insight can be obtained from the
distribution maps (Figs. 17–19), the spanwise averaged plots (Figs. 20–22) offer additional insight and provide clear comparisons for large amounts of data. The effectiveness is averaged from the SS to the PS (Figs. 17–19) of the passage in the axial chord direction. The data outside the airfoil was deleted from the averaged results. The peaks in the plot correspond to the film-cooling holes’ location and the slot location. Figures 20–22 indicate that, with the staggered slot injection, the endwall film-cooling effectiveness increases in the downstream area of the slot. The locally largest film-cooling effectiveness difference appears at Cax=-0.16, where the leakage gap injection appears. The average is significantly higher because the coolant injected from the staggered slot covers the endwall sufficiently, especially at middle pitch region where the local pressure is relatively high. The staggered slot injection effect is clearly seen on the upstream half (axial chord position between 0 and 0.4) of the endwall.
original M=0.7 i= 0deg
Z/Z P
X/C ax
1 2
3
0 0.2 0.4 0.6 0.8 1
-0.4
-0.2
0
0.2
0.4
0.6
0.8
1 0 0.1 0.2 0.3 0.4
staggered M=0.7 i= 0deg
Z/Z P
X/C ax
1 2
3
0 0.2 0.4 0.6 0.8 1
-0.4
-0.2
0
0.2
0.4
0.6
0.8
1 0 0.1 0.2 0.3 0.4
Figure 17 FILM-COOLING EFFECTIVENESS DISTRIBUTION ON ENDWALL (THE BLOWING RATIO IS 0.7, WITH ORIGINAL AND STAGGERED SLOT INJECTION)
original M=1.0 i= 0deg
Z/Z P
X/C ax
1 2
3
0 0.2 0.4 0.6 0.8 1
-0.4
-0.2
0
0.2
0.4
0.6
0.8
1 0 0.1 0.2 0.3 0.4
staggered M=1.0 i= 0deg
Z/Z P
X/C ax
1 2
3
0 0.2 0.4 0.6 0.8 1
-0.4
-0.2
0
0.2
0.4
0.6
0.8
1 0 0.1 0.2 0.3 0.4
Figure 18 FILM-COOLING EFFECTIVENESS DISTRIBUTION ON ENDWALL (THE BLOWING RATIO IS 1.0, WITH ORIGINAL AND STAGGERED SLOT INJECTION)
original M=1.3 i= 0deg
Z/Z P
X/C ax
1 2
3
0 0.2 0.4 0.6 0.8 1
-0.4
-0.2
0
0.2
0.4
0.6
0.8
1 0 0.1 0.2 0.3 0.4
staggered M=1.3 i= 0deg
Z/Z P
X/C ax
1 2
3
0 0.2 0.4 0.6 0.8 1
-0.4
-0.2
0
0.2
0.4
0.6
0.8
1 0 0.1 0.2 0.3 0.4
Figure 19 FILM-COOLING EFFECTIVENESS DISTRIBUTION ON ENDWALL (THE BLOWING RATIO IS 1.3, WITH ORIGINAL AND STAGGERED SLOT INJECTION)
-0.2 0 0.2 0.4 0.6 0.8 1 1.20
0.1
0.2
0.3
0.4
0.5
0.6
0.7
0.8
e
ndw
all
X/C ax
i= 0deg M=0.7 originali= 0deg M=0.7 staggered
Figure 20 LATERALLY AVERAGED FILM-COOLING EFFECTIVENESS ON THE ENDWALL (THE BLOWING RATIO IS 0.7, WITH ORIGINAL AND STAGGERED SLOT INJECTION)
9
-0.2 0 0.2 0.4 0.6 0.8 1 1.20
0.1
0.2
0.3
0.4
0.5
0.6
0.7
0.8
e
ndw
all
X/Cax
i= 0deg M=1.0 originali= 0deg M=1.0 staggered
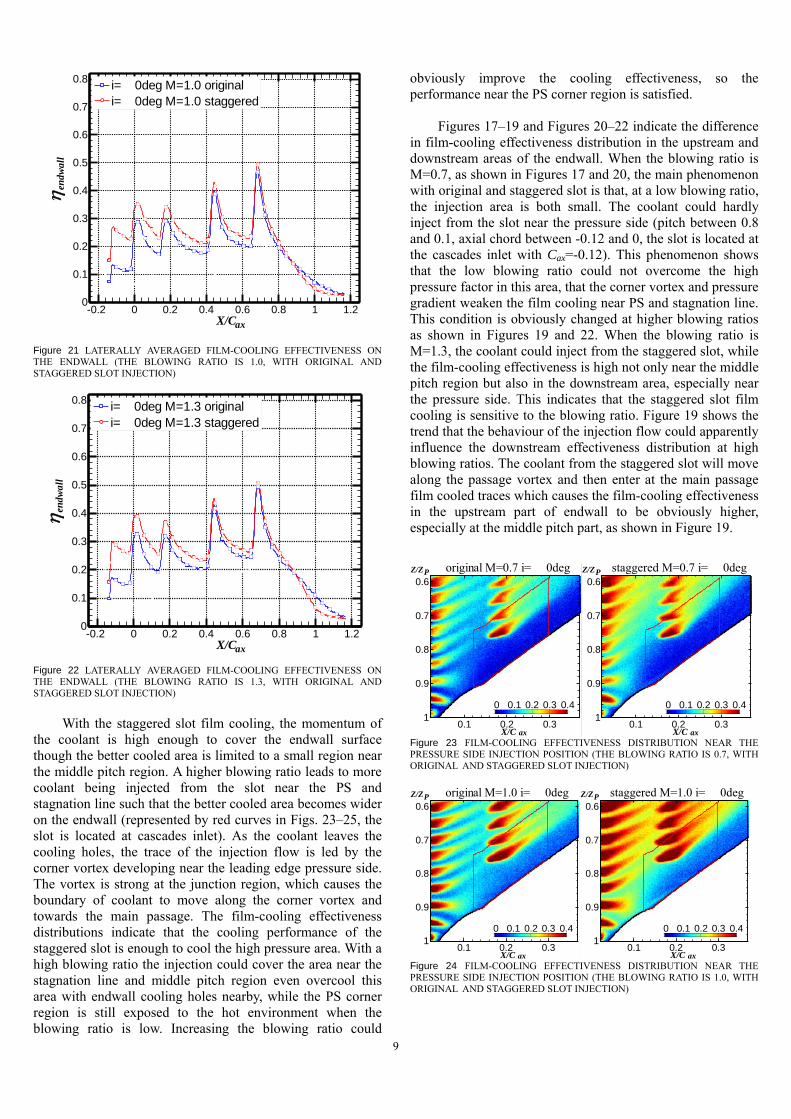
Figure 21 LATERALLY AVERAGED FILM-COOLING EFFECTIVENESS ON THE ENDWALL (THE BLOWING RATIO IS 1.0, WITH ORIGINAL AND STAGGERED SLOT INJECTION)
-0.2 0 0.2 0.4 0.6 0.8 1 1.20
0.1
0.2
0.3
0.4
0.5
0.6
0.7
0.8
e
ndw
all
X/Cax
i= 0deg M=1.3 originali= 0deg M=1.3 staggered
Figure 22 LATERALLY AVERAGED FILM-COOLING EFFECTIVENESS ON THE ENDWALL (THE BLOWING RATIO IS 1.3, WITH ORIGINAL AND STAGGERED SLOT INJECTION)
With the staggered slot film cooling, the momentum of
the coolant is high enough to cover the endwall surface though the better cooled area is limited to a small region near the middle pitch region. A higher blowing ratio leads to more coolant being injected from the slot near the PS and stagnation line such that the better cooled area becomes wider on the endwall (represented by red curves in Figs. 23–25, the slot is located at cascades inlet). As the coolant leaves the cooling holes, the trace of the injection flow is led by the corner vortex developing near the leading edge pressure side. The vortex is strong at the junction region, which causes the boundary of coolant to move along the corner vortex and towards the main passage. The film-cooling effectiveness distributions indicate that the cooling performance of the staggered slot is enough to cool the high pressure area. With a high blowing ratio the injection could cover the area near the stagnation line and middle pitch region even overcool this area with endwall cooling holes nearby, while the PS corner region is still exposed to the hot environment when the blowing ratio is low. Increasing the blowing ratio could
obviously improve the cooling effectiveness, so the performance near the PS corner region is satisfied.
Figures 17–19 and Figures 20–22 indicate the difference
in film-cooling effectiveness distribution in the upstream and downstream areas of the endwall. When the blowing ratio is M=0.7, as shown in Figures 17 and 20, the main phenomenon with original and staggered slot is that, at a low blowing ratio, the injection area is both small. The coolant could hardly inject from the slot near the pressure side (pitch between 0.8 and 0.1, axial chord between -0.12 and 0, the slot is located at the cascades inlet with Cax=-0.12). This phenomenon shows that the low blowing ratio could not overcome the high pressure factor in this area, that the corner vortex and pressure gradient weaken the film cooling near PS and stagnation line. This condition is obviously changed at higher blowing ratios as shown in Figures 19 and 22. When the blowing ratio is M=1.3, the coolant could inject from the staggered slot, while the film-cooling effectiveness is high not only near the middle pitch region but also in the downstream area, especially near the pressure side. This indicates that the staggered slot film cooling is sensitive to the blowing ratio. Figure 19 shows the trend that the behaviour of the injection flow could apparently influence the downstream effectiveness distribution at high blowing ratios. The coolant from the staggered slot will move along the passage vortex and then enter at the main passage film cooled traces which causes the film-cooling effectiveness in the upstream part of endwall to be obviously higher, especially at the middle pitch part, as shown in Figure 19.
original M=0.7 i= 0deg
Z/Z P
X/C ax0.1 0.2 0.3
0.6
0.7
0.8
0.9
10 0.1 0.2 0.3 0.4
staggered M=0.7 i= 0deg
Z/Z P
X/C ax0.1 0.2 0.3
0.6
0.7
0.8
0.9
10 0.1 0.2 0.3 0.4
Figure 23 FILM-COOLING EFFECTIVENESS DISTRIBUTION NEAR THE PRESSURE SIDE INJECTION POSITION (THE BLOWING RATIO IS 0.7, WITH ORIGINAL AND STAGGERED SLOT INJECTION)
original M=1.0 i= 0deg
Z/Z P
X/C ax0.1 0.2 0.3
0.6
0.7
0.8
0.9
10 0.1 0.2 0.3 0.4
staggered M=1.0 i= 0deg
Z/Z P
X/C ax0.1 0.2 0.3
0.6
0.7
0.8
0.9
10 0.1 0.2 0.3 0.4
Figure 24 FILM-COOLING EFFECTIVENESS DISTRIBUTION NEAR THE PRESSURE SIDE INJECTION POSITION (THE BLOWING RATIO IS 1.0, WITH ORIGINAL AND STAGGERED SLOT INJECTION)
10
original M=1.3 i= 0deg
Z/Z P
X/C ax0.1 0.2 0.3
0.6
0.7
0.8
0.9
10 0.1 0.2 0.3 0.4
staggered M=1.3 i= 0deg
Z/Z P
X/C ax0.1 0.2 0.3
0.6
0.7
0.8
0.9
10 0.1 0.2 0.3 0.4
Figure 25 FILM-COOLING EFFECTIVENESS DISTRIBUTION NEAR THE PRESSURE SIDE INJECTION POSITION (THE BLOWING RATIO IS 1.3, WITH ORIGINAL AND STAGGERED SLOT INJECTION)
0 0.1 0.2 0.3 0.4 0.5 0.6 0.7 0.8 0.9 10
0.2
0.4
0.6
0.8
1
1.2
1.4
1.6
1.8
2
SS
PS
S
treL
ocat
ion
1
Z/Pitch
i= 0deg M=0.7 originali= 0deg M=0.7 staggered
0 0.05 0.10
0.2
0.4
near SS0.9 0.95 10
0.1
0.2
0.3
near PS
Figure 26 LOCAL FILM-COOLING EFFECTIVENESS DISTRIBUTION ON THE ENDWALL AT STREAMWISE LOCATION 1 (THE BLOWING RATIO IS 0.7, WITH ORIGINAL AND STAGGERED SLOT INJECTION, Cax=-0.12)
0 0.1 0.2 0.3 0.4 0.5 0.6 0.7 0.8 0.9 10
0.2
0.4
0.6
0.8
1
1.2
1.4
1.6
1.8
2
SS
PS
S
treL
ocat
ion
1
Z/Pitch
i= 0deg M=1.3 originali= 0deg M=1.3 staggered
0 0.05 0.10
0.2
0.4
near SS0.9 0.95 10
0.1
0.2
0.3
near PS
Figure 27 LOCAL FILM-COOLING EFFECTIVENESS DISTRIBUTION ON THE ENDWALL AT STREAMWISE LOCATION 1 (THE BLOWING RATIO IS 1.3, WITH ORIGINAL AND STAGGERED SLOT INJECTION, Cax=-0.12)
The phenomenon captured in this experiment has a close
relationship with the secondary flow field in the turbine cascade. Previous literature could provide some important support material. The research by Rehder and Dannhauer [18]
indicates that the coolant flow has apparent influence on the three-dimensional flow field of the turbine passage. The flow visualization experiment shows that the moving trace of the passage vortex is from the pressure side to the suction side. The passage vortex, as well as the pressure gradient in the cascade could simultaneously force the coolant on the endwall to move onto the airfoil suction side. Similar results were found in the research report by Papa et al. [10]. They captured the phantom cooling phenomenon on the rotor blade suction side and the coolant was ejected from an upstream slot. The paper indicates that the coolant from the endwall would move towards the suction side and then form a triangular cooled area. Though the passage vortex and the pressure gradient in the rotor passage are stronger than that of the NGV, the mechanism of suction side over-cooling is similar. The comparable results provide a reasonable explanation of the over cooling phenomenon near the suction side in this experiment.
Figures 26 and 27 compare the local film-cooling
effectiveness distribution at streamwise location 1 with different blowing ratios (M=0.7 and M=1.3). The position of the computing area is indicated by the PS to SS white line along the pitch direction in Figures 17–19 (Line 1 on the left side). With the staggered slot injection, the local film-cooling effectiveness apparently improves at middle pitch area, as shown in Figures 26 and 27 where the curve representing the staggered slot cooling condition is apparently higher at upstream area. Meanwhile, the film-cooling effectiveness in the main passage and near the SS is also obviously changed. The well protected region is enlarged to the PS corner region. After cooling the PS comer region, the coolant strongly interacts with the secondary flows such as the passage vortex and wall vortex. The main flow eliminates the momentum of the staggered slot film cooling quickly, which makes the film-cooling effectiveness of downstream part to be same. On the other hand, the main flow further mixes the coolant and the hot gas on the endwall, which leads the injection flow to lift off the endwall surface and then move to the main flow. These two factors cause the film-cooling effectiveness to hardly change near the SS corner region.
Figures 28 and 29 compare the local film-cooling effectiveness distribution at streamwise location 2 with different blowing ratios. As the blowing increases, the film-cooling effectiveness apparently improves near the pressure side. Meanwhile, the higher effectiveness area approaches the suction side. The well protected region is near the PS area and the mid-pitch part of the endwall (pitch is between 0.5 and 1.0). In the PS corner region of the passage, the coolant strongly interacts with the secondary flows such as the corner vortex and transversal flow. The main flow pushes the coolant towards the mid-pitch region, which causes the protected area to be larger. But the main flow still mixes the coolant and the hot gas in the passage, which leads the injection flow to lift off the endwall surface, which causes the film-cooling effectiveness to hardly change at the SS corner region of the endwall.
11
0 0.1 0.2 0.3 0.4 0.5 0.6 0.7 0.8 0.9 10
0.2
0.4
0.6
0.8
1
1.2
1.4
1.6
1.8
2 S
S
PS
S
treL
ocat
ion
2
Z/Pitch
i= 0deg M=0.7 originali= 0deg M=0.7 staggered
0 0.05 0.10
0.2
0.4
near SS0.9 0.95 10
0.1
0.2
0.3
near PS
Figure 28 LOCAL FILM-COOLING EFFECTIVENESS DISTRIBUTION ON THE ENDWALL AT STREAMWISE LOCATION 2 (THE BLOWING RATIO IS 0.7, WITH ORIGINAL AND STAGGERED SLOT INJECTION, Cax=0.13)
0 0.1 0.2 0.3 0.4 0.5 0.6 0.7 0.8 0.9 10
0.2
0.4
0.6
0.8
1
1.2
1.4
1.6
1.8
2
SS
PS
S
treL
ocat
ion
2
Z/Pitch
i= 0deg M=1.3 originali= 0deg M=1.3 staggered
0 0.05 0.10
0.2
0.4
near SS0.9 0.95 10
0.1
0.2
0.3
near PS
Figure 29 LOCAL FILM-COOLING EFFECTIVENESS DISTRIBUTION ON THE ENDWALL AT STREAMWISE LOCATION 2 (THE BLOWING RATIO IS 1.3, WITH ORIGINAL AND STAGGERED SLOT INJECTION, Cax=0.13)
0 0.1 0.2 0.3 0.4 0.5 0.6 0.7 0.8 0.9 10
0.2
0.4
0.6
0.8
1
1.2
1.4
1.6
1.8
2
SS
PS
S
treL
ocat
ion
3
Z/Pitch
i= 0deg M=0.7 originali= 0deg M=0.7 staggered
0 0.05 0.10
0.2
0.4
near SS0.9 0.95 10
0.1
0.2
0.3
near PS
Figure 30 LOCAL FILM-COOLING EFFECTIVENESS DISTRIBUTION ON THE ENDWALL AT STREAMWISE LOCATION 3 (THE BLOWING RATIO IS 0.7, WITH ORIGINAL AND STAGGERED SLOT INJECTION, Cax=0.71)
0 0.1 0.2 0.3 0.4 0.5 0.6 0.7 0.8 0.9 10
0.2
0.4
0.6
0.8
1
1.2
1.4
1.6
1.8
2
SS
PS
S
treL
ocat
ion
3
Z/Pitch
i= 0deg M=1.3 originali= 0deg M=1.3 staggered
0 0.05 0.10
0.2
0.4
near SS0.9 0.95 10
0.1
0.2
0.3
near PS
Figure 31 LOCAL FILM-COOLING EFFECTIVENESS DISTRIBUTION ON THE ENDWALL AT STREAMWISE LOCATION 3 (THE BLOWING RATIO IS 1.3, WITH ORIGINAL AND STAGGERED SLOT INJECTION, Cax=0.71)
Figures 30 and 31 show the local film-cooling
effectiveness distribution at streamwise location 3 where the coolant is moved to the downstream part of the endwall, with the blowing ratio controlled at M=0.7 and M=1.3. When the blowing ratio is M=0.7 (Figure 30), no apparent unprotected area could be found at the PS corner region (pitch is between 0.9 and 1.0), while the influence of the staggered slot film cooling could not be probed in this area, the downstream part of the endwall. This indicates that the effects of the staggered slot film cooling are not apparent in the downstream corner region of endwall surface when the blowing ratio is relatively low. Figure 31 compares the local film-cooling effectiveness distribution in the downstream area when the blowing ratio in M=1.3. The figure shows that the increase in the blowing ratio decreases the local film-cooling effectiveness near the PS corner region while increasing the film-cooling effectiveness in the mid-pitch area, for the staggered slot case. The lower film-cooling effectiveness near the PS corner region indicates that the coolant injection is influenced by the main passage secondary flow, especially the passage vortex which causes strong cross flow from PS to SS. In this area, the main flow is dominated by the passage vortex. Lower effectiveness means stronger influence of the vortex, which shows that the streamwise location could change the influence of the staggered slot film cooling on the endwall. The film-cooling effectiveness curve representing the case of staggered slot film cooling is obviously above the curves representing the baseline case in the mid-pitch region (pitch is between 0.4 and 0.7 ) as shown in Figure 31. As the blowing ratio increases, the influence of staggered slot injection is apparently weakened by the secondary flow. The higher momentum of the coolant injection flow could not effectively overcome the mixing trend of the passage vortex and then partially form a high film-cooling effectiveness area at the mid-pitch.
12
CONCLUSIONS In general, staggered slot injection apparently affects the
coolant distribution on the endwall surface, especially for the near inlet area. The results show that with an increasing blowing ratio, the film-cooling effectiveness increases on the endwall surface, especially near the leakage gap region. The film-cooling effectiveness difference is weakened with the axial chord increase, indicating that the pressure side film-cooling ejection mixes with the main flow strongly in the mid-passage, thus forming a low influence region in the downstream area. With increasing blowing ratios, the improvement is also captured at the downstream part on the pressure side gill region and mid-pitch region. The influence of the blowing ratio is apparent for leakage flow film-cooling on the endwall surface.
As the blowing ratio varies from M=0.7, to M=1.3, the
influence of staggered slot leakage flow on the endwall film cooling increases near inlet area. Simultaneously, the area of influence will move towards mid-pitch and the suction side. In conclusion: 1 ) the film-cooling effectiveness on the endwall surface downstream the slot and along the pitchwise direction increased, with the highest parameter at Z/Pitch=0.6; 2) a larger cooled region developed towards the suction side as the blowing ratio increased; 3) the advantage of the staggered slot was apparent on the endwall surface near the inlet area, while the coolant film was obviously weakened along the axial chord at a low blowing ratio. The influence of the staggered slots could hardly be detected on downstream area of the enwall surface even at higher blowing ratio. NOMENCLATURE C =concentration of gas / actual chord length of scaled up
blade profile
D =film-hole diameter, mm
i =incidence angle
I =light intensity
L =length of film hole, mm
M =blowing ratio, ρcVc/ρ∞V∞
Ma =Mach number
PS =pressure side
P =partial pressure
PSP =pressure sensitive paint Re =Reynolds number
SS =suction side
TE =Trailing Edge
V =velocity, m/s
X , Z =Cartesian coordinate system =film cooling effectiveness
Subscripts aw =adiabatic air =air condition ax =axial chord blk =back ground value c =coolant fluid in =inlet mix =mixture condition
O2 =pure oxygen ratio =partial pressure of oxygen ref =reference value sp =span wise =free stream condition REFERENCES [1] Zhang, L., Jaiswal, R.S., 2001. “Turbine Nozzle Endwall
Film Cooling Study Using Pressure-Sensitive Paint”,
Inlet Film Cooling: The Effect of a Back-Facing Step”. In ASME Turbo Expo 2003, collated with the 2003 International Joint Power Generation Conference, Atlanta, ASME Paper No.GT2003–38319.
[3] Wright, L.M., Gao, Z., Varvel, T.A., and Han, J.C., 2005. “Assessment of Steady State PSP, TSP, and IR Measurement Techniques for Flat Plate Film Cooling”. In ASME 2005 Summer Heat Transfer Conference, ASME Paper No.HT2005–72363.
[4] Wright, L.M., Blake, S., Han, J.C., 2006. “Effectiveness Distributions on Turbine Blade Cascade Platforms through Simulated Stator-Rotor Seals”. In 9th AIAA/ASME Joint Thermophysics and Heat Transfer Conference, San Francisco, AIAA Paper No.2006–3402.
[5] Gao, Z., Narzary, D., Han, J.C., 2009. “Turbine Blade Platform Film Cooling with Typical Stator-Rotor Purge Flow and Discrete-Hole Film Cooling”. Journal of Turbomachinery, 131, pp.041004/1–11.
[6] Charbonnier, D., Ott, P., Jonsson, M., Cottier, F., Köbke, Th., 2009. “Experimental and Numerical Study of the Thermal Performance of a Film Cooled Turbine Platform”. In ASME Turbo Expo 2009: Power for Land, Sea, and Air, Orlando, ASME Paper No.GT2009-60306.
[7] Gao, Z., Narzary, D., Mhetras, S., Han, J.C., 2009. “Effect of Inlet Flow Angle on Gas Turbine Blade Tip Film Cooling”. Journal of Turbomachinery, 131, pp.031005/1–12.
[8] Yang, H., Gao, Z., Chen, H.C., Han, J.C., Schobeiri, M.T., 2009. “Prediction of Film Cooling and Heat Transfer on a Rotating Blade Platform With Stator-Rotor Purge and Discrete Film-Hole Flows in a 1–1/2 Turbine Stage”. Journal of Turbomachinery, Transactions of the ASME, Vol. 131, OCTOBER 2009, p. 041003/1–12.
[9] Kost F., Mullaert, A., 2006. “Migration of Film-Coolant from Slot and Hole Ejection at a Turbine Vane Endwall”. ASME Turbo Expo 2006: Power for Land, Sea, and Air (GT2006), Barcelona, Spain, ASME Paper No. GT2006-90355.
[10] Papa, M., Srinivasan, V., Goldstein, R.J, 2010, “Film Cooling Effect of Rotor-stator Purge Flow on Endwall Heat/Mass Transfer”. ASME Turbo Expo 2010: Power for Land, Sea, and Air (GT2010), Glasgow, UK, ASME Paper No.GT2010-23178.
[11] Charbonnier, D., Ott, P., Jonsson, M., Cottier, F., Köbke, Th. “Experimental and Numerical Study of the Thermal Performance of a Film Cooled Turbine Platform”. ASME Turbo Expo 2009, GT2009-60306.
13
[12] Suryanarayanan, A., Ozturk, B., Schobeiri, M.T., Han, J.C., 2010. “Film-Cooling Effectiveness on a Rotating Turbine Platform Using Pressure Sensitive Paint Technique”. Journal of Turbomachinery, 132, pp.041001/1–13.
[13] Hada, S., Thole, K.A., 2011. “Computational Study of a Midpassage Gap and Upstream Slot on Vane Endwall Film-Cooling”. Journal of Turbomachinery, 133, 011024/1–9.
[14] Knost, D.G., Thole, K.A., 2005. “Adiabatic Effectiveness Measurements of Endwall Film-Cooling for a First-Stage Vane”. Journal of Turbomachinery, 127, 297–305.
[15] Cardwell, N.D., Sundaram, N., Thole, K.A., 2006. “Effect of Midpassage Gap, Endwall Misalignment, and Roughness on Endwall Film-Cooling”. Journal of Turbomachinery, 128, 62–70.
[16] Oke, R.A., Simon, T.W., 2002. “Film Cooling Experiments With Flow Introduced Upstream of a First Stage Nozzle Guide Vane Through Slots of Various Geometries”. ASME Turbo Expo 2002: Power for Land, Sea, and Air (GT2002), Amsterdam, The Netherlands, ASME Paper No. GT2002-30169.
[17] Wright, L.M., Gao, Z., Yang, H, Han, J.C., 2008. “Film Cooling Effectiveness Distribution on a Gas Turbine Blade Platform With Inclined Slot Leakage and Discrete Film Hole Flows”. Journal of Turbomachinery, 130 , 071702/1–11.
[18] Rehder, H., Dannhauer, A., 2007. “Experimental Investigation of Turbine Leakage Flows on the Three-Dimensional Flow Field and Endwall Heat Transfer”. Journal of Turbomachinery, 129 , 608–618.
[19] Piggush, J.D., Simon, T.W., 2007. “Heat Transfer Measurements in a First-Stage Nozzle Cascade Having Endwall Contouring: Misalignment and Leakage Studies”. Journal of Turbomachinery, 129, 782–790.
[20] Zhang, L., Moon, H.K., 2011. “Comparison of Two Axisymmetric Profiles on Blade Platform Film Cooling”. In ASME Turbo Expo 2011, Vancouver, British Columbia, Canada, ASME Paper No. GT2011-45102.
[21] Krueckels, J., Colban, W., Gritsch, M., Schnieder, M., 2011. “Validation of a First Vane Platform Cooling Design”. In ASME Turbo Expo 2011, Vancouver, British Columbia, Canada, ASME Paper No. GT2011-45252.
[22] Zhang, L., Yin, J., Moon, H.K., 2012. “The Effect of Compound Angle on Nozzle Suction Side Film Cooling”. In ASME Turbo Expo 2012, Copenhagen, Denmark, ASME Paper No. GT2012-68357.
[23] Liu, K., Yang, S., Han, J., 2012. “Influence of Coolant Density on Turbine Blade Film-Cooling With Compound-Angle Shaped Holes”. In ASME Turbo Expo 2012, Copenhagen, Denmark, ASME Paper No. GT2012-69117.