GTSE1 Is a Microtubule Plus-End Tracking Protein That Regulates EB1-Dependent Cell Migration Massimilano Scolz 1. , Per O. Widlund 2. , Silvano Piazza 1 , Debora Rosa Bublik 1¤a , Simone Reber 2 , Leticia Y. Peche 1 , Yari Ciani 1 , Nina Hubner 3¤b , Mayumi Isokane 4 , Martin Monte 1¤c , Jan Ellenberg 4 , Anthony A. Hyman 2 *, Claudio Schneider 1,5 *, Alexander W. Bird 2 * ¤d 1 Laboratorio Nazionale The Interuniversity Consortium for Biotechnology, Area Science Park, Trieste, Italy, 2 Max Planck Institute of Molecular Cell Biology and Genetics, Dresden, Germany, 3 Department of Molecular Cancer Research, Universitair Medisch Centrum Utrecht, Utrecht, The Netherlands, 4 European Molecular Biology Laboratory, Cell Biology and Biophysics Unit, Heidelberg, Germany, 5 Department of Medical and Biological Sciences, University of Udine, Udine, Italy Abstract The regulation of cell migration is a highly complex process that is often compromised when cancer cells become metastatic. The microtubule cytoskeleton is necessary for cell migration, but how microtubules and microtubule-associated proteins regulate multiple pathways promoting cell migration remains unclear. Microtubule plus-end binding proteins (+TIPs) are emerging as important players in many cellular functions, including cell migration. Here we identify a +TIP, GTSE1, that promotes cell migration. GTSE1 accumulates at growing microtubule plus ends through interaction with the EB1+TIP. The EB1-dependent +TIP activity of GTSE1 is required for cell migration, as well as for microtubule-dependent disassembly of focal adhesions. GTSE1 protein levels determine the migratory capacity of both nontransformed and breast cancer cell lines. In breast cancers, increased GTSE1 expression correlates with invasive potential, tumor stage, and time to distant metastasis, suggesting that misregulation of GTSE1 expression could be associated with increased invasive potential. Citation: Scolz M, Widlund PO, Piazza S, Bublik DR, Reber S, et al. (2012) GTSE1 Is a Microtubule Plus-End Tracking Protein That Regulates EB1-Dependent Cell Migration. PLoS ONE 7(12): e51259. doi:10.1371/journal.pone.0051259 Editor: Elad Katz, University of Edinburgh, United Kingdom Received September 14, 2012; Accepted October 30, 2012; Published December 7, 2012 Copyright: ß 2012 Scolz et al. This is an open-access article distributed under the terms of the Creative Commons Attribution License, which permits unrestricted use, distribution, and reproduction in any medium, provided the original author and source are credited. Funding: Work done in CS’s lab at Laboratorio Nazionale The Interuniversity Consortium for Biotechnology has been supported by Italian Association for Cancer Research (AIRC) IG-2010 and AIRC Special Program Molecular Clinical Oncology ‘‘5 per mille’’. MS and LP were supported by fellowships from Area Science Park. YC is supported by a PhD Fellowship from the School of Molecular Biomedicine University of Trieste. The funders had no role in study design, data collection and analysis, decision to publish, or preparation of the manuscript. Competing Interests: The authors have declared that no competing interests exist. * E-mail: [email protected] (AWB); [email protected] (AAH); [email protected] (CS) . These authors contributed equally to this work. ¤a Current address: Department of Molecular Cell Biology, The Weizmann Institute of Science, Rehovot, Israel ¤b Current address: Department of Molecular Biology, Nijmegen Centre for Molecular Life Sciences, Nijmegen, The Netherlands ¤c Current address: Departamento de Quı ´mica Biolo ´ gica, Facultad de Ciencias Exactas y Naturales, Universidad de Buenos Aires, Buenos Aires, Argentina ¤d Current address: Max Planck Institute of Molecular Physiology, Dortmund, Germany Introduction Cancer cells that have become metastatic are defined by an increased motility, and the modulation of molecular pathways controlling cell migration is important for the progression to metastasis [1–4]. These pathways are normally regulated so that migration occurs only at specific times within the cell-cycle, or in response to distinct environmental cues. Several regulatory pathways controlling cell migration are dependent on the microtubule cytoskeleton, as well as the dynamic regulation of microtubule-associated proteins (MAPs) [5]. MAPs are frequently found overexpressed in tumors, where they are thought to promote cancer progression and resistance to MT- targeting chemotherapy drugs in part by altering microtubule dynamics and stability and promoting chromosomal instability in mitosis [6–7]. Due to their important role in cell motility, misregulation of microtubule functions may also potentially contribute to cancer progression through misregulation of cell migration, by promoting tumor cell invasion and metastasis [5], although there is less evidence for this to date. Furthermore, microtubule-targeting drugs such as paclitaxel have proven effective at treating cancers, but the pathways through which they work remain unclear [8]. To better understand how regulation of microtubule-dependent cell migration affects cancer progression, it is necessary to elucidate the contributions of individual MAPs. Several microtubule-dependent pathways controlling cell mi- gration act by ultimately stimulating actin polymerization at the leading edge of a migrating cell [5]. At the same time, microtubules promote cell migration through the modulation of dynamic cell adhesion properties, by stimulating both the stabilization and disassembly of focal adhesion complexes (FAs) [9]. FAs are large macromolecular complexes required for cell adhesion to the extracellular matrix, as well as signaling from the ECM to the cell. FAs are dynamic, and both their assembly and disassembly are regulated by multiple factors [10,11]. As they migrate, cells must form new FAs at their leading edge, and then disassemble these FAs as they move towards the middle and rear of the cell. The disassembly of FAs appears to be induced when microtubules grow towards and touch (‘‘target’’) focal adhesions, suggesting MAPs are also critical in this process [12–14]. PLOS ONE | www.plosone.org 1 December 2012 | Volume 7 | Issue 12 | e51259
Transcript
GTSE1 Is a Microtubule Plus-End Tracking Protein ThatRegulates EB1-Dependent Cell MigrationMassimilano Scolz1., Per O. Widlund2., Silvano Piazza1, Debora Rosa Bublik1¤a, Simone Reber2,
Leticia Y. Peche1, Yari Ciani1, Nina Hubner3¤b, Mayumi Isokane4, Martin Monte1¤c, Jan Ellenberg4,
Anthony A. Hyman2*, Claudio Schneider1,5*, Alexander W. Bird2*¤d
1 Laboratorio Nazionale The Interuniversity Consortium for Biotechnology, Area Science Park, Trieste, Italy, 2 Max Planck Institute of Molecular Cell Biology and Genetics,
Dresden, Germany, 3 Department of Molecular Cancer Research, Universitair Medisch Centrum Utrecht, Utrecht, The Netherlands, 4 European Molecular Biology
Laboratory, Cell Biology and Biophysics Unit, Heidelberg, Germany, 5 Department of Medical and Biological Sciences, University of Udine, Udine, Italy
Abstract
The regulation of cell migration is a highly complex process that is often compromised when cancer cells becomemetastatic. The microtubule cytoskeleton is necessary for cell migration, but how microtubules and microtubule-associatedproteins regulate multiple pathways promoting cell migration remains unclear. Microtubule plus-end binding proteins(+TIPs) are emerging as important players in many cellular functions, including cell migration. Here we identify a +TIP,GTSE1, that promotes cell migration. GTSE1 accumulates at growing microtubule plus ends through interaction with theEB1+TIP. The EB1-dependent +TIP activity of GTSE1 is required for cell migration, as well as for microtubule-dependentdisassembly of focal adhesions. GTSE1 protein levels determine the migratory capacity of both nontransformed and breastcancer cell lines. In breast cancers, increased GTSE1 expression correlates with invasive potential, tumor stage, and time todistant metastasis, suggesting that misregulation of GTSE1 expression could be associated with increased invasive potential.
Citation: Scolz M, Widlund PO, Piazza S, Bublik DR, Reber S, et al. (2012) GTSE1 Is a Microtubule Plus-End Tracking Protein That Regulates EB1-Dependent CellMigration. PLoS ONE 7(12): e51259. doi:10.1371/journal.pone.0051259
Editor: Elad Katz, University of Edinburgh, United Kingdom
Received September 14, 2012; Accepted October 30, 2012; Published December 7, 2012
Copyright: � 2012 Scolz et al. This is an open-access article distributed under the terms of the Creative Commons Attribution License, which permitsunrestricted use, distribution, and reproduction in any medium, provided the original author and source are credited.
Funding: Work done in CS’s lab at Laboratorio Nazionale The Interuniversity Consortium for Biotechnology has been supported by Italian Association for CancerResearch (AIRC) IG-2010 and AIRC Special Program Molecular Clinical Oncology ‘‘5 per mille’’. MS and LP were supported by fellowships from Area Science Park. YCis supported by a PhD Fellowship from the School of Molecular Biomedicine University of Trieste. The funders had no role in study design, data collection andanalysis, decision to publish, or preparation of the manuscript.
Competing Interests: The authors have declared that no competing interests exist.
¤a Current address: Department of Molecular Cell Biology, The Weizmann Institute of Science, Rehovot, Israel¤b Current address: Department of Molecular Biology, Nijmegen Centre for Molecular Life Sciences, Nijmegen, The Netherlands¤c Current address: Departamento de Quımica Biologica, Facultad de Ciencias Exactas y Naturales, Universidad de Buenos Aires, Buenos Aires, Argentina¤d Current address: Max Planck Institute of Molecular Physiology, Dortmund, Germany
Introduction
Cancer cells that have become metastatic are defined by an
increased motility, and the modulation of molecular pathways
controlling cell migration is important for the progression to
metastasis [1–4]. These pathways are normally regulated so that
migration occurs only at specific times within the cell-cycle, or in
response to distinct environmental cues.
Several regulatory pathways controlling cell migration are
dependent on the microtubule cytoskeleton, as well as the dynamic
regulation of microtubule-associated proteins (MAPs) [5]. MAPs
are frequently found overexpressed in tumors, where they are
thought to promote cancer progression and resistance to MT-
targeting chemotherapy drugs in part by altering microtubule
dynamics and stability and promoting chromosomal instability in
mitosis [6–7]. Due to their important role in cell motility,
misregulation of microtubule functions may also potentially
contribute to cancer progression through misregulation of cell
migration, by promoting tumor cell invasion and metastasis [5],
although there is less evidence for this to date. Furthermore,
microtubule-targeting drugs such as paclitaxel have proven
effective at treating cancers, but the pathways through which
they work remain unclear [8]. To better understand how
regulation of microtubule-dependent cell migration affects cancer
progression, it is necessary to elucidate the contributions of
individual MAPs.
Several microtubule-dependent pathways controlling cell mi-
gration act by ultimately stimulating actin polymerization at the
leading edge of a migrating cell [5]. At the same time,
microtubules promote cell migration through the modulation of
dynamic cell adhesion properties, by stimulating both the
stabilization and disassembly of focal adhesion complexes (FAs)
[9]. FAs are large macromolecular complexes required for cell
adhesion to the extracellular matrix, as well as signaling from the
ECM to the cell. FAs are dynamic, and both their assembly and
disassembly are regulated by multiple factors [10,11]. As they
migrate, cells must form new FAs at their leading edge, and then
disassemble these FAs as they move towards the middle and rear of
the cell. The disassembly of FAs appears to be induced when
microtubules grow towards and touch (‘‘target’’) focal adhesions,
suggesting MAPs are also critical in this process [12–14].
PLOS ONE | www.plosone.org 1 December 2012 | Volume 7 | Issue 12 | e51259
One subclass of MAPs that is ideally positioned to regulate
microtubule dynamics and interactions within cells, due to its
members’ localization at the plus end of microtubules, is +TIPs
(microtubule plus-end tracking proteins) [15–16]. +TIPs generally
refer to proteins that localize to growing MT ends, but do not
necessarily associate with microtubules themselves. Many of the
+TIP proteins identified to date actually localize to the growing
microtubule end by virtue of an interaction with the EB (end-
binding) family of +TIP proteins. EB proteins associate directly
with MTs through a N-terminal calponin homology domain [17].
EB1-interacting +TIP proteins bind to EB1 via conserved domains
located in the C-terminal region of EB1 [18,19]. The majority of
these bind EB1 specifically via short interaction motifs residing in
basic and serine-rich regions, named ‘‘SKIP’’ (or ‘‘SxIP’’) motifs,
for the original defined consensus sequence [20]. EB1 thus serves
as an essential hub of localization for many +TIPs, and is ideally
situated to play key roles in regulation of +TIP protein localization
and activities. Indeed, recent studies have provided examples of
phosphorylation of +TIPs affecting their interaction with EB1 and
localization to growing microtubule ends [18,20–22].
Among several functions, EB1 is required for cell migration
[23–25]. Because of EB1’s ability to recruit likely dozens of
different +TIPs to microtubules in a complex fashion [26], it is
difficult to study individual mechanisms through EB1 perturbation
alone, thus requiring the analysis of individual EB1-interacting
+TIPs and their unique regulation. A few EB1-interacting +TIPs
(i.e. APC, ACF7, CLASP1/2, and CLIP170) have been shown to
play roles in migration-promoting pathways [22,23,27–30]. Most
evidence defines how they work together at the leading edge of a
migrating cell to promote stabilization of microtubules, cell
adhesion, microtubule attachment at the cortex, and stimulation
of actin polymerization [5,9]. How EB1 affects additional
pathways promoting cell migration, such as focal adhesion
disassembly, is less clear, although the EB1-interacting +TIPs
ACF7 and CLIP-170 have been shown to be important for this
activity [28,30,31].
We previously identified the protein GTSE1 (G-2 and S-phase
expressed 1) as a negative regulator of p53 that can shuttle
between the cytoplasm and nucleus. After DNA damage, GTSE1
accumulates the nucleus, where it interacts with p53 and shuttles it
out of the nucleus to promote its downregulation and recovery
from the p53-induced G2 DNA damage checkpoint [32] [33,34].
In the absence of DNA damage, GTSE1 localizes to interphase
MT networks [35–37], and has also been found associated with
clathrin-containing complexes [38,39], but the function of GTSE1
at microtubules has not been elucidated.
Here we have identified GTSE1 as a microtubule-associated
+TIP protein required for EB1-dependent cell migration. GTSE1
interacts directly with microtubules in interphase, and is enriched
at growing microtubule plus ends through interaction with EB1.
We have found a positive relationship between GTSE1 protein
levels and a cell’s migratory capacity. Focal adhesion turnover
activity is also dependent on GTSE1, suggesting that GTSE1’s
affect on cell migration is mediated through stimulation of
the impact of GTSE1 on both cell migration and focal adhesion
turnover is dependent on its interaction with EB1 and tip-tracking
activity. Combined with evidence that GTSE1 expression levels
correlate with tumor invasiveness and metastasis in breast cancer,
these results point to the possibility that misregulation of the +TIP
activity of GTSE1 may promote pathways supporting metastasis,
through upregulation of FA disassembly leading to loss of adhesion
and increased cell motility.
Results
GTSE1 is an EB1-dependent Microtubule Plus End GrowthTracking Protein
We previously described GTSE1 as localizing coincident with
interphase microtubule networks in antibody stainings [35–37],
and in a yeast 2-hyrid screen for GTSE1-interacting proteins, EB1
emerged as a strong candidate. To investigate more closely
potential microtubule- and EB1- related functions of GTSE1, we
tagged the GTSE1 gene with a C-terminal GFP tag within a
bacterial artificial chromosome (BAC), and transfected U2OS cells
and mouse embryonic stem cells (R1/E) with this construct. Time
lapse imaging of stably transfected cells revealed that in addition to
localizing to microtubules, GTSE1-GFP was enriched on what
appeared to be growing microtubule tips in interphase in both cell
types (Figure 1A,C; Movie S1,S2,S3). Live analysis of GTSE1-
GFP cells stably co-transfected with alpha-tubulin-mCherry
confirmed that GTSE1-GFP accumulates at growing microtubule
tips (Figure 1A, Movie S1), identifying GTSE1 as a +TIP.
To determine if GTSE1 required EB1 for its localization to
growing MT ends, we depleted U2OS GTSE1-GFP cells of EB1
by RNAi and recorded short time-lapse movies (Movie S3,S4).
RNAi depletion of EB1 efficiently depleted EB1 protein, but did
not affect the expression levels of GTSE1 (Figure 1B). GTSE1-
GFP no longer tracked microtubule tips after EB1 depletion, but
still associated with the microtubule lattice, confirming that
GTSE1 is dependent on EB1 for +TIP localization (Figure 1C).
GTSE1 is Recruited to Microtubule Plus Ends ThroughShort EB1-interaction Motifs
Analysis of the GTSE1 sequence and secondary structure
prediction revealed that GTSE1 is a mostly intrinsically disordered
protein (IDP), with the exception of a short N-terminal region of
100 amino acids predicted to fold into an ordered secondary
structure. Within the disordered regions are multiple potential
‘‘SKIP’’-like EB1-interaction motifs surrounded by basic residues,
including two highly conserved tandem motifs (residues 509–512
and 520–523; here SxLP; Figure 2A), which suggested a direct
interaction with and +TIP targeting via EB1. To determine if EB1
and GTSE1 interacted, we immunoprecipitated endogenous
GTSE1 from U2OS cells and probed for EB1. Anti-GTSE1
antibody, but not a control antibody (anti-GFP), efficiently co-
immunoprecipitated endogenous EB1 (Figure 2B).
Proteins that interact with EB1 through the SKIP motif
generally bind to the EBH (EB-homology) domain located in the
C-terminus of EB1 [20]. We investigated which region of EB1 was
required for interaction with GTSE1 by performing coimmuno-
precipitations with cells transiently transfected with GTSE1-HA
and different EB1-GFP fragment constructs. Ectopically expressed
GTSE1-HA efficiently coimmunoprecipitated full length EB1-
GFP (Figure S1A,B). A C-terminal EB1-GFP fragment containing
the EBH domain (residues 143–268) was also immunoprecipiated
with GTSE1-HA, but an N-terminal EB1-GFP fragment (residues
1–143) was not (Figure S1B), suggesting the EB1 EBH domain was
also required for GTSE1 interaction.
To test if we could detect this interaction in vitro, we performed
an in vitro pull-down binding assay using a recombinant purified
GST-EB1 fusion protein incubated with in vitro translated 35S-
labeled GTSE1. GST-EB1, but not GST alone, was able to pull
down hGTSE1, confirming an interaction (Figure 2C). The
reciprocal experiment, using recombinant GST-GTSE1 and 35S-
in vitro translated EB1 further verified this result (Figure S1C).35S-labeled GTSE1 from mouse and Xenopus laevis was also pulled
GTSE1 Is a +TIP Required for Cell Migration
PLOS ONE | www.plosone.org 2 December 2012 | Volume 7 | Issue 12 | e51259
down by GST-EB1, further indicating that this interaction is
conserved (Figure S1D).
To determine if the interaction of GTSE1 with EB1 was
mediated through the conserved SKIP-like motifs, we mutated the
two leucine and proline residues within these motifs known to be
critical for the EB1 interaction in other proteins (SALP to SANN
and SGLP to SGNN; [20]), and again tested for pull down by
GST-EB1 (Figure 2C). These mutations indeed abolished the
interaction of GTSE1 with EB1. To test if these residues were also
critical in cells for the tip-tracking activity of GTSE1, we used
counterselection recombineering [40] to engineer the same
mutations into a GTSE1-GFP BAC transgene (‘‘GTSE1Sk’’).
Similar to EB1 depletion, mutation of tandem SxLP motifs in
GTSE1-GFP abolished interphase GTSE1-GFP tip tracking, but
not microtubule lattice association (Figure 2D, Movie S5,S6).
Together, these results identify GTSE1 as a +TIP that is recruited
to growing microtubule tips by interaction with EB1. A recent
screen for novel +TIPs containing SKIP-like motifs also identified
GTSE1 as one of 20 uncharacterized EB1-interacting proteins
[41].
GTSE1 Binds Directly to the Microtubule LatticeIndependent of EB1
During interphase, GTSE1 not only tracks growing microtu-
bules, but also associates with the MT lattice, in an EB1-
independent manner (Figure 1A,C; Figure 2D). To investigate
whether GTSE1 interacted with the microtubule lattice directly,
or was dependent on other factors, as is the tip localization, we first
asked if microtubules could pull down GTSE1 protein in a
microtubule co-sedimentation assay. In vitro-translated 35S-labeled
GTSE1 was incubated with taxol-stabilized microtubules or with
taxol and buffer alone (Figure 3A). With buffer alone, the majority
GTSE1 protein remained in the supernatant, while with the
addition of microtubules, the majority of GTSE1 protein was
pelleted along with the microtubules, consistent with an interac-
tion of GTSE1 with microtubules.
To confirm the ability of GTSE1 to bind microtubules, we
assayed for microtubule binding of purified recombinant
hGTSE1-GFP by total-internal-reflection fluorescence (TIRF)
microscopy. Purified hGTSE1-GFP and unlabeled tubulin were
added to rhodamine-labeled, GMPCPP stabilized microtubule
seeds. hGTSE1-GFP associated with the dynamic microtubule
lattice, and was highly enriched along the microtubule seeds,
confirming a direct interaction (Figure 3B, Movie S7). Therefore
Figure 1. GTSE1 is an EB1-dependent microtubule plus end growth tracking protein. (A) Still images of a live U2OS cell stably expressingGTSE1-GFP and mCherry-alpha-tubulin from Movie S1. GTSE1-GFP is enriched at growing microtubule plus ends, and also associated with themicrotubule lattice. (B) Western blot showing GTSE1 and EB1 levels after EB1 RNAi. U2OS cells stably expressing GFP-GTSE1 were transfected with acontrol (siCONT) or EB1 (siEB1) siRNA for 36 h. Blots were probed with antibodies against GFP, EB1 or actin (loading control). (C) Still images of liveU2OS cells expressing GTSE1-GFP after transfection with control (CON) or EB1 siRNA, from Movies S2 and S3. After EB1 depletion, GTSE1-GFP nolonger tracks growing microtubule ends, but remains associated with the microtubule lattice.doi:10.1371/journal.pone.0051259.g001
GTSE1 Is a +TIP Required for Cell Migration
PLOS ONE | www.plosone.org 3 December 2012 | Volume 7 | Issue 12 | e51259
the EB1-independent microtubule lattice localization of GTSE1 in
cells is most likely due to a direct interaction.
GTSE1+TIP Activity is Lost during Mitosis and Regulatedby Phosphorylation
Initial imaging of mitotic cells expressing GTSE1-GFP showed
no signs of microtubule tip-tracking [38]. To observe precisely
when GTSE1+TIP localization changes during mitosis, we filmed
stable cell lines expressing both GTSE1-GFP and EB3-mCherry,
which tracks microtubule plus-ends throughout the cell cycle.
Short-term time lapse movies of GTSE1-GFP mCherry-EB3 cells
stained with Hoechst (DNA) entering and exiting mitosis revealed
that while EB3 tip-tracking is consistent throughout, GTSE1 tip-
tracking stops at the prophase to prometaphase transition,
approximately concurrent with nuclear envelope breakdown,
and resumes coincident with anaphase onset (Figure 3C, Movie
S7,S8).
We previously reported that murine Gtse1 is hyperphosphory-
lated in mitosis in NIH3T3 cells [35], suggesting that the +TIP
activity of GTSE1 may be negatively regulated my phosphoryla-
tion. In order to closely analyze the tip-tracking ability of GTSE1
in defined cell cycle stages, we developed a system whereby
interphase or mitotic Xenopus extracts are flowed over purified
stabilized microtubules to observe microtubule dynamics by TIRF
microscopy (see methods). As in mammalian cells, endogenous
Xenopus gtse1 was hyperphosphorylated in mitotic extracts,
suggesting a similar regulation in Xenopus (Figure 3D). Adding
purified hGTSE1-GFP to interphase Xenopus extracts resulted in
dramatic tip-tracking behavior of the purified protein, in addition
to microtubule lattice association (Figure 3E; Movie S10). In
contrast, we did not observe any tip-tracking events when purified
hGTSE1-GFP was added to a mitotic extract (Figure 3E, Movie
S11). Purified hEB1-GFP maintained robust tip tracking in both
interphase and mitotic extracts under the same experimental
conditions (data not shown). Together these results confirmed that
as in mammalian cells, in Xenopus extracts GTSE1 is an interphase-
specific microtubule tip-tracking protein.
Recent studies have shown that the interaction between +TIP
proteins and EB1 can be regulated through phosphorylation of
sites located around SKIP motifs [18,20–22]. Notably, GTSE1
phosphorylation sites (TP) located directly adjacent to both SKIP-
like motifs (Figure 2A). Furthermore, a cell-cycle-dependent
phosphoproteome analysis in human cells identified GTSE1
peptides containing these TP sites as hyperphosphorylated in
mitosis (www.phosida.com; [42,43]). We independently identified
these specific residues as mitotic phosphorylation sites by mass
Figure 2. GTSE1 is recruited to microtubule plus ends through short EB1-interaction motifs. (A) Sequence alignment of hGTSE1 aminoacids 503–538 that contain tandem conserved SKIP-like motifs. The first four rows contain GTSE1 homologs from human (hs), mouse (mm), Xenopus(xl) and zebrafish (dr). The last three rows show conserved regions from other human +TIPs. SKIP-like motifs are highlighted in green boxes.Conserved TP motifs are highlighted in grey boxes. Basic residues are colored red, serines and threonines are colored blue. (B) GTSE1immunoprecipitates EB1 in U2OS cells. U2OS cell lysates were immunoprecipitated with anti-GTSE1 antibody, or anti-GFP as a control. Input lysateand immunoprecipitated fractions were run by SDS-PAGE and Western blotted with either anti-GTSE1 or anti-EB1 antibody. (C) In vitro pull-downbinding assay using purified GST or GST-EB1 fusion proteins incubated with in vitro translated 35S-labeled GTSE1 WT (hGTSE1 WT IVT) or GTSE1mutated at the SKIP motifs (L511N P512N L522N P523N) (GTSE1 Sk IVT). Inputs represent 20% of IVTs used for pull-down assays. The top gel showsIVT GTSE1 by autoradiograph, bottom gels are commassie stained. GST-EB1 interacts with in vitro translated GTSE1, but not GTSE1 mutated at SKIPmotifs. (D) Still images of live clonal U2OS cells expressing wild type GTSE1-GFP (GTSE1WT
204) or GTSE1-GFP mutated at the SKIP motifs (L511N P512NL522N P523N) (GTSE1Sk
202)(Movie S4). Similar to EB1 depletion, the mutated GTSE1-GFP does not track growing microtubule tips, but localizes to themicrotubule lattice. All scale bars represent 10 microns.doi:10.1371/journal.pone.0051259.g002
GTSE1 Is a +TIP Required for Cell Migration
PLOS ONE | www.plosone.org 4 December 2012 | Volume 7 | Issue 12 | e51259
GTSE1 Is a +TIP Required for Cell Migration
PLOS ONE | www.plosone.org 5 December 2012 | Volume 7 | Issue 12 | e51259
spectrometry as well (Table S1). To investigate if CDK1 activity
was responsible for negatively regulating the tip-tracking ability of
GTSE1, we performed the same assays for tip tracking as
described above in interphase Xenopus extracts, but after
stimulation of CDK1 activity. CDK1 activity is low in interphase
extracts, but can be stimulated by the addition of purified non-
degradable cyclinB (cyclinBD90) [44,45]. We found that shortly
after addition of cyclinBD90 and hGTSE1-GFP to interphase
extracts, hGTSE1-GFP no longer tracks growing MT tips
(Figure 3F, Movie S12), suggesting that CDK1 phosphorylation
of GTSE1 may abolish +TIP activity. Under the same conditions,
purified EB1 maintained robust tip tracking activity (Figure 3F,
Movie S13). These results are consistent with cell-cycle dependent
phosphorylation of GTSE1 confining +TIP activity to interphase,
most likely through disruption of the EB1-GTSE1 interaction by
phosphorylation around SxIP motifs. Interestingly, microtuble
lattice-binding of GTSE1 may also be affected by cell cycle stage
and CDK1 activity, as it was less prominent in mitotic extracts or
after addition of cyclinBD90 to interphase extracts.
The interphase-specific tip-tracking activity of GTSE1 prompt-
ed us to examine potential effects of GTSE1 depletion on the
interphase microtubule network and microtubule dynamics in
human cells. First, we observed the microtubule network in fixed
cells following RNAi depletion of GTSE1. Here we noticed that in
a small fraction of GTSE1-depleted cells the microtubule network
appeared slightly less radially organized, with microtubules
appearing more dense, more curved and more randomly
organized in relation to the cell center (Figure S2), although the
degree and occurrence of this observation was inconsistent. To
quantify potential defects in microtubule dynamics in interphase in
live cells, as has been reported for several, but not all, +TIP
proteins, we depleted GTSE1 by RNAi in human cells expressing
a fluorescently tagged EB3 protein, which allows one to follow the
dynamic properties of growing microtubules [46,47]. By analyzing
tracks of EB3 comets after GTSE1 RNAi, we found that in cells
depleted of GTSE1, overall microtubule growth velocities were
only slightly decreased (Figure S2). Additionally, the average track
length of growing microtubules, as well as the number of tracks
observed in GTSE1-depleted cells were only moderately decreased
(Figure S2). Although these analyses showed that GTSE1
depletion does have a slight impact on microtubule polymerization
dynamics, the minimal effects suggested that the primary
microtubule-related role of GTSE1 in interphase cells may not
be in regulating microtubule growth rates or the lifetime of growth
events, but potentially in other parameters of microtubule
function, or in tying dynamic microtubules to microtubule-
dependent processes through the plus end.
GTSE1 Modulates Cell Migration in an EB1-dependentManner
To shed light on possible interphase roles for GTSE1 activity,
we investigated the relative protein levels of GTSE1 in both non-
transformed and transformed cell lines, and across the cell cycle.
GTSE1 has been reported as significantly overexpressed in
different tumors [48–50], suggesting that cell cycle misregulation
and/or overexpression of an important GTSE1 activity may play a
role in cancer progression. We initially monitored GTSE1 protein
levels over a panel of non-transformed and transformed cell lines
with different degrees of tumorigenicity (Figure S3A). Five
different non-tumorigenic cell lines tested had very low GTSE1
levels. In contrast, all four tumorigenic cells lines tested had
dramatically elevated GTSE1 protein levels, suggesting a potential
correlation. GTSE1 expression has been shown in non-trans-
formed cells to be most abundant during the S and G2 phases of
the cell cycle [35–37]. To determine if the increased expression
levels in the transformed cell lines was due to enrichment in any
specific phase of the cell cycle relative to non-transformed cells, we
FACS sorted Wi38 (non-transformed, human diploid fibroblast)
and U2OS (transformed) cell lines into fractions enriched for cells
in G1, S, or G2/M phases of the cell cycle. GTSE1 protein levels
in each fraction were analyzed by western blot, normalized to
actin levels. While this analysis showed that that GTSE1 levels
were elevated across all cell cycle phases in the transformed cells,
particularly noticeable was that in non-transformed cells, GTSE1
protein appears to be restricted to very low levels in G1, while in
transformed cells, it is as abundant in G1 as it is in the maximal G2
levels of normal cells (Figure S3B, compare lanes 2, 4, and 6).
Invasion of cancer cells has been reported to occur preferen-
tially in G1 phase of the cell cycle [51], and in several cell types
studied the potential for migration is highest in G1 [52–54],
suggesting that misregulation of proteins in G1 may stimulate
migration. EB1 has been shown to be required for efficient
migration in both nontransformed and transformed cells, and is
expressed at similar levels throughout the cell cycle [23–25]. The
increased G1 expression of GTSE1 in transformed cells, combined
with the EB1-dependent localization of GTSE1 to growing
microtubule ends, prompted us to ask whether GTSE1 levels
may potentiate cell migration.
We first performed a wound-healing assay in U2OS cells in
which cells are induced to migrate by creating a scratch in a
confluent layer. While control-transfected cells almost completely
invaded the wound after 36 hours, cells depleted of GTSE1
migrated into the wound more slowly (Figure S3C). As a more
accurate means of measuring cell motility, we performed
transwell-migration assays with the same cellular background.
Again, depletion of GTSE1 by RNAi resulted in less migration
than control cells (Figure 4A). Cell proliferation was not affected
under these same conditions, indicating the observed effect was
due to migration per se (Table S2). To determine if reducing
GTSE1 levels would also affect migration in non-transformed
cells, we depleted GTSE1 by RNAi in Wi38 cells, and measured
transwell migration. Migration was significantly reduced in these
cells as well (Figure 4B).
Figure 3. GTSE1 binds directly to the microtubule lattice and stops tip tracking in mitosis. (A) Microtubule co-sedimentation assay. Invitro translated 35S-labeled GTSE1 (GTSE1 IVT) was incubated with taxol-stabilized microtubules (MTs +) or with taxol-containing buffer (withoutmicrotubules; MTs 2). Supernatant (SN) and pellet (P) fractions were separated by SDS-PAGE and the presence of GTSE1 in each fraction wasdetected by autoradiography. (B) Still images of a TIRF field showing GTSE1-GFP (left panel) binding to rhodamine-labeled GMPCPP seeds (rightpanel) and along the growing MT lattice. Scale bar represents 2 microns. (C) Still images of live U2OS cells stably expressing GTSE1-GFP and EB3-mCherry with DNA labeled with Hoechst, from Movie S5. Time GTSE1-GFP tracks growing plus ends in prophase, but not 8 minutes later inprometaphase. Scale bar represents 10 microns. (D) Western blot of endogenous GTSE1 in Xenopus meiotic (M) and interphase (I) extract. (E) Stillimages of TIRF fields and representative kymographs of GMPCPP-stabilized microtubules incubated with interphase (Movie S7) or mitotic (Movie S8)Xenopus egg extracts and purified hGTSE1-GFP protein. Horizontal scale bar represents 5 microns, vertical scale bar 10 seconds. (F) Still images of TIRFfields and representative kymographs of GMPCPP-stabilized microtubules incubated with mitotic Xenopus egg extracts and purified hGTSE1-GFP orEB1-GFP protein, after addition of purified cyclinBD90, from Movies S9 and S10.doi:10.1371/journal.pone.0051259.g003
GTSE1 Is a +TIP Required for Cell Migration
PLOS ONE | www.plosone.org 6 December 2012 | Volume 7 | Issue 12 | e51259
GTSE1 Is a +TIP Required for Cell Migration
PLOS ONE | www.plosone.org 7 December 2012 | Volume 7 | Issue 12 | e51259
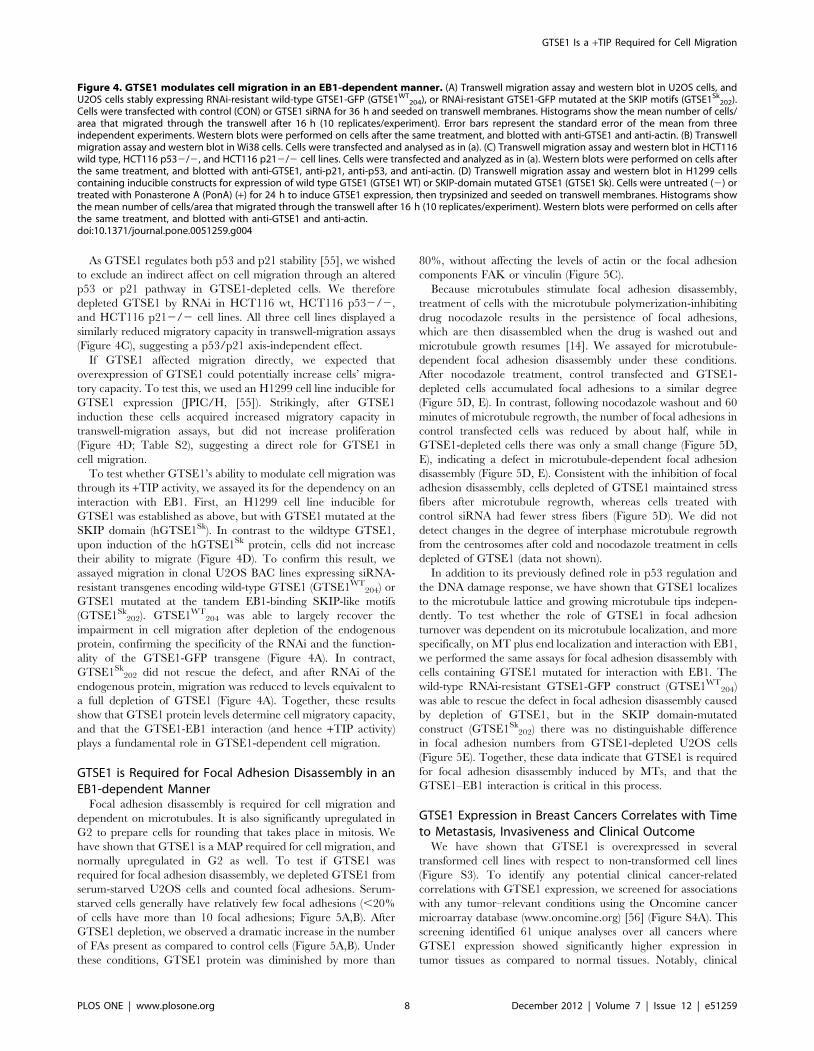
As GTSE1 regulates both p53 and p21 stability [55], we wished
to exclude an indirect affect on cell migration through an altered
p53 or p21 pathway in GTSE1-depleted cells. We therefore
depleted GTSE1 by RNAi in HCT116 wt, HCT116 p532/2,
and HCT116 p212/2 cell lines. All three cell lines displayed a
similarly reduced migratory capacity in transwell-migration assays
(Figure 4C), suggesting a p53/p21 axis-independent effect.
If GTSE1 affected migration directly, we expected that
overexpression of GTSE1 could potentially increase cells’ migra-
tory capacity. To test this, we used an H1299 cell line inducible for
GTSE1 expression (JPIC/H, [55]). Strikingly, after GTSE1
induction these cells acquired increased migratory capacity in
transwell-migration assays, but did not increase proliferation
(Figure 4D; Table S2), suggesting a direct role for GTSE1 in
cell migration.
To test whether GTSE1’s ability to modulate cell migration was
through its +TIP activity, we assayed its for the dependency on an
interaction with EB1. First, an H1299 cell line inducible for
GTSE1 was established as above, but with GTSE1 mutated at the
SKIP domain (hGTSE1Sk). In contrast to the wildtype GTSE1,
upon induction of the hGTSE1Sk protein, cells did not increase
their ability to migrate (Figure 4D). To confirm this result, we
assayed migration in clonal U2OS BAC lines expressing siRNA-
resistant transgenes encoding wild-type GTSE1 (GTSE1WT204) or
GTSE1 mutated at the tandem EB1-binding SKIP-like motifs
(GTSE1Sk202). GTSE1WT
204 was able to largely recover the
impairment in cell migration after depletion of the endogenous
protein, confirming the specificity of the RNAi and the function-
ality of the GTSE1-GFP transgene (Figure 4A). In contract,
GTSE1Sk202 did not rescue the defect, and after RNAi of the
endogenous protein, migration was reduced to levels equivalent to
a full depletion of GTSE1 (Figure 4A). Together, these results
show that GTSE1 protein levels determine cell migratory capacity,
and that the GTSE1-EB1 interaction (and hence +TIP activity)
plays a fundamental role in GTSE1-dependent cell migration.
GTSE1 is Required for Focal Adhesion Disassembly in anEB1-dependent Manner
Focal adhesion disassembly is required for cell migration and
dependent on microtubules. It is also significantly upregulated in
G2 to prepare cells for rounding that takes place in mitosis. We
have shown that GTSE1 is a MAP required for cell migration, and
normally upregulated in G2 as well. To test if GTSE1 was
required for focal adhesion disassembly, we depleted GTSE1 from
serum-starved U2OS cells and counted focal adhesions. Serum-
starved cells generally have relatively few focal adhesions (,20%
of cells have more than 10 focal adhesions; Figure 5A,B). After
GTSE1 depletion, we observed a dramatic increase in the number
of FAs present as compared to control cells (Figure 5A,B). Under
these conditions, GTSE1 protein was diminished by more than
80%, without affecting the levels of actin or the focal adhesion
components FAK or vinculin (Figure 5C).
Because microtubules stimulate focal adhesion disassembly,
treatment of cells with the microtubule polymerization-inhibiting
drug nocodazole results in the persistence of focal adhesions,
which are then disassembled when the drug is washed out and
microtubule growth resumes [14]. We assayed for microtubule-
dependent focal adhesion disassembly under these conditions.
After nocodazole treatment, control transfected and GTSE1-
depleted cells accumulated focal adhesions to a similar degree
(Figure 5D, E). In contrast, following nocodazole washout and 60
minutes of microtubule regrowth, the number of focal adhesions in
control transfected cells was reduced by about half, while in
GTSE1-depleted cells there was only a small change (Figure 5D,
E), indicating a defect in microtubule-dependent focal adhesion
disassembly (Figure 5D, E). Consistent with the inhibition of focal
adhesion disassembly, cells depleted of GTSE1 maintained stress
fibers after microtubule regrowth, whereas cells treated with
control siRNA had fewer stress fibers (Figure 5D). We did not
detect changes in the degree of interphase microtubule regrowth
from the centrosomes after cold and nocodazole treatment in cells
depleted of GTSE1 (data not shown).
In addition to its previously defined role in p53 regulation and
the DNA damage response, we have shown that GTSE1 localizes
to the microtubule lattice and growing microtubule tips indepen-
dently. To test whether the role of GTSE1 in focal adhesion
turnover was dependent on its microtubule localization, and more
specifically, on MT plus end localization and interaction with EB1,
we performed the same assays for focal adhesion disassembly with
cells containing GTSE1 mutated for interaction with EB1. The
was able to rescue the defect in focal adhesion disassembly caused
by depletion of GTSE1, but in the SKIP domain-mutated
construct (GTSE1Sk202) there was no distinguishable difference
in focal adhesion numbers from GTSE1-depleted U2OS cells
(Figure 5E). Together, these data indicate that GTSE1 is required
for focal adhesion disassembly induced by MTs, and that the
GTSE1–EB1 interaction is critical in this process.
GTSE1 Expression in Breast Cancers Correlates with Timeto Metastasis, Invasiveness and Clinical Outcome
We have shown that GTSE1 is overexpressed in several
transformed cell lines with respect to non-transformed cell lines
(Figure S3). To identify any potential clinical cancer-related
correlations with GTSE1 expression, we screened for associations
with any tumor–relevant conditions using the Oncomine cancer
microarray database (www.oncomine.org) [56] (Figure S4A). This
screening identified 61 unique analyses over all cancers where
GTSE1 expression showed significantly higher expression in
tumor tissues as compared to normal tissues. Notably, clinical
Figure 4. GTSE1 modulates cell migration in an EB1-dependent manner. (A) Transwell migration assay and western blot in U2OS cells, andU2OS cells stably expressing RNAi-resistant wild-type GTSE1-GFP (GTSE1WT
204), or RNAi-resistant GTSE1-GFP mutated at the SKIP motifs (GTSE1Sk202).
Cells were transfected with control (CON) or GTSE1 siRNA for 36 h and seeded on transwell membranes. Histograms show the mean number of cells/area that migrated through the transwell after 16 h (10 replicates/experiment). Error bars represent the standard error of the mean from threeindependent experiments. Western blots were performed on cells after the same treatment, and blotted with anti-GTSE1 and anti-actin. (B) Transwellmigration assay and western blot in Wi38 cells. Cells were transfected and analysed as in (a). (C) Transwell migration assay and western blot in HCT116wild type, HCT116 p532/2, and HCT116 p212/2 cell lines. Cells were transfected and analyzed as in (a). Western blots were performed on cells afterthe same treatment, and blotted with anti-GTSE1, anti-p21, anti-p53, and anti-actin. (D) Transwell migration assay and western blot in H1299 cellscontaining inducible constructs for expression of wild type GTSE1 (GTSE1 WT) or SKIP-domain mutated GTSE1 (GTSE1 Sk). Cells were untreated (2) ortreated with Ponasterone A (PonA) (+) for 24 h to induce GTSE1 expression, then trypsinized and seeded on transwell membranes. Histograms showthe mean number of cells/area that migrated through the transwell after 16 h (10 replicates/experiment). Western blots were performed on cells afterthe same treatment, and blotted with anti-GTSE1 and anti-actin.doi:10.1371/journal.pone.0051259.g004
GTSE1 Is a +TIP Required for Cell Migration
PLOS ONE | www.plosone.org 8 December 2012 | Volume 7 | Issue 12 | e51259
Figure 5. GTSE1 modulates focal adhesion disassembly in an EB1-dependent manner. (A) Immunofluorescence of U2OS cells transfectedwith control (CON) or GTSE1 siRNA for 24 h followed by serum starvation for 48 h, stained for vinculin. Focal adhesions persist in cells depleted ofGTSE1. Scale bar represents 10 microns. (B) Quantification of focal adhesion (FA) disassembly from experiments from (A). The percentage of cellscontaining 10 or more focal adhesions after serum starvation-induced disassembly was determined (n = .50 cells per experiment, 3 experiments foreach condition). * indicates p,0.05 as determined by a Student’s t test. (C) Western blot of U2OS cells transfected with control (CON) or GTSE1 siRNAand serum-starved for 48 h, blotted with anti-GTSE1, anti-FAK, anti-vinculin, and anti-actin. (D) Immunofluorescence of U2OS cells transfected withcontrol (CON) or GTSE1 siRNA for 36 hours. Cells were imaged after treatment with nocodazole for 4 hours, and 60 minutes following washout ofnocodazole to allow microtubule regrowth. Cells are stained for vinculin and actin. GTSE1-depleted cells contain more focal adhesions that wild-typefollowing microtubule regrowth. Scale bar represents 10 microns. (E) Quantification of focal adhesion disassembly in U2OS cells, following the assay
GTSE1 Is a +TIP Required for Cell Migration
PLOS ONE | www.plosone.org 9 December 2012 | Volume 7 | Issue 12 | e51259
outcome correlated with increased GTSE1 expression in 12 cases,
10 of which were in breast cancer.
To delve deeper into clinical correlations with GTSE1
expression, we analyzed several microarray data sets of breast
cancer, collectively consisting of more than 2000 patients. Kaplan-
Meier survival analysis of the combined data sets showed that
breast cancer patients expressing higher GTSE1 levels in tumors
displayed both shorter survival time (p,1029; Fig. S4B) and a
shorter time to distant metastasis (p,10215; Fig. 6A, Figure S4C).
We also found a significant correlation between GTSE1 expres-
sion and the grade of breast cancers, with the most invasive and
aggressive cancers (Grade 3) showing highest expression of GTSE1
(Figure 6B). Together these data show a correlative relationship
between the misregulation and overexpression of GTSE1 found in
tumors, and tumor invasiveness and prognosis.
To investigate the significance of GTSE1 expression levels in
the context of breast cancer cell lines, we next analyzed a panel of
lines of varying breast cancer tumor types with different degrees of
invasive potential for both GTSE1 and EB1 protein levels. As is
shown in Figure 6C, two lines with low invasive potential,
MCF10A and MCF7, have relatively low GTSE1 and EB1
protein levels compared to three highly invasive lines, MDA-MB-
231, MDA-MB-468, and MDA-MB-157.
We next looked for a causal link between GTSE1 expression
and migratory ability in two breast cancer cell lines. The MCF-7
cell line is a non-tumorigenic, non-invasive breast cancer line with
very low invasiveness and migratory capability, often used to study
potential factors that stimulate metastasis [57]. In contrast, MBA-
MD-231 is a highly metastatic, invasive and tumorigenic breast
cancer cell line with a relatively high migratory capacity. In
addition to containing higher protein levels for both GTSE1 and
EB1 (Figure 6C), the more invasive MBA-MD-231 cells had 3-fold
more GTSE1 mRNA expression as MCF7 cells as measured by
RT-PCR, with EB1 also significantly increased. Transwell
migration assays on these cell lines confirmed their expected
migratory abilities (Figure 6E, F). We next tested whether
modulating GTSE1 expression levels in these lines would
correspondingly affect their migratory ability. Indeed, siRNA-
mediated reduction in MBA-MD-231 cells significantly reduced
their migration (Figure 6E). Furthermore, increasing GTSE1
expression levels through a retroviral vector in the poorly invasive
MCF-7 cell line dramatically increased its migration to levels 4-
fold higher than control cells (Figure 6F). In both cases, cell
proliferation was not affected (Table S2). Thus GTSE1 protein
levels correlate with invasiveness and metastasis in clinical breast
cancer tumors, and determine cell migratory capacity in breast
cancer cell lines.
Discussion
Here we have identified GTSE1 as a microtubule-associated
and plus-end tracking protein required to promote cell migration.
GTSE1 localizes to growing microtubule tips through interaction
with the EB1+TIP, and this interaction and localization is required
for GTSE1’s role in cell migration, as well as for turnover of focal
adhesion complexes.
Depletion of EB1 from cells has been shown to affect cell
migration [23–25], but this effect has been mostly ascribed to MT
interaction and stabilization at the cell cortex at the leading edge
of migrating cells. Here we have identified the EB1-dependent
+TIP activity of GTSE1, which is required for its role in cell
migration, as also required to support microtubule-dependent
disassembly of focal adhesions. Several elegant studies have
demonstrated that microtubule targeting of focal adhesions
induces their disassembly [12–14,58]. One +TIP, ACF7, has been
previously shown to play a role in focal adhesion disassembly.
ACF7 binds both actin and microtubules and is proposed to
mediate the targeting of MTs to focal adhesions by guiding them
along F-actin [28,31]. However, the mechanism by which focal
adhesions are then triggered to disassemble remains elusive.
Clathrin-mediated endocytosis has emerged as an important step
in this process [58,59]. One hypothesis is that microtubules serve
as tracks to deliver undefined ‘‘relaxing factors’’ via motor
proteins, which eventually lead to clathrin endocytosis of focal
adhesion complexes [12,60]. Alternatively, or in combination,
proteins located at the growing plus tip would be ideally positioned
to directly activate focal adhesion disassembly. In this context,
GTSE1’s requirement for focal adhesion disassembly is intriguing,
considering that it is not only a +TIP, but also clearly associates
with clathrin complexes. We have previously shown by affinity-
purification mass spectrometry analysis that GTSE1 significantly
associates with a large number of clathrin subunits and clathrin-
associated proteins, both in mitosis [38] and interphase (unpub-
lished data). GTSE1 is also enriched in clathrin heavy chain
immunoprecipitations in mitosis [38] and found associated with
clathrin cages in interphase [39]. It will therefore be interesting in
future studies to precisely define a role of the GTSE1-clathrin
interaction in FA disassembly.
It is also possible that the effect of GTSE1 on focal adhesion
disassembly could be through modulation of microtubule dynam-
ics, which then affects the targeting dynamics. Overexpression of
GTSE1 has a clear effect of increasing cell migratory capacity,
indicating the mechanism by which it acts supports gain of
function alteration. After GTSE1 depletion, we did observe a
small reduction in microtubule growth velocity, as well as the
number of growth events and length of growth events. The degree
to which these properties were reduced (,10–15%) were,
however, moderate when compared to the reduction after
depletion of other +TIPs known to inhibit microtubule dynamics,
such as SLAIN2 and Ch-Tog (60% and 40% reduction in growth
velocity, respectively) [21,47]. Nevertheless, we cannot rule out
that these changes may contribute to the focal adhesion
disassembly defect, or that other aspects of microtubule dynamics
or stability are affected. We did observe subtle changes in the
overall organization of the MT lattice after depletion of GTSE1,
similar to those reported after depletion of SLAIN2 or ch-TOG
[21]. SLAIN2 interacts with ch-TOG and modulates its localiza-
tion to growing microtubule plus ends. Ch-TOG also co-
immunoprecipitates with GTSE1 [38], suggesting a potential
overlap in the function of these proteins.
Consistent with a specialized role for its +TIP activity, GTSE1
does not track growing microtubule tips during mitosis, when cells
are rounded up and immotile, even though it is at peak expression
levels. The confinement of GTSE1+TIP activity to interphase is
likely the result of the mitotic phosphorylation events at residues
around the EB1 interaction domain, which could disrupt the
interaction between GTSE1 and EB1, such that it is no longer
recruited to growing microtubule tips. Similar regulation of plus-
described in (D). Cells stably expressing RNAi-resistant wild-type GTSE1-GFP (GTSE1WT204) or GTSE1-GFP mutated at the SKIP motifs (GTSE1Sk
202) wereadditionally assayed. Quantification was performed as described in (B). Cells containing only mutant GTSE1 unable to interact with EB1 or trackgrowing microtubule ends are deficient for microtubule-dependent focal adhesion disassembly.doi:10.1371/journal.pone.0051259.g005
GTSE1 Is a +TIP Required for Cell Migration
PLOS ONE | www.plosone.org 10 December 2012 | Volume 7 | Issue 12 | e51259
GTSE1 Is a +TIP Required for Cell Migration
PLOS ONE | www.plosone.org 11 December 2012 | Volume 7 | Issue 12 | e51259
end tracking and EB1 interaction has been reported for other
+TIPs [18,20–22]. Our studies point to the cell cycle kinase CDK1
as playing a role in regulating GTSE1 plus-end tracking, but we
cannot rule out an indirect effect. In human cells, the timing of the
loss and recurrence of GTSE1+TIP activity correlates well with
CDK1 activity, particularly evident in the rapid onset of tip
tracking at anaphase onset (Movie S9). The phosphorylation of the
+TIP SLAIN2 that disrupts the interaction with EB1 during
mitosis contains the same conserved CDK1 sites (Figure 2A), and
was also shown to be CDK1 dependent, indicating a common
mechanism [21].
As normal cells transition from mitosis into G1, the high levels
of GTSE1 protein are returned to very low levels by degradation
through Cdh1-APC [35,36,61]. GTSE1 only starts to become
abundant again in S phase, and protein levels increase through G2
and into prophase, where focal adhesion disassembly and cell
rounding is at a peak. Thus, GTSE1+TIP activity appears to be
carefully regulated by the cell to reach maximum levels in the S
and G2 phases in two ways: through inhibitory phosphorylation in
mitosis and through cell-cycle dependent expression control.
In this regard, it is notable that sequence analysis of GTSE1
shows that large portions of GTSE1 are likely intrinsically
disordered. Intrinsically disordered proteins (IDPs) are often
involved in signaling and regulatory functions, and many have
been implicated as misregulated in human diseases [62,63]. This
relates to the observation that IDPs are often subject to tight
regulation in cells, through control of protein synthesis, degrada-
tion, and post-translational modification. Due to the nature of
their disordered sequences, IDPs are particularly sensitive to
misregulation. Inappropriate protein levels and activities of IDPs
at times and places in the cell outside of their normally controlled
functions often result in the alteration of protein interactions and
signaling pathways. The inappropriately high levels of GTSE1
expression in G1 in transformed cells indicates loss of its normally
tight regulatory pathways, as occurs with many IDPs. Similarly,
the very tightly controlled low expression levels of GTSE1 in G1 in
normal cells may suggest that at this stage cells are particularly
sensitive to modulators of focal adhesion disassembly affecting
migration. It can thus be hypothesized that transformed cells are
hijacking a primarily G2-restricted function of increased focal
adhesion dynamics in normal cells, by maintaining increased
GTSE1 levels in G1 to sustain high levels of unregulated migration
and invasion.
Interestingly, upregulation of GTSE1 expression was identified
as a potential marker for metastasis in oral tongue squamous cell
carcinoma [48]. More recently, GTSE1 was identified as one of
three cell cycle regulatory genes (along with CDKN3 and Cyclin
B1) whose upregulation in gastroenteropancreatic neuroendocrine
tumors correlate with metastasis [50]. These observations are
consistent with our finding that in breast cancer patients, GTSE1
mRNA expression levels correlate with time to metastasis and
tumor grade. Two major hallmarks of cells that have acquired
metastatic capabilities are loss of adhesion properties and an
increase in cell motility, which together help to promote invasion
as well as angiogenesis [1–4]. Here we have shown that the
molecular activity of GTSE1 leading to stimulation of cell
migration and loss of focal adhesions is EB1-dependent microtu-
bule plus-end tracking, providing an intriguing link between
microtubule plus-end functions and metastasis.
Materials and Methods
Cloning and PlasmidsThe BAC RP11-1152E11 containing hGTSE1 was purchased
from BACPAC Resources Center. A ‘LAP’ tag cassette [64] was
recombined at the C-terminus of hGTSE1 by Red E/T-based
recombination [65]. Point mutations were introduced in the
hGTSE1 BAC through counterselection recombineering based on
an RpsL-amp cassette and dual Redb and Redc expression
(pABRG) as described [40]. The RNAi-resistant GTSE1 mutation
(contained in GTSE1WT204 and GTSE1Sk
202) changed the siRNA
target site GATTCATACAGGAGUCAAA to GGTTTATC-
CAAGAAAGTAA.
pcDNA3-HA-hGTSE1 was previously described [33]. GST-
hGTSE1 contains the full-length hGTSE1 fused to GST (pGEX-
4T1, GE Healthcare). The construct pIND-hGTSE1 used to
generate PonA - inducible cell lines was previously described [55].
pBABE-Puro-hGTSE1 was constructed by subcloning full-length
hGTSE1 into the pBABE-Puro retroviral vector. pEGFP N1-EB1
and pGEX (6p-2)-EB1 [66] were a generous gift from Bert
Vogelstein. pEGFP N1-EB1-N and pEGFP N1-EB1-C encode for
deletion mutants of EB1 from amino acids 1–143 and 143–268
respectively, and were generated by PCR using pEGFP N1-EB1 as
the template.
Cell Lines and Cell CultureWi38, MCF10A, U2OS and H1299 cell lines were obtained
from ATCC. All cell lines were grown in DMEM containing 10%
fetal bovine serum, 2 mM L-glutamine, 100 U/ml penicillin and
100 mg/ml streptomycin at 37uC and 5% CO2, with the exception
of the H1299 (JPIC/H) cell line (RPMI-1640 medium), R1/E
(DMEM, 20% FCS, 50 mM beta-Mercaptoethanol, 1x non-
ml streptomycin, and 13 ng/ml mouse LIF (Leukemia inhibitory
factor)), Wi38 (MEM 10%FBS and non essential aminoacids),
MCF10A (DMEM/F12 5% horse serum, 10 mM HEPES, 20 ng/
ml EGF, 100 ng/ml cholera toxin, 0,01 mg/ml insulin and
500 ng/ml hydrocortisone) and MASC [67] (60% DMEM
Figure 6. GTSE1 expression in breast cancer tumors and cells correlates with time to metastasis and invasiveness. (A) Kaplan–Meiersurvival curve of time to distant metastasis of breast cancer patients classified according to the expression of GTSE1. Red line: cases with highexpression of GTSE1, blue line: cases with low expression of GTSE1. (p-value ,10–15) (B) Boxplots of the distribution of gene expression intensities ofGTSE1 across different breast cancer subtypes (Grade 1, 2 or 3; p,10-5; linear regression analysis),. (C) Western blot analysis of GTSE1 and EB1 proteinlevels in different breast cancer cell lines. Tumor types are: F, fibrocystic disease, non-transformed, immortal cell line; IDC, invasive ductal carcinoma;AC, adenocarcinoma; MC, metaplastic carcinoma. Invasive potential is characterized as not invasive (2), invasive (+), or highly invasive (++). Adaptedfrom Neve et al. Cancer Cell 2006. (D) Quantitative RT-PCR analysis of GTSE1 and EB1 relative mRNA levels in MCF7 and MDA-MB-231 cells. Error barsrepresent the standard error of the mean from three independent experiments. p,0.01 (Student’s t-test). (E) Transwell migration assay and westernblot of the MDA-MB-231 cell line. Cells were transfected with control (CON) or GTSE1 siRNA for 36 hours, trypsinized, and seeded on transwellmembranes. Histograms show the mean number of cells/area that migrated through the transwell after 16 h (10 replicates/experiment). Error barsrepresent the standard error of the mean from three independent experiments. * indicates p,0.05 (Student’s t-test). Western blots were performedon cells after the same treatment, and blotted with anti-GTSE1 and anti-actin. (F) Transwell migration assay and western blot of the MCF7 cell linecontaining a stably integrated GTSE1 overexpression construct (pBABE-GTSE1) or empty vector (pBABE). Cells were trypsinized and seeded ontranswell membranes. Histograms show the mean number of cells/area that migrated through the transwell after 16 h (10 replicates/experiment).Western blots were performed on cells after the same treatment, and blotted with anti-GTSE1 and anti-actin.doi:10.1371/journal.pone.0051259.g006
GTSE1 Is a +TIP Required for Cell Migration
PLOS ONE | www.plosone.org 12 December 2012 | Volume 7 | Issue 12 | e51259
multipotent adult stem cells), Wi38, and IMR-90. Transformed
cell lines are MCF10A, MCF7, MDA-MB-231, HCT116, and
U2OS. (B) Western blot showing GTSE1 levels in different cell
cycle stages in non-transformed (Wi38) and transformed (U2OS)
cell lines. Cells were enriched for cell cycle phases by FACS
sorting, and loading was normalized to actin levels. (C) Wound
healing migration assay in U2OS cells transfected with a control
(CON) or GTSE1 siRNA for 36 hours. Images were taken
immediately after cell scraping (0 h) and after 36 hours (36 h).
(TIF)
Figure S4 GTSE1 expression in breast cancers corre-lates with clinical outcome and time to metastasis. (A)
Disease Summary for GTSE1: this view displays the number of
significant results colored in red or blue for over- or under-
expression, respectively, across all cancer types and analysis types
in Oncomine. (B) Kaplan–Meier survival curve of breast cancer
patients classified according to the expression of GTSE1. Red line:
cases with high expression of GTSE1, blue line: cases with low
expression of GTSE1. (p,10‘29) (C) Table describing the
patients split for the Kaplan–Meier survival curve of time to
distant metastasis (TDM) of breast cancer patients classified
according to the expression of GTSE1.
( )
Table S1 Class I phosphorylation sites surroundingSKIP motifs (503–538) in GTSE1 in mitotic HeLa cells.
(XLSX)
Table S2 Measurement of cell proliferation by cellcounting associated with migration assays.
(XLSX)
Movie S1 GTSE1 colocalizes with growing MT plusends. U2OS cell stably expressing GTSE1-GFP and mCherry-
alpha-tubulin.
(MOV)
GTSE1 Is a +TIP Required for Cell Migration
PLOS ONE | www.plosone.org 15 December 2012 | Volume 7 | Issue 12 | e51259
TIF
Movie S2 GTSE1 tracks growing MT plus ends in mEScells. Mouse embryonic stem cell (R1/E) stably expressing
GTSE1-GFP.
(MOV)
Movie S3 GTSE1 tracks growing MT plus ends in U2OScells. U2OS GTSE1-GFP cells after CON RNAi.
(MOV)
Movie S4 GTSE1 does not track growing MT plus endsafter EB1 RNAi. U2OS GTSE1-GFP cells after EB1 RNAi.
(MOV)
Movie S5 GTSE1-GFP tracks growing MT plus ends.U2OS cells expressing wild type GTSE1-GFP (GTSE1WT
204)
(MOV)
Movie S6 Mutations in GTSE1 ‘SKIP’ motifs abolishtracking of MT plus ends. U2OS cells containing GTSE1-
GFP mutated at tandem ‘SKIP’ motifs (GTSE1Sk202). Mutated
GTSE1 does not track growing MT plus ends.
(MOV)
Movie S7 Purified GTSE1-GFP bind to microtubules.Purified recombinant hGTSE1-GFP and unlabeled tubulin were
added to rhodamine-labeled, GMPCPP stabilized microtubule
seeds and imaged by TIRF microscopy.
(MOV)
Movie S8 GTSE1 microtubule plus-end tracking isdownregulated at prometaphase. U2OS cell stably express-
ing GTSE1-GFP and EB3-mCherry, stained with Hoechst (DNA).
As the cells entered mitosis, short time-lapse movies were acquired
every 3 minutes, then stitched together.
(AVI)
Movie S9 GTSE1 microtubule plus-end tracking resu-mes at anaphase onset. U2OS cell stably expressing GTSE1-
GFP and EB3-mCherry, stained with Hoechst (DNA). As
metaphase cells entered anaphase, short time-lapse movies were
acquired every 3 minutes, then stitched together.
(AVI)
Movie S10 Purified hGTSE1-GFP tracks microtubuleplus ends in interphase Xenopus extract. GMPCPP-
stabilized microtubules incubated with interphase Xenopus egg
extracts and purified hGTSE1-GFP protein imaged by TIRF
microscopy.
(MOV)
Movie S11 Purified hGTSE1-GFP does not track micro-tubule plus ends in mitotic Xenopus extract. GMPCPP-
stabilized microtubules incubated with mitotic Xenopus egg extracts
and purified hGTSE1-GFP protein imaged by TIRF microscopy.
(MOV)
Movie S12 Purified hGTSE1-GFP does not track micro-tubule plus ends in interphase Xenopus extract afteraddition of purified CyclinBD90. GMPCPP-stabilized mi-
crotubules incubated with interphase Xenopus egg extracts, purified
hGTSE1-GFP protein, and purified CyclinBD90, imaged by
TIRF microscopy.
(MOV)
Movie S13 Purified EB1-GFP tracks microtubule plusends in interphase Xenopus extract after addition ofpurified CyclinBD90. GMPCPP-stabilized microtubules incu-
bated with interphase Xenopus egg extracts, purified EB1-GFP
protein, and purified CyclinBD90, imaged by TIRF microscopy.
(MOV)
Acknowledgments
The authors would like to thank Marco Heinrich from the Albert Heck lab
in Utrecht for performing the SCX separation for the phosphoproteomic
analysis
Author Contributions
Conceived and designed the experiments: MS PW SP DRB SR AAH CS
AWB. Performed the experiments: MS PW SP DRB SR LP YC NH MI
MM AWB. Analyzed the data: MS PW SP SR LP YC NH MI CS AWB.
Contributed reagents/materials/analysis tools: MS PW MI JE AWB.
Wrote the paper: MS CS AWB.
References
1. Zhao X, Guan J-L (2011) Focal adhesion kinase and its signaling pathways in
cell migration and angiogenesis. Advanced Drug Delivery Reviews 63: 610–615.
doi:10.1016/j.addr.2010.11.001.
2. Li D-M, Feng Y-M (2011) Signaling mechanism of cell adhesion molecules in
breast cancer metastasis: potential therapeutic targets. Breast Cancer Res Treat
128: 7–21. doi:10.1007/s10549-011-1499-x.
3. Thiery JP (2002) Epithelial–mesenchymal transitions in tumour progression. Nat
Rev Cancer 2: 442–454. doi:10.1038/nrc822.
4. Palmer TD, Ashby WJ, Lewis JD, Zijlstra A (2011) Targeting tumor cell motility
to prevent metastasis. Advanced Drug Delivery Reviews 63: 568–581.
doi:10.1016/j.addr.2011.04.008.
5. Kaverina I, Straube A (2011) Regulation of cell migration by dynamic
microtubules. Seminars in Cell and Developmental Biology 22: 968–974.
doi:10.1016/j.semcdb.2011.09.017.
6. Bhat KMR, Setaluri V (2007) Microtubule-Associated Proteins as Targets in
Cancer Chemotherapy. Clinical Cancer Research 13: 2849–2854. doi:10.1158/
1078-0432.CCR-06-3040.
7. Thompson SL, Compton DA (2010) Chromosomes and cancer cells.
Chromosome Res 19: 433–444. doi:10.1007/s10577-010-9179-y.
8. Mitchison TJ (2011) The proliferation rate paradox in antimitotic chemother-
24. Schober JM, Cain JM, Komarova YA, Borisy GG (2009) Migration and actinprotrusion in melanoma cells are regulated by EB1 protein. Cancer Letters 284:
30–36. doi:10.1016/j.canlet.2009.04.007.25. Pagano A, Honore S, Mohan R, Berges R, Akhmanova A, et al. (2012)
Epothilone B inhibits migration of glioblastoma cells by inducing microtubulecatastrophes and affecting EB1 accumulation at microtubule plus ends.
30. Nakano A, Kato H, Watanabe T, Min K-D, Yamazaki S, et al. (2010) AMPKcontrols the speed of microtubule polymerization and directional cell migration
through CLIP-170 phosphorylation. Nat Cell Biol 12: 583–590. doi:10.1038/ncb2060.
31. Kodama A, Karakesisoglou I, Wong E, Vaezi A, Fuchs E (2003) ACF7: an
essential integrator of microtubule dynamics. Cell 115: 343–354.32. Liu XS, Li H, Song B, Liu X (2010) Polo-like kinase 1 phosphorylation of G2
and S-phase-expressed 1 protein is essential for p53 inactivation during G2checkpoint recovery. EMBO Rep: 1–7. doi:10.1038/embor.2010.90.
33. Monte M, Benetti R, Buscemi G, Sandy P, Del Sal G, et al. (2003) The cellcycle-regulated protein human GTSE-1 controls DNA damage-induced
apoptosis by affecting p53 function. J Biol Chem 278: 30356–30364.
doi:10.1074/jbc.M302902200.34. Monte M, Benetti R, Collavin L, Marchionni L, Del Sal G, et al. (2004) hGTSE-
Multivariate proteomic profiling identifies novel accessory proteins of coated
vesicles. The Journal of Cell Biology 197: 141–160. doi:10.1083/jcb.201111049.40. Bird AW, Erler A, Fu J, Heriche J-K, Maresca M, et al. (2011) High-efficiency
counterselection recombineering for site-directed mutagenesis in bacterialartificial chromosomes. Nat Meth 9: 103–109. doi:10.1038/nmeth.1803.
41. Jiang K, Toedt G, Gouveia SM, Davey NE, Hua S, et al. (2012) A Proteome-
42. Gnad F, Gunawardena J, Mann M (2010) PHOSIDA 2011: the posttransla-tional modification database. Nucleic Acids Research 39: D253–D260.
doi:10.1093/nar/gkq1159.43. Olsen JV, Vermeulen M, Santamaria A, Kumar C, Miller ML, et al. (2010)
Quantitative Phosphoproteomics Reveals Widespread Full Phosphorylation Site
Occupancy During Mitosis. Science Signaling 3: ra3–ra3. doi:10.1126/scisignal.2000475.
44. Murray AW, Solomon MJ, Kirschner MW (1989) The role of cyclin synthesisand degradation in the control of maturation promoting factor activity. Nature
339: 280–286. doi:10.1038/339280a0.
45. Levasseur M, McDougall A (2000) Sperm-induced calcium oscillations atfertilisation in ascidians are controlled by cyclin B1-dependent kinase activity.
Development 127: 631–641.46. Srayko M, Kaya A, Stamford J, Hyman A (2005) Identification and
Characterization of Factors Required for Microtubule Growth and Nucleationin the Early C. elegans Embryo. Developmental Cell 9: 223–236. doi:10.1016/
j.devcel.2005.07.003.
47. Sironi L, Solon J, Conrad C, Mayer TU, Brunner D, et al. (2011) Automaticquantification of microtubule dynamics enables RNAi-screening of new mitotic
48. Zhou X, Temam S, Oh M, Pungpravat N, Huang B-L, et al. (2006) GlobalExpression-Based Classification of Lymph Node Metastasis and Extracapsular
Spread of Oral Tongue Squamous Cell Carcinoma. NEO 8: 925–932.
doi:10.1593/neo.06430.
49. Tian T, Zhang E, Fei F, Li X, Guo X, et al. (2011) Up-regulation of GTSE1Lacks a Relationship with Clinical Data in Lung Cancer. Asian Pac J Cancer
Prev 12: 2039–2043.
50. Lee J, Sung CO, Lee EJ, Do I-G, Kim H-C, et al. (2012) Metastasis ofNeuroendocrine Tumors Are Characterized by Increased Cell Proliferation and
Reduced Expression of the ATM Gene. PLoS ONE 7: e34456. doi:10.1371/journal.pone.0034456.t003.
51. Iwasaki T, Shinkai K, Mukai M, Yoshioka K, Fujii Y, et al. (1995) Cell-cycle-
dependent invasion in vitro by rat ascites hepatoma cells. Int J Cancer 63: 282–287.
52. Fukui R, Amakawa M, Hoshiga M, Shibata N, Kohbayashi E, et al. (2000)Increased migration in late G(1) phase in cultured smooth muscle cells.
Am J Physiol, Cell Physiol 279: C999–1007.
53. Masuyama J, Berman JS, Cruikshank WW, Morimoto C, Center DM (1992)Evidence for recent as well as long term activation of T cells migrating through
endothelial cell monolayers in vitro. J Immunol 148: 1367–1374.
54. Ratner S, Jasti RK, Heppner GH (1988) Motility of murine lymphocytes duringtransit through cell cycle. Analysis by a new in vitro assay. J Immunol 140: 583–588.
55. Bublik DR, Scolz M, Triolo G, Monte M, Schneider C (2010) Human GTSE-1
Regulates p21CIP1/WAF1 Stability Conferring Resistance to PaclitaxelTreatment. Journal of Biological Chemistry 285: 5274–5281. doi:10.1074/
64. Poser I, Sarov M, Hutchins JRA, Heriche J-K, Toyoda Y, et al. (2008) BACTransgeneOmics: a high-throughput method for exploration of protein function
in mammals. Nat Meth 5: 409–415. doi:10.1038/nmeth.1199.
65. Zhang Y, Buchholz F, Muyrers JP, Stewart AF (1998) A new logic for DNAengineering using recombination in Escherichia coli. Nat Genet 20: 123–128.
doi:10.1038/2417.
66. Ligon LA, Shelly SS, Tokito M, Holzbaur ELF (2003) The microtubule plus-endproteins EB1 and dynactin have differential effects on microtubule polymeri-
67. Beltrami AP, Cesselli D, Bergamin N, Marcon P, Rigo S, et al. (2007)Multipotent cells can be generated in vitro from several adult human organs
(heart, liver, and bone marrow). Blood 110: 3438–3446. doi:10.1182/blood-
2006–11–055566.
68. Bunz F, Dutriaux A, Lengauer C, Waldman T, Zhou S, et al. (1998)
Requirement for p53 and p21 to sustain G2 arrest after DNA damage. Science
282: 1497–1501.
69. Wasilko DJ, Lee SE, Stutzman-Engwall KJ, Reitz BA, Emmons TL, et al. (2009)
The titerless infected-cells preservation and scale-up (TIPS) method for large-
scale production of NO-sensitive human soluble guanylate cyclase (sGC) frominsect cells infected with recombinant baculovirus. Protein Expr Purif 65: 122–
132. doi:10.1016/j.pep.2009.01.002.
70. Gell C, Friel CT, Borgonovo B, Drechsel DN, Hyman AA, et al. (2011)Purification of tubulin from porcine brain. Methods Mol Biol 777: 15–28.
doi:10.1007/978-1-61779-252-6_2.
71. Gell C, Bormuth V, Brouhard GJ, Cohen DN, Diez S, et al. (2010) Microtubuledynamics reconstituted in vitro and imaged by single-molecule fluorescence