Prospectus Supplement (To REMIC Prospectus dated May 1, 2010) $565,312,288 Guaranteed REMIC Pass-Through Certificates Fannie Mae REMIC Trust 2011-88 The Certificates We, the Federal National Mortgage Association (Fannie Mae), will issue the classes of certificates listed in the chart on this cover. Payments to Certificateholders We will make monthly payments on the certificates. You, the investor, will receive • interest accrued on the balance of your certificate, and • principal to the extent available for payment on your class. We will pay principal at rates that may vary from time to time. We may not pay principal to certain classes for long periods of time. The Fannie Mae Guaranty We will guarantee that required payments of principal and interest on the certificates are available for distribution to investors on time. The Trust and its Assets The trust will own • Fannie Mae MBS, and • Fannie Mae Stripped MBS. The mortgage loans underlying the Fannie Mae MBS and Fannie Mae Stripped MBS are first lien, single- family, fixed-rate loans. Class Group Original Class Balance Principal Type(1) Interest Rate Interest Type(1) CUSIP Number Final Distribution Date IA(2) .... 1 $111,111,111(3) NTL 4.5% FIX/IO 3136A0C70 September 2026 AI ..... 1 88,888,888(3) NTL 4.5 FIX/IO 3136A0C88 September 2026 AO(2) . . . 1 200,000,000 PT 0.0 PO 3136A0C96 September 2026 MN(2) . . . 2 88,079,579 PAC 1.5 FIX 3136A0D20 September 2026 MI(2) ... 2 50,331,188(3) NTL 3.5 FIX/IO 3136A0D38 September 2026 CA ..... 2 21,000,000 SUP 3.5 FIX 3136A0D46 September 2026 FM ..... 3 60,459,083 PT (4) FLT 3136A0D53 September 2041 IT ..... 3 60,459,083(3) NTL (4) INV/IO 3136A0D61 September 2041 ST ..... 3 60,459,083(3) NTL (4) INV/IO 3136A0D79 September 2041 EW(2) . . . 3 62,346,000 PAC 2.0 FIX 3136A0D87 June 2040 EI(2) .... 3 24,938,400(3) NTL 5.0 FIX/IO 3136A0D95 June 2040 EL ..... 3 7,079,000 PAC 4.0 FIX 3136A0E29 September 2041 FB ..... 3 14,175,751 SUP (4) FLT 3136A0E37 September 2041 SB ..... 3 7,087,875 SUP (4) INV 3136A0E45 September 2041 BM ..... 4 66,750,000 SEQ 2.5 FIX 3136A0E52 November 2020 BI ..... 4 11,125,000(3) NTL 3.0 FIX/IO 3136A0E60 November 2020 BL ..... 4 8,250,000 SEQ 3.0 FIX 3136A0E78 September 2021 IO ..... 5 47,123,199(3) NTL 5.0 FIX/IO 3136A0E86 August 2036 WA..... 6 30,000,000 SEQ 2.5 FIX 3136A0E94 September 2026 WI(2) ... 6 8,571,428(3) NTL 3.5 FIX/IO 3136A0F28 September 2026 WB ..... 6 85,000 SEQ 3.5 FIX 3136A0F36 September 2026 R ..... 0 NPR 0 NPR 3136A0F44 September 2041 RL ..... 0 NPR 0 NPR 3136A0F51 September 2041 (1) See “Description of the Certificates—The Certificates—Class Definitions and Abbreviations” in the REMIC prospectus. (2) Exchangeable classes. (3) Notional balances. These classes are interest only classes. See page S-8 for a description of how their notional balances are calculated. (4) Based on LIBOR. If you own certificates of certain classes, you can exchange them for certif- icates of the corresponding RCR classes to be delivered at the time of exchange. The AB, AP, AQ, AW, AU, AM, AN, AC, AD, AE, AG, AH, AK, AL, A, MG, MD, MB, M, EM, EC, EA, E and IW Classes are the RCR classes. For a more detailed description of the RCR classes, see Schedule 1 attached to this prospectus supplement and “Description of the Certificates—The Certifi- cates—Combination and Recombination” in the REMIC prospectus. The dealer will offer the certificates (other than the AI Class) from time to time in negotiated transactions at varying prices. We expect the settlement date to be August 30, 2011. Fannie Mae initially will retain the AI Class. See “Plan of Distribution” in this prospectus supplement. Carefully consider the risk factors starting on page 11 of the REMIC prospectus. Unless you understand and are able to tolerate these risks, you should not invest in the certificates. You should read the REMIC prospectus as well as this prospectus supplement. The certificates, together with interest thereon, are not guaranteed by the United States and do not constitute a debt or obligation of the United States or any agency or instrumentality thereof other than Fannie Mae. The certificates are exempt from registration under the Securities Act of 1933 and are “exempted securities” under the Securities Exchange Act of 1934. J.P. Morgan August 24, 2011
Transcript
Prospectus Supplement(To REMIC Prospectus dated May 1, 2010)
$565,312,288
Guaranteed REMIC Pass-Through CertificatesFannie Mae REMIC Trust 2011-88
The Certificates
We, the Federal National MortgageAssociation (Fannie Mae), will issuethe classes of certificates listed in thechart on this cover.
Payments to Certificateholders
We will make monthly payments onthe certificates. You, the investor,will receive
• interest accrued on the balance ofyour certificate, and
• principal to the extent availablefor payment on your class.
We will pay principal at rates thatmay vary from time to time. We maynot pay principal to certain classesfor long periods of time.
The Fannie Mae Guaranty
We will guarantee that requiredpayments of principal and intereston the certificates are available fordistribution to investors on time.
The Trust and its Assets
The trust will own
• Fannie Mae MBS, and
• Fannie Mae Stripped MBS.The mortgage loans underlying theFannie Mae MBS and Fannie MaeStripped MBS are first lien, single-family, fixed-rate loans.
(1) See “Description of the Certificates—TheCertificates—Class Definitions andAbbreviations” in the REMIC prospectus.
(2) Exchangeable classes.
(3) Notional balances. These classes are interestonly classes. See page S-8 for a description ofhow their notional balances are calculated.
(4) Based on LIBOR.
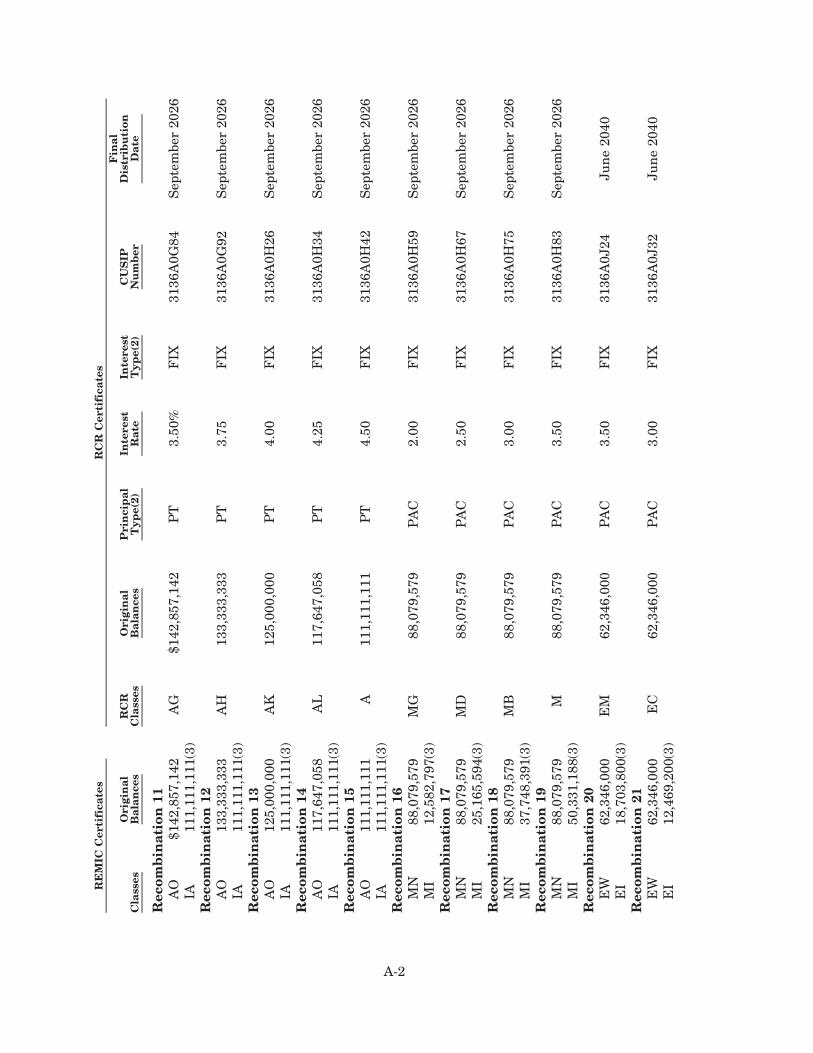
If you own certificates of certain classes, you can exchange them for certif-icates of the corresponding RCR classes to be delivered at the time ofexchange. The AB, AP, AQ, AW, AU, AM, AN, AC, AD, AE, AG, AH, AK, AL,A, MG, MD, MB, M, EM, EC, EA, E and IW Classes are the RCR classes. For amore detailed description of the RCR classes, see Schedule 1 attached to thisprospectus supplement and “Description of the Certificates—The Certifi-cates—Combination and Recombination” in the REMIC prospectus.
The dealer will offer the certificates (other than the AI Class) from time to timein negotiated transactions at varying prices. We expect the settlement date tobe August 30, 2011. Fannie Mae initially will retain the AI Class. See “Plan ofDistribution” in this prospectus supplement.
Carefully consider the risk factors starting on page 11 of the REMIC prospectus. Unless you understand and are able to toleratethese risks, you should not invest in the certificates.You should read the REMIC prospectus as well as this prospectus supplement.The certificates, together with interest thereon, are not guaranteed by the United States and do not constitute a debt orobligation of the United States or any agency or instrumentality thereof other than Fannie Mae.The certificates are exempt from registration under the Securities Act of 1933 and are “exempted securities” under the SecuritiesExchange Act of 1934.
You should purchase the certificates only if you have read and understood this prospectussupplement and the following documents (the “Disclosure Documents”):
• our Prospectus for Fannie Mae Guaranteed REMIC Pass-Through Certificates dated May 1,2010 (the “REMIC Prospectus”);
• our Prospectus for Fannie Mae Guaranteed Pass-Through Certificates (Single-Family Resi-dential Mortgage Loans) dated
O July 1, 2011, for all MBS issued on or after July 1, 2011,
O June 1, 2009, for all MBS issued on or after January 1, 2009 and prior to July 1, 2011,
O April 1, 2008, for all MBS issued on or after June 1, 2007 and prior to January 1, 2009, or
O January 1, 2006, for all other MBS
(as applicable, the “MBS Prospectus”); and
• if you are purchasing the Group 5 Class or the R or RL Class
our Prospectus for Fannie Mae Stripped Mortgage-Backed Securities dated
O January 1, 2009, for all SMBS issued on or after January 1, 2009,
O December 1, 2007, for all SMBS issued on or after December 1, 2007 and prior toJanuary 1, 2009, or
O May 1, 2002, for all other SMBS
(as applicable, the “SMBS Prospectus”); and
the preliminary data statements or prospectus supplements, as applicable, relating to theSMBS (the “SMBS Supplements”); and
• any information incorporated by reference in this prospectus supplement as discussed belowand under the heading “Incorporation by Reference” in the REMIC Prospectus.
For a description of current servicing policies generally applicable to existing Fannie Mae MBSpools, see “Yield, Maturity, and Prepayment Considerations” in the MBS Prospectus dated July 1, 2011.
The MBS Prospectus, the SMBS Prospectus and the SMBS Supplements are incorporated byreference in this prospectus supplement. This means that we are disclosing information in thosedocuments by referring you to them. Those documents are considered part of this prospectussupplement, so you should read this prospectus supplement, and any applicable supplements oramendments, together with those documents.
You can obtain copies of the Disclosure Documents by writing or calling us at:
In addition, the Disclosure Documents, together with the class factors, are available on our corporateWeb site at www.fanniemae.com.
You also can obtain copies of the REMIC Prospectus, the MBS Prospectus, the SMBS Prospectusand the SMBS Supplements by writing or calling the dealer at:
J.P. Morgan Securities LLCc/o Broadridge Financial SolutionsProspectus Department1155 Long Island AvenueEdgewood, NY 11717(telephone 631-274-2635).
S-4
RECENT DEVELOPMENTS
Ratings Matters
Standard and Poor’s Ratings Services
On August 8, 2011, Standard and Poor’s Ratings Services (“Standard & Poor’s”) announced thatit had downgraded Fannie Mae senior unsecured long-term debt from “AAA” to “AA+” with a negativeoutlook. This announcement followed a similar action by Standard & Poor’s taken on August 5, 2011on the United States sovereign long-term debt rating. Standard & Poor’s also announced that FannieMae’s debt ratings were no longer on CreditWatch Negative, and that the ratings on Fannie Maeshort term debt and subordinated debt remain unchanged at “A-1+” and “A”, respectively.
The action taken by Standard & Poor’s with respect to Fannie Mae’s ratings was announced atthe same time as similar ratings actions on other institutions with ties to the United StatesGovernment, including Freddie Mac, select Federal Home Loan Banks, and the Farm Credit System.
Moody’s Investors Service
On August 2, 2011, Moody’s Investors Service (“Moody’s”) confirmed the “Aaa” rating of insti-tutions directly linked to the United States Government, including Fannie Mae. Moody’s alsoannounced that the rating outlook for Fannie Mae and other institutions directly linked to theUnited States Government was being revised to negative, following a similar revision on the outlookof the United States Government.
Fitch Ratings Limited
On August 16, 2011, Fitch Ratings Limited (“Fitch”) affirmed the long-term issuer default ratingand senior unsecured debt rating of Fannie Mae at ‘‘AAA’’, with a Ratings Outlook of Stable, followinga similar affirmation of the United States sovereign rating. Fitch has previously indicated that theratings of Fannie Mae and other issuers with ties to the United States Government would ultimatelybe aligned with the United States sovereign rating assigned by Fitch.
For additional information on the impacts of a credit rating downgrade on Fannie Mae and itssecurities, please refer to our Quarterly Report on Form 10-Q for the quarterly period ended June 30,2011, including the Risk Factors set forth in that Quarterly Report.
S-5
SUMMARY
This summary contains only limited information about the certificates. Statisticalinformation in this summary is provided as of August 1, 2011. You should purchase thecertificates only after reading this prospectus supplement and each of the additionaldisclosure documents listed on page S-3. In particular, please see the discussion of riskfactors that appears in each of those additional disclosure documents.
Assets Underlying Each Group of Classes
Group Assets
1 Group 1 MBS2 Group 2 MBS3 Group 3 MBS4 Group 4 MBS5 Group 5 SMBS6 Group 6 MBS
Group 1, Group 2, Group 3, Group 4, and Group 6 MBS
Characteristics of the Trust MBS
ApproximatePrincipalBalance
Pass-Through
Rate
Range of WeightedAverage Coupons
or WACs(annual percentages)
Range of WeightedAverage RemainingTerms to Maturity
or WAMs(in months)
Group 1 MBS . . . . . . . $200,000,000 4.50% 4.75% to 7.00% 70 to 180Group 2 MBS . . . . . . . $109,079,579 3.50% 3.75% to 6.00% 121 to 180Group 3 MBS . . . . . . . $151,147,709 5.00% 5.25% to 7.50% 241 to 360Group 4 MBS . . . . . . . $ 75,000,000 3.00% 3.25% to 5.50% 85 to 120Group 6 MBS . . . . . . . $ 30,085,000 3.50% 3.75% to 6.00% 121 to 180
Assumed Characteristics of the Underlying Mortgage Loans
The actual remaining terms to maturity, loan ages and interest rates of most of the mortgageloans underlying the Trust MBS will differ from those shown above, perhaps significantly.
The actual remaining terms to maturity, loan ages and interest rates of most of the mortgageloans underlying the Group 5 SMBS will differ from those shown above, perhaps significantly.
Settlement Date
We expect to issue the certificates on August 30, 2011.
Distribution Dates
We will make payments on the certificates on the 25th day of each calendar month, or on the nextbusiness day if the 25th day is not a business day.
Record Date
On each distribution date, we will make each monthly payment on the certificates to holders ofrecord on the last day of the preceding month.
Book-Entry and Physical Certificates
We will issue the classes of certificates in the following forms:
Fed Book-Entry Physical
All classes of certificates other than the R and RL Classes R and RL Classes
S-7
Exchanging Certificates Through Combination and Recombination
If you own certificates of a class designated as “exchangeable” on the cover of this prospectussupplement, you will be able to exchange them for a proportionate interest in the related RCRcertificates. Schedule 1 lists the available combinations of the certificates eligible for exchange andthe related RCR certificates. You can exchange your certificates by notifying us and paying anexchange fee. We will deliver the RCR certificates upon such exchange.
We will apply principal and interest payments from exchanged REMIC certificates to thecorresponding RCR certificates, on a pro rata basis, following any exchange.
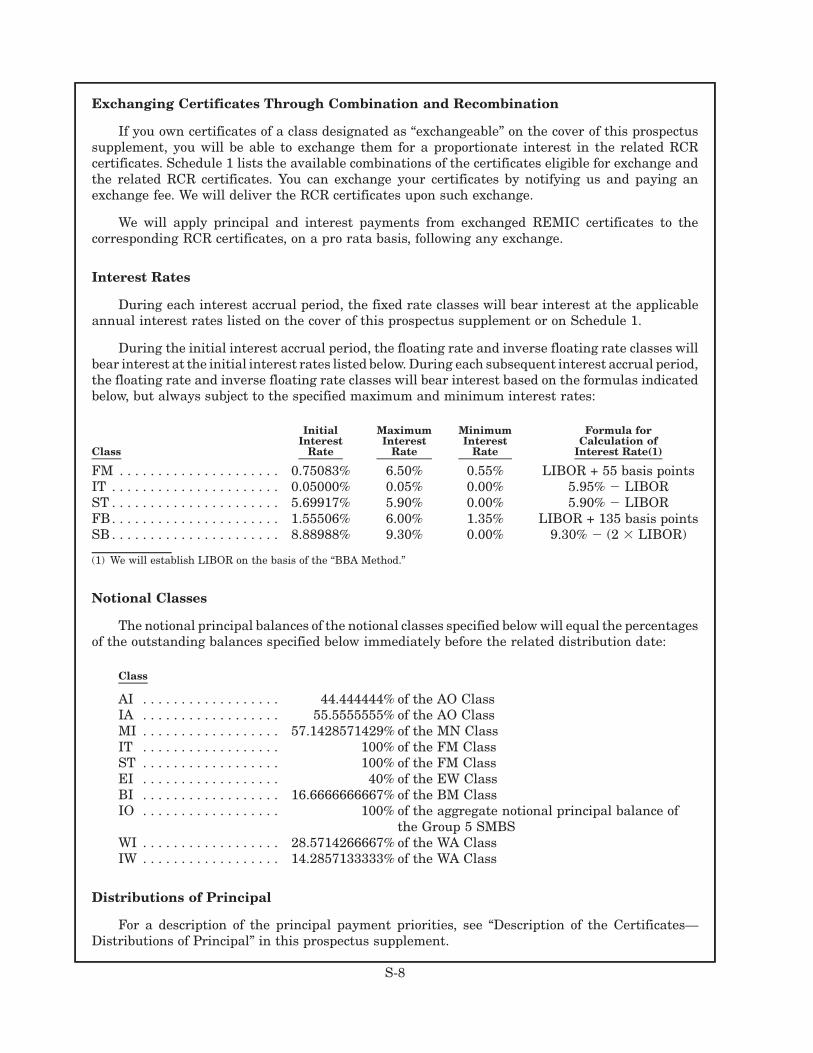
Interest Rates
During each interest accrual period, the fixed rate classes will bear interest at the applicableannual interest rates listed on the cover of this prospectus supplement or on Schedule 1.
During the initial interest accrual period, the floating rate and inverse floating rate classes willbear interest at the initial interest rates listed below. During each subsequent interest accrual period,the floating rate and inverse floating rate classes will bear interest based on the formulas indicatedbelow, but always subject to the specified maximum and minimum interest rates:
(1) We will establish LIBOR on the basis of the “BBA Method.”
Notional Classes
The notional principal balances of the notional classes specified below will equal the percentagesof the outstanding balances specified below immediately before the related distribution date:
Class
AI . . . . . . . . . . . . . . . . . . 44.444444% of the AO ClassIA . . . . . . . . . . . . . . . . . . 55.5555555% of the AO ClassMI . . . . . . . . . . . . . . . . . . 57.1428571429% of the MN ClassIT . . . . . . . . . . . . . . . . . . 100% of the FM ClassST . . . . . . . . . . . . . . . . . . 100% of the FM ClassEI . . . . . . . . . . . . . . . . . . 40% of the EW ClassBI . . . . . . . . . . . . . . . . . . 16.6666666667% of the BM ClassIO . . . . . . . . . . . . . . . . . . 100% of the aggregate notional principal balance of
the Group 5 SMBSWI . . . . . . . . . . . . . . . . . . 28.5714266667% of the WA ClassIW . . . . . . . . . . . . . . . . . . 14.2857133333% of the WA Class
Distributions of Principal
For a description of the principal payment priorities, see “Description of the Certificates—Distributions of Principal” in this prospectus supplement.
Final Distribution Dates” in the REMIC Prospectus.
S-9
DESCRIPTION OF THE CERTIFICATES
The material under this heading describes the principal features of the Certificates. You will findadditional information about the Certificates in the other sections of this prospectus supplement, aswell as in the additional Disclosure Documents and the Trust Agreement. If we use a capitalized termin this prospectus supplement without defining it, you will find the definition of that term in theapplicable Disclosure Document or in the Trust Agreement.
General
Structure. We will create the Fannie Mae REMIC Trust specified on the cover of this prospectussupplement (the “Trust”) pursuant to a trust agreement dated as of May 1, 2010 and a supplementthereto dated as of August 1, 2011 (the “Issue Date”). We will issue the Guaranteed REMIC Pass-Through Certificates (the “REMIC Certificates”) pursuant to that trust agreement and supplement.We will issue the Combinable and Recombinable REMIC Certificates (the “RCR Certificates” and,together with the REMIC Certificates, the “Certificates”) pursuant to a separate trust agreementdated as of May 1, 2010 and a supplement thereto dated as of the Issue Date (together with the trustagreement and supplement relating to the REMIC Certificates, the “Trust Agreement”). We willexecute the Trust Agreement in our corporate capacity and as trustee (the “Trustee”). In general, theterm “Classes” includes the Classes of REMIC Certificates and RCR Certificates.
The assets of the Trust will include:
• five groups of Fannie Mae Guaranteed Mortgage Pass-Through Certificates (the “Group 1MBS,” “Group 2 MBS,” “Group 3 MBS,” “Group 4 MBS” and “Group 6 MBS,” and together, the“Trust MBS”),
• certain previously issued Fannie Mae Stripped Mortgage-Backed Securities (the “Group 5SMBS”).
The Group 5 SMBS represent beneficial ownership interests in certain interest distributions onmortgage loans underlying certain Fannie Mae Guaranteed Mortgage Pass-Through Certificates(together with the Trust MBS, the “MBS”).
Each MBS represents a beneficial ownership interest in a pool of first lien, one- to four-family(“single-family”), fixed-rate residential mortgage loans (the “Mortgage Loans”) having the charac-teristics described in this prospectus supplement.
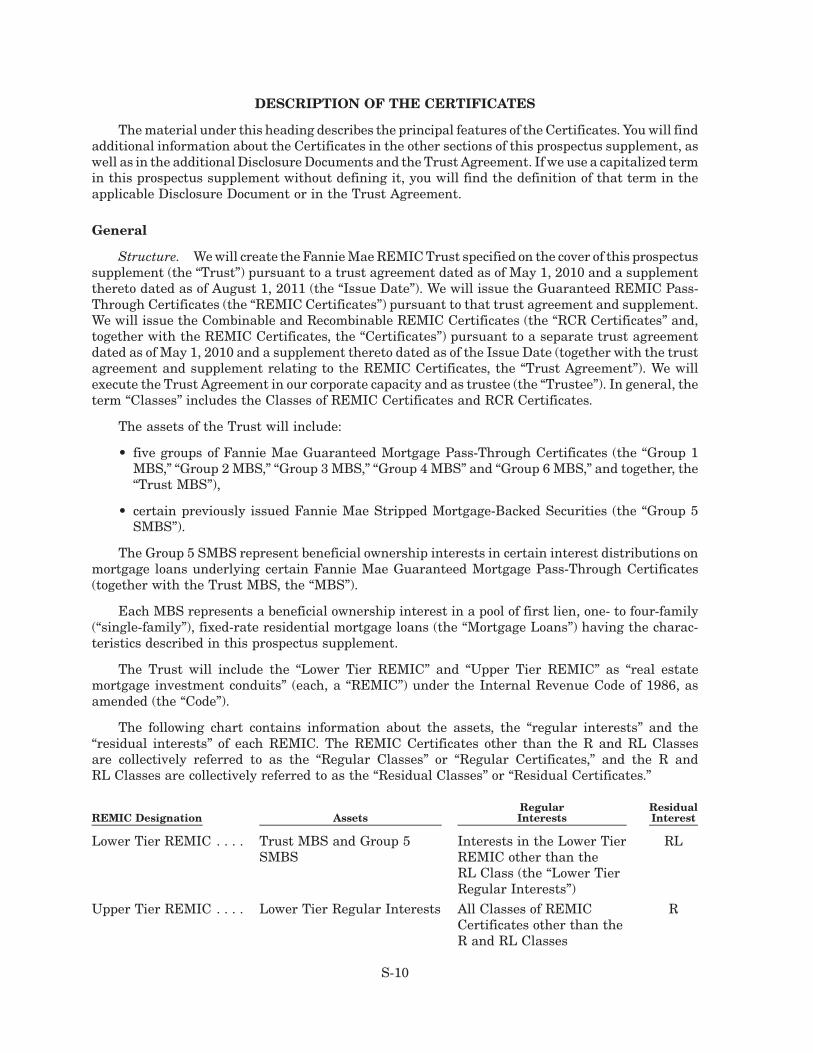
The Trust will include the “Lower Tier REMIC” and “Upper Tier REMIC” as “real estatemortgage investment conduits” (each, a “REMIC”) under the Internal Revenue Code of 1986, asamended (the “Code”).
The following chart contains information about the assets, the “regular interests” and the“residual interests” of each REMIC. The REMIC Certificates other than the R and RL Classesare collectively referred to as the “Regular Classes” or “Regular Certificates,” and the R andRL Classes are collectively referred to as the “Residual Classes” or “Residual Certificates.”
REMIC Designation AssetsRegularInterests
ResidualInterest
Lower Tier REMIC . . . . Trust MBS and Group 5SMBS
Interests in the Lower TierREMIC other than theRL Class (the “Lower TierRegular Interests”)
RL
Upper Tier REMIC . . . . Lower Tier Regular Interests All Classes of REMICCertificates other than theR and RL Classes
R
S-10
Fannie Mae Guaranty. For a description of our guaranties of the Certificates, the Trust MBSand the Group 5 SMBS, see the applicable discussions appearing under the heading “Fannie MaeGuaranty” in the REMIC Prospectus, the MBS Prospectus, the SMBS Prospectus and the SMBSSupplements, as applicable. Our guaranties are not backed by the full faith and credit of the UnitedStates.
Characteristics of Certificates. Except as specified below, we will issue the Certificates in book-entry form on the book-entry system of the U.S. Federal Reserve Banks. Entities whose names appearon the book-entry records of a Federal Reserve Bank as having had Certificates deposited in theiraccounts are “Holders” or “Certificateholders.”
We will issue the Residual Certificates in fully registered, certificated form. The “Holder” or“Certificateholder” of a Residual Certificate is its registered owner. A Residual Certificate can betransferred at the corporate trust office of the Transfer Agent, or at the office of the Transfer Agent inNew York, New York. U.S. Bank National Association in Boston, Massachusetts will be the initialTransfer Agent. We may impose a service charge for any registration of transfer of a ResidualCertificate and may require payment to cover any tax or other governmental charge. See also“—Characteristics of the Residual Classes” below.
Authorized Denominations. We will issue the Certificates in the following denominations:
Classes Denominations
Interest Only, Principal Only andInverse Floating Rate Classes
$100,000 minimum plus whole dollar increments
All other Classes (except the R andRL Classes)
$1,000 minimum plus whole dollar increments
The Trust MBS
The Trust MBS provide that principal and interest on the related Mortgage Loans are passedthrough monthly. The Mortgage Loans underlying the Trust MBS are conventional, fixed-rate,fully-amortizing mortgage loans secured by first mortgages or deeds of trust on single-familyresidential properties. These Mortgage Loans have original maturities of up to 15 years in the caseof the Group 1 MBS, Group 2 MBS and Group 6 MBS, up to 30 years in the case of the Group 3 MBS,and up to 10 years in the case of the Group 4 MBS.
For additional information, see “Summary—Group 1, Group 2, Group 3, Group 4 and Group 6MBS—Characteristics of the Trust MBS” and “—Assumed Characteristics of the Underlying Mort-gage Loans” in this prospectus supplement and “The Mortgage Pools” and “Yield, Maturity, andPrepayment Considerations” in the MBS Prospectus.
The Group 5 SMBS
The general characteristics of the Group 5 SMBS are described in the SMBS Prospectus and inthe SMBS Supplements. The Group 5 SMBS provide that certain interest amounts on the MortgageLoans underlying the related MBS are passed through monthly.
The general characteristics of the MBS are described in the MBS Prospectus. Each MBSevidences beneficial ownership interest in a pool of conventional, fixed-rate, fully-amortizing Mort-gage Loans secured by first mortgages or deeds of trust on single-family residential properties. TheseMortgage Loans have original maturities of up to 30 years. For additional information see “Sum-mary—Group 5 SMBS—Characteristics of the Group 5 SMBS” and “—Assumed Characteristics ofthe Underlying Mortgage Loans” in this prospectus supplement, and “The Mortgage Pools” and“Yield, Maturity, and Prepayment Considerations” in the MBS Prospectus.
S-11
Distributions of Interest
General. The Certificates will bear interest at the rates specified in this prospectus supple-ment. Interest to be paid on each Certificate on a Distribution Date will consist of one month’sinterest on the outstanding balance of that Certificate immediately prior to that Distribution Date.
Delay Classes and No-Delay Classes. The “delay” Classes and “no-delay” Classes are set forth inthe following table:
Delay Classes No-Delay Classes
All interest-bearing Classesother than the FM, IT and ST Classes
The FM, IT and ST Classes
See “Description of the Certificates—The Certificates—Distributions on Certificates—Interest Dis-tributions” in the REMIC Prospectus.
The Dealer will treat the Principal Only Class as a delay Class solely for the purpose offacilitating trading.
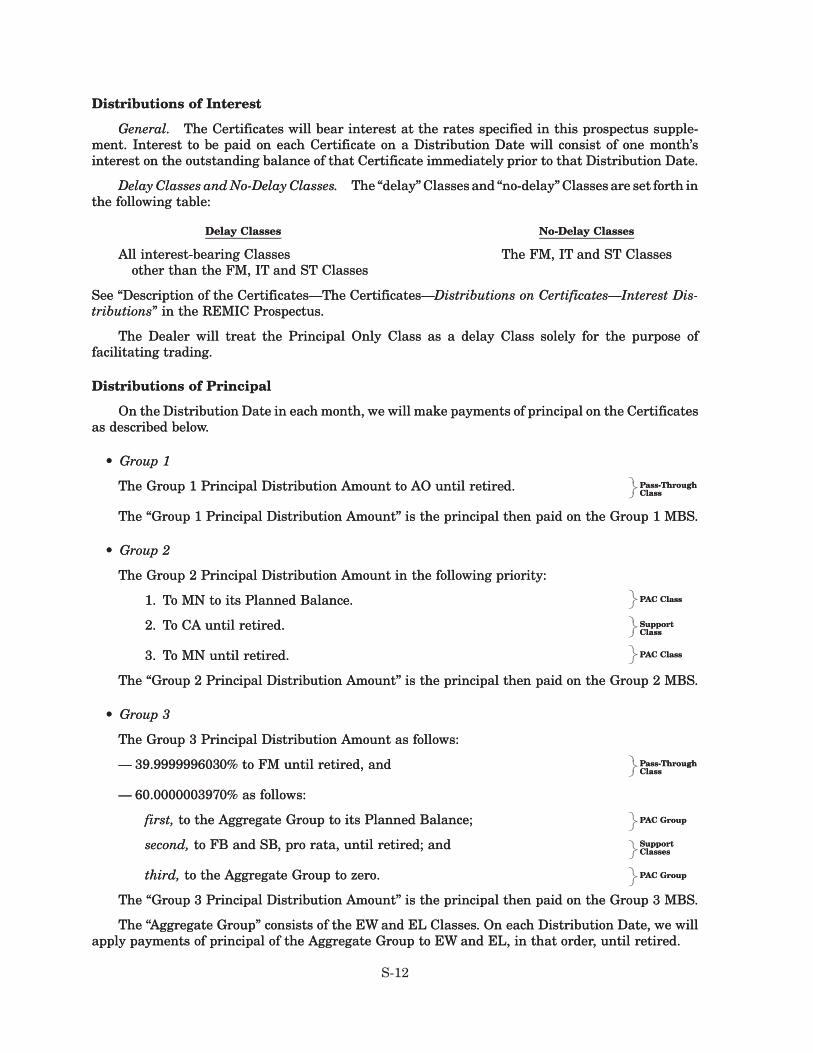
Distributions of Principal
On the Distribution Date in each month, we will make payments of principal on the Certificatesas described below.
• Group 1
The Group 1 Principal Distribution Amount to AO until retired. Pass-ThroughClass
The “Group 1 Principal Distribution Amount” is the principal then paid on the Group 1 MBS.
• Group 2
The Group 2 Principal Distribution Amount in the following priority:
1. To MN to its Planned Balance. PAC Class
2. To CA until retired. SupportClass
3. To MN until retired. PAC Class
The “Group 2 Principal Distribution Amount” is the principal then paid on the Group 2 MBS.
• Group 3
The Group 3 Principal Distribution Amount as follows:
— 39.9999996030% to FM until retired, and Pass-ThroughClass
— 60.0000003970% as follows:
first, to the Aggregate Group to its Planned Balance; PAC Group
second, to FB and SB, pro rata, until retired; and SupportClasses
third, to the Aggregate Group to zero. PAC Group
The “Group 3 Principal Distribution Amount” is the principal then paid on the Group 3 MBS.
The “Aggregate Group” consists of the EW and EL Classes. On each Distribution Date, we willapply payments of principal of the Aggregate Group to EW and EL, in that order, until retired.
Distributions of Interest
General. The Certificates will bear interest at the rates specified in this prospectus supple-ment. Interest to be paid on each Certificate on a Distribution Date will consist of one month’sinterest on the outstanding balance of that Certificate immediately prior to that Distribution Date.
Delay Classes and No-Delay Classes. The “delay” Classes and “no-delay” Classes are set forth inthe following table:
Delay Classes No-Delay Classes
All interest-bearing Classesother than the FM, IT and ST Classes
The FM, IT and ST Classes
See “Description of the Certificates—The Certificates—Distributions on Certificates—Interest Dis-tributions” in the REMIC Prospectus.
The Dealer will treat the Principal Only Class as a delay Class solely for the purpose offacilitating trading.
Distributions of Principal
On the Distribution Date in each month, we will make payments of principal on the Certificatesas described below.
• Group 1
The Group 1 Principal Distribution Amount to AO until retired. Pass-ThroughClass
�������
The “Group 1 Principal Distribution Amount” is the principal then paid on the Group 1 MBS.
• Group 2
The Group 2 Principal Distribution Amount in the following priority:
1. To MN to its Planned Balance. PAC Class�����
2. To CA until retired. SupportClass
�������
3. To MN until retired. PAC Class�����
The “Group 2 Principal Distribution Amount” is the principal then paid on the Group 2 MBS.
• Group 3
The Group 3 Principal Distribution Amount as follows:
— 39.9999996030% to FM until retired, and Pass-ThroughClass
�������
— 60.0000003970% as follows:
first, to the Aggregate Group to its Planned Balance; PAC Group�����
second, to FB and SB, pro rata, until retired; and SupportClasses
�����
third, to the Aggregate Group to zero. PAC Group�����
The “Group 3 Principal Distribution Amount” is the principal then paid on the Group 3 MBS.
The “Aggregate Group” consists of the EW and EL Classes. On each Distribution Date, we willapply payments of principal of the Aggregate Group to EW and EL, in that order, until retired.
S-12
The Aggregate Group has a principal balance equal to the aggregate principal balance of theClasses included in the Aggregate Group.
• Group 4
The Group 4 Principal Distribution Amount to BM and BL, in that order, untilretired.
SequentialPay Classes
The “Group 4 Principal Distribution Amount” is the principal then paid on the Group 4 MBS.
• Group 6
The Group 6 Principal Distribution Amount to WA and WB, in that order, untilretired.
SequentialPay Classes
The “Group 6 Principal Distribution Amount” is the principal then paid on the Group 6 MBS.
Structuring Assumptions
Pricing Assumptions. Except where otherwise noted, the information in the tables in thisprospectus supplement has been prepared based on the following assumptions (the “PricingAssumptions”):
• the Mortgage Loans underlying the Trust MBS have the original terms to maturity, remainingterms to maturity, loan ages and interest rates specified under “Summary—Group 1, Group 2,Group 3, Group 4 and Group 6 MBS—Assumed Characteristics of the Underlying MortgageLoans” in this prospectus supplement;
• the Mortgage Loans underlying the Group 5 SMBS have the original terms to maturity,remaining terms to maturity, loan ages and interest rates specified under “Summary—Group 5 SMBS—Assumed Characteristics of the Underlying Mortgage Loans” in this pro-spectus supplement;
• the Mortgage Loans prepay at the constant percentages of PSA specified in the related tables;
• the settlement date for the Certificates is August 30, 2011; and
• each Distribution Date occurs on the 25th day of a month.
Prepayment Assumptions. The prepayment model used in this prospectus supplement is PSA.For a description of PSA, see “Yield, Maturity and Prepayment Considerations—Prepayment Mod-els” in the REMIC Prospectus. It is highly unlikely that prepayments will occur at any constant PSArate or at any other constant rate.
Principal Balance Schedules. The Principal Balance Schedules are set forth beginning onpage B-1 of this prospectus supplement. The Principal Balance Schedules were prepared based on thePricing Assumptions and the assumption that the related Mortgage Loans prepay at a constant ratewithin the applicable “Structuring Ranges” specified in the chart below. The “Effective Range” for anAggregate Group or a Class is the range of prepayment rates (measured by constant PSA rates) thatwould reduce that Aggregate Group or Class to its scheduled balance each month based on thePricing Assumptions. We have not provided separate schedules for the individual Classes included inthe Aggregate Group. However, those Classes are designed to receive principal distributions in thesame fashion as if separate schedules had been provided (with schedules based on the sameunderlying assumptions that apply to the Aggregate Group schedule). If such separate scheduleshad been provided for the individual Classes included in the Aggregate Group we expect that theeffective ranges for those Classes would not be narrower than that shown below for the AggregateGroup.
The Aggregate Group has a principal balance equal to the aggregate principal balance of theClasses included in the Aggregate Group.
• Group 4
The Group 4 Principal Distribution Amount to BM and BL, in that order, untilretired.
SequentialPay Classes
�����������
The “Group 4 Principal Distribution Amount” is the principal then paid on the Group 4 MBS.
• Group 6
The Group 6 Principal Distribution Amount to WA and WB, in that order, untilretired.
SequentialPay Classes
�����������
The “Group 6 Principal Distribution Amount” is the principal then paid on the Group 6 MBS.
Structuring Assumptions
Pricing Assumptions. Except where otherwise noted, the information in the tables in thisprospectus supplement has been prepared based on the following assumptions (the “PricingAssumptions”):
• the Mortgage Loans underlying the Trust MBS have the original terms to maturity, remainingterms to maturity, loan ages and interest rates specified under “Summary—Group 1, Group 2,Group 3, Group 4 and Group 6 MBS—Assumed Characteristics of the Underlying MortgageLoans” in this prospectus supplement;
• the Mortgage Loans underlying the Group 5 SMBS have the original terms to maturity,remaining terms to maturity, loan ages and interest rates specified under “Summary—Group 5 SMBS—Assumed Characteristics of the Underlying Mortgage Loans” in this pro-spectus supplement;
• the Mortgage Loans prepay at the constant percentages of PSA specified in the related tables;
• the settlement date for the Certificates is August 30, 2011; and
• each Distribution Date occurs on the 25th day of a month.
Prepayment Assumptions. The prepayment model used in this prospectus supplement is PSA.For a description of PSA, see “Yield, Maturity and Prepayment Considerations—Prepayment Mod-els” in the REMIC Prospectus. It is highly unlikely that prepayments will occur at any constant PSArate or at any other constant rate.
Principal Balance Schedules. The Principal Balance Schedules are set forth beginning onpage B-1 of this prospectus supplement. The Principal Balance Schedules were prepared based on thePricing Assumptions and the assumption that the related Mortgage Loans prepay at a constant ratewithin the applicable “Structuring Ranges” specified in the chart below. The “Effective Range” for anAggregate Group or a Class is the range of prepayment rates (measured by constant PSA rates) thatwould reduce that Aggregate Group or Class to its scheduled balance each month based on thePricing Assumptions. We have not provided separate schedules for the individual Classes included inthe Aggregate Group. However, those Classes are designed to receive principal distributions in thesame fashion as if separate schedules had been provided (with schedules based on the sameunderlying assumptions that apply to the Aggregate Group schedule). If such separate scheduleshad been provided for the individual Classes included in the Aggregate Group we expect that theeffective ranges for those Classes would not be narrower than that shown below for the AggregateGroup.
S-13
Group and Class Structuring Ranges Initial Effective Ranges
Aggregate Group Planned Balances Between 120% and 250% PSA Between 120% and 250% PSAMN Class Planned Balances Between 100% and 250% PSA Between 100% and 250% PSA
The Aggregate Group consists of the EW and EL Classes.
See “—Decrement Tables” below for the percentages of original principal balances of the individualClasses included in the Aggregate Group that would be outstanding at various constant PSA rates,including the upper and lower bands of the Structuring Range, based on the Pricing Assumptions.
We cannot assure you that the balance of the Aggregate Group or the MN Class willconform on any Distribution Date to the balance specified in the Principal BalanceSchedules or that distributions of principal of the Aggregate Group or the MN Class willbegin or end on the Distribution Dates specified in the Principal Balance Schedules.
If you are considering the purchase of a PAC Class, you should first take into account theconsiderations set forth below.
• We will distribute any excess of principal distributions over the amount necessary to reduce anAggregate Group or a Class to its scheduled balance in any month. As a result, the likelihood ofreducing an Aggregate Group or a Class to its scheduled balance each month will not beimproved by the averaging of high and low principal distributions from month to month.
• Even if the related Mortgage Loans prepay at rates falling within the applicable StructuringRanges or Effective Ranges, principal distributions may be insufficient to reduce the Aggre-gate Group or the MN Class to their scheduled balances each month if prepayments do notoccur at a constant PSA rate.
• The actual Effective Ranges at any time will be based upon the actual characteristics of therelated Mortgage Loans at that time, which are likely to vary (and may vary considerably)from the Pricing Assumptions. As a result, the actual Effective Ranges will likely differ fromthe Initial Effective Ranges specified above. For the same reason, the Aggregate Group andthe MN Class might not be reduced to their scheduled balances each month even if the relatedMortgage Loans prepay at a constant PSA rate within the applicable Initial Effective Ranges.This is so particularly if the rates fall at the lower or higher end of the applicable ranges.
• The actual Effective Ranges may narrow, widen or shift upward or downward to reflect actualprepayment experience over time.
• The principal payment stability of the Aggregate Group and the MN Class will be supported byone or more other Classes. When the related supporting Class or Classes are retired, theAggregate Group or the MN Class, if still outstanding, may no longer have an Effective Range,and will be much more sensitive to prepayments of the related Mortgage Loans.
Yield Tables
General. The tables below illustrate the sensitivity of the pre-tax corporate bond equivalentyields to maturity of the applicable Classes to various constant percentages of PSA and, wherespecified, to changes in the Index. The tables below are provided for illustrative purposesonly and are not intended as a forecast or prediction of the actual yields on the applicableClasses. We calculated the yields set forth in the tables by
• determining the monthly discount rates that, when applied to the assumed streams of cashflows to be paid on the applicable Classes, would cause the discounted present values of theassumed streams of cash flows to equal the assumed aggregate purchase prices of thoseClasses, and
• converting the monthly rates to corporate bond equivalent rates.
S-14
These calculations do not take into account variations in the interest rates at which you couldreinvest distributions on the Certificates. Accordingly, these calculations do not illustrate the returnon any investment in the Certificates when reinvestment rates are taken into account.
We cannot assure you that
• the pre-tax yields on the applicable Certificates will correspond to any of the pre-tax yieldsshown here, or
• the aggregate purchase prices of the applicable Certificates will be as assumed.
In addition, it is unlikely that the Index will correspond to the levels shown here. Furthermore,because some of the Mortgage Loans are likely to have remaining terms to maturity shorter or longerthan those assumed and interest rates higher or lower than those assumed, the principal paymentson the Certificates are likely to differ from those assumed. This would be the case even if all MortgageLoans prepay at the indicated constant percentages of PSA. Moreover, it is unlikely that
• the Mortgage Loans will prepay at a constant PSA rate until maturity,
• all of the Mortgage Loans will prepay at the same rate, or
• the level of the Index will remain constant.
The Fixed Rate Interest Only Classes. The yields to investors in the Fixed Rate InterestOnly Classes will be very sensitive to the rate of principal payments (including prepay-ments) of the related Mortgage Loans. The Mortgage Loans generally can be prepaid atany time without penalty. On the basis of the assumptions described below, the yield tomaturity on each Fixed Rate Interest Only Class would be 0% if prepayments of therelated Mortgage Loans were to occur at the following constant rates:
For any Fixed Rate Interest Only Class, if the actual prepayment rate of the relatedMortgage Loans were to exceed the level specified for as little as one month whileequaling that level for the remaining months, the investors in the applicable Class wouldlose money on their initial investments.
S-15
The information shown in the following yield tables has been prepared on the basis of the PricingAssumptions and the assumption that the aggregate purchase prices of the applicable Fixed RateInterest Only Classes (expressed in each case as a percentage of the original principal balance) are asfollows:
The Principal Only Class. The Principal Only Class will not bear interest. As indicatedin the table below, a low rate of principal payments (including prepayments) on therelated Mortgage Loans will have a negative effect on the yields to investors in thePrincipal Only Class.
The information shown in the following yield table has been prepared on the basis of the PricingAssumptions and the assumption that the aggregate purchase price of the Principal Only Class(expressed as a percentage of original principal balance) is as follows:
The Inverse Floating Rate Classes. The yields on the Inverse Floating Rate Classes willbe sensitive in varying degrees to the rate of principal payments, including prepayments,of the related Mortgage Loans and to the level of the Index. The Mortgage Loans generallycan be prepaid at any time without penalty. In addition, the rate of principal payments(including prepayments) of the Mortgage Loans is likely to vary, and may vary consid-erably, from pool to pool. As illustrated in the applicable tables below, it is possible thatinvestors in the IT and ST Classes would lose money on their initial investments undercertain Index and prepayment scenarios.
Changes in the Index may not correspond to changes in prevailing mortgage interest rates. It ispossible that lower prevailing mortgage interest rates, which might be expected to result in fasterprepayments, could occur while the level of the Index increased.
S-17
The information shown in the following yield tables has been prepared on the basis of the PricingAssumptions and the assumptions that
• the interest rates for the Inverse Floating Rate Classes for the initial Interest AccrualPeriod are the rates listed in the table under “Summary—Interest Rates” in this prospectussupplement and for each following Interest Accrual Period will be based on the specifiedlevels of the Index, and
• the aggregate purchase prices of those Classes (expressed in each case as a percentage oforiginal principal balance) are as follows:
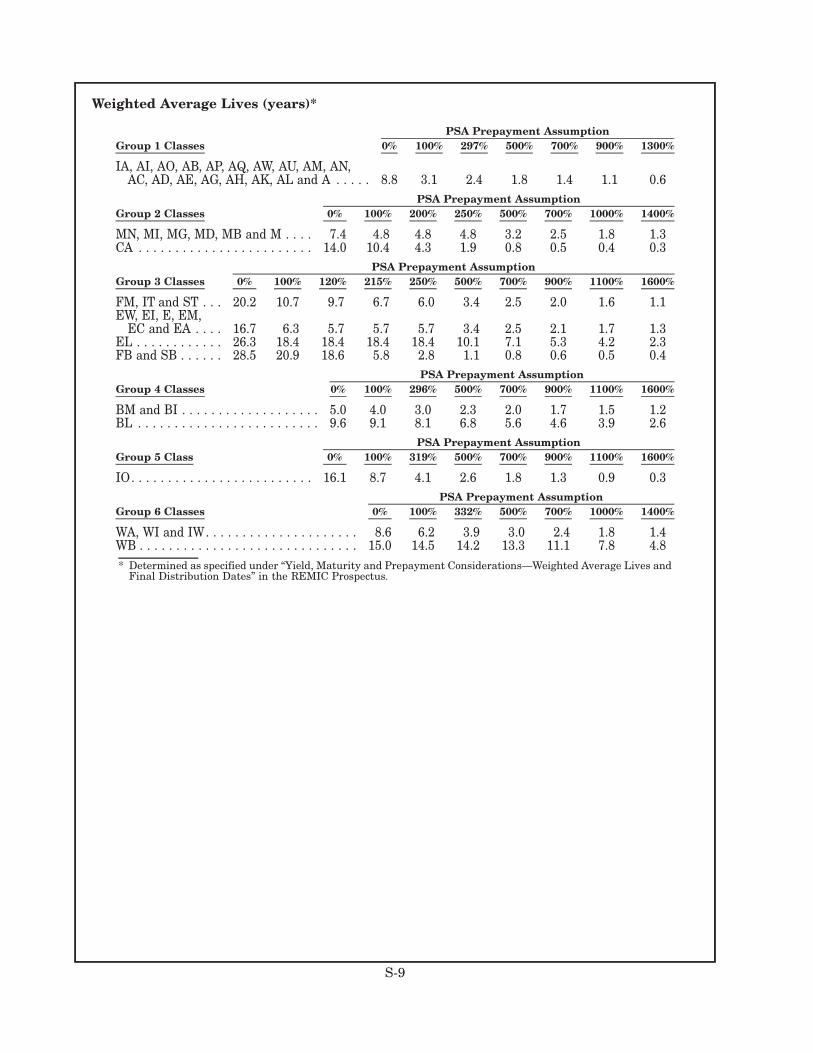
For a description of how the weighted average life of a Certificate is determined, see “Yield,Maturity and Prepayment Considerations—Weighted Average Lives and Final Distribution Dates”in the REMIC Prospectus.
In general, the weighted average lives of the Certificates will be shortened if the level ofprepayments of principal of the related Mortgage Loans increases. However, the weighted averagelives will depend upon a variety of other factors, including
• the timing of changes in the rate of principal distributions, and
• the priority sequences of distributions of principal of the Group 2, Group 3, Group 4 andGroup 6 Classes,
See “—Distributions of Principal” above.
The effect of these factors may differ as to various Classes and the effects on any Class may varyat different times during the life of that Class. Accordingly, we can give no assurance as to theweighted average life of any Class. Further, to the extent the prices of the Certificates representdiscounts or premiums to their original principal balances, variability in the weighted average livesof those Classes of Certificates could result in variability in the related yields to maturity. For anexample of how the weighted average lives of the Classes may be affected at various constantprepayment rates, see the Decrement Tables below.
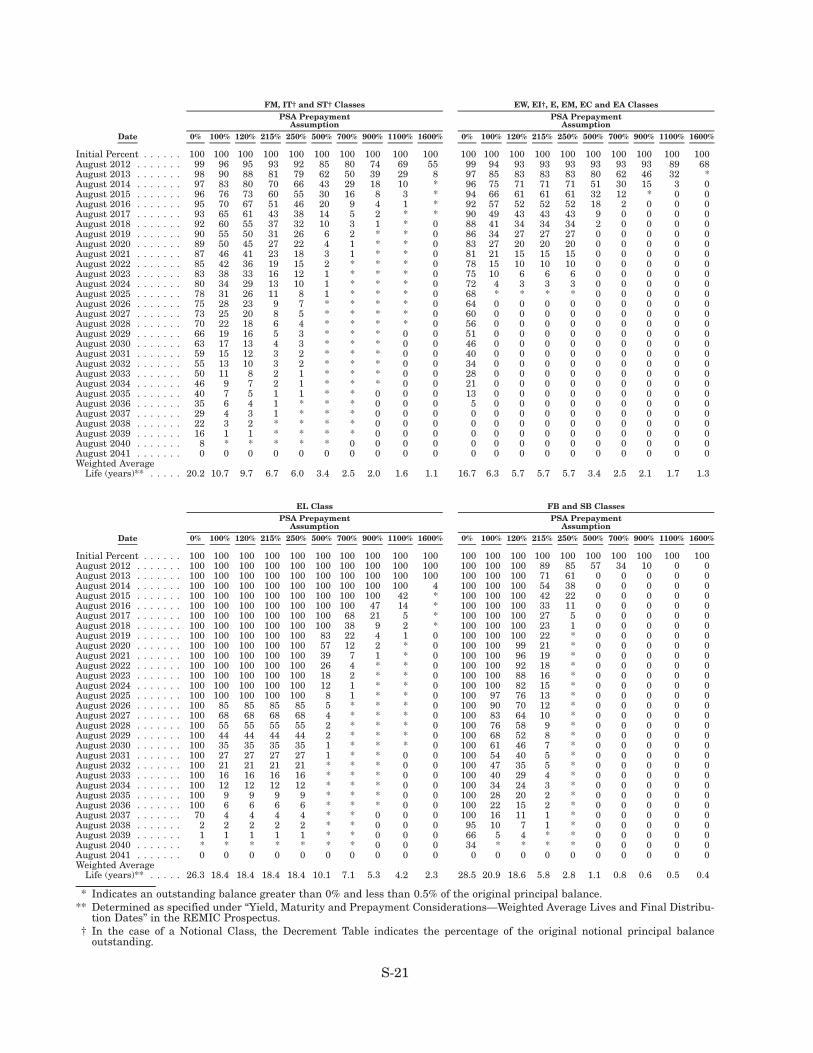
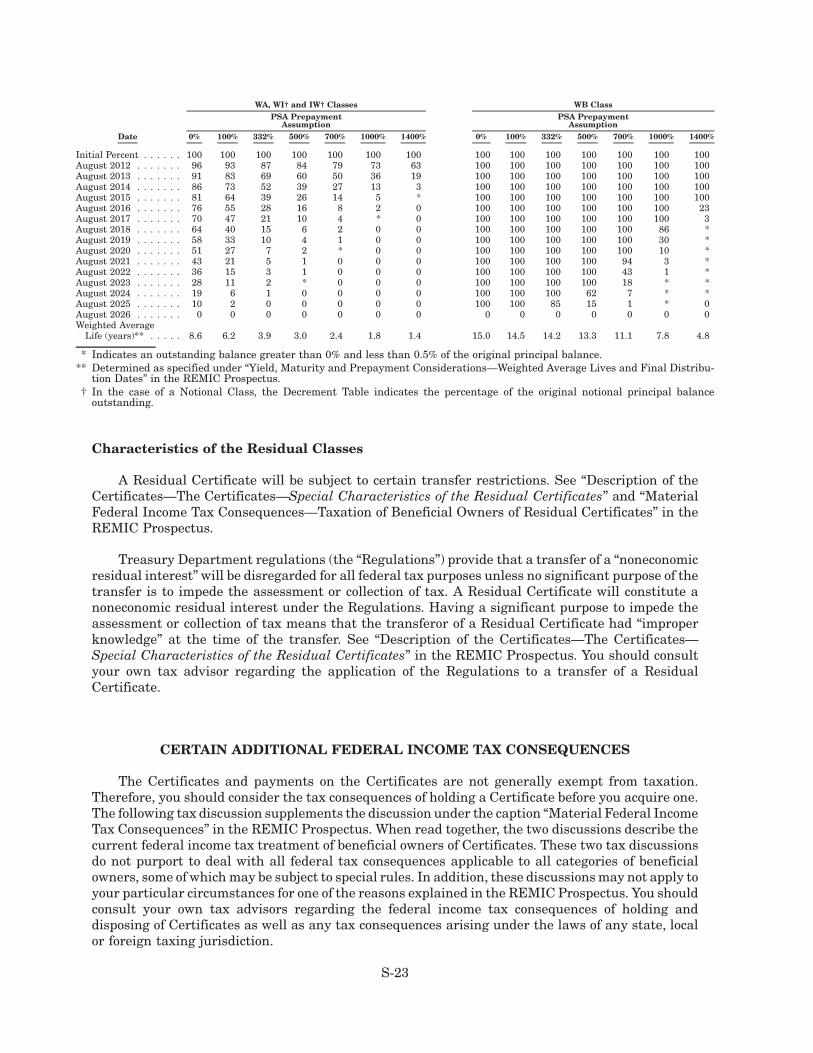
Decrement Tables
The following tables indicate the percentages of original principal balances of the specifiedClasses that would be outstanding after each date shown at various constant PSA rates, and thecorresponding weighted average lives of those Classes. The tables have been prepared on the basis ofthe Pricing Assumptions.
In the case of the information set forth for each Class under 0% PSA, however, we assumed thatthe Mortgage Loans have the original and remaining terms to maturity and bear interest at theannual rates specified in the table below.
It is unlikely that all of the Mortgage Loans will have the loan ages, interest rates or remainingterms to maturity assumed, or that the Mortgage Loans will prepay at any constant PSA level.
In addition, the diverse remaining terms to maturity of the Mortgage Loans could produce sloweror faster principal distributions than indicated in the tables at the specified constant PSA rates, evenif the weighted average remaining term to maturity and the weighted average loan age of theMortgage Loans are identical to the weighted averages specified in the Pricing Assumptions. This isthe case because pools of loans with identical weighted averages are nonetheless likely to reflectdiffering dispersions of the related characteristics.
S-19
Percent of Original Principal Balances Outstanding
* Indicates an outstanding balance greater than 0% and less than 0.5% of the original principal balance.** Determined as specified under “Yield, Maturity and Prepayment Considerations—Weighted Average Lives and Final Distribu-
tion Dates” in the REMIC Prospectus.† In the case of a Notional Class, the Decrement Table indicates the percentage of the original notional principal balance
outstanding.
Characteristics of the Residual Classes
A Residual Certificate will be subject to certain transfer restrictions. See “Description of theCertificates—The Certificates—Special Characteristics of the Residual Certificates” and “MaterialFederal Income Tax Consequences—Taxation of Beneficial Owners of Residual Certificates” in theREMIC Prospectus.
Treasury Department regulations (the “Regulations”) provide that a transfer of a “noneconomicresidual interest” will be disregarded for all federal tax purposes unless no significant purpose of thetransfer is to impede the assessment or collection of tax. A Residual Certificate will constitute anoneconomic residual interest under the Regulations. Having a significant purpose to impede theassessment or collection of tax means that the transferor of a Residual Certificate had “improperknowledge” at the time of the transfer. See “Description of the Certificates—The Certificates—Special Characteristics of the Residual Certificates” in the REMIC Prospectus. You should consultyour own tax advisor regarding the application of the Regulations to a transfer of a ResidualCertificate.
CERTAIN ADDITIONAL FEDERAL INCOME TAX CONSEQUENCES
The Certificates and payments on the Certificates are not generally exempt from taxation.Therefore, you should consider the tax consequences of holding a Certificate before you acquire one.The following tax discussion supplements the discussion under the caption “Material Federal IncomeTax Consequences” in the REMIC Prospectus. When read together, the two discussions describe thecurrent federal income tax treatment of beneficial owners of Certificates. These two tax discussionsdo not purport to deal with all federal tax consequences applicable to all categories of beneficialowners, some of which may be subject to special rules. In addition, these discussions may not apply toyour particular circumstances for one of the reasons explained in the REMIC Prospectus. You shouldconsult your own tax advisors regarding the federal income tax consequences of holding anddisposing of Certificates as well as any tax consequences arising under the laws of any state, localor foreign taxing jurisdiction.
S-23
U.S. Treasury Circular 230 Notice
The tax discussions contained in the REMIC Prospectus (including the sections entitled “Mate-rial Federal Income Tax Consequences” and “ERISA Considerations”) and this prospectus supple-ment were not intended or written to be used, and cannot be used, for the purpose of avoiding UnitedStates federal tax penalties. These discussions were written to support the promotion or marketing ofthe transactions or matters addressed in this prospectus supplement. You should seek advice basedon your particular circumstances from an independent tax advisor.
REMIC Elections and Special Tax Attributes
We will make a REMIC election with respect to each REMIC set forth in the table under“Description of the Certificates—General—Structure.” The Regular Classes will be designated as“regular interests” and the Residual Classes will be designated as the “residual interests” in theREMICs as set forth in that table. Thus, the REMIC Certificates and any related RCR Certificatesgenerally will be treated as “regular or residual interests in a REMIC” for domestic building and loanassociations, as “real estate assets” for real estate investment trusts, and, except for the ResidualClasses, as “qualified mortgages” for other REMICs. See “Material Federal Income Tax Conse-quences—REMIC Election and Special Tax Attributes” in the REMIC Prospectus.
Taxation of Beneficial Owners of Regular Certificates
The Notional Classes and the Principal Only Class will be issued with original issue discount(“OID”), and certain other Classes of REMIC Certificates may be issued with OID. If a Class is issuedwith OID, a beneficial owner of a Certificate of that Class generally must recognize some taxableincome in advance of the receipt of the cash attributable to that income. See “Material Federal IncomeTax Consequences—Taxation of Beneficial Owners of Regular Certificates—Treatment of OriginalIssue Discount” in the REMIC Prospectus. In addition, certain Classes of REMIC Certificates may betreated as having been issued at a premium. See “Material Federal Income Tax Consequences—Taxation of Beneficial Owners of Regular Certificates—Regular Certificates Purchased at a Pre-mium” in the REMIC Prospectus.
The Prepayment Assumptions that will be used in determining the rate of accrual of OID will beas follows:
See “Material Federal Income Tax Consequences—Taxation of Beneficial Owners of Regular Cer-tificates—Treatment of Original Issue Discount” in the REMIC Prospectus. No representation ismade as to whether the Mortgage Loans underlying the MBS will prepay at any of those rates or anyother rate. See “Description of the Certificates—Weighted Average Lives of the Certificates” in thisprospectus supplement and “Yield, Maturity and Prepayment Considerations—Weighted AverageLives and Final Distribution Dates” in the REMIC Prospectus.
Taxation of Beneficial Owners of Residual Certificates
The Holder of a Residual Certificate will be considered to be the holder of the “residual interest”in the related REMIC. Such Holder generally will be required to report its daily portion of the taxableincome or net loss of the REMIC to which that Certificate relates. In certain periods, a Holder of aResidual Certificate may be required to recognize taxable income without being entitled to receive a
S-24
corresponding amount of cash. Pursuant to the Trust Agreement, we will be obligated to provide tothe Holder of a Residual Certificate (i) information necessary to enable it to prepare its federal incometax returns and (ii) any reports regarding the Residual Class that may be required under the Code.See “Material Federal Income Tax Consequences—Taxation of Beneficial Owners of Residual Cer-tificates” in the REMIC Prospectus.
Taxation of Beneficial Owners of RCR Certificates
The RCR Classes will be created, sold and administered pursuant to an arrangement that will beclassified as a grantor trust under subpart E, part I of subchapter J of the Code. The RegularCertificates that are exchanged for RCR Certificates set forth in Schedule 1 (including any exchangeseffective on the Settlement Date) will be the assets of the trust, and the RCR Certificates willrepresent an ownership interest of the underlying Regular Certificates. For a general discussion ofthe federal income tax treatment of beneficial owners of Regular Certificates, see “Material FederalIncome Tax Consequences” in the REMIC Prospectus.
Generally, the ownership interest represented by an RCR certificate will be one of two types. Acertificate of a Combination RCR Class (a “Combination RCR Certificate”) will represent beneficialownership of undivided interests in one or more underlying Regular Certificates. A certificate of aStrip RCR Class (a “Strip RCR Certificate”) will represent the right to receive a disproportionate partof the principal or interest payments on one or more underlying Regular Certificates. All of the RCRCertificates are Combination RCR Certificates. See “Material Federal Income Tax Consequences—Taxation of Beneficial Owners of RCR Certificates” in the REMIC Prospectus for a general discussionof the federal income tax treatment of beneficial owners of RCR Certificates.
PLAN OF DISTRIBUTION
We will deliver the Group 1 MBS to the Trust in exchange for the Group 1 Classes, and will sellthe AB Class of RCR Certificates to J.P. Morgan Securities LLC (the “Dealer”) for aggregate cashproceeds estimated to be approximately $205,387,152. We are obligated to deliver the remainingCertificates (other than the AI Class) to the Dealer in exchange for the remaining Trust MBS and theGroup 5 SMBS.
The Dealer proposes to offer the Certificates (other than the AI Class) directly to the public fromtime to time in negotiated transactions at varying prices to be determined at the time of sale. TheDealer may effect these transactions to or through other dealers. The AI Class initially will beretained by Fannie Mae, which may sell some or all of the Certificates of the AI Class at any time innegotiated transactions at varying prices to be determined at the time of sale.
LEGAL MATTERS
Sidley Austin LLP will provide legal representation for Fannie Mae. Cleary Gottlieb Steen &Hamilton LLP will provide legal representation for the Dealer.
No one is authorized to give information or tomake representations in connection with the Cer-tificates other than the information and represen-tations contained in or incorporated into thisProspectus Supplement and the additional Disclo-sure Documents. We take no responsibility for anyunauthorized information or representation. ThisProspectus Supplement and the additional Disclo-sure Documents do not constitute an offer or solic-itation with regard to the Certificates if it is illegal tomake such an offer or solicitation to you under statelaw. By delivering this Prospectus Supplement andthe additional Disclosure Documents at any time, noone implies that the information contained hereinor therein is correct after the date hereof or thereof.
Neither the Securities and Exchange Commis-sion nor any state securities commission hasapproved or disapproved the Certificates or deter-mined if this Prospectus Supplement is truthful andcomplete. Any representation to the contrary is acriminal offense.