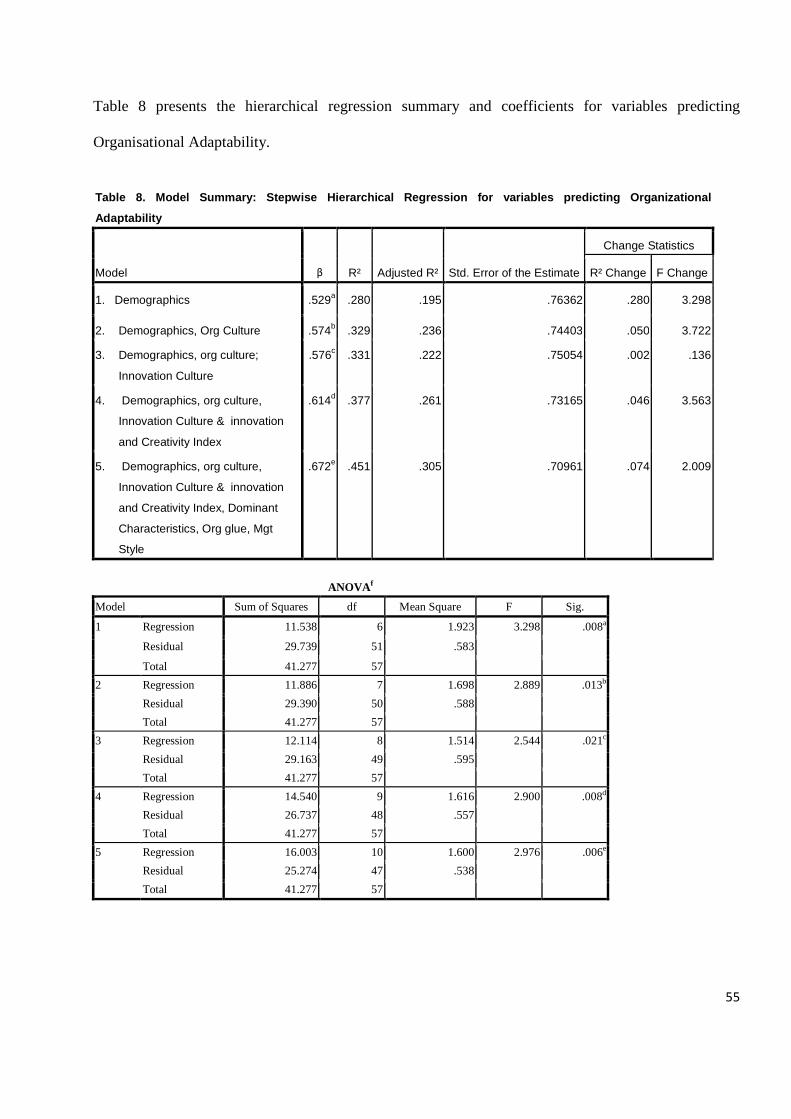
Page 1
The relationship between Creativity, Innovation and Organisational Culture: Achieving
external adaptation by leveraging an innovative enabling culture.
By
Sandra S Gudyanga
A Dissertation submitted in partial fulfilment of t he requirements of the Masters Degree
in Occupational Psychology (MOPS)
Department of Psychology
Faculty of Social Studies
University of Zimbabwe.
June 2013
Supervisor: Mr. D. Zvomuya
Page 2
i
ACKNOWLEDGEMENTS
I wish to express my appreciation for the guidance received in completing this project:
To my family and Jehovah for giving me the strength and resilience to finish this
journey strong.
My supervisor, Mr D. Zvomuya for his fortitude and guidance.
Mr Nharirire and Mr Dhliwayo for their insightful guidance.
The ART Corporation team for their support and willing participation.
The MOPS class for your support and amity we shared
Page 3
ii
I declare that the subsequent research project ‘The relationship between Creativity,
Innovation and Organisational Culture: Achieving external adaptation by leveraging an
innovative enabling culture.’ is my own work and that I have acknowledged all the sources
used in this study to the best of my knowledge and that it had not been submitted at any other
institution of higher learning.
………………………………………. ……..…………………
Sandra S. Gudyanga: R033237M DATE
Page 4
iii
Abstract
In the face of intense global competition and economic instability, the extant reality for
organisations in developing economies is to either adapt, innovate, or die! The purpose of this
project was to empirically test the relationship between organisational culture; innovation and
creativity and organisational adaptation; and test whether innovation and creativity has an
impact on the relationship between organisational culture and organisational adaptation. The
study also sought to explore and advance practical recommendations on how an
organisation’s innovative and creative potential can be leveraged through culture to ensure
organisational adaptation. The study proposed that the decline of the organisation under study
was due to its failure to adapt or navigate the environment. Descriptive statistics, Pearson
correlation and Regression analysis were used to address research questions and test the
hypotheses.
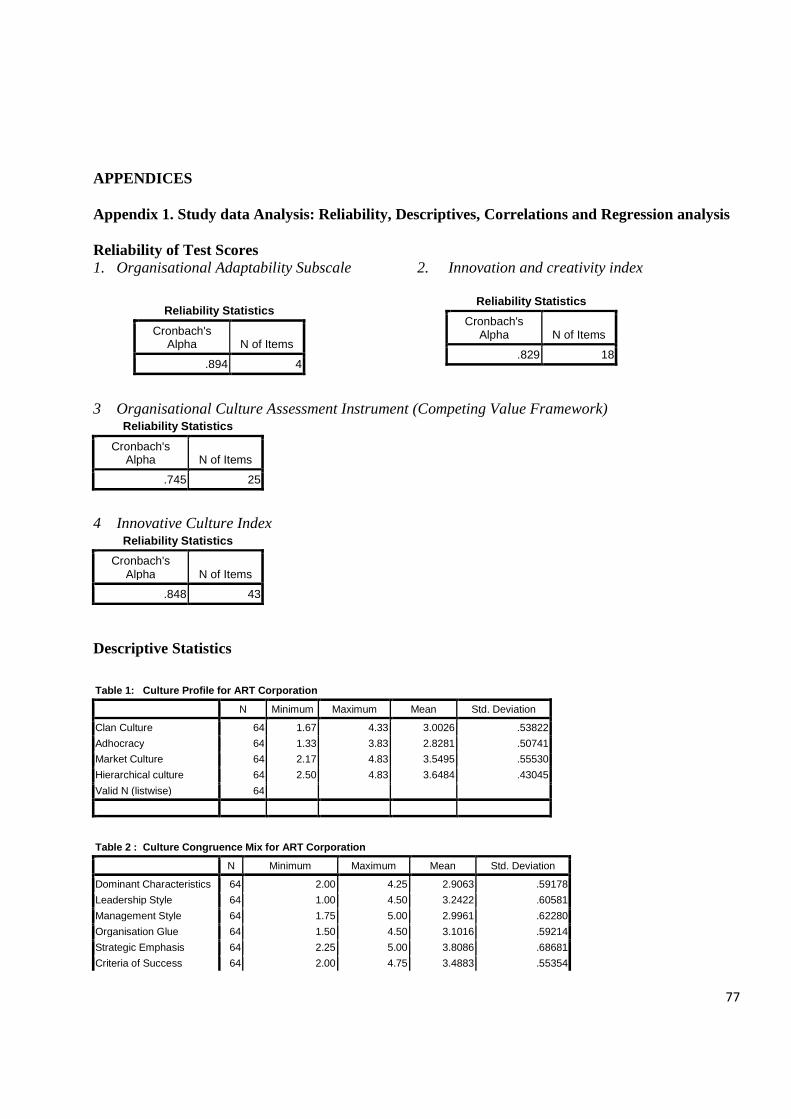
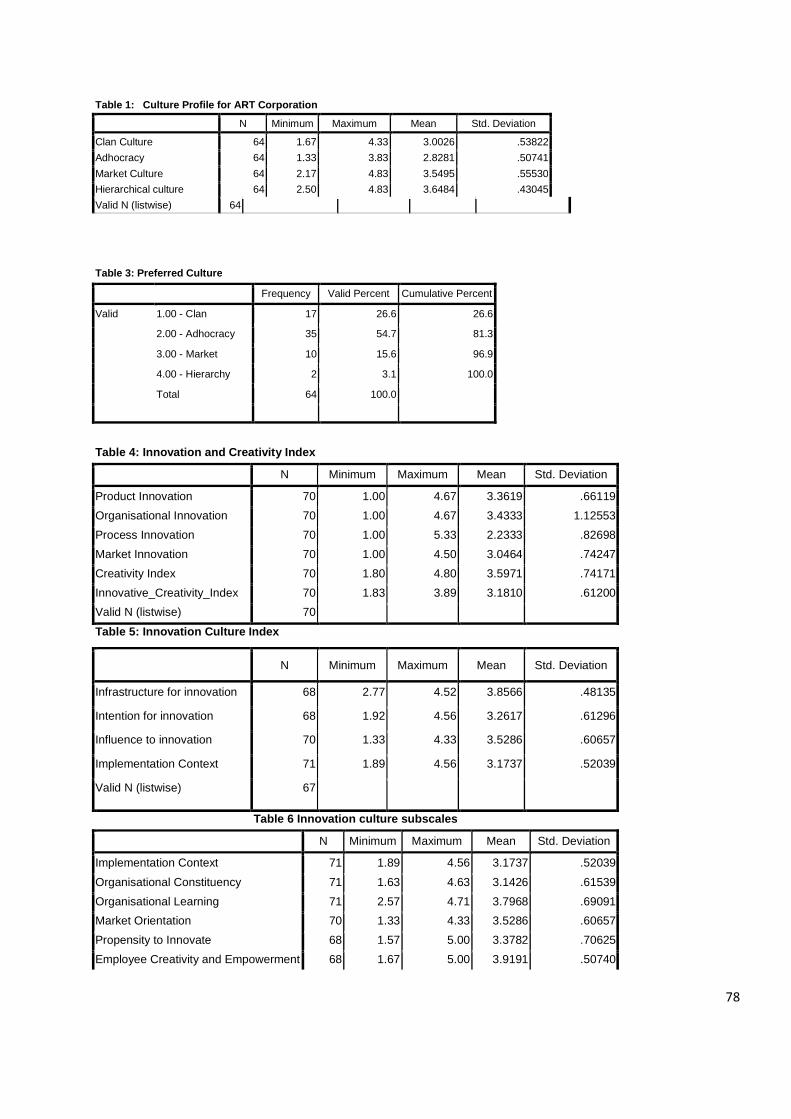
Survey results of ART Corporation sample showed that the dominant culture type at ART
Corporation is the Hierarchy culture with a mean score of 3.65, sd 0.43. Overall ART
Corporation has a lower organisational adaptation index with a mean score of 2.50. sd 0.92
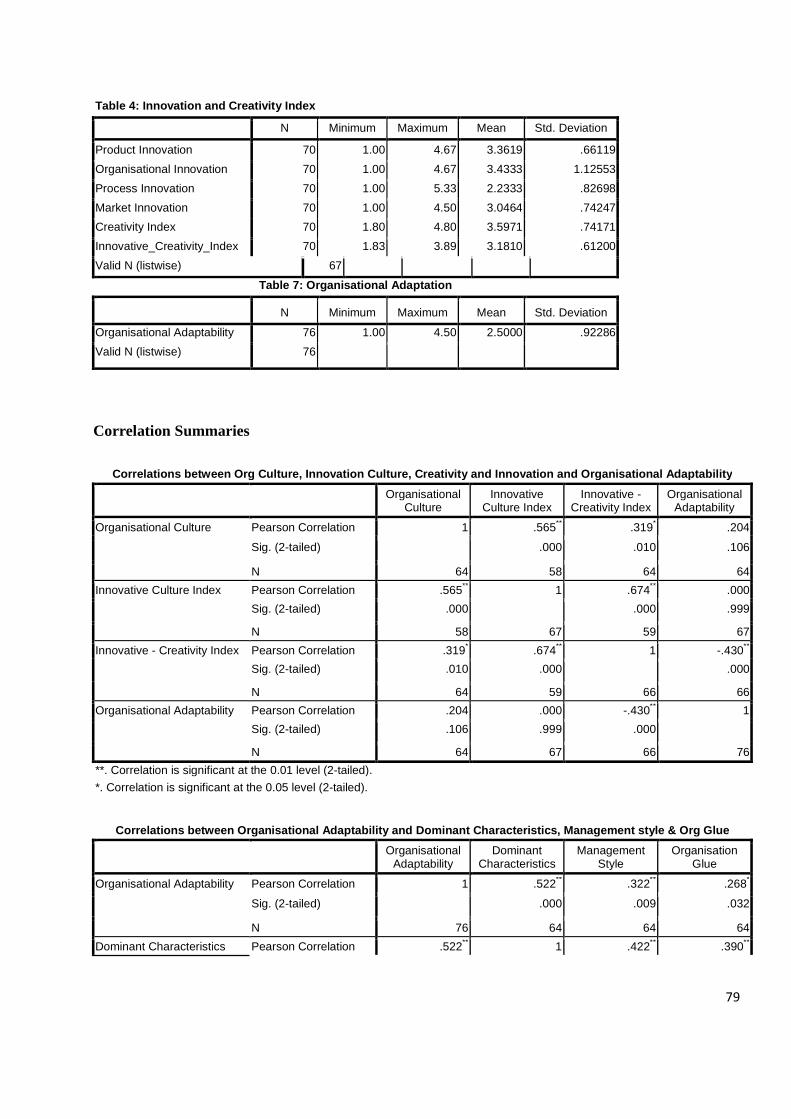
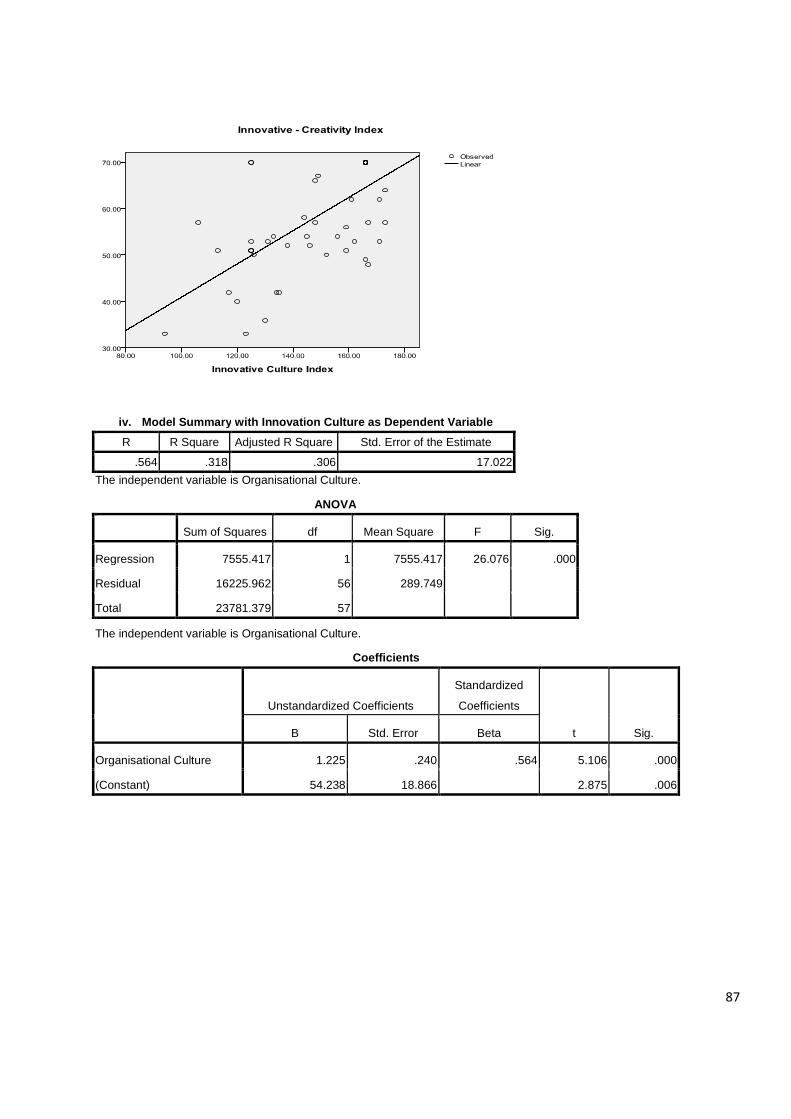
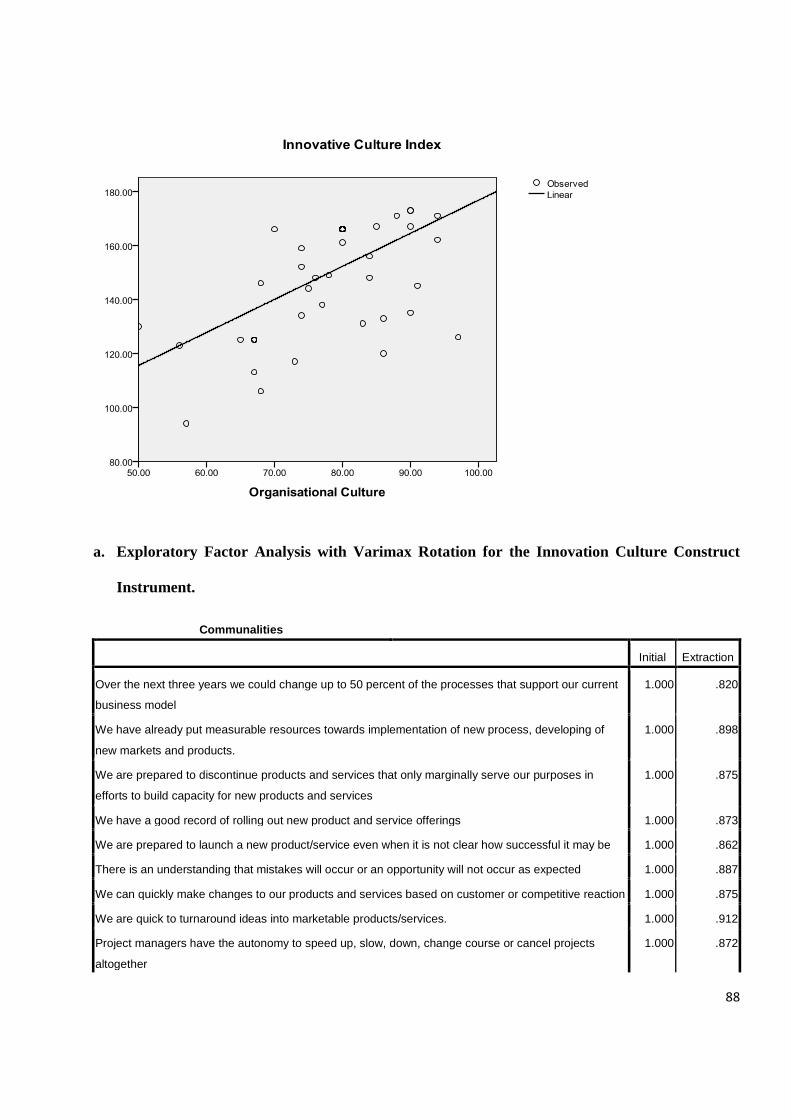
Significant relationships were found between Organisational Culture and Innovation culture
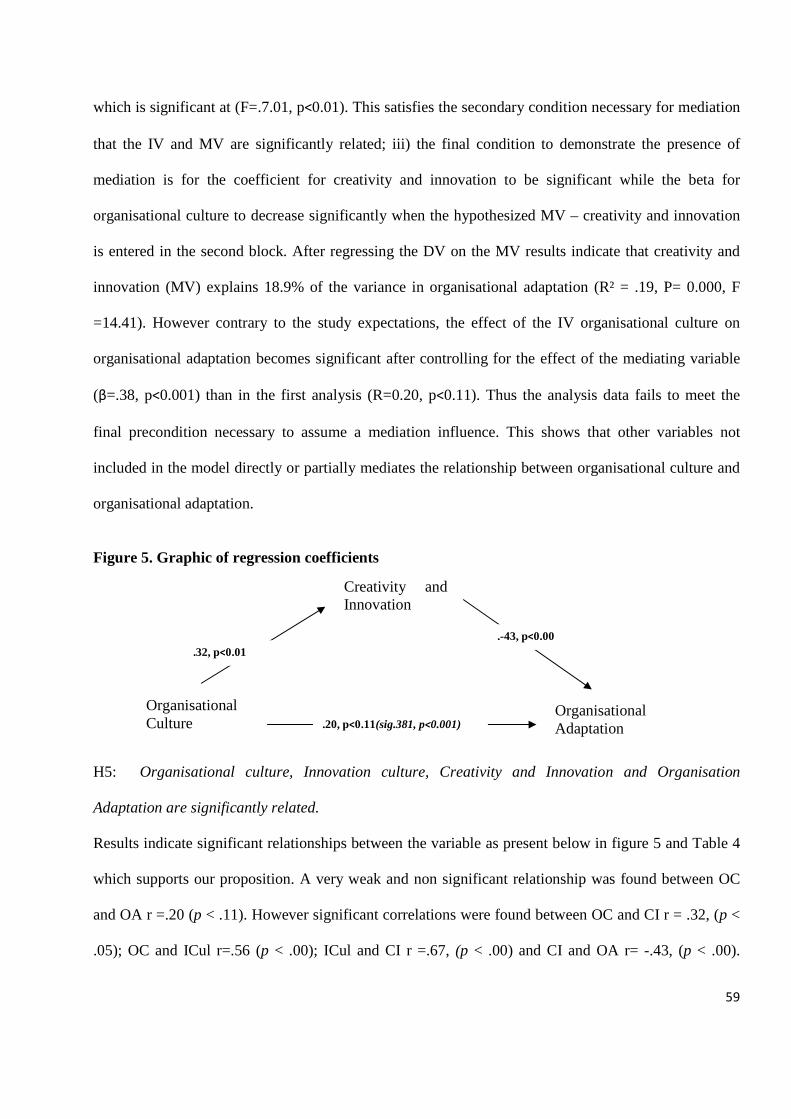
(r = 0.56, p<0.00), Organisational culture and creativity and innovation (r=.32 p<0.01); the
Innovation culture construct and innovation and creativity index (r = 0.67; p < 0.00,) however
an inverse relationship was found between innovation and creativity and organisational
adaptation (r = -0.43, p <0.001). A low significant relationship was found between
organisational adaptation and organisational culture r =0.20, p<0.11. After controlling for
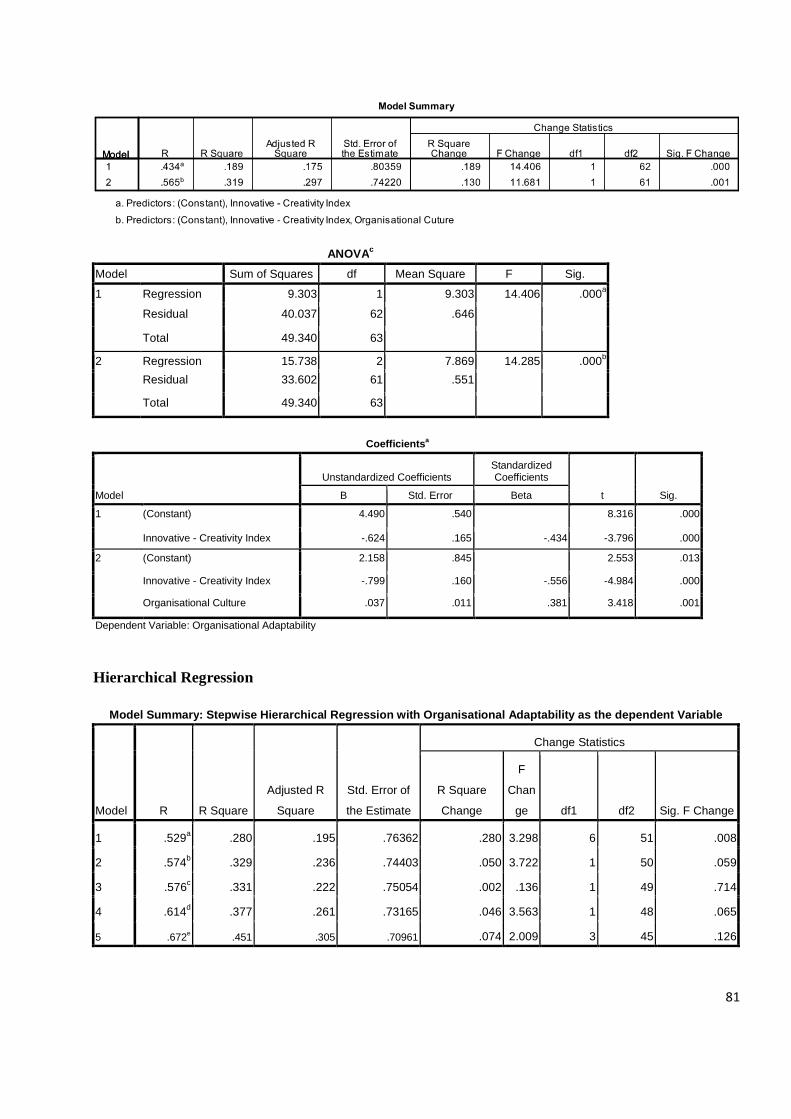
mediation the variance explained by organisational culture changed from 4.2% to 14.44%
that is the link with organisational adaptation increased significantly (β=.38, p<0.01) thus
failing to satisfy the conditions necessary to determine mediation. Secondary analysis with
specific organisational culture dimensions produced significant correlations with the
strongest being dominant characteristics r=0.52, p<0.00. The results indicate that ART
Corporation need to focus on its organisational culture to leverage organisational adaptation.
Future research should focus on exploring other intervening variable that may be possibly
mediating the relationship between organisational adaptation and organisational culture.
Key Terms Organisational Culture, Innovation Culture, Creativity and Innovation,
Organisational Adaptation.
Page 5
1
TABLE OF CONTENTS
ACKNOWLEDGEMENTS ........................................................................................................ i
Abstract .................................................................................................................................... iii
CHAPTER ONE ........................................................................................................................ 4
1.1. INTRODUCTION ....................................................................................................................... 4
1.2. BACKGROUND OF THE STUDY ........................................................................................... 9
1.3. PURPOSE OF THE STUDY .................................................................................................... 13
1.4. RESEARCH QUESTIONS ....................................................................................................... 14
1.5. OBJECTIVES OF THE STUDY .............................................................................................. 15
1.6. SIGNIFICANCE OF THE STUDY .......................................................................................... 16
1.7. DEFINITION OF TERMS ........................................................................................................ 17
CHAPTER 2 ............................................................................................................................ 18
2. LITERATURE REVIEW ............................................................................................................. 18
2.1. Historical Overview .................................................................................................................. 18
2.1.1. Creativity and Nature ......................................................................................................... 18
2.1.2. Creativity and Nurture: the social context of creativity. ................................................... 19
2.2. Theoretical Issues to the study of Creativity and Innovation .................................................... 20
2.3. Conceptual Issues in the Study of Creativity and Innovation ................................................... 23
2.4. Methodological Issues in the study of Creativity and Innovation ............................................. 30
Page 6
2
2.5. Conceptual Issues in the Study of Culture ................................................................................ 31
2.6. Methodological Issues to the study of Organisational Culture ................................................. 36
2.7. Conceptual Issues in the Study of Organisational Adaptation .................................................. 37
2.8. Organisational Culture, Innovation & Creativity and Organisational Adaptation .................... 39
2.9. Theoretical Framework ............................................................................................................. 40
2.10. Research Hypotheses ............................................................................................................. 44
CHAPTER 3 ............................................................................................................................ 45
3. METHODOLOGY ....................................................................................................................... 45
3.1. Research Design .................................................................................................................... 45
3.2. Sample ................................................................................................................................... 45
3.3. Survey Instruments ................................................................................................................ 47
3.4. Data Analysis ......................................................................................................................... 49
3.5. Inferential Statistics ............................................................................................................... 51
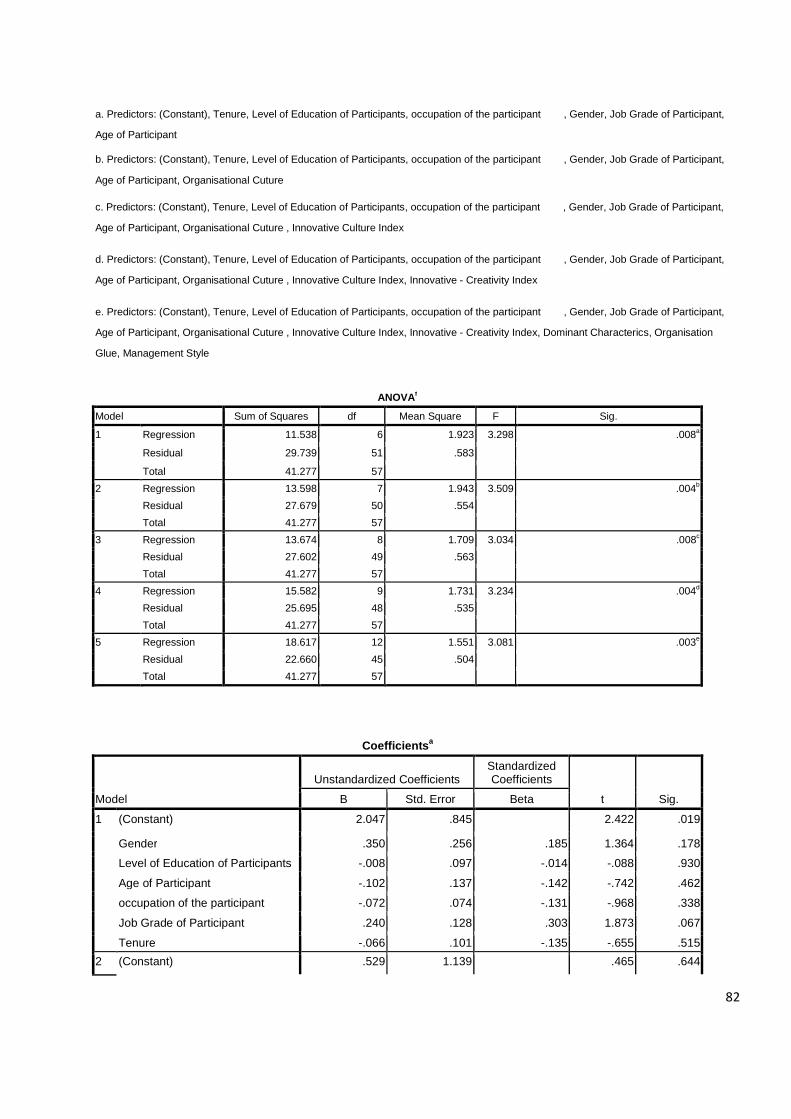
3.6. Summary of Regression Analysis.......................................................................................... 53
CHAPTER 4. ........................................................................................................................... 58
4. RESULTS ..................................................................................................................................... 58
CHAPTER 5. ........................................................................................................................... 61
5. DISCUSSION, CONCLUSIONS AND RECOMMENDATIONS .............................................. 61
5.1. Discussion of Results............................................................................................................. 61
Page 7
3
5.2. Recommendations ................................................................................................................. 64
5.3. Limitations of the Study ........................................................................................................ 66
5.4. Conclusion ............................................................................................................................. 68
REFERRENCES .................................................................................................................................. 70
APPENDICES ...................................................................................................................................... 77
List of figures
Figure 1. Organisational life cycle………………………………………………… ………….7
Figure 2. ART Performance Indicators…………………………………………………….....11
Figure 3. Logical Structure of creativity concept by Kaufman 1993………………………29
Figure 4. Theoretical Framework …………………………………………………………… 41
Figure 5. Mediation Analysis model…………………………………………………………..59
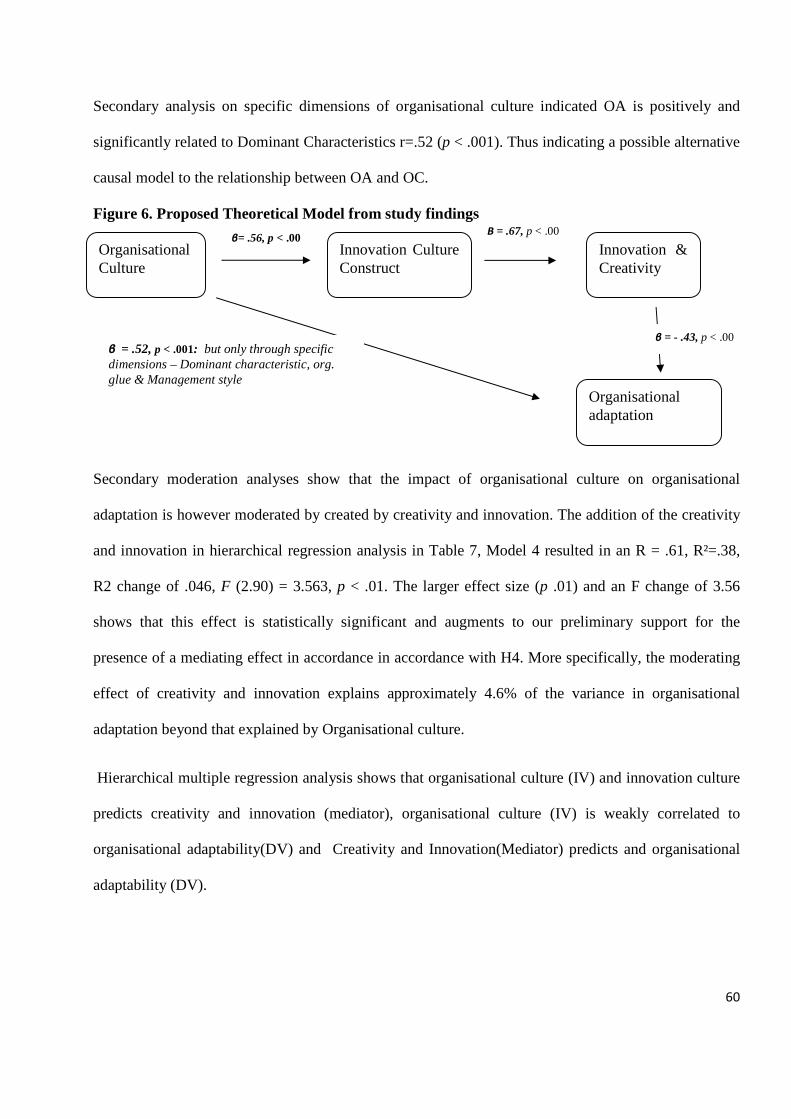
Figure 6. Proposed Theoretical Model ………………………………………………………...60
List of Tables
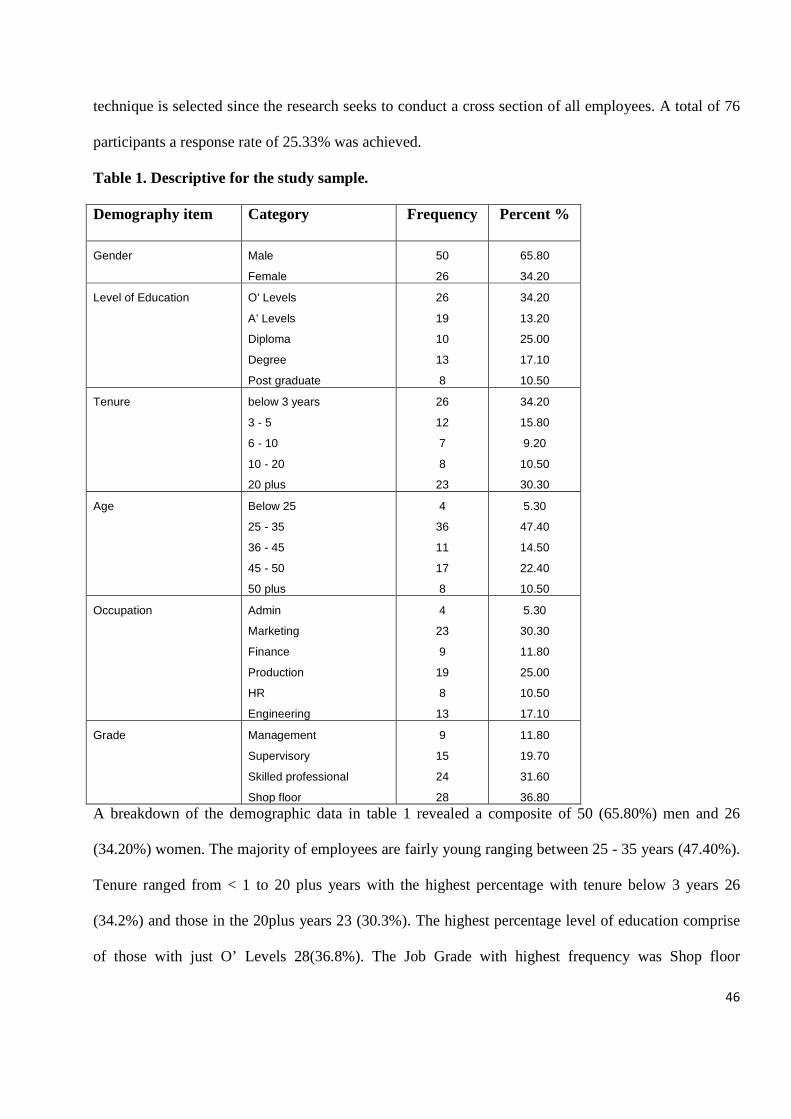
Table 1. Descriptive for the study sample……………………………………………………..46
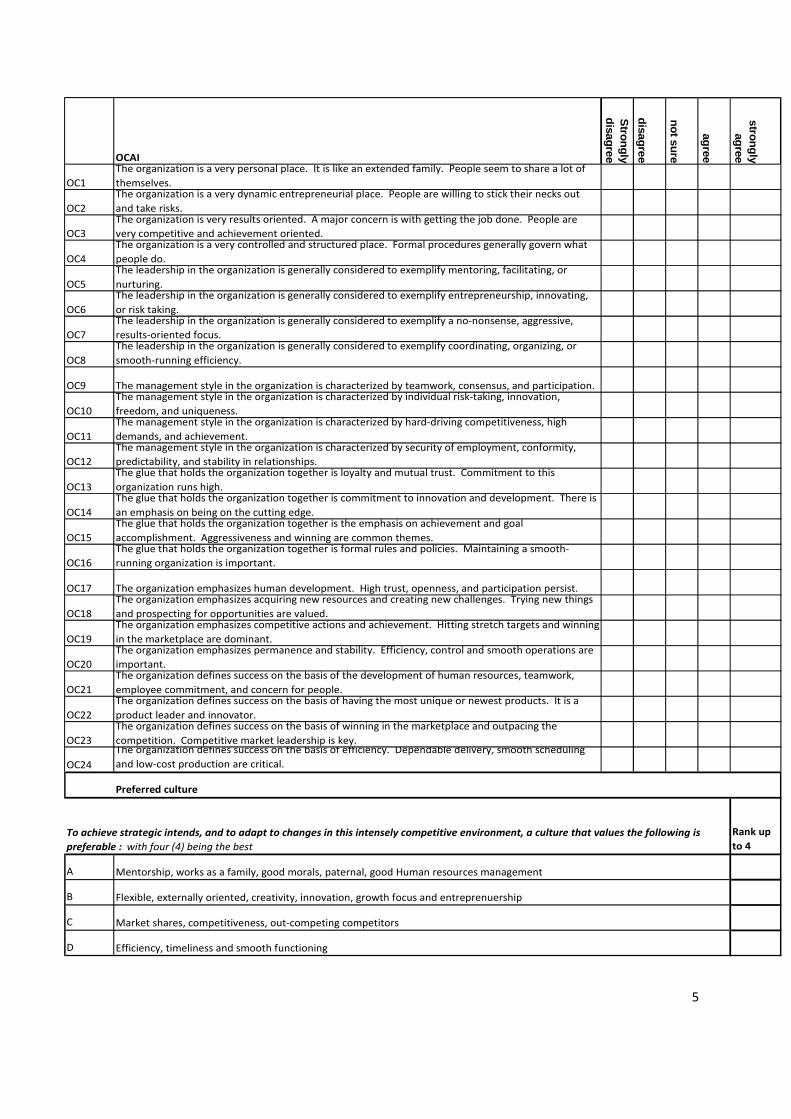
Table 2. Descriptive Statistics for OC, IC, I&C Index and OA…………………………………… 50
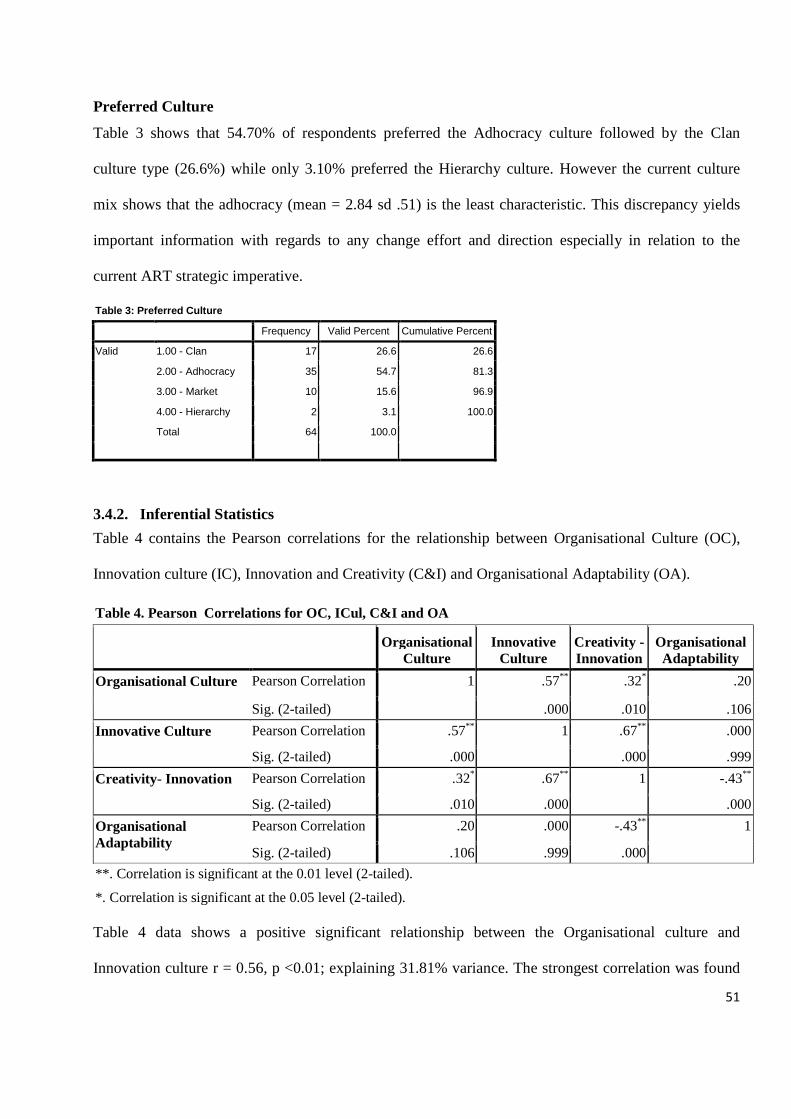
Table 3: Preferred Culture…………………………………………………………………........51
Table 4. Pearson Correlations for OC, ICul, C&I and OA……………… ..…………………. 51
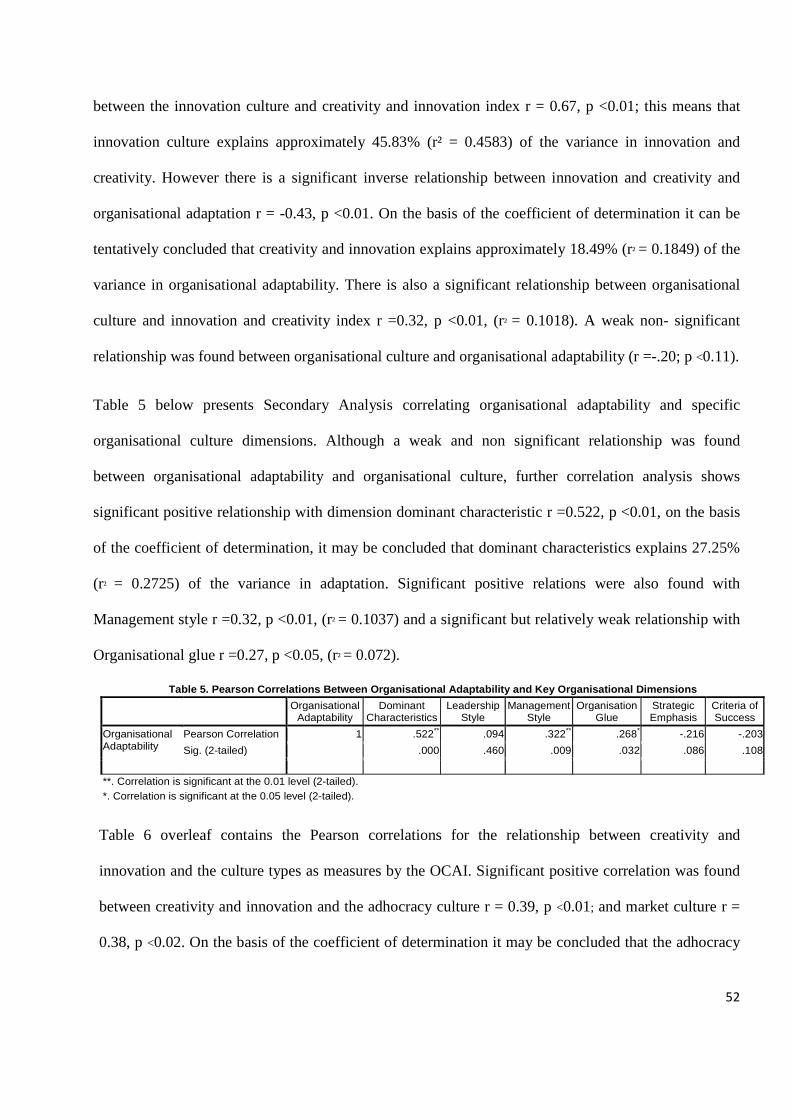
Table 5. Pearson Correlations Between OA and Key Organisational Dimensions…………….52
Table 6. Correlations between Organisational Culture types and creativity and Innovation.....54
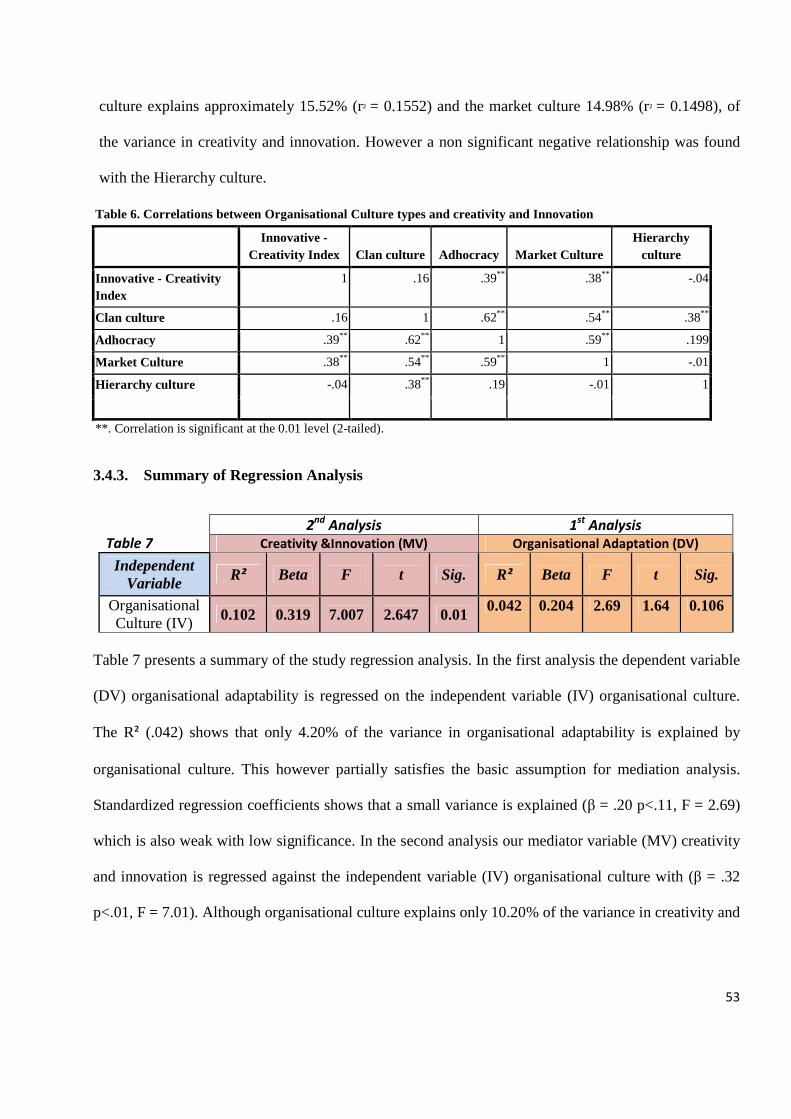
Table 7. Summary of Regression Analysis ………………………………………………………54
Table 8. Stepwise Hierarchical Regression for variables predicting OA………………………...55
Page 8
4
CHAPTER ONE
The chapter puts the imperatives of the research into context and explores the background to the study.
Aims, objectives, assumptions and research questions of the current study and its significance in the
domain of occupational psychology and practice are highlighted.
1.1. INTRODUCTION
In the wake of over a decade of an inimical fluid economic environment and increased global
competition; recovery depends on optimum contributions from everyone in the organization and an
effective (adaptable and flexible) corporate culture. Attaining organisational viability and survival has
become a topic dominating the strategic agenda of many organisations. Attention of the practitioner has
therefore shifted to harnessing employee creative energies into useful and valuable services and
products. In addition among the researcher fraternity, organisational culture has assumed greater
importance in relation to organisational adaptation (Achrol, 1991) and its role in facilitating or
hindering creativity and innovation. Finally Kitchell (1995) notes that companies have come to
appreciate that Research and Development (R&D) alone will not secure innovation, that expressed
creativity is more a cultural concern than a capital or technical issue.
However significant these issues are, creativity and innovation literature has remained deficient in one
area. Creativity and innovation has been posited as crucial to competitive advantage, bottom-line
performance and entrepreneurship (Kotter & Heskett 1992, Baldacchino 2009, and Poskiene, 2006).
Indeed organisations in Zimbabwe may have to leverage innovation and creativity for a different
agenda that goes beyond just competitiveness, enhanced customer product or service experience to
securing adaptation. Mott (1972) posits that an effective organisation should be in the first instance
productive then flexible and adaptive. In the current dynamic environmental, a lot of pressure is being
put on organisations not just to be productive but be adaptive. However, much research and practitioner
racket has been on leveraging effectiveness through ‘productivity’. The ‘adaptive’ dimension has been
Page 9
5
sidelined in organisational behavioral studies despite the fact that it’s an indispensible capability. For
this study, only the ‘adaption’ dimension will be considered. Delobbe, Haccoun, and Vandenberghe
(2000), note that culture is an influential theoretical tool in measuring an organisation’s capacity to
adapt and long - term effectiveness. Thus diagnosing culture is imperative if we are to ensure
organisations that are effective in adjusting to their environments.
Scholars have proposed that some cultures are likely to be effective in uncertain conditions. This line of
thinking has mainly preceded the proposition that successful firms are adaptable. Subsequent research
such as Cameron and Quinn (1999) and Kotter and Heskett (1992) has therefore sought to understand
the characteristics of successful firms. This line of research proved that successful firms are creative
(Angel, 2006), innovative and flexible (Deshpande & Farley, 2004): therefore innovative firms have
been posited to be adaptable (Eisenhardt & Tabrizi, 1995). Schein (1992) argues that culture develops
as the organisation seeks to cope with problems of internal integration and external adaptation.
Therefore researchers such as (Eisenhardt & Tabrizi, 1995; Hurley & Hult, 2008 and Berkhout, Hertin,
& Gann, 2006) posited that innovation is the primary mechanism by which organisations can accelerate
the adaption process. However there is a dearth of studies that have actually empirically tested this
creativity/innovation - adaptation assumption. The intent of the current research is therefore threefold.
First it seeks to diagnose the characteristic culture type of the firm understudy; then establish the
creativity and innovative capacity of the firm and most importantly empirical test the ‘culture –
creativity/innovation –adaptability’ assumption.
Importance of Organisational culture
Organisational cultural issues are becoming increasingly important as sources of strategic positioning.
Although there is no linear effect between organisational culture and adaption, cultural issues may be
responsible for facilitating or hindering innovation and creativity. Denison, (1984) contends that the
strength of corporate culture is directly correlated with the level of profits in a company. The
Page 10
6
Minessence Group (2011) posits that organisational culture is eight times more influential on
performance variance than any corporate strategy. Paradoxically while 90% of all organisations exert
considerable efforts in coming up with business strategies and forecasts, less than 5% have a plan for
developing their culture to match environmental trends. Kotter and Heskett (1992) found that firms
with a strong, strategically appropriate culture performed effectively in the long term when they
contained values that promoted innovation and change. For all its imprecision, corporate culture has a
huge impact on any organizational output.
When an organisation faces tremendous pressures to change, it is imperative to change its culture to
leverage its adaptability. These changes require a comprehensive analysis of values, routines and norms
that guide day-to-day organisational performance. Nelson and Winter (1982) notes that any
organisation inevitably develops certain organisational routines and value systems which make it able
to compete and adapt. Schein (2002) notes that these basic assumptions become so ingrained that they
transcend any explicit mandate. Schein (1992), notes that culture develops and changes slowly with
great difficulty. This is okay if the environment is changing slowly too. Unfortunately the environment
is rarely stable but is changing rapidly. A radical change in the environment may render the current
values and norms dysfunctional.
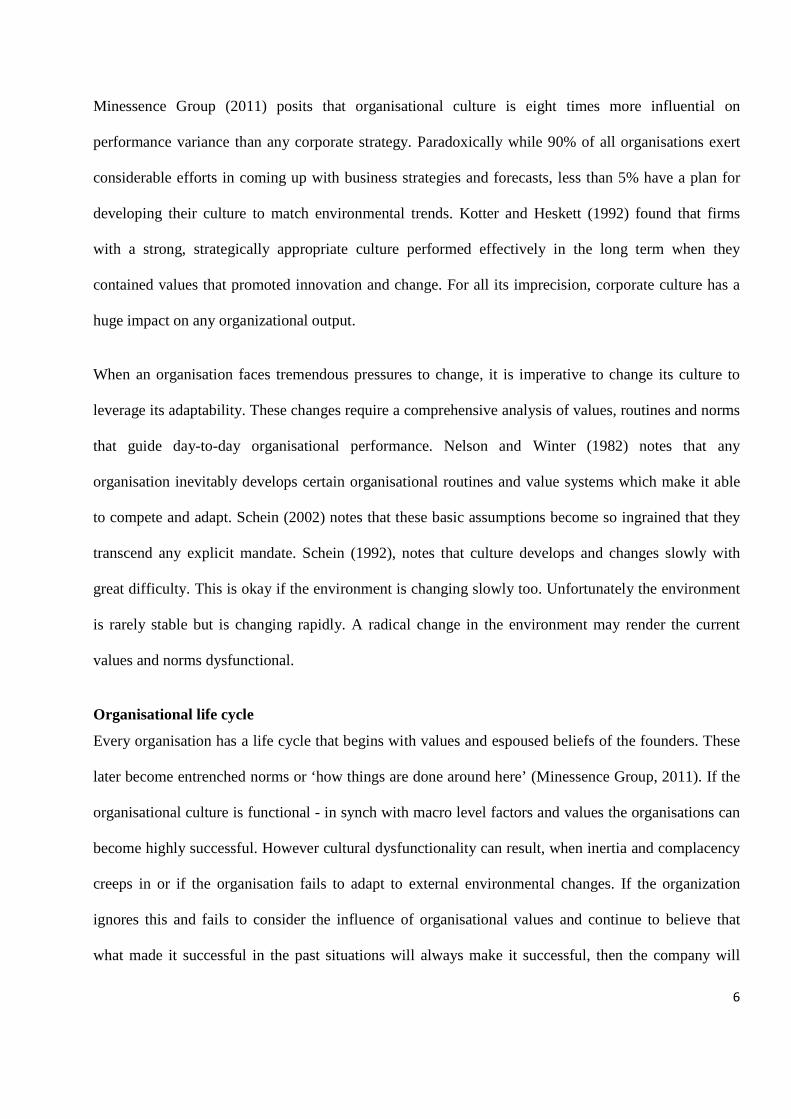
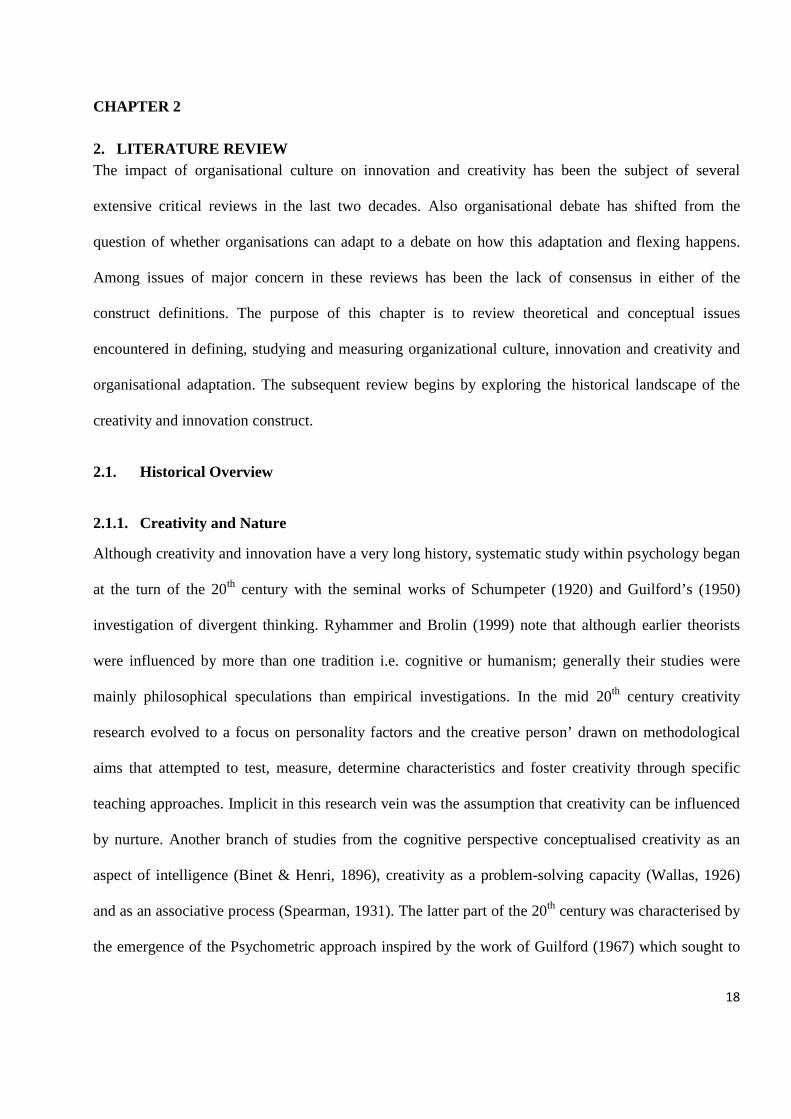
Organisational life cycle
Every organisation has a life cycle that begins with values and espoused beliefs of the founders. These
later become entrenched norms or ‘how things are done around here’ (Minessence Group, 2011). If the
organisational culture is functional - in synch with macro level factors and values the organisations can
become highly successful. However cultural dysfunctionality can result, when inertia and complacency
creeps in or if the organisation fails to adapt to external environmental changes. If the organization
ignores this and fails to consider the influence of organisational values and continue to believe that
what made it successful in the past situations will always make it successful, then the company will
Page 11
7
either (i) cease to exist, (ii) continues to barely exist or (iii) to re-invents itself around new values and
norms (Minessence Group, 2011).
Figure: 1. Organisational life cycle: adapted from the Minessence Group (2011)
Hollinger (1995) notes that when an organisation is faced with shifting stability domains and
corresponding industrial crises, management has three options: i) do nothing and wait to see if the
system will return to its stable state or hope that the external environment will settle back into its
former state. This is evidenced by the mid 2000s global recession and the political turbulence, which
saw most companies putting their corporates into ‘maintenance’, some temporarily ceased operations in
the hope that they will resume operations once the external environment returns to its stable state; (ii)
actively manage the organisational system and try to return it to stability or (iii) accepts that system is
maladaptive, that environmental forces are irreversibly and incrementally changing. That the only
strategy is to revamp the system to adapt to the new altered system. This revamping can include
Success
Foundation Boom Stabilit Decline Revamp, adapt or die
Highly successful: value - actions alignment
Bare Existence
Extinction
Highly Cohesive workforce
Chaos
Sustainable growth
Complacency
Norms Emerge
Vision& values develop
Norms, values, actions misaligned: Organisation fails to cope
Years
Page 12
8
changing cultural aspects to suit the operating environment. This adaptation process presents an
opportunity for re –invention, novelty and innovation in processes and outcomes.
The Imperative for Creativity and Innovation
Industry is born of a need to make a profit. For that it requires creativity and innovation to thrive.
Indeed the value that creativity and innovation brings to an organization cannot be overstated. The
OECD and Eurostat, (2005) posits that innovation is central to the growth of output, productivity and a
basic factor of competitiveness. Job and Sanghamitra (2006) argues that innovation benefit companies
beyond improved efficiencies or sales growth. We can no longer afford relegating creativity and
innovation solely to the ‘creative industries’ if we are to adjust and thrive in a global market. Creativity
requires development of specific organisational capabilities which deviates from the existing ones.
Anderson and Markides (2006) states that for competitive advantage, there is need to come up with a
differentiated strategy. As such, thinking ‘out of the box’ has become a recurrent mandate from
enlightened shareholders. There has been increasing pressures on organizational stakeholders from the
strategic to operational levels to be creative and innovative with their contributory solutions. However
the challenge with creativity and innovation is that you cannot mandate innovation per se, or squeeze it
out of employees. This is a collaborative process which makes imperative the creation of an enabling
environment and value systems. Reality is that coming up with creative and well differentiated business
models, services or products that break the rules of the game is not just relatively easy but insufficient!
In fact most organisations have come up and discarded a host of strategies in any given year! This
challenge is dual requiring not only ensuring adoption of such model within the organisation but
translating such strategy into value addition so as to deliver real value to customers in a cost-efficient
and profitable way. Most important challenge is a strategy that purposively creates a supportive
organisational culture that not only empowers stakeholders into incremental creative problem solving
but is adaptable to the external environment.
Page 13
9
1.2. BACKGROUND OF THE STUDY
1.2.1. The External Operating Environment
The situation in Zimbabwe is not peculiar with most organisations in decline. Industry from the mid
2000s has been beleaguered by uncertainties borne of over a decade of an inimical economy, changing
government regulations, global competition, adjusting to a multi - currency economy and skills flight.
Ironically in the relatively stable post dollarized era, many businesses have failed to justify their
existence. Although this may be blamed on the prior inimical economic environment, the failure to re –
invent and change business cases has been the death of many a company. It is in such an environment
that understanding the role creativity and innovation play in ensuring organizational survival assumes
greater importance.
Because Zimbabwean organisations have to compete against better resourced global competitors that
enjoy first-mover advantage, they cannot simply attack head-on, or lobby the government for bail- outs,
certain import bans, subsidies or hikes in import tariffs hoping to “out compete” their bigger rivals.
Successful organizations have to make their mark by introducing products or services emphasizing
radically diverse value propositions or by adopting radically different value chain configurations
(Kenny & Reedy, 2007). Although globalisation has created inherent opportunities in terms of access to
supply chains and new markets, it has also intensified competition. Vulnerable as the Zimbabwean
economy is, operating in a competitive global environment exerts heavy costs. Especially so; where
productivity, technology, efficiencies, cost platforms and quality standards are appalling in comparison
to regional and international ones. But to compete effectively organisations need to innovate
successfully. The key then to competitiveness no longer lies in re-applying past successes or the
traditional ‘way of doing business’ but in fostering organisational capacity for tolerance and the
competencies required to nurture creativity and contain the ambiguities and uncertainties innovation
brings.
Page 14
10
1.2.2. The ART Corporation Case: the internal operating Environment
Prior to dollarization ART Corporation enjoyed a relative monopoly in the paper and stationery market.
Within the paper industry, the company was competing with only 2 small paper converters and
enjoying over 70% market share. Post dollarization the country opened up to a global market which
saw the company competing with 31 new local players plus international competitors. As a result the
company‘s market share dropped to below 38%. Despite the move to increase effectiveness through
restructuring from 2008 to date, the organisation has been beset by innumerable challenges ranging
from operational inefficiencies, lower lead times, higher labour costs to turnover, organisational inertia,
receding market shares, dwindling profit margins to declining productivity indexes.
Reality is that the organisation can no longer dictate the market rules. Markets have opened up to cheap
poor quality, imitations and also competitively priced higher quality imports which have forced down
price indexes. Therefore the strategy has been on improving internal processes or produce quality
products at lower cost. The mantra among employees is that the market is not moving; not taking up
products, with the organisation shareholders contending that with the current business performance
business can fold up. There is also a pervasive desperation born of not knowing how else to convince
the market or navigate such an environment that has resulted in many executive separations.
In a bid to revitalise the group, executive management teams have changed five times post
dollarization. There have also been trials on various structural configurations. Divisions (Fleximail,
Eversharp and Softex) were merged into a consortium referred to as the Converting, this was disbanded
after slightly less than a year and Fleximail folded operations. In response to increasing competition,
another separate satellite company AT Intertrade was formed to leverage market performance and
disbanded after 6 months. 2012 HR audit results showed total system lapse of the HR function. Despite
these reconfigurations global level performance indices have continued to decline leaving in their wake
fears of closure.
Page 15
11
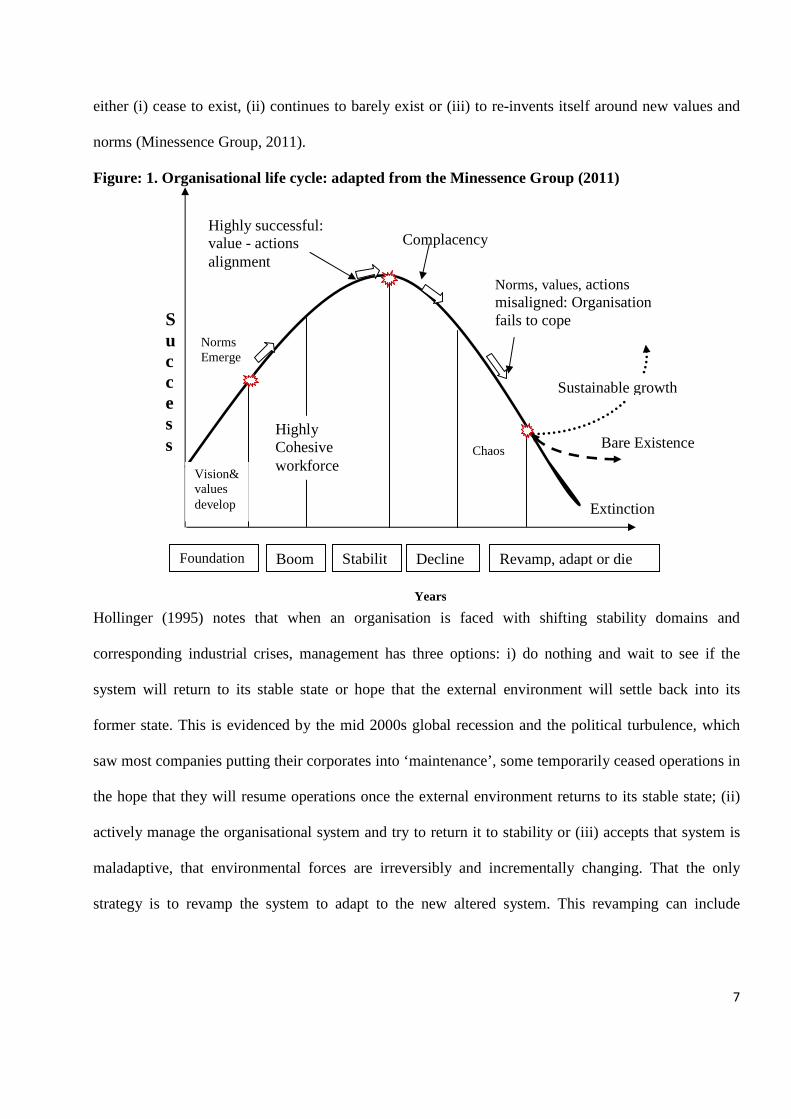
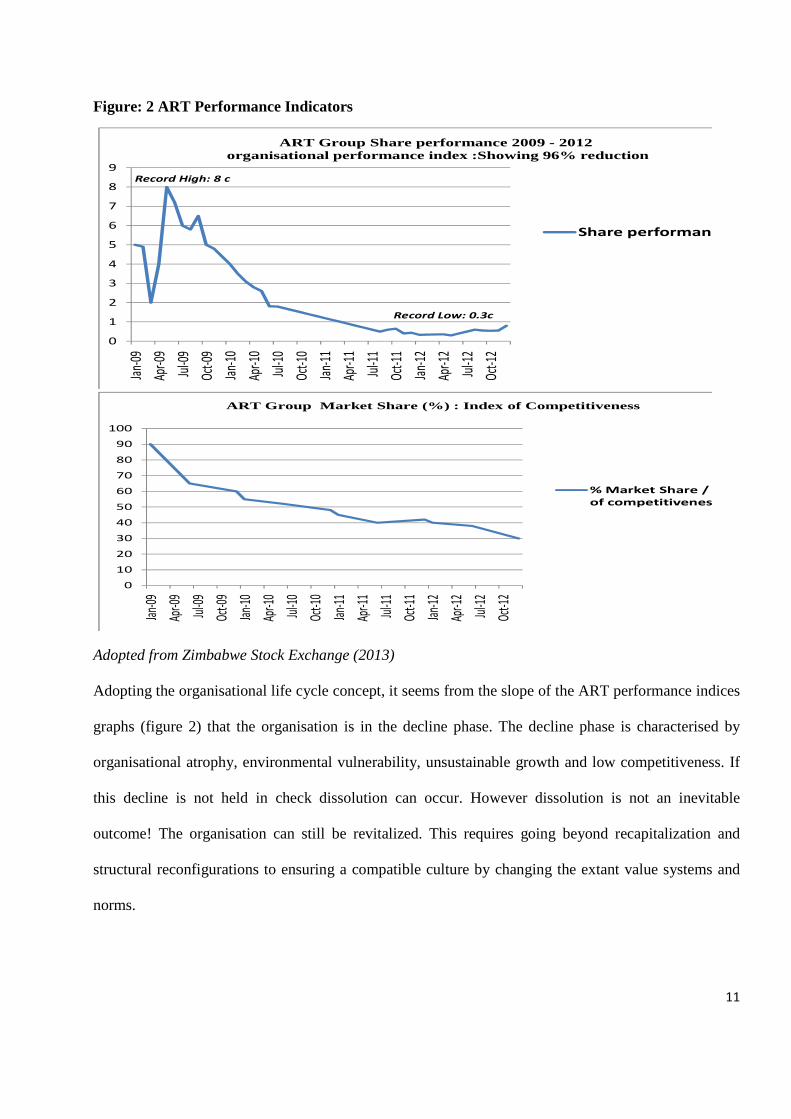
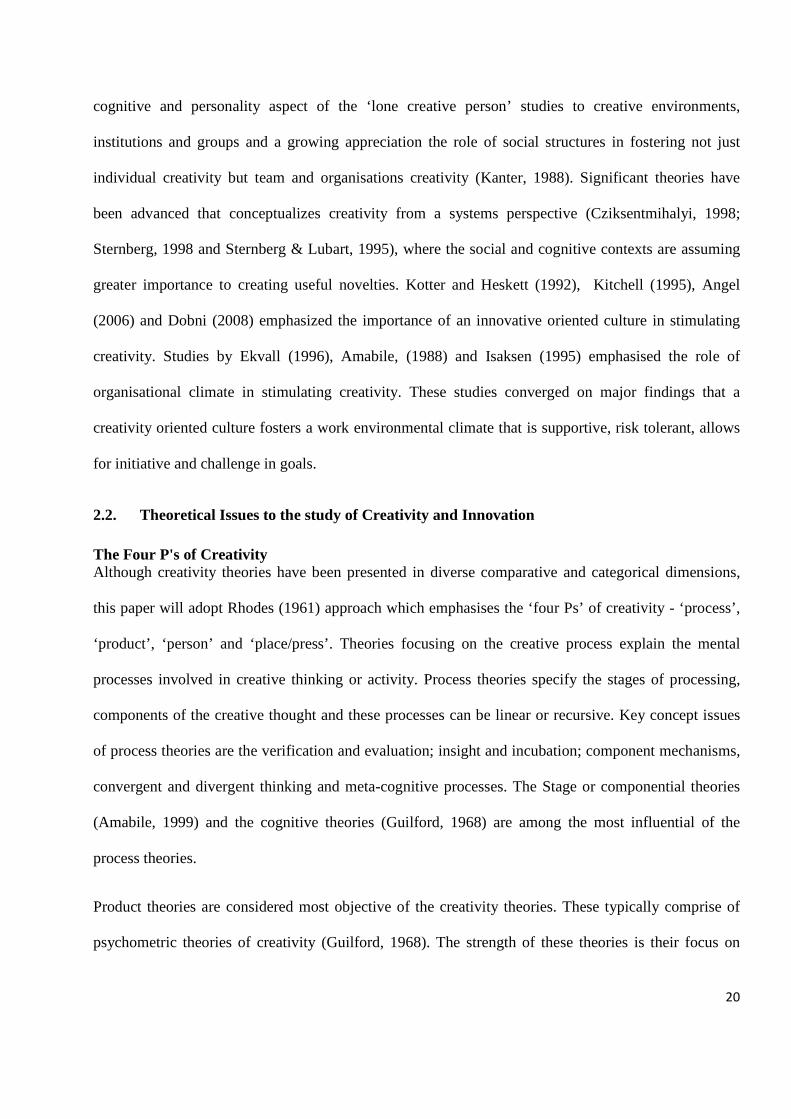
Figure: 2 ART Performance Indicators
Record High: 8 c
Record Low: 0.3c
0
1
2
3
4
5
6
7
8
9
Jan-
09
Apr-0
9
Jul-0
9
Oct-0
9
Jan-
10
Apr-1
0
Jul-1
0
Oct-1
0
Jan-
11
Apr-1
1
Jul-1
1
Oct-1
1
Jan-
12
Apr-1
2
Jul-1
2
Oct-1
2
ART Group Share performance 2009 - 2012organisational performance index :Showing 96% reduction
Share performance
0
10
20
30
40
50
60
70
80
90
100
Jan-
09
Apr-0
9
Jul-0
9
Oct-0
9
Jan-
10
Apr-1
0
Jul-1
0
Oct-1
0
Jan-
11
Apr-1
1
Jul-1
1
Oct-1
1
Jan-
12
Apr-1
2
Jul-1
2
Oct-1
2
ART Group Market Share (%) : Index of Competitiveness
% Market Share / index
of competitiveness
Adopted from Zimbabwe Stock Exchange (2013)
Adopting the organisational life cycle concept, it seems from the slope of the ART performance indices
graphs (figure 2) that the organisation is in the decline phase. The decline phase is characterised by
organisational atrophy, environmental vulnerability, unsustainable growth and low competitiveness. If
this decline is not held in check dissolution can occur. However dissolution is not an inevitable
outcome! The organisation can still be revitalized. This requires going beyond recapitalization and
structural reconfigurations to ensuring a compatible culture by changing the extant value systems and
norms.
Page 16
12
In the midst of such organisational atrophy it is prerequisite that organisations and leaders try to create
an institutional framework in which creativity and innovation are accepted as basic cultural norms.
Unfortunately culture is not like a skin that an organization sheds as it selects a new values and norms
perceived to have strategic fit with its commercial strategy (Denison, 2001). Therefore, when an
organization faces internal or external forces to change its strategy it cannot simply change its culture at
will to avoid strategic incompatibility. The organization has to recognize the miss-match between its
culture and the external environment it is operating in.
To revitalize the organisation at the turn of 2012 ART strategic direction has been on:
i. ‘Leader Value Projects’ which are basically entrepreneurship ventures that are geared towards
doing more with less and increasing organisational capacities.
The major thrust now is to expand and explore other complimentary business opportunities through
‘leader value projects’ and coming up with ‘out of the box’ divisional strategies for competitiveness.
However ten months on from initiation; these have been received with reticence with all divisions
not having firmed up on their identified entrepreneurship ventures and for most just remaining
within the confines of strategy documents.
ii) Efficiency Improvements: This has resulted in consultants also being engaged, project teams
being set up to spearhead the projects and considerable capital investments. However a thousand of
dollars later, marked efficiency improvements or cascading of the system from the project teams has
not been forthcoming.
ii. Reclaiming Market share: Expanding product ranges; incremental improvements on existing
products and investing in strategic alliances.
iii. Reviving the Human Resource function and Human Capital development.
Page 17
13
1.3. PURPOSE OF THE STUDY
The above brief contextual overview shows that fostering an innovative and creativity enabling culture
has become quite topical and receiving immense attention in the last decades. However there are still
some gaps in the literature on creativity and innovation. Several researchers (Ahmed 1998, Filipczak
1997, and Pinchot & Pinchot 1993,) have worked on identifying values, norms and assumptions
involved in promoting creativity and innovation. Very few empirical studies, especially one that
integrate quantitative and qualitative research, appear to have been carried out to support the research
findings especially so in relation to organisational adaptation. The purpose of this research is to i)
diagnose the ART culture, ii) measure the index of the relationship between the determinants of
organisational culture that might influence creativity and innovation; iii) empirically validate the
relationship between organisational culture, creativity and innovation and organisational adaptation;
and iv) advance recommendations on how ART can revamp operations, revitalize the organisation and
ensure the success of their innovation endeavours.
Most creativity and innovation research has been conducted in Western and Eastern contexts. There is
therefore a need to conduct an empirical study from a local context since results may not generalize due
to differences in cultural, socio - economic and political environments, workforce characteristics and
labour market forces. Also the country has gone though a lot of structural changes making such
research imperative. Although there has been lots of studies on innovative firms, Angel (2006) notes
that very little is known about how maladaptive organisations and their cultures can become functional
and innovative. Khandwalla and Mehta (2004) reinforces that one of the challenges facing most
companies is that employees are neither hired for their creativity nor innovativeness. The study also
seeks to assess how adaptive the current organisational is.
Page 18
14
1.4. RESEARCH QUESTIONS
The aim of the research is to diagnose the culture and assess how adaptable, innovative and creative
ART Corporation is. Therefore this research seeks to answer the following.
R1. To what extend is ART Corporation innovative and creative?
R2. How innovative is the present culture.
There seems to be little agreement in literature as to what type of organisational culture is most
adaptable to rapidly changing external contexts and promote creativity and innovation (Judge et al.,
1997). Also a paradox exists in that culture promotes the creativity and innovation necessary for
survival, but can also be an obstacle (Tushman & O’Reilly, 1997). The question then is:
R3. What is the type of organisational culture characteristic of ART Corporation? And which
culture type can support creativity and innovation
R4. How adaptable is the present organisational culture?
Page 19
15
1.5. OBJECTIVES OF THE STUDY
The subsequent study serves to append to existing literature by exploring the relationship between
organisational culture and creativity and innovation and organisational adaptation. More specifically
the foci of this exploratory study is to diagnose the organisational culture, its adaptivity and advance
practicable recommendations on how ART Corporate can best navigate the environment they are
operating in by re - aligning their organisational culture for creativity and innovation. This study is
predominantly interested in how the organisation can best leverage an innovative culture to achieve
organisational adaptation. Thus based on the recognition of the importance of organisational culture in
relation to innovation and creativity and the ability or failure to adapt, this paper seeks
o To identify through an empirically based case study, those features of in the organisational
culture which are facilitating innovation and those that are inhibiting innovation and creativity.
o To diagnose the dominant cultural types that characterises ART Corporation culture.
o To assess how creative and innovative ART Corporation is.
o Develop a model that explains the relationship between organisational culture, innovation and
creativity and organisational adaptation.
o To establish the index of the relationship between organisational culture, innovation and creativity
and organisational adaptation
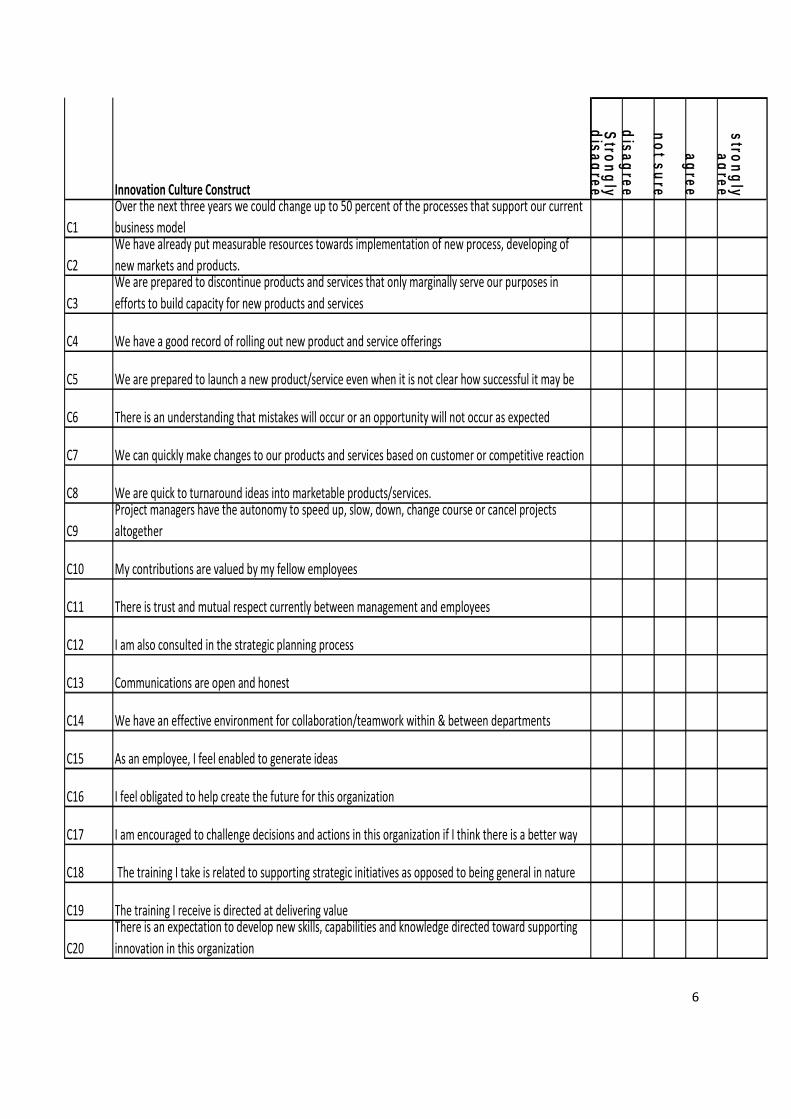
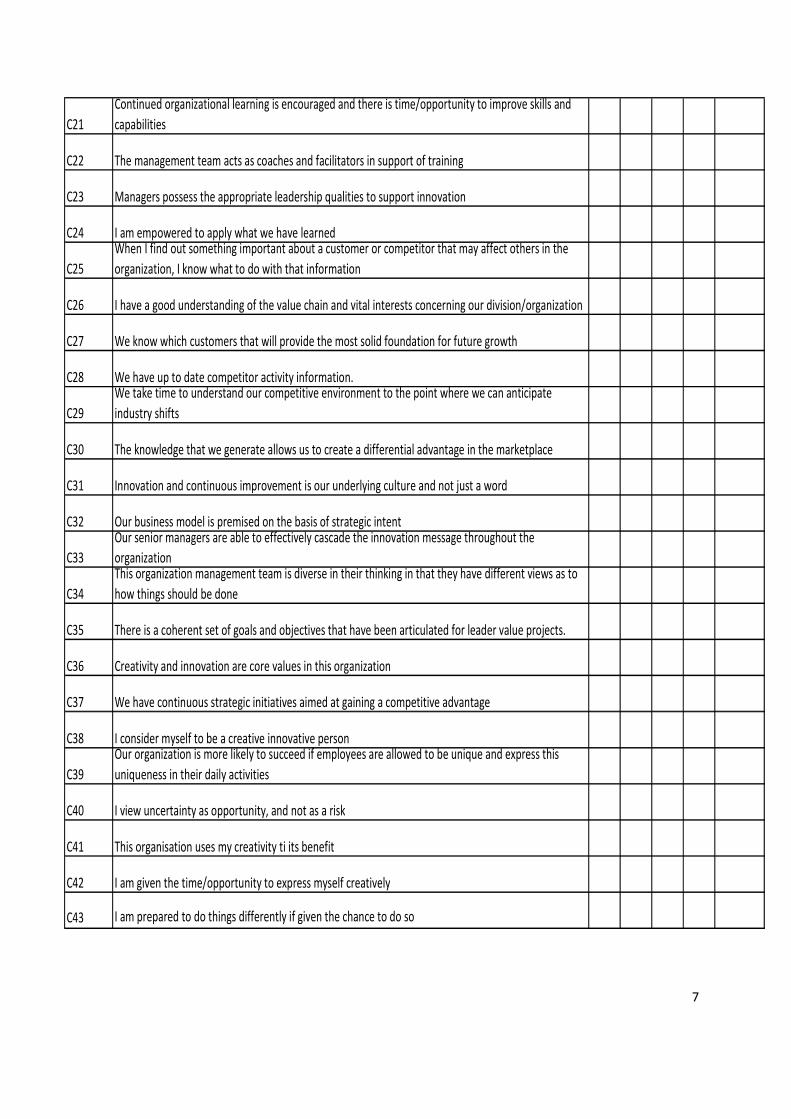
o Provide empirical generalisability to the local context of the adapted Innovative culture construct
by Dobni (2008)
o To derive practical implication for both the practitioner and researcher.
Page 20
16
1.6. SIGNIFICANCE OF THE STUDY
While researchers concur that cultural issues pose significant influence on creativity, subsequent
research emanating from this assertion tends to deviate to work environmental factors rather than
cultural dimensions. Tesluk, Farr and Klein (1997), Oldham and Cummings (1996), and Kotter and
Heskett (1992), lament that despite the significance of creativity and innovation to industries and the
economy as a whole, there remains a paucity of empirical studies on the relationship between
organisational culture construct and innovation and creativity. Deal and Spreitzer (1991) argue that
identification of the distinctive culture type and congruence is imperative if we are to change certain
values and revitalize a declining organisation. Researchers Dennison and Spreitzer (1991) emphasises
on the significance of managing, creating and changing organisational culture in accentuating overall
organisational effectiveness.
Thus this research seeks to contribute to the innovative culture construct and establish how
organisations can achieve external adaptation by leveraging a culture that supports creativity and
innovation. An integration of Schein’s (2002) and Cameron and Quinn, (1999) culture construct, Dobni
(2008) innovative culture concept and Mott (1972) organisational adaptation construct will be used to
come up with a framework to advance a theoretical recommendation on how the organisation’s can
achieve adaptation through innovation and creativity. Practical implications and recommendations will
be advanced on how the organisation can leverage its culture for creativity and innovation.
Page 21
17
1.7. DEFINITION OF TERMS
Creativity refers to the development of novel, appropriate and useful ideas (Amabile et al., 1996)
while
Innovation refers to the implementation or “transformation of a new idea into a new product or service,
or an improvement in organization or process” (Heye, 2006, p. 253). This includes new ways of
producing or delivering products or services.
Organisational Culture refers to patterns of basic assumptions that a given group has invented,
discovered or developed to cope with problems of internal integration and external adaptation that have
worked well enough to be considered valid (Schein, 1992, p. 6).
Organisational Adaptability refers to the capacity and flexibility to adopt strategies and practices that
continuously respond to changing markets and new competitive environments (Kotter &Hesket, 1992).
Page 22
18
CHAPTER 2
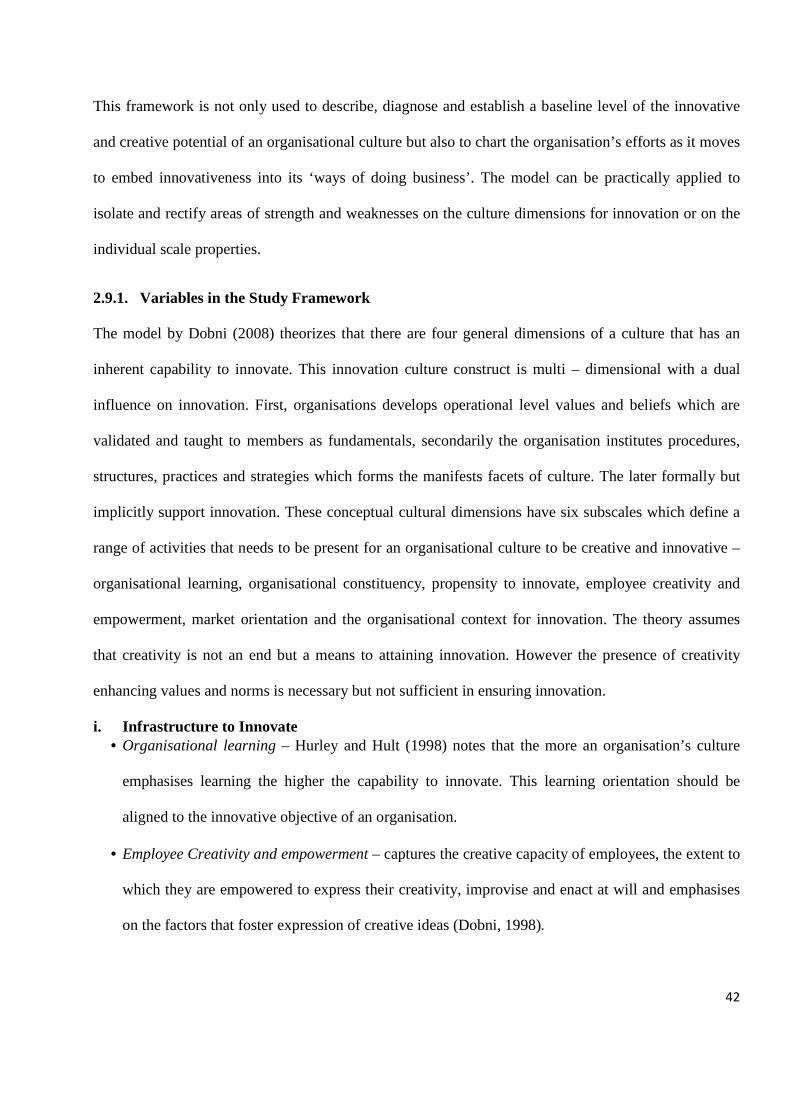
2. LITERATURE REVIEW The impact of organisational culture on innovation and creativity has been the subject of several
extensive critical reviews in the last two decades. Also organisational debate has shifted from the
question of whether organisations can adapt to a debate on how this adaptation and flexing happens.
Among issues of major concern in these reviews has been the lack of consensus in either of the
construct definitions. The purpose of this chapter is to review theoretical and conceptual issues
encountered in defining, studying and measuring organizational culture, innovation and creativity and
organisational adaptation. The subsequent review begins by exploring the historical landscape of the
creativity and innovation construct.
2.1. Historical Overview
2.1.1. Creativity and Nature
Although creativity and innovation have a very long history, systematic study within psychology began
at the turn of the 20th century with the seminal works of Schumpeter (1920) and Guilford’s (1950)
investigation of divergent thinking. Ryhammer and Brolin (1999) note that although earlier theorists
were influenced by more than one tradition i.e. cognitive or humanism; generally their studies were
mainly philosophical speculations than empirical investigations. In the mid 20th century creativity
research evolved to a focus on personality factors and the creative person’ drawn on methodological
aims that attempted to test, measure, determine characteristics and foster creativity through specific
teaching approaches. Implicit in this research vein was the assumption that creativity can be influenced
by nurture. Another branch of studies from the cognitive perspective conceptualised creativity as an
aspect of intelligence (Binet & Henri, 1896), creativity as a problem-solving capacity (Wallas, 1926)
and as an associative process (Spearman, 1931). The latter part of the 20th century was characterised by
the emergence of the Psychometric approach inspired by the work of Guilford (1967) which sought to
Page 23
19
design measures and developed the concept of divergent production. Later variations of Guilford’s
work by Torrance (1966, 1974) include the Torrance tests of creative thinking. Rhodes (1961)
conceptualised creativity as comprising of ‘place’, ‘product’, ‘process’ and the ‘creative person’.
Towards the close of the 20th Century the prevailing creativity theories came under intense criticism
with a concurrent challenge to tear creativity away from the aspects of intelligence. Earlier
conceptualizations have been criticised of their failure to distinguish intelligence from creativity, the
resultant creativity tests’ vulnerability to external factors and the assertion that they measure creativity
on request as opposed to creativity in day to day realities. However Bachelor and Michael (1997) and
Kirschenbaum (1998) have remained optimistic, contending that these tests are useful estimates of the
potential for creative thought.
Gardner (1999) posits that this paradigm contention is mostly about proprietary rights - who should
own the concept? He notes that to avoid epistemological problems it is necessary to separate the two
and not equate creativity with intelligence. Thus when we conflate creativity with intelligence and
further use the descriptor ‘creative’ solely to people who are innovative and whose innovations are
eventually accepted as useful, we end up in an epistemological twist. Intelligent people are neither
necessarily inclined towards novelty nor successful in innovations (Gardner, 1999). Although the
ability to innovate requires a certain degree of intelligence, there are no significant correlations between
measures of intelligence and of creativity. Creativity is not just a function of nature but also of nurture
and explains a greater variance in creativity.
2.1.2. Creativity and Nurture: the social context of creativity.
The creativity concept evolved at the close of the 20th century from a focus on the individual to
environmental determinants of individual and organisational creativity. Research focus turned to the
role ‘nurture’ in fostering creativity and the rising evidence that some social systems proved more
creative and innovative than others. In contrast to the seminal works, research broadened from just the
Page 24
20
cognitive and personality aspect of the ‘lone creative person’ studies to creative environments,
institutions and groups and a growing appreciation the role of social structures in fostering not just
individual creativity but team and organisations creativity (Kanter, 1988). Significant theories have
been advanced that conceptualizes creativity from a systems perspective (Cziksentmihalyi, 1998;
Sternberg, 1998 and Sternberg & Lubart, 1995), where the social and cognitive contexts are assuming
greater importance to creating useful novelties. Kotter and Heskett (1992), Kitchell (1995), Angel
(2006) and Dobni (2008) emphasized the importance of an innovative oriented culture in stimulating
creativity. Studies by Ekvall (1996), Amabile, (1988) and Isaksen (1995) emphasised the role of
organisational climate in stimulating creativity. These studies converged on major findings that a
creativity oriented culture fosters a work environmental climate that is supportive, risk tolerant, allows
for initiative and challenge in goals.
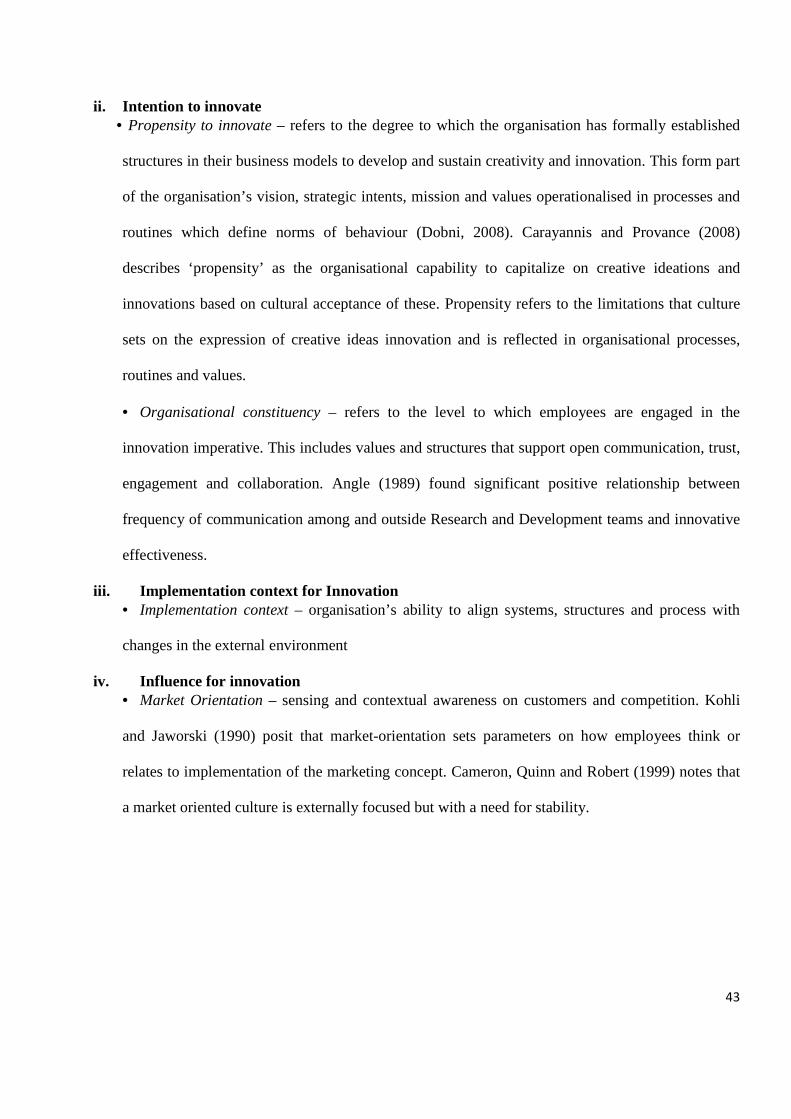
2.2. Theoretical Issues to the study of Creativity and Innovation
The Four P's of Creativity Although creativity theories have been presented in diverse comparative and categorical dimensions,
this paper will adopt Rhodes (1961) approach which emphasises the ‘four Ps’ of creativity - ‘process’,
‘product’, ‘person’ and ‘place/press’. Theories focusing on the creative process explain the mental
processes involved in creative thinking or activity. Process theories specify the stages of processing,
components of the creative thought and these processes can be linear or recursive. Key concept issues
of process theories are the verification and evaluation; insight and incubation; component mechanisms,
convergent and divergent thinking and meta-cognitive processes. The Stage or componential theories
(Amabile, 1999) and the cognitive theories (Guilford, 1968) are among the most influential of the
process theories.
Product theories are considered most objective of the creativity theories. These typically comprise of
psychometric theories of creativity (Guilford, 1968). The strength of these theories is their focus on
Page 25
21
measurement reliability and validity which are major issues of challenge in creativity research and thus
they inform and validate the other theories. However as prior mentioned; these tests only captures
creativity on demand not creativity as expressed in real life. Also these do not explain the process
involved in making of the product. The person or personality perspective of creativity has been the
focus of much earlier research. These focus on the traits and personalities of the creative individuals.
However the person perspective though foundational is inadequate in explaining the creativity theory.
A person is not creative or expresses their creativity because they have the ‘right’ personality for it
(Kozbelt, Beghetto, & Runco, 2008). However contextual features play a bigger role in influencing and
nurturing the expressive creativity capacities. Although creativity occurs at individual, team/group and
organisational level, this study is going to focus on the organisational level creativity. As a consequent
this research will focus mainly on the person – environment interaction ‘press’ aspect of creativity.
Componential Theory of Creativity
Amabile (1996) states that creativity and culture research emphasises on factors that enhance creativity.
The componential theory of Creativity describes characteristics of work environments that foster
creativity as management practices, sufficient resources and collaborative atmosphere. Insufficiency in
resources, limited autonomy and lack of motivation impede innovation and creativity. In addition to the
work environment, Amabile's (1983) componential theory of creativity identifies three intra psychic
characteristics that are necessary for creative output: intrinsic motivation, domain-relevant skills, and
creativity-relevant cognitive processes. Contextual factors such as leadership support, training and
management practices influence creativity output due to their influence on intrinsic motivation and
level of expertise. However Sternberg (2006) and Csikszentmihalyi (1999) argue that Amabile’s (1996)
model does not sufficiently address expressive creativity. Although environmental and intra-psychic
factors are important elements of creative output, however the decisions that creative actors make on
how and when to express their creativity has a large impact on creative output.
Page 26
22
Structural Approach: Kanter (1988) Kanter (1988) structural approach advances creativity enhancers and inhibitors. The theory explicates
cultural aspects that both hinder or support creativity. Kanter (1988) noted that creativity will most
likely occur in entrepreneur organisations with integrative structures; diversity, multiple internal and
external structural linkages, intersecting territories, collective pride, and those that encourage teamwork
and collaboration. In contrast cultures characterised by segmentalism— stifles employees to take
personal initiative in solving problems are an impediment to creativity and innovation. According to
Kanter (1988) there are ten factors that stifle creativity and innovation - control of action, decisions,
and limited information, hierarchies, and lack of supervisor support or encouragement.
System Theories
Csikszentmihalyi’s (1988a, 1999) theory places special emphasis on the place or environment facet of
creativity and explores the creative person vis. how other individuals such as co-workers contribute to
the creativity process. Rather than uphold the perspective that puts the ‘creative person’ as foci of
creativity, Csikszentmihalyi (1988a) reframes the pervasive creativity question of ‘what is creativity?’
to ‘where is creativity?’ Csikszentmihalyi (1999) advances that creativity emerges through three
interrelated components: (i) the domain made up of time specific body of knowledge in a specific
discipline; (ii) the creative individual and (iii) the field, comprising of experts in the domain, who
decides on which creative ideations are to be adopted as useful novelties. Thus creativity accepted
depends not just on the creative person or process but relies on other individuals or domain experts.
The strength of this perspective is its practicality in explaining how creativity is affected by significant
others, is collaborative than merely an intrapsychic process. The model can be used to come up with
hypothesis on how cultural restrictions influence creativity. Despite its conceptual breadth, and
although propositions generated from the model can be empirically tested, most render themselves to
qualitative study which introduces a lot of interpretive subjectivity and consequent biases. Kozbelt et al
(2008) posits that the systems theory is shakily grounded methodologically. However Csikszentmihalyi
Page 27
23
(1994) argues that most creativity theories are parochial and do not afford cumulative understanding of
a successful creative process. Creativity can only be beneficial to a system only when it moves from a
latent potential to expressive and when it is successfully accepted and exploited. Creativity focus
should expand as Csikszentmihalyi (1994) rightly posits from the individual creative person and
environments that foster their creativity to the system as a whole. This theory reinforces the view that
creativity does not and will not necessarily lead to innovation unless the whole system is considered.
Cognitive and problem solving theories
Mumford, Hester, and Robledo (2012) argue that creativity is a deliberate cognitive problem solving
activity employed to make sound decisions. This definition rules out the serendipity of creativity.
Creativity is not only about dealing with problems but can be born out of a need to continuously
explore opportunities presented or refining extant ideas. Similarly cognitive problem solving although
useful and appropriate can miss the novelty test. Solutions are considered creative to the extent that
they are novel (Duxbury, 2012).
2.3. Conceptual Issues in the Study of Creativity and Innovation
Research concurs that the overarching definition of creativity and innovation involves creation of
something new. Creativity and innovation are treated as overlapping constructs on the creative process
continuum with creativity considered as a precursor to the innovation process (Martins & Terblanche,
2003). The preceding is as far as the consensus goes. Hobday (2005) and Mahdi (2002) posits that
innovations and creativity research is fragmented and mostly poorly grounded in theory and fails to
consistently capture the innovation construct within and across paradigms. Rogers and Schneider
(1971) posits that development of an integrative theory of creativity and innovation has remained
elusive; consequently theoretical value of most extant research has been problematic. Extremely
alarming is the extensive variance among findings pointing to instability of research. Factors found
Page 28
24
significant in one study are less important in another, in other contexts inversely related and in others
not related to creativity and innovation at all.
Gardner (1982) noted that no firm knowledge of significant import exists within the field; therefore
new enquiries cannot be confidently built on existing information. Weisberg (1986) laments the paucity
of sound research of scientific significance stating that even the information at hand is mostly
misguided myths. This has led to scepticism in the concept of creativity with some declaring the field a
scientific disaster. Isaksen and Lauer (2002) argue that although results have not been significantly
cumulative the body of research is far from useless.
Isaksen (2002) argues that the challenge faced with creativity research is that the concept has been
driven mostly from an operational bottom – up perspective, whose priority is with development of
instruments to assess creativity than clarifying basic conceptual and theoretical issues. These criticisms
mainly arise from creativity tests that have been peddled on the market, mostly purporting to capture
that elusive, highly desired trait but lacks mostly on the psychometric plane. These have fallen into the
trap of earlier personality and intelligence tests. Further their lack of solid conceptual foundation has
led to some reticence among researchers on the use of these tests. The challenge with the study of
innovation and creativity is not a lack of definition since there is an interdisciplinary myriad of them
albeit a chaotic one. The issue is also not just the lack of a widely accepted structural framework among
extant models, but the use of methodologies whose generative and theory building capacity is suspect.
As a consequent creativity has remained a fuzzy concept. The question that still begs answer is on what
creativity really is? Thus top – down approaches are increasingly becoming important in order to
improve the theoretical basis of creativity. And picking from the myriad of divergent and diverse
definitions a more salient question would rather be ‘what is not creativity? However such conceptual
issues are beyond the scope of this paper. The extant research will however try to answer
Page 29
25
Csikszentmihalyi’s (1999) systems based question of ‘where is creativity? Brief definitional issues will
also be presented.
2.3.1. What is Creativity? Although different conceptualizations of creativity have been advanced, most converge on the finding
that creativity is best conceptualised as the generation of creative ideas that are novel, useful and
appropriate (Amabile, 1998). Despite the complexity of the creativity concept and definitional
challenges there remains among researchers consensus on some of the global characteristics. It seems
clear that creativity is related to the ideation of something new and with some value. There is also some
consensus that anyone can be creative to some extent. Creativity is best conceptualised as a
multifaceted phenomenon with a constellation of factors.
Sternberg (2006a) notes that there are five commonalities in the research of creativity. First, creativity
involves ideation of ideas or products that are comparatively novel and compelling (Sternberg 2006a,).
However the novelty criterion is also fuzzy. Conceptual issues arise with regards to the level or extent
of novelty required before something is considered novel enough to be genuinely creative. Amabile
(1999) clarifies the duality of the novelty criteria in that it can be applied to high task novelty situations
or to high solution novelty ones that requires modification of extant ideas. Weisberg (1988) argues that
originality is a necessary precondition for creativity but not sufficient. Therefore practical utility is the
necessary criterion to augment novelty. However usefulness may well only apply to ideas that have
been socially validated as such. A product introduced out of or ahead of time can fail to pass the
usefulness test. Duxbury (2012) posits that Apple’s iPhone was initially criticised as lacking novelty
however overtime the device has come to be considered as synonymous with the term creativity itself.
Thus Csikszentmihalyi’s (1999) posits that creativity is a domain-specific and subjective judgment of
the novelty and value of a creative outcome.
Page 30
26
Amabile (1998) added appropriateness as another criterion, however this implies convention: that is
anything considered deviant is unlikely to pass the test. Kaufman (1993) notes that social and
expressive ‘validity’ - the meaningfulness of an idea behind an innovation is a better criterion. Duxbury
(2012) posits that variables novelty, practical utility and appropriateness, value and validity are mostly
social constructions, which do not lend themselves to objective operationalisation, rigor and precision
needed in scientific enquiries. Generally creativity, originality, invention and innovation are used
interchangeably as if they are alternates of the same construct.
Duxbury (2012) notes numerous issues with the concept of creativity. He poses the following salient
questions which need to be resolved: i) who has a say on whether some outcome is considered creative?
Is it the domain expert, the consumers or the developers? ii) Can their value judgments be replicated
especially in different theoretical or cultural background?
2.3.2. What is Innovation? The term Innovation has become so generic due to its wide application and use in literature and in
practice. The term has been used to refer to any change in processes, systems and products,
interchanged with creativity. As such a consensual definition still eludes literature, with most
definitions varying from the general to the specific in relation to scope of analysis and theoretical
background. A seminal definition of innovation by Schumpeter (1920) emphasises differentiation and
novelty of outputs – products, processes, or business models. However conceptual debates still rage
concerning qualification and sufficiency of definitions, concept of intentionality and beneficence.
Crossan and Apaydin (2010) conceptualize innovation as the development, adoption, assimilation and
exploitation of value adding novelties. The strength of Crossan and Apaydin’s (2010) definition is its
appreciation of the duality of innovation as a process and an outcome by focusing on both the creative
process and adoption or application of novelties. Thus innovation is treated as relative than an absolute.
Van de Ven et al. (2007) recommends that innovation should rather be treated as a non – linear activity
Page 31
27
consisting of convergences and divergences in activities and that organisational culture is the thread
that holds everything together.
West and Farr (1990) define innovation as intentional exploitation and implementation of original
services, processes or products, designed intentional to significantly benefit the individual, organization
or society. However this definition is not adequate in describing innovation processes because most
innovations are incremental and cyclic. Also the innovating process should be separated from adoption
of innovated products or innovative process. Hamel (2006) advances a more broad definition referring
to innovation as a marked variation from traditional management processes and practices that
noticeably change the way business is conducted. The breadth of this definition is problematic since
any organisational change runs the risk of being lumped under the banner innovation. Although
innovation involves change especially its adoption, however not all change that invokes a departure
from traditional ways of doing things could be referred to as innovation.
Innovation as a process vis. innovation as an outcome
Innovation can be conceptualised in terms of a process rather than just an outcome. However Sood and
Tellis (2005) posit that this distinction is blurred. The innovation process normally precedes an
innovation outcome and seeks to answer the ‘how’ rather than the ‘what’ of innovation. Damanpour
and Aravind (2006), note that dimensions of innovation should be conceptualised in terms of its locus
and level of the innovation process. In contrast, Crossan and Apaydin (2010) argue that innovation
dimensions should comprise of the outcome perspective, whether the innovation is new to the
organisation or market and magnitude - whether the innovation is disruptive, incremental or radical
breakthroughs; nature and type of innovation. Damanpour and Aravind (2006) from their Meta –
analysis notes that determinants of the process and outcome dimensions are common suggesting that
the two are complimentary than distinct. However the two are cannot be equated since outcomes are
Page 32
28
largely tacit and articulate. Moreover Crossan and Apaydin’s (2010) note that innovation as a process
does not satisfy the concept of exploitation of an idea.
According to the OECD and Eurostat (2005) innovation can be classified in terms of i) process
improvements – technologies, efficiency improvements etc; ii) product improvement – development of
new radical design, packaging, qualitative incremental changes; iii) Market innovation – product
positioning, product placement and iv) organisational innovation which are the much ‘softer’, often
inarticulate forms of innovations, such as changes in business strategies, management techniques and
organizational structures (Hamel, 2006). Kirner, Som, Heidi, Gunter, & Zhou, (2008) note that
Organisational and process innovations can be understood primarily as distinct form of innovation,
secondarily as enablers of other types of innovation.
2.3.3. Creativity – Innovation Relationship Duxbury (2012) notes that the creativity construct has evolved from its intelligence origins and select
individual ability to one of primary performance drivers that leverage organisations to achieve
environmental adaptation. Although innovation is often an important outcome of organizational
creativity, scholars have been careful to distinguish between these two constructs. Creativity which is
the generation of novel, useful and appropriate ideas (Amabile, 1999) is an important precursor to
innovation which is the successful exploitation of those novel ideations, but does not necessarily result
in innovation. Ideas that are not accepted, pursued and successfully exploited remain just ideas.
Bledow, Frese, Anderson, Erez and Farr (2009), notes that the creativity and innovation process
contains ambiguities and conflicts arising from different sets of conflicting antecedents relating to
ideation or creativity which are creation–implementation and those relating to innovation
implementation - exploration–exploitation. However creation and implementation are mutually
dependent. Therefore optimizing conditions or work environmental factors that facilitates creativity
does not guarantee innovation. The process to innovate requires more than creativity. Bledow et al
Page 33
29
(2009) contends that optimizing on factors for creativity is most likely to concurrently results in
inhibition of innovation unless the organisation is ambidextrous. For instance XeroxParc is renowned
for its creativity in software design and connectivity however exploitation of these has been poor
compared to highly ambidextrous Apple and Microsoft which have successfully exploited and
capitalised on these creative ideations ( Bergin, 2006; Miller & Sternberg, 2006). Bledow et al (2009)
argues that creativity and innovation are mutually dependent processes. Creativity serves not only as an
input to the innovation outcome but is a prerequisite throughout the implementation process in case of
unforeseen problems and opportunities that vary from the initial conception.
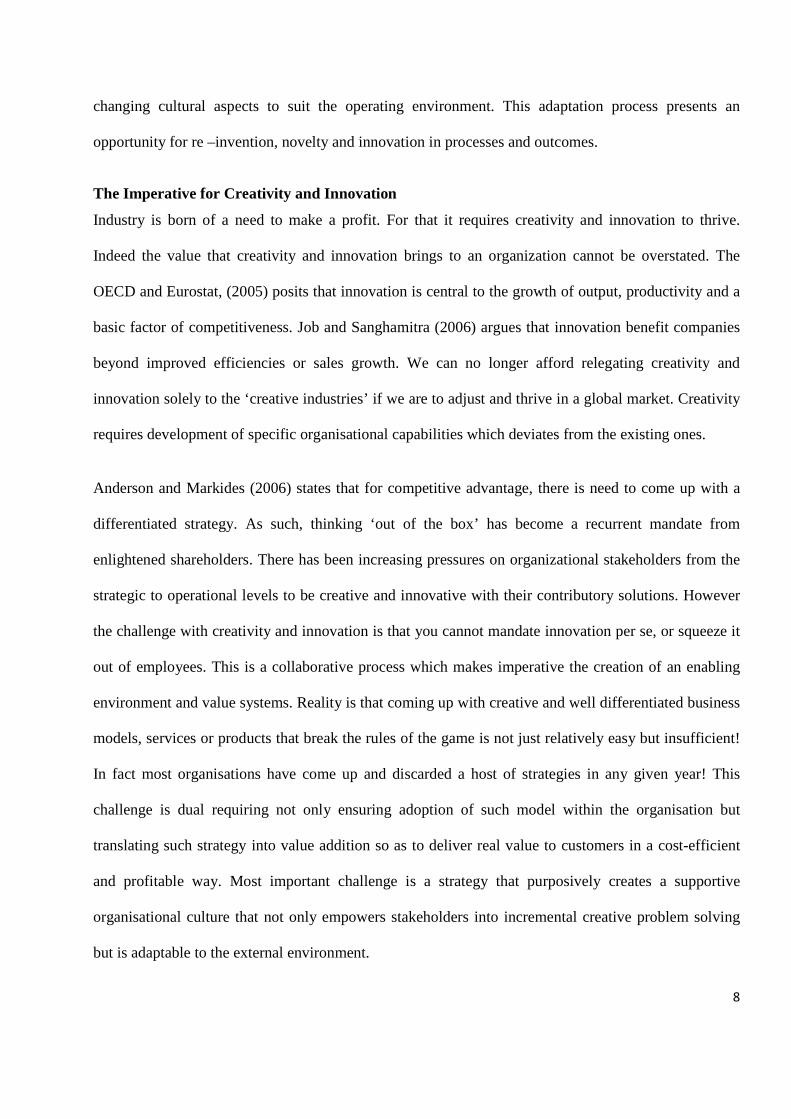
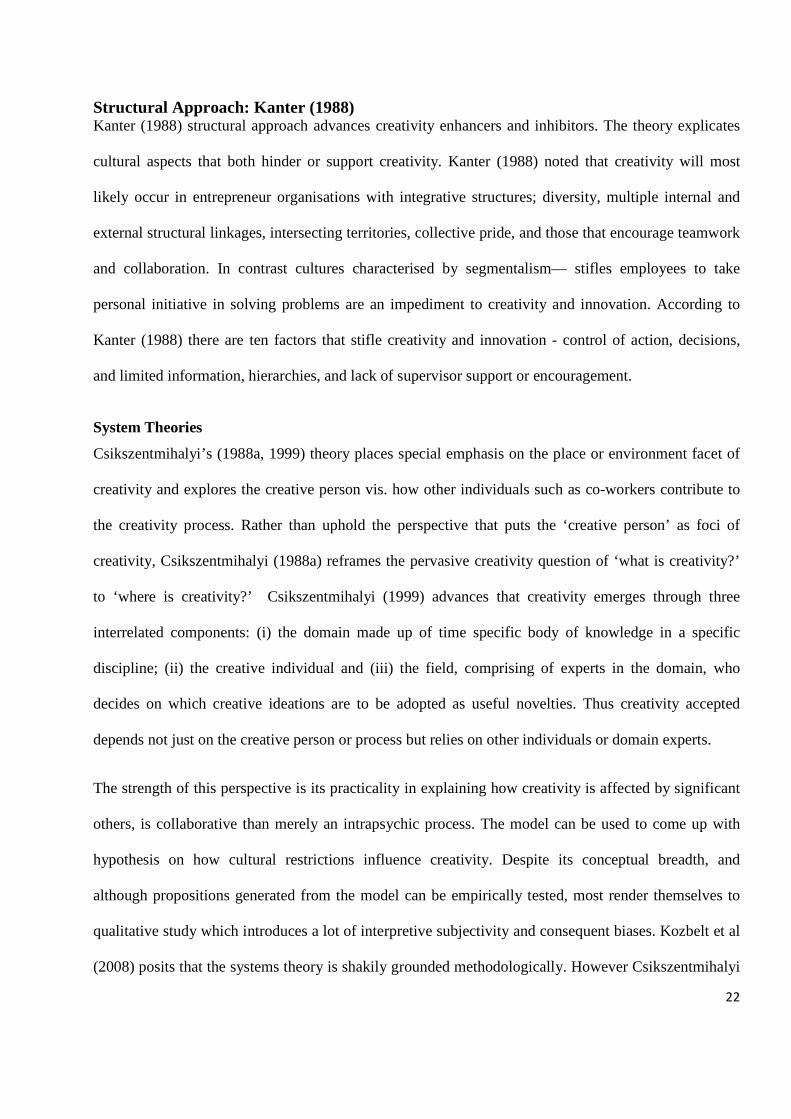
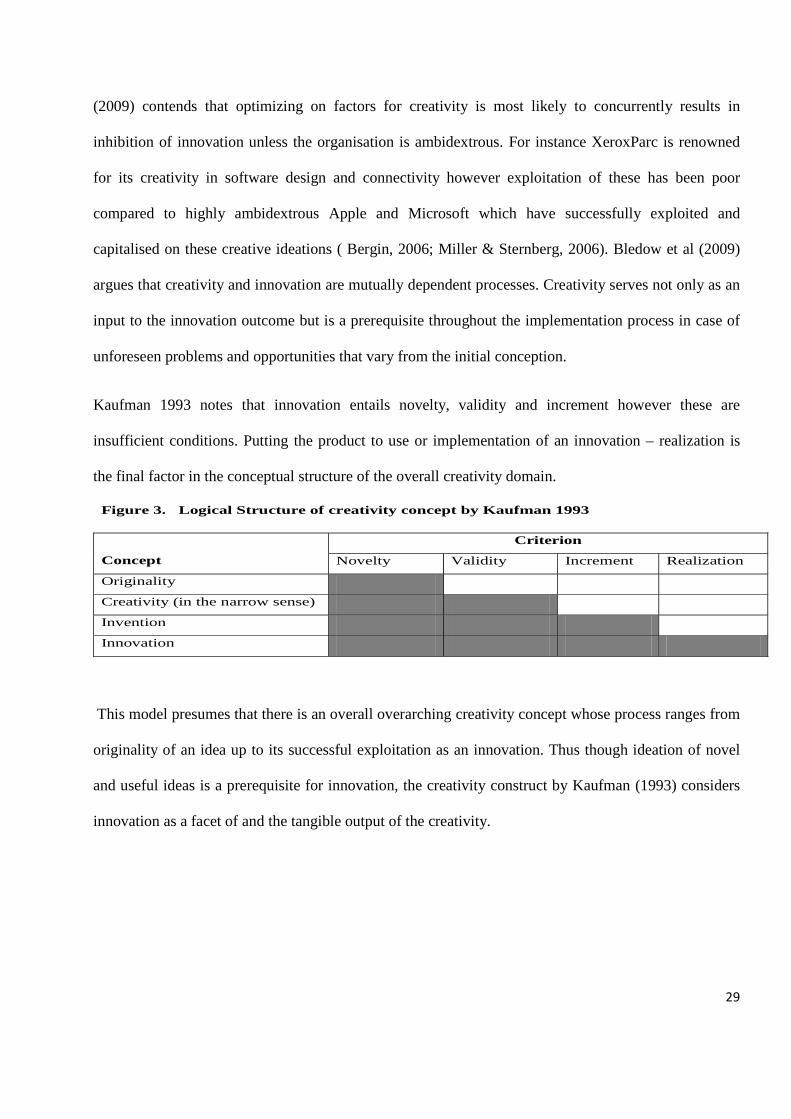
Kaufman 1993 notes that innovation entails novelty, validity and increment however these are
insufficient conditions. Putting the product to use or implementation of an innovation – realization is
the final factor in the conceptual structure of the overall creativity domain.
Figure 3. Logical Structure of creativity concept by Kaufman 1993
Concept
Criterion
Novelty Validity Increment Realization
Originality
Creativity (in the narrow sense)
Invention
Innovation
This model presumes that there is an overall overarching creativity concept whose process ranges from
originality of an idea up to its successful exploitation as an innovation. Thus though ideation of novel
and useful ideas is a prerequisite for innovation, the creativity construct by Kaufman (1993) considers
innovation as a facet of and the tangible output of the creativity.
Page 34
30
2.4. Methodological Issues in the study of Creativity and Innovation
The quandary with measuring creativity is mainly evident at team and organisational level. To this end
rather than measure the construct organisational creativity, researchers have resorted to assess the work
environment characteristics that are assumed to result in creativity. This can be typified by the works of
Ekvall, (1996) and Amabile et al (1996) KEYS: Assessing the Climate for Creativity instrument. The
major problem is that unlike innovation creativity is much ‘softer’ and intangible. However Hobday
(2005) and Mahdi (2005) argues that methodologies which measures the innovation and creativity
construct in linear terms, as the intensity of research and development activities, number of patents
registered or the degree of original products produced fails to explain variances in the innovation
process across and intra – sectors. Kanter (1988) adopted a qualitative, interpretive approach to
creativity. She utilised extensive qualitative in- depth case studies on organisational culture and
creativity.
Kirner, Som, Heidi, Gunter and Zhou, (2008), posits that unlike product innovations, process and
organisational innovations pose methodological challenges because of their complexity. They noted
that most methodological issues emanate from the fact that a consensual definition and theory base of
innovation has remained elusive due to the diversity of academic and theoratical paradigms the topic
has been studied from. Coupled with these, measurement issues on process based have remained a
thorny issue due to:
(i) Different life cycles of innovations i.e. process innovations usually have different and longer life
cycles, higher extent of implementations and are likely to be felt within the organisation after some
time than product and service innovations.
(ii) High complexity and the fact that innovation is no one concept but is on different aggregate levels
in respect to specific indicators. There is also no one super indicator to measure the innovation
outcomes due to its multi – dimensionality. There is also the risk of lumping any organisation
Page 35
31
change under the innovation banner. Khandawala, (1973) noted that innovation is much more than
efficiency improvements.Kirner (2008) recommends measurement of process innovations should
focus on either of the following:
o firm level outcomes such as improved quality, reduced costs, increased productivity and
flexibility or
o Employee level outcomes such as improved satisfaction, autonomy, perceptions on work
environment or increased motivation. Kirner et al (2008) notes that aims of different innovations
can be complimentary i.e. increased flexibility and task integration however in some instances
these can be conflicting i.e. standardization can increase quality and concurrently decrease
flexibility.
2.5. Conceptual Issues in the Study of Culture
Although organisational culture is a term often used in workplace discussions especially in relation
with change management, it is taken for granted that we understand its meaning and that we have a
unitary conception of it. Schein (1990) notes that, reviewing the concept of organisational culture
presents a quandary because currently there is little agreement on how it should be defined, how it
relates to psychological theories and its utility in organisational settings. Conceptual boundaries of
organisational culture are neither defined nor consensual. One of the likely reasons for this imprecision
and diversity of definitions is that culture draws from diverse social sciences i.e. functional sociological
perspective and cultural anthropology. Each culture researcher therefore approaches from and develops
explicit or implicit paradigms that bias not only the definitions of key concepts but the whole approach
to the study of the phenomenon.
Definitional Issues The rising interest in the "cultural" aspects of organizations resulted in a host of conceptual and
methodological problems for those who wish to study and manage organizational cultures. While
Page 36
32
models share some generic traits such as a definition, diagnostic or normative framework, theory of
change and a conceptual framework; there are however significant differences in methodology,
operational definitions of key concepts and strategies to manage culture.
Definitions of the concept range from O'Toole's (1979) conception of culture as "structure" to Wright's
(1977) view that culture is primarily embodied in an organization's "leadership style”, Others use the
term ’culture’ to embrace all that is human within the organization (Ott, 1989) . Although there are
considerable conceptual disagreements regarding nature and levels of culture, researchers however
concur that organisational culture can be adaptive or dysfunctional; provides meaning, direction, and
mobilization; is the social energy moving an organisation into allocation; derives from shared
commitments among group members; is the force that influences behaviour at every level in the
organization and that every organisation has a distinctive culture that can develop, change and must be
managed and controlled (Schein, 2002).
Levels of Debate and Culture Models
The various theories of organizational culture fall into two categories. First, that culture is something an
organization is (Smircich 1983; Morgan 1980; Wacker 1981; Schein 1986). Second, organizational
culture is treated as a variable: as something that an organization has, as a conceptually distinct
ideational system (Cummings & Schmidt 1972; Schwartz & Davis 1981; Deal & Kennedy 1983; Peters
& Waterman 1982). To researchers taking this functionalist conjecture that organisational culture is but
one aspect of the component parts of an organisation, which can be measured and changed (Peters &
Waterman 1982). Its prime function is to support management strategies and is premised on the
assumption that it can be reduced to relatively simple models of prediction and control and thus is ‘top
– down’. In this paradigm, organisational culture is primarily a set of values and beliefs articulated by
leaders to guide the organisation, transformed into appropriate norms for behaviour and reinforced
through rewards. Researchers who subscribe to the scientific rationalist paradigm tend to use survey
Page 37
33
instruments. These instruments bring to the surface factors which purport to be features of specific
cultures, but which are in reality quantitative summaries of individuals’ responses to questions about
how they might behave in a limited set of situations which the researcher predicts will be useful for
highlighting cultural differences. The researcher determines what concepts should be used to describe
the culture and then tests to see which of the concepts are accepted by the majority of respondents as
most relevant to a given culture.
Process oriented vs. Classification approaches
Process-oriented approaches conceptualises organizational culture as an invariable creation of shared
meaning. Typically represented by Schein’s (1992). Schein (1985) argues that if we are to take culture
seriously, we must adopt clinical and ethnographic approaches to identify dimensions and variables that
can usefully lend themselves to more precise empirical measurement. Schein (1991) adopts a
functionalistic normative conceptualization where he defines culture as comprising of three
fundamental levels - visible artifacts, espoused values and beliefs, and underlying core assumptions.
However investigating processes of culture at the latter level is most challenging, as they can only be
inferred but not be directly observed. It is challenging to measure a variable that is implicit, informal
and often invisible. Given such difficulties, challenges are posed in proving the consistent links
between culture and other organisational factors such as innovation, creativity and adaptation and even
in understanding how such a relationship operates.
Classifications therefore provide an alternative and more useful approach to the study of organizational
culture (Hampden-Turner, 1990). Harrison and Stokes (1972) classified organizational cultures using
the degree of formalization and centralization. Hofstede (1983) classified culture on four discrete
dimensions of culture arising from values that inferred from manifestations in alternatives of behaviour
- individualism versus collectivism, power-distance metric, uncertainty avoidance and the bias between
masculinity and femininity. While these classifications have the potential to provide a common
Page 38
34
framework for differentiating and comparing cultures, they do not go beyond the descriptive level to
analyse the processes involved in culture formation and change. Schein (1990) notes that Hofstede’s
(1980) restricted his definition solely to values yet culture extends from the physical and explicit to the
implicit. Lowe (1981) expresses that construct validity of this study is questionable since he inferred
values from attitude surveys alone. It is debatable whether something as abstract as culture can be
measured adequately with survey instruments at all.
A major dispute concerns Deal and Kennedy, (1982) conceptualizing of culture as a set of principles to
guide good management practice. They advanced four general corporate culture types based on degree
of risk and speed of feedback dimensions characteristic of a given industry. Schein (1990) notes their
failure to distinct culture from common behavioural patterns and corporate values has rendered
confusion to the concept of culture change with behavioural change. As a consequence most change
drive focus are on behavioural than value change. Bouno and Lowditch (2003) noted that culture is
multifaceted and multiplicity of cultures usually exists in an industry and organisation. For instance the
merger between two oil companies Gulf Corporation and Chevron Corporation in 1984 was initially
assumed to be a perfect culture blend since they were in the same industry in line with Deal and
Kennedy’s theory. However on merging divergent cultures became evident, the two companies
approached same business from different styles and strategies, different philosophies, resulting in
anxieties and resistances and an unanticipated culture resistance.
The Competing Values Framework
Cameron and Quinn (1999) proposed a classification comprising of four cultural types that have been
widely adopted in culture audits and comparisons. These are the Clan, Adhocracy, Hierarchy and
Market culture types. The Clan culture emphasises human relations, flexible operations while the
Hierarchical culture focuses stability, formal procedures and is risk averse. However the Adhocracy is
more externally oriented, flexible and more likely to be innovative and to value creativity. A market
Page 39
35
Culture is typically market oriented, values competiveness and results and externally oriented but
biased towards stability and control. These descriptors are similar to Handy’s (1978) forms of power,
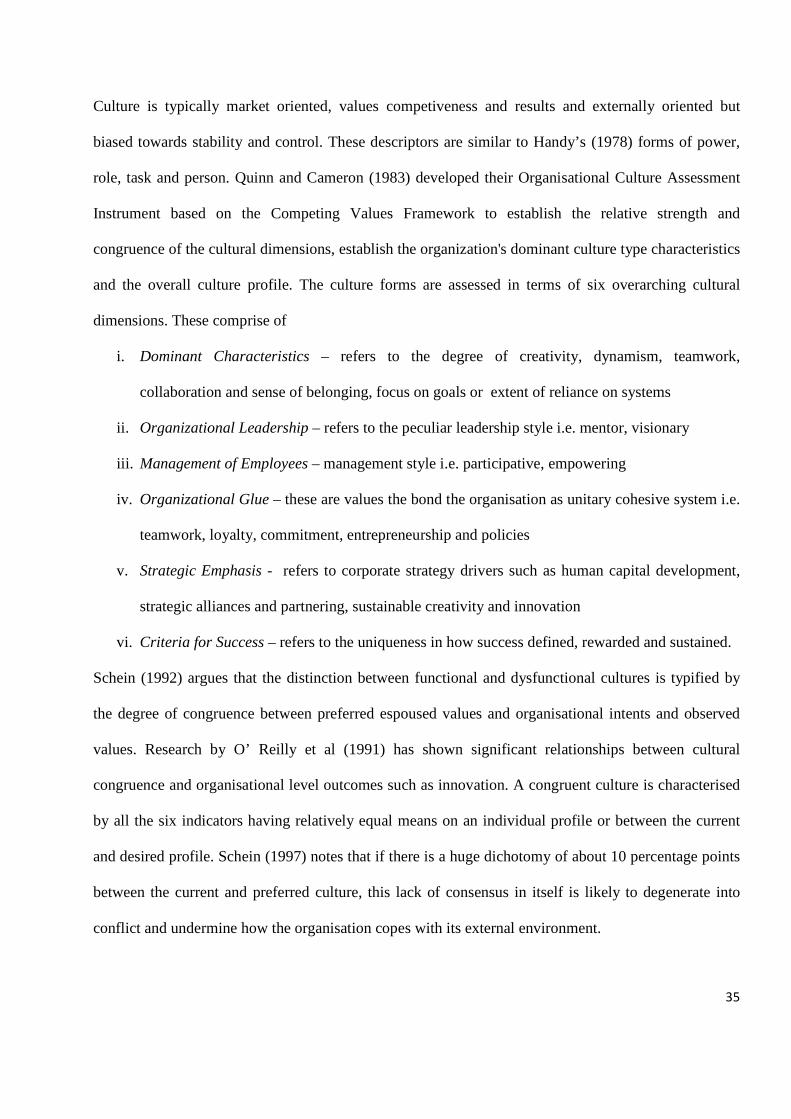
role, task and person. Quinn and Cameron (1983) developed their Organisational Culture Assessment
Instrument based on the Competing Values Framework to establish the relative strength and
congruence of the cultural dimensions, establish the organization's dominant culture type characteristics
and the overall culture profile. The culture forms are assessed in terms of six overarching cultural
dimensions. These comprise of
i. Dominant Characteristics – refers to the degree of creativity, dynamism, teamwork,
collaboration and sense of belonging, focus on goals or extent of reliance on systems
ii. Organizational Leadership – refers to the peculiar leadership style i.e. mentor, visionary
iii. Management of Employees – management style i.e. participative, empowering
iv. Organizational Glue – these are values the bond the organisation as unitary cohesive system i.e.
teamwork, loyalty, commitment, entrepreneurship and policies
v. Strategic Emphasis - refers to corporate strategy drivers such as human capital development,
strategic alliances and partnering, sustainable creativity and innovation
vi. Criteria for Success – refers to the uniqueness in how success defined, rewarded and sustained.
Schein (1992) argues that the distinction between functional and dysfunctional cultures is typified by
the degree of congruence between preferred espoused values and organisational intents and observed
values. Research by O’ Reilly et al (1991) has shown significant relationships between cultural
congruence and organisational level outcomes such as innovation. A congruent culture is characterised
by all the six indicators having relatively equal means on an individual profile or between the current
and desired profile. Schein (1997) notes that if there is a huge dichotomy of about 10 percentage points
between the current and preferred culture, this lack of consensus in itself is likely to degenerate into
conflict and undermine how the organisation copes with its external environment.
Page 40
36
2.6. Methodological Issues to the study of Organisational Culture
The classification approaches utilize quantitative methods for measuring the culture of organizations.
Ott (1989) notes that questionnaire approaches to uncovering culture fails to identify fundamental
assumptions, while serving to orient organizational stakeholders to view their organization along
dimensions suggested in the questionnaires. This possibly confounds the results. The strength of
quantitative methods lies in their level objectivity. Sackman (1991) argues that the study of culture has
graduated from merely anthropological focus to comparative analyses and testable propositions.
Those taking a cognitive and phenomenological approach to culture i.e. Kanter (1988) contend that
quantitative studies miss the basics of culture studies which is to understand the meaning of the social
system from the perspective of an individual member. The qualitative approach has inherent problems
that make it difficult to apply to studies. Ethnographic studies are unable to answer comparative
questions such as those concerning relationship between organisational culture and performance or
effectiveness. They also render a loophole in researcher and measurement objectivity and are rarely
generalizable to other organisations (Cameron & Quinn, 1999). However these differences are not
irreconcilable, for options for culture research may be selected depending on the nature of the problem,
goal of the researcher and any researcher can select an integrative or singular method as such.
The problem with some studies of organizational culture is that they appear to presume that there exists
in a real and tangible sense a collective organizational culture that can be created, measured with
precision or manipulated to enhance organizational effectiveness. However organisational culture is
still considered to be one of the most important areas of empirical research in organisational studies. It
must be kept in mind, though, that culture is an abstraction, and has use only in relation to the
interpretation of observed concrete behavior.
Page 41
37
2.7. Conceptual Issues in the Study of Organisational Adaptation
Berkhout, Hertin and Gann, (2006) notes that debate has spanned decades concerning the organisational
adaptation. One research paradigm positing that organsations are inertial and therefore unable to
transform significantly and another perspective arguing that organisations are flexible and adaptable
therefore can evolve and transform to suit their circumstances. However recently debate has moved
from the question of whether organisations are flexible and adaptable to how and when this adaptation
occurs (Gersick, 1994). While focus has been on large structural changes that organisations undergo to
realign to evolving environments recent thinking is that adaptation also occur in small frequent and
incremental changes in how firms compete.
Substantial literature has been developed on organisational adaptation and related concepts such as
flexibility, effectiveness, vulnerability and adaptive capacities (Mott, 1972; Schneider et al., 2000;
Scheine, 1988). However progress towards an integrative theory of organisational adaptation has been
erratic and slow. The concept has drawn from taxonomies borrowed from other disciplines including
ecology and biology. Drawing on theory of organisational learning, Nelson and Winter (1982) argued
that the process of adaptation involves changes to organisational routines which come to be challenged
and adjusted in the process of learning. (Nelson and Winter, 1982). Studying the innovative capacities
of organisational cultures with a view to their applicability in understanding organisational adaptation
will go a long way to anticipate how organisations react to either sudden or gradual changes to their
environments.
Business organisations face a number of obstacles in learning how to adapt to a globalised economy
especially in relation to the ambiguity of signals from the external environment. Berkout, Hertin and
Gann (2006) note organisations seldom innovate autonomously. The pressure to innovate is influenced
by other external factors such as policy changes and market conditions. To survive the organisations
tend to adjust to this stresses in a process referred to as adaptation. However the adaptive capacities of
Page 42
38
any organisation are limited by deeply rooted beliefs and norms that set parameters as to which
behaviors organisational players can express in the face of challenges. Collectively the organisation’s
responses that have evolved through process of learning to deal with problems of external adaptation
can either result in a ‘flight’ or ‘fight’ response.
Learning in Organisations as a dynamic capability Morgan (1986) posits that the theory of organisational learning is premised on the assumption that a
system must be able to discern the environment, evaluate rules guiding behaviour, identify variations,
and respond by correcting the discrepancy. Theories of organisational learning focus on understanding
how organisations learn from experiences and on how they develop conceptual frameworks for
interpreting that and dealing with those experience in the future (Levitt and March, 1988). However
cultures are relatively stable and transforms slowly, which may not work if rapid adaptation is required.
The familiar response however has been to close up operations or change the business – flight!
However it is imperative that firms adjust to the globalised economy and build innovative cultures that
ensure success.
Innovation as a dynamic capability
Although all organisations can possess dynamic capabilities, investment into these is relative to the
perceived benefits, costs and risk perceived as arising from them. March (1991) notes that organisations
in less stable environments explore and discover new routines while those operating in stable contexts
are assumed to focus on improvement of operating routines and efficiency gains or in extreme cases are
inertial. However this finding is not the rule as some organisation operating in less stable environments
are most likely to be risk averse, and invest mostly in the safer efficiency improvements (Khandawala,
1973).
Page 43
39
2.8. Organisational Culture, Innovation & Creativity and Organisational Adaptation
The culture of the organisation and the way the organisation is structured to exploit resources
determines its success or failure. Morgan (1986) suggests that innovation and creativity must be
understood mostly as processes than outcomes as means to successful competitive survival or
organisational excellence. Thus an organisation focusing on innovation for innovation’s sake – as an
outcome is therefore unlikely to adapt. According to Schein (1998), culture involves integration of
expected norms for behaviour and shared assumptions that distinguish how groups cope with its
external contexts and integrates its internal environments. These cultural patterns for adaptation
describe a coping cycle that a system maintains relative to its environment. Morgan (1986) argues that
the following comprise fundamental elements of an adaptive organisation:
• Shared concept of purpose for existence and identity - ‘ultimate survival problem’.
• Consensus on ways to achieve the mission and organisational goals, resource allocation,
organisational structure, boundary issues and rules that govern relationships.
• Consensus on measures for the outcome of its activities set boundaries on behaviors.
• Strategies and structures that allow the group to adjust and change in response to variations from
stated goals. These corrective strategies expose assumptions about mission, identity and the
internal functioning of organisations.
Berkhout et al (2006) notes that adaptation require chains of adjustments and innovation. Innovation as
an adaptation mechanism occurs in three planes: i) as a response to cope with current internal or
external circumstances i.e. decreasing efficiencies, increasing competition or regressing market shares;
ii) as a response to predicted events, positioning the organisation to optimize on or protect the firm
from anticipated opportunities or challenges i.e. anticipated market trends; iii) Set a pace, break new
grounds and pioneer a concept, product or process.
Page 44
40
2.9. Theoretical Framework
The model for the present study is premised on the hypothesized link presumed to exist between
organisational culture, creativity and innovation and organizational adaptation. Basing on literature
findings, a framework has been proposed and hypotheses advanced for testing through empirical data.
The model evolves from three fields of organisational enquiry: organisation culture studies,
organisational creativity and innovation and organisational adaptation studies.
While cultural issues have been indicated as significantly related to creativity and innovation,
subsequent research has focused mostly on climatic and work environmental factors ( Oldham &
Cummings (1996) than on cultural dimensions except for a few (Dobni, 2008; Kitchell, 2004 and
Martins & Terblanche, 2003). Even cultural models assumed to affect innovation and creativity treads a
very fine line between organisational climate and culture, and consequently uses climatic measures to
assess the culture – innovation link, which blurs the boundaries between two conceptually different
constructs.
It is imperative to make a distinction between two concepts because this will determine variables
incorporated in the theoretical framework and subsequent research methodology. More specifically
questions arise on whether there is an absolute distinct conceptual boundary between the two concepts?
Whether you successfully quantify the culture and creativity relationship without using organisational
climate? However such debate on what Dennison (1996) has terms ‘paradigm wars’ is beyond the
scope of this project. Martin (2002) posits that culture refers to deeply and largely implicit beliefs,
values, assumptions and meanings. Borrowing Schein’s (1992) iceberg metaphor, culture is what
remains under the surface mostly. In contrast organisational climate refers to perceptions and
manifestation of practices and patterns of behaviour.
Page 45
41
The Research Theoretical Framework
The expanded research model assumes a relationship between organisational culture and innovation
and organisational adaptability. The framework guiding this study was adapted from Dobni’s (2008)
conceptualization of an innovative culture construct and integrates research on organisational culture
and organisational adaptation.
The model is premised on the assumption that an adaptable organisation is better placed to survive in a
fluid and highly competitive environment (Mott, 1972). Hurley and Hult (1998) posits that cultural
innovativeness and the innovative and creativity capacity of an organisation are the primary means with
which organisations develop the capability to adapt to their environments. The process of creating and
adopting novel ways of how the business is done transforms organisations to suit their environments.
Intention to Innovate, Infrastructure to innovate, Influence for innovation and Implementation context
are hypothesized as antecedents to an innovative culture and innovation and creativity capacity. The
strength of this model is its focus on intra – organisational factors; conceptual dimensions assumed to
foster innovation and creativity and its specification of distinct factorial scales directly linking culture
to innovation and creativity. The expanded theoretical framework is presented below (figure 4)
Figure 4. Theoretical Framework
Dominant Chacteristics
Strategic emphasis
Organisational glue
Leadership style
Managerial Practices
Criteria of Success
Competing values dimensions supposed to influence Org culture:
1. Infrastructure to innovate
2. Intention to Innovate
3. Implementation Context for Innovation
4. Influence for Innovation
Creativity & innovation culture Dimensions
Creativity and
Innovation
Organisational Adaptability
Scales for assessing innovation and creativity culture
1a. Organisational Learning 1b. Creativity and empowerment
2a. Innovation Propensity
2b.Organisational Constituency
3a. Organisational context
4a. Market orientation
Competitive Advantage/ Organisational survival/ excellence
Unexplored relationships in this study
Organisational culture Innovation culture
Page 46
42
This framework is not only used to describe, diagnose and establish a baseline level of the innovative
and creative potential of an organisational culture but also to chart the organisation’s efforts as it moves
to embed innovativeness into its ‘ways of doing business’. The model can be practically applied to
isolate and rectify areas of strength and weaknesses on the culture dimensions for innovation or on the
individual scale properties.
2.9.1. Variables in the Study Framework
The model by Dobni (2008) theorizes that there are four general dimensions of a culture that has an
inherent capability to innovate. This innovation culture construct is multi – dimensional with a dual
influence on innovation. First, organisations develops operational level values and beliefs which are
validated and taught to members as fundamentals, secondarily the organisation institutes procedures,
structures, practices and strategies which forms the manifests facets of culture. The later formally but
implicitly support innovation. These conceptual cultural dimensions have six subscales which define a
range of activities that needs to be present for an organisational culture to be creative and innovative –
organisational learning, organisational constituency, propensity to innovate, employee creativity and
empowerment, market orientation and the organisational context for innovation. The theory assumes
that creativity is not an end but a means to attaining innovation. However the presence of creativity
enhancing values and norms is necessary but not sufficient in ensuring innovation.
i. Infrastructure to Innovate • Organisational learning – Hurley and Hult (1998) notes that the more an organisation’s culture
emphasises learning the higher the capability to innovate. This learning orientation should be
aligned to the innovative objective of an organisation.
• Employee Creativity and empowerment – captures the creative capacity of employees, the extent to
which they are empowered to express their creativity, improvise and enact at will and emphasises
on the factors that foster expression of creative ideas (Dobni, 1998).
Page 47
43
ii. Intention to innovate • Propensity to innovate – refers to the degree to which the organisation has formally established
structures in their business models to develop and sustain creativity and innovation. This form part
of the organisation’s vision, strategic intents, mission and values operationalised in processes and
routines which define norms of behaviour (Dobni, 2008). Carayannis and Provance (2008)
describes ‘propensity’ as the organisational capability to capitalize on creative ideations and
innovations based on cultural acceptance of these. Propensity refers to the limitations that culture
sets on the expression of creative ideas innovation and is reflected in organisational processes,
routines and values.
• Organisational constituency – refers to the level to which employees are engaged in the
innovation imperative. This includes values and structures that support open communication, trust,
engagement and collaboration. Angle (1989) found significant positive relationship between
frequency of communication among and outside Research and Development teams and innovative
effectiveness.
iii. Implementation context for Innovation • Implementation context – organisation’s ability to align systems, structures and process with
changes in the external environment
iv. Influence for innovation • Market Orientation – sensing and contextual awareness on customers and competition. Kohli
and Jaworski (1990) posit that market-orientation sets parameters on how employees think or
relates to implementation of the marketing concept. Cameron, Quinn and Robert (1999) notes that
a market oriented culture is externally focused but with a need for stability.
Page 48
44
2.10. Research Hypotheses
The primary aim of the research is to assess the index of relationship between organisational culture,
creativity and innovation and organisational adaptability. Thus there are four hypotheses:
H1: Innovation culture is significantly related to Creativity and innovation.
H2: Creativity and innovation is significantly and positively related to Organizational adaptability.
H3: Creativity and Innovation is significantly and positively related to and the OCAI culture types.
H4: Innovation and creativity mediates/ moderates the relationship between organisational culture
and organisational adaptability.
H5: Organisational culture, Innovation culture, Creativity and Innovation and Organisation
Adaptation are significantly related.
Page 49
45
CHAPTER 3
3. METHODOLOGY
3.1. Research Design
This study is a cross –sectional survey of Art Corporation employees. This quantitative survey design is
suitable for the descriptive and predictive purpose of correlation research, which entails examination of
relationships between variables. The study utilized two samples with one acting as a pilot study to
assess scale reliability for the particular population under study and assess if the scales can be adopted
or adapted to suit. Ethics approval for this research was obtained from the Human Resources
Department Committee prior to the collection of data (see Appendix 2).
Pilot study
A pilot study was conducted prior to the main study, to ensure that the survey tools developed for use in
the research were suitable in their content and length and that the respondents were interpreting the
survey questions in the manner intended. Pilot studies are conducted to detect weaknesses in design and
instrumentation and provide proxy data for a selection of a probability sample (Cooper and Schindler,
1998). As a result, a number of amendments to the survey were made. Specifically, the 136 item scale
was reduced to a 96 item scale due to innovative scale items which were not loading significantly after
factor analysis.
3.2. Sample
A proportionate stratified random sampling was used targeting on a population of (N = 351) of the ART
Corporation Employees. Participants were divided into homogeneous subgroups according to
Occupation and gender, a simple random sample was then taken from each strata. Sampling fractions
were used to come up with a proportionate sample. Because the groups are more homogeneous than
across the population we can expect greater statistical precision, less variance and quotas assures us of
adequate representation of both the overall population and key subgroups of the population. This
Page 50
46
technique is selected since the research seeks to conduct a cross section of all employees. A total of 76
participants a response rate of 25.33% was achieved.
Table 1. Descriptive for the study sample.
Demography item Category Frequency Percent %
Gender Male
Female
50
26
65.80
34.20
Level of Education O' Levels
A’ Levels
Diploma
Degree
Post graduate
26
19
10
13
8
34.20
13.20
25.00
17.10
10.50
Tenure below 3 years
3 - 5
6 - 10
10 - 20
20 plus
26
12
7
8
23
34.20
15.80
9.20
10.50
30.30
Age Below 25
25 - 35
36 - 45
45 - 50
50 plus
4
36
11
17
8
5.30
47.40
14.50
22.40
10.50
Occupation Admin
Marketing
Finance
Production
HR
Engineering
4
23
9
19
8
13
5.30
30.30
11.80
25.00
10.50
17.10
Grade Management
Supervisory
Skilled professional
Shop floor
9
15
24
28
11.80
19.70
31.60
36.80
A breakdown of the demographic data in table 1 revealed a composite of 50 (65.80%) men and 26
(34.20%) women. The majority of employees are fairly young ranging between 25 - 35 years (47.40%).
Tenure ranged from < 1 to 20 plus years with the highest percentage with tenure below 3 years 26
(34.2%) and those in the 20plus years 23 (30.3%). The highest percentage level of education comprise
of those with just O’ Levels 28(36.8%). The Job Grade with highest frequency was Shop floor
Page 51
47
(unskilled) employees with 28(36.80%), followed by skilled professionals at 24 (31.60%).
Occupational classes with high response were Production 19(25%), Marketing 23 (30.30%).
3.3. Survey Instruments
Data collection was via paper surveys. A recruitment letter was emailed to Eversharp, Softex and
National Waste division employees inviting them to participate in the study, informing them of who the
researcher is, a brief overview of the goals and purpose of the study and details regarding
confidentiality. Questionnaires were then distributed to respective HR Departments so that they could
randomly distribute to a stratified cross section of employees in all departments.
Data was presented in a single paper and pencil questionnaire containing 96 questions which made it
imperative to reformat to enable the three categories to be rated on the same scale - five point Likert
scales ranging from “strongly disagree” (1) to “strongly agree” (5).
The survey comprises five sections:
• Demographic information: Demographic data was included as control variable to rule out the
explanations for significant relationships. Data included tenure, age, gender, occupation and grade
• Organisational Culture Assessment Instrument (OCAI): The competing values framework, by
Cameron and Quinn (1999) was used in constructing the organisation’s culture profile and establish
the dominant cultural types through the use of the OCAI. The OCAI method measures the extent to
which one of the four culture types (Clan, Adhocracy, Market and Hierarchy) dominates the present
organizational or culture. Respondents assess the culture based on a mix of six culture dimensions –
dominant characteristics, organisational glue, criteria for success, management of employees,
leadership to come up with a dominant culture type. In this study the 25 item scale had an alpha of
0.75.
Page 52
48
• Innovative Culture Index: An adapted and shortened version of Dobni’s (2008) 43-item survey of
the innovative culture construct was used. The Innovative culture Index is a relatively newer
construct, which necessitates going beyond just reliability to more specific psychometric properties.
Validation of the innovative culture construct by Dobni (2008) demonstrated significant construct
validity. The analysis showed significance correlations exceeding ≥0.70, p = 0.001 among the four
dimensions which all converged on a singular construct. Data supports the theory of four general
dimensions of an innovative culture: (i) the intention to be innovative; (ii) the infrastructure to
support innovation initiatives; (iii) influence, or the knowledge and orientation of employees
necessary to support innovation and (iv) an environment or context to support implementation of
innovation. Dobni (2008) reports that an alpha of 0.81 was achieved after running a single factor
exploratory factor analysis. Overall the index has moderate to higher reliability with an internal
consistency reliability of 0.83 and retest correlation falling within 0.72 – 0.90. In this study the 43
item scale had and overall reliability of alpha = 0.85
• Creativity and Innovativeness Index: The organisational innovativeness scale assesses
innovativeness on five dimensions: product, process, market and organisational innovation (Wang
& Ahmed, 2004). The creativity subscale adapted from Goodman’s Organizational Creativity Audit
(1995) was added onto the scale. The 18 item questionnaire had an overall reliability alpha = 0.83
• Organisational Adaptability Scale: The Mott (1972) organisational effectiveness questionnaire
has three subscales (productivity, adaptability, and flexibility) and a summative overall
effectiveness scale. For this study only the adaptability scale was adopted. Adaptability includes
both symbolic adaptation and behavioural adaptation. Mott (1972) defines symbolic adaptation as
both anticipation and proactively designing solutions to cope with the problems for rapid adaptation
to environmental changes. Behavioural adaptation is prompt acceptance of solutions. In this study
the 4 item Adaptation subscale had good reliability: alpha = 0.894.
Page 53
49
Data Analysis
Data analysis involved both descriptive and inferential statistics. Descriptive statistics were used to
summerise the data set in means and standard deviations relating to the levels of creativity and
innovation, innovative culture, organisational adaptability and to answer research questions.
According to Sekaran (2000), inferential statistics allow for inferences to be made on the relationship
between two variables. The following inferential statistical methods were used to test the research
hypotheses.
Correlation Analysis:
The Pearson Product Moment Correlation Coefficient was used to specify the relationships between the
variables organisational culture, creativity and innovation, innovative culture and organisational
adaptability. In terms of statistical significance, it was decided to set the value at a 95% confidence
interval level (p<0.05).
Regression Analysis: Based on the results of the correlation analyses, hierarchical regression analyses
were performed to determine the predictive and index of relationship between creativity and
innovation, innovative culture dimensions and organisational adaptability.
3.4. Data Analysis
An overview of results obtained in the study are presented and discussed. Data is presented thereafter at
alpha levels of 0.01 and 0.05.
3.4.1. Descriptive statistics
Table 2 overleaf presents descriptive statistics in the form of means and standard deviations for the
Organisational Culture (OC), Innovative Culture (IC), Innovation and Creativity Index (I&C Index) and
the Organisational Adaptation (OA).
Page 54
50
Table 2. Descriptive Statistics for OC, IC, I&C Index and OA
Item Variable Mean Standard Deviation
i. Culture Profile for ART Clan Culture Adhocracy Market Culture Hierarchical culture
3.00 2.83 3.55 3.65
.54
.51
.56
.43
Culture Congruence Mix for ART Corporation Dominant Characteristics Leadership Style Management Style Organisation Glue Strategic Emphasis Criteria of Success
2.91 3.24 2.99 3.10 3.81 3.49
.59
.61
.62
.59
.69
.55
ii. Innovativeness of the ART Culture Innovation Culture 3.48 .47
iii. Index of ART Innovation and Creativity Creativity and Innovation 3.18 .61 iv. Level of Adaptability for ART Organisational Adaptation 2.50 .92
Table 2 shows that the dominant culture type at ART Corporation is the Hierarchy culture: structure,
procedures, efficiency and predictability (mean = 3.64. sd 0.43), while the Adhocracy (mean = 2.83. sd
0.51) is the least characteristic. Thus the current culture mix mainly emphasises efficiencies,
procedures, smooth functioning and market shares over flexibility, external orientation and growth
focus. Similarly for cultural congruence there is need to focus on dimensions Dominant characteristics:
Management style (mean= 2.99 sd. 0.62) and Dominant Characteristics (mean= 2.91 sd. 0.59).
The data on Item ii) of Table 2 shows that the current organisational culture has an average Innovation
culture (mean = 3.48; sd .47).
Item iii) of Table 2 shows that ART Corporation has an average innovation and creativity index with a
mean of 3.18 sd .61. A mean score of 4 and above represents high levels of innovation and creativity
while scores between 2.5 to 3.5 points to ambivalence. Similarly an average score of 3.18 sd. 0.61
points to an average innovation and creativity index. This shows that ART Corporation still need to
work on their innovation and creativity.
The data, item iv) shows that that ART Corporation has generally low organisational adaptation (mean
= 2.50: sd 0.92).
Page 55
51
Preferred Culture
Table 3 shows that 54.70% of respondents preferred the Adhocracy culture followed by the Clan
culture type (26.6%) while only 3.10% preferred the Hierarchy culture. However the current culture
mix shows that the adhocracy (mean = 2.84 sd .51) is the least characteristic. This discrepancy yields
important information with regards to any change effort and direction especially in relation to the
current ART strategic imperative.
3.4.2. Inferential Statistics
Table 4 contains the Pearson correlations for the relationship between Organisational Culture (OC),
Innovation culture (IC), Innovation and Creativity (C&I) and Organisational Adaptability (OA).
Table 4. Pearson Correlations for OC, ICul, C&I and OA
Organisational Culture
Innovative Culture
Creativity - Innovation
Organisational Adaptability
Organisational Culture Pearson Correlation 1 .57** .32* .20
Sig. (2-tailed) .000 .010 .106
Innovative Culture Pearson Correlation .57** 1 .67** .000
Sig. (2-tailed) .000 .000 .999
Creativity- Innovation Pearson Correlation .32* .67** 1 -.43**
Sig. (2-tailed) .010 .000 .000
Organisational Adaptability
Pearson Correlation .20 .000 -.43** 1
Sig. (2-tailed) .106 .999 .000
**. Correlation is significant at the 0.01 level (2-tailed).
*. Correlation is significant at the 0.05 level (2-tailed).
Table 4 data shows a positive significant relationship between the Organisational culture and
Innovation culture r = 0.56, p <0.01; explaining 31.81% variance. The strongest correlation was found
Table 3: Preferred Culture
Frequency Valid Percent Cumulative Percent
Valid 1.00 - Clan 17 26.6 26.6
2.00 - Adhocracy 35 54.7 81.3
3.00 - Market 10 15.6 96.9
4.00 - Hierarchy 2 3.1 100.0
Total 64 100.0
Page 56
52
between the innovation culture and creativity and innovation index r = 0.67, p <0.01; this means that
innovation culture explains approximately 45.83% (r² = 0.4583) of the variance in innovation and
creativity. However there is a significant inverse relationship between innovation and creativity and
organisational adaptation r = -0.43, p <0.01. On the basis of the coefficient of determination it can be
tentatively concluded that creativity and innovation explains approximately 18.49% (r² = 0.1849) of the
variance in organisational adaptability. There is also a significant relationship between organisational
culture and innovation and creativity index r =0.32, p <0.01, (r² = 0.1018). A weak non- significant
relationship was found between organisational culture and organisational adaptability (r =-.20; p <0.11).
Table 5 below presents Secondary Analysis correlating organisational adaptability and specific
organisational culture dimensions. Although a weak and non significant relationship was found
between organisational adaptability and organisational culture, further correlation analysis shows
significant positive relationship with dimension dominant characteristic r =0.522, p <0.01, on the basis
of the coefficient of determination, it may be concluded that dominant characteristics explains 27.25%
(r² = 0.2725) of the variance in adaptation. Significant positive relations were also found with
Management style r =0.32, p <0.01, (r² = 0.1037) and a significant but relatively weak relationship with
Organisational glue r =0.27, p <0.05, (r² = 0.072).
Table 5. Pearson Correlations Between Organisational Adaptability and Key Organisational Dimensions
Organisational Adaptability
Dominant Characteristics
Leadership Style
Management Style
Organisation Glue
Strategic Emphasis
Criteria of Success
Organisational Adaptability
Pearson Correlation 1 .522** .094 .322** .268* -.216 -.203
Sig. (2-tailed) .000 .460 .009 .032 .086 .108
**. Correlation is significant at the 0.01 level (2-tailed). *. Correlation is significant at the 0.05 level (2-tailed).
Table 6 overleaf contains the Pearson correlations for the relationship between creativity and
innovation and the culture types as measures by the OCAI. Significant positive correlation was found
between creativity and innovation and the adhocracy culture r = 0.39, p <0.01; and market culture r =
0.38, p <0.02. On the basis of the coefficient of determination it may be concluded that the adhocracy
Page 57
53
culture explains approximately 15.52% (r² = 0.1552) and the market culture 14.98% (r² = 0.1498), of
the variance in creativity and innovation. However a non significant negative relationship was found
with the Hierarchy culture.
Table 6. Correlations between Organisational Culture types and creativity and Innovation
Innovative - Creativity Index Clan culture Adhocracy Market Culture
Hierarchy culture
Innovative - Creativity Index
1 .16 .39** .38** -.04
Clan culture .16 1 .62** .54** .38**
Adhocracy .39** .62** 1 .59** .199
Market Culture .38** .54** .59** 1 -.01
Hierarchy culture -.04 .38** .19 -.01 1
**. Correlation is significant at the 0.01 level (2-tailed).
3.4.3. Summary of Regression Analysis
Table 7
2nd
Analysis 1st
Analysis
Creativity &Innovation (MV) Organisational Adaptation (DV)
Independent Variable R² Beta F t Sig. R² Beta F t Sig.
Organisational Culture (IV) 0.102 0.319 7.007 2.647 0.01
0.042 0.204 2.69 1.64 0.106
Table 7 presents a summary of the study regression analysis. In the first analysis the dependent variable
(DV) organisational adaptability is regressed on the independent variable (IV) organisational culture.
The R² (.042) shows that only 4.20% of the variance in organisational adaptability is explained by
organisational culture. This however partially satisfies the basic assumption for mediation analysis.
Standardized regression coefficients shows that a small variance is explained (β = .20 p<.11, F = 2.69)
which is also weak with low significance. In the second analysis our mediator variable (MV) creativity
and innovation is regressed against the independent variable (IV) organisational culture with (β = .32
p<.01, F = 7.01). Although organisational culture explains only 10.20% of the variance in creativity and
Page 58
54
innovation the relationship is a significant one at (F=.7.01, p<0.01). This satisfies the secondary
condition necessary for mediation that the IV and MV are significantly related.
Table 7.2 presents third analysis summary model of the hierarchical regression, anovas and coefficients
of independent and mediator variables predicting organisational adaptation. The third analysis is at two
levels. In the first level after regressing the DV on the MV results indicate that creativity and
innovation (MV) explains 18.9% of the variance in organisational adaptation (R² = .19, P= 0.000, F
=14.41). In the second level after controlling for the effects of the mediating variable – creativity and
innovation, the addition of the (IV) organisational culture lowered slightly in significance the variance
explained (R² change =0.13, p=0.001, Fchange = 11.68). However the effect of the IV organisational
culture on the DV organisational adaptation becomes significant after controlling for the effect of the
mediating variable (β=.38, p<0.001) than in the first analysis (R=0.20, p<0.11). Which fails to meet the
final precondition for mediation.
Table 7.2. Analysis 3 R R² R² change Standardized
coefficient: β Fchange sig
Level 1. Creativity & Innovation
.434
.189
.189
.-556
14.41
.000
Level 2. Creativity & Innovation; Organisational Culture
.565
.319
.013
.381
11.68
.001
Page 59
55
Table 8 presents the hierarchical regression summary and coefficients for variables predicting
Organisational Adaptability.
Table 8. Model Summary: Stepwise Hierarchical Regression for variables predicting Organizational
Adaptability
Model β R² Adjusted R² Std. Error of the Estimate
Change Statistics
R² Change F Change
1. Demographics .529a .280 .195 .76362 .280 3.298
2. Demographics, Org Culture .574b .329 .236 .74403 .050 3.722
3. Demographics, org culture;
Innovation Culture
.576c .331 .222 .75054 .002 .136
4. Demographics, org culture,
Innovation Culture & innovation
and Creativity Index
.614d .377 .261 .73165 .046 3.563
5. Demographics, org culture,
Innovation Culture & innovation
and Creativity Index, Dominant
Characteristics, Org glue, Mgt
Style
.672e .451 .305 .70961 .074 2.009
ANOVA f
Model Sum of Squares df Mean Square F Sig.
1 Regression 11.538 6 1.923 3.298 .008a
Residual 29.739 51 .583
Total 41.277 57
2 Regression 11.886 7 1.698 2.889 .013b
Residual 29.390 50 .588
Total 41.277 57
3 Regression 12.114 8 1.514 2.544 .021c
Residual 29.163 49 .595
Total 41.277 57
4 Regression 14.540 9 1.616 2.900 .008d
Residual 26.737 48 .557
Total 41.277 57
5 Regression 16.003 10 1.600 2.976 .006e
Residual 25.274 47 .538
Total 41.277 57
Page 60
56
• Model1 step 1 results shows that demographic variables significantly explain 27.20% (19.5%
adjusted) of the variance in Adaptation; R =.53, R² = .28; F (3.29) p < .001. Since, the F statistic of
3.29 is statistically significant at the 99% level, (p < 0.01), it may be concluded that demographic
variables significantly explain 19.5% variance. However 80.5% of the variance in organisational
Adaptation may be explained by factors not considered in this model.
• Results indicate that regression Model 2 is significant and predicts 32.90% (23.60% adjusted) of the
variance in organisational adaptability: R=.57, F (2.89), p < .001. The resultant R² change shows
that organisational culture explains 5% of the variance beyond that explained by biographical
factors. Although the R² change (.05) is only approaching statistical significance, evidence of a
higher effect size (p<.02) and corresponding F change of 3.72 indicates that this change is virtually
significant. It may be concluded that 64.7% of the variance in creativity and innovation may be
explained by factors not considered in this analysis.
• Model 3 is significant and shows that the addition of interacting term innovation culture predict
33.1% (22.20% adjusted) of the variance in Organisational Adaptation. R = .612, F (2.544) p <
.021. However The F value change (.14) between model 2 and model 3 is lower, indicating that the
moderating relationship is very weak. Low R² change (0.02) supports the fact that the effect of
innovation culture beyond that explained by organisational culture is negligent.
• The addition of the creativity and innovation in Model 4 resulted in an R = .61, R²=.38, R² change
of .046, F = 2.90, p < .008. The larger effect size (p < .008) and an F change of 3.56 shows that this
effect is statistically significant and indicates the presence of an interaction effect. Specifically, the
moderating effect of creativity and innovation, innovation culture and organisational culture
predicts 37.70% (26.10% adjusted) of the variance in organisational adaptability and increments
4.6% over and above the variance explained by innovation culture and organisational culture.
Page 61
57
A further analysis of standardized beta weights and curve estimation regressing creativity and
innovation against organisational adaptability as the depended variable shows β=-.43, t(-3.81),
F(14,51), R² = .19, (p<.00). This indicates that creativity and innovation is a significant coefficient
explains on its own18.5% (17.20% adjusted) of the variance in organisational adaptability.
• Model 5 incorporating secondary examination of organisational culture dimensions and the
subsequent addition of – Dominant characteristics, Organisational Glue, and Management style
indicate the strongest significant prediction of variance. Full regression in Model 5 predicts 45.10%
(30.50% adjusted) of the variance in Organisational Adaptability. R = .67, R² (.45) F =2.98, (p <
.006.) R² change = .07. The addition of the three culture dimensions explain, 7.4% of the variance
in Organisational Adaptation beyond that explained by model 4 (organisational culture, innovation
culture and the innovation and creativity). Noteworthy is that Model 5 predicts approximately
17.10% (11% adjusted) variance beyond that explained by biographical factors.
Page 62
58
CHAPTER 4.
4. RESULTS
H1: Innovation culture (ICul) is significantly related to Creativity and innovation (CI).
Data from table 4 indicates a strong positive relationship between innovation culture and creativity and
innovation r=.67, (p <.00). This significant relationship provides support for the hypothesized
relationship.
H2: creativity and innovation is significantly and positively related to Organizational adaptability.
Correlation in Table 4 shows a significant negative relation between creativity and innovation and
organisational adaptability. This only partially supports our hypothesis of a significant relationship.
Conversely the direction of relationship is inverse r=-.43 (P<.00) rather than the proposed positive
relationship, thus we fail to support the hypothesis.
H3: Creativity and Innovation is significantly and positively related to the OCAI culture types.
Results shows that creativity and innovation is positively related to the Adhocracy r = .39 (p<.01),
Market type culture r=.38, (p<.01). However non significant relationships were found with the
Hierarchy and Clan type. This partially supports the hypothesis for a significant relationship.
H4: Creativity and innovation (CI) mediates the relationship between organisational culture (OC) and
organisational adaptability (OA).
Mediation process reflects the causal path with which the Independent variable is linked to the
dependent variable. The study hypothesised that organisational culture influences organisational
adaptation via innovation and creativity. To meet the preconditions necessary to demonstrate mediation
via regression analysis there is need to demonstrate that i) Organisational culture significantly predicts
organisational adaptation which the study partially fulfilled (β=0.20, p<0.11); ii) organisational culture
approximately predicts 10.20% of the variance in creativity and innovation (β = .32, R²=0.01; p<.01)
Page 63
59
which is significant at (F=.7.01, p<0.01). This satisfies the secondary condition necessary for mediation
that the IV and MV are significantly related; iii) the final condition to demonstrate the presence of
mediation is for the coefficient for creativity and innovation to be significant while the beta for
organisational culture to decrease significantly when the hypothesized MV – creativity and innovation
is entered in the second block. After regressing the DV on the MV results indicate that creativity and
innovation (MV) explains 18.9% of the variance in organisational adaptation (R² = .19, P= 0.000, F
=14.41). However contrary to the study expectations, the effect of the IV organisational culture on
organisational adaptation becomes significant after controlling for the effect of the mediating variable
(β=.38, p<0.001) than in the first analysis (R=0.20, p<0.11). Thus the analysis data fails to meet the
final precondition necessary to assume a mediation influence. This shows that other variables not
included in the model directly or partially mediates the relationship between organisational culture and
organisational adaptation.
Figure 5. Graphic of regression coefficients
H5: Organisational culture, Innovation culture, Creativity and Innovation and Organisation
Adaptation are significantly related.
Results indicate significant relationships between the variable as present below in figure 5 and Table 4
which supports our proposition. A very weak and non significant relationship was found between OC
and OA r =.20 (p < .11). However significant correlations were found between OC and CI r = .32, (p <
.05); OC and ICul r=.56 (p < .00); ICul and CI r =.67, (p < .00) and CI and OA r= -.43, (p < .00).
Creativity and Innovation
Organisational Culture
Organisational Adaptation
.32, p<0.01 .-43, p<0.00
.20, p<0.11(sig.381, p<0.001)
Page 64
60
Secondary analysis on specific dimensions of organisational culture indicated OA is positively and
significantly related to Dominant Characteristics r=.52 (p < .001). Thus indicating a possible alternative
causal model to the relationship between OA and OC.
Figure 6. Proposed Theoretical Model from study findings
Secondary moderation analyses show that the impact of organisational culture on organisational
adaptation is however moderated by created by creativity and innovation. The addition of the creativity
and innovation in hierarchical regression analysis in Table 7, Model 4 resulted in an R = .61, R²=.38,
R2 change of .046, F (2.90) = 3.563, p < .01. The larger effect size (p .01) and an F change of 3.56
shows that this effect is statistically significant and augments to our preliminary support for the
presence of a mediating effect in accordance in accordance with H4. More specifically, the moderating
effect of creativity and innovation explains approximately 4.6% of the variance in organisational
adaptation beyond that explained by Organisational culture.
Hierarchical multiple regression analysis shows that organisational culture (IV) and innovation culture
predicts creativity and innovation (mediator), organisational culture (IV) is weakly correlated to
organisational adaptability(DV) and Creativity and Innovation(Mediator) predicts and organisational
adaptability (DV).
Innovation Culture Construct
Innovation & Creativity
Organisational adaptation
Organisational Culture
β= .56, p < .00 Β = .67, p < .00
β = - .43, p < .00 β = .52, p < .001: but only through specific dimensions – Dominant characteristic, org. glue & Management style
Page 65
61
CHAPTER 5.
5. DISCUSSION, CONCLUSIONS AND RECOMMENDATIONS
Introduction
The chapter discusses the prominent findings of the study and makes reference to relevant research to
support the findings of the current study. The discussion includes demographic information about the
sample, results obtained from the descriptive statistics and correlations between the variable
organisational culture, Innovation Culture, creativity and innovation and organisational adaptation.
Conclusions are drawn based on the obtained results and recommendations for future research are put
forth.
5.1. Discussion of Results
The overall goal of this study was to establish through empirical enquiry the relationship between
organisational culture, creativity and innovation and organisational adaptation. The study also sought to
diagnose the ART Corporation culture, and advance recommendations on how ART Corporation can
best leverage its culture to optimize adjustment to a highly averse competitive environment. The
dissertation advanced posited that ART Corporation failure is failing to navigate the environment
therefore needs to leverage adaptation through innovation and creativity. Overall ART Corporation has
lower levels of adaptation, has a Hierarchy culture with an average innovation and creativity index. The
result on advanced propositions and their outcomes are discussed.
The study shows that study variables differed according to gender, age, tenure level of education and
occupation. Specifically women reported lower levels of innovation and creativity than men with mean
scores of 2.89 compared to men who had 3.311and perceptions of organisational adaptation. These
findings are in synch with Amabile et al (1998). Hofstede (1990) also found that employees, who
Page 66
62
differed in values, differed more according to the demographic criteria than according to membership in
the organisation per se.
Results have shown a strong positive relationship between the innovation culture construct and
innovation and creativity r=.67. (p <0.01). This is in line with Dobni (2008) study which posits an
innovative culture is strongly related to innovation and creativity. In line with extant research is the
finding that Adhocracies are innovative and creative cultures with an r = .627, market r = .540 and Clan
r= .455. at p <0.01 significant level with the innovation culture construct and there have a significant
correlation with innovation and creativity. Thus increasing on adhocracy related characteristics such as
flexibility, flatter structures, collaboration entrepreneurship, growth focus and creativity is likely to
result in higher levels of innovation. The study showed a lack of significant relationship between
Khandwalla & Mehta, (2004) posits that Hierarchical cultures inhibits innovation and creativity due to
their inflexibility and beauracratic, centralised command structures.
Although most researchers such as Angel, (2006), Deshpande and Farley (2004), Khandwalla et al
(2004) and Kozbelt, et al (2008) have posited that innovation can accelarate the adaptation process, is
positively related to market shares, competitiveness and organisational effectiveness the current study
found an inverse relationship between organisational adaptation and innovation and creativity r= - 0.32,
p < 0.01. The study also failed to establish the mediating impact of creativity and innovation on
organisational adaptation. Secondary data (table 2): ART performance indicator graphs confirm
empirical finding that ART Corporation is not adapting well to its environment mean = 2.50. However
research findings shows average levels of innovation and creativity mean = 3.181 sd. 0.612.
However this dichotomy with extant propositions literature positing positive relationship is in synch
with current criticism of creativity and innovation research. Critics such as Kaufman (1998), Rogers
and Schneider (1971) notes that research in innovation and creativity is fragmented and not cumulative
Page 67
63
due to extensive variances among findings referred to as instability of research. They note that factors
found significant in one study are less important in another, in other contexts inversely related and in
others not related to creativity and innovation at all. As a consequence theoretical value of most
research findings is rather tenuous.
However, the inverse relationship could be explained by the inadequacy of the innovation and creativity
measure used in the study. The measures only indicated the ‘what’ of innovation but did not go further
to measure how successful that innovation action was implemented or the organisational level and
external effect of the innovation. For instance introducing a wide range of products in the market does
not measure the magnitude of effect in the environment domain, and successful adoption of such
products. Kirner et al (2008) notes this instability of research mainly arise due to methodological
challenges faced in measuring creativity and innovation especially because of its multi –dimensionality
and differences at the aggregate level. Methodological challenge arises particularly on choosing the
level at which innovation should be measured. Although using the scoreboard approach can show
higher levels of Creativity and Innovation, their effect can be negligent due to different life cycles of
innovations. This means that their effect can be felt after some which another alternative explanation
for this variance in findings. Therefore Kirner et al (2008) proposes the use of structural equation
modelling in analysing creativity and innovation data, focusing on organisational level outcomes such
as improved quality or cost reduction and on employee level outcomes such as increased autonomy.
Literature has shown for organisations to be successful they need to be ambidextrous have the capacity
to exploit and explore concurrently (Bledow et al, 2009). In fact case studies have shown that creative
organisations are not necessarily successful.
Research leading to the development of the OCAI using the competing values framework based the
dimensions in the study from a factor analysis of 39 organisational effectiveness indicators. Thus
Schein (2002) posits that congruent cultures are most likely to be functional and better able to cope
Page 68
64
with or adapt to their internal and external environments. Based on this, in the current study the six
dimensions were correlated with organisational adaptation. Although an inverse relatioship had been
found between creativity and adaptation, results showed that Organisational glue, management of
employees and dominant characteristics significantly and positively correlated with adaptation. At
maximum explaining approximately 25.72% variance in adaptation. These findings shows that these
dimensions most likely explain how an organisation adapts to its external environment than creativity
and innovation. This is also in line with Berkhout, el al (2006) and Morgan (1986) who posits that
organisational culture is among an organisation’s dynamic capability that an organisation use in coping
with its environment. It can therefore be tentatively concluded that these cultural dimensions
significantly mediates the relationship between organisational culture and Organisational Adaptation.
Thus it offers an alternative model that explains how organisations can leverage adaptation. However
this is a tenuous conclusion since meditational analysis have not been performed
5.2. Recommendations
Practical Implications
i) Recommendation on Leader Value Projects : Entreprenuership Ventures
o Based on the results ART Corporation needs to focus on increasing the strength and congruence
of its culture. From culture diagnosis, ART culture is the hierarchy type, and although there is no
researcher consensus on the type of culture that support innovation and creativity most
researchers concurs that the Adhocracy and clan type culture are most supportive of
entrepreneurship ventures because of their bias towards flexibility, innovation and creativity.
Cameron and Quinn (1999) posits tha Clan type cultures are also most adaptable in uncertain
environments.
o Schein (1999) posits that cultural dysfunctionality is evidenced by the dichotomy between
current and espoused values and that such dysfunctionality will limit the organisation’s capacity
Page 69
65
to adapt. Results shows a huge dissent between the current and desired culture. This may also
explain why ART has been failing to navigate the environment. The current culture is most
adaptable in stable and slowly changing environements
o The significant relationship found between adaptation and the culture dimensions – Dominant
characteristic, organisational glue, and management of employees shows what ART need to focus
on. Specifically relook at the extent or degree of dynamism or entrepreneurship that
characteristics the organisation, work on increasing participative and empowering management
styles and focus on the bond mechanisms that hold the organisation as a cohesive unit such as
orientation towards innovation. Current dimensions reflect a fundamental hierarchical biased
values and implicit assumptions about ‘how things are done around here’.
o Creativity and Innovation can also not be mandated but requires the development of collaborative
and empowering environments. Therefore there is need to incorparate clan type characteriscs into
the present cultures, such as teamwork, internal maintenance and focus on human capital
development.
ii) Revitalising the organisation : Moving from Organisational decline
o Analysing secondary data in terms of the organisational life cycle concept shows that the
organisation is in the decline stage. However disolution in not an inevitable outcome. To
revitalise, the organisation need to focus on the successful exploitation and capitalisisation of
creativity and innovation. Specifically to gain cost advantage over competitors the organisation
should focus on process innovationa and have a process concept of creativity and innovation
than see innovation as an end goal (Morgan, 1986)
o The organisations should also focus on leveraging values that comprise the dominant
characteristics of the organisation, organisational glue and management of employees since
Page 70
66
these have been shown to be positivley correlated with organisational adaptation. This can be
done by creating a participative and collaborative environment.
Conceptual and Theoratical Implications
o The research findings reported in this study make a valuable contribution to the understanding the
relationship between culture, creativity and innovation and organisational adaptation. However
focusing on leveraging organisational culture for adaptation may in practice comprise a more
urgent practical problem for management.
o In concurrence with Martin (2002), future studies on organisational culture should focus on
explicating and comparing values, assumptions and beliefs of highly creative and innovative and
adaptable firms. Also longitudinal studies that look at culture changes overtime as an organisation
transforms into a highly innovative or inversely into an inertial state will be most effective in
assessing the proposed relationship than the current snapshot cross sectional design. Van de Ven
and Poole (1989) recommended integrating research methodologies. Mclean (2002) posits that
apart from methodological issues in the study of creativity, innovation and organisational culture,
determining measures for the outcome variable in creativity and innovation studies remains an
issue.
o Finally, future research of this nature may assist organisational leadership to pro-actively manage
and change their cultures to leverage successful coping with their environments.
5.3. Limitations of the Study
o The major limitation of this study is its cross section design. The organisation is reinventing hence
a snapshot picture of how an organisation culture is relative to its adaptive capacities will not be
enough to adequately explore this change. Thus to adequately explore the concept there is need to
utilize non – linear analysis, incorporate qualitative and longitudinal research design. Future
research on organisational culture and creativity and innovation could benefit from adopting
Page 71
67
diverse research methods in order to capture the complexities involved in understanding the
cultural and adaptation issues.
o The sample is confined to ART Corporation employees and its peculiar occupational classes.
Therefore the results of the study should be generalized with caution. It is suggested that for
future research the random sample comprise of bigger trans-organisational samples to allow for
generalization of findings.
o Selected variables to the innovative culture concept might not be the only contributing factors that
are important to respondents. Other variables such as participative decision making, power
sharing and mediating role of transformational leadership have not been investigated. As a
consequence internal validity of the study might be adversely affected. Therefore, any conclusions
emanating from current research are potentially tenuous.
o The study proposed that innovation and creativity mediates the relationship between
organisational culture and organisational adaptation. However no meditational analyses were
conducted. Future research could benefit by incorporating such an analysis. Also structural
equation modelling should be adopted to assess the effects innovation and creativity.
o The conclusions from the results of this study were made on the assumptions that perspectives of
those who chose to respond to the survey represented the best answers to the survey questions.
Future research directions should focus on:
o How to adequately measure innovation and creativity,
o use structural equation modelling in dealing with analysis challenges
o Expand methodological focus from an innovation inventory focus to augmenting this with firm
level and organisational level innovation outcomes.
o Replicating the study and widening the study population.
Page 72
68
o Empirically testing the relationship between creativity and organisational adaptation and
explaining the instability of research.
5.4. Conclusion
The central objective of this study was to establish the relationship between organisational culture,
innovation and creativity and organisational Adaptability. A literature survey was conducted to form
the theoretical premise for the study. Creativity and Innovation were found to be strongly related to the
Innovation Culture construct but negatively related to organisational adaptation. Very weak and
insignificant relationship were found between organisational culture and innovation culture construct
with Organisational Adaptation indicating that this relation is no linear and also complex. However
further analysis of by correlating and regressing specific organisational culture dimensions showed
strong positive relationships between dominant characteristics, management style and organisational
glue and organisational Adaptability. It can be concluded that these cultural dimensions maybe the
primary mechanism by which organisation adapt to its external environment. The empirical findings
from the study indicate that ART Corporation is struggling to navigate its external environment.
With reference to the stated research hypotheses the following specific empirical findings emerged
from the investigation:
• There is a negative relationship between creativity and innovation index and organisational
Adaptation.
• Significant and positive relationship exists between the innovation culture construct and innovation
and creativity.
• There are significant relationship between Adhocracy, Market culture and creativity and innovation.
The results of the study should be interpreted with caution due to the limitations of the study.
Cognizance must also be taken of the fact that the results obtained from the research comprised of a
highly homogenous and non-probabilistic sample therefore might not generalize with confidence to
Page 73
69
other situations. In addition, although the response rate for the current study is adequate, the
composition of the sample could have introduced elements of bias in the research findings. Most
notably, significant correlations and disparities due to biographical characteristics of respondents may
have confounded the results obtained from the investigation.
Page 74
70
REFERRENCES
Adams, R., Bessant, J., & Phelps, R. (2006). Innovation management: A review. International Journal
of Management Reviews , 8 (1), 21 - 47.
Achrol, R.S. (1991). Evolution of the marketing organisation: New forms for turbulent environments.
Journal of Marketing, 55, 77 – 93
Ahmed, P. K. (1998). Culture and climate for innovation. European Journal of Innovation
Management, 1 (1), 30–43.
Alvesson, M. (1989). Concepts of organizational culture and presumed links to efficiency.
International Journal of Management Science. Vol. 17 (4), 323-33.
Amabile, T. (1998, September–October). How to kill creativity. Havard Business Review , 77– 87.
Amabile, T. M., Conti, R., Coon, H., Lazenby, J., & Herron, M. (1996). Assessing the work
environment for creativity. Academy of Management Journal , 39, 1154 –1184.
Anderson, J., & Markides, C. (2006). Creativity is not enough: ICT enabled Strategic Innovation.
European Journal of Innovation Management , 9 (2), 129 - 148.
Angel, R. (2006). Putting an innovation culture into practice. Ivey Business Journal , 1 - 5.
Argyris, C., & Schӧn, D. (1972). Organisational learning. A theory of action perspective. Reading:
Addison Wesley Publishing.
Armenkis, A., Mossholder, K., & Harris, S. (1990). Diagnostic Bias in Organisational Consultation.
Journal of Management Science , 18 (6), 563 - 576.
Baldacchino, L. (2009). Entrepreneurial creativity and innovation. First International Conference on
Strategic Innovation and Future Creation (pp. 1 - 15). Floriana: Univeristy of Malta.
Barringer, B. R., & Ireland, R. D. (2006). Entrepreneurship: Successfully launching new ventures. New
Jersey: Pearson Prentice Hall.
Berkhout, F., Hertin, J., & Gann, D. M. (2006). Learning to adapt: Organisational adaptation to climate
change impacts. Climate Change , 78, 135 - 156.
Blau, P.M. & Scott, W.R. (1962). Formal Organizations: A Comparative Approach. Ontario : Chandler.
Page 75
71
Cameron, K. S., & Quinn, R. E. (1999). Diagnosing and changing organizational culture based on the
competing values framework. New York, NY: Addison-Wesley.
Carayannis, E. G., & Provance, M. (2008). Measuring firm innovativeness: toward a composite
innovation index built on firm innovative posture, propensity and performance attribute. International
Journal of innovation and regional Development , 1 (1), 90-107.
Cooke, R. & Lafferty, J. ( 1987). Organizational Culture Inventory (OCI). Plymouth, MI: Human
Synergistics.
Csikszentmihalyi, M. (1999). Implications of a systems perspective for the study of creativity. In R. J.
Sternberg (Ed.), Handbook of creativity (pp. 313-335). New York: Cambridge University Press.
Csikszentmihalyi, M. (1988). Society, culture, and person: A systems view of creativity. In R. J.
Sternberg (Ed.), The nature of creativity: Contemporary psychological perspectives (pp. 325 - 228).
New York: Cambridge University Press.
Damanpour, F. (1991). Organizational innovation: a meta-analysis of effect of determinants and
moderators. Academy of management Journals , 34 (3), 555-590.
Deal, T.E. & Kennedy, A.A. (1982). Corporate Cultures, Addison-Wesley, Reading, MA.
Denison, D.R. (1990). Corporate Culture and Organizational Effectiveness. NewYork: John Wiley &
Sons.
Deshpande, R., & Farley, J. (2004). Organizational culture, market orientation,innovativeness, and firm
performance: An international research odyssey. International Journal of Research in Marketing , 21
(1), 3 - 22.
Devine, P. G. (1990). Diagnostic and Confirmation Strategies in Trait Hypothesis Testing. Journal of
Personality and Social Psychology , 58, 952 - 963.
Dobni, C. B. (2008). Measuring innovation culture in organizations. The developments of a generalized
innovation culture construct using exploratory factor analysis. European Journal of Innovation
Management , 11 (4), 539 - 559.
Page 76
72
Duckworth, A. (2011, April 26). What are IQ tests really measuring. Proceedings of the National
Academy of Sciences, , doi: 10.1073/pnas.1018601108.
Eisenhardt, K. M., & Tabrizi, B. N. (1995). Accelerating adaptive processes: Product innovation in the
global computer innovation. Administrative Science Quarterly , 40 (1), 84 - 110.
Ekvall, G. (1996). Organizational climate for creativity and innovation. European Journal of Work and
Organisational Psychology , 5, 105–123.
Filipczak, B. (1997) It takes all kinds: creativity in the workforce. Training, 34 (5), 32 - 40.
Furnham, A. and Gunter, B. (1993), “Corporate culture: definition, diagnosis and change”, in Cooper,
C.L. and Robertson, I.T. (Eds), International Review of Organizational Psychology, Vol. 8, 233-61.
Hardy, C. (1996). Handbook of Organization Studies. London: Sage.
Hofstede, G. (1980), Culture's Consequences. London: Sage.
Hofstede, G. (1989), ``Organizing for cultural diversity'', European Management Journal. Vol. 7 (4),
389-96.
Hofstede, G. (1994), Cultures and Organizations: Intercultural Cooperation and its Importance for
Survival. London: HarperCollins.
Gardner, H. (2004). Changing Minds: The Art and Science of Changing Our Own and Other People’s
Minds. Boston MA: Harvard Business School Press.
Gardner, H. (2006). Multiple Intelligences. New York: New horizons.
Gardner, H. (1999). Who owns Intelligence. Atlantic Monthly , Volume 283, No. 2; pages 67-76.
Goodman, M. (1995). Creative management. London: Prentice Hall.
Gould, S. (2000). The Lying Stones of Marrakech. New York: Harmony Books.
Guilford, J. P. (1950). Creativity. American Psychologist , 5, 444 - 454.
Guilford, J. P. (1980). Some changes in the structure of intellect model. Educational and Psychology
Measurement , 48, 1 - 4.
Page 77
73
Harnett, P., Cajani, L., Fulop, M., & Johansson, R. (2009). Discerning Bias in Research: Challenging
Epistemological Assumptions. CiCe guides for practice-based research , 4 (1), 1 - 25.
Hertin, J., Berkhout, F., Delaney, K., & Arnell, N. (2002). Business and climate change: measuring and
enhancing adaptive capacity, Progress report: Preliminary results from the house building and water
sector, SPRU/Tyndall Centre for Climate Change Research, Brighton.
Heye, D. (2006). Creativity and innovation: Two key characteristics of the 21st century information
professional. Business Information Review, 23(4), 252 – 257.
Hurley, R. F., & Hult, G. M. (2008). Innovation, market orientation and organizational learning: an
integration and empirical examination. Journal of Marketing , 62, 42-54.
Isaksen, S. G., Lauer, K. J., & Ekvall, G. (2002). Perceptions of the best and worst climates for
creativity: Preliminary validation evidence for the situational outlook questionnaire. Creativity
Research Journal , 13 (2), 171 - 181.
Isaksen, S., & Lauer, K. (2002). The climate for creativity and change in teams. Creativity and
Innovation Management , 11, 74 - 85.
Job, P. A., & Sanghamitra, B. (2006). Creativity and innovation for competitive excellence in
organizations. Conference on global competition & competitiveness of Indian corporate (pp. 53 -63).
Madras: IIMK.
Kanter, R.S. (1988). When a thousand flowers bloom: Structural, collective, and social conditions for
innovation in organizations. Research in Organizational Behavior, 10, 169-112.
Kenny, B., & Reedy, E. (2007). The impact of organizational culture factors on innovation levels in
SMEs: An empirical investigation. The Irish Journal of Management , 5 (17), 119‐142.
Khandawala, P. (1973). Viable and effective organisational designof firms. Academy of Management
Journal , 16, 481 - 491.
Khandwalla, P. N., & Mehta, K. (2004). Design of Corporate Creativity. VIKALPA , 13 - 28.
Kirner, E., Som, O., Heidi, A., Gunter, L., & Zhou, W. (2008). Measuring organisational innovation-
concepts, indicators and outcomes: Non-Technical innovations – definitions, measurement and policy
Page 78
74
implications. 6 CP Workshop (pp. 1 - 26). Karlsruhe: Fraunhofer Institute for Systems and Innovation
Research (ISI).
Kirton, M. (1989). A theory of cognitive style. In M. Kirton (Ed.), Adaptors and innovators: Styles of
creativity and problem solving (pp. 1 -36). New York: Routledge.
Kitchell, S. (1995). Corporate culture, environmental adaptation and Innovation Adoption. Journal of
the academy of marketing science , 23 (3), 195 - 205.
Kotter, J. P., & Heskett, J. L. (1992). Corporate culture and performance. New York: Free Press.
Kozbelt, A., Beghetto, R. A., & Runco, M. A. (2008). Creativity Theories. 20 - 47.
Lowe, E.A. (1981), Culture's consequences: international differences in work-related values, Journal of
Enterprise Management, Vol. 3 (3), 312.
March - Chorda, I., & Moser, J. (2010). How organisational culture affects innovation in large sized
ICT firms: A pilot study. Facultad de Economía. Valencia: Universitat de Valencia.
Minessence Group. (2011, September 22). Culture Matters Most. (P. Chippendale, Ed.) Retrieved
March 13, 2013, from Minessence Group eZine #47: http://www.minessence.net/
Morgan, G. (1986). Images of organization. Newbury Park, CA: Sage Publications Inc.
Mott, P. (1972). Characteristics of effective organisations. New York: Harper & Row.
OECD and Eurostat. (2005). The measurement of scientific and technological activities.Guidelines for
collecting and Interpretting Innovation Data. Oslo Manual (3rd ed.). Oslo: OECD.
Ott, J. (1989). The organizational culture perspective. Chicago: Dorsey.
Perel, M. (2005). You can innovate in hard times. Research Technology and Management , 48 (4),
14‐23.
Pinchot, G., Pinchot, E., (1993). The end of bureaucracy and the rise of the intelligent organization.
San Francisco: Berret-Koehler Publishers.
Poskiene, A. (2006). Organizational culture and innovations. Engineering Economics , 46 (1), 45 - 50.
Page 79
75
Rank, J., Pace, V., & Frese, M. (2004). Three avenues for future research for innovation, creativity and
innitiative. Applied Psychology: An International Review , 53 (4), 518 - 528.
Rhoades, L., & Eisenberger, R. (2002). Perceived Organizational Support: A Review of the Literature.
Journal of Applied Psychology , 87 (4), 698–714.
Rhodes, M. (1961). An analysis of creativity. Phi Delta Kappan , 14, 305 - 310.
Sackmann, S. (1991). ``Uncovering culture in organizations'', Journal of Applied Behavioural Science.
Vol. 27 (3), 295-317.
Sanjeevkumar, V. (2012). A Study on Employee's Intentionto Stay In Public. International Journal of
Business Economics & Management Research , 2 (4), 16 - 27.
Schein, E. (2000). Coaching and Consultation. In M. Goldsmith, L. Lyons, & A. Freas, Coaching for
Leadership :How the World's Greatest Coaches Help Leaders Learn. (p. 65 74). New York: Jossey -
Bass.
Schein, E. H. (1997). The Concept of Client from a Process Consultation Perspective : A Guide for
Change Agents. Reading, MA: Addison - Wesley.
Schein, E. (1999). Process Consultation Revisited. Building the Helping Relationship. Reading,MA:
Addison- Wesley Publishing Inc.
Schein, E. (1992). Organizational Culture and Leadership.A Dynamic view. San Francisco: CA Jossey-
Bass.
Schein, E. (1990). “Organizational culture”, American Psychologist. Vol. 45 (2), 109-19.
Schneider, B. (1985). ``Organizational behaviour'', Annual Review of Psychology. Vol. 36, 573-611.
Siehl, C., & Martin, J. (1984). “The role of symbolic management: how can managers effectively
transmit organizational culture?”, in Hunt, J.G., Hosking, D.M., Schriesheim, C.A. & Stewart, R. (Eds),
Leaders and Managers: International Perspectives on Managerial Behaviour and Leadership,
Pergamon, New York.
Snyderman, M., & Rothman, S. (1987). Survey of Expert Opinion on Intelligence and Aptitude Testing.
American Psychologist , 42 (2), 134 - 147.
Page 80
76
Srivastava, D. K. (2001). Correlates of of organisational adaptability. Indian Journal of Industrial
Realtions , 37 (3), 55 - 65.
Srivastava, D. K., & Ghadially, R. (1996). Organisational structure and management effectiveness. A
case study of four organisations in India. Productivity , 1, 94 - 115.
Sternberg, R. (1985). Beyond IQ: A Triarchic Theory of Human Intelligence. Cambridge: Cambridge
University Press.
Tesluk, P. E., & Klien, S. (1997). Influences of organizational culture and climate on individual
creativity. The Journal of Creative Behavior , 31 (1), 21-41.
Thompson, A. A., & Peteraf, M. (2012). Crafting and Executive. New York: Macgraw Hill.
Torrance, E. P. (1962). Guiding creative talent. Englewood Cliffs, NJ: Prentice-Hall.
Utterback, J. M. (1974). Innovation in industry and the diffusion of technology. Science,. Science
(183), 620-626.
Walton, R. (1998). Explaining why Success dodnt Take. Organisational Dygnostics , 32 (4), 1- 27.
Wang, C. L., & Ahmed, P. K. (2004). The development and validation of the organisational
innovativeness construct using confirmatory factor analysis. European Journal of Innovation
Management , 7 (4), 303 - 313.
Whitehead, J., & McNiff, J. (2006). Action Research. Living Theory. London: Sage.
Zollo, M., & Winter, S. G. (2002). Deliberate learning and the evolution of dynamic capabilities.
Organization Science, 13 (3), 339–351.
Page 81
77
APPENDICES
Appendix 1. Study data Analysis: Reliability, Descriptives, Correlations and Regression analysis Reliability of Test Scores 1. Organisational Adaptability Subscale 2. Innovation and creativity index
3 Organisational Culture Assessment Instrument (Competing Value Framework)
Reliability Statistics
Cronbach's Alpha N of Items
.745 25
4 Innovative Culture Index Reliability Statistics
Cronbach's Alpha N of Items
.848 43
Descriptive Statistics
Table 1: Culture Profile for ART Corporation
N Minimum Maximum Mean Std. Deviation
Clan Culture 64 1.67 4.33 3.0026 .53822
Adhocracy 64 1.33 3.83 2.8281 .50741
Market Culture 64 2.17 4.83 3.5495 .55530
Hierarchical culture 64 2.50 4.83 3.6484 .43045
Valid N (listwise) 64
Table 2 : Culture Congruence Mix for ART Corporation
N Minimum Maximum Mean Std. Deviation
Dominant Characteristics 64 2.00 4.25 2.9063 .59178
Leadership Style 64 1.00 4.50 3.2422 .60581
Management Style 64 1.75 5.00 2.9961 .62280
Organisation Glue 64 1.50 4.50 3.1016 .59214
Strategic Emphasis 64 2.25 5.00 3.8086 .68681
Criteria of Success 64 2.00 4.75 3.4883 .55354
Reliability Statistics
Cronbach's Alpha N of Items
.829 18
Reliability Statistics
Cronbach's Alpha N of Items
.894 4
Page 82
78
Table 1: Culture Profile for ART Corporation
N Minimum Maximum Mean Std. Deviation
Clan Culture 64 1.67 4.33 3.0026 .53822
Adhocracy 64 1.33 3.83 2.8281 .50741
Market Culture 64 2.17 4.83 3.5495 .55530
Hierarchical culture 64 2.50 4.83 3.6484 .43045
Valid N (listwise) 64
Table 4: Innovation and Creativity Index
N Minimum Maximum Mean Std. Deviation
Product Innovation 70 1.00 4.67 3.3619 .66119
Organisational Innovation 70 1.00 4.67 3.4333 1.12553
Process Innovation 70 1.00 5.33 2.2333 .82698
Market Innovation 70 1.00 4.50 3.0464 .74247
Creativity Index 70 1.80 4.80 3.5971 .74171
Innovative_Creativity_Index 70 1.83 3.89 3.1810 .61200
Valid N (listwise) 70
Table 5: Innovation Culture Index
N Minimum Maximum Mean Std. Deviation
Infrastructure for innovation 68 2.77 4.52 3.8566 .48135
Intention for innovation 68 1.92 4.56 3.2617 .61296
Influence to innovation 70 1.33 4.33 3.5286 .60657
Implementation Context 71 1.89 4.56 3.1737 .52039
Valid N (listwise) 67
Table 6 Innovation culture subscales
N Minimum Maximum Mean Std. Deviation
Implementation Context 71 1.89 4.56 3.1737 .52039
Organisational Constituency 71 1.63 4.63 3.1426 .61539
Organisational Learning 71 2.57 4.71 3.7968 .69091
Market Orientation 70 1.33 4.33 3.5286 .60657
Propensity to Innovate 68 1.57 5.00 3.3782 .70625
Employee Creativity and Empowerment 68 1.67 5.00 3.9191 .50740
Table 3: Preferred Culture
Frequency Valid Percent Cumulative Percent
Valid 1.00 - Clan 17 26.6 26.6
2.00 - Adhocracy 35 54.7 81.3
3.00 - Market 10 15.6 96.9
4.00 - Hierarchy 2 3.1 100.0
Total 64 100.0
Page 83
79
Table 4: Innovation and Creativity Index
N Minimum Maximum Mean Std. Deviation
Product Innovation 70 1.00 4.67 3.3619 .66119
Organisational Innovation 70 1.00 4.67 3.4333 1.12553
Process Innovation 70 1.00 5.33 2.2333 .82698
Market Innovation 70 1.00 4.50 3.0464 .74247
Creativity Index 70 1.80 4.80 3.5971 .74171
Innovative_Creativity_Index 70 1.83 3.89 3.1810 .61200
Valid N (listwise) 67
Table 7: Organisational Adaptation
N Minimum Maximum Mean Std. Deviation
Organisational Adaptability 76 1.00 4.50 2.5000 .92286
Valid N (listwise) 76
Correlation Summaries
Correlations between Org Culture, Innovation Culture, Creativity and Innovation and Organisational Adaptability
Organisational Culture
Innovative Culture Index
Innovative - Creativity Index
Organisational Adaptability
Organisational Culture Pearson Correlation 1 .565** .319* .204
Sig. (2-tailed) .000 .010 .106
N 64 58 64 64
Innovative Culture Index Pearson Correlation .565** 1 .674** .000
Sig. (2-tailed) .000 .000 .999
N 58 67 59 67
Innovative - Creativity Index Pearson Correlation .319* .674** 1 -.430**
Sig. (2-tailed) .010 .000 .000
N 64 59 66 66
Organisational Adaptability Pearson Correlation .204 .000 -.430** 1
Sig. (2-tailed) .106 .999 .000 N 64 67 66 76
**. Correlation is significant at the 0.01 level (2-tailed).
*. Correlation is significant at the 0.05 level (2-tailed).
Correlations between Organisational Adaptability and Dominant Characteristics, Management style & Org Glue
Organisational Adaptability
Dominant Characteristics
Management Style
Organisation Glue
Organisational Adaptability Pearson Correlation 1 .522** .322** .268*
Sig. (2-tailed) .000 .009 .032
N 76 64 64 64
Dominant Characteristics Pearson Correlation .522** 1 .422** .390**
Page 84
80
Sig. (2-tailed) .000 .001 .001
N 64 64 64 64
Management Style Pearson Correlation .322** .422** 1 .499**
Sig. (2-tailed) .009 .001 .000
N 64 64 64 64
Organisation Glue Pearson Correlation .268* .390** .499** 1
Sig. (2-tailed) .032 .001 .000 N 64 64 64 64
**. Correlation is significant at the 0.01 level (2-tailed).
*. Correlation is significant at the 0.05 level (2-tailed).
Correlations between Creativity and Innovation and the Culture Types
Innovative - Creativity Index Clan culture Adhocracy
Market Culture
Hierarchy culture
Innovative - Creativity Index
Pearson Correlation 1 .159 .394** .387** -.040
Sig. (2-tailed) .209 .001 .002 .752
N 66 64 64 64 64
Clan culture Pearson Correlation .159 1 .623** .545** .375**
Sig. (2-tailed) .209 .000 .000 .002
N 64 64 64 64 64
Adhocracy Pearson Correlation .394** .623** 1 .599** .199
Sig. (2-tailed) .001 .000 .000 .114
N 64 64 64 64 64
Market Culture Pearson Correlation .387** .545** .599** 1 -.007
Sig. (2-tailed) .002 .000 .000 .955
N 64 64 64 64 64
Hierarchy culture Pearson Correlation -.040 .375** .199 -.007 1
Sig. (2-tailed) .752 .002 .114 .955
N 64 64 64 64 64
**. Correlation is significant at the 0.01 level (2-tailed).
Regression Data
Table 8. Third AnalysisHierarchical Regression summary, ANOVAs and coefficients of creativity and innovation (MV) and organisational culture (IV) predicting organisational adaptation.
Page 85
81
ANOVAc
Model Sum of Squares df Mean Square F Sig.
1 Regression 9.303 1 9.303 14.406 .000a
Residual 40.037 62 .646 Total 49.340 63
2 Regression 15.738 2 7.869 14.285 .000b
Residual 33.602 61 .551 Total 49.340 63
Coefficientsa
Model
Unstandardized Coefficients Standardized Coefficients
t Sig. B Std. Error Beta
1 (Constant) 4.490 .540 8.316 .000
Innovative - Creativity Index -.624 .165 -.434 -3.796 .000
2 (Constant) 2.158 .845 2.553 .013
Innovative - Creativity Index -.799 .160 -.556 -4.984 .000
Organisational Culture .037 .011 .381 3.418 .001
Dependent Variable: Organisational Adaptability
Hierarchical Regression
Model Summary: Stepwise Hierarchical Regression with Organisational Adaptability as the dependent Variable
Model R R Square
Adjusted R
Square
Std. Error of
the Estimate
Change Statistics
R Square
Change
F
Chan
ge df1 df2 Sig. F Change
1 .529a .280 .195 .76362 .280 3.298 6 51 .008
2 .574b .329 .236 .74403 .050 3.722 1 50 .059
3 .576c .331 .222 .75054 .002 .136 1 49 .714
4 .614d .377 .261 .73165 .046 3.563 1 48 .065
5 .672e .451 .305 .70961 .074 2.009 3 45 .126
Page 86
82
a. Predictors: (Constant), Tenure, Level of Education of Participants, occupation of the participant , Gender, Job Grade of Participant,
Age of Participant
b. Predictors: (Constant), Tenure, Level of Education of Participants, occupation of the participant , Gender, Job Grade of Participant,
Age of Participant, Organisational Cuture
c. Predictors: (Constant), Tenure, Level of Education of Participants, occupation of the participant , Gender, Job Grade of Participant,
Age of Participant, Organisational Cuture , Innovative Culture Index
d. Predictors: (Constant), Tenure, Level of Education of Participants, occupation of the participant , Gender, Job Grade of Participant,
Age of Participant, Organisational Cuture , Innovative Culture Index, Innovative - Creativity Index
e. Predictors: (Constant), Tenure, Level of Education of Participants, occupation of the participant , Gender, Job Grade of Participant,
Age of Participant, Organisational Cuture , Innovative Culture Index, Innovative - Creativity Index, Dominant Characterics, Organisation
Glue, Management Style
ANOVAf
Model Sum of Squares df Mean Square F Sig.
1 Regression 11.538 6 1.923 3.298 .008a
Residual 29.739 51 .583
Total 41.277 57
2 Regression 13.598 7 1.943 3.509 .004b
Residual 27.679 50 .554
Total 41.277 57
3 Regression 13.674 8 1.709 3.034 .008c
Residual 27.602 49 .563
Total 41.277 57
4 Regression 15.582 9 1.731 3.234 .004d
Residual 25.695 48 .535
Total 41.277 57
5 Regression 18.617 12 1.551 3.081 .003e
Residual 22.660 45 .504
Total 41.277 57
Coefficientsa
Model
Unstandardized Coefficients Standardized Coefficients
t Sig. B Std. Error Beta
1 (Constant) 2.047 .845 2.422 .019
Gender .350 .256 .185 1.364 .178
Level of Education of Participants -.008 .097 -.014 -.088 .930
Age of Participant -.102 .137 -.142 -.742 .462
occupation of the participant -.072 .074 -.131 -.968 .338
Job Grade of Participant .240 .128 .303 1.873 .067
Tenure -.066 .101 -.135 -.655 .515
2 (Constant) .529 1.139 .465 .644
Page 87
83
Gender .276 .253 .146 1.094 .279
Level of Education of Participants -.060 .098 -.098 -.611 .544
Age of Participant -.137 .135 -.191 -1.016 .314
occupation of the participant -.003 .080 -.005 -.032 .975
Job Grade of Participant .157 .132 .197 1.184 .242
Tenure -.109 .101 -.221 -1.078 .286
Organisational Culture .025 .013 .278 1.929 .059
3 (Constant) .680 1.219 .558 .580
Gender .252 .264 .133 .954 .345
Level of Education of Participants -.058 .099 -.094 -.585 .561
Age of Participant -.146 .138 -.203 -1.055 .296
occupation of the participant .000 .081 .000 -.003 .998
Job Grade of Participant .149 .135 .188 1.102 .276
Tenure -.094 .110 -.191 -.856 .396
Organisational Culture .029 .016 .316 1.774 .082
Innovative Culture Index -.115 .311 -.066 -.368 .714
4 (Constant) 1.005 1.201 .836 .407
Gender .241 .257 .128 .938 .353
Level of Education of Participants -.108 .100 -.177 -1.083 .284
Age of Participant -.104 .136 -.145 -.761 .451
occupation of the participant .036 .082 .067 .445 .659
Job Grade of Participant .055 .141 .070 .393 .696
Tenure -.065 .108 -.132 -.604 .549
Organisational Culture .033 .016 .364 2.076 .043
Innovative Culture Index .181 .341 .104 .531 .598
Innovative - Creativity Index -.500 .265 -.364 -1.888 .065
5 (Constant) .326 1.229 .265 .792
Gender .308 .252 .163 1.223 .228
Level of Education of Participants -.092 .099 -.150 -.926 .359
Age of Participant -.039 .137 -.054 -.285 .777
occupation of the participant .051 .082 .093 .621 .538
Page 88
84
Job Grade of Participant .051 .139 .064 .367 .715
Tenure -.055 .106 -.112 -.520 .605
Organisational Culture -.011 .025 -.118 -.427 .671
Innovative Culture Index .284 .344 .163 .825 .413
Innovative - Creativity Index -.337 .285 -.246 -1.185 .242
Dominant Characteristics .374 .226 .264 1.654 .105
Management Style .260 .267 .194 .974 .335
Organisation Glue .311 .236 .212 1.315 .195
a. Dependent Variable: Organisational Adaptability
Curve Estimations
Curve Estimation Model Summary and Parameter Estimates i. Model Summary regressing Creativity and Innovation against Organisational Adaptability
R R Square Adjusted R Square Std. Error of the Estimate
.430 .185 .172 .794
The independent variable is Innovative - Creativity Index.
ANOVA
Sum of Squares df Mean Square F Sig.
Regression 9.144 1 9.144 14.513 .000
Residual 40.322 64 .630 Total 49.466 65 The independent variable is Innovative - Creativity Index.
Coefficients
Unstandardized Coefficients
Standardized Coefficients
t Sig. B Std. Error Beta
Innovative - Creativity Index -.618 .162 -.430 -3.810 .000
(Constant) 4.471 .532 8.397 .000
Page 89
85
ii. Dependent Variable: Organisational Adaptability ; Independent variable is Dominant Characteristics
Equation
Model Summary Parameter Estimates
R Square F df1 df2 Sig. Constant b1
Linear .273 23.265 1 62 .000 .825 .781
The independent variable is Dominant Characteristics.
ANOVA
Sum of Squares df Mean Square F Sig.
Regression 215.405 1 215.405 23.265 .000
Residual 574.032 62 9.259 Total 789.438 63 The independent variable is Dominant Characteristics.
Page 90
86
iii. Model Summary with Creativity and Innovation as Dependent variable
R R Square Adjusted R
Square Std. Error of the Estimate
.656 .430 .420 8.418
The independent variable is Innovative Culture Index.
ANOVA
Sum of Squares df Mean Square F Sig.
Regression 3053.068 1 3053.068 43.084 .000
Residual 4039.237 57 70.864 Total 7092.305 58 The independent variable is Innovative Culture Index.
Coefficients
Unstandardized Coefficients Standardized Coefficients
t Sig. B Std. Error Beta
Innovative Culture Index .358 .054 .656 6.564 .000
(Constant) 5.159 8.250 .625 .534
Page 91
87
iv. Model Summary with Innovation Culture as Dependent Variable
R R Square Adjusted R Square Std. Error of the Estimate
.564 .318 .306 17.022
The independent variable is Organisational Culture.
ANOVA
Sum of Squares df Mean Square F Sig.
Regression 7555.417 1 7555.417 26.076 .000
Residual 16225.962 56 289.749
Total 23781.379 57
The independent variable is Organisational Culture.
Coefficients
Unstandardized Coefficients
Standardized
Coefficients
t Sig. B Std. Error Beta
Organisational Culture 1.225 .240 .564 5.106 .000
(Constant) 54.238 18.866 2.875 .006
Page 92
88
a. Exploratory Factor Analysis with Varimax Rotation f or the Innovation Culture Construct
Instrument.
Communalities
Initial Extraction
Over the next three years we could change up to 50 percent of the processes that support our current
business model
1.000 .820
We have already put measurable resources towards implementation of new process, developing of
new markets and products.
1.000 .898
We are prepared to discontinue products and services that only marginally serve our purposes in
efforts to build capacity for new products and services
1.000 .875
We have a good record of rolling out new product and service offerings 1.000 .873
We are prepared to launch a new product/service even when it is not clear how successful it may be 1.000 .862
There is an understanding that mistakes will occur or an opportunity will not occur as expected 1.000 .887
We can quickly make changes to our products and services based on customer or competitive reaction 1.000 .875
We are quick to turnaround ideas into marketable products/services. 1.000 .912
Project managers have the autonomy to speed up, slow, down, change course or cancel projects
altogether
1.000 .872
Page 93
89
My contributions are valued by my fellow employees 1.000 .792
There is trust and mutual respect currently between management and employees 1.000 .843
I am also consulted in the strategic planning process 1.000 .886
Communications are open and honest 1.000 .782
We have an effective environment for collaboration/teamwork within & between departments 1.000 .740
As an employee, I feel enabled to generate ideas 1.000 .837
I feel obligated to help create the future for this organization 1.000 .834
I am encouraged to challenge decisions and actions in this organization if I think there is a better way 1.000 .860
The training I take is related to supporting strategic initiatives as opposed to being general in nature 1.000 .800
The training I receive is directed at delivering value 1.000 .815
There is an expectation to develop new skills, capabilities and knowledge directed toward supporting
innovation in this organization
1.000 .715
Continued organizational learning is encouraged and there is time/opportunity to improve skills and
capabilities
1.000 .778
The management team acts as coaches and facilitators in support of training 1.000 .806
Managers possess the appropriate leadership qualities to support innovation 1.000 .738
I am empowered to apply what we have learned 1.000 .903
When I find out something important about a customer or competitor that may affect others in the
organization, I know what to do with that information
1.000 .850
I have a good understanding of the value chain and vital interests concerning our division/organization 1.000 .835
We know which customers that will provide the most solid foundation for future growth 1.000 .868
We have up to date competitor activity information. 1.000 .665
We take time to understand our competitive environment to the point where we can anticipate industry
shifts
1.000 .895
The knowledge that we generate allows us to create a differential advantage in the marketplace 1.000 .876
Innovation and continuous improvement is our underlying culture and not just a word 1.000 .800
Our business model is premised on the basis of strategic intent 1.000 .732
Our senior managers are able to effectively cascade the innovation message throughout the
organization
1.000 .812
This organization management team is diverse in their thinking in that they have different views as to
how things should be done
1.000 .792
There is a coherent set of goals and objectives that have been articulated for leader value projects. 1.000 .839
Creativity and innovation are core values in this organization 1.000 .870
We have continuous strategic initiatives aimed at gaining a competitive advantage 1.000 .764
I consider myself to be a creative innovative person 1.000 .814
Page 94
90
Our organization is more likely to succeed if employees are allowed to be unique and express this
uniqueness in their daily activities
1.000 .858
I view uncertainty as opportunity, and not as a risk 1.000 .841
This organisation uses my creativity ti its benefit 1.000 .806
I am given the time/opportunity to express myself creatively 1.000 .857
I am prepared to do things differently if given the chance to do so 1.000 .833
Extraction Method: Principal Component Analysis.
Page 95
1
Total Variance Explained
Compon
ent
Initial Eigenvalues Extraction Sums of Squared Loadings Rotation Sums of Squared Loadings
Total % of Variance Cumulative % Total % of Variance Cumulative % Total % of Variance Cumulative %
1 13.335 31.011 31.011 13.335 31.011 31.011 8.127 18.900 18.900
2 4.913 11.424 42.436 4.913 11.424 42.436 6.553 15.239 34.138
3 3.705 8.617 51.053 3.705 8.617 51.053 3.348 7.785 41.924
4 3.451 8.026 59.079 3.451 8.026 59.079 3.170 7.372 49.295
5 2.820 6.558 65.636 2.820 6.558 65.636 2.959 6.881 56.177
6 2.098 4.879 70.516 2.098 4.879 70.516 2.755 6.406 62.583
7 1.597 3.714 74.230 1.597 3.714 74.230 2.562 5.958 68.541
8 1.399 3.253 77.483 1.399 3.253 77.483 2.413 5.612 74.153
9 1.229 2.859 80.342 1.229 2.859 80.342 2.021 4.699 78.852
10 1.061 2.469 82.811 1.061 2.469 82.811 1.702 3.959 82.811
11 .971 2.259 85.070
……
………
43 -5.255E-16 -1.222E-15 100.000
Extraction Method: Principal Component Analysis.
Page 96
1
b. Factor Analysis for the Creativity and Innovation Index
Communalities
Initial Extraction
what proportion of the people in your division readily accepts and adjust to these changes quickly 1.000 .669
How good a job do people in your division do in coping with emergence situations 1.000 .775
We have introduced a wide range of new and quality Products than competitors in 2 years 1.000 .598
Our products are viewed as original and new by customers 1.000 .676
Our recent products are only minor changes to the existing product ranges 1.000 .637
We are improving our business processes 1.000 .726
During the past 2 years our company has changed ways of managing the business 1.000 .828
We are have introduced new methods to improve our efficiencies in the last 2 years 1.000 .634
The technology of our main factory machinery is up to date 1.000 .572
In comparison with our competitors we are late in adopting new factory techonologies (R) 1.000 .818
The nature of our manufacturing process in new compared to our competitors 1.000 .704
In comparison to our competitors our company is faster in introducing new ranges and designs into the market
1.000 .747
We have a better marketing strategy with regards to products and services than our competitors 1.000 .727
In the past 2 years we have expanded our sales product range 1.000 .775
In comparison to our competitors our company has a lower success rate in introduced new and good products into the market (R)
1.000 .695
Employees are encouraged to develop new ways of doing business 1.000 .635
Upholding and reviving traditional ways of doing business is the best for this company (r) 1.000 .529
We are willing to embrace new ways of doing business 1.000 .594
When we cannot solve problems the normal ways, we seek newer ways of handling the situation 1.000 .652
We do not tolerate individuals who come up with ideas or try to change the traditional ways of doing business
1.000 .758
Extraction Method: Principal Component Analysis.
Total Variance Explained showing five factors
Compon
ent
Initial Eigenvalues Extraction Sums of Squared Loadings Rotation Sums of Squared Loadings
Total
% of
Variance
Cumulative
% Total
% of
Variance Cumulative % Total % of Variance
Cumulative
%
1 6.943 34.716 34.716 6.943 34.716 34.716 5.280 26.402 26.402
2 2.186 10.928 45.644 2.186 10.928 45.644 2.863 14.317 40.719
3 1.880 9.398 55.043 1.880 9.398 55.043 2.226 11.132 51.850
4 1.378 6.892 61.934 1.378 6.892 61.934 1.928 9.640 61.491
5 1.361 6.807 68.741 1.361 6.807 68.741 1.450 7.251 68.741
6 .960 4.802 73.543
18 .137 .684 99.309
19 .097 .483 99.792
20 .042 .208 100.000
Extraction Method: Principal Component Analysis.
Page 97
2
APPENDIX 2
Survey Materials
Consent to Participate in a Research Study
My name is Sandra Gudyanga, I am a Masters student at the University of Zimbabwe:
Psychology Department conducting Research for my dissertation on the relationship between
Organisational Culture and Innovation and Creativity. I have obtained permission from the
Human Resources Department in your Division to conduct the research at your Organisation.
The questionnaire below is designed to find understand your organisational culture and work
environment. Therefore response options range from 1 ‘strongly disagree to 5 ‘strongly agree’
You are therefore are kindly requested to provide information asked for in section A.
Biographical details and respond to Survey items in section B. There is no right or wrong
answers so complete the questions as honestly as possible. Please ensure that you place a tick on
your response appropriately. The information will be used for academic purposes only.
Your responses will be treated with the maximum confidentiality; therefore, therefore your name
will not be required. Questionnaires are to be returned to your respective HR Departments within
one week of receipt.
If you consent to the request for participation you may proceed to respond to the item questions.
………………………..
SS Gudyanga
Page 98
3
SECTION A. DEMOGRAPHICS Respondent information please answer appropriately Gender: Female ……. Male ………… Educational Qualifications: O’ levels …. A’ levels ……. Diploma …… Degree ….. Post grad … Age ……….. Field of Work ……………………………… Tenure (in years) ……………………………
Page 99
4
SECTION B. STUDY INSTRUMENT
Stro
ng
ly d
isagree
disag
ree
no
t sure
agree
stron
gly
agree
Organisational Adaptation
A1 People in my division do a good job in anticipation problems
A2
People in my organisation adapt fast when newer ways are discovered to organise work and newer
equipment
A3
More than half of the people in my division quickly accepts changes made in the routines or in the
equipment
A4
A smaller proportion- less than half of the people in your division readily accepts and adjust to
changes in strategies, management and ways of doing things quickly
Creativity and Innovation Index
IC1 We have introduced a wide range of new and quality Products than competitors in 2 years
IC2 Our products are viewed as original and new by customers
IC3 Our recent products are only minor changes to the existing product ranges
IC4 We are improving our business processes
IC5 During the past 2 years our company has changed ways of managing the business
IC6 We are have introduced new methods to improve our efficiencies in the last 2 years
IC7 The technology of our main factory machinery is up to date
IC8 In comparison with our competitors we are late in adopting new factory techonologies (R)
IC9 The nature of our manufacturing process in new compared to our competitors
IC10
In comparison to our competitors our company is faster in introducing new ranges and designs into the
market
IC11 We have a better marketing strategy with regards to products and services than our competitors
IC12 In the past 2 years we have expanded our sales product range
IC13
In comparison to our competitors our company has a lower success rate in introduced new and good
products into the market (R)
IC14 Employees are encouraged to develop new ways of doing business
IC15 Upholding and reviving traditional ways of doing business is the best for this company (r)
IC16 We are willing to embrace new ways of doing business
IC17 When we cannot solve problems the normal ways, we seek newer ways of handling the situation
IC18
We do not tolerate individuals who come up with ideas or try to change the traditional ways of doing
business
Page 100
5
OCAIS
tron
gly
disag
ree
disag
ree
no
t sure
agree
stron
gly
agree
OC1
The organization is a very personal place. It is like an extended family. People seem to share a lot of
themselves.
OC2
The organization is a very dynamic entrepreneurial place. People are willing to stick their necks out
and take risks.
OC3
The organization is very results oriented. A major concern is with getting the job done. People are
very competitive and achievement oriented.
OC4
The organization is a very controlled and structured place. Formal procedures generally govern what
people do.
OC5
The leadership in the organization is generally considered to exemplify mentoring, facilitating, or
nurturing.
OC6
The leadership in the organization is generally considered to exemplify entrepreneurship, innovating,
or risk taking.
OC7
The leadership in the organization is generally considered to exemplify a no-nonsense, aggressive,
results-oriented focus.
OC8
The leadership in the organization is generally considered to exemplify coordinating, organizing, or
smooth-running efficiency.
OC9 The management style in the organization is characterized by teamwork, consensus, and participation.
OC10
The management style in the organization is characterized by individual risk-taking, innovation,
freedom, and uniqueness.
OC11
The management style in the organization is characterized by hard-driving competitiveness, high
demands, and achievement.
OC12
The management style in the organization is characterized by security of employment, conformity,
predictability, and stability in relationships.
OC13
The glue that holds the organization together is loyalty and mutual trust. Commitment to this
organization runs high.
OC14
The glue that holds the organization together is commitment to innovation and development. There is
an emphasis on being on the cutting edge.
OC15
The glue that holds the organization together is the emphasis on achievement and goal
accomplishment. Aggressiveness and winning are common themes.
OC16
The glue that holds the organization together is formal rules and policies. Maintaining a smooth-
running organization is important.
OC17 The organization emphasizes human development. High trust, openness, and participation persist.
OC18
The organization emphasizes acquiring new resources and creating new challenges. Trying new things
and prospecting for opportunities are valued.
OC19
The organization emphasizes competitive actions and achievement. Hitting stretch targets and winning
in the marketplace are dominant.
OC20
The organization emphasizes permanence and stability. Efficiency, control and smooth operations are
important.
OC21
The organization defines success on the basis of the development of human resources, teamwork,
employee commitment, and concern for people.
OC22
The organization defines success on the basis of having the most unique or newest products. It is a
product leader and innovator.
OC23
The organization defines success on the basis of winning in the marketplace and outpacing the
competition. Competitive market leadership is key.
OC24
The organization defines success on the basis of efficiency. Dependable delivery, smooth scheduling
and low-cost production are critical.
Preferred culture
Rank up
to 4
A
B
C
D
To achieve strategic intends, and to adapt to changes in this intensely competitive environment, a culture that values the following is
preferable : with four (4) being the best
Mentorship, works as a family, good morals, paternal, good Human resources management
Flexible, externally oriented, creativity, innovation, growth focus and entreprenuership
Market shares, competitiveness, out-competing competitors
Efficiency, timeliness and smooth functioning
Page 101
6
Innovation Culture ConstructS
tron
gly
disag
ree
disag
ree
no
t sure
agree
stron
gly
agree
C1
Over the next three years we could change up to 50 percent of the processes that support our current
business model
C2
We have already put measurable resources towards implementation of new process, developing of
new markets and products.
C3
We are prepared to discontinue products and services that only marginally serve our purposes in
efforts to build capacity for new products and services
C4 We have a good record of rolling out new product and service offerings
C5 We are prepared to launch a new product/service even when it is not clear how successful it may be
C6 There is an understanding that mistakes will occur or an opportunity will not occur as expected
C7 We can quickly make changes to our products and services based on customer or competitive reaction
C8 We are quick to turnaround ideas into marketable products/services.
C9
Project managers have the autonomy to speed up, slow, down, change course or cancel projects
altogether
C10 My contributions are valued by my fellow employees
C11 There is trust and mutual respect currently between management and employees
C12 I am also consulted in the strategic planning process
C13 Communications are open and honest
C14 We have an effective environment for collaboration/teamwork within & between departments
C15 As an employee, I feel enabled to generate ideas
C16 I feel obligated to help create the future for this organization
C17 I am encouraged to challenge decisions and actions in this organization if I think there is a better way
C18 The training I take is related to supporting strategic initiatives as opposed to being general in nature
C19 The training I receive is directed at delivering value
C20
There is an expectation to develop new skills, capabilities and knowledge directed toward supporting
innovation in this organization
Page 102
7
C21
Continued organizational learning is encouraged and there is time/opportunity to improve skills and
capabilities
C22 The management team acts as coaches and facilitators in support of training
C23 Managers possess the appropriate leadership qualities to support innovation
C24 I am empowered to apply what we have learned
C25
When I find out something important about a customer or competitor that may affect others in the
organization, I know what to do with that information
C26 I have a good understanding of the value chain and vital interests concerning our division/organization
C27 We know which customers that will provide the most solid foundation for future growth
C28 We have up to date competitor activity information.
C29
We take time to understand our competitive environment to the point where we can anticipate
industry shifts
C30 The knowledge that we generate allows us to create a differential advantage in the marketplace
C31 Innovation and continuous improvement is our underlying culture and not just a word
C32 Our business model is premised on the basis of strategic intent
C33
Our senior managers are able to effectively cascade the innovation message throughout the
organization
C34
This organization management team is diverse in their thinking in that they have different views as to
how things should be done
C35 There is a coherent set of goals and objectives that have been articulated for leader value projects.
C36 Creativity and innovation are core values in this organization
C37 We have continuous strategic initiatives aimed at gaining a competitive advantage
C38 I consider myself to be a creative innovative person
C39
Our organization is more likely to succeed if employees are allowed to be unique and express this
uniqueness in their daily activities
C40 I view uncertainty as opportunity, and not as a risk
C41 This organisation uses my creativity ti its benefit
C42 I am given the time/opportunity to express myself creatively
C43 I am prepared to do things differently if given the chance to do so