Page 1
Advanced Safety Assessment
Methodologies: extended PSA
1 / 142
ASAMPSA_E
"NUCLEAR FISSION"
Safety of Existing Nuclear Installations
Contract 605001
Guidance document on practices to model and implement EARTHQUAKE
hazards in extended PSA (final version)
Volume 1
Reference ASAMPSA_E
Technical report ASAMPSA_E / WP21 / D50.15/ 2017-33 volume 1
Reference IRSN PSN/RES/SAG/2017-00004
K. Decker (UNIVIE), K. Hirata (JANSI), P. Groudev (INRNE)
Period covered: from 01/03/2015 to 31/12/2016 Actual submission date: 06/07/2016
Start date of ASAMPSA_E: 01/07/2013 Duration: 42 months
WP No: 21 Lead topical coordinator : K. Decker His organization name : UNIVIE
Project co-funded by the European Commission Within the Seventh Framework Programme (2013-2016)
Dissemination Level
PU Public Yes
RE Restricted to a group specified by the partners of the ASAMPSA_E pro-
ject
No
CO Confidential, only for partners of the ASAMPSA_E project No
Page 2
Advanced Safety Assessment
Methodologies: extended PSA
2 / 142
ASAMPSA_E
ASAMPSA_E Quality Assurance page
Partners responsible of the document : UNIVIE - IRSN
Nature of document Technical report
Reference(s) Technical report ASAMPSA_E/ WP21 / D50.15/ 2017-33 vol1
Rapport IRSN-PSN-RES/ SAG/2017-00004
Title Guidance document on practices to model and implement EARTHQUAKE
hazards in extended PSA (final version) - Volume 1
Author(s) K. Decker (UNIVIE), K. Hirata (JANSI), P. Groudev (IRNE)
Delivery date 31 Dec 2017
Topical area Natural hazards, seismic hazard assessment
For Journal & Conf. papers No
Summary :
The current report provides guidance for the assessment of seismotectonic hazards in level 1&2 PSA. The objective
is to review existing guidance, identify methodological challenges, and to propose novel guidance on key issues.
Guidance for the assessment of vibratory ground motion and fault capability comprises the following :
listings of data required for the hazard assessment and methods to estimate data quality and completeness;
in-depth discussion of key input parameters required for hazard models;
discussions on commonly applied hazard assessment methodologies;
references to recent advances of science and technology.
Guidance on the assessment of correlated or coincident hazards comprises of chapters on :
screening of correlated hazards;
assessment of correlated hazards (natural and man-made);
assessment of coincident hazards.
Visa grid
Main author(s) : Verification Approval (Coordinator)
Name (s) K. Decker E. Raimond
Date 2017-02-15 2017-03-02
Page 3
Advanced Safety Assessment
Methodologies: extended PSA
Report IRSN/PSN-RES-SAG 2017-00004 Technical report ASAMPSA_E/ WP21/ D50.15/ 2017-33 vol1 3 / 142
ASAMPSA_E
MODIFICATIONS OF THE DOCUMENT
Version Date Authors
Pages or para-
graphs modified
Description or comments
V1 06-07-2015 K. Decker (Univie) All Based on the UNIVIE prelim-
inary proposal and the
ASAMPSA_E topical phone
conference 2015-04-27.
V2 20-05-2016 K. Decker (Univie)
Kazuta Hirarta (Jansi)
All
Based on response of the
Paris ASAMPSA_E Meeting
11-2015 and partners’ input.
V3 11-07-2016 E. Raimond (IRSN) All Editorial corrections after
“approval review”.
V4 15-02-2017 K. Decker (Univie) All Based on reviews by S. Baize
and O. Scotty (IRSN)
LIST OF DIFFUSION
European Commission (Scientific Officer)
Name First name Organization
Passalacqua Roberto EC
ASAMPSA_E Project management group (PMG)
Name First name Organization
Raimond Emmanuel IRSN Project coordinator
Guigueno Yves IRSN WP10 coordinator
Decker Kurt UNIVIE WP21 coordinator
Klug Joakim LRC WP22 coordinator until 2015-10-31
Kumar Manorma LRC WP22 coordinator from 2015-11-01
Wielenberg Andreas GRS WP30 coordinator until 2016-03-31
Löffler Horst GRS WP40 coordinator WP30 coordinator from 2016-04-01
E
REPRESENTATIVES OF ASAMPSA_E PARTNERS
Name First name Organization
Grindon Liz AMEC NNC
Mustoe Julian AMEC NNC
Cordoliani Vincent AREVA
Name First name Organization
Dirksen Gerben AREVA
Godefroy Florian AREVA
Kollasko Heiko AREVA
Page 4
Advanced Safety Assessment
Methodologies: extended PSA
Report IRSN/PSN-RES-SAG 2017-00004 Technical report ASAMPSA_E/ WP21/ D50.15/ 2017-33 vol1 4 / 142
ASAMPSA_E
Name First name Organization
Michaud Laurent AREVA
Hasnaoui Chiheb AREXIS
Hurel François AREXIS
Schirrer Raphael AREXIS
De Gelder Pieter Bel V
Gryffroy Dries Bel V
Jacques Véronique Bel V
Van Rompuy Thibaut Bel V
Cazzoli Errico CCA
Vitázková Jirina CCA
Passalacqua Roberto EC
Banchieri Yvonnick EDF
Benzoni Stéphane EDF
Bernadara Pietro EDF
Bonnevialle Anne-Marie EDF
Brac Pascal EDF
Coulon Vincent EDF
Gallois Marie EDF
Henssien Benjamin EDF
Hibti Mohamed EDF
Jan Philippe EDF
Lopez Julien EDF
Nonclercq Philippe EDF
Panato Eddy EDF
Parey Sylvie EDF
Romanet François EDF
Rychkov Valentin EDF
Vasseur Dominique EDF
Burgazzi Luciano ENEA
Hultqvist Göran FKA
Karlsson Anders FKA
Ljungbjörk Julia FKA
Pihl Joel FKA
Loeffler Horst GRS
Mildenberger Oliver GRS
Sperbeck Silvio GRS
Tuerschmann Michael GRS
Wielenberg Andreas GRS
Benitez Francisco Jose IEC
Del Barrio Miguel A. IEC
Serrano Cesar IEC
Apostol Minodora ICN
Nitoi Mirela ICN
Groudev Pavlin INRNE
Stefanova Antoaneta INRNE
Andreeva Marina INRNE
Petya Petrova INRNE
Armingaud François IRSN
Bardet Lise IRSN
Baumont David IRSN
Bonnet Jean-Michel IRSN
Bonneville Hervé IRSN
Clement Christophe IRSN
Corenwinder François IRSN
Denis Jean IRSN
Duflot Nicolas IRSN
Duluc Claire-Marie IRSN
Dupuy Patricia IRSN
Durin Thomas IRSN
Georgescu Gabriel IRSN
Guigueno Yves IRSN
Guimier Laurent IRSN
Name First name Organization
Lanore Jeanne-Marie IRSN
Laurent Bruno IRSN
Pichereau Frederique IRSN
Rahni Nadia IRSN
Raimond Emmanuel IRSN
Rebour Vincent IRSN
Sotti Oona IRSN
Volkanovski Andrija JSI
Prošek Andrej JSI
Alzbutas Robertas LEI
Matuzas Vaidas LEI
Rimkevicius Sigitas LEI
Häggström Anna LRC
Klug Joakim LRC
Kumar Manorma LRC
Olsson Anders LRC
Borysiewicz Mieczyslaw NCBJ
Kowal Karol NCBJ
Potempski Slawomir NCBJ
La Rovere Stephano NIER
Vestrucci Paolo NIER
Brinkman Hans (Johannes L.) NRG
Kahia Sinda NRG
Bareith Attila NUBIKI
Lajtha Gabor NUBIKI
Siklossy Tamas NUBIKI
Morandi Sonia RSE
Caracciolo Eduardo RSE
Dybach Oleksiy SSTC
Gorpinchenko Oleg SSTC
Claus Etienne TRACTEBEL
Dejardin Philippe TRACTEBEL
Grondal Corentin TRACTEBEL
Mitaille Stanislas TRACTEBEL
Oury Laurence TRACTEBEL
Zeynab Umidova TRACTEBEL
Yu Shizhen TRACTEBEL
Bogdanov Dimitar TUS
Ivanov Ivan TUS
Kaleychev TUS
Holy Jaroslav UJV
Hustak Stanislav UJV
Jaros Milan UJV
Kolar Ladislav UJV
Kubicek Jan UJV
Decker Kurt UNIVIE
Halada Peter VUJE
Prochaska Jan VUJE
Stojka Tibor VUJE
REPRESENTATIVE OF ASSOCIATED PARTNERS (Ex-
ternal Experts Advisory Board (EEAB))
Name First name Company
Hirata Kazuta JANSI
Hashimoto Kazunori JANSI
Inagaki Masakatsu JANSI
Yamanana Yasunori TEPCO
Coyne Kevin US-NRC
González Michelle M. US-NRC
Page 5
Guidance document on practices
to model and implement EARTHQUAKE hazards in extended PSA (final version) - Volume 1
Report IRSN/PSN-RES/SAG/ 2017-00004 Technical report ASAMPSA_E/ WP21/ D50.15/ 2017-33 vol1 5 / 142
ASAMPSA_E
EXECUTIVE SUMMARY
The report provides guidance on how to derive quantitative values for seismotectonic hazards (vibratory ground
motion and fault capability) for the implementation and use in level 1&2 PSA. The objective is to review existing
guidance, identify good practices and challenges in hazard assessment, and provide links to relevant regulatory,
technical, and scientific literature. References to recent advances of science and technology are included in all
chapters. In addition, novel guidance is proposed for (1) the treatment of some key issues which have large im-
pacts on the hazard results, and (2) the identification and assessment of hazard combinations (correlated and
coincident hazards).
(1) Guidance on seismic hazard assessment focuses on:
o a detailed description of the data required as inputs for seismic hazard assessment including site-specific
information from geosciences and methods for estimating data quality and completeness; the report par-
ticularly identifies the need to critically review earthquake data and to develop reliable data to charac-
terize faults in the surrounding of NPPs; these needs derive from fact that most parts of Europe are intra-
plate areas with slow to very slow faults, which typically produce earthquakes at recurrence intervals of
thousands to ten thousands of years while earthquake catalogues only span few hundred years;
o guidance and in-depth discussion is further provided on how to obtain the key input parameters such as
seismic sources, ground motion prediction equations, maximum magnitude, and lower bound magnitude;
o the report finally provides references to guidance on commonly applied hazard assessment methodologies
(Probabilistic and Deterministic Seismic Hazard Assessment, Probabilistic Fault Displacement Analysis) and
discussions of the associated uncertainties and methodological limits; the most important limitation to
probabilistic hazard assessments is seen in the fact that traditional PSHA heavily relies on the extrapola-
tion of short records of earthquake data to the very low occurrence probabilities required as input pa-
rameters for PSA (10-4 to 10-7 per year).
(2) Novel guidance on hazards combinations considers both, correlated and coincident hazards. The report pro-
vides guidance on the screening of correlated natural and man-made hazards, the assessment of the most im-
portant correlated hazards, and the assessment of coincident (contemporaneous) hazards.
Page 6
Guidance document on practices
to model and implement EARTHQUAKE hazards in extended PSA (final version) - Volume 1
Report IRSN/PSN-RES/SAG/ 2017-00004 Technical report ASAMPSA_E/ WP21/ D50.15/ 2017-33 vol1 6 / 142
ASAMPSA_E
ASAMPSA_E PARNTERS
The following table provides the list of the ASAMPSA_E partners involved in the development of this document.
1 Institute for Radiological Protection and Nuclear Safety IRSN France
2 Gesellschaft für Anlagen- und Reaktorsicherheit mbH GRS Germany
3 AMEC NNC Limited AMEC NNC United Kingdom
4 Ricerca sul Sistema Energetico RSE S.p.A. Italy
5 Lloyd’s Register Consulting LLOIYD’S Sweden
6 Nuclear Research Institute Rez pl UJV Czech
7 Universität Wien UNIVIE Austria
8 Cazzoli Consulting CCA Switzerland
9 Italian National Agency for New Technologies, Energy and the Sustainable Economic Development
ENEA Italy
10 Nuclear Research and consultancy Group NRG Nederland
11 IBERDROLA Ingeniería y Construcción S.A.U IEC Spain
12 Electricité de France EDF France
13 Lietuvos energetikos institutas
(Lithuanian Energy Institute) LEI Lithuania
14 NUBIKI NUBIKI Hungary
15 Forsmark kraftgrupp AB FKA Sweden
16 AREVA NP SAS France AREVA NP SAS France
17 NCBJ Institute NCBJ Poland
18 State Scientific and Technical Center for Nuclear and Radiation Safety” SSTC Ukraine
19 VUJE VUJE Slovakia
20 NIER Ingegneria NIER Italy
21 VGB PowerTech e. V VGB Germany
22 TRACTEBEL ENGINEERING S.A. TRACTEBEL Belgium
23 BeL V BeL V Belgium
24 Institut Jozef Stefan JSI Slovenia
25 Institute of nuclear research and nuclear energy – Bulgarian Academia of science
INRNE Bulgaria
26 Regia Autonoma Pentru Activatati Nucleare Droberta Tr. Severin RA Suc INR Roumania
27 Technical University of Sofia – Research and Development Sector TUS Bulgaria
28 AREXIS S.A.R.L. AREXIS France
United States Nuclear Regulatory Commission US-NRC USA
Tokyo Electric Power Company TEPCO Japan
Japan Nuclear Safety Institute JANSI Japan
Page 7
Guidance document on practices
to model and implement EARTHQUAKE hazards in extended PSA (final version) - Volume 1
Report IRSN/PSN-RES/SAG/ 2017-00004 Technical report ASAMPSA_E/ WP21/ D50.15/ 2017-33 vol1 7 / 142
ASAMPSA_E
CONTENT
MODIFICATIONS OF THE DOCUMENT................................................................................................................................................. 3
LIST OF DIFFUSION ............................................................................................................................................................................ 3
Executive summary ........................................................................................................................................................................... 5
ASAMPSA_E Parnters ..................................................................................................................................................................... 6
Content .............................................................................................................................................................................................. 7
Glossary .......................................................................................................................................................................................... 10
Definitions ....................................................................................................................................................................................... 13
Existing guidance : key documents ................................................................................................................................................. 16
1 Introduction .................................................................................................................................................................................. 17
1.1 Scope and objectives ............................................................................................................................................................. 17
1.2 Potential impacts on the plant ................................................................................................................................................ 20
1.3 Lessons learned from past events .......................................................................................................................................... 22
1.3.1 Kozloduy NPP (Bulgaria) ........................................................................................................................... 22
1.3.2 Humbolt Bay NPP (California, USA) ......................................................................................................... 23
1.3.3 Perry NPP (Ohio, USA) .............................................................................................................................. 23
1.3.4 Metzamor NPP (Armenia) .......................................................................................................................... 23
1.3.5 Kashiwazaki Kariwa (Japan) ...................................................................................................................... 24
1.3.6 Fukishima-Daiichi (Japan) .......................................................................................................................... 25
1.3.7 Fukishima-Daini NPPs (Japan) ................................................................................................................... 26
1.3.8 Onagawa NPP (Japan) ................................................................................................................................ 27
1.3.9 Tokai NPP (Japan) ...................................................................................................................................... 28
1.3.10 NPP North Anna (Virginia, USA) ............................................................................................................ 28
1.3.11 Mühlheim-Kärlich (Germany) .................................................................................................................. 29
1.3.12 Tsuruga NPP (Japan) ................................................................................................................................ 29
1.3.13 Diablo Canyon (U.S.) ............................................................................................................................... 29
1.3.14 Krsko NPP (Slovenia) ............................................................................................................................... 30
2 Screening of seismotectonic hazards ............................................................................................................................................ 31
3 Database ....................................................................................................................................................................................... 34
3.1 Data for the assessment of seismotectonic hazards ............................................................................................................... 34
3.1.1 Data for assessing vibratory ground motion hazards .................................................................................. 34
Page 8
Guidance document on practices
to model and implement EARTHQUAKE hazards in extended PSA (final version) - Volume 1
Report IRSN/PSN-RES/SAG/ 2017-00004 Technical report ASAMPSA_E/ WP21/ D50.15/ 2017-33 vol1 8 / 142
ASAMPSA_E
3.1.2 Data for assessing surface faulting at the site (fault capability) .................................................................. 39
3.1.3 Data for assessing liquefaction and dynamic compaction ........................................................................... 41
3.1.4 Data for assessing permanent ground displacement.................................................................................... 42
3.2 Data sources .......................................................................................................................................................................... 43
3.2.1 Earthquake catalogues ................................................................................................................................ 43
3.2.2 Earthquake focal mechanisms and recent stress databases ......................................................................... 48
3.2.3 Seismogenic source and Active fault databases .......................................................................................... 51
3.2.4 Geological, topographical and geophysical data other than earthquakes .................................................... 53
3.2.5 Site-specific data including data from site-specific observation networks ................................................. 54
3.2.6 Operational event database of plants........................................................................................................... 54
3.3 Data completeness and quality assessment ............................................................................................................................ 55
3.3.1 Completeness of Earthquake data ............................................................................................................... 55
3.3.2 Completeness of active and capable fault data ............................................................................................ 64
4 Hazard assessment methodologies ............................................................................................................................................... 65
4.1 Output of the hazard assessment ........................................................................................................................................... 65
4.1.1 Probabilistic Seismic Hazard Analysis (PSHA) .......................................................................................... 65
4.1.2 Deterministic seismic hazard Analysis (DSHA) ......................................................................................... 69
4.1.3 Fault capabiltiy............................................................................................................................................ 69
4.2 Identification of key input parameters ................................................................................................................................... 70
4.2.1 Fault sources (active faults) ........................................................................................................................ 70
4.2.2 Seismic source zones (Zones of diffuse seismicity) .................................................................................... 75
4.2.3 Ground motion prediction equations ........................................................................................................... 78
4.2.4 Maximum magnitude (Mmax) ...................................................................................................................... 80
4.2.5 Lower Bound magnitude ............................................................................................................................. 83
4.3 Methods commonly applied. ................................................................................................................................................. 84
4.3.1 Probabilistic Seismic Hazard Analysis (PSHA) .......................................................................................... 84
4.3.2 Deterministic seismic hazard Analysis (DSHA) ......................................................................................... 86
4.3.3 Probabilistic fault displacement Analysis (PFDHA)................................................................................... 87
4.4 Uncertainty assessment ......................................................................................................................................................... 91
4.4.1 Probabilistic Seismic Hazard Analysis (PSHA) .......................................................................................... 91
4.4.2 Deterministic Seismic Hazard Analysis (DSHA) ....................................................................................... 93
4.4.3 Probabilistic fault displacement Analysis (PFDHA)................................................................................... 94
4.5 Methodological limits ............................................................................................................................................................ 94
4.6 Event modelling .................................................................................................................................................................... 97
4.7 Use of expert judgment ......................................................................................................................................................... 98
Page 9
Guidance document on practices
to model and implement EARTHQUAKE hazards in extended PSA (final version) - Volume 1
Report IRSN/PSN-RES/SAG/ 2017-00004 Technical report ASAMPSA_E/ WP21/ D50.15/ 2017-33 vol1 9 / 142
ASAMPSA_E
4.8 Advance of science and technology .................................................................................................................................... 102
5 Hazard combinations .................................................................................................................................................................. 103
5.1 Correlated hazards ............................................................................................................................................................... 104
5.2 Associated hazards .............................................................................................................................................................. 106
5.3 Screening of correlated hazards ........................................................................................................................................... 106
5.4 Methods for the assessment of hazard combinations ........................................................................................................... 108
5.5 Examples of hazard combinations ....................................................................................................................................... 114
5.6 Assessment of coincident hazards ....................................................................................................................................... 115
6 Conclusion and recommendations .............................................................................................................................................. 116
7 List of tables ............................................................................................................................................................................... 119
8 List of figures ............................................................................................................................................................................. 120
9 List of References....................................................................................................................................................................... 122
Page 10
Guidance document on practices
to model and implement EARTHQUAKE hazards in extended PSA (final version) - Volume 1
Report IRSN/PSN-RES/SAG/ 2017-00004 Technical report ASAMPSA_E/ WP21/ D50.15/ 2017-33 vol1 10 / 142
ASAMPSA_E
GLOSSARY
AEP Annual Exceedance Probability
AHEAD European Archive of Historical Earthquake Data
ARP Alarm Response Procedure
CCF Common Cause Failure
CDF Core Damage Frequency
CTM Centroid-Moment-Tensor (Earthquake)
DBE Design Basis Earthquake
DEC Design Extension Conditions
DEC-A DEC without fuel damage
DEC-B DEC with postulated fuel damage
DEM Digital Elevation Model
DG Diesel Generator
DPD Discrete Probability Distributions
DSG Design Safety Guide
DSHA Deterministic Seismic Hazard Assessment
EMSC European-Mediterranean Seismological Centre
ENSREG European Nuclear Safety Regulators Group
EOP Emergency Operating Procedure
EPRI Electric Power Research Institute
EPRI Electric Power Research Institute (U.S.)
EPZ Emergency Planning Zones
ETL Event Tree Linking
FDF Fuel Damage Frequency
FDSN International Federation of Digital Seismograph Networks
FTL Fault Tree Linking
GIS Geographical Information System
GMPE Ground Motion Prediction Equation
GPR Ground Penetrating Radar
GPS Global Positioning System
GR Gutenberg-Richter-Relation (Earthquake)
HCLPF High Confidence of Low Probability of Failure
HEP Human Error Probability
HFE Human Failure Events
HRA Human Reliability Analysis
IAEA International Atomic Energy Agency
IEMS-98 Earthquake intensity measured by the European Macroseismic Scale 1998
IESI-2007 Earthquake intensity measured by the Environmental Intensity Scale ESI-2007
IPEEE Individual Plant Examination of External Events
ISRS In Structure Response Spectra
ITC Informed Technical Community
Page 11
Guidance document on practices
to model and implement EARTHQUAKE hazards in extended PSA (final version) - Volume 1
Report IRSN/PSN-RES/SAG/ 2017-00004 Technical report ASAMPSA_E/ WP21/ D50.15/ 2017-33 vol1 11 / 142
ASAMPSA_E
KTA Kerntechnischer Ausschuss (Germany)
LBM Lower Bound Magnitude (=m0)
LERF Large Early Release Frequency
LIDAR Light Detection And Ranging (producing DEM data)
LOCA Loss of Coolant Accidents
LOOP Loss of Off-Site Power
MCS Monte Carlo Simulation
Mmax Maximum Magnitude
Mw Moment Magnitude (Earthquake)
NDC NPH Design Category
NPH Natural Phenomena Hazards
NPP Nuclear Power Plant
NPP Nuclear Power Plant
NR Near-region (25 km radius from NPP site)
NRC (US) Nuclear Regulatory Commission
NSC Nuclear Safety Commission, Japan
NUREG NUREG-Series Publications (U.S.NRC)
OBE Operational Base Earthquake
OECD Organisation for Economic Co-operation and Development
OECD/NEA Nuclear Energy Agency of OECD
PDF Probability Density Functions
PFDHA Probabilistic Fault Displacement Hazard Analysis
PFDHA Probabilistic Fault Displacement Hazard Analysis
PGA Peak Ground Acceleration
PGAH Peak Ground Acceleration in horizontal direction
PGAV Peak Ground Acceleration in vertical direction
POS Plant Operational State
PSA Probabilistic Safety Assessment
PSF Performance Shaping Factor
PSHA Probabilistic Seismic Hazard Analysis
PSR Periodic Safety Review
PTDHA Probabilistic Tectonic Deformation Hazard Analysis
PTDHA Probabilistic Tectonic Deformation Hazard Analysis
RE Region (50 km radius from NPP site)
RHWG Reactor Harmonization Working Group
RS Remote Sensing (satellite imagery)
SAM Severe Accident Management
SAR Safety Analysis Report
SBO Station Black Out
SFP Spent fuel Pool
SHA Seismic Hazard Analysis
SHARE Seismic Hazard Harmonization in Europe
SI NPP site (area under control of the licensee)
Page 12
Guidance document on practices
to model and implement EARTHQUAKE hazards in extended PSA (final version) - Volume 1
Report IRSN/PSN-RES/SAG/ 2017-00004 Technical report ASAMPSA_E/ WP21/ D50.15/ 2017-33 vol1 12 / 142
ASAMPSA_E
SMA Seismic Margin Assessment
SPSA Seismic Probabilistic Safety Assessment
SSC Structure System and Component
SSHAC Senior Seismic Hazard Analysis Committee
SV Site vicinity (5 km radius from NPP site)
TC Technical (or Scientific) Community
TCEF Temporal Course of Earthquake Frequency
TFI Technical Facilitator / Integrator (SSHAC)
TI Technical Integrator (SSHAC)
UHRS Uniform Hazard Response Spectrum
U.S.NRC U.S. Nuclear Regulatory Commission
USGS U.S. Geological Survey
VS30 Average shear wave velocity between 0 to 30 m depth of soil/rock
WENRA Western European Regulator's Association
WSM World Stress Map
Page 13
Guidance document on practices
to model and implement EARTHQUAKE hazards in extended PSA (final version) - Volume 1
Report IRSN/PSN-RES/SAG/ 2017-00004 Technical report ASAMPSA_E/ WP21/ D50.15/ 2017-33 vol1 13 / 142
ASAMPSA_E
DEFINITIONS
Accident Sequence Analysis
The process to determine the combinations of initiating events, safety functions, and system failures and successes that may lead to core damage or large early release.
Aleatory Uncertainty Uncertainty inherent in a random (stochastic) phenomenon reflected by modelling the phenomenon by a probabilistic approach. Aleatory uncertainty cannot be reduced by additional information or data.
Bounding Analysis Analysis that uses assumptions such that assessed outcome will meet or exceed the maximum severity of all credible outcomes.
Cliff Edge Effect
In a nuclear power plant, an instance of severely abnormal plant behavior caused by an abrupt transition from one plant status to another following a small deviation in a plant parameter, and thus a sudden large variation in plant conditions in response to a small variation in an input.
Dangerous Occurrence, Incident
A dangerous occurrence is an unplanned and undesired occurrence (incident) which has the potential to cause injury and which may or may not cause damage to proper-ty, equipment or the environment.
Design Basis
The range of conditions and events taken explicitly into account in the design of a facility, according to established criteria, such that the facility can withstand them without exceeding authorized limits by the planned operation of safety systems. Design basis requirements for existing European plants are prescribed by WENRA (2014a). Requirements include that that “The design basis shall be reviewed and updated during the lifetime of the plant”.
Design Basis External Events
The external event(s) or combination(s) of external events considered in the design basis of all or any part of a facility. According to WENRA (2014a, Issue T5.1) “A com-mon target value of frequency, not higher than 10–4 per annum, shall be used for each design basis event.”
Epistemic uncertainty
Uncertainty that is attributed to incomplete knowledge about a process or phenome-non which effects the ability to model it. Epistemic uncertainty is due to a variety of variable models to describe a phenomenon, diverging expert opinion, etc. It may be reduced by the acquisition of additional information and data.
Event Tree Analysis
An inductive technique that starts by hypothesizing the occurrence of basic initiating events and proceeds through their logical propagation to system failure events.
The event tree is the diagrammatic illustration of alternative outcomes of speci-fied initiating events.
Fault tree analysis considers similar chains of events, but starts at the other end (i.e. with the ‘results’ rather than the ‘causes’). The completed event trees and fault trees for a given set of events would be similar to one another.
External Event
An event originated outside a nuclear power plant that directly or indirectly causes an initiating event and may cause safety system failures or operator errors that may lead to core damage or large early release. Events such as earthquakes, tornadoes, and floods from sources outside the plant and fires from sources inside or outside the plant are considered external events. By historical convention, LOOP not caused by another external event is considered to be an internal event. According to NUREG 2122, the term external event is no longer used and has been replaced by the term external hazard.
Fault Tree Analysis
A deductive technique that starts by hypothesizing and defining failure events and systematically deduces the events or combinations of events that caused the failure events to occur.
The fault tree is the diagrammatic illustration of the events.
Event tree analysis considers similar chains of events, but starts at the other end (i.e. with the ‘causes’ rather than the ‘results’). The completed event trees and fault trees for a given set of events would be similar to one another.
External Hazard Analysis
The objective is to evaluate the frequency of occurrence of different severities or intensities of external events or natural phenomena (e.g., external floods or high winds).
Probabilistic Seismic Hazard Analysis (PSHA)
PSHA determines the probability of a seismic event that exceeds a certain ground motion (defined as horizontal / vertical acceleration and / or spectral accelerations) is determined through a probabilistic assessment.
Fragility The fragility of a structure, system or component (SSC) is the conditional probability
Page 14
Guidance document on practices
to model and implement EARTHQUAKE hazards in extended PSA (final version) - Volume 1
Report IRSN/PSN-RES/SAG/ 2017-00004 Technical report ASAMPSA_E/ WP21/ D50.15/ 2017-33 vol1 14 / 142
ASAMPSA_E
of its failure at a given hazard input level. In seismic hazard analysis the input is the severity of ground shaking induced by an earthquake.
Fragility Analysis
Estimation of the likelihood that a given component, system, or structure will cease to function at the occurrence of a dangerous occurrence of a certain severity.
In a PRA, fragility analysis identifies the components, systems, and structures susceptible to the effects of an external hazard and estimates their fragility pa-rameters. Those parameters are then used to calculate fragility (conditional probability of failure) of the component, system, or structure at a certain inten-sity level of the hazard event.
Fragility analysis considers all failure mechanisms due to the occurrence of an external hazard event and calculates fragility parameters for each mechanism. This is true whether the fragility analysis is used for an external flood hazard, fire hazard, high wind hazard, seismic hazard, or other external hazards. For exam-ple, for seismic events, anchor failure, structural failure, and systems interac-tions are some of the failure mechanisms that would be considered.
Fragility Curve
A graph that plots the likelihood that a component, system, or structure will fail ver-sus the increasing intensity of a hazard event.
In a PRA, fragility curves generally are used in seismic analyses and provide the conditional frequency of failure for structures, systems, or components as a func-tion of an earthquake-intensity parameter, such as peak ground acceleration.
Fragility curves also can be used in PRAs examining other hazards, such as high winds or external floods.
Hazard
In the current context hazard is referred to as a situation that poses a threat to nu-clear installations, life or health of humans in the installation, or the environment.
Internal hazards include equipment failures, human failures, flooding and fires internal to the plant.
External hazards include events such as flooding and fires external to the plant, tornadoes, earthquakes, and aircraft crashes.”
Hazard Analysis
The process to determine an estimate of the expected frequency of exceedance (over some specified time interval) of various levels of some characteristic measure of the intensity of a hazard (e.g., peak ground acceleration to characterize ground shaking from an earthquake). The time period of interest is often taken as 1 year, in which case the estimate is called the annual frequency of exceedance.
Hazard Curve See seismic hazard curve
Human Reliability Anal-ysis
A structured approach used to identify potential human failure events and to system-atically estimate the probability of those events using data, models, or expert judg-ment.
Individual plant exami-nation for external events (IPEEE)
While the "individual plant examination" takes into account events that could chal-lenge the design from things that could go awry internally (in the sense that equip-ment might fail because components do not work as expected), the "individual plant examination for external events" considers challenges such as earthquakes, internal fires, and high winds.
Initiating Event
An identified event that leads to anticipated operational occurrences or accident conditions.
This term (often shortened to initiator) is used in relation to event reporting and analysis, i.e. when such events have occurred. For the consideration of hypothet-ical events considered at the design stage, the term postulated initiating event is used.
Large early release The rapid, unmitigated release of air-borne fission products from the containment to the environment occurring before the effective implementation of off-site emergency response and protective actions such that there is a potential for early health effects.
Large early release frequency (LERF)
Expected number of large early releases per unit of time.
Loss of coolant accident (LOCA)
Those postulated accidents that result in a loss of reactor coolant at a rate in excess of the capability of the reactor makeup system from breaks in the reactor coolant pressure boundary, up to and including a break equivalent in size to the double-ended rupture of the largest pipe of the reactor coolant system.
Loss of Offsite Power (LOOP)
The loss of all power from the electrical grid to the plant. In a PSA/PRA, loss of offsite power (LOOP) is referred to as both an initiating event and an accident sequence class. As an initiating event, LOOP to the plant can be a result of a weather-related fault, a grid-centered fault, or a plant-centered fault. During an accident sequence, LOOP can be a random failure. Generally, LOOP is con-sidered to be a transient initiating event.
Page 15
Guidance document on practices
to model and implement EARTHQUAKE hazards in extended PSA (final version) - Volume 1
Report IRSN/PSN-RES/SAG/ 2017-00004 Technical report ASAMPSA_E/ WP21/ D50.15/ 2017-33 vol1 15 / 142
ASAMPSA_E
Postulated Initiating Event (PIE)
An event identified during design as capable of leading to anticipated operational occurrences or accident conditions.
The primary causes of postulated initiating events may be credible equipment failures and operator errors (both within and external to the facility) or human induced or natural events.
Screening A process that distinguishes items that should be included or excluded from an analy-sis based on defined criteria.
Screening criteria The values and conditions used to determine whether an item is a negligible contribu-tor to the probability of an accident sequence or its consequences.
Seismic Hazard Analysis (SHA)
A process used to assess the hazards of seismic events. Assessments may use deter-ministic methods, probabilistic methods, or combinations of both. Probabilistic assessments determine the probability of occurrence of different ground shaking severities. These probabilities are used as input parameters to the model used to assess the potential effects on the plant. Deterministic seismic hazard assessment determines the strongest possible ground shaking parameters at a site from the largest earthquake that is regarded possible to occur at a certain fault or in a seismic zone.
Seismic Hazard Curve A plot of the exceedance frequency (annual probability of exceedance) versus the level of vibratory ground motion denoted by peak ground acceleration, spectral ac-celeration or other values.
Sensitivity Analysis
A quantitative examination of how the behavior of a system varies with change, usu-ally in the values of the governing parameters.
A common approach is parameter variation, in which the variation of results is investigated for changes in the value of one or more input parameters within a reasonable range around selected reference or mean values, and perturbation analysis, in which the variations of results with respect to changes in the values of all the input
Severe accident A type of accident that may challenge safety systems at a level much higher than expected.
Structures, Systems And Components (SSCs)
A general term encompassing all of the elements (items) of a facility or activity which contribute to protection and safety, except human factors.
Structures are the passive elements: buildings, vessels, shielding, etc.
A system comprises several components, assembled in such a way as to perform a specific (active) function.
A component is a discrete element of a system. Examples of components are wires, transistors, integrated circuits, motors, relays, solenoids, pipes, fittings, pumps, tanks and valves.
Uncertainty See Aleatory Uncertainty and Epistemic Uncertainty
Uncertainty Analysis An analysis to estimate the uncertainties and error bounds of the quantities involved in, and the results from, the solution of a problem.
Page 16
Guidance document on practices
to model and implement EARTHQUAKE hazards in extended PSA (final version) - Volume 1
Report IRSN/PSN-RES/SAG/ 2017-00004 Technical report ASAMPSA_E/ WP21/ D50.15/ 2017-33 vol1 16 / 142
ASAMPSA_E
EXISTING GUIDANCE : KEY DOCUMENTS
Reference Remarks
WENRA-RHWG, 2014a (Reference Levels
Issue T: Natural Hazards)
Requirements for hazard assessment, protection, design basis, and
design extension conditions
WENRA-RHWG, 2015 (Guidance Document
Issue T: Natural Hazards Head Document) Generic guidance on natural hazards
WENRA-RHWG, 2016 (Guidance Document
Issue T: Natural Hazards. Guidance on
Seismic Events)
Specific guidance on seismic hazards
WENRA-RHWG, 2014a (Reference Levels
Issue F: Design Extension for Existing
Reactors)
Requirements for assessment of initiating events exceeding the
severity of design basis events, protection and safety goals
WENRA-RHWG, 2015 (F: Guidance Document
Issue F: Design Extension of Eexisting
Reactors)
Guidance on safety analysis with respect to design extension
conditions
WENRA-RHWG, 2013 (Position paper on PSR) Periodic reviews of natural hazards
KTA, 2011 Design of Nuclear Power Plants against Seismic Events; Part 1:
Principles
IAEA, 2003 (NS-G-1.6) Seismic Design and Qualification for Nuclear Power Plants
IAEA, 2010 (SSG-9) Hazard assessment: vibratory ground motion, fault capabilty
IAEA, 2015 (TECDOC 1767) Paleoseismological methods to support seismic hazard assessment
IAEA, 2009 (NS-G-2.13) Evaluation of seismic safety for extisting nuclear installations
IAEA, 2004 (NS-G-3.6) Hazard assessment: site conditions, liquefaction
NUREG/CR-6372
Senior Seismic Hazard Analysis Committee (SSHAC), 1997. Recom-
mendations for Probabilistic Seismic Hazard Analysis: Guidance on
Uncertainty and Use of Experts.
NUREG 2117 Practical Implementation Guidelines for SSHAC Level 3 and 4 Hazard
Studies
WENRA, 2014a (Reference Levels Issue O:
PSA) Requirements for Probabilistic Safety Analyses
EPRI, 2013 (Seismic Probabilistic Risk
Assessment) Guidelines to seismic probabilistic risk assessments (SPRAs)
IAEA, 1995 (50-P-7) Superseeded External hazards in PSA
IAEA, 2011 (A Methodology to Assess the
Safety Vulnerabilities of Nuclear Power
Plants against Site Specific Extreme Natural
Hazards)
Seismic PSA, Seismic Margin Assessment (SMA)
Page 17
Guidance document on practices
to model and implement EARTHQUAKE hazards in extended PSA (final version) - Volume 1
Report IRSN/PSN-RES/SAG/ 2017-00004 Technical report ASAMPSA_E/ WP21/ D50.15/ 2017-33 vol1 17 / 142
ASAMPSA_E
1 INTRODUCTION
1.1 SCOPE AND OBJECTIVES
The recent experience of the severe accidents at the Fukushima Dai-ichi NPPs has shown how significant the im-
pact of a strong earthquake and causally connected hazards (in this case tsunami and seismically triggered local
landsliding) can be for a nuclear site. It has particularly shown that, in spite of the fact that in the design basis of
each NPP natural hazards should have been appropriately taken into account and efficient protection should be in
place, hazard assessments for defining the design basis may have underestimated hazards. The occurrence of
events with severities exceeding the design basis can therefore not be generally excluded.
In the aftermath of the Fukushima accidents the ENSREG Stress Tests have addressed these issues for European
NPPs. The Stress Tests specifically explored the adequacy of the seismic design bases and whether protection
against earthquakes is in place which is sufficient to exclude potential severe damage to SSCs important to safety
in cases of seismic loads that exceed the design basis values. It was further attempted to quantify these “safety
margins”. Although ENSREG did not explicitly identify the need for updates of hazard assessments and revisions of
design basis values, ENSREG (2012 a) issued the following European level recommendations for natural hazards as a
conclusion of the Stress Tests:
“The peer review Board recommends that WENRA … develop guidance on natural hazards assessments,
including earthquake, flooding and extreme weather conditions, as well as corresponding guidance on
the assessment of margins beyond the design basis and cliff-edge effects.”
“The peer review Board recommends that ENSREG underline the importance of periodic safety review. In
particular, ENSREG should highlight the necessity to re-evaluate natural hazards and relevant plant pro-
visions as often as appropriate but at least every 10 years.” (ENSREG, 2012a, p. 2)
With respect to seismic hazards, ENSREG further stressed the following (ENSREG, 2012 b):
“With regard to hazards, particularly seismic, it would appear that techniques and available data are
still developing. It is recommended that regulators should consider co-operation with other agencies in
order to develop a consistent approach across Europe, taking account of updates in methodology, new
findings and any relevant information from continuous research on active and capable faults in the vicin-
ity of NPPs.” (p. 20)
“PSRs including re-assessment of the seismic hazard were found to be particularly strong safety features
since such repeated periodic updates make it possible to take advantage of advances in science and tech-
nology.” (p. 17)
WENRA has consequently published Safety Reference Levels defining the requirements for natural hazard assess-
ments and protection against natural hazards (WENRA, 2014a, Reference Levels, Issue T) and corresponding Guid-
ance Documents for assessing natural hazards in general (WENRA, 2015), and seismic hazards in particular (WENRA,
2016). One of the main advances in the requirements published by WENRA (2014a) is that the design bases for
protecting existing plants against external hazards shall be reviewed as often as necessary (the design basis may
Page 18
Guidance document on practices
to model and implement EARTHQUAKE hazards in extended PSA (final version) - Volume 1
Report IRSN/PSN-RES/SAG/ 2017-00004 Technical report ASAMPSA_E/ WP21/ D50.15/ 2017-33 vol1 18 / 142
ASAMPSA_E
consequently change during the lifetime of a plant; WENRA. 2014a, p. 19 etc.; WENRA, 2015). This review process
involves regular reviews and re-assessments of external hazards, e.g., during Periodic Safety Reviews (WENRA,
2013).
The requirements and expectations that are expressed in the cited WENRA documents are formulated in concise
forms which refrain from detailed technical guidance and from detailed explanations of how to achieve the expec-
tations. Such guidance is also not fully covered by documents on seismic hazard assessment published by IAEA,
U.S.NRC, and other organisations (see table “Existing guidance : key documents”, page 16). The ASAMPSA_E con-
sortium therefore decided to develop specific guidance on seismic hazards taking into account existing documents
but identifying and closing “gaps” in the available literature and identifying needs to supplement or update exist-
ing guidance to meet the current state of the science.
Developing guidance on seismic hazard assessment in ASAMPSA_E should further address the needs of “End Users”
expressed during the ASAMPSA_E End-User Workshop held in Uppsala, 2014 (Guigueno et al., 2014). Accordingly,
ASAMPSA_E should:
address earthquake as one of the most important external hazards (Recommendation No.31),
provide practices and methods to model combinations/correlations/dependencies of hazards (No. 7),
provide guidance on how to assess coincident hazards in cases of long-lasting accidents (No. 8),
develop a glossary, common for all PSAs (No. 16),
present and compare existing methods for external hazards modelling including uncertainties (No. 27),
examine how experts judgement shall be used for external hazards characterisation and how uncertainties
can be considered (No. 28),
PSHA assesses hazards for very low occurrence probabilities by extrapolating earthquake observations
covering only few 100 years of records. Guidance should be provided on how to assess earthquake cata-
logue completeness and reliability, on how to assess the maximum possible earthquake (Mmax), identify,
analyse and assess (potentially) active faults relevant to the safety of the site (No. 32),
a fact: in a region with low seismicity like Sweden, an earthquake M 8 is “possible” (and observed in paleo
history) with a return period 1 million years examine how can such information be presented in a PSA
(33),
insist on the need to update periodically the design-basis hazards curve (No. 34).
The current document consequently focuses on providing guidance for seismic hazard assessments for extended
PSA particularly considering the listed end-user requests. Development of a seismic PSA or extended PSA including
seismic should be able to verify or demonstrate that that the protection against seismic design basis events is
sufficient. It should further be able to demonstrate a minimum of protection against events with severities ex-
ceeding the design basis values leading to design extension conditions (DEC). For DEC events without fuel damage
(DEC-A), it should be demonstrated that protection is sufficient to ensure the fundamental safety functions. For
1 Numbers refer to End User Recommendations listed in Guigeno et al., 2014, p. 20 – 28.
Page 19
Guidance document on practices
to model and implement EARTHQUAKE hazards in extended PSA (final version) - Volume 1
Report IRSN/PSN-RES/SAG/ 2017-00004 Technical report ASAMPSA_E/ WP21/ D50.15/ 2017-33 vol1 19 / 142
ASAMPSA_E
design extension conditions with postulated fuel damage (DEC-B), it should be demonstrated that the plant is able
to fulfil confinement of the radioactive material (WENRA, 2014a, Issue F).
The current document provides guidance on the assessment of seismotectonic hazards listed in Table 1 with priori-
ty given to the evaluation of vibratory ground motion.
Code Hazard Dur. P&P Hazard definition and hazard impact
N1 Vibratory ground motion (includ-ing long period ground motion)
s-m U/R The hazard is defined by the contemporaneous impact of vibratory ground motion on all civil structures and SSCs of the plant and its surrounding.
N2 Vibratory ground motion induced or triggered by human activity (oil, gas or groundwater extrac-tion, quarrying, mine collapse)
s-m U/R The hazard is defined by the contemporaneous impact of vibratory ground motion on all civil structures and SSCs of the plant and its surrounding.
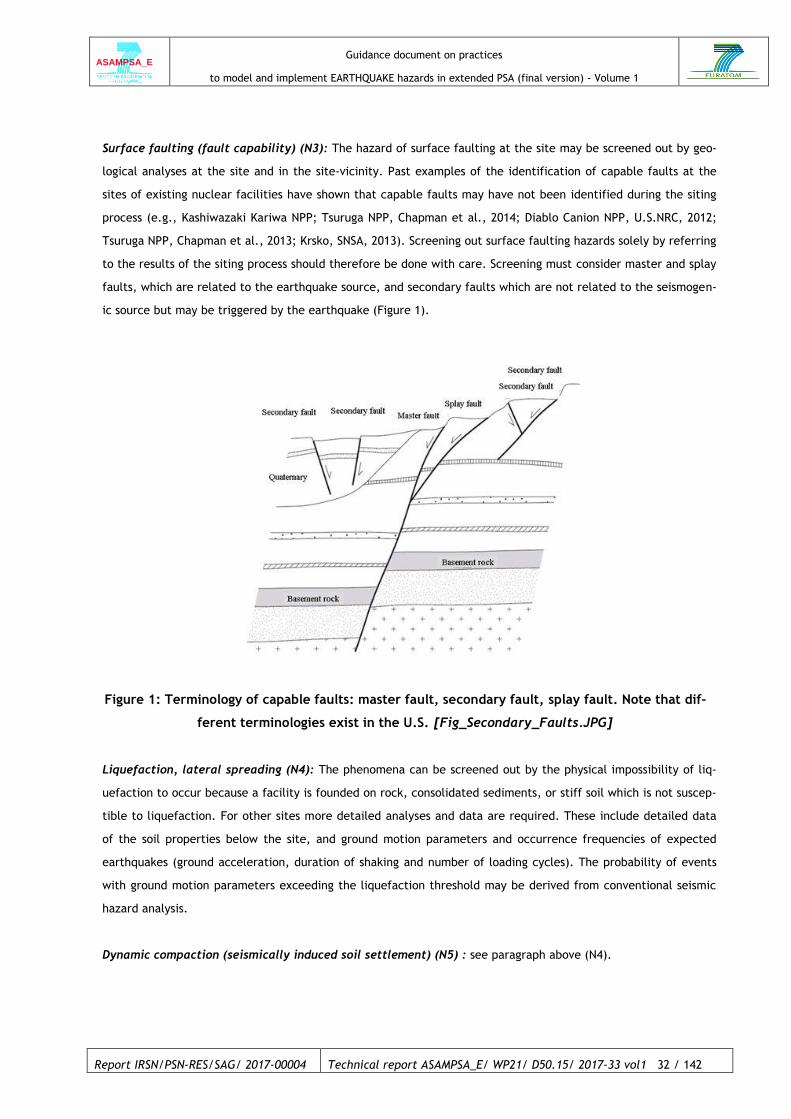
N3 Surface faulting (fault capabil-ity)
s-m U/R The hazard is defined in terms of impact on the plant of coseismic fault rupture and surface displacement. It in-cludes surface rupture at secondary faults.
N4 Liquefaction, lateral spreading s-m U/R The hazard is defined by the loss of shear strength of foun-dation soil and its effects on civil structures and under-ground installations such as pipes or cable trays.
N5 Dynamic compaction (seismically induced soil settlement)
s-m U/R The hazard is defined by the effects of soil settlement on civil structures and underground installations such as pipes or cable trays. It includes effects of seismically induced surface cracks.
N6 Permanent ground displacement subsequent to earthquake
d-l U/R The hazard is defined in terms of impact on the plant of permanent ground subsidence or ground heave due to strain release after an earthquake.
Table 1. List of seismotectonic hazards covered in the current document (from ASAMPSA_E D21.2).
Explanation to columns: Dur.: duration of hazard phenomena classified as s-m (seconds to minutes),
m-h (minutes to hours), h-d (hours to days), d-l (days and longer). P&P: Hazard predictability and
hazard progression: predictable (P), unpredictable (U), progressing rapidly (R) or gradually (G). Ref:
references to international standards introducing the hazard type.
Page 20
Guidance document on practices
to model and implement EARTHQUAKE hazards in extended PSA (final version) - Volume 1
Report IRSN/PSN-RES/SAG/ 2017-00004 Technical report ASAMPSA_E/ WP21/ D50.15/ 2017-33 vol1 20 / 142
ASAMPSA_E
1.2 POTENTIAL IMPACTS ON THE PLANT
Unlike the effects of other external hazards seismic events and vibratory ground motion simultaneously challenge
all parts of the site of an NPP, all civil structures, SSCs (both safety and non-safety related), and personnel. The
simultaneous impact and the following characteristics distinguish vibratory ground motion from all other external
hazards and internal hazards:
1. Seismic events are not predictable and have no precursors (except for foreshocks of earthquake; these,
however, cannot be identified as such at the time of their occurrence).
2. Hazard progresses very rapidly in seconds and lasts up to minutes.
3. Potential of aftershocks may aggravate damage due to the higher vulnerability of pre-damaged civil struc-
tures and SSCs as compared to intact ones.
4. Vibratory ground motion impacts on non-safety classified civil structures and equipment at the site such
as the fire brigades2 which are important for defense-in-depth.
5. Seismic ground shaking at multi-unit sites affects all units contemporaneously stressing the resources for
accident management. The effects and damage to the individual plants at the site may, however, be dif-
ferent due to different site effects (soil type below basemat), basemat depths, and construction details.
6. Vibratory ground motion simultaneously affects the whole region around the site including traffic connec-
tions, support routes, and electrical grid.
7. Earthquake effects have a potential impact on regional communication networks.
8. Earthquakes challenge the availability of human resources from outside plant having an impact on human
reliability (HRA)3. Seismic events therefore are different from other external hazard which progress slowly
(as most types of flooding) or affect only very limited areas (such as airplane crash, lightning), but may be
similar to some meteorological effects. NPP personnel may be distracted from nuclear safety due to pri-
vate concerns (rescue, securing homes) reducing their reliability. HRA is thought to decrease with increas-
ing impact (intensity) of the earthquake.
9. Unclear priorities for overall emergency response by local authorities may be in conflict with the priorities
for SAMG. The availability of rescue and support from outside the plant (e.g., fire brigades, medical aid,
and heavy machines for clean-up operations) may be limited due to the simultaneous needs of civil pro-
tection outside the plant.
10. Vibratory ground motion is correlated/associated with a large number of hazards including man-made
hazards.
2 The importance such effects have been highlighted by the ENSREG Stress Tests finding that some fire brigade
buildings are not capable to withstand design basis seismic events althought the action of fire brigades is credited
in the defence-in-depth concept (e.g., the support of core cooling by feed and bleed) (ENSREG, 2012 c).
3 Guidance on the verification and improvement SAM strategies in the context of PSA are included in the
ASAMPSA_E Report by Rahni et al. (2017).
Page 21
Guidance document on practices
to model and implement EARTHQUAKE hazards in extended PSA (final version) - Volume 1
Report IRSN/PSN-RES/SAG/ 2017-00004 Technical report ASAMPSA_E/ WP21/ D50.15/ 2017-33 vol1 21 / 142
ASAMPSA_E
11. Issues related to (6) to (9) may arise from events with ground motion values below the design basis of the
NPP which by themselves are not challenging the nuclear installation. However, they may cause severe
damage to other structures due to the fact that these are not designed for equally high safety standards
and have higher vulnerabilities than the NPP.
Page 22
Guidance document on practices
to model and implement EARTHQUAKE hazards in extended PSA (final version) - Volume 1
Report IRSN/PSN-RES/SAG/ 2017-00004 Technical report ASAMPSA_E/ WP21/ D50.15/ 2017-33 vol1 22 / 142
ASAMPSA_E
1.3 LESSONS LEARNED FROM PAST EVENTS
Deliverable D10.3 of the ASAMPSA_E Project (Nitoi et al., 2015) includes a detailed list of earthquakes that affect-
ed nuclear power plants. Among them, the following deserve special attention.
1.3.1 KOZLODUY NPP (BULGARIA)
Vrancea earthquake 04.03.1977, Mw 7.2 (Radu et al., 1979)
The earthquake with its epicenter in Romania (region of Vrancea, c. 270 km from the site) was felt with an inten-
sity of MSK~6 at the site. The event had no impact on safety.
“Lessons learned” includes the re-evaluation of site seismicity and upgrading of SSCs. An overview on the most
important activities on the Kozloduy NPP site till 1997 can be found in IAEA (2001). Issues concerning the site seis-
micity are also described and discussed in BNRA (2011) and BNRA (2012) stating that according to the design of
Kozloduy NPP Units 1 and 2 (of 1973), the seismic activity in the region had been evaluated as below IMSK=VI degree
of the Medvedev-Sponheuer-Karnik seismic intensity scale (MSK-64). Following the March 1977 earthquake, a site
seismic re-evaluation had been per-formed. The Operational Base Earthquake (OBE) was set to IMSK=VI degree with
Peak Ground Acceleration (PGA) of 0.05g and Design Basis Earthquake (DBE) to IMSK=VII degree with PGA of 0.1g.
The lessons learned from this strongest earthquake were taken into consideration in the design on the next units
built on the Kozloduy NPP site. According to the BNRA (2012), the following site maximum seismic impact had
been adopted in the design of Kozloduy NPP Units 3 and 4:
o OBE - IMSK=VI (MSK-64 scale);
o DBE - IMSK=VII (MSK-64 scale);
o Surface response spectrum – the spectrum of Vrancea earthquake accelerogram dated 04.03.1977, rec-
orded in Bucuresti and aligned to PGA of 0.1 g.
o The design of Units 5 and 6 had been developed based on the following seismic characteristics:
o OBE - VI degree by MSK-64 scale with PGA of 0.05g for recurrence period of 100 years; and
o DBE - VII degree by MSK 64 scale with PGA of 0.1g for recurrence period of 10,000 years.
A further reassessment of seismic design basis was performed during the period 1990-1992 under a joint IAEA pro-
ject BUL 9/012 “Site and Seismic Safety of Kozloduy and Belene NPPs” (BNRA, 2011; 2012). New site seismic char-
acteristics were defined accordingly. Seismic levels for recurrence period of 100 and 10,000 years respectively
were determined using probabilistic and deterministic methods. Thus, for Kozloduy NPP site, were defined:
o for recurrence period of 100 years - PGA of 0.10g;
o for recurrence period of 10,000 years - PGA of 0.20g; and
o resultant floor design response spectra and respective three-component accelerograms for duration of 61
seconds.
Moreover, following an IAEA recommendation, floor design response spectra and respective three component ac-
celerograms (for duration of 20 s) were additionally defined for local earthquakes.
The seismic characteristics – seismic levels, resultant design floor response spectra and respective three-
component accelerograms were reviewed and confirmed by IAEA experts in the period from 1992 till 2008. The so
Page 23
Guidance document on practices
to model and implement EARTHQUAKE hazards in extended PSA (final version) - Volume 1
Report IRSN/PSN-RES/SAG/ 2017-00004 Technical report ASAMPSA_E/ WP21/ D50.15/ 2017-33 vol1 23 / 142
ASAMPSA_E
called Review Level Earthquake (RLE) was also defined. This is the level, for which all SSCs of 1st seismic category
of plants already designed and commissioned should be reviewed in respect of seismic resistance (BNRA, 2012).
Current seismic characteristics of the Kozloduy NPP site were defined in the period 1990-1992 and are valid for all
facilities located on the site (BNRA, 2011; 2012). It should be noted that only two units - Unit 5 and Unit 6, com-
missioned respectively in 1987 and 1991, are in operation. In pursuance of the Bulgarian commitments made for
the country’s accession to the European Union, the first four reactors on the Kozloduy NPP site were shut down
before the end of their design lifetime.
1.3.2 HUMBOLT BAY NPP (CALIFORNIA, USA)
Eureka earthquake 08.11.1980, M 7.2
The earthquake epicenter was located at a distance of 120 km from the site. The peak ground acceleration associ-
ated with the event (free flied) was 0.2 – 0.25 g while the plant was originally designed for 0.25 g and upgraded to
0.5 g. The event did not cause visible damage (IAEA, 2003a).
IAEA (2003) lists the following “Lessons learned”:
“Upgraded structures can withstand events higher than the original design basis.”
1.3.3 PERRY NPP (OHIO, USA)
Leroy earthquake 31.01.1986, M 5
The earthquake epicenter was located 18 km from the NPP. The event caused strong motion duration of 1 second
and a total earthquake duration of 2.7 seconds at the site. Peak ground acceleration of 0.19 g exceeded the design
basis of 0.15 g. All SSCs operated properly during and after the earthquake. Post-event inspections and walkdowns
by a large group of technicians did not find damage to any SSC (IAEA, 2003a).
IAEA (2003) lists the following “Lesions learned”:
“PGA as damage indicator is not a suitable choice, while CAV or relative displacement confirmed their
validity”
“Low energy earthquakes, even if very close to the site, induce low damage because of their short dura-
tion and high frequency content”
“65 people for a walkdown is too large a number and technical outcomes could be confused and contra-
dictory”
1.3.4 METZAMOR NPP (ARMENIA)
Spitak earthquake 07.12.1988, Ms 6.8
The Armenian (former USSR) NPP Metzamor is located about 70 km SSW of the epicenter of the 1988 Spitak earth-
quake. After the earthquake the USSR Ministers Council decided to shut down the existing two units of the NPP.
Detailed descriptions of the impact of the earthquake on the NPP and of damage to SSCs are not available. In 1995
the Unit 2 of the NPP was re-commissioned after retrofitting of the reactor building, DG buildings and seismic
qualification of the primary circuit equipment. Since 1995 several additional seismic upgrading programs were
implemented. Actions further include novel PSHA studies for the site (Armenian Nuclear Regulatory Authority,
2015).
Page 24
Guidance document on practices
to model and implement EARTHQUAKE hazards in extended PSA (final version) - Volume 1
Report IRSN/PSN-RES/SAG/ 2017-00004 Technical report ASAMPSA_E/ WP21/ D50.15/ 2017-33 vol1 24 / 142
ASAMPSA_E
1.3.5 KASHIWAZAKI KARIWA (JAPAN)
Niigataken Chuetsu-Oki (NCO) earthquake 16.07.2007, Mw 6.6
The epicenter of the earthquake was about 16 km north of the site of the Kashiwazaki-Kariwa NPP.
There are seven units in Kashiwazaki-Kariwa NPP site.
Design basis: The design basis earthquake ground motion was specified at the free surface of the base stratum at
the level of about -150m to -300m (different for each unit) from the ground surface. At the time of design, the
vertical component of the earthquake was taken into account by static seismic force and vertical ground motion
was not specified. The maximum acceleration of design basis earthquake ground motion is:
PGAH 450cm/s2 (in horizontal direction)
Ground motion at the site during the earthquake: the maximum horizontal accelerations (AHmax) observed on the
base mat of the reactor building are as follows (IAEA, 2007b; numbers in the parentheses are the maximum accel-
eration from the response analysis at the design stage using design basis earthquake ground motion):
Unit 1 AHmax 680 cm/s2 (273 cm/s2)
Unit 2 AHmax 606 cm/s2 (167 cm/s2)
Unit 3 AHmax 384 cm/s2 (193 cm/s2)
Unit 4 AHmax 492 cm/s2 (194 cm/s2)
Unit 5 AHmax 442 cm/s2 (254 cm/s2)
Unit 6 AHmax 322 cm/s2 (263 cm/s2)
Unit 7 AHmax 356 cm/s2 (263 cm/s2)
Estimated PGA (Peak Ground Acceleration) in horizontal direction PGAH at the free surface of the base stratum
about -150m to -300m (different for each rector) underground, where design earthquake ground motion is speci-
fied, was estimated by deconvolusion analysis:
Unit 1 PGAH 1699 cm/s2
Unit 2 PGAH 1011 cm/s2
Unit 3 PGAH 1113 cm/s2
Unit 4 PGAH 1478 cm/s2
Unit 5 PGAH 766 cm/s2
Unit 6 PGAH 539 cm/s2
Unit 7 PGAH 613 cm/s2
Damage: No significant damages to safety related structures, systems and components were found by the plant
walkdowns which were confirmed by thorough and detailed inspection and investigation later conducted (IAEA,
2007a).
Large soil deformations: Many of the problems on the Kashiwazaki-Kariwa nuclear power plant site were induced
by large soil deformations.
Fire: Unit 3 in-house electrical transformer fire, which was not directly related to nuclear safety,
Page 25
Guidance document on practices
to model and implement EARTHQUAKE hazards in extended PSA (final version) - Volume 1
Report IRSN/PSN-RES/SAG/ 2017-00004 Technical report ASAMPSA_E/ WP21/ D50.15/ 2017-33 vol1 25 / 142
ASAMPSA_E
Anchorage Failures: there were a limited number of anchorage failures mainly on transformers and water tanks
that are not safety related equipment.
Design basis review: in September 2006, i.e., before the NCO earthquake occurred, guidelines were revised by
the regulator (NSC: Nuclear Safety Commission, Japan) concerning the review of the seismic design of nuclear
power plants in Japan. The guidelines address that both horizontal and vertical design earthquake ground motions
are to be considered. Reflecting the guidelines as well as knowledge obtained from the NCO earthquake, TEPCO
newly proposed the design basis earthquake ground motion specified at the free surface of the base stratum about
-150 m to -300 m underground. Maximum acceleration of the design earthquake ground motion PGAH (horizontal)
and PGAV (vertical) are as follows. Numbers in the parentheses are the maximum acceleration on the base mat of
the reactor building from the response analysis using the revised design basis earthquake ground motion:
Unit 1 PGAH 2300 cm/s2 (845 cm/s2) PGAV 1050 cm/s2
Unit 2 PGAH 2300 cm/s2 (809 cm/s2) PGAV 1050 cm/s2
Unit 3 PGAH 2300 cm/s2 (761 cm/s2) PGAV 1050 cm/s2
Unit 4 PGAH 2300 cm/s2 (704 cm/s2) PGAV 1050 cm/s2
Unit 5 PGAH 1050 cm/s2 (606 cm/s2) PGAV 650 cm/s2
Unit 6 PGAH 1050 cm/s2 (724 cm/s2) PGAV 650 cm/s2
Unit 7 PGAH 1050 cm/s2 (738 cm/s2) PGAV 650 cm/s2
Upgrades: After NCO earthquake, upgrading to the site and the plant structures, systems and components were
conducted such as: soil stabilization works on the site, modifications to structures including the reactor building
roof structure, crane rail supports and exhaust stack, addition of new pipe supports and modifications to existing
pipe supports (IAEA, 2008).
After Fukushima-Daiichi accident which occurred in 2011 new regulatory guides were issued and the design basis
earthquake ground motions are to be re-evaluated. Upgrading works for SSCs against these newly specified earth-
quake ground motions are (will be) conducted.
1.3.6 FUKISHIMA-DAIICHI (JAPAN)
Great East Japan Earthquake (GEJE) or Tohoku earthquake 11.03.2011, Mw 9.0
The hypocentre was located at 24 km depth and the epicenter at a distance of about 180 km from Fukushima
Daiichi NPP site.
Design basis: design basis earthquake ground motion is specified at the free surface of the base stratum at the
level of about -200 m from the ground surface. The maximum horizontal and vertical accelerations of the design
basis earthquake ground motion in accordance with the guidelines revised in 2006 concerning reviewing seismic
design of nuclear power plants in Japan are:
PGAH 600 cm/s2
PGAV 400 cm/s2
Page 26
Guidance document on practices
to model and implement EARTHQUAKE hazards in extended PSA (final version) - Volume 1
Report IRSN/PSN-RES/SAG/ 2017-00004 Technical report ASAMPSA_E/ WP21/ D50.15/ 2017-33 vol1 26 / 142
ASAMPSA_E
Ground motion at the site: maximum horizontal and vertical accelerations observed on the base mat of the reac-
tor building are as follows (IAEA, 2011; numbers in the parentheses are the maximum acceleration from the re-
sponse analysis using design basis earthquake ground motion):
Unit 1 AHmax 460 cm/s2 (487 cm/s2) AVmax 258 cm/s2 (412 cm/s2)
Unit 2 AHmax 550 cm/s2 (438 cm/s2) AVmax 302 cm/s2 (420 cm/s2)
Unit 3 AHmax 507 cm/s2 (441 cm/s2) AVmax 231 cm/s2 (429 cm/s2)
Unit 4 AHmax 319 cm/s2 (445 cm/s2) AVmax 200 cm/s2 (422 cm/s2)
Unit 5 AHmax 548 cm/s2 (452 cm/s2) AVmax 256 cm/s2 (427 cm/s2)
Unit 6 AHmax 444 cm/s2 (448 cm/s2) AVmax 244 cm/s2 (415 cm/s2)
Damage (IAEA, 2011): Operating plants were automatically shut down and all plants behaved in a safe manner,
during and immediately after the earthquake. Although all off-site power was lost when the earthquake occurred
(LOOP occurred due to break of power line caused by failure of a transmission tower due to an earthquake-
triggered landslide; Y. Fukushima, IAEA Seismic Safety Center, per. Comm.), the automatic systems at Fukushima
Daiichi successfully inserted all the control rods into its three operational reactors upon detection of the earth-
quake, and all available emergency diesel generator power systems were in operation, as designed. Fundamental
safety functions of (a) reactivity control, (b) removal of heat from the core and (c) confinement of radioactive
materials were available.
Accident analysis therefore shows that fundamental safety functions were in place until the tsunami reached the
sites. Damage by the tsunami was due to insufficient design provisions against tsunami.
1.3.7 FUKISHIMA-DAINI NPPS (JAPAN)
Great East Japan Earthquake (GEJE) or Tohoku earthquake 11.03.2011, Mw 9.0
Fukushima Daini site, located 12km south of Fukushima Daiichi site, has four reactors. At the time of the earth-
quake, all four units were operating.
Design basis: The design basis earthquake ground motion parameters are specified at the free surface of the base
stratum -180m from the ground surface. Maximum horizontal and vertical accelerations of the design basis earth-
quake ground motion are:
PGAH 600 cm/s2
PGAV 400 cm/s2
Ground motion at the site: Maximum horizontal and vertical accelerations observed on the base mat of the reac-
tor building are as follows (IAEA, 2011; TEPCO, 2012; numbers in the parentheses are the maximum acceleration
from the response analysis using design basis earthquake ground motion):
Unit 1 AHmax 254 cm/s2 (434 cm/s2) AVmax 305 cm/s2 (512 cm/s2)
Unit 2 AHmax 243 cm/s2 (428 cm/s2) AVmax 232 cm/s2 (504 cm/s2)
Unit 3 AHmax 277 cm/s2 (428 cm/s2) AVmax 208 cm/s2 (504 cm/s2)
Unit 4 AHmax 210 cm/s2 (415 cm/s2) AVmax 288 cm/s2 (504 cm/s2)
Page 27
Guidance document on practices
to model and implement EARTHQUAKE hazards in extended PSA (final version) - Volume 1
Report IRSN/PSN-RES/SAG/ 2017-00004 Technical report ASAMPSA_E/ WP21/ D50.15/ 2017-33 vol1 27 / 142
ASAMPSA_E
By deconvolusion analysis using the seismic observation records, the seismic motion of the free surface of the base
stratum at -180m underground was evaluated and compared to the design basis seismic ground motion, showing
that both motions are roughly equivalent.
Damage: The plants achieved cold shutdown safely with no core damage. Also, subsequent facility checks found
no damage to functions of safety-critical equipment except for damage by the tsunami. Thus, it is considered that
the earthquake had no impact on the functionality of safety-critical equipment.
1.3.8 ONAGAWA NPP (JAPAN)
Great East Japan Earthquake (GEJE) or Tohoku earthquake 11.03.2011, Mw 9.0
Situated on the eastern coast of Japan facing the Pacific Ocean, the Onagawa NPP was the closest nuclear power
plant to the epicenter of the Mw 9.0 GEJE. The plant experienced very high levels of ground motion the strongest
shaking that any nuclear power plant has ever experienced from an earthquake. The ground subsided about 1 m
during the earthquake, from 14.8 m above sea level to 13.8m. There are three units in Onagawa NPP site.
Design basis: design basis earthquake ground motion is specified at the free rock surface -16m to -30m (different
for each unit) from the ground surface. Maximum horizontal and vertical accelerations of the design basis earth-
quake ground motion:
PGAH 580 cm/s2
PGAV 387 cm/s2
Ground motion at the site: estimated horizontal and vertical PGAs at the free rock surface by the deconvolution
analysis were comparable with the design ones.
PGAH 636 cm/s2
PGAV 312 cm/s2
Response spectrum of the deconvoluted wave is roughly equivalent to that of the design earthquake ground mo-
tion. Maximum horizontal and vertical acceleration observed on the base mat of the reactor building are as follows
(numbers in the parentheses are the maximum acceleration from the response analysis using design basis earth-
quake ground motion):
Unit 1 AHmax 587 cm/s2 (529 cm/s2) AVmax 439 cm/s2 (451 cm/s2)
Unit 2 AHmax 607 cm/s2 (594 cm/s2) AVmax 389 cm/s2 (490 cm/s2)
Unit 3 AHmax 573 cm/s2 (512 cm/s2) AVmax 321 cm/s2 (476 cm/s2)
Damage: IAEA (2012b) reports that there were no identified system failures affecting safety functions due to the
earthquake. The most significant damage to equipment due to the earthquake shaking was the failure in the 6.9
kV switchgear. A vertically-racked circuit breaker in the non-safety-related turbine building switchgear caused a
short circuit and a subsequent arc due to rocking of the breaker and fracture of the insulation around the bus
clamps at top. The short circuit arc burnt the switchgear, consuming three or four adjacent cabinets.
Page 28
Guidance document on practices
to model and implement EARTHQUAKE hazards in extended PSA (final version) - Volume 1
Report IRSN/PSN-RES/SAG/ 2017-00004 Technical report ASAMPSA_E/ WP21/ D50.15/ 2017-33 vol1 28 / 142
ASAMPSA_E
Design basis review: after Fukushima-Daiichi accident which occurred in 2011, new regulatory requirements were
issued and the design basis earthquake ground motion is to be re-evaluated
Upgrades: upgrading works for seismic capacity of the SSCs are (will be) conducted, e.g., for equipment and pip-
ing support, exhaust stack frame and foundation.
1.3.9 TOKAI NPP (JAPAN)
Great East Japan Earthquake (GEJE) or Tohoku earthquake 11.03.2011, Mw 9.0
The Tokai Daini site has a single reactor. At the time of the earthquake, Tokai Daini (unit 2) was operating.
Design basis: the design basis earthquake ground motion is specified at the free surface of the base stratum about
-370m from the ground surface. Maximum horizontal and vertical accelerations of the design basis earthquake
ground motion:
PGAH 600 cm/s2
PGHV 370 cm/s2
Ground motion at the site: Maximum horizontal and vertical acceleration observed on the base mat of the reac-
tor building are as follows (numbers in the parentheses are the maximum acceleration from the response analysis
using design basis earthquake ground motion):
Unit 2 AHmax 225 cm/s2 (400 cm/s2) AVmax 189 cm/s2 (456 cm/s2)
Damage: In response to the earthquake, the reactor automatically scrammed (shutdown). All three off-site power
sources were lost and all three emergency diesel generators started automatically.
Design basis review: After Fukushima-Daiichi accident which occurred in 2011, new regulatory guides were issued
and design earthquake ground motion is to be re-evaluated
Upgrades: Upgrading works for SSCs against these newly specified earthquake ground motions are (will be) con-
ducted.
1.3.10 NPP NORTH ANNA (VIRGINIA, USA)
Earthquake of Mineral, Virginia, 23.08.2011, Mw 5.8
The earthquake with an epicenter located some 18 km from the North Anna Nuclear Station led to a loss of offsite
power (LOOP) and caused the reactors to automatically shut down. Four emergency diesel generators started up to
supply electricity to safety systems. Due to a coolant leak, one of the diesel generators stopped working and was
replaced by a fifth EDG. Offsite power was restored during August 23.
Page 29
Guidance document on practices
to model and implement EARTHQUAKE hazards in extended PSA (final version) - Volume 1
Report IRSN/PSN-RES/SAG/ 2017-00004 Technical report ASAMPSA_E/ WP21/ D50.15/ 2017-33 vol1 29 / 142
ASAMPSA_E
1.3.11 MÜHLHEIM-KÄRLICH (GERMANY)
Identification of a fault at the site
The NPP Mühlheim-Kärlich was situated in the Neuwieder Basin in vicinity of the Rhine Graben Fault system. During
the construction a fault was discovered at the site where the reactor building should be constructed. This lead to
the decision to move the location of the reactor building for about 70 m to a location off the fault. The decision
had severe legal consequences which finally resulted in the final shutdown of the NPP only two years after its
commercial start. The legal decision to shut down was not related to any questions of fault capability. It was sole-
ly based on the invalidity of the planning and building permission resulting from the fact that the reactor building
was not constructed at the location planned.
1.3.12 TSURUGA NPP (JAPAN)
Identification of a capable fault at the site
The NPP is located at the so-called Urasoko fault, which extends over a total length of about 10 km and forms a
morphological scarp at the site. The foundations of both reactor units are located only 200 m from the fault. The
fault was not considered to be active at the time of the siting of the plant. Paleoseismological trenching, however,
proofed that the fault has moved repeatedly in the Late Pleistocene, and it is shown as an “active” or “possibly
active” fault on Japan’s active fault map. The Urasoko fault is apparently connected to a fault which extends
below the basemat of the reactors and therefore should be defined as active as well.
According Japanese national regulations by NRA, critical facilities which are situated on active faults should not be
operated. Although this criterion was originally applied for the siting of NPPs (compare IAEA, 2009), NRA extended
it to existing facilities. This regulatory approach required to clarify the definition of the term “active fault” and to
assess the youngest slip history of the faults using extensive paleoseismological trenching (Chapman et al., 2013).
1.3.13 DIABLO CANYON (U.S.)
Identification of a capable fault in the site vicinity
Relocated microearthquakes led to the identification of an active fault (Shoreline or Hosgri Fault) in the site vicini-
ty offshore of the Diablo Canyon NPP, California. The identification of the active fault in 2008 triggered a series of
reviews of the seismic ground shaking hazards using PSHA and deterministic hazard assessment methods (see re-
view by USNRC, 2012). Due to the fact that the seismic hazard at the NPP is controlled by faults located within 10
km, finite fault simulations were conducted for assessing ground motion (Abrahamson, 2015).
The identification of the fault led to the implementation of a license condition for operating the plant requiring
the licensee to implement a “Long-Term Seismic Program” to perform regular hazard re-evaluations with the lat-
est techniques and data (Chapman et al., 2013).
Page 30
Guidance document on practices
to model and implement EARTHQUAKE hazards in extended PSA (final version) - Volume 1
Report IRSN/PSN-RES/SAG/ 2017-00004 Technical report ASAMPSA_E/ WP21/ D50.15/ 2017-33 vol1 30 / 142
ASAMPSA_E
1.3.14 KRSKO NPP (SLOVENIA)
Identification of a capable fault in the site vicinity
The NPP Krsko is located close to the high-seismicity plate boundary between the Adriatic and the Pannonian plate
in a tectonically complex region of moderate to high seismicity where seismicity is distributed over a large number
of (partly unknown) active faults. In the course of geological investigations for the siting of a new NPP close to the
existing one at least one active fault has recently been described in the site vicinity/near-region. To assess the
resulting ground displacement hazard at the Krsko site a Probabilistic Fault Displacement Hazard Analysis (PFDHA)
was initiated which accounts for as many as 10 potentially capable faults in the near-region (Cline et al., 2015).
Besides the capable fault issue the correct assessment of these faults is of vital importance for the derivation of
reliable seismic hazard values for vibratory ground motion. The update of the seismic hazard assessment for Krsko
is part of the Slovenian National Action Plan in the aftermath of the European Post-Fukushima Stress Test (“Revi-
sion of the 2004 SPSA”; SNSA, 2014, p. 13). The action follows ENSREG’s Stress Tests recommendation which sug-
gested that “the regulator should consider requesting to update the seismic design basis” (ENSREG, 2012). The
fact that the hazard update has not been completed by now highlights the complexity and duration of a process to
revise the seismic design basis. The time between deciding for a hazard update and implementation of protection
measures at the plant may be very significant.
Page 31
Guidance document on practices
to model and implement EARTHQUAKE hazards in extended PSA (final version) - Volume 1
Report IRSN/PSN-RES/SAG/ 2017-00004 Technical report ASAMPSA_E/ WP21/ D50.15/ 2017-33 vol1 31 / 142
ASAMPSA_E
2 SCREENING OF SEISMOTECTONIC HAZARDS
Vibratory ground motion (including long period ground motion) (N1) : Seismic ground motion hazards have to
be analyzed for all nuclear power plants and cannot be screened out for any site (WENRA, 2015: Issue T, Guid-
ance on Seismic Events).
Vibratory ground motion induced or triggered by human activity (oil, gas or groundwater extraction, quar-
rying, mine collapse) (N2): Triggered or induced seismic ground motion can be screened out by the absence of
man-made facilities which might cause such events (screening out by physical impossibility). Screening needs to
consider the following potential sources:
water, oil, or gas extraction wells,
hydrothermal plants for thermal water extraction or re-injection,
liquid waste disposal wells,
mines and other large open volumes in the subsurface,
quarries which, by their topography, may produce large volume rock falls.
The screening area around the site should be chosen in accordance with the potential maximum magnitude of the
earthquake that may be produced by such facilities, and appropriate ground motion prediction equations
(GMPEs)4 which are applicable to model such events.
For induced earthquakes (i.e., events which are entirely controlled by human intervention) magnitudes up to Mw
5.6 have been observed. Examples include sites in Switzerland (Basel Deep Heat Mining : recorded Mmax=3.4,
Deichmann, 2010; maximum magnitude estimated from seismological data Mw 4.5, Baisch et al., 2009), Germany
(Geothermianlage Landau : Imax=5, Ritter et al., 2014), and the USA (Rocky Mountain Arsenal, Denver, Mmax=5.6,
Folger & Tiemann, 2015; Paradox Valley, Colorado, M=4.3, Ake et al., 2005; The Geysers Field, California,
Mmax=4.6, US Department of Energy, 2015).
Although these magnitudes appear low compared to the possible magnitudes of natural earthquakes it must be
considered that induced events occur at much shallower depth (typically 2-4 km) than natural earthquakes. The
small hypocenter depths lead to large ground motion values at the epicenter. The shallow nature of the events,
however, implies that the area affected by ground shaking will be significantly smaller than the area shaken by
deeper natural quakes.
Maximum magnitude estimates for triggered seismicity, where human intervention initiates the seismic rupture
process of a fault while the subsequent rupture propagation is controlled by natural stress, are more difficult to
assess. Estimates should be based on the size of the largest fault that may rupture accounting for the orientation
of the fault and the orientation of natural stresses. Maxiumum magnitude estimates can be obtained from scaling
laws (Wells and Coppersmith, 1994; see also chapter 4.2.1, page 70).
4 GMPEs provide relations between earthquake magnitude, distance from the hypocentre, and ground shaking pa-
rameters.
Page 32
Guidance document on practices
to model and implement EARTHQUAKE hazards in extended PSA (final version) - Volume 1
Report IRSN/PSN-RES/SAG/ 2017-00004 Technical report ASAMPSA_E/ WP21/ D50.15/ 2017-33 vol1 32 / 142
ASAMPSA_E
Surface faulting (fault capability) (N3): The hazard of surface faulting at the site may be screened out by geo-
logical analyses at the site and in the site-vicinity. Past examples of the identification of capable faults at the
sites of existing nuclear facilities have shown that capable faults may have not been identified during the siting
process (e.g., Kashiwazaki Kariwa NPP; Tsuruga NPP, Chapman et al., 2014; Diablo Canion NPP, U.S.NRC, 2012;
Tsuruga NPP, Chapman et al., 2013; Krsko, SNSA, 2013). Screening out surface faulting hazards solely by referring
to the results of the siting process should therefore be done with care. Screening must consider master and splay
faults, which are related to the earthquake source, and secondary faults which are not related to the seismogen-
ic source but may be triggered by the earthquake (Figure 1).
Figure 1: Terminology of capable faults: master fault, secondary fault, splay fault. Note that dif-
ferent terminologies exist in the U.S. [Fig_Secondary_Faults.JPG]
Liquefaction, lateral spreading (N4): The phenomena can be screened out by the physical impossibility of liq-
uefaction to occur because a facility is founded on rock, consolidated sediments, or stiff soil which is not suscep-
tible to liquefaction. For other sites more detailed analyses and data are required. These include detailed data
of the soil properties below the site, and ground motion parameters and occurrence frequencies of expected
earthquakes (ground acceleration, duration of shaking and number of loading cycles). The probability of events
with ground motion parameters exceeding the liquefaction threshold may be derived from conventional seismic
hazard analysis.
Dynamic compaction (seismically induced soil settlement) (N5) : see paragraph above (N4).
Page 33
Guidance document on practices
to model and implement EARTHQUAKE hazards in extended PSA (final version) - Volume 1
Report IRSN/PSN-RES/SAG/ 2017-00004 Technical report ASAMPSA_E/ WP21/ D50.15/ 2017-33 vol1 33 / 142
ASAMPSA_E
Permanent ground displacement subsequent to earthquake (N6) : The hazard can be screened out by physical
impossibility in cases where no faults are present which may lead to significant permanent uplift / subsidence of
the site. The hazard cannot be screened out for sites which are located in the vicinity of faults which may accu-
mulate significant vertical displacement during a seismic event. These are sites in the hangingwall of subduction
zones or large thrust faults, and locations in the hangingwall / footwall of large normal faults.
Page 34
Guidance document on practices
to model and implement EARTHQUAKE hazards in extended PSA (final version) - Volume 1
Report IRSN/PSN-RES/SAG/ 2017-00004 Technical report ASAMPSA_E/ WP21/ D50.15/ 2017-33 vol1 34 / 142
ASAMPSA_E
3 DATABASE
3.1 DATA FOR THE ASSESSMENT OF SEISMOTECTONIC HAZARDS
3.1.1 DATA FOR ASSESSING VIBRATORY GROUND MOTION HAZARDS
The kinds of data and the detailedness required for data collection in preparation for seismic hazard evaluations
should generally follow the graded approach proposed by IAEA (2010). In this paper IAEA suggests to increase de-
tailedness and efforts for data collection with decreasing distance from the utility. IAEA discerns between re-
gional (RE, typically 300 km radius from the site), near-regional (NR, typically 25 km), site-vicinity (SV, 5 km) and
site (SI) investigations. Data collection should be as complete as possible and include the acquisition of new data.
It should be noted from the beginning of a hazard assessment program that the acquisition of new data will be a
suitable and in many cases the only tool to narrow down the uncertainties of the outcome of the assessment.
The collected and newly acquired data should constrain as tightly as possible the following inputs for seismic
hazard assessment:
Construction of a regional seismotectonic model. The aim of a seismotectonic model is to integrate all
available data which describe the deformation of the Earth’s crust under the current5 geological condi-
tions into a coherent and self-consistent model. Such a model must not be exclusively based on seismo-
logical data. Instead, a reasonable model will integrate earthquake data, geological data, geophysical
data, geomorphological data, paleoseismolgoical data, geodetic data, stress data, tectonic data describ-
ing the deformation history, etc. (see below). One of the basic inputs is a tectonic map encompassing all
relevant tectonic faults (both active and inactive). The seismotectonic model may be regarded as a the-
ory of the current tectonic evolution of the region under consideration.
In the construction of a seismotectonic model all relevant and scientifically supportable interpretations
should be taken into account. This process may result in more than one model without being able to de-
cide about the correctness of the different results. It such cases it should be decided whether the acqui-
sition of new data may reduce the number of possible models (thereby decreasing uncertainty) or it is
necessary to propagate the uncertainty of different models in a probabilistic approach, e.g., by adopting
a logic tree. In the latter case all reasonable models should be weighted and considered in the final haz-
ard evaluation.
The construction of a plausible and well supported seismotectonic model is regarded as a key step be-
cause many important decisions in the subsequent seismic hazard assessment procedure will depend on
it such as the selection of seismic sources / seismic source zones, the characterization of potentially ac-
tive faults, fault activity rates etc.
In most if not all parts of Europe the construction of seismotectonic models will be able to benefit from
recent scientific studies on seismotectonic and active tectonics, which exploded in numbers during the
last two decades.
5 “Current” in this context refers to the youngest geological history, e.g., the Pliocene to Quaternary.
Page 35
Guidance document on practices
to model and implement EARTHQUAKE hazards in extended PSA (final version) - Volume 1
Report IRSN/PSN-RES/SAG/ 2017-00004 Technical report ASAMPSA_E/ WP21/ D50.15/ 2017-33 vol1 35 / 142
ASAMPSA_E
It should also be noted that a well-defined seismotectonic model which is in agreement with current
scientific standards will serve as a strong argument to defend the final results of a hazard assessment.
Seismogenic structures (active faults). Earthquakes occur on geological faults. Most parts of Europe are
intra-plate areas with slow (< 1 mm/year) or very slow (< 0.1 mm/year) fault displacement rates pro-
ducing strong earthquakes (M ~ 5 and larger) at recurrence intervals of 10³ to 105 years, which are sig-
nificantly longer than the time span covered by earthquake records (generally <10³ years; see below). It
is therefore very unlikely that all the active faults, which pose a potential threat in a certain region,
have produced earthquakes in historical times, i.e., in the last 500 years or so. It is equally unlikely that
all active faults can be recognized from analyzing the earthquake record. The hazard contribution of ac-
tive faults therefore cannot be assessed from earthquake data alone as active faults which have not
produced historical or instrumental seismicity are invisible in the earthquake record. Seismic hazard as-
sessments which are exclusively based on earthquake data disregarding active faults may lead to severe-
ly underestimated hazard values.
The epistemic uncertainties resulting from the inadequate time coverage of earthquake catalogues shall
be reduced by systematic fault mapping and the collection of data to locate and characterize active
faults (IAEA, 2010; WENRA, 2016). Systematic geologic surveys for identifying seismogenic faults signifi-
cant for hazard results shall extend to a sufficient distance from the site. The choice of the distance to
perform dedicated investigations may depend on the site seismicity. Larger distances may be adequate
for sites with apparent low hazard as strong earthquakes occurring on remote faults may produce ground
motion on the site, which exceeds the assumed low values. Systematic efforts should at least be made
in the near-region of the site (25 km radius according to IAEA 2010).
General guidance for the identification and characterization of active faults is given by IAEA (2010) and
more detailed by IAEA (2015c). Modern geosciences provide reliable tools for the identification and
characterization of active faults which are applicable within a reasonable time frame. Among these
methods quantitative tectonic geomorphology and paleoseismological techniques are regarded as key
methods. The tectonic geomorphology approach identifies landforms which result from the deformation
of the Earth’s surface by active faulting and deformation. It is capable of applying a time-saving graded
approach including: screening of relatively large areas (several 100 km²) to identify potentially active
faults, fault mapping, initial fault characterization and selection of faults requiring further analysis by
paleoseismological methods. Guidance for the implementation of the method is given below.
Paleoseismological trenching techniques allow to identify and to characterize prehistorical earthquakes
that occurred on surface-breaking faults in terms of the timing of earthquake occurrence, magnitude,
and recurrence intervals. These parameters shall be used to update the seismological database (see be-
low).
Seismological (earthquake) database. The requirements of a seismological database for seismic hazard
assessment are described in detail by IAEA (2010). IAEA discriminates between prehistoric, historical and
instrumental earthquakes due to the fact that these types of data are characterized by different relia-
bility and accuracy. The main data characteristics are summarized as follows:
Page 36
Guidance document on practices
to model and implement EARTHQUAKE hazards in extended PSA (final version) - Volume 1
Report IRSN/PSN-RES/SAG/ 2017-00004 Technical report ASAMPSA_E/ WP21/ D50.15/ 2017-33 vol1 36 / 142
ASAMPSA_E
Prehistorical earthquake data typically derive from paleoseismological trenching of active faults. The
data are precise with respect to the location of the earthquake because they occurred on the trenched
seismogenic source. Magnitudes are estimated from empirical relationships between faulting parameters
(e.g., surface displacement) and magnitude (compare IAEA, 2015c, pages 95-107). Magnitudes therefore
have error bars which can be quantified by statistical methods (Hintersberer & Decker, 2016). The accu-
racy of timing of the events is limited by the applied dating techniques (compare IAEA, 2015c, pages 82-
91) and may therefore be subjected to errors up to a range of few thousand years. Data completeness
depends on the effort and depth of research, and the local geological situation which may be favorable
or unfavorable to conserve the effects of prehistorical earthquakes. Data quality and completeness can
be increased by additional investigations in reasonable time. In some exceptional cases attention needs
to be paid to the stationarity of data. Such a case is the deglaciation of Northern Europe during the last
late Pleistocene to Holocene.
Historical earthquake data are compiled from historical documents which include descriptions of the
earthquake effects at different locations. These descriptions are interpreted in terms of macroseismic
intensity resulting in a set of intensity data points, which in turn are used to estimate the location of
the epicenter and the maximum (epicentral) intensity. Earthquake magnitudes are derived from empiri-
cal intensity-magnitude correlations for the maximum (epicentral) intensity or from modeling approach-
es using all intensity datapoints of a single earthquake (Gasperini et al., 1999; Álvarez-Rubio & Fäh,
2009). The workflow therefore includes a number of steps that may introduce substantial errors: inter-
pretation of historical sources; intensity assessment for intensity datapoints; assessment of epicenter lo-
cation; assessment of epicentral intensity; intensity-magnitude conversion. Earthquake location, intensi-
ty, and magnitude will therefore be subjected to significant uncertainties, which frequently are not
mentioned or quantified in earthquake catalogues. Due to the uncertainties of earthquake locations
which may reach up to several tens of kilometers it will only in exceptional cases be possible to associ-
ate historical events to a certain seismic source. The data completeness and quality of historical earth-
quake data can be increased by targeted historical research but will finally be limited by availability of
historical documents.
The quality and accuracy of instrumental earthquake data is strongly dependent on the density and
quality of the seismic station network which has substantially changed since the beginning of instrumen-
tal records in the late 19th century. Location accuracy, reliability of magnitude values, and record
thresholds will generally increase in quality through the 20th century but need to be assessed separately
for different locations.
As suggested by IAEA (2010) the seismological database data should also include all types of data that
help identifying seismogenic structures and support the seismotectonic model. Such data may particular-
ly be obtained from local seismic networks around nuclear installations and include focal mechanisms,
fore- and aftershock sequences, and precise relocations of earthquakes. IAEA (2015) further clearly
states that “seismic hazard assessments based on historical data are not sufficient to capture low fre-
quency seismic events. Investigations to collect prehistoric data are needed”.
Page 37
Guidance document on practices
to model and implement EARTHQUAKE hazards in extended PSA (final version) - Volume 1
Report IRSN/PSN-RES/SAG/ 2017-00004 Technical report ASAMPSA_E/ WP21/ D50.15/ 2017-33 vol1 37 / 142
ASAMPSA_E
Site conditions. Site-specific seismic hazard assessments require to determine the geotechnical and dy-
namic characteristics of the site considering site topography, the crustal and soil structure below the
reactor basemat, and seismic velocity profiles of seismic and geotechnic bedrocks. Guidance on this is-
sue is provided by IAEA (2004).
IAEA (2009 SSG-9) provides an incomprehensive compilation of data which is required for the assessment at the
regional (RE; 300 km), near-regional (NR; 25 km), site-vicinity (SV; 5 km) and site (SI) scale. In addition to the
data listed there the following data should be collected and acquired to support hazard assessment:
Database of scientific and technical literature:
Data: Geological and geophysical research papers on seismicity, seismotectonics, and active faulting.
The number of topical papers has tremendously increased in the past years due to a recent shift of
the focus of academic research to active seismotectonic phenomena and processes. It is therefore in-
dispensable to collect a database of relevant scientific papers (RE, NR, SV)
Purpose: Support the construction of a seismotectonic model
Seismological data:
Data: Earthquake catalogues with instrumental / historical / paleoseismological data (RE, NR, SV)
Earthquake data from local observation networks (NR, SV) and data listed in by IAEA (2010)
Purpose: Definition of seismicity; construction of a seismotectonic model; identification of active
faults
Data: Compilations of focal mechanism (fault plane solution) data and seismic moment tensors (RE)
Purpose: Assess the orientation and kinematics of seismogenic faults; support the construction of a
seismotectonic model
Data: Strong motion data and/or intensity data points of individual events, isoseismal maps, ground
motion prediction equations published in scientific and technical literature data (RE)
Purpose: Selection of appropriate ground motion prediction equations
Geological and tectonic data:
Data: Tectonic maps showing all relevant faults (both inactive and active) with adequate scales;
compilation of the tectonic history of the area under consideration as derived from structural geology
techniques and tectonic analyses (literature compilation); list of significant6 tectonic faults (both ac-
tive and inactive) with fault names, orientation, slip characteristics, geological evidence for youngest
slip events (RE, NR, SV); recent stress data preferably from deep industrial boreholes (RE)
6 Significant faults are > 10 km long (RE), > 5 km (NR), and > 1 km (SV)
Page 38
Guidance document on practices
to model and implement EARTHQUAKE hazards in extended PSA (final version) - Volume 1
Report IRSN/PSN-RES/SAG/ 2017-00004 Technical report ASAMPSA_E/ WP21/ D50.15/ 2017-33 vol1 38 / 142
ASAMPSA_E
Purpose: Support the construction of a seismotectonic model; locate and characterize faults (orien-
tation, slip characteristics); identify faults which could move in current stress field (RE, NR, SV)
Data: List of proved / disputed active faults from published data or fault databases (RE, NR)
Purpose: Support the construction of a seismotectonic model; locate and characterize active faults
Geophysical data:
Data: Reflection / refraction seismic, seismic tomography, heat flow, gravity (RE)
Purpose: Define the thickness of the seismogenic crust and sources of seismicity in the mantle7
Data: Reflection seismic, gravity, magnetic (RE, NR)
Purpose: Map tectonic faults
Data: High-resolution near-surface geophysical data (reflection seismic, resistivity, gravity, ground
penetrating radar) (NR, SV, SI)
Purpose: Map and locate potentially active faults precisely for paleoseismological investigations
Topographic and remote sensing data:
Data: Satellite imagery, aerial photographs, Digital Elevation Models (DEM) and high-resolution LIDAR
elevation data with resolution adequate to the scale (RE, NR, SV)
Purpose: Support tectonic geomorphology and mapping of potentially active faults
Data: GPS data and conventional geodetic data (repeated precise levelling) (RE, NR)
Purpose: Asses horizontal / vertical crustal movements to support the identification of active faults
Site-specific data:
Data: Rock and soil profiles below facility, geotechnical bedrock and soil properties, seismic veloci-
ties of bedrock and soil (Vs 30), topographic data obtained from boreholes and geophysical investiga-
tions (SI), cross-hole seismic tests
Purpose: Assess site conditions in terms of dynamic elastic properties to characterize soil-structure
interaction
Human activities
Data: Location and type of facilities that may induce / trigger seismicity (deep oil, gas or water ex-
traction wells; deep injection wells; mines; quarries etc.) (NR)
Purpose: Assess induced and triggered seismicity
Numerical simulation data
Data: earthquake ground motion models, (e.g., modeling of ground motion from fault parameters),
Purpose: constrain ground motion characteristics.
7 E.g., the subducting slab in the Vrancea region, Romania.
Page 39
Guidance document on practices
to model and implement EARTHQUAKE hazards in extended PSA (final version) - Volume 1
Report IRSN/PSN-RES/SAG/ 2017-00004 Technical report ASAMPSA_E/ WP21/ D50.15/ 2017-33 vol1 39 / 142
ASAMPSA_E
3.1.2 DATA FOR ASSESSING SURFACE FAULTING AT THE SITE (FAULT CAPABIL-
ITY)
Guidance on the assessment of fault capability is provided by IAEA (2010, paragraphs 8.1 to 8.13). The cited doc-
ument provides a definition of the term “capable fault”. Accordingly, “a fault should be considered capable if it
shows evidence of past movement or movements … of a recurring nature within such a period that it is reasonable
to conclude that further movements at or near the surface may occur. In highly active areas … periods of the
order of tens of thousands of years (e.g. Upper Pleistocene-Holocene, i.e., present) may be appropriate for the
assessment of capable faults. In less active areas, it is likely that much longer periods (e.g. Pliocene-Quaternary,
i.e. present) are appropriate.” (IAEA, 2010).
Most parts of Europe are intra-plate areas with low to moderate seismicity produced by slow to very slow faults.
Such regions cannot be regarded as “highly active”. According to IAEA’s definition the assessment of fault capabil-
ity therefore shall address a geological time period that at least includes the entire Quaternary (< 2.6 mio. years
before present) or extends back into the Pliocene (5.3 to 2.6 mio. years b.p.). The assessment of whether a fault
moved repeatedly through that period of time, or not, requires an in-depth geological and paleoseismological
approach as partly outlined by IAEA (2015c).
Although the assessment of fault capability focuses on the site it may be necessary to acquire data reaching out
beyond this geographical area. This is due to the fact that faults in the near region (25 km) or site vicinity (5 km
from the site) may extend into the site and that fault assessment at the site is hindered or impossible due to geo-
logical, technical, or logistical reasons.
The following data are required for the assessment:
Seismological data:
Data: earthquake data from local observation networks with precise hypocenter locations; focal
mechanism data (fault plane solutions, moment tensor solutions) from events that occurred in the re-
gion around the site,
Purpose: check the coincidence of earthquake hypocenters with known tectonic faults; assess the lo-
cation, orientation, and kinematics of the faults which produce earthquakes close to or at the site.
Geological data:
Data: geological and tectonic maps showing all types of faults (both inactive and active) at adequate
resolution (1:5.000 or higher); borehole data; lithology, stratigraphy, and age data of sediments
which are offset by faults or seal faults; data on the fault rock (mylonite, cataclasite etc.),
Purpose: locate and characterize faults (orientation, dip); date the youngest fault movements by off-
set/non-offset sediments; check consistency of fault rock with near-surface faulting (nature of fault
gouge with respect to P/T conditions and deformation mechanisms).
Page 40
Guidance document on practices
to model and implement EARTHQUAKE hazards in extended PSA (final version) - Volume 1
Report IRSN/PSN-RES/SAG/ 2017-00004 Technical report ASAMPSA_E/ WP21/ D50.15/ 2017-33 vol1 40 / 142
ASAMPSA_E
Geophysical data:
Data: reflection seismic, airborne geophysical data (resistivity, magnetics), gravity data to locate
faults on the RE and NR scale; reflection seismic as the state-of-the-art method providing images of
the layering and structures of the underground should be preferred,
Purpose: map and locate faults for further investigations.
Topographic and remote sensing data
Data: high-resolution aerial photographs, high-resolution LIDAR elevation data,
Purpose: support tectonic geomorphology and map surface expressions of capable faults.
Geodetic data:
Data: GPS derived and conventional geodetic data (repeated precise levelling),
Purpose: assess horizontal and vertical movements to support the identification of active faults.
Geophysical data for precise fault location:
Data: high-resolution reflection seismic, resistivity, gravity, ground penetrating radar data (GPR) to
locate near-surface faults; methods providing images of the layering and structures of the under-
ground such as reflection seismic and GPR should be preferred,
Purpose: map and locate potentially active faults precisely for paleoseismological investigations.
Paleoseismological data:
Data: evidence for past fault movements derived from paleoseismological trenching (age of the
youngest fault displacement; magnitude and timing of repeated slip events; evidence for paleoearth-
quakes; recurrence intervals of slip events) and offset,
Data: evidence for the sealing of the fault by undisplaced sediments (age of the youngest fault dis-
placement),
Purpose: asses the possibility, magnitude, timing, and recurrence rate of surface faulting.
Page 41
Guidance document on practices
to model and implement EARTHQUAKE hazards in extended PSA (final version) - Volume 1
Report IRSN/PSN-RES/SAG/ 2017-00004 Technical report ASAMPSA_E/ WP21/ D50.15/ 2017-33 vol1 41 / 142
ASAMPSA_E
3.1.3 DATA FOR ASSESSING LIQUEFACTION AND DYNAMIC COMPACTION
The data requirements for assessments of the liquefaction and dynamic compaction potential are summarized by
IAEA (2004). Data collection should include the following:
Site-specific geological and geomechanical data:
Data: high-resolution geological maps; drilling profiles; boring logs and test pit logs; lithology, stratigra-
phy, and age data of sediments; grain size; soil properties from in-situ (e.g., standard or cone penetration
tests) and laboratory soil mechanic testing (geomechanical soil parameters); seismic wave velocities
(Vs30),
Purpose: constrain the thickness and 3D geometry of sediment layers and soil; characterize lithological
and geotechnical properties of the layers.
Geophysical data:
Data: high-resolution reflection seismic, resistivity, ground penetrating radar data (GPR); methods
providing images of the layering and structures of the underground such as reflection seismic and GPR
should be preferred,
Purpose: constrain the 3D geometry of sediment layers and soil.
Site-specific hydrological and hydrogeological data:
Data: groundwater level and ground water level fluctuations; hydrological data of fore-flood river, lake or
sea; climate and rainfall records; porosity, permeability, and water saturation of sediments and soil,
Purpose: constrain the thickness and 3D geometry of sediment layers; characterize variations of the hy-
drogeological properties of layers.
Paleoseismological data:
Data: evidence for past liquefaction of sediments at the site or at locations which are similar to the site
(e.g., evidence of clastic dykes or intrusions, paleo-sand volcanoes, lateral spreading etc.,
Purpose: confirm or reject the occurrence of past liquefaction at the site.
Page 42
Guidance document on practices
to model and implement EARTHQUAKE hazards in extended PSA (final version) - Volume 1
Report IRSN/PSN-RES/SAG/ 2017-00004 Technical report ASAMPSA_E/ WP21/ D50.15/ 2017-33 vol1 42 / 142
ASAMPSA_E
3.1.4 DATA FOR ASSESSING PERMANENT GROUND DISPLACEMENT
The assessment of the potential of permanent ground displacement by earthquakes requires the assessment of
major active faults which have the potential to cause significant vertical ground displacement of the site. Large
co-seismic and post-seismic vertical displacements in the order of several meters have been recorded from numer-
ous earthquakes at oceanic subduction zones which are not present in Europe. In intra-plate Europe vertical dis-
placement may occur in the vicinity of normal faults (e.g., the Rhine Graben) and thrust faults (e.g., in Europe’s
active orogenic mountain belts). Vertical displacement may also occur above blind faults and related folds.
Data: all kinds of data required for the identification and characterization of active faults in the near-
region of the site (see above); fault dimensions,
Purpose: assess the maximum credible vertical displacement.
Page 43
Guidance document on practices
to model and implement EARTHQUAKE hazards in extended PSA (final version) - Volume 1
Report IRSN/PSN-RES/SAG/ 2017-00004 Technical report ASAMPSA_E/ WP21/ D50.15/ 2017-33 vol1 43 / 142
ASAMPSA_E
3.2 DATA SOURCES
3.2.1 EARTHQUAKE CATALOGUES
Earthquake catalogues with continent-wide coverage have been compiled by several European projects including
the projects SHARE (Seismic Hazard Harmonization in Europe) and AHEAD (European Archive of Historical Earth-
quake Data). The compiled catalogues (Table 2) are homogeneous with respect to the magnitude (Mw, moment
magnitude; see discussion by Grünthal et al. [2009] and Grünthal & Walström [2013]). The catalogues do not con-
sider earthquakes with magnitudes / intensities below a certain threshold (see references in Table 2 for details).
European earthquake catalogues
Region Link Reference Time coverage
Europe http://www.emidius.eu/SHEEC/ Stucchi et al., 2013 1000-1999
Europe http://www.gfz-potsdam.de/emec/ Grünthal & Walström, 2013 1000-2006
Europe http://www.gfz-potsdam.de/en/section/seismic-hazard-and-stress-field/products-and-services/cenec-earthquake-catalogue/
Grünthal et al., 2009 1000-2009
Europe http://www.bgr.bund.de/EN/Themen/Seismolo-gie/Erdbebenauswertung_en/Kataloge_en/historisch/EU_Oe_Schw_en.html
Van Gils & Leydecker, 1991 479 BC-1983
Europe http://emidius.eu/GEH/info/popup_pdf_complete.php?id=5801
Shebalin et al., 1998 342 BC-1990
Table 2. List of European earthquake catalogues with continent-wide coverage.
National earthquake catalogues are commonly being maintained and updated by the national seismological,
geophysical or geological surveys. Table 3 provides a non-exhaustive list of online links and references to such
catalogues.
Page 44
Guidance document on practices
to model and implement EARTHQUAKE hazards in extended PSA (final version) - Volume 1
Report IRSN/PSN-RES/SAG/ 2017-00004 Technical report ASAMPSA_E/ WP21/ D50.15/ 2017-33 vol1 44 / 142
ASAMPSA_E
National earthquake catalogues
Country Link Reference Time coverage
Austria Not online AEC, 2015 1201-2015
Belgium http://seismologie.be/index.php?LANG=EN&CNT=BE&LEVEL=0
1900-2015
Bulgaria Not online Bayliss & Burton, 2007
Grigorova et al., 1978
Croatia Not online Herak, 1995
ftp://hazards.cr.usgs.gov/LAHR/iaspei/data/croatia/zag_eq.txt
Herak et al., 1996 1908-1992
Czech Republic
http://www.czechgeo.cz/en/gfu-catalog/ 1976-2015
Not online ACORN, 2004 1267-2004
Denmark
Finland http://www.helsinki.fi/geo/seismo/maanjaristykset/suomi.html
FENCAT Catalog of earth-quakes in Finland since 2000
2000-2015
http://www.seismo.helsinki.fi/english/bulletins/ FENCAT Catalog of earth-quakes in Finland 1610 - 1999
1910-1999
France Not online LDG, 2011 1962-2011
Not online Baumont & Scotti, 2011
Germany http://www.bgr.bund.de/DE/Themen/Erdbeben-Gefaehrdungsanaly-sen/Seismologie/Seismologie/Erdbebenauswertung/Erdbebenkataloge/historische_Kataloge/germany.html;jsessionid=65EFBFA658A59A61C9D528A2B1D33014.1_cid284?nn=1544984
Leydecker, 2011 800-2008
Not online Grünthal, 1988 823-1984
Hungary Not online Hungarian Nastional Seismological Bulletin
2002-2013
http://www.seismology.hu/index.php/en/seismicity/earthquake-bulletins
456-1986
Italy http://emidius.mi.ingv.it/CPTI/ CPTI Working Group, 2004.
Lithuania http://www.lmaleidykla.lt/ojs/index.php/geologija/article/view/1894/800
Pačėsa & Šliaupa, 2011 1375-2006
Nether-lands
http://www.knmi.nl/nederland-nu/seismologie/aardbevingen
Recent earthqua-kes
Norway http://www.norsardata.no/NDC/recenteq/lastweek.html
NORSAR - Research Coun-cil of Norway
Poland Guterch & Lewandowska-Marciniak, 2002
Portugal http://www.emidius.eu/ahead/main/info/?en=62712
LNC, 1986
Portugal Not online Solares & Rodriguez, 2002
Romania http://www.seismo.ethz.ch/static/gshap/neurasia/nordasiacat.txt
Kondorskaya & Ulomov, 1999
http://www1.infp.ro/seismic-catalogue/events?page=1
National Institute for Earth Physics
Not online Oncescu et al., 1999 984-1997
Page 45
Guidance document on practices
to model and implement EARTHQUAKE hazards in extended PSA (final version) - Volume 1
Report IRSN/PSN-RES/SAG/ 2017-00004 Technical report ASAMPSA_E/ WP21/ D50.15/ 2017-33 vol1 45 / 142
ASAMPSA_E
Slovakia http://www.emidius.eu/AHEAD/main/info/?en=16940
Labak & Broucek, 1995.
Not online ACORN, 2004 1267-2004
Slovenia Not online Poljak, Živčić & Zu-pančič, 2002
Not online Ribaric, 1988
Spain http://www.ign.es/ign/resources/sismologia/publicaciones/Catalogohasta1900.pdf
Solares & Rodriguez, 2002
800-1900
New Atles Sísmic de Catalunya Vol.1 - Seismicity Catalogue
880-1996
Sweden Not online Walström, 1990
http://snsn.geofys.uu.se/
Switzer-land
http://www.seismo.ethz.ch/prod/catalog/index ECOS-09 (Earthquake Catalog of Switzerland 2009
250-2009
United Kingdom
http://quakes.bgs.ac.uk/earthquakes/dataSearch.html
Musson, 1994
Musson & Sargeant, 2007
Ukraina http://wdc.org.ua/en/data
Table 3. List of national earthquake catalogues of European countries.
Page 46
Guidance document on practices
to model and implement EARTHQUAKE hazards in extended PSA (final version) - Volume 1
Report IRSN/PSN-RES/SAG/ 2017-00004 Technical report ASAMPSA_E/ WP21/ D50.15/ 2017-33 vol1 46 / 142
ASAMPSA_E
In addition to the national earthquake catalogues a number of catalogues exist which focus on historical earth-
quakes (Table 4). The most comprehensive database is accessible via the AHEAD online portal (Locati et al.,
2014). It comprises extensive information on major historical events including macroseismic datapoints, estimates
of epicentral uncertainties, epicentral intensity with uncertainties, estimated magnitude (Mw) with uncertainties,
and references. The coverage of the database is shown in Figure 2.
A non-exhaustive list of catalogues of historical earthquakes that cover individual countries or regions is included
in Table 4.
Figure 2. Coverage of the database of historical earthquakes AHEAD (2015)
[Fig_AHEAD_historical_earthquake_data.JPG]
Page 47
Guidance document on practices
to model and implement EARTHQUAKE hazards in extended PSA (final version) - Volume 1
Report IRSN/PSN-RES/SAG/ 2017-00004 Technical report ASAMPSA_E/ WP21/ D50.15/ 2017-33 vol1 47 / 142
ASAMPSA_E
Catalogues focused on historical earthquake data
Region / Coun-try
Link Reference / database
Europe http://www.emidius.eu/ahead/main/ Locati et al., 2014
Austria https://www.zamg.ac.at/cms/de/geophysik/erdb
eben/historische-erdbeben
Austria http://opac.geologie.ac.at/wwwopacx/wwwopac.ashx?command=getcontent&server=images&value=Abhandlungen_67.pdf
Hammerl & Lenhardt, 2013
Belgium http://seismologie.be/index.php?LANG=NL&CNT=BE&LEVEL=230
Royal Observatory of Belgium
Bulgaria
Czech Republic http://www.ipe.muni.cz/newweb/english/temelin_en/hluboka_fault.php
Spacek et al., 2011, p. 19 ff
France http://www.sisfrance.net/ Sismicité historique de la France Métro-politaine
Germany http://www.bgr.bund.de/EN/Themen/Seismologie/Erdbebenauswertung_en/Kataloge_en/historisch/historische_erdbeben_inhalt_en.html
Bundesanstalt für Geowissenschaften und Rohstoffe
Spain http://www.ign.es/ign/layoutIn/bdmacrosismica.do
Base de datos de intensidad macrosismi-cita (IGN)
http://www.igc.cat/web/ca/sismologia_bdmacrosis.html
Base de Dades Macrosísmica de Catalunya
Not online Mezcua et al., 2004
Finland Not online Mäntyniemi et al., 2007
France http://www.sisfrance.net/ Sismicité historique de la France Métro-pole
Greece http://macroseismology.geol.uoa.gr/ Hellenic Macroseismic Database (UoA)
Not online Kouskouna & Sakkas, 2013
Italy http://emidius.mi.ingv.it/ASMI/ ASMI Archivio Storico Macrosismico
Lithuania Not online Mäntyniemi et al., 2007.
Norway http://www.norsar.no/seismology/Earthquakes/SeismicityNorway/ELOCS/
Historical seismicity on the norwegian continental shelf (ELCOS)
Poland http://private.igf.edu.pl/~pwiejacz/p/ Pagaczewski, 1972
Slovakia Slovak macroseismic earthquake catalogue (SLOVMEC)
Kysel et al., 2016
Slovenia Cecić, 2016
Spain http://www.igc.cat/web/files/IGC_2006_sismologia_segles.pdf
Olivera et al., 2006
Sweden Not online Mäntyniemi et al., 2007
Switzerland Fäh et al., 2016
United King-dom
http://www.earthquakes.bgs.ac.uk/historical/data/studies/MUSS008/MUSS008.pdf
UK Historical Earthquake Database
Table 4. List of earthquake catalogues focused on historical earthquake data.
Page 48
Guidance document on practices
to model and implement EARTHQUAKE hazards in extended PSA (final version) - Volume 1
Report IRSN/PSN-RES/SAG/ 2017-00004 Technical report ASAMPSA_E/ WP21/ D50.15/ 2017-33 vol1 48 / 142
ASAMPSA_E
Seismological data in excess of data recorded in earthquake catalogues may exist from local seismic monitoring
networks. Such networks may not be connected with the national observation grid and the recorded data may
therefore not be included in national or regional earthquake catalogues.
Seismic networks may be installed or have been operational for some periods of time for research purposes, e.g.,
the observation of aftershock sequences subsequent to major earthquakes or to monitor teleseismic events for
seismic tomography. Such data may be accessible via the operating scientific organizations. A list of digital seis-
mograph networks, both permanent and temporary, is provided and updated by the International Federation of
Digital Seismograph Networks (FDSN; http://www.fdsn.org/networks/?). The list includes deployment countries /
regions, network names, links to network operators, and data access.
Data recorded by such temporary networks may significantly contribute to identify seismogenic faults by accurate-
ly localized earthquake hypocenters, understand fault kinematics using first arrival studies or seismic moment
tensor solutions, etc. An example for the benefit of analyzing microearthquakes recorded by dense local seismo-
logical networks is the identification of the Shoreline Fault close to the Diablo Canyon NPP which led to an update
of the seismic hazard assessment (USNRC, 2012).
Local seismic monitoring networks around nuclear power plants are dealt with in chapter 3.2.5 on page 54.
3.2.2 EARTHQUAKE FOCAL MECHANISMS AND RECENT STRESS DATABASES
Earthquake focal mechanisms (fault plane solution) data and seismic moment tensors provide evidence on the
orientation and slip direction of the fault which created a specific earthquake and are therefore an important
basis for the construction of seismotectonic models. For strong earthquakes such data are routinely produced and
collected in a number of databases, which all allow data queries and downloads (Table 5).
Recent stress data (orientation of the maximum horizontal compressive stresses) are equally im-
portant to constrain seismotectonic models and assess the probability of slip at pre-existing faults.
Data are collected in the World Stress Map (WSM) database (
Figure 3, Table 5). The WSM includes tools for data query, download, and visualization.
The databases listed in (Table 5) are not comprehensive and numerous additional data may exist in scientific liter-
ature or at the local geophysical / seismological / geological surveys. Focal mechanisms may particularly be avail-
able from site-specific observation networks. Stress data which are not included in the WSM may be available from
deep drilling (e.g., for hydrocarbon or thermal water exploration) and mining activities.
Page 49
Guidance document on practices
to model and implement EARTHQUAKE hazards in extended PSA (final version) - Volume 1
Report IRSN/PSN-RES/SAG/ 2017-00004 Technical report ASAMPSA_E/ WP21/ D50.15/ 2017-33 vol1 49 / 142
ASAMPSA_E
Figure 3. European stress data of the World Stress Map (WSM) database (release 2008)
[Fig_WSM_Database.JPG]
Page 50
Guidance document on practices
to model and implement EARTHQUAKE hazards in extended PSA (final version) - Volume 1
Report IRSN/PSN-RES/SAG/ 2017-00004 Technical report ASAMPSA_E/ WP21/ D50.15/ 2017-33 vol1 50 / 142
ASAMPSA_E
Moment tensor, earthquake mechanisms and recent stress orientation databases
Name Link Reference
Global Centroid-Moment-Tensor (CMT) Database
http://www.globalcmt.org/ Dziewonski et al., 1981
Global Centroid-Moment-Tensor (CMT) Database
http://www.globalcmt.org/ Ekström et al., 2012
EMSC quick Moment Tensor Solu-tions
http://www.emsc-csem.org/Earthquake/index_tensors.php
USGS Moment Tensor and Broad-band Source Parameter Search
http://earthquake.usgs.gov/earthquakes/eqarchives/sopar/
Moment Tensor Product Query - IRIS
http://ds.iris.edu/spud/momenttensor
European-Mediterranean RCMT Catalogue
http://www.bo.ingv.it/RCMT/searchRCMT.html
EMMA Database of Earthquake Mechanisms for European Area
http://www.emsc-csem.org/Earthquake/emma.php
Vanucci & Gasperini, 2003
EMMA Database of Earthquake Mechanisms for European Area
http://www.emsc-csem.org/Earthquake/emma.php
Vanucci & Gasperini, 2004
WSM World Stress Map database http://dc-app3-14.gfz-pots-dam.de/pub/stress_data/stress_data_frame.html
Heidbach et al., 2008
Table 5. List of moment tensor, earthquake mechanism and stress databases.
Page 51
Guidance document on practices
to model and implement EARTHQUAKE hazards in extended PSA (final version) - Volume 1
Report IRSN/PSN-RES/SAG/ 2017-00004 Technical report ASAMPSA_E/ WP21/ D50.15/ 2017-33 vol1 51 / 142
ASAMPSA_E
3.2.3 SEISMOGENIC SOURCE AND ACTIVE FAULT DATABASES
Active and capable fault databases which are maintained by geological surveys or academic research groups only
exist for a small number of European countries. References and links to these databases are included in Table 6. A
comprehensive database of active and capable faults in Europe does currently not exist. The only available Euro-
pean scale dataset is the European Database of Seismogenic Faults (EDSF) established by the SHARE project
(SHARE, 2012), which collected information of faults that are regarded to be capable of generating earthquakes
with M ≥ 5.5 as input for vibratory ground motion hazard assessment. The database is not comprehensive and al-
most exclusively contains information from those European countries which participated in SHARE (Figure 4, Table
6). The EDSF has not been updated since May 2012 (http://diss.rm.ingv.it/share-edsf/index.html).
Figure 4. Active and capable fault data: coverage of the SHARE database (SHARE, 2012)
[Fig_SHARE_overview_map.JPG]
Page 52
Guidance document on practices
to model and implement EARTHQUAKE hazards in extended PSA (final version) - Volume 1
Report IRSN/PSN-RES/SAG/ 2017-00004 Technical report ASAMPSA_E/ WP21/ D50.15/ 2017-33 vol1 52 / 142
ASAMPSA_E
Active and capable fault databases
Country SHARE 1 National Database
Austria Yes In preparation (Austrian Geological Survey & University Vienna)
Belgium No ² Lower Rhine Graben (Vanneste et al., 2013) 2
Bulgaria Yes
Croatia Yes
Czech Republic No ²
Denmark No
Finland No ² Kiuvamäki et al., 1998
France No ² NEOPAL 3 French Database of Recent Deformation and Paleoseismicity
http://www.neopal.net/
Germany No ² In preperation (BGR & Aachen University)
(Hürtgen et al., 2014)
Greece Yes GreDaSS 4 Greek Database of Seismogenic Sources
http://gredass.unife.it/
Hungary No Atlas of present-day geodynamics of the Pannonian Basin: neotectonic (actdive) structures (Horváth & Bada) http://geophysics.elte.hu/atlas/geodin_atlas.htm
Italy Yes ITHACA Italian Database of Capable Faults (Michetti et al., 2000)
http://sgi1.isprambiente.it/GeoMapViewer/index.html
DISS 4 Italian Database of Individual Seismogenic Sources (Basili et al., 2007) http://diss.rm.ingv.it/diss/
CEDIT Italian Catalogue of Earthquake-Induced Groudn-Failures (Fortunato et al. 2012) http://www.ceri.uniroma1.it/
Lithuania No
Netherlands Yes Lower Rhine Graben (Vanneste et al., 2013) 2
Portugal Yes Active Fault Databsae of Portugal (included in Spanish database QAFI) (Nemsa et al., 2012)
Romania No
Slovakia No ²
Slovenia Yes In preperation (Geological Survey of Slovenia)
(Jamsek-Rupnik et al., 2015)
Spain Yes QAFI Quaternary Active Faults Database of Iberia (Garcia-Mayordomo et al., 2012) http://www.igme.es/infoigme/aplicaciones/qafi/
Sweden No
Switzerland No ²
Ukraine No
United Kingdom No
1 SHARE 2013: http://diss.rm.ingv.it/share-edsf/SHARE_WP3.2_Database.html
2 Only single faults included in database
3 Database of geomorphic evidence for active tectonics; no fault data
4 Seismogenic sources, no fault data
Table 6. List of active and capable fault databases available for European countries.
Page 53
Guidance document on practices
to model and implement EARTHQUAKE hazards in extended PSA (final version) - Volume 1
Report IRSN/PSN-RES/SAG/ 2017-00004 Technical report ASAMPSA_E/ WP21/ D50.15/ 2017-33 vol1 53 / 142
ASAMPSA_E
Comparison of the active fault databases in the U.S. and Japan with the available databases in Europe shows that
the U.S. and Japanese databases fulfill significantly higher quality standards with respect to completeness and
data quality.
The main reasons for these differences appear to result from the different scientific approaches to seismic hazard.
The high quality and detailedness of the Japanese fault database clearly reflects the high level of seismic hazard
and the need to develop adequate hazard levels.
In the U.S. seismic hazard assessment is a common target of seismological and geological sciences, probably stimu-
lated by shortness of historical earthquake records which led to the study of active faults and implementation of
paleoseismological techniques already during the early 1970s. In contrast, seismic hazard assessments in Europe
were traditionally almost exclusively performed by seismologists who relied heavily (or exclusively) on earthquake
records. The first paleoseismological studies in Europe were consequently only made in the late 1990ies (e.g.,
Camelbeek & Meghraoui, 1998) and sporadic collections of fault data only commenced in the last years. Also, and
different from the U.S., no national or Europe-wide research programs exist for a systematic effort to identify,
map, and parameterize active fault. Such dedicated efforts, however, would be required to develop a European
fault database which is comparable to the U.S. or Japanese ones.
3.2.4 GEOLOGICAL, TOPOGRAPHICAL AND GEOPHYSICAL DATA OTHER THAN
EARTHQUAKES
Geological, topographical and geophysical data are generally available from:
national geological surveys, geological departments of local governments and districts or municipal
administration: geological maps, tectonic maps, geological cross-sections, thematic geophysical
maps, borehole data etc.,
national geodetic surveys, geodetic departments of local governments and districts or municipal ad-
ministration : topographic data, digital elevation data, digital topographic contour lines (to be used
for gridding to produce digital elevation data), LIDAR digital elevation data,
national geophysical surveys: various types of geophysical data, maps and cross-sections etc.
industry data from hydrocarbon, mining, or geothermal exploration : borehole data, geophysical data
(e.g., reflection seismic),
universities and other research institutes doing active geological / geophysical research in the area of
interest : scientific and technical papers and data.
Page 54
Guidance document on practices
to model and implement EARTHQUAKE hazards in extended PSA (final version) - Volume 1
Report IRSN/PSN-RES/SAG/ 2017-00004 Technical report ASAMPSA_E/ WP21/ D50.15/ 2017-33 vol1 54 / 142
ASAMPSA_E
3.2.5 SITE-SPECIFIC DATA INCLUDING DATA FROM SITE-SPECIFIC OBSERVATION
NETWORKS
Earthquake data. At many nuclear sites site-specific monitoring networks have been established to monitor the
seismic activity region around nuclear power plants. Although the recording length of these networks may be short
(two decades or less) the data is of particular importance due to its high resolution with respect to both, the rec-
ord threshold and accuracy. Data are of specific interest for the seismotectonic characterization of the near-region
and region of NPPs, the construction of a seismotectonic model, the identification of potential seismogenic faults,
and their assessment. Data are mostly proprietary to the nuclear operators.
Site-specific geological and geophysical data. Detailed data on the site are expected to be available from the
siting process and construction period of the facilities. Data should be used to assess site conditions with respect
to the geological and soil profile below the facilities for the assessment of vibratory ground motion, fault capabil-
ity, liquefaction, and dynamic compaction hazards.
3.2.6 OPERATIONAL EVENT DATABASE OF PLANTS
Information on observed earthquake effects on NPPs is collected in the ASAMPSA_E Report D10.3. The report pro-
vides references to detailed assessments. Additional information on selected occurrences of earthquakes at 10
NPPs is included in chapter 1.3 of this report.
Comprehensive information on incidents related to earthquakes can be found in the international Incident Report-
ing System (IRS) Database of IAEA (http://www-ns.iaea.org/reviews/op-safety-reviews.asp?s=7&l=49#irs). The IRS
is an international system jointly operated by IAEA and the Nuclear Energy Agency of the Organisation for Econom-
ic Cooperation and Development (OECD/NEA). The database contains reports on unusual events considered im-
portant for safety submitted by thirty-one participating countries. Access to the database is restricted to IAEA
Staff, IRS National Coordinators, NPPs, Utilities, and TSOs. Its contents (or parts of its contents) can therefore not
be reproduced or cited in ASAMPSA_E Reports.
Further information external hazards related events at NPPs can be obtained from the European Clearinghouse
Topical Operational Report (Ramos & Zerger, 2012). The report, however, is not open to use in ASAMPSA_E.
Page 55
Guidance document on practices
to model and implement EARTHQUAKE hazards in extended PSA (final version) - Volume 1
Report IRSN/PSN-RES/SAG/ 2017-00004 Technical report ASAMPSA_E/ WP21/ D50.15/ 2017-33 vol1 55 / 142
ASAMPSA_E
3.3 DATA COMPLETENESS AND QUALITY ASSESSMENT
3.3.1 COMPLETENESS OF EARTHQUAKE DATA
Earthquake catalogues are key data used for estimating the mean annual rate of seismic activity and magnitude-
frequency relations using the Gutenberg-Richter relation. A thorough assessment of data completeness is therefore
a prime prerequisite for SHA.
Both, historical and instrumental earthquake records are incomplete by their nature. The main sources for incom-
pleteness of historical data are:
Lack of historical records (e.g., due to low past population density; absence of chronologists; lack of
interest; intensities not reaching a record threshold [Gutdeutsch and Hammerl, 1999]; other events
distracting from earthquakes [e.g., war, social and political circumstances, other natural disasters]);
Ambiguity of descriptions that do not allow parameterizing earthquakes (time, intensity, location);
Lack or insufficient historical earthquake research.
The completeness of instrumental data depends on:
The timing of the implementation of seismic networks (in Europe generally starting during at the be-
ginning of the 20th century);
The geometry, density, and coverage of the seismic network;
Sensitivity of the instrumentation;
Malfunction of seismic stations over longer periods of time (e.g., due to war action; Hammerl et al.,
2001).
Assessments of earthquake catalogue completeness determine the time intervals in which a certain intensity or
magnitude class can be considered to be completely reported. Different approaches for such assessments have
been proposed (Stepp, 1972; Mulargia and Tinti, 1987; Grünthal et al., 1998; Stucchi et al., 2004; Wössner &
Wiemer, 2005). Among these the approaches which are based on Stepp’s (1972) method and on the analysis of
time-frequency plots are most commonly used (Nasir et al., 2013; USNRC, 2012a, vol. 1). Both approaches require
the declustering of earthquake catalogues.
Time-frequency plots: TCEF (Temporal Course of Earthquake Frequency, Figure 5) estimates the com-
pleteness of records for single intensity or magnitude classes by plotting the cumulative number of events
of a class versus time. The basic assumption is that earthquakes occur at constant average frequencies
through history, and that apparent frequency increases are due to more complete records (Gasperini and
Ferrari, 2000). The method is commonly used in Central Europe (e.g. Lenhardt, 1996; Decker et al., 2011;
Nasir et al., 2013). Recurrence intervals are computed for the time for which data are considered com-
plete.
Stepp-type analysis (Stepp Test, Figure 5; Stepp, 1972; Bollinger, 1973; Cuthbertson, 2006; Bus et al.,
2009): “The test relies on the statistical property of the Poisson distribution highlighting time intervals
during which the recorded earthquake occurrence rate is uniform. Supposing that earthquake occurrenc-
Page 56
Guidance document on practices
to model and implement EARTHQUAKE hazards in extended PSA (final version) - Volume 1
Report IRSN/PSN-RES/SAG/ 2017-00004 Technical report ASAMPSA_E/ WP21/ D50.15/ 2017-33 vol1 56 / 142
ASAMPSA_E
es follow a Poisson distribution, the test evaluates the stability of the mean rate of occurrences (λ) of
events which fall in a predefined intensity range in a series of time windows (T). If λ is constant, then
the standard deviation (σ) varies as 1/√T. On the contrary, if λ is not stable, σ deviates from the straight
line of the 1/√T slope. The length of the time interval at which no deviation from that straight line oc-
curs defines the completeness time interval for the given intensity range (Stepp, 1972). This interval is
visually determined from the plots. The test further evaluates the minimum observations length needed
for establishing reliable average recurrence intervals for events of a certain intensity class.” (modified
from Nasir et al., 2013).
Figure 5. Explanation of completeness assessments of earthquake catalogues using the Stepp Test
and the TCEF method for a single magnitude or intensity class. “Minimum observation period” in
the Step Plot designates the time required for establishing reliable average recurrence intervals.
[Stepp_TCEF_explanation.JPG]
An alternative approach to determine magnitude completeness thresholds and/or the year of beginning of com-
plete reporting of earthquakes of a certain magnitude of mainly instrumental data is described by Herak et al.
(2008).
Page 57
Guidance document on practices
to model and implement EARTHQUAKE hazards in extended PSA (final version) - Volume 1
Report IRSN/PSN-RES/SAG/ 2017-00004 Technical report ASAMPSA_E/ WP21/ D50.15/ 2017-33 vol1 57 / 142
ASAMPSA_E
Figure 6 to Figure 10 show the results of completeness assessments of typical European earthquake catalogues that
were performed with the Stepp Test and the TCEF method. The assessments are performed for a regional Europe-
an catalogue (CENEC, 2009; Grünthal et al., 2009) and four countries which were selected as examples for low
seismicity (Finland), moderate seismicity (Germany), moderate seismicity with extensive historical earthquake
research performed (France), and increased seismicity (Spain). The assessments generally show that:
the time windows of reasonably complete records increase with increasing earthquake magnitude / inten-
sity,
the number of earthquake records increases sharply at about 1900 AD due to the implementation of seis-
mographs,
records for “strong” to “heavily damaging” earthquakes (intensity class 5 < I0 ≤ 8; approximately corre-
sponding to magnitude M < 6) are only complete for the last 200 - 300 years,
records for “destructive” earthquakes (intensity class 9 and higher; approximately corresponding to mag-
nitude M ~ 6 to 7) are only complete for the last 300 - 500 years,
reliable recurrence interval for the strongest events can mostly not be established due to the rareness of
these events in the analyzed catalogues (i.e., the minimum observations periods needed for establishing
reliable average recurrence intervals for events is longer than the period of historical observations).
An interpretative summary of the completeness intervals is shown in Table 7.
Page 58
Guidance document on practices
to model and implement EARTHQUAKE hazards in extended PSA (final version) - Volume 1
Report IRSN/PSN-RES/SAG/ 2017-00004 Technical report ASAMPSA_E/ WP21/ D50.15/ 2017-33 vol1 58 / 142
ASAMPSA_E
Table
7.
Com
ple
teness
inte
rvals
est
imate
d f
rom
Euro
pean e
art
hquake c
ata
logues
usi
ng t
he S
tep T
est
and t
he T
CEF m
eth
od.
Data
sourc
es:
EU
: G
rünth
al
et
al.
, 2009;
FI:
and E
S:
see T
able
3 a
nd T
able
4 f
or
refe
rence (
magnit
ude-i
nte
nsi
ty c
onvers
ion a
fter
Mezcua e
t al.
, 2011);
FR
: Baum
ont
& S
cott
i, 2
011;
DE:
Leydecker,
2011.
Page 59
Guidance document on practices
to model and implement EARTHQUAKE hazards in extended PSA (final version) - Volume 1
Report IRSN/PSN-RES/SAG/ 2017-00004 Technical report ASAMPSA_E/ WP21/ D50.15/ 2017-33 vol1 59 / 142
ASAMPSA_E
Figure 6. Completeness assessment of the earthquake catalogue for Central, Western and North-
Western Europe (CENEC, 2009; Grünthal et al., 2009) using the Stepp Test and the TCEF meth-
od.[CENEC_Stepp.JPG CENEC_Tcef.JPG]
Page 60
Guidance document on practices
to model and implement EARTHQUAKE hazards in extended PSA (final version) - Volume 1
Report IRSN/PSN-RES/SAG/ 2017-00004 Technical report ASAMPSA_E/ WP21/ D50.15/ 2017-33 vol1 60 / 142
ASAMPSA_E
Figure 7. Completeness assessment of the Spanish earthquake catalogue (see Table 3 and Table 4
for reference) using the Stepp Test and TCEF method. [ES_Stepp.JPG ES_Tcef.JPG]
Page 61
Guidance document on practices
to model and implement EARTHQUAKE hazards in extended PSA (final version) - Volume 1
Report IRSN/PSN-RES/SAG/ 2017-00004 Technical report ASAMPSA_E/ WP21/ D50.15/ 2017-33 vol1 61 / 142
ASAMPSA_E
Figure 8. Completeness assessment of the Finnish earthquake catalogues (see Table 3 and Table 4 for refer-
ence) using the Stepp Test and TCEF method. [FI_Stepp.JPG FI_Tcef.JPG]
Page 62
Guidance document on practices
to model and implement EARTHQUAKE hazards in extended PSA (final version) - Volume 1
Report IRSN/PSN-RES/SAG/ 2017-00004 Technical report ASAMPSA_E/ WP21/ D50.15/ 2017-33 vol1 62 / 142
ASAMPSA_E
Figure 9. Completeness assessment of the French earthquake catalogues (see Table 3 and Table 4 for refer-
ence) using the Stepp Test and TCEF method. [FR_Stepp.JPG FR_Tcef.JPG]
Page 63
Guidance document on practices
to model and implement EARTHQUAKE hazards in extended PSA (final version) - Volume 1
Report IRSN/PSN-RES/SAG/ 2017-00004 Technical report ASAMPSA_E/ WP21/ D50.15/ 2017-33 vol1 63 / 142
ASAMPSA_E
Figure 10. Completeness assessment of the German earthquake catalogues (see Table 3 and Table 4 for refer-
ence) using the Stepp Test and TCEF method. [DE_Stepp.JPG DE_Tcef.JPG]
Page 64
Guidance document on practices
to model and implement EARTHQUAKE hazards in extended PSA (final version) - Volume 1
Report IRSN/PSN-RES/SAG/ 2017-00004 Technical report ASAMPSA_E/ WP21/ D50.15/ 2017-33 vol1 64 / 142
ASAMPSA_E
3.3.2 COMPLETENESS OF ACTIVE AND CAPABLE FAULT DATA
Databases or catalogues of active and capable faults in European countries can by their nature not be compared to
earthquake catalogues which are systematically compiled and updated by the national geophysical or geological
surveys.
The buildup of fault databases in Europe only started in the last decade due to the increased interest of academic
research on topics such as earthquake geology, seismotectonic and active fault processes. So far only few Europe-
an countries committed their geological surveys or other academic institutions to the systematic establishment
and maintenance of active fault databases.
The content, quality, and completeness of European databases therefore can currently not be compared to the
databases which exist for Japan (Active Fault Database of Japan; AIST, 2015) or the United States (Quaternary
Fault and Fold Database for the United States; USGS, 2015). The latter may be regarded as a best-practice exam-
ple with respect to detailedness, data content, and depth of research. Both, the U.S. and Japanese database are
continuously updated and include detailed information on fault location, kinematics, fault dimensions, slip rate,
earthquake recurrence intervals, paleoseismological data, and references to original studies.
Such detailedness is mostly not provided by the databases listed in Table 6 (e.g., the SHARE [2012] database only
provides part of the listed fault-specific data and only few and incomplete references to original studies). Also,
the databases are mostly not kept up to date.
The databases listed in Table 6 must therefore not be regarded as complete. Incompleteness results from:
limited and non-systematic basic research on active faults;
possibly incomplete collection of data during the establishment of the database;
the time elapsed since the compilation of the database.
The databases therefore can only serve as starting points for the assessment of active faults in site-specific hazard
assessments. Data needs to be supplemented by thorough literature reviews and site-specific geological investiga-
tions.
Page 65
Guidance document on practices
to model and implement EARTHQUAKE hazards in extended PSA (final version) - Volume 1
Report IRSN/PSN-RES/SAG/ 2017-00004 Technical report ASAMPSA_E/ WP21/ D50.15/ 2017-33 vol1 65 / 142
ASAMPSA_E
4 HAZARD ASSESSMENT METHODOLOGIES
4.1 OUTPUT OF THE HAZARD ASSESSMENT
4.1.1 PROBABILISTIC SEISMIC HAZARD ANALYSIS (PSHA)
Probabilistic seismic hazard assessment (PSHA) provides site-specific hazard results and their uncertainties for PGA
and different spectral accelerations. Hazard values are typically represented by hazard curves and hazard spectra
for a specified range of annual frequencies of exceedance and for different confidence values. These data are
required as an input for PSA.
The severity of vibratory ground motion should be expressed in terms of (WENRA, 2016):
peak ground acceleration (PGA);
spectral accelerations for all plant‐significant vibration frequencies;
peak ground velocity;
strong motion duration.
Hazard curves and hazard spectra relate the severity of ground shaking with its annual frequency of exceedance.
The severity of ground shaking may be expressed by peak ground accelerations (PGA, PGAH or PGAV; Figure 11) or
the spectral acceleration. In the latter case exceedance probabilities are calculated for different oscillation fre-
quencies (Figure 12). Hazard curves and hazard spectra should include mean hazard values, median, and percen-
tiles of confidence (0.05, 0.16, 0.84 and 0.95) to quantify the uncertainties of the assessment. Hazard assessment
should be based on the mean value of hazard curves as it accounts best for the epistemic uncertainty expressed by
the long tail of the hazard distribution (O. Scotti / N. Abrahamsen, pers. comm.)
Hazard results can further be represented by uniform hazard response spectra (UHRS) which provide quantitative
values of ground acceleration for different frequencies for a certain annual probability of exceedance (Figure 13).
UHRS should be prepared for different annual probabilities of exceedance such as 10-4 (corresponding to the mini-
mum design basis requirements) and lower probabilities of exceedance such as 10-5 and 10-6 required as input for
PSA and DEC analysis (WENRA, 2014a, b; 2015). All hazard results should be obtained for both, horizontal and ver-
tical free field motions, and for rock and soil hazard (WENRA, 2016).
Hazard values are required for defining the ground motion values for the design basis earthquake (DBE; 10‐4/year;
WENRA, 2014a, Issue T), and ground motion values for lower frequencies of exceedance which are required for the
assessment of Design Extension Conditions.
Outputs of hazard assessments should further include deaggregation plots to allow assessing the contribution of
different sources and assumptions to the overall hazard. A list with a typical output of probabilistic seismic hazard
assessment is provided by IAEA (2010, p. 49-50).
Page 66
Guidance document on practices
to model and implement EARTHQUAKE hazards in extended PSA (final version) - Volume 1
Report IRSN/PSN-RES/SAG/ 2017-00004 Technical report ASAMPSA_E/ WP21/ D50.15/ 2017-33 vol1 66 / 142
ASAMPSA_E
Figure 11. Examples of hazard curves: annual probability of exceedance of peak ground accelera-
tion. Curves are plotted for mean hazard value, median, and the 0.05, 0.16, 0.84 and 0.95 per-
centiles of confidence. [Hazard_curve_examples.JPG]
Page 67
Guidance document on practices
to model and implement EARTHQUAKE hazards in extended PSA (final version) - Volume 1
Report IRSN/PSN-RES/SAG/ 2017-00004 Technical report ASAMPSA_E/ WP21/ D50.15/ 2017-33 vol1 67 / 142
ASAMPSA_E
Figure 12. Examples of hazard curves: probability of exceedance of spectral acceleration for dif-
ferent oscillation frequencies (1 Hz, 10 Hz, 20 Hz, 50 Hz) and a selected degree of damping (com-
monly 5%). Curves are plotted for mean hazard value, median, and the 0.05, 0.16, 0.84 and 0.95
percentiles of confidence. [Spectral_acceleration_examples.JPG]
Page 68
Guidance document on practices
to model and implement EARTHQUAKE hazards in extended PSA (final version) - Volume 1
Report IRSN/PSN-RES/SAG/ 2017-00004 Technical report ASAMPSA_E/ WP21/ D50.15/ 2017-33 vol1 68 / 142
ASAMPSA_E
Figure 13. Uniform Hazard Spectra (UHRS) plotted for different annual probabilities of exceedance
(10-4 to 10-7 per year) and a selected degree of damping (commonly 5%). Curves are plotted for
mean hazard value, median, and the 0.05, 0.16, 0.84 and 0.95 percentiles of confidence.
[Uniform_hazard_response_spectra_example.JPG]
Page 69
Guidance document on practices
to model and implement EARTHQUAKE hazards in extended PSA (final version) - Volume 1
Report IRSN/PSN-RES/SAG/ 2017-00004 Technical report ASAMPSA_E/ WP21/ D50.15/ 2017-33 vol1 69 / 142
ASAMPSA_E
4.1.2 DETERMINISTIC SEISMIC HAZARD ANALYSIS (DSHA)
DSHA determines the maximum credible amplitude of ground motion which may be expected at a site. The method
does not account for the probability of this ground motion to occur and it does not assess the recurrence intervals
of earthquakes leading to the estimated ground motion. As in PSHA, ground motion may be expressed by peak
ground acceleration (PGA), spectral accelerations for different vibration frequencies, peak ground velocity, or
strong motion duration.
By not providing probabilities for the occurrence of certain ground motion amplitudes, the method is typically not
used to determine input parameters for PSA. However, DSHA can provide an estimate of the largest amplitude of
vibratory ground motion to be expected at a site as an upper cutoff value for PSA or for the assessment of Design
Extension Conditions (DEC) as required by WENRA (2014a; reference levels F and T).
4.1.3 FAULT CAPABILTIY
The severity of fault capability hazard is expressed by the total amount of surface rupture displacement (horizon-
tal and vertical displacement) for both, primary on-fault and distributed off-fault surface ruptures. IAEA (2010)
discerns between primary displacement (“typically in the form of direct seismogenic fault rupture”) and second-
ary displacement (“typically associated with induced movement along pre-existing seismogenic slip planes (e.g. a
triggered slip on an existing fault or a bedding plane from an earthquake on another fault) and non-seismogenic
slip planes (e.g. localized fractures and weak clay seams)”).
Probabilistic Fault Displacement Hazard Analysis (PFDHA) determines the mean annual frequency of exceedance of
different amounts of surface fault displacement. Hazard results are expressed as fault displacement hazard curves
plotting the mean annual frequency of exceedance versus surface displacement. Assessments should also comprise
sensitivity analyses to show the influence of the various PFDHA input data and the sensitivity of results to the
range of uncertainty. Unlike for ground motion hazard PFDHA is typically not applied during the planning and con-
structional stage of a nuclear installation as IAEA recommends that “an alternative site should be considered” in
cases “where reliable evidence shows that there may be a capable fault with the potential to affect the safety of
a plant” (IAEA, 2010, para. 8.8). PFDHA is therefore generally applied to existing plants where capable faults were
identified during the lifetime of the plant8. As a consequence plants are originally not designed against any surface
displacement. A pending problem of PFDHA is that only a small number of assessments has been performed so far
and that assessments are based on very limited numbers of observations of displacements along primary faults and
distributed off-fault surface ruptures (see chapter 4.3.3, page 87).
8 A current exception is the planning of the Slovenian NPP Krsko II, where PFDHA was also applied during the siting
process after the detection of a number of capable faults in the site vicinity (Cline et al., 2015).
Page 70
Guidance document on practices
to model and implement EARTHQUAKE hazards in extended PSA (final version) - Volume 1
Report IRSN/PSN-RES/SAG/ 2017-00004 Technical report ASAMPSA_E/ WP21/ D50.15/ 2017-33 vol1 70 / 142
ASAMPSA_E
4.2 IDENTIFICATION OF KEY INPUT PARAMETERS
The following chapters provide short discussions of selected input parameters for seismic hazard evaluation, which
have significant impact on the outcome of the assessment. It is a common property of all discussed parameters
that their assessment is not straight forward and includes significant degrees of epistemic uncertainty. In PSHA
these uncertainties are commonly modelled by logic tree approaches which take into account different assess-
ments of the parameters.
4.2.1 FAULT SOURCES (ACTIVE FAULTS)
The identification and correct assessment of active faults in the surrounding of NPPs is regarded as a key issue in
seismic hazard assessment. The importance of identifying and characterizing active faults is stressed by IAEA
(2010), WENRA (2016), and IAEA (2015c).
As discussed in more detail in the chapter 3.1.1 (page 34), seismically active faults cannot be recognized from
analyzing the earthquake record alone. This is due to the fact that the active faults in intra-plate Europe are slow
to very slow moving structures which produce earthquakes at recurrence times of thousands to ten thousands of
years, which exceed the time coverage of earthquake records by factors between 10 and 100. Not identifying ac-
tive faults (because they have not produced recorded earthquakes) may result in significantly underestimated
hazard values.
The identification and assessment of active faults should use a graded approach as the one proposed in Figure 14
in order to allow for the screening of sufficiently large areas around the site (i.e., the near-region or region as
defined by IAEA, 2010). The approach may be structured into the following steps, which require increasing efforts:
regional assessment using tectonic geomorphology techniques;
detailed fault analysis and assessment;
active fault characterization.
The described workflow focuses on the identification of emergent active faults which reach up to the Earth’s sur-
face. Although some indications of buried (or “blind”) active faults which do not reach up to the surface may be
derived from geomorphological studies, these techniques are not sufficient to identify and characterize such
faults. Blind faults are particularly important in fold-thrust belts and their forelands (e.g., Molasse unit in the
Alpine foreland of Switzerland; Po Plain in the foreland of the Southern Alps / Apennines). Their assessment re-
quires targeted geophysical (reflection seismic) and seismological investigations (assignment of earthquakes to
buried faults).
Page 71
Guidance document on practices
to model and implement EARTHQUAKE hazards in extended PSA (final version) - Volume 1
Report IRSN/PSN-RES/SAG/ 2017-00004 Technical report ASAMPSA_E/ WP21/ D50.15/ 2017-33 vol1 71 / 142
ASAMPSA_E
Figure 14. Flow chart of the suggested graded approach for the identification and assessment of
active / capable faults in the near-region and region of a site.
[Fig_Fault_Identification_Flow_Chart.JPG]
Regional assessment using tectonic geomorphology techniques. A graded approach for active fault identifica-
tion and assessment may start from applying tectonic geomorphology techniques (e.g., Burbank & Anderson, 2011;
Schumm et al., 2000). The methods are capable to screen relatively large areas for potentially active faults which
impact recent morphology within a reasonable time and with sensible effort. Numerous case studies from low
seismicity regions with slow to very slow moving faults show that tectonic geomorphology techniques can identify
active faults with slip rates below 0.1 mm/year (see Table 8 for references). A recent case study form the near-
region of a European NPP has been published by Popotnig et al. (2013).
Many tectonic geomorphology methods are based on quantitative measurements of geomorphic features and on
the calculation of quantitative geomorphologic parameters supporting objective decisions about the activity or
inactivity of faults and reducing the uncertainties arising from purely experience-based expert opinion. The analy-
sis of landforms and calculation of geomorphologic parameters requires digital elevation data (DEM and/or LIDAR
data). The parameters are usually assessed in combination with all available geological and tectonic data in a GIS
environment. Analyzed morphological features include: mountain front morphology, drainage basin geometry,
river valley morphology, and river planform patterns. Table 8 provides an overview of commonly used quantitative
geomorphic indices and references of key studies from non-arid regions which are comparable to European condi-
tions.
Page 72
Guidance document on practices
to model and implement EARTHQUAKE hazards in extended PSA (final version) - Volume 1
Report IRSN/PSN-RES/SAG/ 2017-00004 Technical report ASAMPSA_E/ WP21/ D50.15/ 2017-33 vol1 72 / 142
ASAMPSA_E
Restrictions to the methods may arise in regions which were glaciated during the Würmian. In such areas landforms
are overprinted by young glacial erosion that may have erased the morphologic record of slow active faults. Ap-
plicability to blind faults is restricted to cases where blind faulting leads to topographic changes at the surface
(e.g., fold growth above a buried thrust ramp).
Tectonic geomorphology studies using quantitative geomorphic parameters
Reference Vf SL Smf Be C Re Rf Hi AF T Bs LSP FA
Ahmad & Bath, 2012 x x x x x x
Azor et al. 2002 x x x x
Bhatt et al. 2007 x x x x
Biswas & Grasemann 2005 x x x x
Bull & McFadden 1977 x x x
Cuong & Zuchiewicz 2001 x x
El Hamdouni et al. 2008 x x x x x x
Ezati & Agh-Atabai 2013 x x x x x
Font et al. 2010 x x
Garcia-Tortosa et al. 2008 x x
Garrote et al. 2006 x x
Giaconia et al. 2012 x x x x x x
Gürbüz & Gürer 2008 x x x
Khavari et al. 2009 x x x x
Pedrera et al. 2009 x x x
Pérez-Peña et al. 2010 x x x x x
Peters & van Balen 2007 x x x
Pinter 2005 x x
Popotnig et al. 2013 x x x x x x x x x
Rachna 2012 x x x x
Shtober-Zisu et al. 2008 x x x x
Troiani & Della Seta 2008 x x
Tsodoulos et al. 2008 x x x x x x x
Verrios et al. 2004 x x x x
Vf: Ratio of valley floor-width (Bull & McFadden, 1977)
SL: Stream length-gradient (Hack, 1973) Smf: Mountain sinuosity (Bull & McFadden, 1977)
Be: Basin elongation C: Circularity index (Bell, 2004)
Re: Drainage elongation ratio (Schumm, 1956) Rf: Basin shape (Talling et al., 1997)
Hi: Hypsometric integral (Walcott & Summerfield, 2008)
AF: Drainage basin asymmetry factor (Keller & Pinter, 2002) T: Transverse topographic symmetry factor (Keller & Pinter, 2002)
Bs: Elongation ratio (Ramirez-Herrera, 1998) LSP: Longitudional stream profiles (thalweg sections)
FA: Alluvial fan morphology
Table 8. Examples of tectonic geomorphology studies using quantitative geomorphic indices to identify
active and capable faults in non-arid regions.
Page 73
Guidance document on practices
to model and implement EARTHQUAKE hazards in extended PSA (final version) - Volume 1
Report IRSN/PSN-RES/SAG/ 2017-00004 Technical report ASAMPSA_E/ WP21/ D50.15/ 2017-33 vol1 73 / 142
ASAMPSA_E
Detailed fault analysis and assessment. The goal of the analysis is to decide whether a potentially active fault
(as identified during the regional assessment) is capable / active or not according to IAEA’s following definitions:
Capable fault (IAEA, 2010, 8.4., p. 30; compare also IAEA, 2003b, 3.6, p. 10-11):
“On the basis of geological, geophysical, geodetic or seismological data, a fault should be considered capable if
the following conditions apply:
(a) If it shows evidence of past movement or movements (such as significant deformations and/or dislocations)
of a recurring nature within such a period that it is reasonable to conclude that further movements at or
near the surface may occur. In highly active areas, where both earthquake data and geological data consist-
ently reveal short earthquake recurrence intervals, periods of the order of tens of thousands of years (e.g.
Upper Pleistocene–Holocene, i.e. the present) may be appropriate for the assessment of capable faults. In
less active areas, it is likely that much longer periods (e.g. Pliocene–Quaternary, i.e. the present) are ap-
propriate.
(b) If a structural relationship with a known capable fault has been demonstrated such that movement of the
one fault may cause movement of the other at or near the surface.
(c) If the maximum potential magnitude associated with a seismogenic structure, as determined in Section 4, is
sufficiently large and at such a depth that it is reasonable to conclude that, in the current tectonic setting
of the plant, movement at or near the surface may occur.”
Active fault (IAEA, 2015, p. 157):
“A tectonic structure that moved in the recent geologic past and that is expected to move within a future time
span of concern for the safety of a nuclear installation. In highly active (e.g., interplate) areas with short earth-
quake recurrence intervals, periods of the order of tens of thousands of years (e.g., Upper Pleistocene to pre-
sent) may be appropriate for defining a fault as active. In less active areas (e.g., intraplate) much longer periods
(e.g., Pliocene –Quaternary to present) may be appropriate. In the conservative perspective of NPP siting, any
fault within the Earth’s crust might need to be reassessed for potential re-activation. In fact, it is impossible to
exclude that an earthquake of low magnitude may occur along any fault (Modified from IAEA SSG-9, 8.4).”
The definitions differ by the fact that the term “active fault” includes blind faults, which are not capable to cause
surface fault rupture (a blind fault is a “Buried fault not reaching up to the ground surface when it was last ac-
tive. Usually applied to buried reverse or thrust faults. [IAEA, 2015c, p. 158]). It should be noted that earth-
quakes on blind faults, however, may induce ruptures on secondary faults at the Earth’s surface.
Page 74
Guidance document on practices
to model and implement EARTHQUAKE hazards in extended PSA (final version) - Volume 1
Report IRSN/PSN-RES/SAG/ 2017-00004 Technical report ASAMPSA_E/ WP21/ D50.15/ 2017-33 vol1 74 / 142
ASAMPSA_E
STATE EVIDENCE
Extinct
Fault does not displace Pliocene-Quaternary sediments or structures
The mineralogy of mechanically continuous fault rock is incompatible with the current stress/temperature regime
Fault is a small secondary feature
Unproven
Fault does not displace late Quaternary sediments or structures
Fault style and orientation makes a displacement unlikely in the current tectonic regime
Fault shows geographical association with small macroseismic earthquake or instrumental earthquake located by regional network
Fault has undergone multiple post-variscan reactivation
Fault influences current morphology as shown by quantitative tectonic geomor-phology parameters
Fault has a close analogue proved active
Active
Fault has appropriate dimensions and is uniquely implicated by well-located earthquake(s)
Fault coincides with accurately located hypocentre(s) from local network and is consistent with parameters from well-constrained focal mechanism(s)
Fault displaces ground surface or Quaternary deposits and/or structures
Table 9. Criteria for assessing faults as “active” or “extinct” (Mallard, 1991)
Table 9 summarizes possible criteria to assess faults as “active”, “extinct” (inactive), or “unproven”.
Guidance on the detailed analysis of potentially active faults is provided by IAEA (2010, 2015c) and references
therein. The assessment generally relies on appropriate combinations of geological, geophysical, paleoseismologi-
cal, seismological, geomorphological, and geodetic methods. Among these, the following methods are regarded to
be of crucial importance:
analysis of seismicity from local networks to find coincidences between faults, accurately located hypo-
centers, and focal mechanisms,
analysis (including dating) of Quaternary and Pliocene sediments and their relation to the fault (offset or
sealing the fault),
high-resolution geophysical surveys to map and accurately locate near-surface faults (reflection seismic,
resistivity, ground penetrating radar). Preference should be given to methods providing accurate images
of subcrop structures.
Page 75
Guidance document on practices
to model and implement EARTHQUAKE hazards in extended PSA (final version) - Volume 1
Report IRSN/PSN-RES/SAG/ 2017-00004 Technical report ASAMPSA_E/ WP21/ D50.15/ 2017-33 vol1 75 / 142
ASAMPSA_E
Active fault characterization. For the modeling of ground motion hazard in PSHA and fault capability in PFDHA
active fault sources should be represented by their 3D location (outcrop trace, dip direction, dip), fault length,
depth and area, fault kinematics (slip vector and slip direction), slip rate, seismogenic depth (minimum/maximum
depth of earthquakes). These geological data allow estimating:
the maximum magnitude of earthquakes produced by the fault using empirical relationships between
faulting parameters and magnitude (e.g., Wells & Coppersmith, 1994; Vakov, 1996; Mohammadioun &
Serva, 2001; Hanks & Bakun, 2002; Leonard, 2010; Striling et al., 2002; 2013). An in-depth discussion of
the application of these methods and their uncertainties is provided by Stirling & Godet (2012) and IAEA
(2015c, page 95 ff),
the recurrence intervals of earthquakes from geologically determined slip rates and fault dimensions.
Both, the estimates of maximum magnitudes and recurrence intervals of strong earthquakes should be compared
to and validated by paleoseismological trenching (see IAEA, 2015c and McCalpin, 2009 for additional guidance).
Probabilistic Fault Displacement Hazard Analyses (PFDHA) require very detailed data to characterize the faults
under consideration. Data need to characterize faults in terms of slip rate, event recurrence intervals, magnitude
and direction of slip events (fault displacements), existence of secondary faults and fractures etc. (compare IAEA,
2010, chapter 8).
4.2.2 SEISMIC SOURCE ZONES (ZONES OF DIFFUSE SEISMICITY)
Seismic source zones (also referred to as zones of diffuse seismicity, IAEA, 2010; area sources, NAGRA, 2004) are
defined as a region (or volume) of the Earth that is assumed to have uniform seismological characteristics with
respect to the rate of seismicity, the depth distribution of earthquakes, and maximum magnitude (Mmax, see be-
low). Source zones are defined as an area delimited by a polygon in a geographical coordinate space. Source zone
boundaries consequently delimit areas with different sets of seismicity parameters.
Due to the fact that source zones are regarded homogeneous with respect to the seismicity rates9, their geome-
tries have a very large potential effect on hazard evaluations. An extreme example is shown in Figure 15 where in
one case a site is “fenced” from a higher seismicity by a source zone boundary preventing higher seismicity rates
to apply to the site, and a second case where high seismicity is unduly spread over a large area.
9 Seismicity is considered spatially homogeneous within a single zone. The probability of an earthquake of a cer-
tain magnitude to occur is therefore the same throughout the source zone.
Page 76
Guidance document on practices
to model and implement EARTHQUAKE hazards in extended PSA (final version) - Volume 1
Report IRSN/PSN-RES/SAG/ 2017-00004 Technical report ASAMPSA_E/ WP21/ D50.15/ 2017-33 vol1 76 / 142
ASAMPSA_E
Figure 15. Examples of unreasonable seismic source zone definitions. (1) Source zones B and C
divide a continuos fault zone. (2) High seismicity in source zone C related to an unidentified active
fault is unduly spread over the entire source zone. (3) Source zone C “fences” a facility from other
source zones with higher seismicity. [Fig_Source_Zones.JPG]
The definition of source zones and their boundaries is based on the seismotectonic model (or several alternative
models) developed for the region of interest. The delineation of source zone boundaries should account for the
following:
1. Lithospheric and /or crustal structure (including crustal thickness / MOHO depth, subducting slabs) delin-
eating large-scale geological and rheological units;
2. Tectonic evolution and long-term deformation history;
3. Tectonic structures (fault orientation, style of faulting);
4. Current tectonic regime and states of stress;
5. Kinematics of seismic ruptures determined from focal mechanisms;
6. Depth of the brittle-ductile transition. The brittle-ductile transition governs the depth distribution of
earthquake hypocenters. It is in turn controlled by the crustal structure and the thermal state (heat flow)
of the crust;
7. Depth distribution of earthquake hypocenters;
8. Significant differences of the rate of occurrence of earthquakes which may be indicative for distinct tec-
tonic conditions.
Page 77
Guidance document on practices
to model and implement EARTHQUAKE hazards in extended PSA (final version) - Volume 1
Report IRSN/PSN-RES/SAG/ 2017-00004 Technical report ASAMPSA_E/ WP21/ D50.15/ 2017-33 vol1 77 / 142
ASAMPSA_E
Building seismic source zones exclusively on seismicity rates is not recommended and may be grossly misleading as
the rate of earthquake recurrence obtained from historical / instrumental data may not be stationary over long
(geological) time intervals10. Extrapolating the seismicity rate derived from observations through a geologically
insignificant time window may therefore lead to wrong estimates of the long-term seismicity rates which are ad-
dressed by seismic hazard evaluation for NPPs which aims at providing data for very low occurrence probabilities /
very long recurrence intervals.
10 The Vienna Basin Transfer Fault (Austria, Slovakia) may serves as an example of non-stationarity. Only few seg-
ments of the faults moved in historical times producing earthquakes, while several other segments have not
caused earthquakes throughout the historical observation period (c. 300-500 years; Hinsch & Decker, 2003; 2010).
Defining seismic source zone polygons based on observed seismicity (as for example shown in Figure 15/1) there-
fore would separate the historically active fault segments (source zones with high seismicity rate) from the inac-
tive ones (zones with low seismicity rate). This would to lead significantly underestimated hazard for the histori-
cally inactive fault strands.
Page 78
Guidance document on practices
to model and implement EARTHQUAKE hazards in extended PSA (final version) - Volume 1
Report IRSN/PSN-RES/SAG/ 2017-00004 Technical report ASAMPSA_E/ WP21/ D50.15/ 2017-33 vol1 78 / 142
ASAMPSA_E
4.2.3 GROUND MOTION PREDICTION EQUATIONS
Ground motion prediction equations (GMPEs) and attenuation models are used to relate seismic ground motion
parameters (such as ground acceleration, spectral acceleration, peak velocity, shaking duration) to magnitude and
distance from the seismic source (Figure 20). GMPEs should include algorithms for predicting the median ampli-
tude, an algorithm describing the variability (standard deviation) of the scatter of observations for the same mag-
nitude and distance, and the maximum ground motion that can occur (NAGRA, 2004).
A large variety of such models which are either based on empirical attenuation relations or numerical simulations
is available in seismological literature (see, for example, references in Delavaud et al., 2012).
Empirical relations derive from instrumental records of significant earthquakes and establish relations between
ground motion, magnitude, and distance to the source (measured either as hypocentral distance or as Joyner-
Boore distance). Due to the sparsity of strong instrumental earthquakes in Europe apart from the Mediterranean
region virtually no ground motion records exist which can be used to derive empirical attenuation relations for
large parts of Europe. It is therefore necessary to rely on empirical ground motion prediction equations established
in different parts of the world or on numerical simulation. Candidate GMPEs need to be adequate with respect to:
the geological environment (stable continental regions, active shallow crustal regions, subduction zones);
magnitude range;
distance range (including minimum distance from fault sources, if applicable);
hypocenter depth distribution;
tectonic style (strike-slip, reverse and normal faulting).
Selection further needs to account for the fact that GMPEs relate distance to different ground motion parameters
such as peak ground acceleration (PGA, PGAH, PGAV) and/or wave periods (most available models not applicable
for periods greater than 3 s; Delavaud et al., 2012). Equations account for site conditions in different ways such as
site classification (rock, shallow soil, deep soil) or site characteristics expressed by the seismic s-wave velocity VS30
using classes or continuous functions for VS30. Advanced GMPEs may further account for point sources as well as
extended sources, and nonlinear site response (Akkar et al., 2013).
The results of SHA are very sensitive to the choice of GMPEs / attenuation models, and the difficulties in selecting
appropriate sets of GMPEs introduce large uncertainties into the hazard assessment. It is therefore common praxis
in PSHA not to base the hazard evaluation on a single GMPE but to select a group of suitable GMPEs to model the
related uncertainty using a logic tree approach.
Criteria for selecting GMPEs for a logic tree are discussed in detail by Cotton et al. (2006). Accordingly, GMPEs
should be selected in order to “obtain the smallest possible suite of equations that can capture the expected
range of possible ground motions in the target region” (Cotton et al., 2006). The selection of GMPEs may be justi-
fied by comparing model predictions to existing European records of moderate earthquakes (e.g., Hintersberger et
al., 2007) or mathematical approaches (Scherbaum et al., 2009). Evaluation of the selected GMPEs should further
lead to assign weights to their use in ground motion logic trees, e.g., by expert judgement as described by
Delavaud et al. (2012). A comprehensive discussion of various aspects of selecting and adapting ground motion
Page 79
Guidance document on practices
to model and implement EARTHQUAKE hazards in extended PSA (final version) - Volume 1
Report IRSN/PSN-RES/SAG/ 2017-00004 Technical report ASAMPSA_E/ WP21/ D50.15/ 2017-33 vol1 79 / 142
ASAMPSA_E
models to a specific SHA is given in by NAGRA (2004, page 183 ff; e.g., magnitude conversion, conversion of hypo-
center to Joyner-Boore distances, adjustment for fault styles, site-conditions conversion accounting for VS30).
A comprehensive annotated collection of GMPEs published between 1968 and 2010 is provided by Douglas (2011).
Figure 16. Example of different GMPEs relating PGAH with distance for an earthquake with M = 6.
Note the large spread of predicted ground motion at, e.g., 10 km distance. GMPEs from:
Abrahamson & Silva (1997, 2008); Akkar & Bommer (2007); Ambraseys & Douglas (2003); Ambra-
seys et al. (1996; 2005); Atkinson & Boore (2006); Berge-Thierry et asl. (2003); Boore & Atkinson
(2007); Boore et al. (1993; 1997); Campbell & Bozorgnia (2008); Campbell (1997); Kalkan & Gülkan
(2004); Sabetta & Pugliese (1996); Sadigh et al. (1993; 1997); Tavakoli & Pezeshk (2005); Toro &
Silva (2001). [GMPEs_examples.JPG]
Page 80
Guidance document on practices
to model and implement EARTHQUAKE hazards in extended PSA (final version) - Volume 1
Report IRSN/PSN-RES/SAG/ 2017-00004 Technical report ASAMPSA_E/ WP21/ D50.15/ 2017-33 vol1 80 / 142
ASAMPSA_E
4.2.4 MAXIMUM MAGNITUDE (MMAX)
The maximum magnitude (Mmax) refers to the conceivably largest earthquake that can be generated by a seismic
source irrespective of its probability of occurrence. The parameter has to be determined for both, fault sources
and zones of diffused seismicity. The concept is based on the assumption that a physical limit exists to the magni-
tude of an earthquake that can be produced by a seismic source.
The selection of Mmax (sometimes also referred to as “maximum credible earthquake” or MCE) has a significant
impact on the results of seismic hazard assessment. Mmax is used in all earthquake recurrence relationships which
rely on Gutenberg-Richter (or modified Gutenberg-Richter) relations describing seismic sources (Figure 17).
Figure 17. Maximum magnitude: (a) cuttoff Gutenberg-Richter exponential distribution (Cornell &
Van Marke, 1969), (b) truncated exponential distribution, and (c) characteristic earthquake model
(Youngs & Coppersmith, 1985). Modified from NAGRA (2004)
[Fig_Mmax_truncated_G-R.JPG]
Seismic sources defined as areas. Approaches to assess Mmax for seismic source zones include both, statistical and
deterministic methods:
in the “EPRI-Approach” (described by NAGRA 2004, p. 107-109) Mmax is statistically determined from the
strongest earthquake which is included in the earthquake catalogue (providing a minimum value for Mmax)
using a statistical approach,
extrapolation from current earthquake catalogues (Kijko & Graham, 1998; Kijko, 2004); the approach es-
timates Mmax by statistical methods solely from the seismicity recorded in a region,
Gumbel extreme value statistics (e.g., Kijko & Ahjos, 1985); the approach is regarded highly problematic
as extrapolations of extreme values to times exceeding the length of catalogue coverage are not reliable
(Kijko & Dessokey, 1987; Peruzza & Slejko, 1993); in some cases Mmax derived from Gumbel statistics even
fail to reproduce the maximum observed magnitude (Lenhardt, 1996; Musson, 2003),
adding a margin or increment to the magnitude of the strongest observed earthquake,
larger samples earthquake data can be obtained from combining geologically similar areas (e.g., stable
continental interiors, rifted margins, subduction zones etc.) in order to obtain a larger number of strong
Page 81
Guidance document on practices
to model and implement EARTHQUAKE hazards in extended PSA (final version) - Volume 1
Report IRSN/PSN-RES/SAG/ 2017-00004 Technical report ASAMPSA_E/ WP21/ D50.15/ 2017-33 vol1 81 / 142
ASAMPSA_E
earthquakes and a database which is more robust for statistical analysis (Kagan & Jackson, 2013; USNRC,
2012a); statistical analysis of the larger sample proved more effective in estimating Mmax (Kagan & Jack-
son, 2013; Vanneste et al., 2016),
deterministic assessment; for source areas where faults, fault characteristics (fault orientation and di-
mensions), and the current tectonic regime (kinematics, recent stress directions) can be readily described
Mmax can be determined by a deterministic assessment using empirical fault dimension – magnitude rela-
tions (see below); the assessment should account for the dimensions of the largest faults which may be
regarded to be activated in the current tectonic regime. Mmax is derived from the maximum rupture di-
mensions of these faults.
In the absence of any theoretical basis for deriving maximum magnitudes values, estimates using the various sta-
tistical approaches cited above often prove to be too low, as in the case of the 2011 Tohoku earthquake causing
the Fukushima accident (Stein et al., 2015). Estimating Mmax is particularly challenging in intra-plate regions such
as in Europe, where large earthquakes are infrequent compared to the length of earthquake catalogues, and
earthquakes often occur on previously unrecognized active faults. The difficulties of assessing maximum magni-
tudes from historical / instrumental earthquake information have recently been described by Merino et al. (2013)
using Monte Carlo simulations of earthquake catalogues. The authors show that the probability of a maximum
magnitude event with an assumed recurrence time of 5000 years to be included in an earthquake catalogue cover-
ing 500 years is as low as 5%. As a result, Mmax cannot be reliably estimated from earthquake catalogs. High proba-
bilities of capturing a maximum magnitude event only exists for earthquake records which cover at least twice the
average recurrence time of the maximum event (i.e., 10.000 years in the example). Such times can only be cov-
ered geological and paleoseismological observations.
Holschneider et al. (2011) have further shown on a statistical theoretical basis that it is probabilistically / mathe-
matically impossible to derive Mmax from a Gutenberg-Richter relation without further boundary conditions or as-
sumptions. They conclude that “From a statistical point of view, a limited data set does not allow us to estimate
a magnitude that is maximum for all times,” and that “From a physical point of view, numerical models of the
earthquake process adjusted to specific fault regions may be a powerful alternative to overcome the shortcom-
ings of purely statistical inference” (Holschneider et al., 2011). Such numerical models are based on fault dimen-
sions and displacement rates.
Due to the discussed shortcomings of statistical approaches and the shortness of earthquake records, deterministic
assessment to estimate Mmax for area sources should be preferred. The assessment should start from selecting all
faults in a source zone which, by their orientation, may potentially be activated in the current stress field, or
which are oriented parallel to known active faults. Mmax can be derived from the dimensions of the largest suitably
oriented faults using scaling relations (see paragraph on fault sources below). Due to the fact that source zones in
practically all parts of Europe will contain significant numbers of faults with lengths of more than 10 km estimates
of Mmax < 6 to 6.5 are regarded unreasonable (Mw = 6 and Mw = 6.5 correspond to ruptures of faults with 10 km and
30 km length, respectively [Wells & Coppersmith, 1994]).
Page 82
Guidance document on practices
to model and implement EARTHQUAKE hazards in extended PSA (final version) - Volume 1
Report IRSN/PSN-RES/SAG/ 2017-00004 Technical report ASAMPSA_E/ WP21/ D50.15/ 2017-33 vol1 82 / 142
ASAMPSA_E
It should be noted that estimates of Mmax are made independently of the annual frequency of such events. The
recurrence intervals of Mmax for different regions or source zones will differ significantly depending on the level of
seismicity (highly active regions will be characterized with shorter recurrence intervals of Mmax events while much
longer recurrence intervals are expected in low seismicity and stable tectonic environments).
Fault sources. Approaches to assess Mmax for fault sources are based on empirical relations between the maximum
rupture area of a fault and Mmax accounting for the fault kinematics (e.g., Wells & Coppersmith, 1994; Vakov,
1996; Mohammadioun & Serva, 2001; Leonard, 2010; Striling et al., 2002; 2013). Summaries and discussions of the
method and its uncertainties are included in Stirling & Godet (2012) and IAEA (2015c, page 95 ff).
The maximum rupture area of a fault that is used as an input to the assessment may be equal to the total dimen-
sion of a fault, or to a segment of a fault which is believed to rupture during a seismic event. The concept of fault
segmentation derived from the common observation that especially long faults do not rupture along their entire
length during one single earthquake (e.g., King & Nabelek, 1984; Schwartz & Coppersmith 1984; Tsutsumi & Oka-
da, 1996; Zhang et al., 1991). Dynamic fault rupture may be impeded at geometric fault segment boundaries such
as changes in fault strike, increase of the number of faults or the width of the fault zone, increased fault complex-
ity, stepover of fault segments, or branch lines of splay faults (Zhang et al., 1991). Among these, significant fault
bends are regarded to act as the strongest impediments during dynamic rupture propagation. Further discussion on
the effectivity of fault steps in arresting dynamic rupture is provided by Wenousky (2006, 2008). The author par-
ticularly showed that dynamic rupture may continue over fault steps smaller than a certain size indicating that
attempts “to place limits on the probable length of future earthquakes on mapped active faults” by the evalua-
tion of fault steps may be not be straight forward (Wenousky, 2006).
In cases where it is possible to precisely define the 3D geometry of a fault, fault segment dimensions may conse-
quently be used for constraining the maximum fault surface, which is expected to break during single earthquakes,
and to assess Mmax (e.g., Beidinger & Decker, 2011). It must, however, be noted that in many cases such detailed
fault analyses will not be available.
Erroneous assumptions of fault segmentation may lead to underestimating Mmax as it has been the case in the 2011,
Tohoku earthquake. In cases where reliable and detailed studies on the subsurface geometry are not available the
total fault area should consequently be used to estimate Mmax. Estimates of Mmax based on fault size should as far
as possible be compared to by paleoseismological data and modelling results.
Page 83
Guidance document on practices
to model and implement EARTHQUAKE hazards in extended PSA (final version) - Volume 1
Report IRSN/PSN-RES/SAG/ 2017-00004 Technical report ASAMPSA_E/ WP21/ D50.15/ 2017-33 vol1 83 / 142
ASAMPSA_E
4.2.5 LOWER BOUND MAGNITUDE
The lower bound magnitude (LBM) or minimum magnitude (m0) refers to the lowest earthquake magnitude which is
considered in deriving ground shaking hazard curves for a site.
The lower bound magnitude (LBM) is significant parameter influencing the results of PSHA in the way that higher
values for m0 commonly result in lower apparent ground motion hazards. The minimum magnitude is a lower cut-
off value for the analysis, applied because small-magnitude earthquakes can generate high PGA values in impulsive
spikes. It is commonly assumed that these high accelerations do not have the capacity to cause damage to engi-
neered structures as they have insufficient energy or duration. They are consequently filtered out of the hazard
calculations. The definition of m0 is to some extent arbitrary. For ordinary masonry structures, it is common to use
M = 4 as the LBM, but engineered structures of good design should not be damaged by earthquakes smaller than M
= 5, so this higher value is generally used for major engineering projects. Seismic hazard evaluations for nuclear
installations therefore frequently consider only earthquakes with magnitudes greater than Mw = 5 (e.g., NAGRA,
2004). This value corresponds to IAEA’s recommended maximum value for m0 (“a selected lower bound magnitude
[LBM] should not exceed Mw = 5.0.” IAEA, 2010, p. 44).
The selection of LBM as Mw = 5 apparently is stimulated by operating experience from the USA where two earth-
quake occurrences (NPP North Anna, Earthquake of Mineral, Virginia, 23.08.2011, Mw = 5.8; Perry NPP, Leroy
earthquake 31.01.1986, M = 5) were found to induce no or only low damage because of their short duration and
high frequency content (IAEA, 2003a).
No operating experience about the effects of earthquakes with M ~ 5 exists from European NPPs. In Europe the
design base earthquakes for a number of NPPs were originally defined by macroseismic intensities. In some cases
hazard assessments performed during the siting process resulting in DBEs with intensity I = 7 to 8. In intraplate
Europe intensities of I0 = 7 correlate with earthquake magnitudes Mw ~ 5 (Grünthal et al., 2009) indicating that the
design basis of some NPPs is close to the maximum value of LBM (Mw = 5) proposed by IAEA. It appears therefore
not straight forward to apply LBM = 5 to such sites. In addition, WENRA (2016) addresses high-frequency vibratory
movement with a frequency higher than 15 Hz as such waves are important for sensitive components, e.g. relays.
In the selection process for m0 it should therefore be clarified whether or not the concept of the lower bound
magnitude and the same level of m0 can be applied to all SSCs of an NPP which are subjected to seismic qualifica-
tion, an all civil structures which are credited in a protection and defense in depth concept11. When applying a
specific level of the LBM it should be ruled out that some critical components can be damaged by ground motion
resulting from earthquakes with M < LBM.
It is further suggested to base the selection of minimum magnitude a sensitivity study to determine how much
influence it has on the hazard results (Reiter, 1990).
11 The ENSREG Stress Tests have revealed cases where civil structures such as the fire brigade buildings, which are
credited as functional in defense in depth concpets, would suffer severe damage at very low PGA values (ENSREG,
2012c).
Page 84
Guidance document on practices
to model and implement EARTHQUAKE hazards in extended PSA (final version) - Volume 1
Report IRSN/PSN-RES/SAG/ 2017-00004 Technical report ASAMPSA_E/ WP21/ D50.15/ 2017-33 vol1 84 / 142
ASAMPSA_E
4.3 METHODS COMMONLY APPLIED.
4.3.1 PROBABILISTIC SEISMIC HAZARD ANALYSIS (PSHA)
PSHA assesses the probability that a given vibratory ground motion (characterized by ground motion parameters
expressed by PGA, spectral acceleration etc.; see chapter 4.1, page 65) happens at least once in a given place and
during a given time period. The method is originally based on Cornell (1968). The calculation of probabilities is
based on a Poisson model which assumes that all events are independent in both time and space12. The model is
therefore “stationary” meaning that the likeliness of an earthquake does not change with the time elapsed from
the last event. It therefore does not account for the buildup of stress.
The PSHA methodology for calculating the probability of occurrence of vibratory ground motion at a specific site is
well established since the 1970s (Cornell, 1971; Der Kiureghian & Ang, 1975; McGuire, 1976; 1978; 1995).
Comprehensive descriptions of the PSHA approach are, for example, included in Green & Hall (1994) and NAGRA
(2004, volume 1). PSHA hazard calculation is based on specifications of the following inputs and steps:
1. Identification of sources and establishment of source geometry. PSHA requires to specify the geometry
and geographical location of fault (or line) sources (chapter 4.2.1, page 70) and seismic source zones (ar-
ea sources; chapter 4.2.2, page 75).
2. Earthquake recurrence relationships: For each source the mean annual rate of earthquake occurrence and
the magnitude distribution needs to be defined. In most cases, the recurrence is expressed by a Guten-
berg-Richter relation with appropriate a- and b-values (Gutenberg & Richter, 1956). The step includes the
selection of a maximum magnitude for each source zone (chapter 4.2.4, page 80).
3. Ground motion prediction equation (attenuation function): Algorithms for the estimation of ground motion
at a site (e.g., expressed as PGA or spectral acceleration) need to be defined (chapter 4.2.3, page 78).
Green & Hall (1994) and NAGRA (2004, Volume 1) provide detailed descriptions of both, the general PSHA approach
and its mathematical formulations. Seismic source characterization, earthquake recurrence models, and ground
motion characterization are discussed in detail on the background of relevant literature. Additional discussion on
some specific aspects of the methodology (minimum magnitude, site effects) is provided by McGuire (2009).
PSHA includes formalized ways to treat both, aleatory and epistemic uncertainties. Epistemic uncertainty resulting
from the limited knowledge of key input parameters (seismic source zones, earthquake recurrence, maximum
magnitude, GMPEs, etc.) are incorporated via logic trees (chapter 4.4.1, page 91). The weighting of alternative
input parameters or models of the logic tree is based on expert opinion, which may be formalized by an SSHAC
approach (Hanks et al., 2009; U.S.NRC, 2012; chapter 4.7, page 98). The type PSHA is therefore sometimes re-
ferred to as the Cornell-McGuire-SSHAC model of PSHA.
12 Fore- and aftershocks of major events need to be removed from the database (“declustering” of the earthquake
catalogue).
Page 85
Guidance document on practices
to model and implement EARTHQUAKE hazards in extended PSA (final version) - Volume 1
Report IRSN/PSN-RES/SAG/ 2017-00004 Technical report ASAMPSA_E/ WP21/ D50.15/ 2017-33 vol1 85 / 142
ASAMPSA_E
Recent advances of PSHA, e.g., driven by the Global Earthquake Model programme (GEM) and the development of
the OpenQuake risk calculation software allow for a realistic representation of active faults in the hazard assess-
ment both in terms of fault geometry and earthquake behavior. Advanced seismic hazard calculations can take
into account complexities such as geometrical irregularity of faults in the prediction of ground motion, and near-
fault effects such as fault directivity (Weatherill et al., 2016). The corresponding methods and computer codes are
currently developing and are not yet standard approaches.
Although several critical opinions on the PSHA approach were published in the past (Klügel, 200813; Krinitzsky,
199514; 2003) the method is widely used for the assessment of vibratory ground motion hazards. The application of
probabilistic hazard assessment techniques for NPPs is implicitly required for the definition of design basis events
by WENRA (2014a, Issue T) stating that “The exceedance frequencies of design basis events shall be low enough to
ensure a high degree of protection with respect to natural hazards. A common target value of frequency, not
higher than 10–4 per annum, shall be used for each design basis event.”
PSHA is further the only method providing ground motion amplitudes for different occurrence probabilities togeth-
er with the associated uncertainties which are required as input parameters for PSA.
13 The applicability of the model of a stationary homogeneous Poisson process is questioned.
14 Points out that experts opinions cannot be averaged meaningfully because the criteria for different models are
nonequivalent.
Page 86
Guidance document on practices
to model and implement EARTHQUAKE hazards in extended PSA (final version) - Volume 1
Report IRSN/PSN-RES/SAG/ 2017-00004 Technical report ASAMPSA_E/ WP21/ D50.15/ 2017-33 vol1 86 / 142
ASAMPSA_E
4.3.2 DETERMINISTIC SEISMIC HAZARD ANALYSIS (DSHA)
The deterministic seismic hazard analysis approach typically determines the maximum credible vibratory ground
motion at a site. The process includes the following principle steps:
1. Definition of the nearby seismic source zones (zones of distributed seismicity) and fault sources (chapters
4.2.1and 4.2.2, page 70 ff).
2. Evaluation of the maximum magnitude for each source zone and fault source (e.g., using scaling relations
between rupture area and magnitude; see chapter 4.2.4, page 80).
3. Identification of the distance between the site and the location of the possible maximum magnitude
earthquakes for each source considering the following:
a. For each fault source the potential maximum magnitude event (Mmax) should be assumed to occur
at the point closest to the site. “In cases where the site is located within the boundaries of a
seismic source [e.g., on top of a thrust or normal fault] the maximum potential magnitude
should be assumed to occur beneath the site.” (IAEA, 2010).
b. For seismic source zones not containing the site the potential maximum magnitude event should
be assumed to occur at the point closest to the site.
c. The distance of the maximum potential magnitude in the zone of diffuse seismicity containing
the site should be constrained by geological and tectonic data with the aim to demonstrate that
either (i) faults are absent from the site and its surrounding, or (ii) the probability of the faults
identified at the site and its surrounding to produce earthquakes is “negligibly low“ (IAEA, 2010).
This can be done by showing that faults near the site are extinct (Table 9) or not able to produce
earthquakes due to their size, or due to their orientation with respect to the current stress field.
The demonstration requires detailed investigations which are typically restricted to some 10 km
around the site. The distance of the site to the location of the maximum potential earthquake is
then constrained by (i) the distance of an area where faulting cannot be excluded or (ii) the ra-
dius around the site for which detailed analyses excluded seismogenic faulting.
4. Selection of appropriate GMPEs (attenuation relations) for the site region to assess the ground motion at
the site as a function of earthquake magnitude and source to site distance. Assessments should not exclu-
sively rely on a single GMPE.
5. Calculation of the ground motions resulting at the site from the possible maximum magnitude earthquake
in each source or source zone. The earthquake associated with the largest ground motion value is typical-
ly used to describe the ground motion hazard.
DSHA calculations should account for the uncertainties related to each step of the evaluation “with the considera-
tion that the conservative procedure described [in bullet 3 above] has already been introduced to cover uncer-
tainties, and double counting should be avoided” (IAEA. 2010). Statistics can be incorporated into the procedure
by taking one standard deviation above median for all parameters determined in each step (e.g., Mmax estimates
from fault dimensions, ground motion derived from GMPEs).
Page 87
Guidance document on practices
to model and implement EARTHQUAKE hazards in extended PSA (final version) - Volume 1
Report IRSN/PSN-RES/SAG/ 2017-00004 Technical report ASAMPSA_E/ WP21/ D50.15/ 2017-33 vol1 87 / 142
ASAMPSA_E
DSHA does not account for the probability of an earthquake occurring in a source zone or on a fault. DSHA is usual-
ly considered to be conservative particularly when it is based on tectonic features as it assumes Mmax to occur at
the location on the fault closest to the site, or at the closest fault within the source zone containing the site which
cannot be proved to be incapable of producing earthquakes. DSHA is therefore not applicable for defining design
basis requirements as required by WENRA (2014a) and occurrence probabilities of ground motion amplitude as
required for PSA. The method, however, may provide an estimate of the largest amplitude of vibratory ground
motion at a site which can be used for DEC considerations or as an upper cutoff value for PSA.
Guidelines for DSHA are provided by IAEA (2010). McGuire (2001) and Krinitzsky (2003) provide discussions on the
combined application of DSHA and PHSHA.
4.3.3 PROBABILISTIC FAULT DISPLACEMENT ANALYSIS (PFDHA)
As outlined in chapter 4.1 PFDHA is typically applied in cases where faults were identified at the site or in the site
vicinity during the lifetime of a nuclear installation. According to IAEA (2010) PFDHA should be applied in cases
where “no sufficient basis is provided to decide conclusively that the fault is not capable”. For such cases IAEA
(2010) recommends “to use probabilistic methods analogous to and consistent with those used for the ground
motion hazard assessment should be used to obtain an estimate of the annual frequency of exceedance of various
amounts of displacement at or near the surface”. Analyses should consider both, primary displacement (surface
rupture) of the seismogenic fault, and secondary displacements such as induced movements along pre-existing slip
planes.
Probabilistic Fault Displacement Hazard Analysis (PFDHA) is a method to estimate the frequency of the fault dis-
placement exceeding a certain value for certain period (e.g., frequency of exceedance per year). The result is
expressed as a fault displacement hazard curve. A methodology to estimate fault displacement the ground surface
associated with earthquakes probabilistically was proposed by Youngs et al. (2003). Youngs et al. (2003) showed
evaluation procedures based on diverse data on normal faults in the U.S. Cases for strike-slip faults and reverse
faults have been analyzed by Petersen et al. (2011), Robb et al (2011) and Moss & Ross (2011). Takao et al. (2013)
showed evaluation formulas based on Japanese earthquakes associated with strike-slip faults and reverse faults.
Detailed requirements for the assessment of tectonic surface fault rupture and surface deformation have recently
been formulated by ANSI/ANS (2015). The standard also includes a detailed methodological description to assess
surface rupture hazards by PFDHA, and the analysis of permanent ground motion caused by slip on a buried fault
by a method referred to as PTDHA (Probabilistic Tectonic Deformation Hazard Analysis).
There are two approaches, the earthquake approach and the displacement approach. The earthquake approach is
similar to the probabilistic seismic hazard analysis proposed for areal source (diffusive earthquakes) by Cornell
(1968). The displacement approach uses the characteristics of the fault displacement observed at the target point
(location) for the analysis. In the displacement approach, characteristics of the fault are used directly with which
displacement probability is evaluated. The rate (e.g. annual frequency) of exceedance of displacement is given as
(Youngs et al., 2003):
Page 88
Guidance document on practices
to model and implement EARTHQUAKE hazards in extended PSA (final version) - Volume 1
Report IRSN/PSN-RES/SAG/ 2017-00004 Technical report ASAMPSA_E/ WP21/ D50.15/ 2017-33 vol1 88 / 142
ASAMPSA_E
ν(d) = λDE P(D>d)
d: displacement
ν(d) : the rate of fault displacement exceeding d
λDE: the rate of displacement events on the fault
P(D>d): conditional probability that displacement D exceeds d in an event
The displacement approach requires a sound knowledge of the fault history (e.g., determined from paleoseismo-
logical records). The annual frequency of exceedance of the fault displacement is estimated for master faults
(principal faults) and secondary faults (distributed faults). A master fault is defined as the fault closely related to
earthquake source. For seismogenic faults the probability of surface rupture increases with the magnitude of the
event (Figure 18). Secondary faults are defined as fault whose displacement occurs at the ground surface and not
closely related to earthquake source fault, or those faults whose displacement occur secondarily or subordinately
over a wide zone associated with the activity of the master fault. In the earthquake approach, annual frequency of
exceedance of the displacement is expressed as below (Takao et al., 2013; JANSI, 2013):
As for Master fault,
ν(d)p1 = P0 × P1p × P2p × P3p
ν(d)p1: annual frequency of master fault displacement exceeding d
P0: activity rate of the earthquake source fault (per year)
P1p: probability that the fault displacement due to the master fault occurs at the ground surface when the
earthquake source fault becomes active
P2p: probability that the fault displacement occurs at the analysis point when fault displacement due to
the master fault occurs at the ground surface
P3p: probability that the fault displacement exceeds a certain value “d” when fault displacement due to
the master fault occurs at the analysis point
As for secondary fault,
ν(d)d1 = P0 × P1p × P2d × P3d
ν(d)d1: annual frequency of secondary fault displacement exceeding d
P0: activity rate of the earthquake source fault (per year)
P1p: probability that the fault displacement due to the master fault occurs at the ground surface when the
earthquake source fault becomes active
Page 89
Guidance document on practices
to model and implement EARTHQUAKE hazards in extended PSA (final version) - Volume 1
Report IRSN/PSN-RES/SAG/ 2017-00004 Technical report ASAMPSA_E/ WP21/ D50.15/ 2017-33 vol1 89 / 142
ASAMPSA_E
P2d: probability that the fault displacement due to the secondary fault occurs at the ground surface at the
analysis point when the earthquake source fault becomes active
P3d: probability that the fault displacement exceeds a certain value “d” when fault displacement due to
the secondary fault occurs at the analysis point.
Details of the calculation method are described in JANSI (2013), ANS (2015), IAEA (2015), Suziki & Annaka (2015)
and Takao et al. (2015).
In the probabilistic analysis, two types of uncertainties can basically be taken into account, i.e., aleatory uncer-
tainties and epistemic uncertainties. Aleatory uncertainties are due to the inherently random and unpredictable
nature of future events, and cannot be reduced. Aleatory uncertainties can be evaluated by assuming the probabil-
ity distribution. Epistemic uncertainties are those resulting from inadequate knowledge or data, which are gener-
ally modeled using logic tree branches and the weight given to them (Youngs et al., 2003). Examples of fault dis-
placement hazard curve for secondary fault are shown below (Figure 19, Figure 20).
Figure 18. Probability of surface rupture as a function of earthquake magnitude (Takao et al.,
2015) [Takao_probability_surface_rupture.JPG]
Page 90
Guidance document on practices
to model and implement EARTHQUAKE hazards in extended PSA (final version) - Volume 1
Report IRSN/PSN-RES/SAG/ 2017-00004 Technical report ASAMPSA_E/ WP21/ D50.15/ 2017-33 vol1 90 / 142
ASAMPSA_E
Figure 19. Example of fault displacement hazard curves of secondary fault with fractile values
(epistemic uncertainty considered). By courtesy of Y. Suzuki (2015). [PFDHA_example_1.JPG]
Figure 20. Example of fault displacement hazard curves of secondary fault. Annual rate of ex-
ceedence is plotted against distance from master fault as parameter assuming an earthquake with
Mw = 6.5 at the master fault. By courtesy of Y. Suzuki (2015). [PFDHA_example_2.JPG]
Page 91
Guidance document on practices
to model and implement EARTHQUAKE hazards in extended PSA (final version) - Volume 1
Report IRSN/PSN-RES/SAG/ 2017-00004 Technical report ASAMPSA_E/ WP21/ D50.15/ 2017-33 vol1 91 / 142
ASAMPSA_E
Issues concerning the application and the Improvement of PFDHA:
o epistemic uncertainties in the fault displacement hazards are estimated using logic tree branches and the
weight given to them; uncertainties are expressed as the band of fault displacement hazard curves (frac-
tal hazard curves); it is considered important in the application of PFDHA that options are provided to al-
low for appropriate setting of logic tree branches and that these options cover almost all future possibili-
ties;
o accumulating field survey data, and utilizing the results of experiments and numerical simulations to
complement the data in case of their inadequacy will work to reduce uncertainties in PFDHA;
o in the earthquake approach hazard values depend on the cell size used for analysis; the smaller the cell
gets, the smaller the probability of occurrence of secondary fault becomes, decreasing the estimated dis-
placement hazard (Petersen et al., 2011; Takao et al., 2014); therefore appropriate computational cell
sizes need to be selected taking account of the size of the target facilities in a specific application;
o the observational database for PFDHA is still very small meaning that the empirical relations used for haz-
ard assessments are based on very limited numbers of observations (e.g., Takao et al., 2013, 2015; Pe-
tersen et al., 2015); this applies to correlations between (a) annual rates of exceedance of displacement
and magnitude; (b) distance of distributed surface rupture from the primary fault and magnitude; (c) the
influence of the fault type (strike-slip, reverse, normal) on these relations;
o displacement records on surface earthquake faults include those occurred both in overlying strata and
bedrock; in general, it is difficult to discuss the quantitative relationship between fault displacements on
bedrock and those in overlying strata; thus, it is necessary to accumulate survey data, evaluations based
on experiments and numerical simulations;
o studies on the probabilistic fault displacement hazard analysis started only recently; although the IAEA
safety standards address PFDHA regarding the problems posed by capable faults for existing nuclear pow-
er plant facilities, PFDHA has only been applied to a limited number of cases; an example of PFDHA ap-
plied to existing NPP (Diablo Canyon NPP) can be found in USNRC (2012).
o
4.4 UNCERTAINTY ASSESSMENT
4.4.1 PROBABILISTIC SEISMIC HAZARD ANALYSIS (PSHA)
PSHA commonly distinguishes between aleatory and epistemic uncertainty:
Aleatory uncertainty (or: statistical uncertainty, randomness) “is the physical variability present in the system
being analysed or its environment. It is not strictly due to a lack of knowledge and cannot be reduced. The de-
termination of material properties or operating conditions of a physical system typically leads to aleatory uncer-
tainties; additional experimental characterization might provide more conclusive description of the variability
Page 92
Guidance document on practices
to model and implement EARTHQUAKE hazards in extended PSA (final version) - Volume 1
Report IRSN/PSN-RES/SAG/ 2017-00004 Technical report ASAMPSA_E/ WP21/ D50.15/ 2017-33 vol1 92 / 142
ASAMPSA_E
but cannot eliminate it completely. Aleatory uncertainty is normally characterized using probabilistic approach-
es15”.
In seismic hazard assessment the location, time and magnitude of an earthquake occurring on an active fault (or
within a seismic source zone) and the resulting ground motion are considered aleatory (NAGRA, 2004). “Even with
a perfect knowledge of the state of stress of the earth’s crust, future earthquakes could still be occurring at a
variety of unknown locations with some probability distribution. In current practice, this probability distribution
expresses the irreducible aleatory uncertainty” (ANS, 2015). The uncertainty about where or when an earthquake
occurs on an active fault cannot be reduced by acquiring additional data but could only be reduced with funda-
mentally new insights into the physical processes of seismic rupture processes. Aleatory uncertainty is assessed by
integration over randomly distributed variables to calculate the exceedance probability of a hazard parameter. In
PSHA aleatory uncertainty is thereby integrated into a single hazard curve.
Epistemic uncertainty (or: systematic uncertainty) refers to parameters which could in principle be known, but in
practice are not. It therefore refers to a lack of knowledge which can, for example, be reduced by the acquisition
of new data. “Epistemic uncertainty is not well characterized by probabilistic approaches because it might be
difficult to infer any statistical information due to the nominal lack of knowledge16”.
In PSHA uncertainties about the characteristics of seismic source zones, active tectonic structures etc. are treated
as epistemic leading to uncertainties in the data used as input into seismic hazard calculations. Uncertainties exist
for all basic inputs of the SHA, i.e., active fault sources, seismic source zones, earthquake recurrence intervals
expressed by Gutenberg-Richter parameters (a- and b-values), maximum magnitude, ground motion prediction
equations (GMPEs), and site effects (local soil conditions).
The epistemic uncertainty is represented in the PSHA by the development of a weighted set of alternative models
in a logic tree framework (see below; NAGRA, 2004). In a full-scope PSHA these uncertainties are propagated
through the entire hazard analysis resulting in a series of alternative hazard curves. Each of the results derived
from a certain set of input parameters therefore results in a distinct hazard curve. In PSHA uncertainties are han-
dled by giving a weight to each individual hazard curve, which represents the credibility of the input dataset. The
spread of the results, accordingly, quantify seismic hazard and its uncertainties.
The resulting set of individual hazard curves can further be used to assess the dependence of the results on indi-
vidual input parameters and identify those input parameters, which contribute most to the observed uncertainty.
Such sensitivity assessment may lead to the conclusion that uncertainty of a certain input parameter (e.g., a near-
regional fault source) may contribute significantly to the total uncertainty while other parameters do not (e.g.,
local soil conditions). Such analyses can therefore be used to decide about the acquisition of new data and con-
centrate resources on the most relevant topics (e.g., fault investigation) in order to reduce the uncertainty of the
PSHA result.
15 https://web.stanford.edu/group/uq/uq_youq.html
16 https://web.stanford.edu/group/uq/uq_youq.html
Page 93
Guidance document on practices
to model and implement EARTHQUAKE hazards in extended PSA (final version) - Volume 1
Report IRSN/PSN-RES/SAG/ 2017-00004 Technical report ASAMPSA_E/ WP21/ D50.15/ 2017-33 vol1 93 / 142
ASAMPSA_E
A logic tree methodology (Coppersmith & Youngs, 1986) is commonly used to represent epistemic uncertainty in
PSHA as suggested by SSHAC (1997). In a logic tree each node represents a key input parameter affecting seismic
hazard. Branches emanating from the nodes represent different interpretations of the input parameter under con-
sideration. Each branch is given a probability by experts or expert teams which denotes the assumed likelihood
that the branch is “true”. The sum of all probabilities of branches emending from a node is 1, and the weight of
each branch is conditional on the values of the preceding branches of the logic tree (Figure 21). Further detailed
information on uncertainty assessment can be found in NAGRA (2004) and SSHAC (1997).
Figure 21. (a) Example of a logic tree for assessing fault geometry as a characteristic of seismic
sources. (b) Example of a logic tree to assess maximum magnitude for a seismic source with uncer-
tain kinematics (strike-slip, reverse) and fault length. The probability of the magnitude on the
right of the tree is the product of the probabilities of the branches leading to the result. The final
result is a distribution of Mmax to be used as input for PSHA (redrawn from USNRG, 1997).
[Logic_tree_example.JPG]
4.4.2 DETERMINISTIC SEISMIC HAZARD ANALYSIS (DSHA)
DSHA calculations can account for some epistemic uncertainties by introducing simple statistics into the procedure
of selecting input parameters, e.g., by taking the standard deviation into account for empirically derived parame-
ters (e.g., Mmax from fault dimensions, GMPEs). Uncertainties related to different source zone models could, in
principle, be handled by logic tree approaches similar to the ones applied in PSHA. The authors, however, are not
aware of studies applying such approaches.
Page 94
Guidance document on practices
to model and implement EARTHQUAKE hazards in extended PSA (final version) - Volume 1
Report IRSN/PSN-RES/SAG/ 2017-00004 Technical report ASAMPSA_E/ WP21/ D50.15/ 2017-33 vol1 94 / 142
ASAMPSA_E
4.4.3 PROBABILISTIC FAULT DISPLACEMENT ANALYSIS (PFDHA)
The development of probabilistic methods for analyzing surface ruptures started only recently and PDFHA exercis-
es were only performed for a very limited number of sites (e.g., Diablo Canyon NPP, USNRC, 2012; Krsko NPP,
Cline et al., 2015). An elaborated and widely used treatment of uncertainties is therefore not available. Recent
studies, however, applied logic tree approaches to model the uncertainties of input parameters (Cline et al.,
2015). Input parameters modelled by different branches are the probability of fault activity, fault length and the
derived maximum magnitude, slip rate, maximum magnitude, and principle / distributed faulting.
It currently appears that most of the uncertainty of the results is due to the very small database which is available
for secondary displacements such as induced movements along pre-existing slip planes (Takao et al., 2015).
4.5 METHODOLOGICAL LIMITS
Outputs of seismic hazard assessments for low and very low exceedance probabilities down to 10-5 or 10-6 per year
are required as numerical input for quantifying accident sequences in PSA. Extrapolations down to very low ex-
ceedance probabilities are further implicitly required by the WENRA Reference Levels (WENRA, 2014a) and sup-
porting Guidance Documents for the assessment of design extension conditions (WENRA, 2014b; 2015;; 2016).
WENRA (2014a) does not define numerical target values for the non-exceedance probability of events which must
be considered in DEC analysis but it requires “considering those events and combinations of events, which cannot
be considered with a high degree of confidence to be extremely unlikely to occur” (WENRA, 2014a, Reference
Levels Issue F).
The commonly used probabilistic methods allow for a straight-forward calculation of hazard curves down to ex-
tremely low exceedance probabilities. Examples include the PEGASOS PSHA results (NAGRA, 2004; hazard curves
for non-exceedance probabilities of 10-7 per year) and PFDHA assessments calculating hazard curves down to 10-10
(Cline et al., 205; Takao et al., 2003) or even lower (10-13, Suzuki et al., 2015; Takao et al., 2015). A critical scien-
tific discussion of the reliability of such hazard results which goes beyond the assessment of probabilistic (aleatory
and epistemic) uncertainty is, however, commonly not provided.
The interpretation of calculated hazard values and the assessment of their reliability for extremely low exceed-
ance probabilities needs to consider the following issues:
o Earthquake data coverage and completeness: each hazard assessment is based on a limited number of
data which covers a limited time period. As discussed in chapter 3.1.3 (page 41) European earthquake da-
ta typically cover time periods of few hundred years only and may be incomplete even for this time inter-
val. Hazard assessments which are exclusively based on such data therefore essentially extrapolate the
seismicity of the observation period to extremely long recurrence intervals (10.000 years and longer; Fig-
ure 22). The resulting limitations to the reliability of SHA are particularly relevant for regions with low
seismicity such as the stable European continental interiors. This is due to the prevalence of active faults
with very slow slip rates, long recurrence intervals for large earthquakes, and the general paucity of
seismological data.
Page 95
Guidance document on practices
to model and implement EARTHQUAKE hazards in extended PSA (final version) - Volume 1
Report IRSN/PSN-RES/SAG/ 2017-00004 Technical report ASAMPSA_E/ WP21/ D50.15/ 2017-33 vol1 95 / 142
ASAMPSA_E
o Availability of paleo-earthquake data and integration of active fault data: the time coverage of
earthquake data can be significantly expanded by paleoseismological investigations and the assessment of
active faults. Interpreting the reliability of an SHA therefore should critically review the availability,
completeness and quality of paleoseismological data as well as the depth of research addressing the as-
sessment of active and inactive faults in the area of consideration. In-depth research is expected to in-
crease the reliability of hazard results.
o The validation of seismic hazard results is generally not possible. Comparisons of hazard predictions
of the GSHAP Global Seismic Hazard Map (GSHAP, 1999) which were made significant times ago with the
seismicity recorded after 1999, however, show that abundant and severe pitfalls can occur in hazard pre-
diction17 (Wyss & Rosset, 2013). Similar underpredictions of seismic hazard were proved for the hazard
maps of Japan18 (Geller, 2011) and the USGS (Stein et al., 2012). Some reasons for the observed failure of
SHA to correctly predict hazard levels in addition to the ones listed above are discussed by Stein et al.
(2012).
Limits to the assessment of seismic ground motion hazards are evident from examples of diverging results of PSHA
which were performed for the same site and revealed different results (e.g., USNRC, 2010).
17 “Instrumentally measured accelerations due to 6 earthquakes were about three times larger, on average, than
the maximum likely accelerations shown on the map (GSHAP, Giardini, 1999). On average, the accelerations were
underestimated by a factor of approximately 3. … Intensities reported for the last 60 earthquakes with M ≥ 7.5
were all significantly larger than expected, based on the hazard map (by 2.3 intensity units for the 12 deadliest
earthquakes).” Wyss & Rosset, 2013.
18 “Since 1979, earthquakes that have caused 10 or more fatalities in Japan have occurred in places designated as
low risk“. Geller, 2011.
Page 96
Guidance document on practices
to model and implement EARTHQUAKE hazards in extended PSA (final version) - Volume 1
Report IRSN/PSN-RES/SAG/ 2017-00004 Technical report ASAMPSA_E/ WP21/ D50.15/ 2017-33 vol1 96 / 142
ASAMPSA_E
Figure 22. (a) Comparison of the time coverage of the European CENEC earthquake catalogue with
a 10.000 years time interval illustrating the extent of extrapolation required to assess events with
an average recurrence interval of 10.000 years. This average recurrence time corresponds to the
occurrence probability of 10-4 per year as defined for design basis requirements (WENRA, 2014a).
(b) Regional coverage of the CENEC catalogue. (c) Cumulative number of earthquakes for single
magnitude classes of the CENEC Earthquake Catalogue (Grünthal et al., 2009) plotting versus time.
See chapter 3.3.1 for detailed explanation. [CENEC_vs_10000_years.JPG]
Page 97
Guidance document on practices
to model and implement EARTHQUAKE hazards in extended PSA (final version) - Volume 1
Report IRSN/PSN-RES/SAG/ 2017-00004 Technical report ASAMPSA_E/ WP21/ D50.15/ 2017-33 vol1 97 / 142
ASAMPSA_E
4.6 EVENT MODELLING
Ground motion simulation. Due to the understanding of physical fault rupture processes ground motion simulation
techniques for ground motion hazard assessment gained significant importance during the last years. Modelling
techniques address the simulation of ground motion based on the modelling of fault rupture processes to make
predictions of the ground motion at a given site. Doing this strong motion simulation complements or substitutes
empirical GMPEs, which relate ground motion parameters to earthquake magnitude and epicentral distances.
In contrast to empirically derived GMPE models, ground motion simulations use “the elastodynamic representation
theorem … to compute the total ground motion at a site from time functions of slip on the fault that represent
faulting and Green’s functions that represent seismic wave propagation” (IAEA, 2015, SR-85). Simulation accounts
for fault geometry parameters, fault slip parameters, crustal structure parameters such as seismic wave velocity,
density, damping, and soil parameters. Simulations therefore are, in principle, capable to overcome drawbacks of
GMPEs which are related to the common lack of data from locations close to the ruptured fault (i.e., GMPEs are
not readily applicable to near-site faults), lack of data for larger earthquake magnitudes, and the scarcity of
strong-motion data from low-seismicity stable continental regions which prevent the development of reliable
GMPEs for such regions.
It should be noted, however, that ground motion simulation is only applicable for identifiable fault and requires
detailed input data. IAEA (2010) lists the following data requirements for simulation:
(a) “Fault geometry parameters (location, length, width, depth, dip, strike);
(b) Macroparameters (seismic moment, average dislocation, rupture velocity, average stress drop);
(c) Microparameters (rise time, dislocation, stress parameters for finite fault elements);
(d) Crustal structure parameters, such as shear wave velocity, density and damping of wave propagation
(i.e. the wave attenuation Q value).” (IAEA, 2010, 5.14)
Ground motion simulation approaches therefore require a very detailed geological and seismological understanding
of faults.
IAEA (2015 SR-85) provides detailed information on the methodology along with examples of ground motion predic-
tions based on simulation approaches. Due to the advances in modelling, IAEA started revising IAEA SSG-9 (IAEA,
2010) to incorporate modelling techniques. A recent study applying simulation techniques to complement ground
motion data has been published for Fennoskandia where ground motion observations for moderate and large
eartqhuakes (M > 3) are not available due to the low seismicity of the region (NSK, 2015). In this study modelling
techniques were developed to generate synthetic accelerograms starting from fault rupture processes.
Page 98
Guidance document on practices
to model and implement EARTHQUAKE hazards in extended PSA (final version) - Volume 1
Report IRSN/PSN-RES/SAG/ 2017-00004 Technical report ASAMPSA_E/ WP21/ D50.15/ 2017-33 vol1 98 / 142
ASAMPSA_E
4.7 USE OF EXPERT JUDGMENT
A formalized approach for the use of expert judgement and the role of different experts in PSHA has initially been
proposed by the “Senior Seismic Hazard Analysis Committee (SSHAC)” in the U.S. through the U.S. NRC (SSHAC,
1997, referred to as “SSHAC Guidelines”). “The paper addresses why and how multiple expert opinions and the
intrinsic uncertainties that attend them should be used in Probabilistic Seismic Hazard Analyses (PSHA) for criti-
cal facilities such as commercial nuclear power plants.” (Hanks et al., 2009).
The principal concern of formalizing the contribution of different experts and expert judgement are the epistemic
uncertainties in the inputs to PSHA, which drive the uncertainties of the output of the hazard assessments (e.g.,
uncertainties of the key input parameters discussed in chapter 4.2, page 70 ff). The SSHAC approach to PSHA has
been developed to account for these uncertainties as fully as possible. Accordingly, USNRC (2012) summarizes the
purpose of the approach as follows:
“The fundamental goal of a SSHAC process is to carry out properly and document completely the activi-
ties of evaluation and integration, defined as:
Evaluation: The consideration of the complete set of data, models, and methods proposed by the larger
technical community that are relevant to the hazard analysis.
Integration: Representing the center, body, and range of technically defensible interpretations in light
of the evaluation process (i.e., informed by the assessment of existing data, models, and methods).”
(USNRC, 2012, p. XVI-XVII)
The process of a PSHA using a SSHAC approach is summarized in Hanks et al. (2009) : “SSHAC Guidelines
[SSHAC,1997] are concerned with how to capture, quantify, and communicate both the implicit and explicit un-
certainties expressed by multiple experts. … SSHAC (1997) proposed a process for obtaining and aggregating
expert interpretations, judgments, and models … . This process begins with diverse inputs, such as differing mod-
els and interpretations obtained from multiple experts, which are then evaluated through an interactive process
overseen by a technical integrator19 (TI) or technical facilitator/integrator19 (TFI). This process results in a model
representing not only the experts from whom it was derived but, ideally, also the larger informed technical
community19 (ITC) that the experts in principle represent. … The goal of all this interaction is “to represent the
center, body, and range of technical interpretations that the larger informed technical community would have if
they were to conduct the [seismic hazard] study.”” (Hanks et al., 2009).
SSHAC consequently established formalized processes to perform a PSHA with different roles attributed to the
contributing technical experts (SSHAC, 1997). The interaction between experts which is required in some levels of
the SSHAC approach is regarded as the major difference between SSHAC and conventional expert elicitation which
19 See Table 10 for definition of terms.
Page 99
Guidance document on practices
to model and implement EARTHQUAKE hazards in extended PSA (final version) - Volume 1
Report IRSN/PSN-RES/SAG/ 2017-00004 Technical report ASAMPSA_E/ WP21/ D50.15/ 2017-33 vol1 99 / 142
ASAMPSA_E
involve independent experts as well but do not support their interaction. Another important difference between
the SSHAC approach and expert elicitation is that SSHAC-based studies integrate rather than aggregate the assess-
ments of individual experts by stimulating discussions between the experts and the revision of models (USNRC,
2012).
SSHAC (1997) defines four levels of PSHA studies referred to as Level 1 to Level 4. Among these Level 4 studies are
regarded to capture and quantify the uncertainties in SHA to the best extent. The levels differ by their complexity
and required resources. Both increase from Level 1 to Level 4. A short summary of the main elements of each of
these levels and the most important differences between them is provided in Table 11. Detailed descriptions of
the four approaches are provided by SSHAC (1997), Hanks et al. (2009), and USNRC (2012).
Detailed guidelines for the implementation of SSHAC Level 3 and Level 4 seismic hazard studies are provided by
USNRC (2012). Guidance includes definitions of the roles of involved experts, explanation of the SSHAC concept,
structure and process, and implementation guidelines. Hanks et al. (2009) include reports on the experience gath-
ered during past SSHAC Level 3 and 4 studies along with further references.
For existing European NPPs a full-scope SSHAC Level 4 approach has so far only been applied to the Swiss plants in
the framework of the PEGASOS Project and the Pegasos Refinement Project (PRP). The hazard assessment process
is described in detail in NAGRA (2004). The procedure turned out to be extremely complex and time consuming.
Although already started at the end of the 1990s the process of determining hazard levels for regulatory decision
has only been finished in 2016. On the other hand there are successful examples of SSHAC Level 3 projects that
could be finished in about three years (Brazil; South Africa; Bommer et al., 2015).
Page 100
Guidance document on practices
to model and implement EARTHQUAKE hazards in extended PSA (final version) - Volume 1
Report IRSN/PSN-RES/SAG/ 2017-00004 Technical report ASAMPSA_E/ WP21/ D50.15/ 2017-33 vol1 100 / 142
ASAMPSA_E
Roles of exerts in PSHA according to the SSHAC approach
Peer Reviewers “Review both the soundness of the technical input and the final hazard results and, for SSHAC Levels 3 and 4, the pro-cedural aspects of the expert interaction. Peer review at Levels 3 and 4 is formalized with Participatory Peer Review Panels (PPRP) that provides commentary throughout the course of the project.”
Hanks et al., 2009, p. 9
Technical Facilita-tor / Integrator (TFI)
“A SSHAC Level 4 individual or team who compiles the community distributions constructed by each evaluator team into a single community distribution representing the views of the informed technical community.”
SSHAC, 1997, p. 29
Technical Integra-tor (TI)
“A SSHAC Level 3 individual or team responsible for captur-ing the views of the informed technical community in the form of a community distribution.”
SSHAC, 1997, p. 30
Hazard Analyst “PSHA cognoscenti who actually perform the PSHA calcula-tions.”
Hanks et al., 2009, p. 9
Normative Expert “An expert with sound theoretical and conceptual under-standing of probability, logic trees, and model building in probabilistic frameworks.”
Hanks et al., 2009, p. 49
Proponent Expert “A technical expert who advocates a particular hypothesis or technical position and has developed and evaluated a particular hypothesis to explain the data.”
SSHAC, 1997, p. 24
Evaluator Expert: “A technical expert who provides his/her representation of the community distribution by examining the available data and assessing the technical basis for proponent models; the expert then is expected to represent the community distri-bution of the ITC in light of the other evaluators distribu-tions.”
Hanks et al., 2009, p. 49
Resource Expert “A technical expert who has either site-specific knowledge or expertise with a particular methodology or procedure useful to the evaluator experts in developing the communi-ty distribution.”
Hanks et al., 2009, p. 50
Technical Commu-nity (TC)
“The cadre of scientists and engineers known for their expe-rience with and knowledge of SSC [seismic source character-ization] or GMC [ground motion characterization] issues.”
Hanks et al., 2009, p. 8
Informed Technical Community (ITC)
A member of the ITC (who is also part of the TC) is described as ”an expert who has full access to the complete database developed for a project and has fully participated in the interactive SSHAC process. … Experts who participate in the PSHA study must endeavour to represent “the larger in-formed technical community” by assuming the hypothetical case where the others in the larger technical community become “informed” through participation in the same pro-cess.”
U.S.NRC, 2012, p. 10
Table 10. Definitions of the roles of experts in a PSHA project according to SSHAC Guidelines.
Page 101
Guidance document on practices
to model and implement EARTHQUAKE hazards in extended PSA (final version) - Volume 1
Report IRSN/PSN-RES/SAG/ 2017-00004 Technical report ASAMPSA_E/ WP21/ D50.15/ 2017-33 vol1 101 / 142
ASAMPSA_E
SSHAC Level 1
Structure TI is a single hazard analyst
TI reviews literature, datasets, and models; TI quantifies uncertainties and expresses his view on all models and parameters
Peer review Peer review (late stage) to determine if opinions of ITC are captured and docu-mentation is complete
Application PSHA for conventional facilities, sensitivity studies to evaluate new information
SSHAC Level 2
Structure In addition to Level 1:
TI is a evaluator team including the hazard analyst
TI contacts members of ITC regarding databases and directly communicates with proponents of alternative viewpoints
Topical meetings to resolve questions of key topics
Peer review Participatory or late stage
Application PSHA for critical infrastructure
SSHAC Level 3
Structure In addition to Level 2:
TI team, proponents and resource experts are brought together in workshops to discuss different methods, models and databases
TI team questions proponents and resource experts to understand applicability of alternative models
Revision to the models in the light of feedback
Peer review Participatory peer review of technical decisions made by TI team
Documentation Includes discussion of all models, parameters, and their technical basis; final hazard with sensitivity analyses to understand important contributors to hazard and uncertainties
Application PSHA for nuclear installations, National Seismic Hazard Map Programme for U.S.
SSHAC Level 4
Structure In addition to Level 3:
TFI team added; Each TFI is responsible for a single technical topic (e.g., source zone characterization, ground motion characterization, site characterization)
Multiple evaluators or evaluator teams perform work of the TI team as defined for Level 3
Evaluators / evaluator teams are limited to a single technical topic (e.g., source zone characterization, ground motion characterization, site characterization)
Peer review Participatory, including both technical and process review
Documentation Documentation includes all information required for Level 3 plus individual summaries by each evaluator expert to express his interpretations, technical bases, and estimates of uncertainty
Application PSHA for nuclear installations (Switzerland: NAGRA, 2004; Yucca Mountain: CRWMS M&O, 1996; 1998)
Table 11. Summaries of the structure and content of SSHAC Level 1 to Level 4 PSHAs
Page 102
Guidance document on practices
to model and implement EARTHQUAKE hazards in extended PSA (final version) - Volume 1
Report IRSN/PSN-RES/SAG/ 2017-00004 Technical report ASAMPSA_E/ WP21/ D50.15/ 2017-33 vol1 102 / 142
ASAMPSA_E
4.8 ADVANCE OF SCIENCE AND TECHNOLOGY
The assessment of seismotectonic hazards currently benefits from dramatic progresses in science which is mainly
driven by pure research. The focused interest of a large part of the Earth sciences community in active defor-
mation processes has led to an explosion of the number of scientific articles dealing with seismic rupture process-
es, the rheology of seismogenic deformation, earthquake geology, and the youngest tectonic and geologic evolu-
tion of many European regions. This concerted research efforts led to:
collection of a large amount of novel and precise data for the assessment of seismotectonic processes
(e.g., data from dense and sensitive seismological networks; GPS geodesy; LIDAR digital elevation data);
updated and novel methodologies to identify active faults including tectonic geomorphology and paleo-
seismology;
identification of a still increasing number of active faults driven by basic research and scientific curiosity;
a better understanding of seismotectonic processes of large parts of Europe.
These new findings can lead to better characterizations of source zones (both fault and area sources) and more
accurate assessments of long-term seismicity rates thereby increasing the reliability of the input data for SHA.
Most of these new findings are currently not included in the routines of seismic hazard assessment, although the
SHARE project made an attempt to include active faults as sources its European seismic hazard map20 and the GEM
project21 is continuing these efforts.
Significant progress is currently being made in the integration of fault models in PSHA. Current efforts include the
implementation of codes into computer programs and software such as OpenQuake22 which allow to implement 3D
fault data both in terms of their geometry and earthquake behavior (Siva et al., 2013; Weatherill et al., 2016). To
date seismic hazard calculations can take into account complexities such as geometrical irregularity of faults in
the prediction of ground motion.
The outlined continuous progress of science and technology and its significance for nuclear safety has been under-
lined by ENSREG (2012 a,b) who highlighted the importance to reevaluate natural hazards at least every 10 years
(see also chapter 1.1, page 17). Periodic hazard reviews are consequently also addressed by the WENRA Safety
Reference Levels (WENRA, 2014a, Issue P, Periodic Safety Reviews) and by WENRA (2013).
For seismic hazards WENRA (2016) further suggests the following: “The seismic hazard assessment should be re-
viewed thoroughly and periodically. The reviewers should consider conducting independent hazard assessments
involving different groups of experts and considering all relevant interpretations. … New evidence or concerns
may arise, e.g. related to seismic sources, newly discovered active or capable faults, new data on ground motion
attenuation, or local site effects.”
20 http://diss.rm.ingv.it/share-edsf/index.html; http://www.efehr.org:8080/jetspeed/portal/HazardMaps.psml
21 https://www.globalquakemodel.org/openquake/about/
22 https://www.globalquakemodel.org/openquake/about/
Page 103
Guidance document on practices
to model and implement EARTHQUAKE hazards in extended PSA (final version) - Volume 1
Report IRSN/PSN-RES/SAG/ 2017-00004 Technical report ASAMPSA_E/ WP21/ D50.15/ 2017-33 vol1 103 / 142
ASAMPSA_E
5 HAZARD COMBINATIONS
According to ASAMPSA_E Report D21.1 the following hazard combinations are distinguished:
1. Correlated hazards. These are linked by a cause-effect relation, where an incident of hazard A triggers
or may trigger hazard B (NIER, 2013; “common cause event”, Kuramoto et al., 2014). Hazards may be
causally connected in two ways: (a) hazard A may cause hazard B (indicating that A is not a prerequisite
to B) or (b) hazard A is a prerequisite for hazard B (Figure 24). Correlations of seismic and other hazards
include both types. An example for (a) is vibratory ground motion / liquefaction (seismic shaking is a pre-
requisite of liquefaction); an example for (b) is seismically triggered mass movements (landsliding may be
triggered by vibratory ground shaking, but may also occur as an independent event).
2. Associated hazards. These refer to events which are probable to occur at the same time due to a com-
mon root cause (“contemporary relation”, NIER, 2013). The common root cause (e.g., a meteorological
situation) may not necessarily be regarded as a hazard by itself.
ASAMPSA_E’s Report D21.2 (Decker & Brinkman, 2014) did not identify hazards which are associated to
seismotectonic hazards via a common root cause.
3. Temporal coincidence. Such hazard combinations refer to not causally connected independent incidents
associated with different hazards (see chapter 5.6, page 115).
Page 104
Guidance document on practices
to model and implement EARTHQUAKE hazards in extended PSA (final version) - Volume 1
Report IRSN/PSN-RES/SAG/ 2017-00004 Technical report ASAMPSA_E/ WP21/ D50.15/ 2017-33 vol1 104 / 142
ASAMPSA_E
5.1 CORRELATED HAZARDS
Seismic hazards are correlated with a large number of natural and man-made hazards (Figure 23). This is due to
the fact that vibratory ground motion during an earthquake is not restricted to the site but affects a wide area
around the epicenter of the earthquake. Seismic ground shaking consequently impacts on all man-made structures
and the entire natural environment in the vicinity of an NPP.
Fault capability, liquefaction, dynamic compaction, and ground displacement potentially have a similar wide-
spread impact, but correlate with a smaller number of hazards than vibratory ground motion. A comprehensive list
of hazards which are correlated with seismic hazards is provided in the ASAMPSA_E Report D21.2 and shown in
Figure 24.
Figure 23. Number of hazards correlated with seismotectonic hazards
[Seismotectonic_hazard_correlation_statistics.JPG]
Page 105
Guidance document on practices
to model and implement EARTHQUAKE hazards in extended PSA (final version) - Volume 1
Report IRSN/PSN-RES/SAG/ 2017-00004 Technical report ASAMPSA_E/ WP21/ D50.15/ 2017-33 vol1 105 / 142
ASAMPSA_E
Figure 24. List of hazards correlated with seismotectonic hazards. Only direct consequences of
individual hazards are listed. Causal chains are not considered. Combinations of independent phe-
nomena with low severity which cause potential hazards by their contemporaneous occurrence are
not identified. [Seismic_hazard_correlation_list_2015_07_08.JPG]
Page 106
Guidance document on practices
to model and implement EARTHQUAKE hazards in extended PSA (final version) - Volume 1
Report IRSN/PSN-RES/SAG/ 2017-00004 Technical report ASAMPSA_E/ WP21/ D50.15/ 2017-33 vol1 106 / 142
ASAMPSA_E
5.2 ASSOCIATED HAZARDS
Associated hazards refer to events which are probable to occur at the same time due to a common root cause
(“contemporary relation”, NIER, 2013).
Seismic hazards have no common root causes with other external hazards such as external flooding extreme
weather conditions, or man-made hazards. D21.2 therefore did not identify hazards which are associated to seis-
motectonic hazards via a common root cause.
5.3 SCREENING OF CORRELATED HAZARDS
The screening process of correlated hazards should start from the list of hazards and possible hazard correlations
shown in Figure 24. In accordance with WENRA (2014a) hazards “can be screened out on the basis of being incapa-
ble of posing a physical threat or being extremely unlikely with a high degree of confidence. Care shall be taken
not to exclude hazards which in combination with other hazards have the potential to pose a threat to the facili-
ty. (WENRA, 2014a, Safety Reference Level T3.1)”
Screening out of correlated hazards can therefore be based on demonstrating that:
incidents of the type of hazard are physically impossible at the site (e.g., occurrence of liquefaction on a
rock site; the occurrence of a tsunami in the continental interior),
the impacts of all possible events caused by the incident are incapable of posing a physical threat to the
safety of the plant. In this case the screening process requires that (1) a “maximum possible severity” of
the incident can be defined and (2) a demonstration that an event of that severity does not pose a physi-
cal threat to the plant,
incidents of the type of hazard with severities that pose a physical threat to the safety of the plant are
“extremely unlikely with a high degree of confidence” (WENRA, 2014a); unfortunately a common under-
standing does currently neither exist for a probabilistic value for extreme unlikeliness, nor for the degree
of statistical confidence required (e.g. use of higher percentiles of the hazard curve rather than median
or mean).
Due to the impact of earthquakes and correlated hazards on both, the site and the region around the site the
screening processes has to include assessments of the actual NPP site and all sites from which correlated hazards
may arise. Examples of the latter include water dams (when dam failure [N15] may pose a threat to the NPP),
industrial sites in the site vicinity (industry explosion [M1], chemical release [M2]), transportation routes etc. It
should be noted that correlated hazards, which are not applicable to the actual NPP site, nevertheless may pose
threats to nearby facilities (e.g., liquefaction of soil may damage an industrial plant while the NPP is funded on
non-liquefiable ground; seismically triggered slope instability [N60] may be a threat to water containment struc-
tures although the NPP site is located in a topographically flat area).
Page 107
Guidance document on practices
to model and implement EARTHQUAKE hazards in extended PSA (final version) - Volume 1
Report IRSN/PSN-RES/SAG/ 2017-00004 Technical report ASAMPSA_E/ WP21/ D50.15/ 2017-33 vol1 107 / 142
ASAMPSA_E
Screening must take into account that the robustness of structures and utilities that pose a potential threat to the
NPP (e.g., dams, industrial facilities) may be significantly lower than the robustness of the NPP itself. Threats by
incidents caused by the failure of such structures and utilities may consequently arise from seismotectonic events
with severities, which would not pose a threat to the NPP itself.
A screening process for correlated hazards may be structured in the following way:
1. Screening of correlated hazards based on physical impossibility starting from analyzing the location of the
NPP site:
Site location at seaside, lake, or river. One or several of the following hazards may as an example
be screened out : Tsunami [N7], Obstruction of river channel [N12], Changing river channel
[N13], Seiche [N16], Underwater landslide [N61]
Topography : Snow avalanche [N47], Slope instability [N60], Debris flow, mudflow [N62]
Distance to volcanic structures : Nearby and remote volcanic hazards [N68, N69]
2. The screening process should further identify the absence / presence of facilities which, upon their fail-
ure due to a seismotectonic event, pose potential threats to the NPP :
Water containments [N15]
Industrial facilities [M1, M2]
Military facilities [M3, M4]
Transportation routes and transportation facilities [M10 to M12]
Pipelines [M13, M14]
3. For facilities not screened out in (2) vulnerability assessments are required to estimate the hazard severi-
ty which leads to incidents or failures which pose threats to the NPP site. Assessments must take note of
the fact that events with ground motion values well below the design basis of the NPP may cause severe
damage to other structures due to the fact that these are not designed for equally high safety standards
and have higher vulnerabilities than the NPP.
4. For the sites of facilities posing potential threats to the NPP step (1) should be repeated to identify corre-
lated hazards relevant for these sites.
5. Correlation with meteorite fall (vibratory ground motion caused by meteorite impact) can possibly be
screened out by extreme unlikeliness using statistics quantifying the flux of meteorites to the Earth and
providing empirical relations between meteorite size and fall frequency. The latter is defined by a power
law quantifying the number of meteorites with a certain diameter colliding with the Earth per year
(Brown et al., 2002).
6. Stability of external power grid cannot be screened out even for low levels of seismic ground shaking. The
ENSREG Stress Tests identified that the external power grids may be highly vulnerable and may not sus-
tain even small earthquakes with intensities IMSK > 6 and PGAhor > 0.05 g (SÚJB, 2011, p.76).
For further detailed guidance for screening initiating events and hazards for consideration in extended PSA we
refer to the Wielenberg and al. (2017; ASAMPSA_E Report D30.7 vol2).
Page 108
Guidance document on practices
to model and implement EARTHQUAKE hazards in extended PSA (final version) - Volume 1
Report IRSN/PSN-RES/SAG/ 2017-00004 Technical report ASAMPSA_E/ WP21/ D50.15/ 2017-33 vol1 108 / 142
ASAMPSA_E
5.4 METHODS FOR THE ASSESSMENT OF HAZARD COMBINATIONS
The following chapter includes guidance to the assessment of selected hazards which are causally dependent on
vibratory ground motion. It should be noted that each of the correlations shown in the hazard correlation chart
(Figure 24) may require a specific assessment method. A comprehensive discussion of methods for all hazard corre-
lations, however, is beyond the scope of the current document.
Vibratory ground motion [N1] – Fault capability [N3]:
Ground displacement hazard should be analyzed by PFDHA (Probabilistic Fault Displacement Hazard Analysis) as
described in the chapters 4.3.3 and 4.4.3.
Vibratory ground motion [N1] – Liquefaction [N4]:
Vibratory ground motion [N1] – dynamic compaction [5]:
Liquefaction of soil and unconsolidated fine-grained sediments occurs by the expulsion of pore water due to seis-
mic shaking. Liquefaction phenomena typically occur at local intensities of IESI-2007 = VIII or higher (Michetti et al.,
2007). Assessments of the probability of liquefaction are commonly based on the following criteria:
o Seismic criteria: liquefaction only occurs upon the exceedance of a threshold magnitude within a given
epicentral distance (Figure 25). The exceedance of a local level of ground shaking and minimum number
of loading cycles (earthquake duration) is a prerequisite for the phenomenon. The probability of ground
motion exceeding the threshold (ground acceleration, earthquake duration) derives from seismic hazard
assessment.
o Geological criteria: the susceptibility to liquefaction decreases significantly with the age of sediments
(susceptibility of Holocene sediments > Pleistocene > Pre-Pleistocene) and depends on the sediment faci-
es (fluvial, alluvial, lacustrine and aeolian sediments may be highly susceptible; Youd & Perkins, 1978).
Other important parameters include grain size (sand is most susceptible, silt under certain conditions,
gravely sand rarely susceptible to liquefaction), sorting and angularity of grains.
o State criteria: The initial "state" of sediment is defined by its density and effective stress at the time it is
subjected to loading. At a given effective stress level, looser sediments are more susceptible to liquefac-
tion than denser ones. For a given density, soils at high effective stresses are generally more susceptible
to liquefaction than soils at low effective stresses.
Input data required for the assessment of liquefaction hazards are listed in chapter 3.1.3 of this report. Recent
examples of soil liquefaction analyses for nuclear power plants include the studies for Paks NPP (Bán et al., 2015;
Tóth et al., 2015).
Page 109
Guidance document on practices
to model and implement EARTHQUAKE hazards in extended PSA (final version) - Volume 1
Report IRSN/PSN-RES/SAG/ 2017-00004 Technical report ASAMPSA_E/ WP21/ D50.15/ 2017-33 vol1 109 / 142
ASAMPSA_E
Figure 25. Graph showing surface wave magnitude (Ms) – distance relations for liquefaction phe-
nomena based on empirical data. [Liquefaction_seismic_criteria.JPG]
Vibratory ground motion [N1] – Ground displacement [N6]:
The hazard is only relevant for sites which are located in the vicinity of faults which may accumulate significant
vertical displacement during a seismic event, e.g., in the hangingwall of thrust faults or in the hangingwall / foot-
wall of large normal faults, or releasing/restraining bends of strike-slip faults. According to the ESI Intensity Scale
(Michetti et al., 2007) permanent vertical ground displacements of < 0.1 m may be induced by earthquakes with
local intensity IESI-2007 = VII. Permanent ground dislocation with amplitudes of about 1 m and more are possible for
local intensities IESI-2007 > IX.
The occurrence probabilities of large displacements at normal or thrust faults may be assessed by methods compa-
rable to PFDHA. Chapter 3.1.4 provides a list of data required for the assessment of ground displacement hazards.
Vibratory ground motion [N1] – Tsunami [N7]:
The perception of the Fukushima Daiichi accident may suggest that vibratory ground motion – tsunami as a typical
hazard combination. Although tsunami is a relevant hazard for European costal sites, the combination of tsunami
flooding with strong vibratory ground motion is not regarded typical for European coasts. Previous and potential
future sources of tsunamis affecting the European Atlantic coast include submarine landslides (e.g., the Storega
Landslide; Bondevik et al., 2005; Smith et al., 2004; Weninger et al., 2008), possible volcanic collapse (Canary
Islands; Ward & Day, 2001), and offshore earthquakes in the Gibraltar seismic arc (1755 Lisbon earthquake; the
earthquake offshore Portugal caused a tsunami with catastrophic effects; e.g., Gutscher et al., 2006). Tsunami-
genic seismic sources in the Atlantic, however, are remote from current nuclear sites. The probability for a costal
Page 110
Guidance document on practices
to model and implement EARTHQUAKE hazards in extended PSA (final version) - Volume 1
Report IRSN/PSN-RES/SAG/ 2017-00004 Technical report ASAMPSA_E/ WP21/ D50.15/ 2017-33 vol1 110 / 142
ASAMPSA_E
site to be affected by vibratory ground motion and tsunami is therefore equal to the probability of a tsunamigenic
earthquake, e.g., in the Gibraltar seismic arc.
For the Tsunami hazard assessment we refer to the ASAMPSA_E Guidance for External Flooding.
Vibratory ground motion [1] – Water containment failure [15]:
Assessment of the hazard by earthquake induced water containment failure requires a site-specific seismic hazard
assessment for the dam sites under consideration. SHA may rely on the same dataset and methodology as the SHA
performed for the nuclear installation, but needs to account for the different location and site conditions of the
water containment structures. The assessment of the probability of hazards resulting from containment failure
further needs to take account of the vulnerability of the structures. Examples from the Swiss NPP Mühleberg and
the upstream Wohlensee dam show that fragility analysis is challenging. There, the seismic fragility of the
Wohlensee was established by a nonlinear analysis revealing HCLPF values for its seismic resistance (Ghanaat et
al., 2011).
Apart from direct coseismic effects on water dams vibratory ground motion may also lead to increased post-
seismic vulnerability of water control structures and dykes which persist for long time periods. Such weakening of
protection systems may be relevant for the assessment of flooding hazards.
Vibratory ground motion [N1] – Slope instability [N60]:
Slope instability caused by seismic ground shaking is a common and frequent effect of earthquakes on the natural
environment for earthquakes with local environmental intensity IESI-2007 = VIII or higher (Michetti et al., 2007). As-
sessments of the probability of slope instability should account for the following criteria:
o Magnitude – distance criteria: Empirical data show positive correlations between the earthquake mag-
nitude and the distance from the epicenter or the ruptured fault where slope instabilities may occur
(Figure 26, Figure 27). The probabilities of ground motion exceeding the threshold for triggering land-
slides therefore can be derived from SHA. Assessment may reveal the probability of earthquakes which
cause ground motion at the site with IESI-2007 ≥ VIII, or the probability of earthquakes with magnitudes ex-
ceeding the threshold, which occur within a certain distance from the site. When magnitude-distance cri-
teria are used for hazard assessment care must be taken to apply relations which derived from datasets of
climatically similar regions. Several published relations distinguish between “wet” and “dry” countries
due to the fact that water saturated soils and rocks are more susceptible to landsliding (e.g., Japanese
Geotechnical Society, 1999).
o Susceptibility criteria: The Japanese Geotechnical Society (1999) proposed a number of factors to assess
the susceptibility of slopes to earthquake-induced slope instability. Factors include morphological and ge-
ological criteria such as the elevation difference and length of slopes, slope morphology expressed by the
shape of contour lines (convex, concave, curved or linear), length of artificial slopes, rock type and frac-
ture patterns. Factors are used for a categorization of the vulnerability of slopes with respect to slope in-
stability.
Page 111
Guidance document on practices
to model and implement EARTHQUAKE hazards in extended PSA (final version) - Volume 1
Report IRSN/PSN-RES/SAG/ 2017-00004 Technical report ASAMPSA_E/ WP21/ D50.15/ 2017-33 vol1 111 / 142
ASAMPSA_E
Figure 26. Empirical magnitude-distance criteria for earthquake-induced slope instability for Japan
(redrawn from Tamura, 1978). Graphs show the distance from fault or epicenter to the outer
boundaries of the zone where many (red line) or few (broken line) slope failures occur
[Slope_instability_Japan.JPG]
Figure 27. Empirical correlations between the area affected by landslides and magnitude (redrawn
from Keefer, 1984; Rodriguez, 2006). [Slope_instability_Keefer_Rodriguez.JPG]
Page 112
Guidance document on practices
to model and implement EARTHQUAKE hazards in extended PSA (final version) - Volume 1
Report IRSN/PSN-RES/SAG/ 2017-00004 Technical report ASAMPSA_E/ WP21/ D50.15/ 2017-33 vol1 112 / 142
ASAMPSA_E
Vibratory ground motion [1] – Obstruction of river channel [12]:
Vibratory ground motion [1] – Changing river channel [13]:
Obstructions of river channels may result from the damming of a river or valley by earthquake-induced slope fail-
ure or debris flows. The listed phenomena may similarly force river channels to change their course. The assess-
ment of the probabilities of events leading to such changes may use approaches as outlined above (Vibratory
ground motion [N1] – Slope instability [N60]) and below (Vibratory ground motion [N1] – Debris flow – mud flow
[N62]).
Vibratory ground motion [1] – Debris flow – mud flow [N62]
Earthquake triggered debris flows and mud flows may result from the effect of vibratory ground motion on water-
saturated soil. “Wet” soil conditions are a prerequisite for the phenomenon. The probability of occurrence can be
estimated as the product of the probability of an earthquake causing ground motion in excess of a threshold value
at which debris flows/mud flows can be triggered, and the probability that “wet” soil conditions exist during the
time of the earthquake. The temporal and spatial variation debris-flow susceptibility can be estimated from rain-
fall infiltration and slope stability based on high-resolution topographic data (DEM), data on initial groundwater
conditions, physical properties of near-surface earth materials, and depth to bedrock (e.g., Baum et al., 2011).
Although debris flow hazard assessment is well established, assessments of the probabilities of earthquake-
triggered debris flows were so far only rarely performed (e.g., Junnan et al., 2015). Debris flow hazard assess-
ments account for the earthquake magnitude, topography (slope), lithology, fault density, land use, and total
antecedent rainfall (or rainfall intensity) in the water shed under consideration.
Lesions learned from the 2008 Wenchuan Mw 7.9 earthquake and earthquakes in Taiwan indicate that strong
earthquakes do not only trigger coseismic landslides but also lead to increased post-seismic slope instability which
persists for a long period of time. The effect is due to the abundance of loose debris derived from landslide nu-
merous small landslides and the formation of co-seismic extension cracks on hill slopes reducing both soil stability
and increasing infiltration. In Wenchuan, debris flows further led to the formation debris-dams, dammed lakes,
and flooding of the area upstream of the dams. The Wenchuan earthquake may consequently be considered as an
event leading to cascading natural disaster chain (Junnan, 2015).
Vibratory ground motion [1] – Man-made hazards [M]
Assessments of combinations of vibratory ground motion with man-made hazards require data on the seismic vul-
nerabilities of man-made structures outside the site and the identification of accident sequences in off-site facili-
ties which may pose threats to the NPP. As outlined in chapter 5.3 it must be taken into account that the robust-
ness of structures and utilities that pose potential threats to the NPP may be significantly lower than the robust-
ness of the NPP itself. Although higher safety requirements usually exist for non-nuclear high-risk facilities such as
water dams or chemical plants, other facilities may only be engineered to fulfill common building codes (i.e.,
these facilities will only be engineered to withstand ground shaking levels with non-exceedance probabilities of
95% in 50 years; EUROCODE 8). Due to the outlined engineering differences between common structures and NPPs
two earthquake scenarios may be distinguished:
Page 113
Guidance document on practices
to model and implement EARTHQUAKE hazards in extended PSA (final version) - Volume 1
Report IRSN/PSN-RES/SAG/ 2017-00004 Technical report ASAMPSA_E/ WP21/ D50.15/ 2017-33 vol1 113 / 142
ASAMPSA_E
o man-made hazards induced by earthquake severities below the design basis of an NPP: vibratory
ground motion at levels below the NPP design base are not expected to challenge the safety of the NPP
and should therefore not lead to accident conditions; external man-made events triggered by such earth-
quakes may therefore be modeled as a single hazard rather than an additional challenge combined with
the impact of seismic ground motion on the NPP;
o man-made hazards induced by earthquake severities equal to or higher than the design basis of the
NPP: for such cases failure of the potentially hazardous structures may be reasonably postulated; it may
therefore be necessary to consider the resulting adverse effects as coincident with earthquake damage to
the NPP.
In both cases the effects of the earthquake-triggered man-made phenomena on the NPP may be conditional on
parameters other than vibratory ground motion. Examples are the impact of chemical release or fire which may
depend on wind direction, and the amount of emissions which may depend on the type and amount of chemicals
available at the plant at the time of the earthquake.
Page 114
Guidance document on practices
to model and implement EARTHQUAKE hazards in extended PSA (final version) - Volume 1
Report IRSN/PSN-RES/SAG/ 2017-00004 Technical report ASAMPSA_E/ WP21/ D50.15/ 2017-33 vol1 114 / 142
ASAMPSA_E
5.5 EXAMPLES OF HAZARD COMBINATIONS
A non-comprehensive list of hazard combinations for seismotectonic hazards which is regarded most likely is shown
in Table 12.
Typical and abundant combinations of seismotectonic hazards
N1* Vibratory ground motion N4* Liquefaction (1)
N1 Vibratory ground motion N5 Dynamic compaction (2)
N1 Vibratory ground motion N15 Water containment failure (3)
N1 Vibratory ground motion N60 Slope instability (4)
N1 Vibratory ground motion M1, M2 Industry accidents (5)
N1 Vibratory ground motion M19 Stability of power grid (6)
N3 Fault capability N15 Vibratory ground motion
N3 Fault capability N4 Liquefaction
N3 Fault capability N5 Dynamic compaction
* Numbers refer to hazard list defined in ASAMPSA_E Report D21.2 (Decker & Brinkman, 2014)
(1) Sites on liquefyable soft soil
(2) Sites on soft soil
(3) Up- or donwstram dams, water protection systems, dykes
(4) Including effects of landslide on surrounding infrastructure, rivers etc.
(5) Lower level of seismic design of ordinary facilities as compared to NPPs to be considered
(6) LOOP; high vulnerability of power grid to be considered
Table 12. Non-comprehensive list of typical and abundant combinations of seismotectonic hazards to be
considered in extended PSA
Observed and seriously investigated hazard combinations include the following:
o NPP Fukushima Dai-Ichi : combination of vibratory ground motion [N1] and slope instability [N60] where
the latter effect leading to loss of offsite power [M19] due to the destruction of energy transmission lines;
o NPP Paks : liquefaction caused by vibratory ground motion which slightly exceeds the seismic design basis
value was identified as a serious hazard challenging the stability of underground connections (piping, ca-
bles etc.; HAEA, 2014) and led to dedicated hazard assessment (Bán et al., 2ß15; Tóth et al., 2015);
o NPP Mühleberg : Fragility analyses showed that the seismic robustness of one of the safety trains for core
cooling is limited by the seismic resistance of the Wohlensee dam wall upstream of the plant because the
cooling water intake of the special emergency system is endangered in case of a seismically induced fail-
ure of the dam wall (ENSI, 2011).
Page 115
Guidance document on practices
to model and implement EARTHQUAKE hazards in extended PSA (final version) - Volume 1
Report IRSN/PSN-RES/SAG/ 2017-00004 Technical report ASAMPSA_E/ WP21/ D50.15/ 2017-33 vol1 115 / 142
ASAMPSA_E
5.6 ASSESSMENT OF COINCIDENT HAZARDS
Coincident hazards refer to the temporal concurrence of causally not connected independent events which are
associated with different hazards. Guidance for the assessment of coincident hazards is provided by WENRA
(2015):
“It is possible for more than one independent natural event to apply simultaneously to a site. Such combinations
of events should be considered carefully where frequent natural phenomena are involved which pose similar de-
mands to the plants. The analysis of the probability of such event combinations should consider the duration of
the events.” (WENRA, 2015). It is further stated that “The simultaneous application of two independent low fre-
quency hazards is considered as unreasonable.”
Based on this guidance two types of coincident hazards may be discerned:
o Frequent phenomena which pose similar demands to the plant: in this context vibratory ground motion
and other seismotectonic hazards are not regarded as “frequent23”; the only “frequent” natural phenom-
enon posing loads similar to those of vibratory ground motion is wind (High wind, storm [N40]); wind loads
are similar to horizontal ground acceleration induced by vibratory ground motion; combined effects of
both phenomena, however, only apply to buildings and SSCs outside of buildings; due to the short dura-
tion of earthquakes (seconds to minutes) and the limited duration of high winds the hazard combination
will likely be screened out by its low probability;
o Event combinations leading to different demands to the plant: earthquakes are short; however, the
consequences of vibratory ground shaking and other seismotectonic incidents on the plant and the SSCs
relevant to safety may be long lasting; the occurrence of independent natural events during the accident
management or repair time subsequent to an earthquake is therefore significantly higher than the proba-
bility of a temporal coincidence with the earthquake; assessment of the probability of hazard coincidenc-
es should consider the time required until full plant resilience is regained again after an earthquake; spe-
cial care should be taken to consider earthquake damage to SSCs which protect against other hazards and
which are not designed to withstand seismic loads; examples could be the damage or blocking of parts of
the sewer system leading to a loss of protection against flash flooding [N8] or the unavailability of mobile
equipment (e.g., for flood protection) due to damage of storage buildings;
similar considerations may be appropriate for the assessment of other hazards which cause long-lasting
consequences for the plants; examples are High wind, storm [N40] or icing [N34] leading to the damage of
the electrical grid (LOOP); in such cases the event duration should be defined by the repair time instead
of the event duration.
23 Compared to, e.g., combinations of high tide, storm surge and wind-driven waves, whith increase flood hazards.
Page 116
Guidance document on practices
to model and implement EARTHQUAKE hazards in extended PSA (final version) - Volume 1
Report IRSN/PSN-RES/SAG/ 2017-00004 Technical report ASAMPSA_E/ WP21/ D50.15/ 2017-33 vol1 116 / 142
ASAMPSA_E
6 CONCLUSION AND RECOMMENDATIONS
This report summarizes the collective experience of the partners involved in developing guidance on seismic haz-
ard assessment. In order to stimulate progress in the reliability of hazard assessments the following recommenda-
tions are highlighted:
Database and key input parameters for hazard assessment
Seismotectonic
model
The construction of a well-supported seismotectonic model is regarded as a key step in the
seismic hazard assessment procedure. Decisions such as the selection of seismic sources,
characterization of active faults, and assessment of seismicity rates depend on this model.
It is recommended to regard the seismotectonic model as a theory of the Pliocene to
Quaternary tectonic evolution of the region under consideration. Seismotectonic models
solely derived from seismological data are regarded as outdated. Instead, models should
be based on all geoscience data available in the region of interest noting that research
activities on active tectonics, earthquake geology, space geodesy, and seismology in-
creased exponentially in the last decade.
Earthquake data Completeness assessments of typical European earthquake catalogues performed with the
Stepp Test and the TCEF method show that records for earthquakes (including strong ones)
are only complete for the last 300 - 500 years. This limitation will remain in spite of extend-
ed efforts of historical earthquake research. The data row is too short to establish reliable
recurrence interval for the strongest earthquakes due to the rareness of these events.
It is recommended to mitigate the outlined shortcoming of earthquake catalogues by
systematic paleoseismological investigations to constrain the magnitudes and recurrence
intervals of strong prehistorical earthquakes.
Active faults Earthquakes occur on faults. Most parts of Europe are intra-plate areas with slow or very
slow faults producing earthquakes at recurrence times of 10³ to 105 years, which are signifi-
cantly longer than the time covered by earthquake records. It is therefore very unlikely that
all faults, which pose a potential threat, are recognized from analyzing earthquake records.
The epistemic uncertainties resulting from the inadequate time coverage of earthquake
catalogues should be reduced by systematic fault mapping and the collection of data to
locate and characterize active faults. A work flow of a graded approach for the identifi-
cation and assessment of active / capable faults in the near-region and region of a site is
introduced in the current report.
Page 117
Guidance document on practices
to model and implement EARTHQUAKE hazards in extended PSA (final version) - Volume 1
Report IRSN/PSN-RES/SAG/ 2017-00004 Technical report ASAMPSA_E/ WP21/ D50.15/ 2017-33 vol1 117 / 142
ASAMPSA_E
Active fault cata-
logues
Comprehensive active fault catalogues are currently neither available at a European scale
nor for many EU member states. The available catalogues do not share common quality
standards.
Comparison of the few available European datasets with active fault databases in the U.S.
and Japan shows that the latter fulfill significantly higher quality standards with respect to
completeness and reliability.
The development of active fault data is a long-term perspective. The required time and
research efforts can hardly be reconciled with the schedules of a PSA or PSR. It is rec-
ommended to implement research activities on international or European level to estab-
lish a comprehensive uniform active fault database for regions around NPPs to be used
for seismic hazard assessment in the framework of PSA and periodic safety reviews (PSR)
as required by WENRA (2014a).
Ground motion
prediction equa-
tions
Ground motion prediction equations (GMPEs) are a very sensitive issue in seismic hazard
assessment. Due to the sparsity of strong instrumental earthquakes in large parts of Europe
virtually no ground motion records exist which can be used to derive empirical attenuation
relations. These limitations may be overcome by the simulation of ground motion based on
the modelling of fault rupture processes, seismic wave propagation, and site effects in the
near future. Methods are currently developing.
Maximum magni-
tude Mmax
Assessments of Mmax are highly sensitive for ground motion hazard assessments. Recent re-
search shows that it is not possible to derive reliable estimates of Mmax from earthquake
catalogues.
It is recommended to derive estimates of Mmax from geological data such as fault dimen-
sions and paleoseismological evidence.
Methods commonly applied and key input parameters for hazard assessment
PSHA
(Probabilistic
Seismic Hazard
Assessment)
PSHA is the most common method to assess vibratory ground motion hazards in Europe. It is
well established and provides all inputs for PSA (i.e., ground acceleration or spectral accel-
eration values for different annual probabilities and their uncertainties). Formalized proce-
dures exist for the treatment of epistemic uncertainties (logic trees) and the use of expert
judgement (“SSHAC levels”).
For PSA some annual probabilities at 10-4 to 10-6 are needed (these values are consistent
with LERF for internal events). Hazard estimates for such low exceedance probabilities are
Page 118
Guidance document on practices
to model and implement EARTHQUAKE hazards in extended PSA (final version) - Volume 1
Report IRSN/PSN-RES/SAG/ 2017-00004 Technical report ASAMPSA_E/ WP21/ D50.15/ 2017-33 vol1 118 / 142
ASAMPSA_E
associated with large uncertainties, which is due to the fact that (a) the time coverage of
earthquake records is short (few 10² years) and data need to be extrapolated over 2 to 4
orders of magnitude (104 to 106 years), and (b) complete and reliable data of active faults
and paleoseismicity are only locally available and incomplete.
With respect to the reliability of the assessment the following is recommended:
assessments should not be based on single expert opinions (SSHAC Level 1); in-
dependence of experts (i.e., the ability of an expert to provide his/her own
views and not those of their peers, sponsors, or agency) is a key issue;
PSHA should be subjected to rigorous participatory peer review by independent
experts, including the period of data collection;
the preferred approach should correspond to SSHAC Level 3 (application of
SSHAC Level 4 in Swiss project PEGASOS turned out to be unduly time consum-
ing).
The reliability of PSHA can only be increased by increasing the quality of input data (see
recommendations above). SHA is therefore a long-term perspective requiring sufficient
time for data collection.
DSHA
(Probabilistic
Seismic Hazard
Assessment)
DSHA typically determines the maximum credible vibratory ground motion at a site. It does
not provide annual probabilities of occurrences of ground motion amplitudes and the related
uncertainties. However, DSHA can provide an estimate of the largest amplitude of vibratory
ground motion to be expected at a site as an upper cutoff value for PSA and the assessment
of DEC.
Hazard combinations
Screening of
correlated haz-
ards
Vibratory ground motion and fault capability are correlated with a large number of natural
and man-made external hazards. The number of correlations can be significantly reduced by
screening with screening-out criteria preferably based on demonstrating that incidents of
certain types of hazards are physically impossible at the site.
Page 119
Guidance document on practices
to model and implement EARTHQUAKE hazards in extended PSA (final version) - Volume 1
Report IRSN/PSN-RES/SAG/ 2017-00004 Technical report ASAMPSA_E/ WP21/ D50.15/ 2017-33 vol1 119 / 142
ASAMPSA_E
7 LIST OF TABLES
Table 1. List of seismotectonic hazards covered in the current document (from ASAMPSA_E D21.2). Explanation
to columns: Dur.: duration of hazard phenomena classified as s-m (seconds to minutes), m-h (minutes to hours), h-
d (hours to days), d-l (days and longer). P&P: Hazard predictability and hazard progression: predictable (P),
unpredictable (U), progressing rapidly (R) or gradually (G). Ref: references to international standards introducing
the hazard type. ................................................................................................................... 19
Table 2. List of European earthquake catalogues with continent-wide coverage. ....................................... 43
Table 3. List of national earthquake catalogues of European countries. .................................................. 45
Table 4. List of earthquake catalogues focused on historical earthquake data. ......................................... 47
Table 5. List of moment tensor, earthquake mechanism and stress databases. ......................................... 50
Table 6. List of active and capable fault databases available for European countries. ................................. 52
Table 7. Completeness intervals estimated from European earthquake catalogues using the Step Test and the
TCEF method. Data sources: EU: Grünthal et al., 2009; FI: and ES: see Table 3 and Table 4 for reference
(magnitude-intensity conversion after Mezcua et al., 2011); FR: Baumont & Scotti, 2011; DE: Leydecker, 2011. .. 58
Table 8. Examples of tectonic geomorphology studies using quantitative geomorphic indices to identify active and
capable faults in non-arid regions. .............................................................................................. 72
Table 9. Criteria for assessing faults as “active” or “extinct” (Mallard, 1991) ........................................... 74
Table 10. Definitions of the roles of experts in a PSHA project according to SSHAC Guidelines. .................... 100
Table 11. Summaries of the structure and content of SSHAC Level 1 to Level 4 PSHAs ............................... 101
Table 12. Non-comprehensive list of typical and abundant combinations of seismotectonic hazards to be
considered in extended PSA .................................................................................................... 114
Page 120
Guidance document on practices
to model and implement EARTHQUAKE hazards in extended PSA (final version) - Volume 1
Report IRSN/PSN-RES/SAG/ 2017-00004 Technical report ASAMPSA_E/ WP21/ D50.15/ 2017-33 vol1 120 / 142
ASAMPSA_E
8 LIST OF FIGURES
Figure 1: Terminology of capable faults: master fault, secondary fault, splay fault. Note that different
terminologies exist in the U.S. [Fig_Secondary_Faults.JPG] ................................................................. 32
Figure 2. Coverage of the database of historical earthquakes AHEAD (2015)
[Fig_AHEAD_historical_earthquake_data.JPG] ................................................................................ 46
Figure 3. European stress data of the World Stress Map (WSM) database (release 2008) [Fig_WSM_Database.JPG]. 49
Figure 4. Active and capable fault data: coverage of the SHARE database (SHARE, 2012)
[Fig_SHARE_overview_map.JPG] ................................................................................................ 51
Figure 5. Explanation of completeness assessments of earthquake catalogues using the Stepp Test and the TCEF
method for a single magnitude or intensity class. “Minimum observation period” in the Step Plot designates the
time required for establishing reliable average recurrence intervals. [Stepp_TCEF_explanation.JPG].............. 56
Figure 6. Completeness assessment of the earthquake catalogue for Central, Western and NorthWestern Europe
(CENEC, 2009; Grünthal et al., 2009) using the Stepp Test and the TCEF method.[CENEC_Stepp.JPG
CENEC_Tcef.JPG] .................................................................................................................. 59
Figure 7. Completeness assessment of the Spanish earthquake catalogue (see Table 3 and Table 4 for reference)
using the Stepp Test and TCEF method. [ES_Stepp.JPG ES_Tcef.JPG] .................................................. 60
Figure 8. Completeness assessment of the Finnish earthquake catalogues (see Table 3 and Table 4 for reference)
using the Stepp Test and TCEF method. [FI_Stepp.JPG FI_Tcef.JPG] ................................................... 61
Figure 9. Completeness assessment of the French earthquake catalogues (see Table 3 and Table 4 for reference)
using the Stepp Test and TCEF method. [FR_Stepp.JPG FR_Tcef.JPG] ................................................. 62
Figure 10. Completeness assessment of the German earthquake catalogues (see Table 3 and Table 4 for reference)
using the Stepp Test and TCEF method. [DE_Stepp.JPG DE_Tcef.JPG] ................................................. 63
Figure 11. Examples of hazard curves: annual probability of exceedance of peak ground acceleration. Curves are
plotted for mean hazard value, median, and the 0.05, 0.16, 0.84 and 0.95 percentiles of confidence.
[Hazard_curve_examples.JPG] ................................................................................................... 66
Figure 12. Examples of hazard curves: probability of exceedance of spectral acceleration for different oscillation
frequencies (1 Hz, 10 Hz, 20 Hz, 50 Hz) and a selected degree of damping (commonly 5%). Curves are plotted for
mean hazard value, median, and the 0.05, 0.16, 0.84 and 0.95 percentiles of confidence.
[Spectral_acceleration_examples.JPG] ......................................................................................... 67
Figure 13. Uniform Hazard Spectra (UHRS) plotted for different annual probabilities of exceedance (10-4 to 10-7 per
year) and a selected degree of damping (commonly 5%). Curves are plotted for mean hazard value, median, and
the 0.05, 0.16, 0.84 and 0.95 percentiles of confidence. .................................................................... 68
Figure 14. Flow chart of the suggested graded approach for the identification and assessment of active / capable
faults in the near-region and region of a site. [Fig_Fault_Identification_Flow_Chart.JPG] .......................... 71
Figure 15. Examples of unreasonable seismic source zone definitions. (1) Source zones B and C divide a continuos
fault zone. (2) High seismicity in source zone C related to an unidentified active fault is unduly spread over the
Page 121
Guidance document on practices
to model and implement EARTHQUAKE hazards in extended PSA (final version) - Volume 1
Report IRSN/PSN-RES/SAG/ 2017-00004 Technical report ASAMPSA_E/ WP21/ D50.15/ 2017-33 vol1 121 / 142
ASAMPSA_E
entire source zone. (3) Source zone C “fences” a facility from other source zones with higher seismicity.
[Fig_Source_Zones.JPG] ........................................................................................................... 76
Figure 16. Example of different GMPEs relating PGAH with distance for an earthquake with M = 6. Note the large
spread of predicted ground motion at, e.g., 10 km distance. GMPEs from: ............................................... 79
Figure 17. Maximum magnitude: (a) cuttoff Gutenberg-Richter exponential distribution (Cornell & Van Marke,
1969), (b) truncated exponential distribution, and (c) characteristic earthquake model (Youngs & Coppersmith,
1985). Modified from NAGRA (2004) ............................................................................................. 80
Figure 18. Probability of surface rupture as a function of earthquake magnitude (Takao et al., 2015)
[Takao_probability_surface_rupture.JPG] ..................................................................................... 89
Figure 19. Example of fault displacement hazard curves of secondary fault with fractile values ...................... 90
Figure 20. Example of fault displacement hazard curves of secondary fault. Annual rate of exceedence is plotted
against distance from master fault as parameter assuming an earthquake with Mw = 6.5 at the master fault. By
courtesy of Y. Suzuki (2015). [PFDHA_example_2.JPG] ..................................................................... 90
Figure 21. (a) Example of a logic tree for assessing fault geometry as a characteristic of seismic sources. (b)
Example of a logic tree to assess maximum magnitude for a seismic source with uncertain kinematics (strike-slip,
reverse) and fault length. The probability of the magnitude on the right of the tree is the product of the
probabilities of the branches leading to the result. The final result is a distribution of Mmax to be used as input for
PSHA (redrawn from USNRG, 1997). ............................................................................................. 93
Figure 22. (a) Comparison of the time coverage of the European CENEC earthquake catalogue with a 10.000 years
time interval illustrating the extent of extrapolation required to assess events with an average recurrence interval
of 10.000 years. This average recurrence time corresponds to the occurrence probability of 10-4 per year as
defined for design basis requirements (WENRA, 2014a). (b) Regional coverage of the CENEC catalogue. (c)
Cumulative number of earthquakes for single magnitude classes of the CENEC Earthquake Catalogue (Grünthal et
al., 2009) plotting versus time. See chapter 3.3.1 for detailed explanation. [CENEC_vs_10000_years.JPG] ....... 96
Figure 23. Number of hazards correlated with seismotectonic hazards .................................................. 104
Figure 24. List of hazards correlated with seismotectonic hazards. Only direct consequences of individual hazards
are listed. Causal chains are not considered. Combinations of independent phenomena with low severity which
cause potential hazards by their contemporaneous occurrence are not identified.
[Seismic_hazard_correlation_list_2015_07_08.JPG] ........................................................................ 105
Figure 25. Graph showing surface wave magnitude (Ms) – distance relations for liquefaction phenomena based on
empirical data. [Liquefaction_seismic_criteria.JPG] ..................................................................... 109
Figure 26. Empirical magnitude-distance criteria for earthquake-induced slope instability for Japan (redrawn from
Tamura, 1978). Graphs show the distance from fault or epicenter to the outer boundaries of the zone where many
(red line) or few (broken line) slope failures occur [Slope_instability_Japan.JPG] ................................... 111
Figure 27. Empirical correlations between the area affected by landslides and magnitude (redrawn from Keefer,
1984; Rodriguez, 2006). [Slope_instability_Keefer_Rodriguez.JPG] .................................................... 111
Page 122
Guidance document on practices
to model and implement EARTHQUAKE hazards in extended PSA (final version) - Volume 1
Report IRSN/PSN-RES/SAG/ 2017-00004 Technical report ASAMPSA_E/ WP21/ D50.15/ 2017-33 vol1 122 / 142
ASAMPSA_E
9 LIST OF REFERENCES
Abrahamson, N., 2015. Current and planned uses of finite-fault numerical simulations for seismic hazard studies at
the Diablo Canyon Power Plant. Conference Paper, Best Practices in Physics-based Fault Rupture Models for Seis-
mic Hazard Assessment of Nuclear Installations, IAEA, November 18-20, 2015, Vienna, 9pp.
Abrahamson, N.A. & Silva, W.J. 1997. Empirical response spectral attenuation relations for shallow crustal earth-
quakes. Seism. Res. Lett. 68: 94–127."
Abrahamson, N.A. & Silva, W.J. 2008. Summary of the Abrahamson and Silva NGA ground-motion relations. Earth-
quake Spectra, 24: 67-97.
ACORN, 2004. Catalogue of Earthquakes in the Region of the Alps - Western Carpathians – Bohemian Massif for the
period from 1267 to 2004. Computer File, Vienna (Central Institute for Meteorology and Geodynamics, Department
of Geophysics) – Brno (Institute of Physics of the Earth, University Brno.
AEC, 2015. Earthquake catalogue of felt earthquakes 1200 – 2014 A.D. (Austria). Computer File. Central Institute of
Meteorology and Geodynamics (ZAMG), Vienna, Austria.
Ahmad, S., Bhat, M.I., 2012. Tectonic geomorphology of the Rambiara basin, SW Kashmir Valley reveals emergent
out-of-sequence active fault system. Himalayan Geology, 33 (2), 162-172.
AIST, 2015. GSJ / AIST / Institute of Earthquake and Volcano Geology, Active fault database of Japan. Accessed
2015-10-12, from web site:
https://gbank.gsj.jp/activefault/index_e_usual.html?search_no=e001&version_no=1&search_mode=0
AIST, 2015. GSJ / AIST / Institute of Earthquake and Volcano Geology, Active fault database of Japan. Accessed
2015-10-12, from web site:
https://gbank.gsj.jp/activefault/index_e_usual.html?search_no=e001&version_no=1&search_mode=0
Ake, J., Mahrer, K., O’Connell, D. & Block. L., 2005. Deep-injection and closely monitored induced seismicity at
Paradox Valley, Colorado. Bull. Seismol. Soc. Am., 95/2: 664-683.
Akkar, S. & Bommer, J.J. 2007. Empirical prediction equations for peak ground velocity derived from strong-
motion records from Europe and the Middle East. Bull. Seismol. Soc. Am., 97: 511–530.
Akkar, S., Sandikkaya, M.A. & Bommer, J.J., 2013. Empirical ground-motion models for point- and extended source
crustal earthquake scenarios in Europe and the Middle East. Bull. Earthquake Engineering, 12: 359-387.
Page 123
Guidance document on practices
to model and implement EARTHQUAKE hazards in extended PSA (final version) - Volume 1
Report IRSN/PSN-RES/SAG/ 2017-00004 Technical report ASAMPSA_E/ WP21/ D50.15/ 2017-33 vol1 123 / 142
ASAMPSA_E
Àlvarez-Rubio, S. & Fäh, D., 2009. The BOXER method applied to the determination of earthquake parameters
from macroseismic data - Verification of the calibration of historical earthquakes in the Earthquake Catalogue of
Switzerland (ECOS2009) www.seismo.ethz.ch/static/ecos-09/Appendix/Appendix_E.pdf
Ambraseys, N. N., J. Douglas, S. K. Sarma & Smit, P.M., 2005. Equation for the Estimation of Strong Ground Mo-
tions from Shallow Crustal Earthquakes Using Data from Europe and the Middle East: Horizontal Peak Ground Ac-
celeration and Spectral Acceleration. Bull. Earthquake Eng. 3, 1-53.
Ambraseys, N.N., 1988. Engineering seismology, Earthquake Engineering and Structural Dynamics, 17, 1-105.
Ambraseys, N.N., Simpson, K.A. & Bommer, J.J. 1996. Prediction of horizontal response spectra in Europe. Earthq.
Eng. Struct. Dyn. 25: 371–400.
Ambrasseys, N.N. & Douglas, J., 2003. Near-field horizontal and vertical ground motion relations. Soil Dynamics
and Earthquake Engineering, 23: 1-18.
Ambraseys, N. N., Douglas, J., Sarma, S. K., & Smit, P. M. 2005a. Equations for the estimation of strong ground
motions from shallow crustal earthquakes using data from Europe and the Middle East: Horizontal peak ground
acceleration and spectral acceleration. Bulletin of Earthquake Engineering, 3(1), 1–53.
ANS, 2015. Criteria for Assessing Tectonic Surface Fault Rupture and Deformation at Nuclear Facilities. ANSI/ANS-
2.30-2015, 60pp.
Armenian Nuclear Regulatory Authority, 2015. National Report. The Stress Test for Armenian Nuclear Power Plant.
http://www.ensreg.eu/armenia-stress-test
Atkinson, G. M. & Boore, D.M., 2006. Earthquake Ground-Motion Prediction Equations for Eastern North America.
Bull. Seism. Soc. Am., 96: 2181-2205.
Azor, A., Keller, E.A., Yeats, R.S., 2002. Geomorphic indicators of active fold growth: South Mountain-Oak Ridge
Ventura basin, Southern California. Bull. Seismol. Soc. Am., 114: 745-753.
Baisch, S., Martin, C. & SERIANEX group, 2010. Seismic risk analysis of the Basel Geothermal (EGS) Project. Euro-
pean Seismological Commission, 32nd General Assembly, Abstract Volume: 33.
Bán, Z., Györi, E., Katona, T. & Tóth, L. (2015). Characterisation of Liquefaction Effects for Beyond-Design Basis
Safety Assessment of Nuclear Power Plants. Geophysical Research Abstracts, 17: EGU2015-4152.
Basili, R., et al., 2007. The Database of Individual Seismogenic Sources (DISS), version 3: Summarizing 20 Years of
Research on Italy's Earthquake Geology, Tectonophysics, 453: 20–43.
Page 124
Guidance document on practices
to model and implement EARTHQUAKE hazards in extended PSA (final version) - Volume 1
Report IRSN/PSN-RES/SAG/ 2017-00004 Technical report ASAMPSA_E/ WP21/ D50.15/ 2017-33 vol1 124 / 142
ASAMPSA_E
Baum, R.L., Godt, J.W. & Coe, J.A., 2011. Assessing susceptibility and timing of shallow landslide and debris flow
initiation in the Oregon Coast Range, USA. Italian Journal of Engineering Geology and Environment -
www.ijege.uniroma1.it, 2011 Casa Editrice Università La Sapienza, DOI: 10.4408/IJEGE.2011-03.B-090, p. 825-834.
Baumont D. and Scotti O., 2011. The French Parametric Earthquake Catalogue (FPEC) based on the best events of
the Sisfrance macroseismic database - Version 1.1. IRSN/DEI/2011-012.
Bayliss, T., Burton, P. W., (2007) A new earthquake catalogue for Bulgaria and the conterminous Balkan high re-
gion. Nat. Hazazrds Earth Syst. Sci., 7: 345-359.
Beidinger, A. & Decker, K., 2011. Seismic mapping and kinematics of the Lassee segment of the active Vienna
Basin transfer fault system. Tectonophysics, 499: 22-40.
Bell, F.G., 2004. Engineering Geology and Construction. Spon Press, New York.
Berge-Thierry, C., F. Cotton, O. Scotti, D. A. Griot-Pommera & Fukushima, Y., 2003. New empirical response spec-
tral attenuation laws for moderate European earthquakes. J. Earthquake Eng. 7: 193-222.
Chapman, N., Berrymore, K., Villamor, P., Epstein, W., Cluff, L. & Kawamura, H., 2013. Active Faults and Nuclear
Power Plants. EOS, 95/4: 33-40.
Bhatt, C.M., Chopra, R., Sharma, P.K., 2007. Morphotectonic Analysis in Anandpur Sahib Area, Punjab (India) using
Remote Sensing and GIS Approach. Journal of the Indian Society of Remote Sensing 35 (2), 129-139.
Biswas, S., Grasemann, B., 2005. Quantitative morphotectonics of the southern Shillong Plateau (Bangla-
desh/India). Austrian Journal of Earth Sciences 97, 82-93.
BNRA, 2011. European “Stress Tests” for NPPs, National Report of Bulgaria, December 2011.
http://www.bnsa.bas.bg/en/documents-en/conventions-en/report-en/finalstresstests-kozloduy-en.pdf
BNRA, 2012. Republic of Bulgaria, National Report, Second Extraordinary Meeting under the Convention of Nuclear
Safety, Sofia, May 2012. http://www.bnsa.bas.bg/en/documents-en/conventions-en/report-en/cns-extra-
bulgaria.pdf
Julian J. Bommer, J-J., Coppersmith, K.J., Coppersmith, R.T., Hanson, K.L., Mangongolo, A., Neveling, J., Rathje,
Rodriguez-Marek, E.M., Scherbaum, F., Shelembe, R., Stafford, P.J. & Strasser, F.O., 2015. A SSHAC Level 3 Prob-
abilistic Seismic Hazard Analysis for a New-Build Nuclear Site in South Africa. Earthquake Spectra, 31/2: 661-
698.Bondevik, S., Lovhot, F., Harbitz, C., Mangerud J., Dawsin A. & Svendsen J. I., 2005. The Storegga Slide tsu-
nami – comparing field observations with numerical observations. Marine and Petroleum Geology 22: 195–208.
Page 125
Guidance document on practices
to model and implement EARTHQUAKE hazards in extended PSA (final version) - Volume 1
Report IRSN/PSN-RES/SAG/ 2017-00004 Technical report ASAMPSA_E/ WP21/ D50.15/ 2017-33 vol1 125 / 142
ASAMPSA_E
Boore, D. M., & Atkinson, G. M., 2007. Boore-Atkinson NGA ground motion relations for the geometric mean hori-
zontal component of peak and spectral ground motion parameters. PEER Report 2007/01. Pacific Earthquake Engi-
neering Research Center, College of Engineering, University of California, Berkeley.
Boore, D. M., Joyner, W. B., & Fumal, T. E., 1993. Estimation of response spectra and peak accelerations from
western North American earthquakes: An interim report. USGS Open-File Report 93-509. U.S. Geological Survey. 70
pp.
Boore, D. M., Joyner, W. B. & Fumal, T.E. 1997. Equations for estimating horizontal response spectra and peak
acceleration from western North American earthquakes; a summary of recent work. Seism. Res. Lett. 68: 128–153.
Brown, P., Spalding, R., ReVelle, D., Tagliaferri, E & Worden, P., 2002. The flux of small near-Earth objects collid-
ing with the Earth. Nature 420: 294-296.
Bull, W.B., 2007. Tectonic geomorphology of mountains: A new approach to paleoseismology. Blackwell, Malden.
Bull, W.B., 2009. Tectonically Active Landscapes. Wiley-Blackwell, New Jersey.
Bull, W.B., McFadden, L.D., 1977. Tectonic geomorphology north and south of the Garlock fault, California. Geo-
morphology in Arid Regions: In: Doehring, D.O. (Ed.), Proceedings of the Eighth Annual Geomorphology Symposia,
State University of New York, Binghampton, pp. 115–138.
Bull, W.B., McFadden, L.D., 1977. Tectonic geomorphology north and south of the Garlock fault, California. In:
Doehring, D.O. (Ed.), Geomorphology in Arid Regions. Proceedings of the Eighth Annual Geomorphology Symposia.
State University of New York, Binghampton, 115-138.
Burbank, D.W. & Anderson, R.S., 2011. Tectonic Ggeomorphology, 2nd Edition, 468 pp. (Wiley-Blackwell).
Burbank, D.W., Anderson, R.S., 2001. Tectonic Geomorphology. Blackwell Science, Malden.
Camelbeeck, T., & Meghraoui, M., 1998, Geological and geophysical evidence for large palaeo-earthquakes with
surface faulting in the Roer Graben (northwest Europe): Geophysical Journal International, v. 132, p. 347-362.
Campbell, K. W., 1997. Empirical near-source attenuation relationships for horizontal and vertical components of
peak ground acceleration, peak ground velocity, and pseudo-absolute acceleration response spectra. Seismological
Research Letters, 68(1): 154–179.
Campbell, KW. & Bozorgnia, Y., 2008. NGA ground motion model for the geometric mean horizontal component of
PGA, PGV, PGD and 5%-damped linear elastic response spectra at periods ranging from 0.1 s to 10.0 s. Earthquake
Spectra, 24: 139-171.
Cecić, I., 2016. Recent re-evaluations of historical earthquakes in Slovenian catalogue. Abstract, 4th International
Colloquium on Historical Earthquakes and Macroseismology, 2.-3. May 2016, Vienna, Austria.
Page 126
Guidance document on practices
to model and implement EARTHQUAKE hazards in extended PSA (final version) - Volume 1
Report IRSN/PSN-RES/SAG/ 2017-00004 Technical report ASAMPSA_E/ WP21/ D50.15/ 2017-33 vol1 126 / 142
ASAMPSA_E
Chapman, N., Berryman, K., Epstein, W., Kato, H., Lichtfield, N. & Okomura, K., 2004. Evaluation of Faults Near
the Tsuruga Nuclear Power Plant. Third Party Review Meeting and International Review Group, Summary of Inde-
pendent Findings of the 2nd Review June 3rd-5th 2014.
http://www.japc.co.jp/news/press/2014/pdf/260605_2e.pdf
Cline, C.M., Cline, M.L., Blanco, J., Quitmeyer, R., Kimball, J., Rizzo, P.C. & Bavec, M., 2015. Probabilistic fault
displacement hazard analysis for regulatory decision-making: a case study using state-of-the-practice fault charac-
terization methods. Conference Paper, Best Practices in Physics-based Fault Rupture Models for Seismic Hazard
Assessment of Nuclear Installations, IAEA, November 18-20, 2015, Vienna.
Coppersmith, K.J., & Youngs, R.R., 1986. Capturing Uncertainty in Probabilistic Seismic Hazard Assessment Within
Intraplate Tectonic Environments. In: Proceedings of the Third U.S. National Conference on Earthquake Engineer-
ing, Earthquake Engineering Research Institute, 1:301-312.
Cornell, C.A., 1968. Engineering seismic risk analysis. Bull. Seism. Soc. Amer., 58: 1583-1606.
Cornell, C.A., 1971. A probabilistic analysis of damage to structures under seismic loads. In: D.A Howells et al.
(eds), Dynamic waves in civil engineering, Chapter 27 (London, John Wiley & Sons).
CPTI Working Group, 2004. Catalogo Parametrico dei Terremoti Italiani, versione 2004 (CPTI04). INGV, Bologna.
CRWMS M&O, 1996, Probabilistic Volcanic Hazard Analysis for Yucca Mountain, Nevada: Las Vegas, Nevada
BA0000000-01717-2200-00082 REV 0.
CRWMS M&O, 1998, Probabilistic Seismic Hazard Analyses for Fault Displacement and Vibratory Ground Motion at
Yucca Mountain, Nevada, Vols. 1-3: Las Vegas, Nevada, Milestone SP32IM3.
Cuong, N.Q., Zuchiewicz, W.A., 2001. Morphotectonic properties of the Lo River Fault near Tam Dao in North Vi-
etnam. Natural Hazards and Earth System Sciences 1, 15-22.
Decker, K., 2017. Bibliography – Existing Guidance for External Hazard Modelling, Technical report ASAMPSA_E /
WP21 / D21.1 / 2015-09, reference IRSN PSN-RES/SAG/2015-00082
Decker, K., Homolova, D. & Porpaczy, C., 2011. Paleoseismology of Temelin's Near_Regional Faults. AIP [Austrian
Interfacing Project] - Part 1, 185 pp.
Decker, K. & Brinkman, H., 2017. List of external hazards to be considered in ASAMPSA_E. Technical report
ASAMPSA_E / WP21 / D21.2 / 2017-41, reference IRSN PSN-RES/SAG/2017-00004.
Deichmann, N., 2010. Injection-induced seismicity: placing the problem in perspective. European Seismological
Commission, 32nd General Assembly, Abstract Volume: 36-37.
Page 127
Guidance document on practices
to model and implement EARTHQUAKE hazards in extended PSA (final version) - Volume 1
Report IRSN/PSN-RES/SAG/ 2017-00004 Technical report ASAMPSA_E/ WP21/ D50.15/ 2017-33 vol1 127 / 142
ASAMPSA_E
Delavaud, E., Cotton, F., Akkar, S. et al., 2012. Toward a ground-motion logic tree for probabilistic seismic hazard
assessment in Europe. Journal of Seismology, 16: 451-473.
Der Kiureghian, A. & Ang, A.H.S., 1975. A line source model for sesimic risk analysis. Univ. Illinois Technological
Report, UILU-ENG-75-2023, Ureana, 134pp.
Douglas, J., 2011. Ground-motion prediction equations 1964-2010. Final Report BRGM/RP-59356-FR, February
2011.
Dziewonski, A. M., T.-A. Chou and J. H. Woodhouse, Determination of earthquake source parameters from wave-
form data for studies of global and regional seismicity, J. Geophys. Res., 86, 2825-2852, 1981.
doi:10.1029/JB086iB04p02825.
Ekström, G., M. Nettles, and A. M. Dziewonski, The global CMT project 2004-2010: Centroid-moment tensors for
13,017 earthquakes, Phys. Earth Planet. Inter., 200-201, 1-9, 2012. doi:10.1016/j.pepi.2012.04.002.
El Hamdouni, R., Irigaray, C., Fernández, T., Chacón, J., Keller, E.A., 2008. Assessment of relative active tecton-
ics, southwest border of the Sierra Nevada (southern Spain). Geomorphology 96, 150-173.
ENSI, 2011. EU Stress Test Swiss National Report. ENSI Review of the Operators’ Reports.
http://static.ensi.ch/1326182677/swiss-national-report_eu-stress-test_20111231_final.pdf
ENSREG, 2012a. Peer review report. Stress tests performed on European nuclear power plants.
http://www.ensreg.eu/node/407
ENSREG, 2012b. Compilation of recommendations and suggestions. Peer review of stress tests performed on Euro-
pean nuclear power plants. http://www.ensreg.eu/node/512
ENSREG, 2012c. Czech Republic. Peer review country report, Stress tests performed on European nuclear power
plants. http://www.ensreg.eu/node/393
ENSREG, 2012d. Slovenia. Peer review country report. Stress Tests performed on European nuclear power plants.
http://www.ensreg.eu/node/403
Ezati, M., Agh-Atabai, M., 2013. Active tectonic analysis of Atrak river subbasin located in NE Iran (East Alborz).
Journal of Tethys 1 (3), 177-188.
Fäh, D., Gassner-Stamm, G., Strasser, M., Grolimund, R & Wirth, S., 2016. Large earthquakes in historical and
prehistorical times in Switzerland: An overview of earthquake induced effects. Abstract, 4th International Collo-
quium on Historical Earthquakes and Macroseismology, 2.-3. May 2016, Vienna, Austria.
Folger, P. & Tiemann, M., 2015. Human-induced earthquakes from deep-well injection: a brief overview. Congres-
sional Research Service, CRS Report 7-5700, 29 pp.
Page 128
Guidance document on practices
to model and implement EARTHQUAKE hazards in extended PSA (final version) - Volume 1
Report IRSN/PSN-RES/SAG/ 2017-00004 Technical report ASAMPSA_E/ WP21/ D50.15/ 2017-33 vol1 128 / 142
ASAMPSA_E
Font, M., Amorese, D., Lagarde, J.L., 2010. DEM and GIS analysis of the stream gradient index to evaluate effects
of tectonics: The Normandy intraplate area (NW France). Geomorphology 119, 172-180.
Fortunato, C., Martino, S., Prestinizi, A., Romeo, R.W., 2012. New release of the Italian catalogue of earthquake-
induced ground failures (CEDIT), Italian Journal of Engineering Geology and Environment 2: 63–74, (with map), Doi:
10.4408/IJEGE.2012-02.O-05.
Garcia-Mayordomo, J., et al., 2012. The Quaternary active faults database of Iberia (QAFI v.2.0), Journal of Iberi-
an Geology, 38: 285–302.
García-Tortosa, F.J., Alfaro, P., Galindo-Zaldivar, J., Gubert, L., López-Garrido, A.C., Sanz de Galdeano, C., Ure-
ña, M., 2008. Geomorphologic evidence of the active Baza Fault (Betic Cordillera, South Spain). Geomorphology
97, 374-391.
Garrote, R., Cox, R.T., Swann, C., Ellis, M.A., 2006. Tectonic geomorphology of the southeastern Mississippi Em-
bayment in northern Mississippi, USA. Bull. Seismol. Soc. Am., 118: 1160-1170.
Gasperini, P., Bernardini, F., Valensise, G. & Boschi, E., 1999. Defining seismogenic sources from historical earth-
quake felt reports. Bull. Seismol. Soc. Am., 89: 94-110.
Geller, R.J., 2011. Shake-up time for Japanese seismology. Nature 472, 407–409.
Ghanat, Y., Hashimoto, P.S., Zuchuat, O. & Kennedy, R.P. (2011). Seismic fragility of Mühleberg dam using nonlin-
ear analysis with latin hypercube simulation. U.S. Society on Dams, 31st Annual USSD Conference, San Diego, Cali-
fornia, April 11-15, 2011, p 1197-1212.
Giaconia, F., Booth-Rea, G., Martínez-Martínez, J., Azañón, J.M., Pérez-Peña, J.V., Pérez-Romero, J., Villegas, I.,
2012. Geomorphic evidence of active tectonics in the Sierra Alhamilla (eastern Betics, SE Spain). Geomorphology
145-146, 90-106.
Green, R.A. & Hall, W.J., 1994. An overview of selected seismic hazard analysis methodologies. University of Illi-
nois at Urbana-Champaign, August 1994.
Grigorova E., Christoskov L., Sokerova D., Rizhikova S. and Roglinov A., 1978. Catalogue of earthquakes in Bulgaria
and the nearby territories during the period 1st cent. BC - 1977. Geophys. Inst., Bulg. Acad. Sci., Sofia (unpublis-
hed).
Grünthal G., 1988. Erdbebenkatalog des Territoriums der Deutschen Demokratischen Republik und angrenzender
Gebiete von 823 bis 1984. Veröff. Zentralinst. Physik der Erde (99), Potsdam, 139 pp.
Grünthal, G. & Wahlström, R., 2012. The European‐Mediterranean Earthquake Catalogue (EMEC) for the last mil-
lennium. ‐ Journal of Seismology, 16: 535‐570.
Page 129
Guidance document on practices
to model and implement EARTHQUAKE hazards in extended PSA (final version) - Volume 1
Report IRSN/PSN-RES/SAG/ 2017-00004 Technical report ASAMPSA_E/ WP21/ D50.15/ 2017-33 vol1 129 / 142
ASAMPSA_E
Grünthal, G., Wahlström, R. & Strohmeyer, D., 2009. The unified catalogue of earthquakes in central, northern,
and northwestern Europe (CENEC) - updated and expanded to the last millennium. J. Seismol., 13: 517-541.
GSHAP (Global Seismic Hazard Assessment Program), 1999. http://www.seismo.ethz.ch/static/GSHAP.
Guigueno, Y., Pihl, J., Karlsson, A. & Rahni, N., 2014. Minutes and recommendations of the ASAMPSA_E Uppsala
End-Users workshop (26-28/05/2014). Technical report ASAMPSA_E / WP10 / 2014-07.
Guigueno, Y and al, ASAMPSA_E, Synthesis of the initial survey related to PSAs End-Users needs, technical report
ASAMPSA_E/WP10/D10.2/2014-051- Reference IRSN PSN-RES/SAG/2014-00193
Gürbüz, A. & Gürer, Ö.F., 2008. Tectonic Geomorphology of the North Anatolian Fault Zone in the Lake Sapanca
Basin (Eastern Marmara Region, Turkey). Geosciences Journal 12 (3), 215-225.
Gutenberg, B., Richter, C. F., 1956. Magnitude and Energy of Earthquakes. Annali di Geofisica, 9: 1–15.
Guterch B. & Lewandowska-Marciniak H., 2002. Seismicity and seismic hazard in Poland. Folia Quat., 73: 85-99.
Guterch, B. & Kozák, J., 2015. Studies of Historical Earthquakes in Southern Poland: Outer Western Carpathian
Earthquake of December 3, 1786, and First Macroseismic Maps in 1858-1901. (Springer).
Gutscher, M.-A., Baptista, M.A.. & Miranda, J.M., 2006. The Gibraltar Arc seismogenic zone (part 2): Constraints
on a shallow east dipping fault plane source for the 1755 Lisbon earthquake provided by tsunami modelling and
seismic intensity. Tectonophysics 426: 153-166.
Hack, J.T., 1973. Stream-profiles analysis and stream-gradient index. Journal of Research. United States Geologi-
cal Survey 1, 421–429.
HAEA (Hungarian Atomic Energy Authority), 2014. National Action Plan of Hungary on the implementation actions
decided upon the lessons learned from the Fukushima Daiichi accident. http://www.ensreg.eu/node/3769
Hanks, T.C., Abrahamson, N.A., Boore, D.M., Coppersmith, K.J, Knepprath, N.E., 2009. Implementation of the
SSHAC Guidelines for Level 3 and 4 PSHAs - Experience Gained from Actual Applications. U.S. Geological Survey
Open File Report 2009-1093, 66 pp.
Hanks, T.C. & Bakun, W.H., 2002. A Bilinear Source-Scaling Model for M–log A Observations of Continental Earth-
quakes. Bull. Seismol. Soc. Am., 92/5: 1841–1846.
Heidbach, O., Tingay, M., Barth, A., Reinecker, J., Kurfeß, D. and Müller, B., 2008. The World Stress Map database
release 2008 doi:10.1594/GFZ.WSM.Rel2008.
Herak M., 1995. Earthquake Catalogue of Croatia and adjacent Regions. Archives of the Andrija Mohorovicic Geo-
physical Institute, Zagreb (unpublished).
Page 130
Guidance document on practices
to model and implement EARTHQUAKE hazards in extended PSA (final version) - Volume 1
Report IRSN/PSN-RES/SAG/ 2017-00004 Technical report ASAMPSA_E/ WP21/ D50.15/ 2017-33 vol1 130 / 142
ASAMPSA_E
Herak, D., Herak, M. & Tomljenović, B., 2008. Seismicity and earthquake focal mechanisms in North-Western Croa-
tia. Tectonophysics, 465: 212-220.
Herak, M., Herak, D., & Markusic, S., 1996. Revision of the earthquake catalogue and seismicity of Croatia, 1908-
1992. Terra Nova, 8, 86-94.
Hinsch, R. & Decker, K., 2003. Do seismic slip deficits indicate an underestimated earthquake potential along the
Vienna Basin Transform Fault System? Terra Nova 15 (5), 343-349.
Hinsch, R. & Decker, K., 2010. Seismic slip rates, potential subsurface rupture areas and seismic potential of the
Vienna Basin Transfer Fault. Int. J. Earth Sci., 100: 1925-1935. DOI 10.1007/s00531-010-0613-3
Hintersberger, E. & Decker, K., 2016. How to assess magnitudes of paleo-earthquakes from multiple observations.
Geophysical Research Abstracts Vol. 18, EGU2016-14588
Hintersberger, E., Scherbaum, F. & Hainzl, S., 2007. Update of likelihood-based groundmotion model selection for
seismic hazard analysis in western central Europe. Bulletin of Earthquake Engineering, 5: 1-16.
Holschneider, M., Zöller, G. & Hainzel, S., 2011. Estimation of the maximum possible magnitude in the framework
of a doubly truncated Gutenberg-Richter model. BSSA, 101: 1649-1659.
Hürtgen, J., Spiess, T., Schlittenhardt, J. & Reicherter, K., 2014. Development of a paleoseismic database for
Germany and surrounding areas. Schriftenreihe der Deutschen Gesellschaft für Geowissenschaften, 85: 444.
IAEA, 2001. Seismic evaluation of existing nuclear facilities, Proceedings on the SMiRT-14 post Conference Seminar
No.16 organized by the International Atomic Energy Agency and held in Vienna, 25-27 August 1997. IAEA TECDOC-
1202, 446pp.
IAEA, 2003a. Extreme external events in the design and assessment of nuclear power plants. IAEA Tecdoc 1341,
114 pp.
IAEA, 2003b. Site Evaluation for Nuclear Installations. Safety Requirements NS-R-3, 28 pp.
IAEA, 2004. Geotechnical Aspects of Site Evaluation and Foundations for Nuclear Power Plants. Safety Guide NS-G-
3.6, 53 pp.
IAEA, 2007a. Seismic Safety Expert Mission “Prelimniary findings and lessons learned from the 16 July 2007 earth-
quake at Kashiwazaki-Kariwa NPP”, Mission Report Vol. I, Kashiwazaki-Kariwa NPP and Tokyo, Japan, 6 – 10 August
2007.
IAEA, 2007b. Seismic Safety Expert Mission “Prelimniary findings and lessons learned from the 16 July 2007 earth-
quake at Kashiwazaki-Kariwa NPP”, Mission Report Vol. II, 6-10 August 2007.
Page 131
Guidance document on practices
to model and implement EARTHQUAKE hazards in extended PSA (final version) - Volume 1
Report IRSN/PSN-RES/SAG/ 2017-00004 Technical report ASAMPSA_E/ WP21/ D50.15/ 2017-33 vol1 131 / 142
ASAMPSA_E
IAEA, 2008. Mission Report Seismic Safety Expert Mission 2nd Follow-Up IAEA Mission in relation to the findings and
lessons learned from the 16 July 2007 earthquake at Kashiwazaki-Kariwa NPP, Tokyo and Kashiwazaki-Kariwa NPP,
Japan, 1-5 December 2008.
IAEA, 2010. Seismic Hazards in Site Evaluation for Nuclear Installations. Specific Safety Guide SSG-9, 60 pp.
IAEA, 2011. IAEA International Fact Finding Expert Mission of the Fukushima Dai-Ichi NPP accident following the
Great East Japan Earthquake and tsunami, Report to the IAEA Member States, Tokyo, Fukushima Dai-ichi NPP,
Fukushima Dai-ni NPP and Tokai Dai-ni NPP, Japan, 24 May – 2 June 2011.
IAEA, 2012b. IAEA Mission to Onagawa Nuclear Power Station to examine the performance of systems, structures
and components following the Great East Japan Earthquake and tsunami, Onagawa and Tokyo, Japan, 30 July - 11
August 2012.
IAEA, 2015a. Considerations for Supplementary Safety Analysis on Nuclear Power Plants in the light of the Fuku-
shima Daiichi NPP Accident. Technical Document, Rev. 0 of 14 November 2015.
IAEA, 2015b. Ground Motion Simulation Based on Fault Rupture Modelling for Seismic Hazard Assessment in Site
Evaluation for Nuclear Installations, Safety Reports Series No. 85, Vienna, 2015.
IAEA, 2015c. The Contribution of Palaeoseismology to Seismic Hazard Assessment in Site Evaluation for Nuclear
Installations. IAEA TECDOC No. 1767, Vienna, 212 pp.
Jamšek Rupnik, P., Atanackov, J., Jez, J., et al., 2015. Database of active faults in Slovenia. Advances in Active
Tectonics and Speleotectonics (AATS) 2015, Book of Abstracts: 14.
JANSI, 2013. Assessment methods for nuclear power plant against fault displacement. On-site Fault Assessment
Method Review Committee, Japan Nuclear Safety Institute, JANSI-FDE-03 rev.1, 53pp.
Japanese Geotechnical Society, 1993. Manual for zonation on seismic geotechnical hazards (revised version). Japa-
nese Geotechnical Society, Tokyo.
Junnan, X., Ming, S., Shan, L. & Chao, P., 2015. The Debris Flow Hazard Assessment of Wenchuan Earthquake-
stricken Area Based on Watershed Unit. EJGE, 20 (Bund 14): 6025-6034.
Kagan, Y. Y., and D. D. Jackson (2013), Tohoku Earthquake: A Surprise?, Bull. Seismol. Soc. Am., 103: 1181-1194.
Kalkan, E. & Güulkan, P.,2004. Empirical Attenuation Equations for Vertical Ground Motion in Turkey. Earthquake
Spectra 20, 853-882.
Keefer, D.K. (1984) Landslides caused by earthquakes. Bull. Seismol. Soc. Am., 95: 406-421.
Page 132
Guidance document on practices
to model and implement EARTHQUAKE hazards in extended PSA (final version) - Volume 1
Report IRSN/PSN-RES/SAG/ 2017-00004 Technical report ASAMPSA_E/ WP21/ D50.15/ 2017-33 vol1 132 / 142
ASAMPSA_E
Keller E.A., Pinter N. 2002. Active Tectonics – Earthquake Uplift and landscape 2 ed. Prentice Hall, New Jersey,
362pp.
Khavari, R., Arian, M., Ghorashi, M., 2009. Neotectonics of the South Central Alborz Drainage Basin, in NW Tehran,
N Iran. Journal of Applied Sciences 9 (23), 4115-4126.
Kijko, A. & Ahjos, T., 1985. Seismic hazard in Finland: evaluation of Mmax. Geophysica 21/1: 39-50.
Kijko, A. & Dessokey, M., 1987. Application of extreme magnitude distributions to incomplete earthquake files.
BSSA, 77: 1429-1436.
Kijko, A. & Graham, G., 1998. Parametric-historic procedure for probabilistic seismic hazard analysis, Part I: Esti-
mation of maximum regional magnitude Mmax. Pageoph 152: 413-442.
Kijko, A., 2004. Estimation of the maximum earthquake magnitude, Mmax, Pure and Applied 226 Geophysics,
161(8), 1655-1681.
King, G. & Nabelek, J., 1985. Role of fault bends in the initiation and termination of earthquake ruptures. Science
24: 984-987.
Klügel, J.-U., 2008. Seismic hazard analysis - Quo vadis? Earth-Science Reviews, 88: 1-32.
Kondorskaya N.V. and. Ulomov V.I., 1999. Special earthquake catalogue of the Northern Eurasia (SECNE), Academy
of Sciences, Moscow, Russia.
Kouskouna V. & G. Sakkas, 2013. The University of Athens Hellenic Macroseismic Database (HMDB.UoA): historical
earthquakes. Journal of Seismology, October 2013, Volume 17, Issue 4, pp 1253-1280, DOI 10.1007/s10950-013-
9390-3.
Kuivamäki, A., Vuorela, P. & Paananen, M., 1998. Indications of postglacial and recent bedrock movements in
Finland and Russian Karelia. Geological Survey of Finland, Nuclear Waste Disposal Research, Report YST-99, 105
pp. (Espoo)
Kuramoto, T., Yamaguchi, A., Narumiya, Y., Ota, T., Mamizuka, Y., 2014. Development of Implementation Stand-
ard Concerning the Risk Evaluation Methodology Selection for the External Hazards, PSAM 12 - Probabilistic Safety
Assessment and Management, 22-27 June 2014, Sheraton Waikiki, Honolulu, Hawaii, USA, 12 pp.
Kuribayashi, E. & Tatsuoka, F., 1975. Brief review of soil liquefaction during earthquakes in Japan, Soils and Foun-
dations, 15, 81-92.
Kysel, R., Cipciar, A., Moczo, P., Kristek, J., Kristeková, M., Csicsay, K., 2016. Slovak Historical Earthquakes and
Macroseismic Earthquake Catalogue: past studies and future investigations. Abstract, 4th International Colloquium
on Historical Earthquakes and Macroseismology, 2.-3. May 2016, Vienna, Austria.
Page 133
Guidance document on practices
to model and implement EARTHQUAKE hazards in extended PSA (final version) - Volume 1
Report IRSN/PSN-RES/SAG/ 2017-00004 Technical report ASAMPSA_E/ WP21/ D50.15/ 2017-33 vol1 133 / 142
ASAMPSA_E
Labak P. and Broucek I., 1995. Catalogue of macroseismically observed earthquakes on the territory of Slovakia
starting from the year 1034. Geophysical Institute of the Slovak Academy of Sciences, Bratislava.
LDG, 2011. Data file of French earthquakes from 1962 and on. Laboratoire de Détection et de Géophysique, Bru-
yères-le-Châtel, France.
Lenhardt, W., 1996. Erdbebenkennwerte zur Berechnung der Talsperren Österreichs. Wien (Zentralanstalt für
Meteorologie und Geodynamik), 84 pp.
Leonard, M., 2010. Earthquake Fault Scaling: Self-Consistent Relating of Rupture Length, Width, Average Dis-
placement, and Moment Release. Bull. Seismol. Soc. Am., 100/5A: 1971-1988.
Leydecker, G., 2011. Erdbebenkatalog für Deutschland mit Randgebieten für die Jahre 800 bis 2008. (Earthquake
catalogue for Germany and adjacent areas for the years 800 to 2008). Geologisches Jahrbuch, E 59, 1-198; 12
Abb., 5 Tab., 9 Anh., 1 CD; BGR Hannover.
Liu, Y. & Xie, J.F., 1984. Seismic liquefaction of sand, Earthquake Press, China.
LNEC, 1986. A Sismicidade Histórica e a Revisão do Catálogo Sísmico. Laboratorio Nacional de Engenharia Civil,
Lisboa, 189 pp.
Mallard, D.J., 1991. Learning to cope with faults. In: B. Mohammadioun (ed.), Proceedings of the International
Conference “Seismic Hazard Determinations in Areas with Moderate Seismicity”, Quest Editions, Presses Academ-
iques.
Mäntyniemi et al., 2007. State of the art historical earthquake research in Fennoscandia and the Baltic republics.
Annals of Geophysics, 47: 611-619.
Martinez Solares J.M. and J. Mezcua Rodriguez (eds), 2002. Catalogo sismico de la Peninsula Iberica (880 a.C.-
1990). IGN, Madrid, Monografía Núm. 18, 254 pp.
McCalpin, J., 2009. Paleoseismology, 2nd Edition, 848 pp. (Elsevier)
McGuire, R.K., 1977. Effects of uncertainty in seismicity on estimates of seismic hazard for the east coast of the
United States. Bull. Seism. Soc. Amer., 67: 827-848.
McGuire, R.K., 1978. FRISK: Computer program for seismic risk analysis using faults earthquake sources. USGS
Open File Report, 78-1007.
McGuire, R.K., 1995. Probabilistic seismic hazard analysis and design earthquakes: Closing the loop. Seism. Soc.
Amer., 67: 1275-1284.
Page 134
Guidance document on practices
to model and implement EARTHQUAKE hazards in extended PSA (final version) - Volume 1
Report IRSN/PSN-RES/SAG/ 2017-00004 Technical report ASAMPSA_E/ WP21/ D50.15/ 2017-33 vol1 134 / 142
ASAMPSA_E
McGuire, R.K., 2001. Deterministic vs. probabilistic earthquake hazards and risks. Soil Dynamics and Earthquake
Engineering, 21: 377-384.
McGuire, R.K., 2009. Issues in probabilistic seismic hazard analysis for nuclear facilities in the US. Nuclear Engi-
neering and Technology, 41: 1235-1243.Merino, M. & Stein, S., 2013. Have we seen the largest earthquake in East-
ern North America? Unpublished Manuscript,
http://www.earth.northwestern.edu/people/seth/Texts/ecmmax.pdf.
Mezcua J., Rueda J., García Blanco R.M., 2004. Reevaluation of Historic Earthquakes in Spain. SRL, 75: 75-81.
Mezcua, J., Rueda, J. & Barcá Blanco, R.M., 2011. A new probabilistic seismic hazard study of Span. Natural Haz-
ards, 59: 1087-1108.
Michetti et al., 2007. Intensity Scale ESI 2007, in Mem. Descr. Carta Geologica d’Italia L. Guerrieri and E. Vittori
(Editors), Servizio Geologico d’Italia, Dipartimento Difesa del Suolo, APAT, Rome, Italy, 74.
Michetti, A.M., Serva, L., Vittori, E., ITHACA (Italy Hazard from Capable Faulting), 2000. A Database of Active
Capable Faults of the Italian Onshore Territory, Internal Report of Agenzia Nazionale Protezione Ambiente, Rome,
CD-ROM.
Mohammadioun B., Serva L., 2001. Stress Drop, Slip Type, Earthquake Magnitude, and Seismic Hazard, Bull. Seis-
mol. Soc. Am., 91/4: 694-707.
Moss, R. E. S., & Ross, Z. E., 2011. Probabilistic Fault Displacement Hazard Analysis for Reverse Faults. Bull. Seis-
mol. Soc. Am., 101(4): 1542–1553.
Musson R.M.W., 1994. Earthquake Catalogue of Great Britain and surroundings. British Geological Survey, Technical
report WL/94/04, Edinburgh, 99 pp.
Musson, R., 2003. A guide to seismic hazard. The statistical method. British Geological Survey,
http://www.earthquakes.bgs.ac.uk/hazard/haz_guide/stats.html
Musson, R., 2008. The seismicity of the Britisch Isles to 1600. British Geological Survey, Earth Hazards and Systems,
Internal Report OR/08/049, 90 pp.
Musson R.M.W. & Sargeant S.L., 2007. BGS UK Earthquake Database. Eurocode 8 seismic hazard zoning maps for
the UK. British Geological Survey Technical Report, CR/07/125.
NAGRA, 2004. Probabilistic Seismic Hazard Analysis for Swiss Nuclear Power Plant Sites (PEGASOS Project). Final
Report, Volume 1, Text, Wettingen, 31 July 2004.
http://www.swissnuclear.ch/upload/cms/user/PEGASOSProjectReportVolume1-new.pdf.
Page 135
Guidance document on practices
to model and implement EARTHQUAKE hazards in extended PSA (final version) - Volume 1
Report IRSN/PSN-RES/SAG/ 2017-00004 Technical report ASAMPSA_E/ WP21/ D50.15/ 2017-33 vol1 135 / 142
ASAMPSA_E
Nemsa, E.S., Cabral, J. Et al., 2012. Compilation of active fault data in Portugal for use in seismic hazard analysis.
Sismicita 2010 - 8° Congresso de Sismologiea e Engenheria Sísmica, 6pp.
http://dspace.uevora.pt/rdpc/bitstream/10174/6348/1/SISMICA_2_2010.pdf.
NIER Ingegneria, 2013. Hazards and threats ontology. Unpublished Report, Project reference number:
HOME/2011/CIPS/AG/4000002102, 6 pp.
Nitoi, M., Ivanov, I., Pihl, J., Guigueno, Y. & Decker, K., 2015. D10.3 Report on external hazards with high ampli-
tude that have affected NPP in operation (in Europe or in other countries). Technical report ASAMPSA_E / WP10 /
D10.3 / 2016-13 - Reference IRSN PSN/RES/SAG/ 2016-00031
NSK [Nordic Nuclear Safety Research], 2016. Modelling as a tool to augment ground motion data in regions of dif-
fuse seismicity - Progress 2015. NKS-363, ISBN 978-87-7893-448-2".
Olivera C., Redondo E., Lambert J., Riera Melis A. and Roca A., 2006. Els terratrèmols dels segles XIV i XV a Cata-
lunya, Barcelona, Institut Cartogràfic de Catalunya, 407 pp.
Oncescu M.C., Marza V.I., Rizescu M. and Popa M., 1999. The Romanian earthquake catalogue between 984-1997.
In: F. Wenzel and D. Lungu (eds), Contributions from the First International Workshop on Vrancea Earthquakes,
Bucharest, Romania, November 1-4, 1997, 43-48.
Pačėsa, A., Šliaupa, S., 2011 Seismic activity and earthquake catalogue of the East Baltic region. Geologija, 53:
134-146.
Pagaczewski, J., 1972. Catalogue of earthquakes in Poland in 1000-1970 years. Publs. Inst. Geophys. Pol. Acad.
Sci. 51: 3-36.
Pedrera, A., Pérez-Peña, J.V., Galindo-Zaldívar, J., Azañón, J.M., Azor, A., 2009. Testing the sensitivity of geo-
morphic indices in areas of low-rate active folding (eastern Betic Cordillera, Spain). Geomorphology 105, 218-231.
Pérez-Peña, J.V., Azor, A., Azañón, J.M., Keller, E.A., 2010. Active tectonics in the Sierra Nevada (Betic Cordille-
ra, SE Spain): Insights from geomorphic indexes and drainage pattern analysis. Geomorphology 119, 74-87.
Peruzza, L. & Slejko, D., 1993. Some aspects of seismic hazard assessment when comparing different approaches.
Natural Hazards, 7: 133-153.
Peters, G., van Balen, R.T., 2007. Tectonic geomorphology of the northern Upper Rhine Graben, Germany. Global
and Planetary Change 58, 310–334.
Petersen, M.D., et al. 2011, Fault displacement hazard for strike-slip faults, Bull. Seism. Soc. Am., 101: 805-825.
Page 136
Guidance document on practices
to model and implement EARTHQUAKE hazards in extended PSA (final version) - Volume 1
Report IRSN/PSN-RES/SAG/ 2017-00004 Technical report ASAMPSA_E/ WP21/ D50.15/ 2017-33 vol1 136 / 142
ASAMPSA_E
Petersen, M.D. & Chen, R., 2015. Empirical fault displacement hazard methods applied in the United States. Con-
ference Paper, Best Practices in Physics-based Fault Rupture Models for Seismic Hazard Assessment of Nuclear
Installations, IAEA, November 18-20, 2015, Vienna, 16pp. 11 pp.
Pinter, N., 2005. Applications of tectonic geomorphology for deciphering active deformation in the Pannonian
Basin, Hungary. Occasional Papers of the Geological Institute of Hungary 204, 45-51.
Poljak, M., Živčić, M., Zupančič, P. 2002. The Seismotectonic Characteristics of Slovenia. Pure and applied Geo-
physics. Vol 157 P 37-55.
Popotnig, A., Tschegg, D. & Decker, K., 2013. Morphometric analysis of a reactivated Variscan fault in southern
Bohemian Massif (Budějovice basin, Czech Republic). Geomorphology, 197, 108-122.
Rachna, R., 2012. Active tectonics of NE Gujarat (India) by morphometric and morphostructural studies of Vatrak
River basin. Journal of Asian Earth Sciences 50, 66-78.
Radu, C., Polonic, G. & Apopei, I., 1979. Macroseismic field of the March 4, 1977 Vrancea earthquake. Rev. Roum.
Géol., Géophys. Et Géogr., Géophysique 23: 19-26.
Rahni, N., Raimond, E., Jan, P., Lopez, J., Löffler, H., Mildenberger, O., Kubicek, J., Vitazkova, J., Ivanov, I. &
Groudev, P., Lajtha, G., Serrano, C., Zhabin, O., Prosek, A., Dirksen, G., Yu, S. & Oury L. 2016. Guidance on the
verification and improvement of SAM strategies with L2 PSA. Technical report ASAMPSA_E / WP40 / D40.5 / 2017-
39 volume 3, Reference IRSN-PSN-RES-SAG/ 2017-00001..
Ramírez-Herrera, M.T., 1998. Geomorphic assessment of active tectonics in the Acambay graben, Mexican volcanic
belt. Earth Surface Processes and Landforms 23, 317–332.
Ramos, M.M. & Zerger; B., 2012. European Clearinghouse: External Hazards related events at NPPs. Topical Opera-
tional Experience Report. European Communities, 2012.
Reiter, L., 1990. Earthquake Hazard Analysis, Issues and Insights, Columbia University Press, New York.
Ribaric, V., 1988. The space and time pattern of local seismicity in Slovenia. Seismological institute of SR Slovenia,
Ljubljana, Yugoslavia. Geofizika. Vol 5.
Ritter, J., Frietsch, M., Gaßner, L., Groos, J., Grund, M. & Zeiß, J., 2014. Fluid injection, fault reactivation and
shaking in an urban environment – a seismological view. Schriftenreihe der deutschen Gesellschaft für Geowissen-
schaften 85: 540.
Robb, E., et al. 2011. Probabilistic fault displacement hazard analysis for reverse faults, Bull. Seism. Soc. Am.,
101: 1542-1552.
Page 137
Guidance document on practices
to model and implement EARTHQUAKE hazards in extended PSA (final version) - Volume 1
Report IRSN/PSN-RES/SAG/ 2017-00004 Technical report ASAMPSA_E/ WP21/ D50.15/ 2017-33 vol1 137 / 142
ASAMPSA_E
Rodriguez, C.E., 2006. Assessment of earthquake-induced landslide hazard on natural slopes.
cvfeller.cv.ic.ac.uk/carlos.html
Sabetta, F. & Pugliese, A. 1996. Estimation of ground-motion and simulation of nonstationary earthquake ground-
motions. Bull. Seismol. Soc. Am., 86: 337–352.
Sadigh, K., Chang, C.-Y., Abrahamson, N. A., Chiou, S. J., & Power, M. S., 1993. Specification of long-period
ground motions: Updated attenuation relationships for rock site conditions and adjustment factors for near-fault
effects. Pages 59–70 of: Proceedings of ATC-17-1 Seminar on Seismic Isolation, Passive Energy Dissipation, and
Active Control.
Sadigh, K., Chang, C.-Y., Egan, J. A., Makdisi, F., & Youngs, R. R., 1997. Attenuation relationships for shallow
crustal earthquakes based on California strong motion data. Seismological Research Letters, 68(1: 180–189.
Scherbaum, F., Delafaud, E. & Riggelsen, C., 2009. Model selection in seismic hazard analysis: an information-
theoretic approach. BSSA 99: 3234-3247.
Schumm, S.A., Dumont, J.F. & Holbrook, J.M., 2000. Active tectonics and alluvial rivers, 276 pp. (Cambridge Uni-
versity Press).
SHARE, 2012. The European database of seismogenic faults. http://diss.rm.ingv.it/share-edsf/
Shebalin, N. V., Leydecker, G., Mokrushina, N. G., Tatevossian, R. E., Erteleva, O. O. & Vassiliev, V.Y., 1998.
Earthquake Catalogue for Central and Southeastern Europe 342 BC - 1990 AD. -- European Commission, Report No.
ETNU CT 93 - 0087, Brussels.
Shtober-Zisu, N., Greenbaum, N., Inbar, M., Flexer, A., 2008. Morphometric and geomorphic approaches for as-
sessment of tectonic activity, Dead Sea Rift (Israel). Geomorphology 102, 93-104.
Silva, V., Crowley, H., Pagani, M., Monelli, D. & Pinho, R., 2013. Development of the OpenQuake engine, the
Global Earthquake Model’s open-source software for seismic risk assessment, Natural Hazards, March 2013, DOI
10.1007/s11069-013-0618-x.
Smmith, D. E., Shi, S., Cullingford, R., Dawson, A., Dawson, S., Firth C., Foster I., Fretwell, P., Haggart, B., Hol-
loway L. & Long, D., 2004. The Holocene Storegga Slide Tsunami in the United Kingdom. Quaternary Science Re-
views 23: 2291–2311.
SNSA (Slovenian Nuclear Safety Administration), 2013. URSJV se je seznanila z mnenjem francoskega inštituta IRSN
o potresni varnosti lokacije Krško, 15.3.2013.
http://www.ursjv.gov.si/si/info/novica/article/4597/5735/b59f6ae1b52b804f4376d3e3298a1bfe/
SNSA, 2014. Update of the Slovenian Post-Fukushima Action Plan. http://www.ensreg.eu/node/3773
Page 138
Guidance document on practices
to model and implement EARTHQUAKE hazards in extended PSA (final version) - Volume 1
Report IRSN/PSN-RES/SAG/ 2017-00004 Technical report ASAMPSA_E/ WP21/ D50.15/ 2017-33 vol1 138 / 142
ASAMPSA_E
Solares, J.M.M. & Rodríguez, J.M., 2002. Catálogo sísmico de la Península Ibérica (880 a.C. – 1900). Madrid, (Minis-
terio de Fomento, Dirección General del Instituto Geográfico Nacional), 256 pp.
Spacek et al., 2011. Quaternary activity of the Luboká Fault. Abridged translation of updated final report for pro-
ject "Paleoseismology of the fault structures near NPP Temelin, Brno.
SSHAC [Senior Seismic Hazard Analysis Committee, R.J. Budnitz, Chairman, G. Apostolakis, D.M. Boore, L.S. Cluff,
K.J. Coppersmith, C.A. Cornell, and P.A. Morris], 1997. Recommendations for probabilistic seismic hazard analy-
sis—Guidance on uncertainty and use of experts: Washington, D.C., U.S. Nuclear Regulatory Commission Report,
NUREG/CR-6372.
Stein, S., Geller, R.J. & Liu, M., 2012. Why earthquake hazard maps often fail and what to do about it. Tectono-
physics, 562-563, 1-25.
Stein, S., Merino, M., Adams, J., Vanneste, K., Vlemincks, B. &V Camelbeeck, T., 2015. Have we seen the largest
earthquakes in Eastern North America? GSA Annual Meeting in Baltimore, Maryland, USA.
https://gsa.confex.com/gsa/2015AM/webprogram/Paper261865.html
Stirling M.., Goded T., Berryman K. & Litchfield N., 2013. Selection of Earthquake Scaling Relationships for Seismic
Hazard Analysis. Bull. Seismol. Soc. Am., 103/6: 2993-3011.
Stirling M.W., Rhoades D. & Berryman K., 2002. Comparison of Earthquake Scaling Relations Derived from Data of
the Instrumental and Preinstrumental Era, Bull. Seismol. Soc. Am., 92/2: 812-830.
Stirling, M.W. & Goded, T., 2012. Magnitude scaling relationships. Report produced for the GEM Faulted Earth &
Regionalisation Global Components. http://www.nexus.globalquakemodel.org/gem-faulted-
earth/posts/magnitude-scaling-relationships-report
Stucchi, M., Rovida, A. et al., 2013. The SHARE European Earthquake Catalogue (SHEEC) 1000-1899. J. Seismology,
17: 523-544.
SÚJB (2011). National Report on “Stress Tests” NPP Dukovany and NPP Temelin Czech Republic. Evaluation of Safe-
ty and Safety Margins in the Light of the Accident of the NPP Fukushima. http://www.ensreg.eu/node/369
Suziki, Y. & Annaka, T., T., 2015. Probabilistic hazard analysis for secondary fault. Conference Paper, Best Prac-
tices in Physics-based Fault Rupture Models for Seismic Hazard Assessment of Nuclear Installations, IAEA, Novem-
ber 18-20, 2015, Vienna, 12pp.
Suzuki, Y., et al., 2015. Fault Displacement Hazard of Nuclear Power Plant in Japan (in Japanese), (presentation
material), Proceedings of the Symposium on Fault Displacement Evaluation, The Nuclear Engineering Committee of
the JSCE, July 2015.
Page 139
Guidance document on practices
to model and implement EARTHQUAKE hazards in extended PSA (final version) - Volume 1
Report IRSN/PSN-RES/SAG/ 2017-00004 Technical report ASAMPSA_E/ WP21/ D50.15/ 2017-33 vol1 139 / 142
ASAMPSA_E
Swiss Seismological Service, 2002. ECOS-09 Earthquake Catalogue of Switzerland Release 2010.
Takao, M., Annaka, T. & Kurita, T., 2015. Establishment of evaluation formulae for Probabilistic Fault Displace-
ment Hazard Analysis (PFDHA) in Japan. Conference Paper, Best Practices in Physics-based Fault Rupture Models
for Seismic Hazard Assessment of Nuclear Installations, IAEA, November 18-20, 2015, Vienna, 16pp.
Takao, M., et al. 2013. Application of probabilistic fault displacement hazard analysis in Japan, Journal of Japan
Association for Earthquake Engineering (in Japanese), Volume 13, No. 1, 17-36.
Takao, M., et al., 2014. Reliability improvement of probabilistic fault displacement hazard analysis, Journal of
Japan Association for Earthquake Engineering (in Japanese), Volume 14, No. 2.
Talling, P.J., Stewart, M.D., Stark, C.P., Gupta, S., Vincent, S.J., 1997. Regular spacing of drainage outlets from
linear fault blocks. Basin Research 9, 275–302.
Tamura, T., 1978. An analysis of the relationship between the areal distribution of distribution of earthquake-
induced landslides and the earthquake magnitude, Geophysical Review of Japan, 51/8, 662-672.
Tappin, D., Grilli, S., Harris, J. et al., 2014. Did a submarine landslide contribute to the 2011 Tohoku tsunami?
Marine Geology, 357: 344-361.
Tavakoli, B. & Pezeshk, S., 2005. Empirical-Stochastic Ground-Motion Prediction for Eastern North America. Bull.
Seism. Soc. Am. 95: 2283-2296.
TEPCO (Tokyo Electric Power Company), 2012. Fukushima Nuclear Accident Analysis Report, Fukushima Nuclear
Accidents Investigation Report, June 20, 2012 (Report and Attachment).
Toro, G. R., & Silva, W. J., 2001. Scenario earthquakes for Saint Louis, MO, and Memphis, TN, and seismic hazard
maps for the central United States region including the effect of site conditions. Tech. rept. Research supported
by the U.S. Geological Survey (USGS), under award number 1434-HQ-97-GR-02981.
Tóth, L., Monus, P., Györi, E., Grenerczy, G., Katona, T. & Kiszely, M., 2015. Towards the Seismic Hazard Reas-
sessment of Paks NPP (Hungary) Site: Seismicity and Sensitivity Studies. Geophysical Research Abstracts, 17:
EGU2015-2939.
Troiani, F., Della Seta, M., 2008. The use of the Stream Length-Gradient index in morphotectonic analysis of small
catchments: A case study from Central Italy. Geomorphology 102, 159-168.
Tsodoulos, I.M., Koukouvelas, I.K., Pavlides, S., 2008. Tectonic Geomorphology of the easternmost extension of
the Gulf of Corinth (Beotia, Central Greece). Tectonophysics 453, 211-232.
Tsutsumi, H. & Okada, A., 1996. Segmentation and Holocene surface faulting on the Median Tectonic Line, south-
west Japan, J. Geophys. Res., 101: 5855 - 5871.
Page 140
Guidance document on practices
to model and implement EARTHQUAKE hazards in extended PSA (final version) - Volume 1
Report IRSN/PSN-RES/SAG/ 2017-00004 Technical report ASAMPSA_E/ WP21/ D50.15/ 2017-33 vol1 140 / 142
ASAMPSA_E
US Department of Energy, 2015. EGS: The Geysers: What is the history of seismicity at The Geysers?
http://esd1.lbl.gov/research/projects/induced_seismicity/egs/geysers_history.html
USGS, 2015. U.S. Geological Survey (and supporting agency if appropriate-see list below), 2006, Quaternary fault
and fold database for the United States, accessed 2015-10-12, from USGS web site:
http://earthquakes.usgs.gov/regional/qfaults/
USNRC, 1997. Recommendations for Probabilistic Seismic Hazard Analysis: Guidance on Uncertainty and Use of
Experts. NUREG/CR-6372, UCRL-ID-122160, Vol. 1, 280pp.
USNRC, 2010. Resolution of Generic Safety Issues: Issue 194: Implications of Updated Probabilistic Seismic Hazard
Estimates (NUREG-0933, Main Report with Supplements 1–34)
http://nureg.nrc.gov/sr0933/Section%203.%20New%20Generic%20Issues/194r1.html
USNRC, 2012a. Central and Eastern United States Seismic Source Characterization for Nuclear Facilities (NUREG-
2115, Volumes 1 to 6).
USNRC, 2012b. Practical Implementation Guidelines for SSHAC Level 3 and 4 Hazard Studies. NUREG 2117, 227 pp.
USNRC, 2012c. Confirmatory Analysis of Seismic Hazard at the Diablo Canyon Power Plant from the Shoreline Fault
Zone, U.S. Nuclear Regulatory Commission, Research Information Letter 12-01: September 2012, 177 pp.
Vakov, A.V., 1996. Relationships between earthquake magnitude, source geometry and slip mechanism. Tectono-
physics, 261: 97-113.
Van Gils,J.M. & Leydecker, G. (eds.) (1991): Catalogue of European earthquakes with intensities higher than 4. --
Commission of the European Communities - Nuclear Science and Technology. 353 pp., 14 fig., 1 tab.- ISBN 92-826-
2506-0, Catalogue Number: CD-NA-13406-EN-C. Brussels - Luxembourg.
Vanneste, K., Camelbeek, T. & Verbeeck, K., 2013. A model of composite seismic sources for the Lower Rhine
Graben, Northwest Europe. Bull. Seismol. Society of America, 103: 984-1007.
Vanneste, K., Vleminckx, B., Stein, S. & Camelbeek, T., 2013. Could Mmax be the same for all stable continental
regions? Seismological Research Letters 87/5: 1-10.
Vannucci, G. & Gasperini, P., 2003. A database of revised fault plane solutions for Italy and surrounding regions,
Computers & Geosciences, 29: 903-909.
Vannucci, G. & Gasperini, P., 2004. The new release of the database of Earthquake Mechanisms of the Mediterra-
nean Area (EMMA version 2), Annals of Geophysics, Supplement to Vol 47: 303-327.
Verrios, S., Zygouri, V., Kokkalas, S., 2004. Morphotectonic Analysis in the Eliki Fault Zone (Gulf of Corinth,
Greece). Bulletin of the Geological Society of Greece 36, 1706-1715.
Page 141
Guidance document on practices
to model and implement EARTHQUAKE hazards in extended PSA (final version) - Volume 1
Report IRSN/PSN-RES/SAG/ 2017-00004 Technical report ASAMPSA_E/ WP21/ D50.15/ 2017-33 vol1 141 / 142
ASAMPSA_E
Wahlström, R., 1990. A catalogue of earthquakes in Sweden in 1375–1890. Volume 112, P. 215-225.
Wakamatsu, K., 1991. Maps for historic liquefaction sites in Japan, Tokio University press, 341 pp.
Wakamatsu, K., 1993. History of soil liquefaction in Japan and assessment of liquefaction potential based on geo-
morphology, PhD Thesis, Waseda University, Tokyo, 245 pp.
Walcott R.C., Summerfield M.A. 2008. Scale dependence of hypsometric integrals: An analysis of southeast African
basins. Geomorphology 96 (2008) 174-186.
Ward, S.N. & Day, S., 2001. Cumbre Vieja Volcano — Potential collapse and tsunami at La Palma, Canary Islands.
Geophysical Research Letters 28 (17): 3397–3400.
Weatherill, G., Garcia, J., Poggi, V., Chen, Y.-S. & Pagani, M., 2016. Modelling Active Faults in Probabilistic Seis-
mic Hazard Analysis (PSHA) with OpenQuake: Definition, Design and Experience. Geophysical Research Abstracts,
18, EGU2016-16361.
Weninger, B., Schulting, R., Vradtmöller, M. et al., 2008. The catastrophic final flooding of Doggerland by the
Storegga Slide tsunami. Documenta Praehistorica XXXV: 1-24.
WENRA, 2013. Postion paper on Periodic Safety Reviews (PSRs) taking into account the lessons learnt from the
TEPCO Fukushima Dai-ichi NPP accident.
http://www.wenra.org/media/filer_public/2013/04/05/rhwg_position_psr_2013-03_final_2.pdf
WENRA, 2014a. Report WENRA Safety Reference Levels for Existing Reactors. 24th September 2014. 52pp.
http://www.wenra.org/publications/
WENRA, 2014b. Guidance Document Issue F: Design Extension of Existing Reactors. 27pp.
http://www.wenra.org/publications/
WENRA, 2015. Guidance Head Document Issue T: Natural Hazards Head Document. 18. February 2015. 26pp.
http://www.wenra.org/publications/
WENRA, 2016. Guidance Document Issue T: Natural Hazards - Guidance on Seismic Events. 26pp.
http://www.wenra.org/publications/
Wesnousky, S.G., 2006. Predicting the endpoints of earthquake ruptures, Nature, 444: 358-360.
Wesnousky, S., 2008. Displacement and geometrical characteristics of earthquake surface ruptures: Issues and
implications for seismic hazard analysis and the earthquake rupture process, Bull. Seismol. Soc. Am., 98/4: 1609-
1632.
Page 142
Guidance document on practices
to model and implement EARTHQUAKE hazards in extended PSA (final version) - Volume 1
Report IRSN/PSN-RES/SAG/ 2017-00004 Technical report ASAMPSA_E/ WP21/ D50.15/ 2017-33 vol1 142 / 142
ASAMPSA_E
Wielenberg, A. & al., 2017. Methodology for Selecting Initiating Events and Hazards for Consideration in an Ex-
tended PSA. Technical report ASAMPSA_E / WP30 / D30.7/2017-31 volume 2 - Reference IRSN PSN-RES/SAG/2017-
00004.
Wyss, M. & Rosset, P., 2013. Mapping seismic risk: the current crisis. Natural Hazards, 68: 49-52.
Youd, T.L. & Perkins, J. B., 1978. Mapping of liquefaction induced ground failure potential, J. GED, ASCE, 104,
433-446.
Youngs, R.R., et al., 2003. A methodology for probabilistic fault displacement hazard analysis (PFDHA), Earthquake
Spectra, Vol.19, No.1, 191-219.
Zhang, P., Slemmons, D.B., & Mao, F., 1991. Geometric pattern, rupture termination, and fault segmentation of
the Dixie Valley-Pleasant Valley active normal fault system, Nevada, USA. J. Struct. Geol. 13: 165–176.
Zsiros, T., Mónus, P. & Tóth, L., 1988. Hungarian Earthquake Catalog (456-1986). Kövesligethy Radó Seismological
Observatory, Hungary