Organisation for Economic Co-operation and Development
ENV/JM/MONO(2018)12
Unclassified English - Or. English
6 July 2018
ENVIRONMENT DIRECTORATE
JOINT MEETING OF THE CHEMICALS COMMITTEE AND THE WORKING PARTY
ON CHEMICALS, PESTICIDES AND BIOTECHNOLOGY
GUIDANCE DOCUMENT ON THE DETERMINATION OF IN VITRO
INTRINSIC CLEARANCE USING CRYOPRESERVED HEPATOCYTES (RT-
HEP) OR LIVER S9 SUB-CELLULAR FRACTIONS (RT-S9) FROM RAINBOW
TROUT AND EXTRAPOLATION TO IN VIVO INTRINSIC CLEARANCE SERIES ON TESTING AND ASSESSMENT
No. 280
JT03434401
This document, as well as any data and map included herein, are without prejudice to the status of or sovereignty over any territory, to the
delimitation of international frontiers and boundaries and to the name of any territory, city or area.
This document, as well as any data and map included herein, are without prejudice to the status of or sovereignty over any territory, to the
delimitation of international frontiers and boundaries and to the name of any territory, city or area.
ENV/JM/MONO(2018)12 │ 3
Unclassified
OECD Environment, Health and Safety Publications
Series on Testing and Assessment
No. 280
GUIDANCE DOCUMENT ON THE DETERMINATION OF IN VITRO INTRINSIC CLEARANCE USING
CRYOPRESERVED HEPATOCYTES (RT-HEP) OR LIVER S9 SUB-CELLULAR FRACTIONS (RT-S9)
FROM RAINBOW TROUT AND EXTRAPOLATION TO IN VIVO INTRINSIC CLEARANCE
Environment Directorate
ORGANISATION FOR ECONOMIC CO-OPERATION AND DEVELOPMENT
Paris 2018
4 │ ENV/JM/MONO(2018)12
Unclassified
About the OECD
The Organisation for Economic Co-operation and Development (OECD) is an intergovernmental
organisation in which representatives of 35 industrialised countries in North and South America, Europe
and the Asia and Pacific region, as well as the European Commission, meet to co-ordinate and harmonise
policies, discuss issues of mutual concern, and work together to respond to international problems. Most
of the OECD’s work is carried out by more than 200 specialised committees and working groups
composed of member country delegates. Observers from several countries with special status at the
OECD, and from interested international organisations, attend many of the OECD’s workshops and other
meetings. Committees and working groups are served by the OECD Secretariat, located in Paris, France,
which is organised into directorates and divisions.
The Environment, Health and Safety Division publishes free-of-charge documents in twelve different
series: Testing and Assessment; Good Laboratory Practice and Compliance Monitoring; Pesticides;
Biocides; Risk Management; Harmonisation of Regulatory Oversight in Biotechnology; Safety of
Novel Foods and Feeds; Chemical Accidents; Pollutant Release and Transfer Registers; Emission
Scenario Documents; Safety of Manufactured Nanomaterials; and Adverse Outcome Pathways.
More information about the Environment, Health and Safety Programme and EHS publications is
available on the OECD’s World Wide Web site (www.oecd.org/chemicalsafety/).
This publication was developed in the IOMC context. The contents do not necessarily reflect the
views or stated policies of individual IOMC Participating Organizations.
The Inter-Organisation Programme for the Sound Management of Chemicals (IOMC) was established
in 1995 following recommendations made by the 1992 UN Conference on Environment and
Development to strengthen co-operation and increase international co-ordination in the field of
chemical safety. The Participating Organisations are FAO, ILO, UNDP, UNEP, UNIDO, UNITAR,
WHO, World Bank and OECD. The purpose of the IOMC is to promote co-ordination of the policies
and activities pursued by the Participating Organisations, jointly or separately, to achieve the sound
management of chemicals in relation to human health and the environment.
ENV/JM/MONO(2018)12 │ 5
Unclassified
This publication is available electronically, at no charge.
For this and many other Environment,
Health and Safety publications, consult the OECD’s
World Wide Web site (www.oecd.org/ehs)
or contact:
OECD Environment Directorate,
Environment, Health and Safety Division
2, rue André-Pascal
75775 Paris cedex 16
France
Fax : (33-1) 44 30 61 80
E-mail : [email protected]
© OECD 2018
Applications for permission to reproduce or translate all or part of this material should
be made to: Head of Publications Service, [email protected], OECD, 2 rue André-
Pascal, 75775 Paris Cedex 16, France
6 │ ENV/JM/MONO(2018)12
Unclassified
Foreword
This document contains the Guidance Document (GD) on aspects of the two OECD Test
Guidelines (TG) TG 319A and TG 319B.
The project to develop this Guidance Document was co-led by the European Commission
(EC-JRC) and the United States.
This GD was developed to provide additional information on how to best perform the two
TGs in terms of selection of in vitro system (i.e. RT-HEP or RT-S9), considerations for
the testing of specific chemicals, potential applications of the in vitro intrinsic clearance
determined with the two TGs (e.g. in vitro-in vivo (IVIVE) model to predict BCFs in
fish) as well as uncertainties and potential limitations of predicted BCFs.
The Guidance Document was approved by the Working Group of the National Co-
ordinators of the Test Guidelines Programme (WNT) at its 30th meeting in April 2018.
The Joint Meeting of the Chemicals Committee and the Working Party on Chemicals,
Pesticides and Biotechnology agreed to its declassification on 30 June 2018.
This document is published under the responsibility of the Joint Meeting of the Chemicals
Committee and the Working Party on Chemicals, Pesticides and Biotechnology.
ENV/JM/MONO(2018)12 │ 7
Unclassified
Table of contents
Foreword ................................................................................................................................................ 6
1. General Introduction and Scope ...................................................................................................... 9
2. Selection of the in vitro system ........................................................................................................ 10
2.1. Biological and technical considerations ...................................................................................... 10 2.2. Comparison of in vitro intrinsic clearance .................................................................................. 11
3. Considerations specific for the test chemicals ............................................................................... 13
3.1. Analytical method ....................................................................................................................... 13 3.2. Preparation of test chemical stock solutions ............................................................................... 13 3.3. Extraction solvents for stopping of the incubation and extraction of the test chemical .............. 14 3.4. Selection of test chemical concentrations ................................................................................... 15 3.5. Poorly water soluble test chemicals ............................................................................................ 15 3.6. Volatile test chemicals ................................................................................................................ 16 3.7. Adsorption of test chemicals ....................................................................................................... 16 3.8. Abiotic degradation of test chemicals ......................................................................................... 17 3.9. Ionizable test chemicals .............................................................................................................. 17 3.10. Testing of chiral chemicals and structural isomers ................................................................... 17 3.11. Mixtures, MCS and UVCBs as test chemicals ......................................................................... 18
4. Positive and negative control incubations ..................................................................................... 19
4.1. Negative control incubations ...................................................................................................... 19 4.1.1. Enzymatically inactive RT-HEP and RT-S9 ........................................................................ 19 4.1.2. Additional negative control incubations – RT-S9 ................................................................ 20
4.2. Positive control (reference chemical) incubations ...................................................................... 20
5. Use of in vitro intrinsic clearance to predict BCFs ....................................................................... 21
5.1. In vitro-in vivo extrapolation and mass balance model to predict BCFs: theoretical background
(model examples) ............................................................................................................................... 21 5.2. Use of the spreadsheets for BCF prediction: practical application ............................................. 23 5.3. Applications and interpretation of BCF predictions ................................................................... 25 5.4. Uncertainties and limitations of BCF predictions ....................................................................... 25
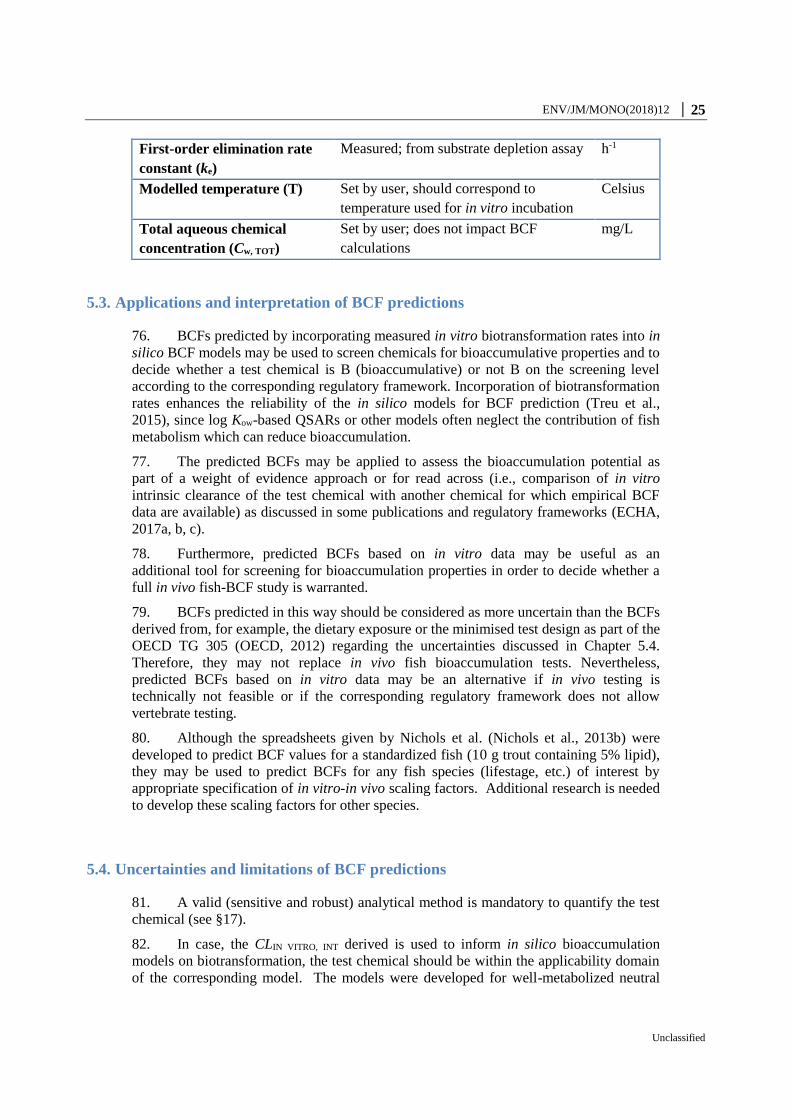
6. Other potential use of the in vitro RT-HEP and RT-S9 test systems .......................................... 28
6.1. Adaptation to other fish species and tissues................................................................................ 28 6.2. Identification of metabolites ....................................................................................................... 28
7. References ........................................................................................................................................ 29
ANNEX 1 - Abbreviations .................................................................................................................. 35
8 │ ENV/JM/MONO(2018)12
Unclassified
ANNEX 2 - Recommendations on how to proceed in case of substantial decreases of the test
chemical in enzymatically inactive (heat-inactivated) control incubations. ................................... 37
ANNEX 3 - Preparation of room temperature inactivated RT-S9 ................................................. 38
ANNEX 4 - Potential reference chemicals for incubations using RT-HEP or RT-S9 ................... 39
ANNEX 5 - Spreadsheets for calculation of BCFs for methoxychlor as example using the
hepatocyte-bioconcentration factor model (HEP-BCF) and the S9-bioconcentration factor (S9-
BCF) model .......................................................................................................................................... 42
ENV/JM/MONO(2018)12 │ 9
Unclassified
1. General Introduction and Scope
1. This Guidance Document (GD) accompanies OECD Test Guideline (TG) 319A
on Determination of in vitro intrinsic clearance using cryopreserved rainbow trout
hepatocytes (RT-HEP) (OECD, 2018a) and OECD TG 319B on Determination of in vitro
intrinsic clearance using rainbow trout liver S9 sub-cellular fractions (RT-S9) (OECD,
2018b).
2. The two TGs describe the use of cryopreserved hepatocytes (RT-HEP (OECD,
2018a) or liver S9 sub-cellular fractions (RT-S9 (OECD, 2018b) of rainbow trout
(Oncorhynchus mykiss) to determine the in vitro intrinsic clearance (CLIN VITRO, INT) of a
test chemical using a substrate depletion approach. The CLIN VITRO, INT can be incorporated
into in silico models to predict bioconcentration factors (BCFs) in fish which
substantially improves their performance as demonstrated over the last decade by several
authors (Cowan-Ellsberry et al., 2009; Fay et al., 2014b; Gomez et al., 2010; Han et al.,
2007; Han et al., 2009; Laue et al., 2014).
3. The GD provides information on how to best perform these methods and the
following points are addressed:
selection of the in vitro system, i.e., RT-HEP (OECD, 2018a) or RT-S9 (OECD,
2018b), including biological and technical considerations, and an overview of
published efforts to compare both methods (chapter 2).
specific considerations for the testing of chemicals regarding the analytical
method, chemical stock solutions, extraction solvents, test chemical
concentrations, poor water solubility, volatility, adsorption, abiotic degradation
and quantification of chiral chemicals or structural isomers. Furthermore, the
testing of ionizable chemicals, mixtures, multi-constituent substances and UVCBs
is briefly addressed (chapter 3).
use of negative control incubations (enzymatically inactive RT-HEP and RT-S9)
and positive control incubations using reference chemicals (chapter 4).
4. The GD further describes in chapter 5 how the in vitro intrinsic clearance (CLIN
VITRO, INT) determined with OECD TG RT-HEP (OECD, 2018a) or RT-S9 (OECD, 2018b)
can be incorporated into in silico models to predict BCFs in fish. It includes an example
in vitro-in vivo (IVIVE) model developed by Nichols et al. (Nichols et al., 2013b)
Furthermore, guidance is provided on how to apply these predicted BCFs and
uncertainties and potential limitations are addressed.
5. Chapter 6 discusses other potential applications of RT-S9 and RT-HEP, e.g.
adaptation to other fish species and metabolites identification.
10 │ ENV/JM/MONO(2018)12
Unclassified
2. Selection of the in vitro system
6. This chapter aims to provide some guidance for the user on which in vitro system,
i.e., OECD TG RT-HEP or TG RT-S9 (OECD, 2018a, b), should be chosen. There are
only limited numbers of studies published which directly compare in vitro intrinsic
clearance rates of the same set of chemicals in liver S9 sub-cellular fractions and
hepatocytes from the same fish species.
2.1. Biological and technical considerations
7. There are significant differences between the two in vitro systems which should
be considered before choosing one. Hepatocytes contain the whole set of metabolic
enzymes and cofactors at physiological levels (Li, 2007). Thus, hepatocyte-based assays
do not require addition of cofactors for biotransformation studies. However, rate-limiting
factors specifically associated with hepatocytes may include cofactor depletion and / or
restricted chemical diffusion across the cell membrane as discussed for human
hepatocytes (Godoy et al., 2013).
8. In contrast to liver S9 sub-cellular fractions, hepatocytes contain intact cell
membranes. Thus, uptake of the test chemical by passive diffusion or active transport is
required for biotransformation in hepatocytes (Li, 2007). If uptake is rate-limiting on
biotransformation, hepatocytes may be closer to the in vivo situation and a more
appropriate choice for the in vitro system.
9. Liver S9 sub-cellular fractions are cell-free systems containing cytosolic and
microsomal enzymes, but require the addition of cofactors. Cofactors for Phase I
(nicotinamide adenine dinucleotide phosphate; NADPH) and the Phase II enzymes UDP-
glucuronosyltransferases (uridine 5'-diphospho-glucuronic acid; UDPGA),
sulfotransferases (3'-phosphoadenosine-5'-phosphosulfate; PAPS) and glutathione
transferases (glutathione; GSH) have to be added to the S9 incubations (Johanning et al.,
2012). The addition of alamethicin is needed to reduce latency associated with
glucuronidation activity (Ladd et al., 2016). Other Phase II enzymes may be involved in
the biotransformation of certain chemicals like the conjugation of carboxylic groups with
amino acids, e.g., taurine (James, 1987; Plakas and James, 1990). However, cofactors for
these minor Phase II reactions are currently not part of the standard S9 protocol. If it is
known that such reactions play a role in metabolism of a specific substrate, hepatocytes
may be preferred over S9 fractions.
10. Both in vitro systems (OECD TG RT-HEP (OECD, 2018a) or TG RT-S9 (OECD,
2018b)) are considered to have a limited working lifetime due to a progressive loss of
enzymatic activity. Hepatocytes are thought to maintain their biotransformational
integrity longer, so they may be preferred for assessing slowly metabolized chemicals
(Fay et al., 2015). Accumulating experience indicates that substrate depletion experiments
using RT-HEP incubations may be carried out up to 4 h (Fay et al., 2015). The total
incubation time using RT-S9 should not generally exceed 2 h (Johanning et al., 2012);
however, incubation times up to 4 h may be possible for very slowly biotransformed test
chemicals. To date, the working lifetime of the two in vitro systems has not been
ENV/JM/MONO(2018)12 │ 11
Unclassified
rigorously established (Nichols et al., 2017). Because proteases may contribute to loss of
activity of RT-S9, the addition of a protease inhibitor may improve assay performance.
However, this possibility has not yet been evaluated. Therefore, the difference regarding
incubation time between the two assays seems to be minor. The lowest rate of in vitro
activity which can be reliably quantified is approximately 0.05 h-1 to 0.14 h-1 (Chen et al.,
2016; Nichols et al., 2013b).
11. The major advantage using liver S9 sub-cellular fractions compared to
hepatocytes is the ease of preparation and simpler shipment and storage conditions (i.e.,
shipment on dry ice and storage at -80°C for S9 sub-cellular fractions vs. shipment in
liquid nitrogen and storage in liquid nitrogen or at -135°C for hepatocytes).
12. Liver S9 sub-cellular fractions are technically easier to use for substrate depletion
experiments compared to cryopreserved hepatocytes, which require more complex
procedures for proper thawing and handling of the cells (e.g., cell counting). As such, it
may be possible to achieve higher levels of chemical throughput using S9 fractions. In the
ring trial supporting the development of RT-S9 and RT-HEP TGs (OECD, 2018c), intra-
and inter-laboratory variability in assay performance tended to be somewhat lower for
RT-S9 than for RT-HEP. This finding was attributed to variability among individual users
with respect to thawing, cell counting technique and viability determination. Generally,
however, intra- and inter-laboratory variability associated with both assays was quite low,
indicating that both methods are highly reliable (OECD, 2018c).
2.2. Comparison of in vitro intrinsic clearance
13. There have been few direct comparisons of the hepatocyte and liver S9 sub-
cellular fraction assays. In a study by Han et al., in vitro activities determined using liver
S9 sub-cellular fractions, liver microsomes and freshly isolated hepatocytes from rainbow
trout were compared for five chemicals. Intrinsic clearance values (expressed as mL/h/106
cells) determined using microsomes and S9 sub-cellular fractions were 4.5 to 16.6-fold
lower than those measured using hepatocytes (Han et al., 2009). In vitro depletion assays
for 6 polycyclic aromatic hydrocarbons (PAHs) were performed recently using
cryopreserved rainbow trout hepatocytes (Fay et al., 2016), and predicted in vivo intrinsic
clearance values (CLIN VIVO, INT; L/d/kg fish) were compared to values predicted using
existing data from trout liver S9 sub-cellular fractions (Nichols et al., 2013a).
Importantly, the hepatocytes and S9 sub-cellular fractions employed for this comparison
were obtained from the trout of the same size and strain, raised under similar conditions.
Moreover, measured levels of chemical binding in both in vitro systems were very similar
indicating that for each test chemical the free (unbound) concentration in both test
systems was approximately the same. Predicted CLIN VIVO,INT values for 5 out of 6 PAHs,
determined in cryopreserved hepatocytes, were in close agreement with those determined
using S9 sub-cellular fractions (<2.5-fold difference). For one chemical (benzo[a]pyrene),
the CLIN VIVO,INT determined using S9 fractions was ca. 10-fold higher than that obtained
using cryopreserved hepatocytes. Based on these findings, Fay et al. concluded that both
in vitro systems are well-suited for measuring intrinsic clearance in rainbow trout (Fay et
al., 2016).
14. In the ring trial (OECD, 2018c) performed to support development of OECD TG
RT-HEP and TG RT-S9 (OECD, 2018a, b), CLIN VITRO, INT for six chemicals were
determined using both methods. When these in vitro rates were extrapolated to CLIN VIVO,
12 │ ENV/JM/MONO(2018)12
Unclassified
INT, the clearance rates calculated for each test chemical differed among the two test
systems by no more than a factor of ~2, and were generally much closer. Moreover, there
was no general trend indicating that one test system or the other consistently yields higher
predicted levels of CLIN VIVO, INT. Differences in in vivo hepatic clearance (CLH) predicted
using the two test systems were even smaller (< 2.6-fold), because in several cases
predicted CLH was approaching the limit imposed by the liver blood flow (OECD,
2018c). Generally, these findings confirm earlier work by Fay et al., and suggest that
current data do not support a preference for one in vitro system or the other (Fay et al.,
2016). However, additional studies may be needed to determine whether one in vitro
system is more suitable for certain chemicals, e.g., for larger molecules.
Table 1. Comparison of in vitro hepatocyte and liver S9 sub-cellular fraction test systems to
determine intrinsic clearance of chemicals.
Cryopreserved hepatocytes S9 sub-cellular fractions
Cofactor addition Not required Cofactor addition required
Membrane
transporters
Yes, although transporter
activity may be impacted by
cell isolation procedures
No
Enzymes Phase I and Phase II metabolic
enzymes
Phase I and Phase II
metabolic enzymes
Max. recommended
incubation time
4 h 2-4 h
Preparation More sophisticated, has
probably to be adapted for
each species
Easy, can be adapted, in
principle, to any fish species
Storage Liquid nitrogen or -150°C -80°C freezer
Shipment Liquid nitrogen Dry ice
Standardization of
enzyme content
Thawing and counting step
may lead to more variability
regarding final cell
concentration
Protein concentration
determined once allows
precise adjustment of final
protein concentration
Species used so far Rainbow trout, carp1 Rainbow trout, carp, channel
catfish, fathead minnow,
various other species 2
1 (Bischof et al., 2016; Cowan-Ellsberry et al., 2008; Fay et al., 2015; Mingoia et al., 2010) 2 (Bearr et al., 2012; Cowan-Ellsberry et al., 2008; Dyer et al., 2008; Fay et al., 2015; Gomez et al., 2010; Han
et al., 2009; Johanning et al., 2012; Mingoia et al., 2010; Strobel et al., 2015)
ENV/JM/MONO(2018)12 │ 13
Unclassified
3. Considerations specific for the test chemicals
15. This section addresses considerations for the development of a robust test
chemical analytical method, including the selection of appropriate solvents for the
preparation of test chemical stock solutions and extraction solvents. Additional guidance
is provided on the selection of test chemical concentration and how to address potential
issues such as poor water solubility, volatility, adsorption, instability, and ionization. The
potential for applying these methods to chemical mixtures is also discussed. In general,
preliminary incubations with both active and enzymatically inactive biological material
should be performed in order to identify potential issues and optimize the test conditions.
16. The OECD guidance document 23 “Guidance Document on Aquatic Toxicity
Testing of Difficult Substances and Mixtures” (OECD, 2000) provides further support for
the testing of substances and mixtures classified as “difficult to test”.
3.1. Analytical method
17. A valid (robust and sensitive) analytical method (HPLC, LC-or GC-MS) is
needed to determine chemical depletion using TG RT-HEP (OECD, 2018a) or TG RT-S9
(OECD, 2018b). The sensitivity of the analytical method determines the lower limit of
concentration of the test chemical which can be used in the test system. As a general rule,
the initial test chemical concentration should be around 10-fold higher than the limit of
quantification (LOQ).
18. An internal standard with similar properties as the test chemical may be used to
correct for potential losses of the test chemical during sample preparation (e.g., due to
evaporation of the stopping solvent during the extraction procedure). The internal
standard should be added to the stopping solvent.
19. For the analytical measurement, calibration standards should be prepared in the
presence of biological matrix (i.e., incubation buffer containing cofactors, alamethicin,
and enzymatically inactive S9 sub-cellular fractions for RT-S9 incubations, and L-15
containing enzymatically inactive hepatocytes for RT-HEP incubations) and extracted
using the same protocol as for the incubation samples. Alternatively, the calibration
standards can be prepared in an organic solvent. In this case, matrix spikes are needed to
allow correction for extraction efficiency in order to calculate the concentration of test
chemical in the incubation samples.
3.2. Preparation of test chemical stock solutions
20. Stock solution(s) of the test chemical should be prepared in the reaction buffer
(i.e., L-15 medium for RT-HEP and potassium phosphate buffer for RT-S9, respectively)
if possible. However, since chemicals of interest for bioaccumulation assessment tend to
be hydrophobic, water-miscible solvents are commonly used to facilitate introduction of
these chemicals to the test system. A concentrated stock solution of the test chemical is
14 │ ENV/JM/MONO(2018)12
Unclassified
prepared in a solvent. Defined quantities of the stock solution (or intermediate spiking
solution) are then added to the incubation mixture to start the reaction, termed “spiking.”
21. The choice of a spiking solvent depends in part on the properties of the test
chemical. Solubility of the test chemical in this solvent should be determined. Water-
miscible solvents which are commonly used include acetonitrile, acetone, and methanol
(Johanning et al., 2012). DMSO is not recommended due to inhibition of certain CYP
isoforms as described for human liver microsomes (Chauret et al., 1998). The organic
stock solution can be directly added to the incubation mixture or, preferably, diluted into
an intermediary spiking solution with lower level of solvent which is finally added to the
incubations. This may be in particular necessary for the multiple vial approach (OECD,
2018b). In either case, the solvent concentration in the incubation should not exceed 1%
of the total volume (Johanning et al., 2012). In general, final concentrations of organic
solvents in the incubation medium should be minimized as much as possible, since they
can potently inhibit enzyme activities (Easterbrook et al., 2001; Nichols et al., 2017;
Sakalli et al., 2015). If the in vitro intrinsic clearance is lower than expected and the final
solvent concentration close to 1%, use of a lower solvent concentration or a different
solvent may be considered.
22. If stock solutions of test chemicals are stored prior to the incubation experiments,
stability tests must be performed under the corresponding storage conditions. Stock
solutions should not be stored for longer than 2 weeks at 4°C, and spiking solutions
should be freshly prepared at each day of the incubation. Stock solutions and spiking
solutions should be stored in the dark or in Amber glass vials for photolabile chemicals.
3.3. Extraction solvents for stopping of the incubation and extraction of the test
chemical
23. The organic solvent used to stop the biotransformation activity and extract the
chemical in RT-S9 and RT-HEP incubations depends on the properties of the test
chemical and on the analytical method used. Commonly used stopping and extractions
solvents are e.g., acetonitrile, methanol, dichloromethane (methylene chloride), and
methyl tert-butyl ether (MTBE)(OECD, 2018a, b). Due to difference of the biological
matrix, different extraction solvents may be needed for RT-HEP and RT-S9 incubations.
24. Preliminary experiments should be performed to determine whether the test
chemical is extractable from the incubation samples (active and enzymatically inactive
RT-S9 or active and enzymatically inactive RT-HEP, respectively). Different organic
solvents may need to be compared to ensure sufficient extraction efficacy. In instances
where the extraction solvent may interact with plastic, glass tubes (e.g., Hirschmann glass
inserts) should be used for extraction.
25. If extracted incubation samples are kept frozen prior to analysis, the chemical
stability of these frozen, extracted samples must be determined. It is not recommended to
freeze directly incubation samples which have not been extracted due to potential losses
e.g., by adsorption. Extracted samples should be stored in tightly closed glass vials, such
as HPLC- or GC-vials.
ENV/JM/MONO(2018)12 │ 15
Unclassified
3.4. Selection of test chemical concentrations
26. From theoretical considerations, the starting test chemical concentration should be
substantially lower than the Michaelis-Menten affinity constant (KM1) for the reaction in
order to result in first-order depletion kinetics (Nichols et al., 2006). Previously, Lo et al.
demonstrated a procedure for estimating KM from substrate depletion data collected
across a range starting concentrations (Lo et al., 2015). Using this method, they showed
that in vitro intrinsic clearance rates may depend strongly on the initial test chemical
concentration. A user of TG RT-HEP or TG RT-S9 (OECD, 2018a, b) may wish to
evaluate the concentration-dependence of a particular reaction to insure that the starting
concentration is <<KM. Without such an effort, the test chemical concentration may be
guided by analytical sensitivity as described above. Selection of the starting test chemical
concentration is detailed in TG RT-HEP, Annex 6 and TG RT-S9, Annex 5 (OECD,
2018a, b). This includes preliminary experiments comparing different test chemical
concentrations to establish the final reaction conditions needed to reliably measure in
vitro intrinsic clearance.
27. In certain cases (e.g., if the analytical method is not sensitive enough which may
be common for substances with multiple isomers), the use of a test chemical
concentration ≥ 1 µM may be valid from the perspective of providing a conservative
bioaccumulation assessment. If, however, the starting test chemical concentration is >KM,
an in vitro test system may underestimate the true rate of in vivo activity leading to an
over-prediction of the true BCF.
3.5. Poorly water soluble test chemicals
28. For very hydrophobic chemicals (log Kow > 6), use of a solvent spiking approach
could result in a dynamic system with incomplete dissolution in the aqueous test medium.
In particular, the test chemical concentration could locally exceed its aqueous solubility
causing the formation of microcrystals (Kwon et al., 2009). This could, in turn, reduce the
substrate concentration available to metabolizing enzymes causing underestimation of in
vitro biotransformation rates (Lee et al., 2014). To minimize this problem, all samples
should be mixed immediately after substrate addition.
29. A sorbent-phase dosing approach may be more useful for measuring in vitro
intrinsic clearance rates for chemicals with very low water solubility (Kwon et al., 2009;
Lee et al., 2011). An ethylene vinyl acetate (EVA) thin-film sorbent-phase dosing
approach has been developed and applied to measure the in vitro intrinsic clearance of
PAHs by RT-S9 (Lee et al., 2014). The in vitro intrinsic clearance rate of pyrene (log Kow
5.18) was similar in solvent-delivery dosing experiments and the sorbent-phase dosing
experiments. In contrast, the in vitro intrinsic clearance rate determined for chrysene (log
Kow 5.60) using sorbent-phase dosing was 20-fold higher than that achieved using solvent
spiking (Lee et al., 2014).
1 KM is the substrate concentration at which the reaction rate is ½ Vmax (maximum rate achieved
by the system at substrate maximum saturation concentration).
16 │ ENV/JM/MONO(2018)12
Unclassified
3.6. Volatile test chemicals
30. Volatility of the test chemical must be taken into account as one potential cause
for abiotic loss which should be minimized. Generally, if the Henry’s law constant (H) is
>100 Pa m3/mol, more than 50% of the substance could be lost from the water phase
within 3-4 hours (OECD, 2000). The thin-film sorbent-phase dosing approach should be
avoided for volatile chemicals as it may produce higher error in the determination of
mass-transfer rate constants due to loss of the substance from the sorbent phase during
preparation and handling of the thin films.
31. A substantial decrease of the test chemical concentration (i.e., >20%) in the
control incubations using enzymatically inactive RT-S9 or RT-HEP may indicate abiotic
losses due to volatility. The significance of volatility can be assessed by comparing
control incubations with enzymatically inactive RT-S9 or RT-HEP in open and closed
vials in preliminary experiments using other types of vials (e.g., GC or HPLC vials
rendering smaller headspace).
32. The multiple vial approach as described in Annex 7 and Annex 6 of the two TGs
respectively (OECD, 2018a, b) using tightly closed vials (e.g. GC-vials and lids with gas
tight septa) is preferred for testing of volatile chemicals. In contrast to the single vial
approach which requires withdrawal of aliquots at different time points, incubation vials
using the multiple vial approach are only opened once at the sampling point and the
headspace volume for each time point is comparable.
3.7. Adsorption of test chemicals
33. Abiotic loss of the test chemical may also be caused by adsorption onto surfaces
and onto organic material like protein or lipids.
34. Glass vials have to be used for the RT-HEP and RT-S9 incubations as described
in TG RT-HEP and RT-S9 (OECD, 2018a, b). The use of plastic vessels is not
recommended for the incubation tests. Additionally, highly adsorptive materials like
rubber should be avoided as part of the exposure system. When closed vials are used for
incubations, lids should consist of non-adsorptive materials like polytetrafluoroethylene
(PTFE) (OECD, 2000).
35. When working with highly hydrophobic chemicals, it is important to minimize
the sampling transfers during analysis (Johanning et al., 2012). Thus, the multiple vial
approach as described in Annex 7 and Annex 6 of the two TGs (see TG RT-HEP and TG
RT-S9 (OECD, 2018a, b)) is recommended in which incubation, stopping of the reaction
and extraction are done in the same vial.
ENV/JM/MONO(2018)12 │ 17
Unclassified
3.8. Abiotic degradation of test chemicals
36. Abiotic degradation processes, including hydrolysis and photolysis, may also
cause a loss of test chemicals from active and enzymatically inactive RT-S9 or RT-HEP.
Amber glass incubation vials (e.g., amber GC vials) may be used to prevent photolysis.
37. If chemical stock solutions are stored, the stability of these solutions must be
evaluated prior to testing. Furthermore, spiking solutions of the test chemical should be
prepared fresh the day of an experiment (see section 3.2).
3.9. Ionizable test chemicals
38. Relatively small changes in pH can significantly alter the balance between the
dissociated and non-dissociated forms of some organic acids and bases (OECD, 2000).
Altered dissociation equilibrium may significantly affect the water solubility. Therefore,
the relevant dissociation constants (pKa values) should be known prior to testing ionizable
chemicals (IOCs).
39. There are limited data available on the biotransformation of IOCs in fish.
Substrate depletion of 12 pharmaceuticals was studied in rainbow trout liver S9 fractions
(Connors et al., 2013b). Recently, in vitro intrinsic clearances were determined for 50
IOCs representing the most common types of monoprotic acids and bases using RT-S9
(Chen et al., 2016). Similar RT-S9 incubation conditions were used as described in the
TG RT-S9 (OECD, 2018b), while test chemical stock solutions were prepared in
acetone/incubation buffer (20:80,v:v) instead of pure solvent.
40. Due to the chemical properties that distinguish IOCs from neutral chemicals,
specific considerations may have to be applied for IVIVE extrapolation to predict BCFs
(Armitage et al., 2017) (see Chapter 5.4, §83).
3.10. Testing of chiral chemicals and structural isomers
41. The substrate depletion approach using RT-S9 or RT-HEP may be employed to
compare in vitro intrinsic clearance rates for different stereoisomers or structural isomers.
For example, trout liver S9 fractions were applied to investigate enantiomer-specific
differences in biotransformation of three pharmaceuticals (Connors et al., 2013a).
42. Some chemicals exist as isomeric mixtures containing two or more isomers. In
vitro intrinsic clearance rates can be determined for the individual isomers in these
mixtures if the analytical method is sensitive enough to quantify the isomers separately
(Laue et al., 2014). Current BCF predictions based on log Kow and QSAR-estimated
biotransformation rates (i.e., the Arnot-Gobas model, (Arnot and Gobas, 2003)) do not
distinguish between different stereoisomers except if there are differences in log Kow
values.
18 │ ENV/JM/MONO(2018)12
Unclassified
3.11. Mixtures, MCS and UVCBs as test chemicals
43. In principle, TG RT-HEP (OECD, 2018a) and TG RT-S9 (OECD, 2018b) can be
used to determine in vitro intrinsic clearance rates of mixtures. With few exceptions,
these in vitro methods have only been applied to single chemical substances. Using a
conventional solvent dosing approach to determine in vitro biotranformation with
rainbow trout liver S9 fractions, Lee et al. (Lee et al., 2014) found that in vitro
biotransformation rate constants for three PAHs tested individually were significantly
greater than those obtained when the three PAHs were tested as a mixture. Based on this
finding, it was suggested that in vitro biotransformation of one PAH may be
competitively inhibited by the presence of other PAHs.
44. The mixture effect noted by Lee et al. when using a conventional solvent dosing
was substantially reduced when the three PAHs were tested using a sorbent-phase dosing
approach. The lower initial substrate concentrations in the incubation medium in the thin-
film dosing experiments may reduce competitive inhibition. Thus, a sorbent-delivery
system may have greater potential for measuring biotransformation rates of multiple
chemicals (Lee et al., 2014).
45. In addition to possible inhibitory effects associated with mixtures, the analytical
determination of the concentrations of individual components of the mixture may be
challenging. The extraction method, analytical method, and test concentration must be
suitable for all components of the mixture. Thus, it is recommended to test the
biotransformation of the individual components of mixtures if they are available.
46. The same holds true for multi-constituent substances, major constituents may
need to be tested individually provided that a sensitive analytical method is available.
Testing of UVCBs may be even more challenging and can only be performed on
components for which an analytical method is available.
ENV/JM/MONO(2018)12 │ 19
Unclassified
4. Positive and negative control incubations
4.1. Negative control incubations
47. The use of a negative control is necessary to ensure that an observed decrease in
test chemical concentration is not due to abiotic processes. This section describes
procedures used to prepare negative controls as well as guidance on how the negative
control results should be interpreted.
4.1.1. Enzymatically inactive RT-HEP and RT-S9
48. TG RT-HEP and TG RT-S9 (OECD, 2018a, b) state that in addition to
incubations with active RT-HEP or RT-S9, negative control incubations with
enzymatically inactive RT-HEP or RT-S9 should be performed in parallel to distinguish
between enzymatic metabolism and abiotic decrease (e.g., abiotic degradation,
volatilization, adsorption to the reaction vessel). Enzymatically inactive RT-HEP or RT-
S9 are used for negative control incubations and their routine preparation by heat
inactivation is described in TG RT-HEP and TG RT-S9 (OECD, 2018a, b). Heating in a
microwave is not recommended (Fay et al., 2015).
49. A decrease of the test chemical by >20% with enzymatically inactive biological
material indicates potential issues which are addressed in section 3.6-3.8. In such cases, it
is recommended that the incubation conditions are optimized to reduce these abiotic loss
processes. Recommendations on how to proceed in case of substantial decreases of the
test chemical in enzymatically inactive control incubations are described in Annex 2.
50. For some chemicals, there may be issues due to the inhomogeneous nature (i.e.,
precipitated protein) of the heat-inactivated matrix, especially for heat-inactivated RT-S9.
In such cases, enzymatically inactive RT-S9 can be prepared by incubating active RT-S9
at room temperature for 24 h followed by storage at -20°C for at least 24 h prior to use.
Negative control incubations with room-temperature inactivated RT-S9 are carried out in
presence of alamethicin, but without addition of any cofactors. Preparation of room-
temperature inactivated RT-S9 is described in detail in Annex 3.
51. If, during preliminary incubations, there is negligible loss of substrate in the
presence of enzymatically inactive RT-HEP or RT-S9 (see Annex 6, TG RT-HEP
(OECD, 2018a) and Annex 5, TG RT-S9 (OECD, 2018b), respectively), a reduced
number of time points may be applied for the negative controls in the main incubations,
e.g., starting, middle, and ending time points (Johanning et al., 2012).
52. If there is an abiotic loss of test chemical from enzymatically inactive RT-HEP or
RT-S9 which cannot be avoided by optimization of test conditions (i.e., abiotic decrease
>20%), the rate of this loss process may be subtracted from the measured rate of
depletion in active samples to obtain a corrected in vitro intrinsic clearance rate (Nichols
et al., 2013a). In this case, however, it must be verified that the abiotic loss process
follows first-order kinetics. Furthermore, if the difference between abiotic decrease in the
negative control and enzymatic decrease in the RT-S9 or RT-HEP incubations is rather
small, a correction of the in vitro clearance may also be performed.
20 │ ENV/JM/MONO(2018)12
Unclassified
53. Furthermore, negative controls should demonstrate no apparent increase (i.e.,
>20%) of the parent chemical over the incubation time. Apparent increase in the negative
controls may be due to an increase in solubility or better extractability in presence of
(inactive) protein over the incubation time. In this case, the use of other negative controls
like the use of room temperature inactivated RT-S9 may be considered.
4.1.2. Additional negative control incubations – RT-S9
54. Control incubations containing active RT-S9, but no added cofactors, can be used
to detect cofactor-independent enzymatic reactions such as hydrolysis by
carboxylesterases. It should be noted, however, that background concentrations of each
cofactor may be present in liver S9 sub-cellular fractions (Johanning et al., 2012).
4.2. Positive control (reference chemical) incubations
55. Before using a new lot of RT-HEP or RT-S9, the enzymatic activity of this
material should be characterized by running Phase I and Phase II biotransformation
reactions using standard substrates. Assays that have been used to characterize RT-HEP
and RT-S9 are described in Annex 3 of TG RT-HEP (OECD, 2018a) and TG RT-S9
(OECD, 2018b). In addition, activities of the RT-HEP and RT-S9 used for the ring trial
are provided in Table 2 of the ring trial report (OECD, 2018c).
56. In addition to the initial characterization of a new lot of RT-HEP or RT-S9, it is
recommended that users incorporate an appropriate reference chemical into test systems
involving a new test chemical in order to verify enzymatic activity of the biological
material. If a specific pathway for biotransformation of the new test chemical is known or
suspected (e.g., Phase I or Phase II), it may be useful to choose a reference chemical
which is transformed by the same metabolic pathway. Incorporation of a reference
chemical increases confidence in the experimental outcome and may provide a means of
accounting for lot-to-lot differences in activity of biological material.
57. Ideally, the depletion rate for a reference chemical in the chosen test system
would be well studied in order to provide a range of expected performance. Preliminary
studies and/or depletion rates reported in the literature may be helpful when selecting a
suitable reference chemical. However, potential differences in depletion rates due to
differences in biological material, initial test chemical concentrations, and experimental
conditions must be taken into consideration (Fay et al., 2015). Additional considerations
for selecting a reference compound include: commercial availability, volatility, relative
hydrophobicity, stability, and availability of analytical methods. Examples for possible
reference chemicals are listed in Annex 4, Table 1.
58. In vitro intrinsic clearance rates are usually similar when a reference chemical is
tested using different aliquots of the same lot of biological material (RT-HEP or RT-S9).
If enzymatic clearance of the reference chemical is verified at regular intervals, it may not
be necessary to run the reference chemical in parallel with all test chemical incubations.
ENV/JM/MONO(2018)12 │ 21
Unclassified
5. Use of in vitro intrinsic clearance to predict BCFs
59. Biotransformation can reduce the extent to which chemicals accumulate in fish.
Recent research has led to development of a screening-level QSAR model for estimating
biotransformation rates (kMET) based on chemical structure (Arnot et al., 2009). This
QSAR had been implemented in the Arnot-Gobas bioaccumulation models (Arnot and
Gobas, 2003) within the U.S. EPA’s Estimation Program Interface (EPI) Suite (U.S.
Environmental Protection Agency, 2013). Despite this progress, biotransformation
remains one of the greatest uncertainties in the prediction of bioaccumulation of
chemicals in fish. In vitro metabolizing systems which directly measure
biotransformation rates using fish hepatocytes or liver S9 sub-cellular fractions can be
used method to refine in silico BCF prediction models (Cowan-Ellsberry et al., 2008; Han
et al., 2007; Nichols et al., 2006).
60. In the following paragraphs, examples of an in vitro-in vivo extrapolation (IVIVE)
model for rainbow trout and a mass balance model for BCF prediction as published by
Nichols et al. are explained (Nichols et al., 2013b). However, CLIN VITRO, INT may be used
as an input to physiologically based toxicokinetic (PBTK) models for fish for
bioaccumulation assessment (Brinkmann et al., 2016; Stadnicka-Michalak et al., 2014).
5.1. In vitro-in vivo extrapolation and mass balance model to predict BCFs:
theoretical background (model examples)
61. In vitro intrinsic clearance rates determined with OECD RT-HEP or RT-S9 are
extrapolated to an estimate of hepatic clearance (CLH), which is used to estimate a whole-
body biotransformation rate constant (kMET). This whole-body rate constant is then used
as an input to established mass-balance models for rainbow trout to predict well-known
metrics of accumulation such as the BCF. Details on the general approach have been
given by various authors (Cowan-Ellsberry et al., 2009; Han et al., 2007; Han et al., 2009;
Nichols et al., 2006). In a recent report, Nichols et al., (Nichols et al., 2013b) described
two models that employ measured in vitro intrinsic clearance rates to predict BCFs in
rainbow trout. One model (HEP-BCF) was provided for data derived from RT-HEP,
while a second (S9-BCF) was developed for data derived from RT-S9. Both models were
configured as Microsoft Excel spreadsheets (for examples, see Annex 5) and are available
via the OECD website. Importantly, these models predict the BCF for a “standardized”
fish (10 g rainbow trout containing 5% whole-body lipid), which is typical of fish
commonly tested in vivo under OECD TG305 (OECD, 2012).
62. As described in TG RT-HEP and TG RT-S9 (OECD, 2018a, b), a substrate
depletion approach is used to determine an in vitro a first-order elimination rate constant
(ke, h-1). Implied by this approach is an assumption that the starting substrate
concentration is below KM, the Michaelis-Menten affinity constant for the reaction (i.e.,
under first-order conditions). The rate constant ke is then normalized to cell number or S9
protein content (CHEP and CS9, respectively) to derive the in vitro intrinsic clearance (CLIN
VITRO,INT; mL/h/106 cells or mL/h/mg protein; see equation 1).
CLIN VITRO,INT = ke/ CHEP or CLIN VITRO,INT = ke / CS9 [1]
22 │ ENV/JM/MONO(2018)12
Unclassified
63. In the S9-BCF model, the CLIN VITRO,INT is multiplied by the S9 protein content of
liver tissue (LS9; mg/g liver), the liver weight as a fraction of body weight (LFBW; g liver/g
fish) and by 24 to yield the in vivo intrinsic clearance (CLIN VIVO,INT; L/d/kg fish; equation
2) (Nichols et al., 2013b). The S9 content of liver tissue refers to the total amount of S9
protein in the tissue and not the protein content of the S9 fraction itself. This scaling
factor accounts for incomplete recovery of protein during the preparation of S9 sub-
cellular fraction (e.g., due to incomplete cell lysis) and was determined using two markers
of microsomal protein (total cytochrome P450 content and glucose-6-phosphatase
activity). An average value of 163 mg S9 protein /g liver is applied in the S9-BCF model
(Nichols et al., 2013b). This correction had not been implemented in previous models
(Cowan-Ellsberry et al., 2008; Han et al., 2009). The fractional liver weight (LFBW) used
by Nichols et al. (Nichols et al., 2013b) was based on a value determined previously for
small trout (Schultz and Hayton, 1999).
CLIN VIVO,INT = CLIN VITRO,INT LS9 LFBW 24 [2]
64. In the HEP-BCF model, the CLIN VITRO,INT is multiplied by hepatocellularity (LHEP;
106 cells/g liver), fractional liver weight (LFBW) and by 24 to yield the CLIN VIVO,INT
(L/d/kg fish) (equation 3). An average hepatocellularity value of 510 x 106 cells/g liver is
used in the HEP-BCF model (Fay et al., 2014a). This value is appropriate for sexually
immature trout and is based on studies performed by the authors as well as studies
described previously (Hampton et al., 1989; Han et al., 2008).
CLIN VIVO,INT = CLIN VITRO,INT LHEP LFBW 24 [3]
65. The CLIN VIVO,INT is converted to an estimate of in vivo hepatic clearance (CLH; L/d
kg) (equation 4) using a well-stirred liver model (Nichols et al., 2013b). Calculation of
the CLH accounts for possible rate limitations imposed by the liver blood flow rate and by
possible chemical binding effects.
CLH = QH U CLIN VIVO, INT / (QH + U CLIN VIVO, INT) [4]
where QH (L/d/kg fish) is the liver blood flow rate and U (unitless) is a binding term
(ranging from 0.0 to 1.0) that corrects for the difference in free chemical concentration
between blood and the in vitro system used to measure activity (Nichols et al., 2013b;
Nichols et al., 2006). In the spreadsheets, U is calculated as the ratio of free chemical
fractions in blood plasma (U,P; unitless) and the in vitro system (U,S9 or U,HEP; unitless),
each of which is estimated using log Kow–based algorithms. Consistent with the “free
chemical hypothesis,” these models assume that only the free chemical fraction is
available for metabolic transformation in vitro and in vivo.
66. Presently, the effect of chemical binding on predicted hepatic clearance is one of
the major uncertainties in modelled BCF predictions. It was observed in several studies
that setting U =1.0 (i.e., assuming the same availability of the chemical to metabolic
enzymes in vitro and in vivo) resulted in much better agreement between predicted and
measured BCF values (Cowan-Ellsberry et al., 2008; Escher et al., 2011; Laue et al.,
2014; OECD, 2018c). The spreadsheet can be adapted by manually changing the term
“fu” to “fuone”, thereby setting U =1.0. This results in the following equation:
CLH = QH CLIN VIVO, INT / (QH + CLIN VIVO, INT) [5]
For chemicals with relatively high log Kow values and low intrinsic clearance rates, the
two different binding assumptions result in substantial differences in predicted hepatic
ENV/JM/MONO(2018)12 │ 23
Unclassified
clearance rates and measured BCFs (Nichols et al., 2013b). The impact on these binding
assumptions is discussed in more detail below (§84-86).
67. A whole-body biotransformation rate constant (kMET; 1/d) is calculated by
dividing CLH by the chemical’s apparent volume of distribution, referenced to the
chemical concentration in blood (VD,BL; L/kg; equation 6) (Nichols et al., 2006). The
VD,BL is estimated as the ratio of fish/water and blood/water partition coefficients, each of
which is calculated using log Kow-based algorithms.
kMET = CLH / VD,BL [6]
68. There are still uncertainties in the extrapolation models with respect to
physiological parameters. The second key parameter besides the binding term fU is the
apparent volume of distribution (VD,BL). As described above (§67), VD,BL is estimated as
the ratio of fish/water and blood/water partition coefficients. This calculation combines
errors associated with prediction of these two terms individually. For some chemicals, in
particular when high affinity binding to specific proteins or tissues is observed, it may be
necessary to measure VD,BL directly (Nichols et al., 2013b).
69. The total chemical concentration in fish at steady state (CFISH,SS; mg/kg) is
predicted using the 1-compartment model given by Arnot and Gobas (Arnot and Gobas,
2003) (equation 7). The calculation includes rate constants that describe chemical uptake
(k1) and loss across the gills (k2), and fecal egestion (kE) (Arnot and Gobas, 2003).
Additionally, a rate constant (kG) can be included accounting for growth. In the current
version of the spreadsheets (see Annex 5 for examples) kG is set to 0, i.e., growth dilution
of the chemical is not considered.
CFISH,SS = (k1 CW,FD) / (k2+kMET+kG+kE) [7]
k1 = gill uptake rate constant (L/d/kg); CW,FD = chemical concentration dissolved in water
(mg/L);
k2 = gill elimination rate constant (d-1); kMET = whole-body biotransformation rate
constant (d-1); kG= growth rate constant (d-1); kE = fecal egestion rate constant (d-1)
70. Finally, (CFISH,SS; mg/kg) is divided by the total chemical concentration in water
(CW,TOT) resulting in a predicted BCF expressed on a total chemical basis (BCFTOT; L/kg
fish; equation 8). BCFTOT as quotient of the chemical concentration in fish and the
concentration in water is in line (i.e. same units) with the BCF measured using OECD TG
305 (OECD, 2012).
BCFTOT = CFISH,SS / CW,TOT [8]
71. A second BCF is predicted which is normalized for fish lipid content (BCFFD,L;
L/kg lipid) and expressed on a freely dissolved chemical basis. BCFFD,L is calculated by
dividing CFISH,SS by the product of the chemical concentration dissolved in water (CW, FD;
mg/L) and the fish’s whole-body lipid content (vLWB; unitless); equation 9); vLWB; is
assumed to be 0.05 (Nichols et al., 2013b).
BCFFD,L = CFISH,SS / (CW,FD vLWB) [9]
5.2. Use of the spreadsheets for BCF prediction: practical application
72. BCFs are predicted for the test chemical based on in vitro biotransformation rates
determined in the RT-HEP or RT-S9 test system using the corresponding spreadsheets
(for examples, see Annex 5). The two different binding assumptions (i.e., U modelled
24 │ ENV/JM/MONO(2018)12
Unclassified
and U=1.0) should be considered for BCF prediction to estimate upper and lower limits
of hepatic clearance (Nichols et al., 2013b).
73. Parameters that need to be entered by the user into the spreadsheets are the log
Kow of the test chemical, the body weight of fish used for RT-HEP or RT-S9 preparation
(does not impact the BCF calculations in the spreadsheets as included in Annex 5), the
RT-S9 protein concentration or hepatocyte concentration used in the in vitro test system,
the reaction rate determined, incubation temperature, and the nominal test chemical
concentration (Tables 2 and 3; and examples in Annex 5). Measured log Kow values
should be used, when available; in the absence of measured values, modelled estimates
can be used (e.g., those provided by EpiSuite (U.S. Environmental Protection Agency,
2013)).
74. Additional independent variables such as liver S9 protein content, liver weight as
a fraction of body weight, and liver blood flow as a fraction of cardiac output are
specified in the spreadsheets. See Annex 5 for details.
75. The spreadsheets calculate a BCFTOT (L/kg fish) for a standardized fish based on
the in vitro reaction rate determined in the hepatocyte or S9 test system. A second BCF is
calculated normalized for fish lipid (BCFFD,L; L/kg lipid) (Nichols et al., 2013b). These
models can in principle be adjusted for different sizes of fish and for temperature.
Table 2. Independent variable inputs to be set when using the S9-bioconcentration factor
(S9-BCF) model. Additional independent variables which are already included in the
spreadsheet are not listed (Nichols et al., 2013b).
Parameter Value Units
Log Kow of test chemical Measured or estimated Unitless
Body weight of fish used as
source of S9
Measured g
S9 protein concentration (CS9)
in the test system
Set by user; typically 0.25 to 2.0 mg/mL
Reaction rate (Rate) Measured; from substrate depletion assay h-1
Modelled temperature (T) Set by user, should correspond to
temperature used for in vitro incubation
Celsius
Total aqueous chemical
concentration (Cw, TOT)
Set by user mg/L
Table 3. Independent variable inputs to be set when using the hepatocyte-bioconcentration
factor (HEP-BCF) model. Additional independent variables which are already included in
the spreadsheet are not listed (Nichols et al., 2013b).
Parameter Value Units
Log Kow of test chemical Measured or estimated Unitless
Body weight of fish used as
source of hepatocytes
Measured g
Hepatocyte cell number
(CHEP)
Set by user; typically 1 to 2 × 10⁶ (final
cell number is verified by recounting)
cells/mL
ENV/JM/MONO(2018)12 │ 25
Unclassified
First-order elimination rate
constant (ke)
Measured; from substrate depletion assay h-1
Modelled temperature (T) Set by user, should correspond to
temperature used for in vitro incubation
Celsius
Total aqueous chemical
concentration (Cw, TOT)
Set by user; does not impact BCF
calculations
mg/L
5.3. Applications and interpretation of BCF predictions
76. BCFs predicted by incorporating measured in vitro biotransformation rates into in
silico BCF models may be used to screen chemicals for bioaccumulative properties and to
decide whether a test chemical is B (bioaccumulative) or not B on the screening level
according to the corresponding regulatory framework. Incorporation of biotransformation
rates enhances the reliability of the in silico models for BCF prediction (Treu et al.,
2015), since log Kow-based QSARs or other models often neglect the contribution of fish
metabolism which can reduce bioaccumulation.
77. The predicted BCFs may be applied to assess the bioaccumulation potential as
part of a weight of evidence approach or for read across (i.e., comparison of in vitro
intrinsic clearance of the test chemical with another chemical for which empirical BCF
data are available) as discussed in some publications and regulatory frameworks (ECHA,
2017a, b, c).
78. Furthermore, predicted BCFs based on in vitro data may be useful as an
additional tool for screening for bioaccumulation properties in order to decide whether a
full in vivo fish-BCF study is warranted.
79. BCFs predicted in this way should be considered as more uncertain than the BCFs
derived from, for example, the dietary exposure or the minimised test design as part of the
OECD TG 305 (OECD, 2012) regarding the uncertainties discussed in Chapter 5.4.
Therefore, they may not replace in vivo fish bioaccumulation tests. Nevertheless,
predicted BCFs based on in vitro data may be an alternative if in vivo testing is
technically not feasible or if the corresponding regulatory framework does not allow
vertebrate testing.
80. Although the spreadsheets given by Nichols et al. (Nichols et al., 2013b) were
developed to predict BCF values for a standardized fish (10 g trout containing 5% lipid),
they may be used to predict BCFs for any fish species (lifestage, etc.) of interest by
appropriate specification of in vitro-in vivo scaling factors. Additional research is needed
to develop these scaling factors for other species.
5.4. Uncertainties and limitations of BCF predictions
81. A valid (sensitive and robust) analytical method is mandatory to quantify the test
chemical (see §17).
82. In case, the CLIN VITRO, INT derived is used to inform in silico bioaccumulation
models on biotransformation, the test chemical should be within the applicability domain
of the corresponding model. The models were developed for well-metabolized neutral
26 │ ENV/JM/MONO(2018)12
Unclassified
organic chemicals with log Kow between 3-8. More studies on additional chemicals are
needed to expand the domain of applicability of this method.
83. Due to the different chemical properties of IOCs, special BCF models may be
needed for IVIVE extrapolation especially regarding their uptake and elimination rates
(Chen et al., 2016). A recent paper by Armitage et al. (Armitage et al., 2017) discusses
some of the specific considerations to assess bioaccumulation of IOCs, and proposes a
tiered strategy. A mechanistic bioconcentration model had been developed for IOCs in
fish. The model is based on an existing approach for neutral organic chemicials (Arnot
and Gobas, 2004) and was modified to account for dissociation of IOCs (Armitage et al.,
2013). However, empirical data on chemical absorption efficiency and gill uptake rate
constants are lacking in particular for cationic IOCs (Armitage et al., 2013) and further
research is needed. There is currently no validated IVIVE model for IOCs available due
to the small current data set. Further research is needed on in vitro biotransformation and
in vivo bioconcentration on IOCs.
84. Uncertainties in the IVIVE model, e.g., the binding term U, volume of
distribution (VDB), and the BCF model, e.g., rate constants, will propagate uncertainty in
the calculated BCFs. The models and underlying assumptions that present these
uncertainties continue to be evaluated in related on-going research and thus the model
formulations are expected to continue to evolve.
85. For some hydrophobic chemicals, there was a poor correlation between empirical
BCFs and BCFs predicted using the full modelled binding assumption (i.e., fU = fU,P/fU,HEP
or fU,S9). Instead, there was better agreement using the binding assumption U=1.0,
especially for slowly metabolized chemicals (Cowan-Ellsberry et al., 2008; Escher et al.,
2011; Laue et al., 2014; OECD, 2018c). These observations suggest that hepatic
clearance values predicted using the full binding assumption under-predict true levels of
in vivo clearance resulting in overestimation of measured BCFs. A systematic bias toward
under-prediction of high in vivo hepatic clearance rates by in vitro systems (hepatocytes,
microsomes) derived from mammalian liver tissue has been noted by several authors
(Hallifax et al., 2010; Hallifax and Houston, 2012; Wood et al., 2017).
86. Previously, it was suggested that the two different binding assumptions may be
used to estimate upper and lower limits on hepatic clearance (Nichols et al., 2013b). More
studies are needed to evaluate which binding assumption results in more accurate BCF
predictions for hydrophobic chemicals in fish. These studies should ideally be performed
at substrate concentrations shown to be well below the KM for the reaction if the
analytical method is sensitive enough. Recent work indicates that the use of substrate
concentrations greater than KM may, by itself, result in lower levels of measured in vitro
clearance, and by extension lower levels of predicted in vivo hepatic clearance and higher
predicted BCF values (Lo et al., 2015).
87. Additional factors that may explain differences between measured and predicted
BCF values include extrahepatic metabolism and induction of metabolizing enzymes in
prolonged contaminant exposures (e.g., a laboratory BCF testing effort). In either case,
these factors would tend to result in measured BCFs that are lower than those predicted
considering only hepatic metabolism, as well as those predicted using liver S9-subcellular
fractions and hepatocytes from trout that have not been induced.
88. The RT-HEP and RT-S9 test systems have practical limitations which limit their
use for chemicals metabolized at very low rates. The ability to detect a low rate chemical
depletion (i.e., one statistically different from negative controls) depends on the
ENV/JM/MONO(2018)12 │ 27
Unclassified
behaviour of these controls, the quality of the dataset (e.g., the precision of replicated
measurements at each time point), and the length of time over which the test is run. As
noted above (§10), these tests have a finite working lifetime. Previously, Nichols et al.
(Nichols et al., 2013b) estimated that the lowest rate of in vitro activity which can be
reliably quantified using this approach is about 0.05 h-1, based on historical data for
several compounds. A somewhat higher limit value (0.14 h-1) was estimated by Chen et
al. (Chen et al., 2016), based on modelled simulations of hypothetical substrate depletion
data.
89. When used to evaluate the validity of in vitro-in vivo metabolism extrapolation
efforts, it should also be kept in mind that even high quality experimental BCF data differ
by >0.5 log units for at least 35% of chemicals tested and >1 log unit for at least 10% of
chemicals (Nendza et al., 2010) which may result in BCFs values which are below and
above a certain B threshold, e.g., as described for lindane (log BCF ranging from 2.16-
3.32) (Arnot and Gobas, 2006).
90. Additionally, the impact of the log Kow value used to predict BCFs based on in
vitro intrinsic clearance has to be considered for the interpretation of the predicted BCFs.
Both measured and predicted (e.g., QSAR) log Kow values may be prone to error in
certain instances. The accepted variation of log Kow values determined using OECD TG
117 (OECD, 2004) is +/- 0.5 which may result in substantially different predicted BCFs
especially for higher log Kow chemicals which are slowly biotransformed.
28 │ ENV/JM/MONO(2018)12
Unclassified
6. Other potential use of the in vitro RT-HEP and RT-S9 test systems
6.1. Adaptation to other fish species and tissues
91. In principle, the RT-HEP and RT-S9 test systems can be adapted to any fish
species, thereby allowing a comparison of in vitro biotransformation in different fish
species. Primary hepatocytes have been successfully isolated from numerous fish species.
However, to-date, consistent substrate depletion studies have only been performed in
rainbow trout (Bischof et al., 2016; Fay et al., 2014a; Han et al., 2008; Mingoia et al.,
2010) and common carp (Cyprinus carpio) (Bischof et al., 2016; Cowan-Ellsberry et al.,
2008; Dyer et al., 2008, 2009).
92. Because they are easier to prepare, most studies on multiple species have been
performed using liver S9 sub-cellular fractions. For example, Phase I and II metabolism
of model substrates have been compared in eight finfish species (González et al., 2009)
and the metabolism of benzo[a]pyrene was compared in liver S9 sub-cellular fractions
from red and white blooded antarctic fish (Strobel et al., 2015).
93. In addition to liver, S9 sub-cellular fractions can be prepared from other organs,
such as the gills and gut. This facilitates comparisons of biotransformation in different
organs and may provide a means for studying the impact of extrahepatic clearance on
predicted BCFs. Gomez et al compared biotransformation of pharmaceuticals in S9 sub-
cellular fractions prepared from liver and gill of rainbow trout and channel catfish
(Ictalurus punctatus) (Gomez et al., 2011; Gomez et al., 2010).
6.2. Identification of metabolites
94. The RT-HEP and RT-S9 test systems could be applied to identify metabolites in
vitro; i.e. the substrate depletion tests may allow a qualitative identification of metabolites
and potential metabolic pathways. Furthermore, the tests may be used to quantify the
appearance of metabolites and not the disappearance of parent chemical (Bischof et al.,
2016; Chen et al., 2016). Identification of metabolites may be a requirement in various
regulatory frameworks.
95. For example, numerous published protocols exist for separating the liver S9
fraction into subcellular fractions that reflect compartmentalization of cellular enzyme
activity (e.g., lysosomal, mitochondrial, microsomal, and cytosolic fractions). By using
these protocols, it may be possible to explore the metabolism of a particular chemical
including the site of metabolism and, by manipulating various cofactors, the identities of
responsible enzymes.
ENV/JM/MONO(2018)12 │ 29
Unclassified
7. References
Armitage, J.M., Arnot, J.A., Wania, F., and Mackay, D. (2013). Development and
evaluation of a mechanistic bioconcentration model for ionogenic organic chemicals in
fish, Environmental Toxicology and Chemistry 32, 115-128.
Armitage, J.M., Erickson, R.J., Luckenbach, T., Ng, C.A., Prosser, R.S., Arnot, J.A.,
Schirmer, K., and Nichols, J.W. (2017), Assessing the bioaccumulation potential of
ionizable organic compounds: Current knowledge and research priorities, Environmental
Toxicology and Chemistry 36, 882-897.
Arnot, J.A., and Gobas, F.A. (2004), A food web bioaccumulation model for organic
chemicals in aquatic ecosystems, Environmental Toxicology and Chemistry 23, 2343-
2355.
Arnot, J.A., and Gobas, F.A.P.C. (2003), A generic QSAR for assessing the
bioaccumulation potential of organic chemicals in aquatic food webs, QSAR and
Combinatorial Science 22, 337-345.
Arnot, J.A., and Gobas, F.A.P.C. (2006), A review of bioconcentration factor (BCF) and
bioaccumulation factor (BAF) assessments for organic chemicals in aquatic organisms,
Environmental Reviews 14, 257-297.
Arnot, J.A., Meylan, W., Tunkel, J., Howard, P.H., Mackay, D., Bonnell, M., and
Boethling, R.S. (2009), A quantitative structure-activity relationship for predicting
metabolic biotransformation rates for organic chemicals in fish. Environmental
Toxicology and Chemistry 28, 1168-1177.
Bearr, J.S., Mitchelmore, C.L., Roberts, S.C., and Stapleton, H.M. (2012), Species
specific differences in the in vitro metabolism of the flame retardant mixture,
Firemaster(R) BZ-54, Aquatic Toxicology 124-125, 41-47.
Bischof, I., Koster, J., Segner, H., and Schlechtriem, C. (2016), Hepatocytes as in vitro
test system to investigate metabolite patterns of pesticides in farmed rainbow trout and
common carp: Comparison between in vivo and in vitro and across species, Comparative
Biochemistry and Physiology Part C: Toxicology & Pharmacology 187, 62-73.
Brinkmann, M., Schlechtriem, C., Reininghaus, M., Eichbaum, K., Buchinger, S.,
Reifferscheid, G., Hollert, H., and Preuss, T.G. (2016), Cross-Species Extrapolation of
Uptake and Disposition of Neutral Organic Chemicals in Fish Using a Multispecies
Physiologically-Based Toxicokinetic Model Framework, Environmental Science &
Technology 50, 1914-1923.
Chauret, N., Gauthier, A., and Nicoll-Griffith, D.A. (1998), Effect of common organic
solvents on in vitro cytochrome P450-mediated metabolic activities in human liver
microsomes, Drug Metabolism and Disposition 26, 1-4.
Chen, Y., Hermens, J.L.M., Jonker, M.T.O., Arnot, J.A., Armitage, J.M., Brown, T.,
Nichols, J.W., Fay, K.A., and Droge, S.T.J. (2016), Which Molecular Features Affect the
Intrinsic Hepatic Clearance Rate of Ionizable Organic Chemicals in Fish? Environmental
Science & Technology 50, 12722-12731.
30 │ ENV/JM/MONO(2018)12
Unclassified
Connors, K.A., Du, B., Fitzsimmons, P.N., Chambliss, C.K., Nichols, J.W., and Brooks,
B.W. (2013a), Enantiomer-specific in vitro biotransformation of select pharmaceuticals in
rainbow trout (Oncorhynchus mykiss), Chirality 25, 763-767
Connors, K.A., Du, B., Fitzsimmons, P.N., Hoffman, A.D., Chambliss, C.K., Nichols,
J.W., and Brooks, B.W. (2013b), Comparative pharmaceutical metabolism by rainbow
trout (Oncorhynchus mykiss) liver S9 fractions, Environmental Toxicology and
Chemistry 32, 1810-1818.
Cowan-Ellsberry, C.E., Dyer, S.D., Erhardt, S., Bernhard, M.J., Roe, A.L., Dowty, M.E.,
and Weisbrod, A.V. (2008), Approach for extrapolating in vitro metabolism data to refine
bioconcentration factor estimates, Chemosphere 70, 1804-1817.
Cowan-Ellsberry, C.E., McLachlan, M.S., Arnot, J.A., Macleod, M., McKone, T.E., and
Wania, F. (2009), Modeling exposure to persistent chemicals in hazard and risk
assessment, Integrated Environmental Assessment and Management 5, 662-679.
Dyer, S.D., Bernhard, M.J., Cowan-Ellsberry, C., Perdu-Durand, E., Demmerle, S., and
Cravedi, J.-P. (2008), In vitro biotransformation of surfactants in fish. Part I: Linear
alkylbenzene sulfonate (C12-LAS) and alcohol ethoxylate (C13EO8), Chemosphere 72,
850-862.
Dyer, S.D., Bernhard, M.J., Cowan-Ellsberry, C., Perdu-Durand, E., Demmerle, S., and
Cravedi, J.-P. (2009), In vitro biotransformation of surfactants in fish, Part II - Alcohol
ethoxylate (C16EO8) and alcohol ethoxylate sulfate (C14EO2S) to estimate
bioconcentration potential, Chemosphere 76, 989-998.
Easterbrook, J., Lu, C., Sakai, Y., and Li, A.P. (2001), Effects of organic solvents on the
activities of cytochrome P450 isoforms, UDP-dependent glucuronyl transferase, and
phenol sulfotransferase in human hepatocytes, Drug Metabolism and Disposition 29, 141-
144.
ECHA (2017a), Guidance on Information Requirements and Chemical Safety Assessment
Chapter R.7c: Endpoint specific guidance. Version 30.
ECHA (2017b), Guidance on Information Requirements and Chemical Safety
Assessment Chapter R.11: PBT/vPvB assessment. Version 30.
ECHA (2017c), Non-animal approaches: Current status of regulatory applicability under
the REACH, CLP and Biocidal Products regulations.
Escher, B.I., Cowan-Ellsberry, C.E., Dyer, S., Embry, M.R., Erhardt, S., Halder, M.,
Kwon, J.-H., Johanning, K., Oosterwijk, M.T.T., Rutishauser, S., et al. (2011), Protein
and lipid binding parameters in Rainbow Trout (Oncorhynchus mykiss) blood and liver
fractions to extrapolate from an in vitro metabolic degradation assay to in vivo
bioaccumulation potential of hydrophobic organic chemicals, Chemical Research in
Toxicology 24, 1134-1143.
Fay, K.A., Fitzsimmons, P.N., Hoffman, A.D., and Nichols, J.W. (2014a), Optimizing the
use of rainbow trout hepatocytes for bioaccumulation assessments with fish, Xenobiotica
44, 345-351.
Fay, K.A., Fitzsimmons, P.N., Hoffman, A.D., and Nichols, J.W. (2016), Comparison of
trout hepatocytes and liver S9 fractions as in vitro models for predicting hepatic clearance
in fish, Environmental Toxicology and Chemistry.
ENV/JM/MONO(2018)12 │ 31
Unclassified
Fay, K.A., Mingoia, R.T., Goeritz, I., Nabb, D.L., Hoffman, A.D., Ferrell, B.D., Peterson,
H.M., Nichols, J.W., Segner, H., and Han, X. (2014b), Intra- and interlaboratory
reliability of a cryopreserved trout hepatocyte assay for the prediction of chemical
bioaccumulation potential, Environmental Science & Technology 48, 8170-8178.
Fay, K.A., Nabb, D.L., Mingoia, R.T., Bischof, I., Nichols, J.W., Segner, H., Johanning,
K., and Han, X. (2015), Determination of metabolic stability using cryopreserved
hepatocytes from rainbow trout (Oncorhynchus mykiss), Current Protocols in Toxicology
65, 4.42.41-44.42.29.
Godoy, P., Hewitt, N.J., Albrecht, U., Andersen, M.E., Ansari, N., Bhattacharya, S.,
Bode, J.G., Bolleyn, J., Borner, C., Bottger, J., et al. (2013), Recent advances in 2D and
3D in vitro systems using primary hepatocytes, alternative hepatocyte sources and non-
parenchymal liver cells and their use in investigating mechanisms of hepatotoxicity, cell
signaling and ADME, Archives of Toxicology 87, 1315-1530.
Gomez, C., Constantine, L., Moen, M., Vaz, A., Wang, W., and Huggett, D. (2011),
Ibuprofen Metabolism in the Liver and Gill of Rainbow Trout, Oncorhynchus mykiss,
Bulletin of Environmental Contamination and Toxicology 86, 247-251.
Gomez, C.F., Constantine, L., and Huggett, D.B. (2010), The influence of gill and liver
metabolism on the predicted bioconcentration of three pharmaceuticals in fish,
Chemosphere 81, 1189-1195.
González, J.F., Reimschuessel, R., Shaikh, B., and Kane, A.S. (2009), Kinetics of hepatic
phase I and II biotransformation reactions in eight finfish species, Marine Environmental
Research 67, 183-188.
Hallifax, D., Foster, J., and Houston, J.B. (2010), Prediction of human metabolic
clearance from in vitro systems: retrospective analysis and prospective view,
Pharmaceutical Research 27, 2150-2161.
Hallifax, D., and Houston, J.B. (2012), Evaluation of hepatic clearance prediction using
in vitro data: Emphasis on fraction unbound in plasma and drug ionisation using a
database of 107 drugs, Journal of Pharmaceutical Sciences 101, 2645-2652.
Hampton, J.A., Lantz, R.C., and Hinton, D.E. (1989), Functional units in rainbow trout
(Salmo gairdneri, Richardson) liver: III. Morphometric analysis of parenchyma, stroma,
and component cell types, American Journal of Anatomy 185, 58-73.
Han, X., Mingoia, R.T., Nabb, D.L., Yang, C.H., Snajdr, S.I., and Hoke, R.A. (2008),
Xenobiotic intrinsic clearance in freshly isolated hepatocytes from rainbow trout
(Oncorhynchus mykiss): determination of trout hepatocellularity, optimization of cell
concentrations and comparison of serum and serum-free incubations, Aquatic Toxicology
89, 11-17.
Han, X., Nabb, D.L., Mingoia, R.T., and Yang, C.H. (2007a), Determination of
xenobiotic intrinsic clearance in freshly isolated hepatocytes from rainbow trout
(Oncorhynchus mykiss) and rat and its application in bioaccumulation assessment,
Environmental Science & Technology 41, 3269-3276.
Han, X., Nabb, D.L., Yang, C.H., Snajdr, S.I., and Mingoia, R.T. (2009), Liver
microsomes and S9 from rainbow trout (Oncorhynchus mykiss): comparison of basal-
level enzyme activities with rat and determination of xenobiotic intrinsic clearance in
support of bioaccumulation assessment, Environmental Toxicology and Chemistry 28,
481-488.
32 │ ENV/JM/MONO(2018)12
Unclassified
James, M.O. (1987), Conjugation of organic pollutants in aquatic species, Environmental
Health Perspective 71, 97-103.
Johanning, K., Hancock, G., Escher, B., Adekola, A., Bernhard, M.J., Cowan-Ellsberry,
C., Domoradzki, J., Dyer, S., Eickhoff, C., Embry, M., et al. (2012), Assessment of
metabolic stability using the rainbow trout (Oncorhynchus mykiss) liver S9 fraction,
Current Protocols in Toxicology, 14.10.11-14.10.28.
Kwon, J.-H., Wuethrich, T., Mayer, P., and Escher, B.I. (2009), Development of a
dynamic delivery method for in vitro bioassays, Chemosphere 76, 83-90.
Ladd, M.A., Fitzsimmons, P.N., and Nichols, J.W. (2016), Optimization of a UDP-
glucuronosyltransferase assay for trout liver S9 fractions: activity enhancement by
alamethicin, a pore-forming peptide, Xenobiotica 46, 1066-1075.
Laue, H., Gfeller, H., Jenner, K.J., Nichols, J.W., Kern, S., and Natsch, A. (2014),
Predicting the bioconcentration of fragrance ingredients by rainbow trout using measured
rates of in vitro intrinsic clearance, Environmental Science & Technology 48, 9486-9495.
Lee, Y.-S., Lee, D.H.Y., Delafoulhouze, M., Otton, S.V., Moore, M.M., Kennedy, C.J.,
and Gobas, F.A.P.C. (2014), In vitro biotransformation rates in fish liver S9: Effect of
dosing techniques, Environmental Toxicology and Chemistry 33, 1885-1893.
Lee, Y.-S., Otton, S.V., Campbell, D.A., Moore, M.M., Kennedy, C.J., and Gobas,
F.A.P.C. (2011), Measuring in vitro biotransformation rates of super hydrophobic
chemicals in rat liver S9 fractions using thin-film sorbent-phase dosing, Environmental
Science & Technology 46, 410-418.
Li, A.P. (2007), Human hepatocytes: Isolation, cryopreservation and applications in drug
development, Chemico-Biological Interactions 168, 16-29.
Lo, J.C., Allard, G.N., Otton, S.V., Campbell, D.A., and Gobas, F.A. (2015),
Concentration dependence of biotransformation in fish liver S9: Optimizing substrate
concentrations to estimate hepatic clearance for bioaccumulation assessment,
Environmental Toxicology and Chemistry 34, 2782-2790.
Mingoia, R.T., Glover, K.P., Nabb, D.L., Yang, C.H., Snajdr, S.I., and Han, X. (2010),
Cryopreserved Hepatocytes from rainbow trout (Oncorhynchus mykiss): a validation
study to support their application in bioaccumulation assessment, Environmental Science
& Technology 44, 3052-3058.
Nendza, M., Aldenberg, T., Benfenati, E., Benigni, R., Cronin, M.T.D., Escher, S.,
Fernandez, A., Gabbert, S., Giralt, F., Hewitt, M., et al. (2010), Chapter 4 Data quality
assessment for in silico methods: A survey of approaches and needs, In In Silico
Toxicology: Principles and Applications (The Royal Society of Chemistry), pp. 59-117.
Nichols, J.W., Bonnell, M., Dimitrov, S.D., Escher, B.I., Han, X., and Kramer, N.I.
(2009), Bioaccumulation assessment using predictive approaches, Integrated
Environmental Assessment and Management 5, 577-597.
Nichols, J.W., Hoffman, A.D., ter Laak, T.L., and Fitzsimmons, P.N. (2013a), Hepatic
clearance of six polycyclic aromatic hydrocarbons by isolated perfused trout livers:
Prediction from in vitro clearance by liver S9 fractions, Toxicological Sciences 136, 359-
372.
Nichols, J.W., Huggett, D.B., Arnot, J.A., Fitzsimmons, P.N., and Cowan-Ellsberry, C.E.
(2013b), Towards improved models for predicting bioconcentration of well-metabolized
ENV/JM/MONO(2018)12 │ 33
Unclassified
compounds by rainbow trout using measured rates of in vitro intrinsic clearance,
Environmental Toxicology and Chemistry 32, 1611-1622.
Nichols, J.W., Ladd, M.A., and Fitzsimmons, P.N. (2017), Measurement of kinetic
parameters for biotransformation of polycyclic aromatic hydrocarbons by trout liver S9
fractions: implications for bioaccumulation assessment, Applied In Vitro Toxicology
Online Ahead of Print: May 22, 2017
Nichols, J.W., Schultz, I.R., and Fitzsimmons, P.N. (2006), In vitro-in vivo extrapolation
of quantitative hepatic biotransformation data for fish. I. A review of methods, and
strategies for incorporating intrinsic clearance estimates into chemical kinetic models,
Aquatic Toxicology 78, 74-90.
OECD (2000), Guidance document on aquatic toxicity testing of difficult substances and
mixtures. Series on Testing and Assessment, No. 23, ENV Publications, OECD, Paris.
OECD (2004), Test Guidelines No. 117, Partition Coefficient (n-octanol/water), High
Performance Liquid Chromatography (HPLC) Method, OECD Guidelines for the Testing
of Chemicals, Section 1, OECD Publishing, Paris.
OECD (2012), Test Guidelines No. 305, Bioaccumulation in Fish: Aqueous and Dietary
Exposure, OECD Guidelines for the Testing of Chemicals, Section 3, OECD Publishing,
Paris, http://dx.doi.org/10.1787/9789264185296-en.
OECD (2018a), Test Guideline No.319A: Determination of in vitro intrinsic clearance
using cryopreserved rainbow trout hepatocytes (RT-HEP), OECD Guidelines for the
Testing of Chemicals, Section 3, OECD Publishing, Paris.
OECD (2018b), Test Guideline No.319B: Determination of in vitro intrinsic clearance
using rainbow trout liver S9 sub-cellular fraction (RT-S9), OECD Guidelines for the
Testing of Chemicals, Section 3, OECD Publishing, Paris.
OECD (2018c), Multi-laboratory ring trial to support development of OECD test
guidelines on determination of in vitro intrinsic clearance using cryopreserved rainbow
trout hepatocytes and liver S9 sub-cellular fractions, Series on Testing and Assessment
No, 281, OECD Publishing, Paris.
Plakas, S.M., and James, M.O. (1990), Bioavailability, metabolism, and renal excretion of
benzoic acid in the channel catfish (Ictalurus punctatus), Drug Metabolism and
Disposition 18, 552-556.
Sakalli, S., Burkina, V., Zlabek, V., and Zamaratskaia, G. (2015), Effects of acetone,
acetonitrile, ethanol, methanol and DMSO on cytochrome P450 in rainbow trout
(Oncorhynchus mykiss) hepatic microsomes, Toxicology Mechanisms and Methods 25,
501-506.
Schultz, I.R., and Hayton, W.L. (1999), Interspecies scaling of the bioaccumulation of
lipophilic xenobiotics in fish: An example using trifluralin, Environmental Toxicology
and Chemistry 18, 1440-1449.
Stadnicka-Michalak, J., Tanneberger, K., Schirmer, K., and Ashauer, R. (2014),
Measured and modeled toxicokinetics in cultured fish cells and application to in vitro-in
vivo toxicity extrapolation, PLoS ONE 9, e92303.
Strobel, A., Burkhardt-Holm, P., Schmid, P., and Segner, H. (2015), Benzo(a)pyrene
metabolism and EROD and GST biotransformation activity in the liver of red- and white-
blooded antarctic fish, Environmental Science & Technology 49, 8022-8032.
34 │ ENV/JM/MONO(2018)12
Unclassified
Treu, G., Drost, W., Johncke, U., Rauert, C., and Schlechtriem, C. (2015), The Dessau
workshop on bioaccumulation: state of the art, challenges and regulatory implications,
Environmental Sciences Europe 27, 34.
U.S. Environmental Protection Agency, E.A.B.W., DC. (2013), Exposure Assessment
Tools and Models, Estimation Program Interface (EPI) Suite, Version 4.1.
Wood, F.L., Houston, J.B., and Hallifax, D. (2017), Clearance prediction methodology
needs fundamental improvement: trends common to rat and human
hepatocytes/microsomes and implications for experimental methodology, Drug
Metabolism and Disposition 45, 1178-1188.
ENV/JM/MONO(2018)12 │ 35
Unclassified
ANNEX 1 - Abbreviations
BCF Bioconcentration factor
BCFTOT Bioconcentration factor expressed on a total chemical basis (L/kg)
BCFFD,L Bioconcentration factor normalized for fish lipid content (L/kg lipid)
CFISH,SS chemical concentration in fish at steady state (mg/kg)
CLH in vivo hepatic clearance (L/d kg fish)
CHEP measured viable RT-HEP cell density (cells/mL)
CS9 S9 protein concentration (mg/mL)
CLIN VITRO, INT in vitro intrinsic clearance (mL/h/106 cells or mL/h/mg protein)
CLIN VIVO, INT in vivo intrinsic clearance (L/d/kg fish)
CYP Cytochrome P450
CW,FD chemical concentration dissolved in water (mg/L)
CW,TOT chemical concentration in water (mg/L)
DMEM Dulbecco’s modified Eagle’s medium
DMSO Dimethyl sulfoxide
EROD Ethoxyresorufin-O-deethylase
fU binding term used to correct for binding effects in vitro and in plasma
U,HEP free chemical fractions in the in vitro system (RT-HEP; unitless)
fU, P free chemical fractions in blood plasma (unitless)
U,S9 free chemical fractions in the in vitro system (RT-S9; unitless)
GC Gas Chromatography
GSH L-Glutathione
GST Glutathione transferase
HPLC High Performance Liquid Chromatography
IOCs Ionizable organic chemicals
IVIVE model In vitro-in vivo extrapolation model
ke Elimination rate constant determined from the slope of the log
transformed substrate depletion data (h-1)
kE Fecal egestion rate constant (d-1)
kG Growth rate constant (d-1)
36 │ ENV/JM/MONO(2018)12
Unclassified
KM Michaelis-Menten constant
kMET Whole-body biotransformation rate constant (d-1)
k1 Gill uptake rate constant (L/kg/d)
k2 Gill elimination rate constant (d-1)
log Kow n-Octanol-water partition coefficient
L-15 Leibovitz-15
LC Liquid Chromatography
LOQ Limit of quantification
LFBW Fractional liver weight (g liver/g fish)
LS9 S9 protein content of liver tissue (mg/g liver)
LHEP Liver hepatocyte content (106 cells/g liver)
MCSs Multi-constituent substances
MS Mass spectrometry
MTBE methyl tert-butyl ether
NADPH Nicotinamide adenine dinucleotide 2'-phosphate
PAHs Polycyclic aromatic hydrocarbons
PAPS Adenosine 3'-phosphate 5'-phosphosulfate
pKa Acid dissociation constant
QH Liver blood flow rate (mL/h/g liver)
RT-HEP Rainbow trout hepatocytes
RT-S9 Rainbow trout liver S9 sub-cellular fraction
SULT Sulfotransferase
TG Test Guideline
UDPGA Uridine 5'-diphosphoglucuronic acid
UGT Uridine 5'-diphospho-glucuronosyltransferase
UVCBs Substances of unknown or variable composition, complex reaction
products or biological materials
VD, BL chemical’s apparent volume of distribution (L/kg)
Vmax maximum enzymatic rate at saturating test chemical concentration
ENV/JM/MONO(2018)12 │ 37
Unclassified
ANNEX 2 - Recommendations on how to proceed in case of substantial
decreases of the test chemical in enzymatically inactive (heat-inactivated)
control incubations.
38 │ ENV/JM/MONO(2018)12
Unclassified
ANNEX 3 - Preparation of room temperature inactivated RT-S9
1. For certain chemicals the use of enzymatically inactive RT-S9 generated by heat-
inactivation as negative control may lead to substantial abiotic decrease in the control as
discussed in section 4.1.1. If the decrease of the test chemical is >20% in presence of
heat-inactivated RT-S9 which cannot be diminished as described in sections 3.6-3.8,
room-temperature inactivated (RTI) RT-S9 fractions may be used as an alternative
negative control.
2. This enzymatically inactive RT-S9 can be prepared by incubating active RT-S9 at
room temperature for 24 h as described below. Negative control incubations with RTI
RT-S9 are carried out in presence of alamethicin, but without addition of any cofactors.
3. To prepare RTI RT-S9, an appropriate volume of active RT-S9 is thawed and
diluted to 10.0 mg/mL protein by adding 100 mM potassium phosphate buffer, pH 7.8.
4. The vial(s) with the diluted RT-S9 are incubated for 24 h at room temperature for
inactivation and stored for at least 24 h at -20°C prior to use.
5. Negative control incubations with RTI RT-S9 should be carried out in presence of
alamethicin, but without addition of any cofactors. The final composition of the reaction
mixture for the RTI RT-S9 control in one 7 mL scintillation vial prior to dosing is as
follows:
a. 800 µL 100 mM K-PO4 buffer
b. 100 µL pre-diluted RTI S9 (10 mg/mL protein)
c. 100 µL 250 µg/mL alamethicin
6. Excess RTI RT-S9 material may be refrozen at -20°C for further use.
ENV/JM/MONO(2018)12 │ 39
Unclassified
ANNEX 4 - Potential reference chemicals for incubations using RT-HEP or
RT-S9
Table 1. Chemicals which may be applied for positive control incubations using RT-HEP or RT-S9.
Assay / Activity Phase Enzyme Test chemical Chemical class Reference
Ester cleavage I Esterase
fluroxypyr
methylheptyl ester,
haloxyfop methyl
ester
pesticide Cowan-Ellsberry
et al., 2008
Aromatic ring
hydroxylation I CYP3A testosterone hormone
Han et al., 2009;
Nabb et al., 2006
lauric acid
hydroxylation I
lauric acid fatty acid Nabb et al., 2006
Aryl hydrocarbon
hydroxylation I CYP pyrene PAH
Fay et al., 2017;
Nichols et al.,
2013; OECD, 2018
Aryl hydrocarbon
hydroxylation I CYP benzo[a]pyrene PAH
Fay et al., 2014;
Lo et al., 2015;
Nichols et al.,
2013
Hydroxylation,
gluruconidation,
sufation
I & II CYP,
UGT, ST 4-n-nonylphenol alkylphenol
Coldham et al.,
1998; Fay et al.,
2014; Mingoia et
al., 2010; OECD,
2018
O-demethylation,
hydroxylation,
glucuronidation
I & II CYP,
UGT methoxychlor pesticide
Bischof et al.,
2016;; Fay et al.,
2014
fenthion pesticide Fay et al., 2014
Hydroxylation,
glucuronidation I & II
CYP,
UGT cyclohexyl salicylate
fragrance
chemical
Laue et al., 2014;
OECD, 2018
Glucuronidation,
sulfation II
UGT,
SULT 7-hydroxy-coumarin
Laue et al., 2014
Hydroxylation
CYP propranolol diclofenac
pharmaceutical
Chen et al., 2016;
Connors et al.,
2013a; Connors et
al., 2013b
40 │ ENV/JM/MONO(2018)12
Unclassified
References
Bischof, I., Koster, J., Segner, H., and Schlechtriem, C. (2016), Hepatocytes as in vitro
test system to investigate metabolite patterns of pesticides in farmed rainbow trout and
common carp: Comparison between in vivo and in vitro and across species. Comparative
Biochemistry and Physiology Part C: Toxicology & Pharmacology 187, 62-73.
Chen, Y., Hermens, J.L.M., Jonker, M.T.O., Arnot, J.A., Armitage, J.M., Brown, T.,
Nichols, J.W., Fay, K.A., and Droge, S.T.J. (2016), Which molecular features affect the
intrinsic hepatic clearance rate of ionizable organic chemicals in fish? Environmental
Science & Technology 50, 12722-12731.
Coldham, N.G., Sivapathasundaram, S., Dave, M., Ashfield, L.A., Pottinger, T.G.,
Goodall, C., and Sauer, M.J. (1998), Biotransformation, tissue distribution, and
persistence of 4-nonylphenol residues in juvenile rainbow trout (Oncorhynchus mykiss),
Drug Metabolism and Disposition 26, 347-354.
Connors, K.A., Du, B., Fitzsimmons, P.N., Chambliss, C.K., Nichols, J.W., and Brooks,
B.W. (2013a), Enantiomer-specific in vitro biotransformation of select pharmaceuticals in
rainbow trout (Oncorhynchus mykiss), Chirality 25, 763-767
Connors, K.A., Du, B., Fitzsimmons, P.N., Hoffman, A.D., Chambliss, C.K., Nichols,
J.W., and Brooks, B.W. (2013b), Comparative pharmaceutical metabolism by rainbow
trout (Oncorhynchus mykiss) liver S9 fractions. Environmental Toxicology and
Chemistry 32, 1810-1818.
Cowan-Ellsberry, C.E., Dyer, S.D., Erhardt, S., Bernhard, M.J., Roe, A.L., Dowty, M.E.,
and Weisbrod, A.V. (2008), Approach for extrapolating in vitro metabolism data to refine
bioconcentration factor estimates. Chemosphere 70, 1804-1817.
Fay, K.A., Fitzsimmons, P.N., Hoffman, A.D., and Nichols, J.W. (2017), Comparison of
trout hepatocytes and liver S9 fractions as in vitro models for predicting hepatic clearance
in fish. Environmental Toxicology and Chemistry 36, 463-471.
Fay, K.A., Mingoia, R.T., Goeritz, I., Nabb, D.L., Hoffman, A.D., Ferrell, B.D., Peterson,
H.M., Nichols, J.W., Segner, H., and Han, X. (2014), Intra- and interlaboratory reliability
of a cryopreserved trout hepatocyte assay for the prediction of chemical bioaccumulation
potential. Environmental Science & Technology 48, 8170-8178.
Han, X., Nabb, D.L., Yang, C.H., Snajdr, S.I., and Mingoia, R.T. (2009), Liver
microsomes and S9 from rainbow trout (Oncorhynchus mykiss): comparison of basal-
level enzyme activities with rat and determination of xenobiotic intrinsic clearance in
support of bioaccumulation assessment. Environmental Toxicology and Chemistry 28,
481-488.
Laue, H., Gfeller, H., Jenner, K.J., Nichols, J.W., Kern, S., and Natsch, A. (2014),
Predicting the bioconcentration of fragrance ingredients by rainbow trout using measured
rates of in vitro intrinsic clearance. Environmental Science & Technology 48, 9486-9495.
Lo, J.C., Allard, G.N., Otton, S.V., Campbell, D.A., and Gobas, F.A. (2015),
Concentration dependence of biotransformation in fish liver S9: Optimizing substrate
concentrations to estimate hepatic clearance for bioaccumulation assessment.
Environmental Toxicology and Chemistry 34, 2782-2790.
Mingoia, R.T., Glover, K.P., Nabb, D.L., Yang, C.H., Snajdr, S.I., and Han, X. (2010),
Cryopreserved Hepatocytes from rainbow trout (Oncorhynchus mykiss): a validation
ENV/JM/MONO(2018)12 │ 41
Unclassified
study to support their application in bioaccumulation assessment. Environmental Science
& Technology 44, 3052-3058.
Nabb, D.L., Mingoia, R.T., Yang, C.-H., and Han, X. (2006), Comparison of basal level
metabolic enzyme activities of freshly isolated hepatocytes from rainbow trout
(Oncorhynchus mykiss) and rat. Aquatic Toxicology 80, 52-59.
Nichols, J.W., Hoffman, A.D., ter Laak, T.L., and Fitzsimmons, P.N. (2013), Hepatic
clearance of six polycyclic aromatic hydrocarbons by isolated perfused trout livers:
Prediction from in vitro clearance by liver S9 fractions. Toxicological Sciences 136, 359-
372.
OECD (2018), Multi-laboratory ring trial to support development of OECD test
guidelines on determination of in vitro intrinsic clearance using cryopreserved rainbow
trout hepatocytes and liver S9 sub-cellular fractions, Series on Testing and Assessment
No, 281, OECD Publishing, Paris.
42 │ ENV/JM/MONO(2018)12
Unclassified
ANNEX 5 - Spreadsheets for calculation of BCFs for methoxychlor as
example using the hepatocyte-bioconcentration factor model (HEP-BCF) and
the S9-bioconcentration factor (S9-BCF) model
Note: The HEP-BCF and the S9-BCF models from Nichols et al. is given as example.
Additional details and full references for the model equations are available in Nichols et
al. (Nichols et al., 2013).
Table 1. Independent variable inputs to be set to the hepatocyte-bioconcentration factor
(HEP-BCF) model for the BCF prediction of methoxychlor as example (Nichols et al., 2013).
Parameter Value Units
Log Kow of test chemical1 5.1 Unitless
Body weight of fish used as source of hepatocytes2 364 g
Hepatocyte cell number (CHEP)3 2.2 × 10⁶ cells/mL
Reaction rate (Rate) 0.128 h-1
Modelled temperature (T) 12 Celsius
Total aqueous chemical concentration (Cw, TOT)2 1.0 mg/L
1log Kow of test chemical can be measured or estimated 2does not impact BCF calculations 3final cell number was verified by recounting
Table 2. Independent variable inputs to be set to the S9 bioconcentration factor (S9-BCF)
model for the BCF prediction of methoxychlor as example (Nichols et al., 2013).
Parameter Value Units
Log Kow of test chemical1 5.1 Unitless
Body weight of fish used as source of S92 310 g
S9 protein concentration (CS9) in the assay 1.0 mg/mL
Reaction rate (Rate) 0.359 h-1
Modelled temperature (T) 12 Celsius
Total aqueous chemical concentration (Cw, TOT)2 1.0 mg/L
1log Kow of test chemical can be measured or estimated 2does not impact BCF calculations
ENV/JM/MONO(2018)12 │ 43
Unclassified
Table 3. Spreadsheet of the HEP-BCF model using the full modeled binding assumption
applied to predict the BCF of methoxychlor as example.1
1Parameters in red have to be set for each experiment (see Tab. 1). The full modelled binding assumption
(i.e., fU = fU,P/fU,HEP is explained in §66 and in Nichols et al. (Nichols et al., 2013).
Hepatocyte substrate depletion (linear) data; Standard fish The BCF portion of this model incorporates the Arnot and Gobas (2003)
Hepatocyte spreadsheet_Public_062617 model equations
Input Parameters for the source of in vitro data
Parameter Value Units
Reaction rate (Rate) 0.1275597 1/h Determined from the slope of the log-transformed substrate depletion data
Fish body weight in grams (BwgHEP) 364 g Hepatocyte donor fish
Hepatocyte concentration (CHEP) 2.2 106 cells/ml Set by researcher
Liver hepatocyte content (LHEP) 510 106 cells/g liver Avg. of values for juvenile males and females (Nichols et al., 2013)
Inputs for the modeled fish (10 g fish, 5% lipid, @ 15 C) Modeled after fish commonly used for BCF testing. These are also the parameters assumed by Arnot et al. (2008)
for his evaluation of measured BCFs (from which Jon estimated apparent whole-body KMET values)
Parameter Value Units
Modeled body weight in grams (BwgM) 10 g Standard value (assumed)
Modeled body weight in kilograms (BwkgM) 0.01 kg Calculated from previous
Modeled temperature (T) 12 C Assumed
Fractional liver weight (LFBW) 0.015 g liver/g fish From Schultz et al. (1999)
Liver blood flow as fraction of cardiac output (QHFRAC) 0.259 Unitless From Nichols et al. (1990)
Fractional whole-body lipid content (vLWB) 0.05 Unitless Assumed
Fractional blood water content (vWBL) 0.84 Unitless From Bertelsen et al. (1998)
Additional Input Parameters
Parameter Value Units
Log KOW 5.1 Unitless
Total aqueous chemical conc. (CW,TOT) 1 mg/l
Dissolved organic carbon (CDOC) 0.0000046 kg/L From US EPA (2003) Table 6-10, mean of all types
Particulate orgaic carbon (CPOC) 0.000001 kg/L From US EPA (2003) Table 6-10, mean of all types
POC binding constant (αPOC) 0.35 Unitless From Seth et al. (1999), cited by Arnot and Gobas (2004)
DOC binding constant (αDOC) 0.08 Unitless From Burkhard et al. (2000)
Calculated Parameters Equations
Parameter Value Units
KOW 125892.54118 Unitless KOW = 10^Log KOW
Blood:water partition coefficient (PBW) 846.35240 Unitless PBW = (10^(0.73*Log KOW) * 0.16) + vWBL
Binding correction term (fU) 0.01632 Unitless fU= (vWBL/PBW)/((CHEP/2)/(10^(0.676*Log KOW - 2.215) + 1.0))
Binding correction term assuming fu = 1.0 (fu,1) 1.00000 Unitless fu=1.0
Partitioning-based BCF (BCFP) 6294.62706 BCFP = vLWB*KOW
Volume of distribution ref. to blood plasma (VD,BL) 7.44 l/kg VD,BL = BCFP/PBW
In vitro intrinsic clearance (CLIN VITRO,INT) 0.06 ml/h/106 cells CLIN VITRO,INT = Rate/CHEP
In vivo intrinsic clearance (CLIN VIVO,INT) 10.6454 l/d/kg fish (or ml/d/g fish) CLINVITROINT * LHEP * LFBW * 24
Scaled clearance for 10 g fish (CLIN VITRO,INT,10) 10.6454 l/d/kg fish (or ml/d/g fish) CLIN VIVO,INT,10 = CLIN VIVO,INT * ((BwgM/BwgHEP)^0)
weight-normalized clearance is constant across body sizes (allometric exponent set to 0)
Alternative assumptions are implemented by changing the exponent to a user-assigned
value (in cell 74C)
Temperature adjusted Cardiac output (QC) 70.2706 l/d/kg fish QC = (((0.23*T)-0.78)*(BwgM/500)^-0.1)*24
Liver blood flow (QH) 18.2001 l/d/kg fish QH = QC*QHFRAC
Hepatic clearance (CLH) 0.1721 l/d/kg fish CLH = ((QH*fU*CLIN VIVO,INT,10)/(QH+(fU*CLIN VIVO,INT,10)))
To adopt the assumption that binding is functionally identical in vitro and in plasma
the user must manually change the term "fu" to "fuone" in the equation (in cell 82C)
Whole-body metabolism rate (kMET) 0.0231 /d kMET = CLH/VD,BL
Chemical concentration dissolved in water (CW,FD) 0.917102345 mg/l CW,FD = CW,TOT *(1/(1+CDOC*αDOC*KOW+CPOC*αPOC*KOW))
Gill uptake rate constant (k1) 630.456555 l/kg/d k1 = 1/((0.01 + 1/KOW)*BwkgM^0.4)
Gill elimination rate constant (k2) 0.100157888 /d k2 = k1/(vLWB*KOW)
Fecal egestion rate constant (kE) 0.00510752 /d kE = 0.125*(0.02*BwkgM^-0.15*e(0.06*T))/(0.000000051*KOW + 2)
Growth rate constant (kG) 0 /d KG = 0 (or 0.000502*BwkgM^-0.2 as in BCFBAF)
Concentration in fish (CFISH,SS) 4503.067125 mg/kg CFISH,SS = (k1*CW,FD)/(k2+kMETAB+kG+kE)
BCF, on a total conc basis, w/out lipid norm. (BCFTOT) 4503.067125 l/kg or ml/g BCFTOT = CFISH,SS/CW,TOT
BCF, on freely diss. basis, norm. for fish lipid (BCFFD,L) 98202.06332 l/kg lipid or ml/g lipid BCFFD,L = CFISH,SS/(CW,FD*vLWB)
44 │ ENV/JM/MONO(2018)12
Unclassified
Table 4. Spreadsheet of the HEP-BCF model using the binding assumption U=1.0 applied to
predict the BCF of methoxychlor as example.1
1Parameters in red have to be set for each experiment (see Tab. 1). To adopt the assumption that binding is
functionally identical in vitro and in plasma (see §66), the term "fu" was manually changed to "fuone" in the
equation for calculation of hepatic clearance (CLH) (Nichols et al., 2013).
Hepatocyte substrate depletion (linear) data; Standard fish The BCF portion of this model incorporates the Arnot and Gobas (2003)
Hepatocyte spreadsheet_Public_062617 model equations
Input Parameters for the source of in vitro data
Parameter Value Units
Reaction rate (Rate) 0.1275597 1/h Determined from the slope of the log-transformed substrate depletion data
Fish body weight in grams (BwgHEP) 364 g Hepatocyte donor fish
Hepatocyte concentration (CHEP) 2.2 106 cells/ml Set by researcher
Liver hepatocyte content (LHEP) 510 106 cells/g liver Avg. of values for juvenile males and females (Nichols et al., 2013)
Inputs for the modeled fish (10 g fish, 5% lipid, @ 15 C) Modeled after fish commonly used for BCF testing. These are also the parameters assumed by Arnot et al. (2008)
for his evaluation of measured BCFs (from which Jon estimated apparent whole-body KMET values)
Parameter Value Units
Modeled body weight in grams (BwgM) 10 g Standard value (assumed)
Modeled body weight in kilograms (BwkgM) 0.01 kg Calculated from previous
Modeled temperature (T) 12 C Assumed
Fractional liver weight (LFBW) 0.015 g liver/g fish From Schultz et al. (1999)
Liver blood flow as fraction of cardiac output (QHFRAC) 0.259 Unitless From Nichols et al. (1990)
Fractional whole-body lipid content (vLWB) 0.05 Unitless Assumed
Fractional blood water content (vWBL) 0.84 Unitless From Bertelsen et al. (1998)
Additional Input Parameters
Parameter Value Units
Log KOW 5.1 Unitless
Total aqueous chemical conc. (CW,TOT) 1 mg/l
Dissolved organic carbon (CDOC) 0.0000046 kg/L From US EPA (2003) Table 6-10, mean of all types
Particulate orgaic carbon (CPOC) 0.000001 kg/L From US EPA (2003) Table 6-10, mean of all types
POC binding constant (αPOC) 0.35 Unitless From Seth et al. (1999), cited by Arnot and Gobas (2004)
DOC binding constant (αDOC) 0.08 Unitless From Burkhard et al. (2000)
Calculated Parameters Equations
Parameter Value Units
KOW 125892.54118 Unitless KOW = 10^Log KOW
Blood:water partition coefficient (PBW) 846.35240 Unitless PBW = (10^(0.73*Log KOW) * 0.16) + vWBL
Binding correction term (fU) 0.01632 Unitless fU= (vWBL/PBW)/((CHEP/2)/(10^(0.676*Log KOW - 2.215) + 1.0))
Binding correction term assuming fu = 1.0 (fu,1) 1.00000 Unitless fu=1.0
Partitioning-based BCF (BCFP) 6294.62706 BCFP = vLWB*KOW
Volume of distribution ref. to blood plasma (VD,BL) 7.44 l/kg VD,BL = BCFP/PBW
In vitro intrinsic clearance (CLIN VITRO,INT) 0.06 ml/h/106 cells CLIN VITRO,INT = Rate/CHEP
In vivo intrinsic clearance (CLIN VIVO,INT) 10.6454 l/d/kg fish (or ml/d/g fish)CLINVITROINT * LHEP * LFBW * 24
Scaled clearance for 10 g fish (CLIN VITRO,INT,10) 10.6454 l/d/kg fish (or ml/d/g fish)CLIN VIVO,INT,10 = CLIN VIVO,INT * ((BwgM/BwgHEP)^0)
weight-normalized clearance is constant across body sizes (allometric exponent set to 0)
Alternative assumptions are implemented by changing the exponent to a user-assigned
value (in cell 74C)
Temperature adjusted Cardiac output (QC) 70.2706 l/d/kg fish QC = (((0.23*T)-0.78)*(BwgM/500)^-0.1)*24
Liver blood flow (QH) 18.2001 l/d/kg fish QH = QC*QHFRAC
Hepatic clearance (CLH) 6.7167 l/d/kg fish CLH = ((QH*fU*CLIN VIVO,INT,10)/(QH+(fU*CLIN VIVO,INT,10)))
To adopt the assumption that binding is functionally identical in vitro and in plasma
the user must manually change the term "fu" to "fuone" in the equation (in cell 82C)
Whole-body metabolism rate (kMET) 0.9031 /d kMET = CLH/VD,BL
Chemical concentration dissolved in water (CW,FD) 0.917102345 mg/l CW,FD = CW,TOT *(1/(1+CDOC*αDOC*KOW+CPOC*αPOC*KOW))
Gill uptake rate constant (k1) 630.456555 l/kg/d k1 = 1/((0.01 + 1/KOW)*BwkgM^0.4)
Gill elimination rate constant (k2) 0.100157888 /d k2 = k1/(vLWB*KOW)
Fecal egestion rate constant (kE) 0.00510752 /d kE = 0.125*(0.02*BwkgM^-0.15*e(0.06*T))/(0.000000051*KOW + 2)
Growth rate constant (kG) 0 /d KG = 0 (or 0.000502*BwkgM^-0.2 as in BCFBAF)
Concentration in fish (CFISH,SS) 573.3919884 mg/kg CFISH,SS = (k1*CW,FD)/(k2+kMETAB+kG+kE)
BCF, on a total conc basis, w/out lipid norm. (BCFTOT) 573.3919884 l/kg or ml/g BCFTOT = CFISH,SS/CW,TOT
BCF, on freely diss. basis, norm. for fish lipid (BCFFD,L) 12504.42749 l/kg lipid or ml/g lipidBCFFD,L = CFISH,SS/(CW,FD*vLWB)
ENV/JM/MONO(2018)12 │ 45
Unclassified
Table 5. Spreadsheet of the S9-BCF model using the full modeled binding assumption
applied to predict the BCF of methoxychlor as example.1
1Parameters in red have to be set for each experiment (see Tab. 1). The full modelled binding assumption
(i.e., fU = fU,P/ fU,S9 is explained in §66 and by Nichols et al. (Nichols et al., 2013).
S9 substrate depletion (linear) data; Standard fish The BCF portion of this model incorporates the Arnot and Gobas (2003)
S9 spreadsheet_Public_062713 model equations
Input Parameters for the source of in vitro data
Parameter Value Units
Reaction rate (Rate) 0.3593967 1/h Determined from the slope of the log-transformed substrate depletion data
Fish body weight in grams (BwgS9) 310 g S9 Donor fish
S9 Protein concentration (CS9) 1 mg/ml Set by researcher
Liver S9 protein content (LS9) 163 mg/g liver Avg. of recovery corrected values obtained using the G6P
and CYP content assays (Nichols et al., 2013)
Inputs for the modeled fish (10 g fish, 5% lipid, @ 15 C) Modeled after fish commonly used for BCF testing. These are also the parameters assumed by Arnot et al. (2008)
for his evaluation of measured BCFs (from which Jon estimated apparent whole-body KMET values)
Parameter Value Units
Modeled body weight in grams (BwgM) 10 g Standard value (assumed)
Modeled body weight in kilograms (BwkgM) 0.01 kg Calculated from previous
Modeled temperature (T) 12 C Assumed
Fractional liver weight (LFBW) 0.015 g liver/g fish From Schultz et al. (1999)
Liver blood flow as fraction of cardiac output (QHFRAC) 0.259 Unitless From Nichols et al. (1990)
Fractional whole-body lipid content (vLWB) 0.05 Unitless Assumed
Fractional blood water content (vWBL) 0.84 Unitless From Bertelsen et al. (1998)
Additional Input Parameters
Parameter Value Units
Log KOW 5.1 Unitless
Total aqueous chemical conc. (CW,TOT) 1 mg/l
Dissolved organic carbon (CDOC) 0.0000046 kg/L From US EPA (2003) Table 6-10, mean all types
Particulate orgaic carbon (CPOC) 0.000001 kg/L From US EPA (2003) Table 6-10, mean all types
POC binding constant (αPOC) 0.35 Unitless From Seth et al. (1999), cited by Arnot and Gobas (2004)
DOC binding constant (αDOC) 0.08 Unitless From Burkhard et al. (2000)
Calculated Parameters Equations
Parameter Value Units
KOW 125892.54118 Unitless KOW = 10^Log KOW
Blood:water partition coefficient (PBW) 846.35240 Unitless PBW = (10^(0.73*Log KOW) * 0.16) + vWBL
Binding correction term (fU) 0.02488 Unitless fU= (vWBL/PBW)/(1/(CS9*10^(0.694*Log KOW - 2.158) + 1.0))
Binding correction term, assuming fu = 1.0 (fu,1) 1.00000 Unitless fU=1.0
Partitioning based BCF (BCFP) 6294.62706 l/kg BCFP = vLWB*KOW
Volume of distribution ref. to blood plasma (VD,BL) 7.44 l/kg VD,BL = BCFP/PBW
In vitro intrinsic clearance (CLIN VITRO,INT) 0.36 ml/h/mg S9 protein CLIN VITRO,INT = Rate/CS9
In vivo intrinsic clearance (CLIN VIVO,INT) 21.0894 l/d/kg fish (or ml/d/g fish)CLIN VITRO,INT * LS9 * LFBW * 24
Scaled clearance for 10 g fish (CLIN VIVO,INT,10) 21.0894 l/d/kg fish (or ml/d/g fish)CLIN VIVO,INT,10 = CLIN VIVO,INT * ((BwgM/BwgS9)^0)
weight-normalized clearance is constant across body sizes (allometric exponent set to 0)
Alternative assumptions are implemented by changing the exponent to a user-assigned
value (in cell 74C)
Temperature adjusted Cardiac output (QC) 70.2706 l/d/kg fish QC = (((0.23*T)-0.78)*(BwgM/500)^-0.1)*24
Liver blood flow (QH) 18.2001 l/d/kg fish QH = QC*QHFRAC
Hepatic clearance (CLH) 0.5100 l/d/kg fish CLH = ((QH*fU*CLIN VIVO,INT,10)/(QH+(fU*CLIN VIVO,INT,10)))
To adopt the assumption that binding is functionally identical in vitro and in plasma
the user must manually change the term "fu" to "fuone" in the equation (in cell 82C)
Whole-body metabolism rate (kMET) 0.0686 /d kMET = CLH/VD,BL
Chemical concentration dissolved in water (CW,FD) 0.917102345 mg/l CW,FD = CW,TOT *(1/(1+CDOC*αDOC*KOW+CPOC*αPOC*KOW))
Gill uptake rate constant (k1) 630.456555 l/kg/d k1 = 1/((0.01 + 1/KOW)*BwkgM^0.4)
Gill elimination rate constant (k2) 0.100157888 /d k2 = k1/(vLWB*KOW)
Fecal egestion rate constant (kE) 0.00510752 /d kE = 0.125*(0.02*BwkgM^-0.15*e(0.06*T))/(0.000000051*KOW + 2)
Growth rate constant (kG) 0 /d kG = 0 (or 0.000502*BwkgM^-0.2 as in BCFBAF)
Concentration in fish (CFISH,SS) 3326.16137 mg/kg CFISH,SS = (k1*CW,FD)/(k2+kMETAB+kG+kE)
BCF, on a total conc basis, w/out lipid norm. (BCFTOT) 3326.16137 l/kg or ml/g BCFTOT = CFISH,SS/CW,TOT
BCF, on freely diss. basis, norm. for fish lipid (BCFFD,L) 72536.31812 l/kg lipid or ml/g lipid BCFFD,L = CFISH,SS/(CW,FD*vLWB)
46 │ ENV/JM/MONO(2018)12
Unclassified
Table 6. Spreadsheet of the S9-BCF model using the binding assumption U=1.0 applied to
predict the BCF of methoxychlor as example.1
1Parameters in red have to be set for each experiment (see Tab. 1). To adopt the assumption that binding is
functionally identical in vitro and in plasma (see §66), the term "fu" was manually changed to "fuone" in the
equation for calculation of hepatic clearance (CLH) (Nichols et al., 2013).
S9 substrate depletion (linear) data; Standard fish The BCF portion of this model incorporates the Arnot and Gobas (2003)
S9 spreadsheet_Public_062713 model equations
Input Parameters for the source of in vitro data
Parameter Value Units
Reaction rate (Rate) 0.3593967 1/h Determined from the slope of the log-transformed substrate depletion data
Fish body weight in grams (BwgS9) 310 g S9 Donor fish
S9 Protein concentration (CS9) 1 mg/ml Set by researcher
Liver S9 protein content (LS9) 163 mg/g liver Avg. of recovery corrected values obtained using the G6P
and CYP content assays (Nichols et al., 2013)
Inputs for the modeled fish (10 g fish, 5% lipid, @ 15 C) Modeled after fish commonly used for BCF testing. These are also the parameters assumed by Arnot et al. (2008)
for his evaluation of measured BCFs (from which Jon estimated apparent whole-body KMET values)
Parameter Value Units
Modeled body weight in grams (BwgM) 10 g Standard value (assumed)
Modeled body weight in kilograms (BwkgM) 0.01 kg Calculated from previous
Modeled temperature (T) 12 C Assumed
Fractional liver weight (LFBW) 0.015 g liver/g fish From Schultz et al. (1999)
Liver blood flow as fraction of cardiac output (QHFRAC) 0.259 Unitless From Nichols et al. (1990)
Fractional whole-body lipid content (vLWB) 0.05 Unitless Assumed
Fractional blood water content (vWBL) 0.84 Unitless From Bertelsen et al. (1998)
Additional Input Parameters
Parameter Value Units
Log KOW 5.1 Unitless
Total aqueous chemical conc. (CW,TOT) 1 mg/l
Dissolved organic carbon (CDOC) 0.0000046 kg/L From US EPA (2003) Table 6-10, mean all types
Particulate orgaic carbon (CPOC) 0.000001 kg/L From US EPA (2003) Table 6-10, mean all types
POC binding constant (αPOC) 0.35 Unitless From Seth et al. (1999), cited by Arnot and Gobas (2004)
DOC binding constant (αDOC) 0.08 Unitless From Burkhard et al. (2000)
Calculated Parameters Equations
Parameter Value Units
KOW 125892.54118 Unitless KOW = 10^Log KOW
Blood:water partition coefficient (PBW) 846.35240 Unitless PBW = (10^(0.73*Log KOW) * 0.16) + vWBL
Binding correction term (fU) 0.02488 Unitless fU= (vWBL/PBW)/(1/(CS9*10^(0.694*Log KOW - 2.158) + 1.0))
Binding correction term, assuming fu = 1.0 (fu,1) 1.00000 Unitless fU=1.0
Partitioning based BCF (BCFP) 6294.62706 l/kg BCFP = vLWB*KOW
Volume of distribution ref. to blood plasma (VD,BL) 7.44 l/kg VD,BL = BCFP/PBW
In vitro intrinsic clearance (CLIN VITRO,INT) 0.36 ml/h/mg S9 protein CLIN VITRO,INT = Rate/CS9
In vivo intrinsic clearance (CLIN VIVO,INT) 21.0894 l/d/kg fish (or ml/d/g fish)CLIN VITRO,INT * LS9 * LFBW * 24
Scaled clearance for 10 g fish (CLIN VIVO,INT,10) 21.0894 l/d/kg fish (or ml/d/g fish)CLIN VIVO,INT,10 = CLIN VIVO,INT * ((BwgM/BwgS9)^0)
weight-normalized clearance is constant across body sizes (allometric exponent set to 0)
Alternative assumptions are implemented by changing the exponent to a user-assigned
value (in cell 74C)
Temperature adjusted Cardiac output (QC) 70.2706 l/d/kg fish QC = (((0.23*T)-0.78)*(BwgM/500)^-0.1)*24
Liver blood flow (QH) 18.2001 l/d/kg fish QH = QC*QHFRAC
Hepatic clearance (CLH) 9.7692 l/d/kg fish CLH = ((QH*fU*CLIN VIVO,INT,10)/(QH+(fU*CLIN VIVO,INT,10)))
To adopt the assumption that binding is functionally identical in vitro and in plasma
the user must manually change the term "fu" to "fuone" in the equation (in cell 82C)
Whole-body metabolism rate (kMET) 1.3135 /d kMET = CLH/VD,BL
Chemical concentration dissolved in water (CW,FD) 0.917102345 mg/l CW,FD = CW,TOT *(1/(1+CDOC*αDOC*KOW+CPOC*αPOC*KOW))
Gill uptake rate constant (k1) 630.456555 l/kg/d k1 = 1/((0.01 + 1/KOW)*BwkgM^0.4)
Gill elimination rate constant (k2) 0.100157888 /d k2 = k1/(vLWB*KOW)
Fecal egestion rate constant (kE) 0.00510752 /d kE = 0.125*(0.02*BwkgM^-0.15*e(0.06*T))/(0.000000051*KOW + 2)
Growth rate constant (kG) 0 /d kG = 0 (or 0.000502*BwkgM^-0.2 as in BCFBAF)
Concentration in fish (CFISH,SS) 407.521917 mg/kg CFISH,SS = (k1*CW,FD)/(k2+kMETAB+kG+kE)
BCF, on a total conc basis, w/out lipid norm. (BCFTOT) 407.521917 l/kg or ml/g BCFTOT = CFISH,SS/CW,TOT
BCF, on freely diss. basis, norm. for fish lipid (BCFFD,L) 8887.163345 l/kg lipid or ml/g lipid BCFFD,L = CFISH,SS/(CW,FD*vLWB)
ENV/JM/MONO(2018)12 │ 47
Unclassified
References
Nichols, J.W., D.B. Huggett, J.A. Arnot, P.N. Fitzsimmons and C.E. Cowan-Ellsberry
(2013). Towards improved models for predicting bioconcentration of well-metabolized
compounds by rainbow trout using measured rates of in vitro intrinsic clearance.
Environmental Toxicology and Chemistry 32: 1611-1622.