Page 1
I. Result Indicator Fiches EN.doc
1
Guidance note I – Result Indicator Fiches
This guidance note presents a fiche for each result indicator in the CMEF. Each fiche contains the
following elements:
Type of indicator
Related measure
Measure Code
Definition of the indicator
Subdivision
Unit of measurement
Level of collection
Responsible actor for collection
Collection method/good practice
Source
Registration frequency
RESULT INDICATORS (CMEF)
Axis/Objective Indicator
Improving the competitiveness of
the agricultural and forestry sector
(1) Number of participants that successfully ended a training
activity related to agriculture and/or forestry
(2) Increase in agricultural gross value added in supported
farms
(3) Number of holdings introducing new products and/or new
techniques
(4) Value of agricultural production under recognized quality
label/standards
(5) Number of farms entering the market
Improving the environment and
the countryside through land
management
(6) Area under successful land management contributing to:
(a) bio diversity and high nature value
farming/forestry
(b) water quality
(c) mitigating climate change
(d) soil quality
(e) avoidance of marginalisation and land
abandonment
Improving the quality of life in
rural areas and encouraging
diversification of economic activity
(7) Increase in non-agricultural gross value added in supported
businesses
(8) Gross number of jobs created
(9) Additional number of tourists
(10) Population in rural areas benefiting from improved services
(11) Increase in internet penetration in rural areas
(12) Number of participants that successfully ended a training
activity
Page 2
I. Result Indicator Fiches EN.doc
2
AXIS 1 IMPROVING THE COMPETITIVENESS OF THE
AGRICULTURAL AND FORESTRY SECTOR
RESULT INDICATOR 01. NUMBER OF PARTICIPANTS THAT SUCCESSFULLY ENDED A
TRAINING ACTIVITY RELATED TO AGRICULTURE AND/OR FORESTRY
Type of indicator
Result indicator for axis 1, subsection 1 (improving the competitiveness of
the agricultural and forestry sector by promoting knowledge and improving
human potential)
Related measure Vocational training and information actions, including diffusion of scientific
knowledge and innovative practises, for persons engaged in the
agricultural, food and forestry sectors (Article 20 (a) (i) of Reg. (EC) N°
1698/2005)
Measure Code 111
Definition of the
indicator
What is a successfully ended training result?
A first condition is that the participant must have ended the full training session/
programme. Than a successful result can be:
- Receiving a (quality)certificate, degree or diploma after finishing the
training
- Applying the achieved skills in practice. Examples:
o Reconversion
o Alternative activities
o Improving production methods (e.g. using new machine that
rationalises production)
o Introducing more ICT applications for the management of the
farm (e.g. bookkeeping, …)
o Introducing environmental methods/ practices
Subdivision Division according to:
gender (male/female)
age category
- age < 40
- 40 ≤ age
type of successful result
- passing by achieving certificate, degree or diploma
- implementing the achieved skills
type of participants
- participants engaged in farming
- participants engaged in food industry
- participants engaged in forestry
Unit of measurement Unique number of persons
Page 3
I. Result Indicator Fiches EN.doc
3
Level of collection Project level
Responsible actor for
collection
Project managers. Measure managers will collect and centralize the data of all
project managers.
Collection
method/good practice
- Registration of farmers/ forest holders that achieved (quality)certificate,
degree or diploma after training activity: if relevant the final result of the
training can be registered in a central training database (created and
managed by the responsible measure manager).
This database contains all relevant information related to this measure (see
also output indicator fiche n° 1). This information can be obtained by adding
an extra section on the registration form concerning the en result of the
training activity : passed, failed, degree, certificate,… This section needs to
be filled in by the project manager after each training activity.
- Collection method for measuring the degree of implementation of new skills:
through a survey of the farmers and forest holders that participated in
training activities.
Source - Training database of the responsible measure manager, containing all the
information as indicated above.
- Survey
Registration
frequency
- If successful result is achieving a (quality) certificate, a degree or a diploma:
after each training session
- if successful result is implementation of new skills: surveys should at least be
held in function of the evaluation moments of rural development programmes
(mid term, ex post)
Page 4
I. Result Indicator Fiches EN.doc
4
AXIS 1 IMPROVING THE COMPETITIVENESS OF THE
AGRICULTURAL AND FORESTRY SECTOR
RESULT INDICATOR 02. INCREASE IN GROSS VALUE ADDED IN SUPPORTED
HOLDINGS/ENTERPRISES
Type of indicator
Result indicator for axis 1, subsection 1 (improving the competitiveness of
the agricultural and forestry sector by promoting knowledge and improving
human potential)
Related measure Setting up of young farmers
Early retirement
Use of advisory services
Setting up of farm management, farm relief and farm advisory services
Farm modernisation
Improving the economic value of forests
Adding value to agricultural and forestry products
Cooperation for development of new products processes and technologies
in the agriculture and food sector and in the forestry sector
Improving and developing infrastructure related to the development and
adaptation of agriculture and forestry
Helping farmers to adapt to demanding standards based on community
legislation
Measure Code 112-113 -114-115-121-122-123-124-125-131
Definition of the
indicator
This indicator measures the increase in gross value added (GVA) of agricultural,
food or forestry holdings/enterprises that are supported. Important is that we
measure the gross effect. This means that it can be possible that a change in
GVA over different years can also be explained by other factors than the received
support.
To measure the GVA of the supported holdings/enterprises, we use the following
proxy:
the average profit after taxes of assisted holdings/enterprises =
turnover - costs whereby:
- costs =
o direct inputs: seed, plants, fertilizer, animal feed, energy, water,
contract work, …
o + overheads: maintenance and depreciation of buildings and
machinery, insurances, other
o + labor costs
o + rent
o + interest
- turnover = Value of sales - bonuses given on sales - taxes on sales
This indicator needs to be compared over different years to see its evolution
Subdivision Division according to:
Page 5
I. Result Indicator Fiches EN.doc
5
measure
type of sector:
- agriculture
- food industry
- forestry
Unit of measurement euro
Level of collection project level (for each supported holding) or measure level depending on the
sources used
Responsible actor for
collection
Measure managers will collect and centralize the necessary financial data of the
supported holdings.
Collection
method/good practice
Collect per supported holding the costs and revenues as defined above. This
information can be found in the bookkeeping of all holdings.
formula:
( revenues - costs)/ number of supported holdings
Source There are a few possible sources for the bookkeeping information:
- FADN (Farm Accountancy Data Network),
- national/regional accounts or statistics, national farm accountancy
network
- survey: contacting the individual supported holdings for the information
(information can be included in the application form)
Registration
frequency
Per application for support and upon completion of the project
Surveys should at least be scheduled in function of the evaluation moments of
rural development programmes (mid term, ex post)
Page 6
I. Result Indicator Fiches EN.doc
6
AXIS 1 IMPROVING THE COMPETITIVENESS OF THE
AGRICULTURAL AND FORESTRY SECTOR
RESULT INDICATOR 03. NUMBER OF HOLDINGS/ENTERPRISES INTRODUCING NEW
PRODUCTS AND/OR NEW TECHNIQUES
Type of indicator
Result indicator for axis 1, sub-section 2 (improving the competitiveness of
the agricultural and forestry sector - restructuring physical potential and
promoting innovation)
Related measure Modernisation of farms
Improving the economic value of forests
Adding value to agricultural and forestry products
Cooperation for development of new products, processes and technologies
Measure Code 121-122-123-124
Definition of the
indicator
Introducing new products or techniques consists of a redeployment of the
production, i.e. changes in land use or in agricultural practices that lead to a
change in the composition of the basic agricultural products. With this indicator
we don’t measure the number of holdings/enterprises receiving investment
support but the number of holdings/enterprises where the investment support led
to the introduction of a new technique or product.
Subdivision Division according to:
Measure
Type of holding/enterprise
- Agricultural holding
- forestry holding
- food enterprise
type of redeployment of production:
- new technique
- new product
Page 7
I. Result Indicator Fiches EN.doc
7
Unit of measurement Number of holdings
Level of collection Measure level
Responsible actor for
collection
Measure manager
Collection
method/good practice
Introducing a monitoring system that allows to keep track of the supported farmer,
forestry and food enterprises that received investment support (e.g. application
forms introduced in a database).
To measure the indicator a survey can be conducted among the supported
holdings/enterprises 2 years after the investment support was granted.
Source Database of the responsible measure manager, containing all the information as
indicated above.
Registration
frequency
Per application for support and upon completion of the project.
The surveys should at least be scheduled in function of the evaluation moments
of rural development programmes (mid term, ex post)
Page 8
I. Result Indicator Fiches EN.doc
8
AXIS 1 IMPROVING THE COMPETITIVENESS OF THE
AGRICULTURAL AND FORESTRY SECTOR
RESULT INDICATOR 04. VALUE OF AGRICULTURAL PRODUCTION UNDER RECOGNIZED
QUALITY LABEL/ STANDARDS
Type of indicator Result indicator for axis 1, sub-section 3 (improving the quality of
agricultural production and products)
Related measure Meeting standards based on Community legislation
Supporting farmers who participates in food quality schemes
Supporting producer groups for information and promotion activities for
products under food quality schemes
Measure Code 131-132-133
Definition of the
indicator
“Value” expressed as total market value (=selling value: P*Q) of the agricultural
production under recognized quality label/ standards and supported through the
related measures
“Recognized label/ standard” can be:
- European label/ standard
- Member State label/ standard
Subdivision Division according to:
Measure
Type of label/standard:
- European label/standard
- Member State label/standard
Type of agricultural product involved (Cfr. regulations 509/2006/EC and
510/2006/EC)
- Fresh meat (and offal)
- Meat based products (cooked, salted, smoked, etc.)
- Cheeses
- Other products of animal origin (eggs, milk products excl. butter etc.)
- Oils and fats (butter, margarine, oils, etc.)
- Fruits, vegetables, cereals, whether or not processed
- Beer
- Beverages made from plant extracts
- Bread, pastry, cakes, confectionery, biscuits and other baker's wares
- Other food products
Unit of measurement million Euro
Level of collection Measure level
Responsible actor for Measure manager
Page 9
I. Result Indicator Fiches EN.doc
9
collection
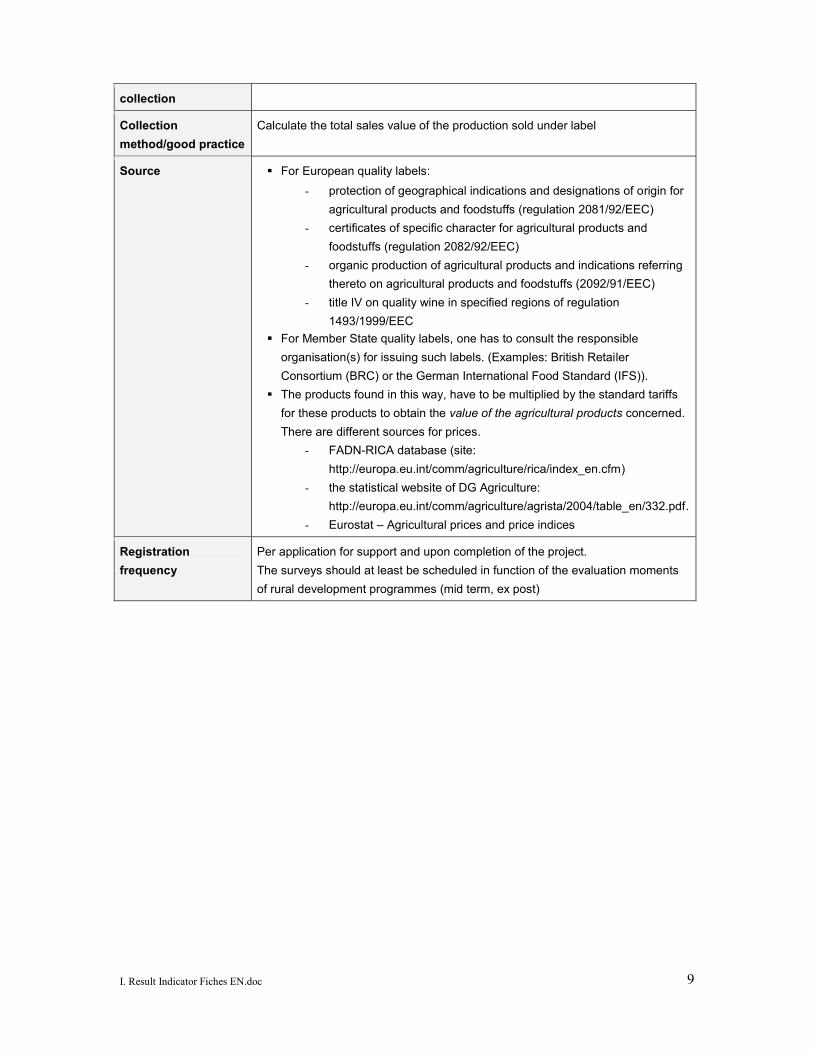
Collection
method/good practice
Calculate the total sales value of the production sold under label
Source For European quality labels:
- protection of geographical indications and designations of origin for
agricultural products and foodstuffs (regulation 2081/92/EEC)
- certificates of specific character for agricultural products and
foodstuffs (regulation 2082/92/EEC)
- organic production of agricultural products and indications referring
thereto on agricultural products and foodstuffs (2092/91/EEC)
- title IV on quality wine in specified regions of regulation
1493/1999/EEC
For Member State quality labels, one has to consult the responsible
organisation(s) for issuing such labels. (Examples: British Retailer
Consortium (BRC) or the German International Food Standard (IFS)).
The products found in this way, have to be multiplied by the standard tariffs
for these products to obtain the value of the agricultural products concerned.
There are different sources for prices.
- FADN-RICA database (site:
http://europa.eu.int/comm/agriculture/rica/index_en.cfm)
- the statistical website of DG Agriculture:
http://europa.eu.int/comm/agriculture/agrista/2004/table_en/332.pdf.
- Eurostat – Agricultural prices and price indices
Registration
frequency
Per application for support and upon completion of the project.
The surveys should at least be scheduled in function of the evaluation moments
of rural development programmes (mid term, ex post)
Page 10
I. Result Indicator Fiches EN.doc
10
AXIS 1 IMPROVING THE COMPETITIVENESS OF THE
AGRICULTURAL AND FORESTRY SECTOR
RESULT INDICATOR 05. NUMBER OF FARMS ENTERING THE MARKET
Type of indicator Result indicator for axis 1, sub-section 4 (transitional measures)
Related measure Semi-subsistence farming
Setting up of producer groups
Measure Code 141-142
Definition of the
indicator
This indicator measures the number of farms in the new Member States that
enter the market, meaning that they evolved from a (semi) subsistence farm to an
income generating market player.
Subdivision -
Unit of measurement Unique number of farm holdings
Level of collection Measure level
Responsible actor for
collection
Measure manager
Collection
method/good practice
Follow up the supported (semi) subsistence farms to monitor whether they enter
the market and count the farms that actually entered the market. A survey will
probably be necessary.
Source Database of the responsible measure manager, containing all the information on
the supported (semi) subsistence farms.
Registration
frequency
Per application for support and upon completion of the project.
The surveys should at least be scheduled in function of the evaluation moments
of rural development programmes (mid term, ex post)
Page 11
I. Result Indicator Fiches EN.doc
11
AXIS 2 IMPROVING THE ENVIRONMENT AND THE COUNTRYSIDE
RESULT INDICATOR 06. AREA UNDER SUCCESSFUL LAND MANAGEMENT CONTRIBUTING TO:
A) BIO DIVERSITY AND HIGH NATURE VALUE FARMING/FORESTRY
B) WATER QUALITY
C) CLIMATE CHANGE
D) SOIL QUALITY
E) AVOIDANCE OF MARGINALISATION AND LAND ABANDONMENT
Type of indicator Result indicator of axis 2
Related measure All measures of axis 2
Measure Code 211-212-213-214-215-216-221-222-223-224-225-226-227
Definition of the
indicator
The indicator measures the total amount of hectares under successful land
management. Successful land management is defined as the successful
completion of land management actions contributing to :
- improvement of biodiversity
o protection of wildlife species or groups of species
o maintain reintroduce crop-combinations
o safeguarding endangered animal breeds and plant varieties
- improvement of water quality
o decrease in concentration of nutrients, phosphorous and/or pesticides
o reduced use of chemical fertilizers
o reduced life stock density
o improved nitrogen balance
o reducing the transport of pollutants to aquifers
- mitigating climate change
- improvement of soil quality:
o reduction of erosion (water/wind/tillage)
o less water logging
o reduction or prevention of chemical contamination (less use of plant
nutrient/manure, plant protection substances, …)
o stabilising and enhancing the level of soil organic matter through the
use of appropriate sources of stable organic matter and, where
appropriate, through reduced tillage
- Avoidance of marginalisation and land abandonment
Subdivision Division according to:
Measure
Type of contribution
- Improvement of biodiversity
- Improvement of water quality
- Mitigating climate change
Page 12
I. Result Indicator Fiches EN.doc
12
- Improvement of soil quality
- Avoidance of marginalisation and land abandonment
Unit of measurement number of Ha
Level of collection Measure level
Responsible actor for
collection
Measure manager/programme manager
Collection
method/good practice
Where possible using existing statistic sources at the lowest disaggregated level
possible (regional, sub-regional, local). In this way the data can be linked as
much as possible to the supported area.
If no data are available:
- Empirical tests on the supported land with respect to:
o biodiversity
o water quality
o climate change
o soil quality
- survey of supported forest/ farm holders
Source - national/regional statistics;
- EUROFARM (cf., Annex 1 to Commission decision 98/377/EC)
- EUROSTAT "Les indices de Ruralité et de développement rural"
- on-farm observation (interview, sample, case study…);
- RDP monitoring data (output indicators)
Registration
frequency
Per application for support and upon completion of the project.
In case of multi-annual commitments, registration should at least be scheduled in
function of the evaluation moments of rural development programmes (mid term,
ex post)
Page 13
I. Result Indicator Fiches EN.doc
13
AXIS 3 IMPROVING THE QUALITY OF LIFE IN RURAL AREAS AND
ENCOURAGING DIVERSIFICATION OF ECONOMIC ACTIVITY
RESULT INDICATOR 07. INCREASE IN NON-AGRICULTURAL GROSS VALUE ADDED IN
SUPPORTED BUSINESSES
Type of indicator Result indicator for axis 3, subsection 1 (promote the diversification of rural
economy)
Related measure Diversification into non-agricultural activities
Business creation and development
Encouragement of tourism activities
Measure Code 311-312-313
Definition of the
indicator
This indicator measures the increase in non-agricultural gross value added
(GVA) of supported businesses. This means that it can be possible that a
change in GVA over different years can also be explained by other factors than
the received support.
To measure the GVA of the supported enterprises, we use the following proxy:
the average profit after taxes of assisted holdings = turnover - costs
whereby:
- costs =
o direct inputs: energy, water, contract work, …
o + overheads: maintenance and depreciation of buildings and
machinery, insurances, other
o + labor costs
o + rent
o + interest
- turnover = Value of sales/services - bonuses given on sales - taxes on
sales
This indicator needs to be compared over different years to see its evolution
Subdivision - per measure
- per type of holding:
o agricultural holding
o other enterprises
Page 14
I. Result Indicator Fiches EN.doc
14
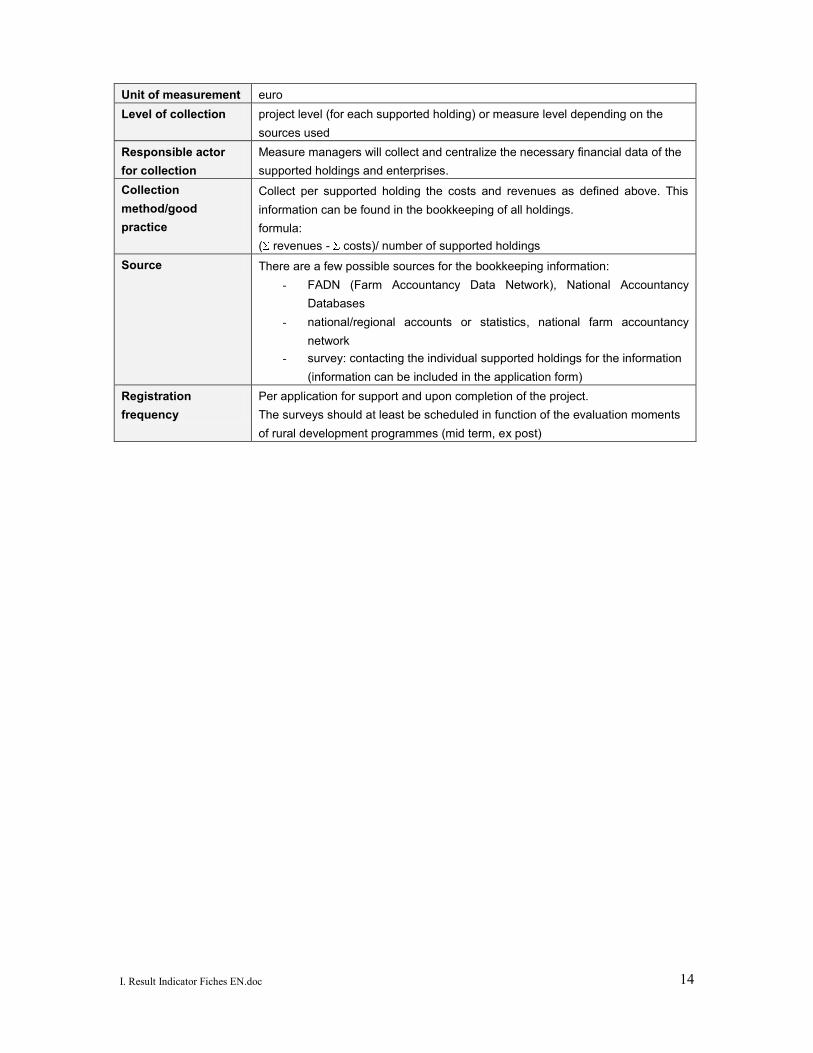
Unit of measurement euro
Level of collection project level (for each supported holding) or measure level depending on the
sources used
Responsible actor
for collection
Measure managers will collect and centralize the necessary financial data of the
supported holdings and enterprises.
Collection
method/good
practice
Collect per supported holding the costs and revenues as defined above. This
information can be found in the bookkeeping of all holdings.
formula:
( revenues - costs)/ number of supported holdings
Source There are a few possible sources for the bookkeeping information:
- FADN (Farm Accountancy Data Network), National Accountancy
Databases
- national/regional accounts or statistics, national farm accountancy
network
- survey: contacting the individual supported holdings for the information
(information can be included in the application form)
Registration
frequency
Per application for support and upon completion of the project.
The surveys should at least be scheduled in function of the evaluation moments
of rural development programmes (mid term, ex post)
Page 15
I. Result Indicator Fiches EN.doc
15
AXIS 3 IMPROVING THE QUALITY OF LIFE IN RURAL AREAS AND
ENCOURAGING DIVERSIFICATION OF ECONOMIC ACTIVITY
RESULT INDICATOR 08. GROSS NUMBER OF JOBS CREATED
Type of indicator
Result indicator of axis 3, sub-section 1 (improving the quality of life in rural
areas and encouraging diversification of economic activity – diversification
of the rural economy)
Result indicator of axis 4, sub-section 1 (to implement the Leader approach
in mainstream rural development programming)
Related measure Diversification into non-agricultural activities
Business creation and development
Encouragement of tourism activities
All Leader measures
Measure Code 311-312-313
Page 16
I. Result Indicator Fiches EN.doc
16
Definition of the
indicator
The indicator measures the gross increase of employment expressed in number
of new jobs related to the assisted actions. Nevertheless “gross” means that not
all new jobs are a direct result of this assistance. The increase of jobs is also
likely to be influenced by several exogenous factors like economic trends, other
structural aid, and the general socio-economic situation of the region.
Subdivision Division of new jobs created according to:
- on farm versus off farm jobs:
- on farm jobs created by assisted actions
o agri-tourism
o craft
o retail
o renewable energy production
o other
- off farm jobs created by assisted actions
o tourism
o craft
o retail
o renewable energy production
o other
- gender (male/ female)
- age category
- age < 25
- 25 ≤ age
- Leader
o Axis 1
o Axis 2
o Axis 3
-
Page 17
I. Result Indicator Fiches EN.doc
17
Unit of measurement number of jobs created
Level of collection Project level
Responsible actor for
collection
Project manager/coordinators of local action groups, centralized by measure
managers and programme manager
Collection
method/good practice
Monitoring of the supported operations: each beneficiary can be asked the
number of new jobs since the support was granted (e.g. two years later). Since
the indicator measures a gross effect the beneficiary doesn’t need to know how
many jobs were created as a direct result of the support. The data must be
centralized by the measure managers and the programme manager.
Alternatively, labour market statistics by sector and region can be used as a
source.
Source Survey
Registration
frequency
Per application for support and upon completion of the project.
The surveys should at least be scheduled in function of the evaluation moments
of rural development programmes (mid term, ex post).
Page 18
I. Result Indicator Fiches EN.doc
18
AXIS 3 IMPROVING THE QUALITY OF LIFE IN RURAL AREAS AND
ENCOURAGING DIVERSIFICATION OF ECONOMIC ACTIVITY
RESULT INDICATOR 09. ADDITIONAL NUMBERS OF TOURIST VISITS
Type of indicator
Result indicator of axis 3, sub-section 1 (improving the quality of life in rural
areas and encouraging diversification of economic activity – diversification
of the rural economy)
Related measure Encouragement of tourism activities
Measure Code 313
Definition of the
indicator
the indicator measures the additional number of tourist visits in the rural area due
to the supported tourism investments
Subdivision Division according to :
Number of overnight stays (hotels,..)
Number of day visitors (tourism facilities, recreational activities….)
Unit of measurement Number of tourist visits
Level of collection Project level
Responsible actor for
collection
Project manager/measure manager
Collection
method/good practice
Monitoring of number of visits of the supported tourism infrastructure in a
database.
Source monitoring by project manager, centralized by measure manager
Registration
frequency
Per application for support and upon completion of the project.
The surveys should at least be scheduled in function of the evaluation moments
of rural development programmes (mid term, ex post)
Page 19
I. Result Indicator Fiches EN.doc
19
AXIS 3 IMPROVING THE QUALITY OF LIFE IN RURAL AREAS AND
ENCOURAGING DIVERSIFICATION OF ECONOMIC ACTIVITY
RESULT INDICATOR 10. POPULATION IN RURAL AREAS BENEFITING FROM IMPROVED
SERVICES
Type of indicator
Result indicator of axis 3, sub-section 2 (improving the quality of life in rural
areas and encouraging diversification of economic activity – to improve
basic services)
Related measure Basic services for the economy and rural population
Village renewal and development
Conservation and upgrading of the rural heritage
Measure Code 321-322-323
Definition of the
indicator
The indicator measures the number of people in rural areas that benefit from
improved services.
Subdivision -
Unit of measurement Unique number of persons
Level of collection Project level
Responsible actor for
collection
Project manager/Measure manager
Collection
method/good practice
Population in supported areas under the above mentioned measures. Project
managers could be asked to indicate in their applications the size of the
population and/or the area benefiting from their project.
Source National, regional statistics (National Institute of Statistics, …) and application
forms
Registration
frequency
Per application for support and upon completion of the project.
The surveys should at least be scheduled in function of the evaluation moments
of rural development programmes (mid term, ex post)
Page 20
I. Result Indicator Fiches EN.doc
20
AXIS 3 IMPROVING THE QUALITY OF LIFE IN RURAL AREAS AND
ENCOURAGING DIVERSIFICATION OF ECONOMIC ACTIVITY
RESULT INDICATOR 11. INCREASE IN INTERNET PENETRATION IN RURAL AREAS
Type of indicator
Result indicator of axis 3, sub-section 2 (improving the quality of life in rural
areas and encouraging diversification of economic activity – to improve
basic services)
Related measure Basic services for the economy and rural population
Measure Code 321
Definition of the
indicator
Internet penetration can be expressed as the population that has access to
(broadband) internet connections
Subdivision -
Unit of measurement Unique number of persons
Level of collection measure level
Responsible actor for
collection
Project manager/measure manager
Collection
method/good practice
Compare internet penetration in the supported areas the year before and the year
after the support and make the difference for each supported area.
Source National, regional statistics: in each country there exist different studies and
statistics on the internet penetration. The more local the data are available the
better the link can be made between internet penetration and the supported
areas. The project managers could be asked to indicate the area in which they
will operate.
Registration
frequency
Per application for support and upon completion of the project.
The surveys should at least be scheduled in function of the evaluation moments
of rural development programmes (mid term, ex post)
Page 21
I. Result Indicator Fiches EN.doc
21
AXIS 3 IMPROVING THE QUALITY OF LIFE IN RURAL AREAS AND
ENCOURAGING DIVERSIFICATION OF ECONOMIC ACTIVITY
RESULT INDICATOR 12. NUMBER OF PARTICIPANTS THAT SUCCESSFULLY ENDED A
TRAINING ACTIVITY
Type of indicator
Result indicator of axis 3, sub-section 3 (improving the quality of life in rural
areas and encouraging diversification of economic activity – diversification
of the rural economy)
Related measure Training and information for economic actors operating in the field of
covered by axis 3
Skills acquisition and animation with a view to preparing and implementing
a local development strategy
Measure Code 331-341
Definition of the
indicator
What is a successfully ended training?
A first condition is that the participant must have ended the full training session/
programme. Than a successful result can be:
- Receiving a (quality)certificate, degree or diploma after finishing the
training
- Applying the achieved skills in practice
The participants of training activities that we include in the indicator are economic
actors operating in the field of axis 3 and staff involved with preparation and
implementation of local development programmes.
Subdivision Division of indicator according to:
gender (male/female)
age category
- age < 25
- 25 ≤ age
Page 22
I. Result Indicator Fiches EN.doc
22
Unit of measurement Unique number of persons
Level of collection Project level
Responsible actor for
collection
Project managers. Measure managers will collect and centralize the data of all
project managers.
Collection
method/good practice
- Registration of participants in training activities that achieved
(quality)certificate, degree or diploma after training activity: if relevant the
final result of the training can be registered in a central training database
(created and managed by the responsible measure manager).
This database contains all relevant information related to this measure (see
also output indicator fiche n° 57). This information can be obtained by adding
an extra section on the registration form concerning the end result of the
training activity : passed, failed, degree, certificate, … This section needs to
be filled in by the project manager after each training activity ends.
- Collection method for measuring the degree of implementation of new skills:
through a survey of the participants that participated in a training activities.
Source - Training database of the responsible measure manager, containing all the
information as indicated above.
- Survey
Registration
frequency
- If successful result is achieving a (quality) certificate, a degree or a diploma:
after each training session
- if successful result is implementation of new skills: surveys should at least be
held in function of the evaluation moments of rural development programmes
(mid term, ex post)