70
Prepared for: Evaluation Unit DG Regional Policy European Commission Guide to cost-benefit analysis of investment projects (Structural Fund-ERDF, Cohesion Fund and ISPA). Studio Gatelli

Prepared for:
Evaluation UnitDG Regional Policy
European Commission
Guide to cost-benefit analysisof investment projects (Structural
Fund-ERDF,Cohesion Fund
and ISPA).
Stu
dio
Ga
tell
i

2
AcronymsAEI Analysis of Environmental ImpactB/C Benefit/cost CBA Cost and Benefit AnalysisCF Cohesion Fundcf Conversion FactorDCF Discounted Cash FlowEIB European Investment BankENPV Economic Net Present ValueERDF European Regional Development
FundERR Economic Rate of Return
FNPV Financial Net Present ValueFRR Financial (Internal) Rate of ReturnFRR/C Financial Rate of Return on InvestmentFRR/K Financial Rate of Return on EquityISPA Instrument For Structural Policies in
Pre-Accession CountriesIWS Integrated Water Supply ServicesPPP Polluter Pays PrincipleSCF Standard Conversion FactorSF Structural FundsVAT Value Added Tax
Within the framework of the programme of studies and technical assistance in the field of
Regional Policies implemented by the Commission, a working team was given the task
to prepare a new edition of the previous Guide to Cost Benefit Analysis of Major Projects,
published in 1997.
The working team for the Guide was coordinated by Professor Massimo Florio, and included
Ugo Finzi, Mario Genco (risk analysis, water projects), François Levarlet (waste management
project), Silvia Maffii (transport projects), Alessandra Tracogna (text coordination chapter
three, discount rate annex and bibliography), Silvia Vignetti (text coordination).
Guide to cost-benefit analysisof investment projects

5
Table of contents
Acronyms 2
Table of contents 4
Foreword 6
Outline of the new edition of the Guide 7
Chapter One - Project appraisalin the framework of the Structural Funds, Cohesion Fund and ISPA 10
Overview 101.1 Scope and objectives 101.2 Definition of the projects 111.3 Responsibility for prior appraisal 121.4 Information required 13
Chapter Two - An agenda for the project examiner 15
Overview 152.1 Objectives definition 152.2 Project identification 17
2.2.1 Clear identification 172.2.2 Financial threshold 182.2.3 Project definition 18
2.3 Feasibility and options analysis 182.4 Financial analysis 19
2.4.1 The time horizon 202.4.2 Determining Total Costs 242.4.3 Revenue Generated by the Project 252.4.4 Residual Value of the Investment 252.4.5 Adjusting for inflation 262.4.6 Financial Sustainability (Tab. 2.4) 262.4.7 Determining the Discount Rate 262.4.8 Determination of performance indicators 262.4.9 Determination of the co-financing Rate 28
2.5 Economic analysis 282.5.1 Phase 1 - Fiscal corrections 282.5.2 Phase 2 - Externalities corrections 312.5.3 Phase 3 - From market to accounting prices 322.5.4 Discounting 362.5.5 The calculation of the economic rate of return 36
2.6 Multicriteria analysis 362.7 Sensitivity and risk analysis 38
2.7.1 Forecasting uncertainties 382.7.2 Sensitivity analysis 382.7.3 Scenario analysis 392.7.4 Risk probability analysis 40
Chapter Three - Outline of project analysis by sectors 42
Overview 423.1 Waste treatment 43
Introduction 433.1.1 Objectives definition 433.1.2 Project identification 433.1.3 Feasibility and options analysis 453.1.4 Financial analysis 473.1.5. Economic analysis 473.1.6 Other evaluation criteria 503.1.7 Sensitivity and risk analysis 513.1.8 Case study: Investment in an incinerator
with energy recovery 513.2 Water supply and depuration 53
Introduction 533.2.1. Objectives definition 533.2.2 Project identification 553.2.3 Feasibility and options analysis 553.2.4 Financial analysis 573.2.5 Economic analysis 593.2.6 Other evaluation criteria 603.2.7 Sensitivity and risk analysis 603.2.8 Case study: infrastructure sheet for the management of the IWS 61
3.3 Transport 70Introduction 703.3.1 Objectives definition 703.3.2 Project identification 703.3.3 Feasibility and options analysis 713.3.4 Financial analysis 753.3.5 Economic analysis 753.3.6 Other evaluation criteria 773.3.7 Sensitivity, scenario and risk analysis 783.3.8 Case study: Investment in a motorway 78
3.4 Energy transport and distribution 823.4.1 Objectives definition 823.4.2 Project identification 833.4.3 Feasibility and options analysis 833.4.4 Financial analysis 833.4.5 Economic analysis 843.4.6 Other evaluation criteria 843.4.7 Sensitivity and risk analysis 84
3.5 Energy production 843.5.1 Objectives definition 843.5.2 Project identification 843.5.3 Feasibility and options analysis 853.5.4. Financial analysis 853.5.5 Economic analysis 853.5.6 Other evaluation elements 853.5.7 Sensitivity and risk analysis 85
Table of contents
4
3.6 Ports, airports and infrastructure networks 863.6.1 Objectives definition 863.6.2 Project identification 863.6.3 Feasibility and options analysis 863.6.4 Financial analysis 863.6.5 Economic analysis 873.6.6 Other evaluation elements 873.6.7 Sensitivity and risk analysis 87
3.7 Training infrastructure 873.7.1 Objectives definition 873.7.2 Identification of the project 883.7.3 Feasibility and options analysis 883.7.4 Financial analysis 883.7.5 Economic analysis 883.7.6 Other evaluation elements 893.7.7 Sensitivity and risk analysis 89
3.8 Museums and archaeological parks 893.8.1 Objectives definition 893.8.2 Project identification 893.8.3 Feasibility and options analysis 903.8.4 Financial analysis 903.8.5 Economic analysis 903.8.6 Other evaluation elements 903.8.7 Sensitivity and risk analysis 90
3.9 Hospitals and other health infrastructure 903.9.1 Objectives definition 903.9.2 Project identification 913.9.3 Feasibility and options analysis 913.9.4 Financial analysis 913.9.5 Economic analysis 913.9.6 Other evaluation elements 923.9.7 Sensitivity and risk analysis 92
3.10 Forests and parks 923.10.1 Objectives definition 923.10.2 Project identification 923.10.3 Feasibility and options analysis 933.10.4 Financial analysis 933.10.5 Economic analysis 933.10.6 Other evaluation elements 943.10.7 Sensitivity and risk analysis 94
3.11 Telecom infrastructures 943.11.1 Objectives definition 943.11.2 Project identification 943.11.3 Feasibility and options analysis 953.11.4 Financial analysis 953.11.5 Economic analysis 953.11.6 Other evaluation elements 953.11.7 Sensitivity and risk analysis 95
3.12 Industrial estates and technological parks 963.12.1 Objectives definition 963.12.2 Project identification 963.12.3 Feasibility and options analysis 963.12.4 Financial analysis 963.12.5 Economic analysis 973.12.6 Other evaluation elements 973.12.7 Sensitivity and risk analysis 97
3.13 Industrial and other productive investments 973.13.1 Objectives definition 973.13.2 Project identification 983.13.3 Feasibility and options analysis 983.13.4 Financial analysis 983.13.5 Economic analysis 983.13.6 Other evaluation elements 993.13.7 Sensitivity and risk analysis 99
Annexes 100
Annex A Project performance indicators 100A.1 The net present value (NPV) 100A.2 The internal rate of return 101A.3 B/C ratio 102
Annex B The choice of the Discount Rate 103B.1 The Financial Discount Rate 103B.2 The social discount rate 104
Annex C The determination of the co-financing rate 106C.1 Regulatory framework 106C.2 Rules for modulation 106
C.2.1 Calculation of the financial rate of return on the total investment cost (before EU intervention) 107C.2.2 Calculation of the financial rate of return on national capital (after EU grant) 108C.2.3 Calculation of the economic rate of return 108
Annex D Sensitivity and risk analysis 109Annex E Monetary evaluation of environmental
services 112E.1 Why do we value the environment? 112E.2 Evaluating environmental impacts
in development projects 112E.3 What do we do measuring
monetary benefits? 1141. Averting expenditures and avoided costs 1142. Dose-response functions 1153. Hedonic price method 1154. Travel cost method 1165. Methods based on hypothetical markets: the contingent evaluation method 1166. Benefits transfer 117
E.4 The different steps of an environmental cost-benefit analysis 118
Annex F Affordability and evaluation ofdistributive impact 119
Annex G Table of contents of a feasibility study 120
Glossary - Some key-words for project analysis 122
Basic glossary 122Financial analysis 123Economic analysis 125Other evaluation elements 126
Bibliography 127
General 127Agriculture - Education - Energy 128Environment - Health 129Industrial projects 130Tourism & entertainment 130Transport 130Water 132 Addendum 133

The Guide is structured in the followingchapters:
• Chapter One. Project appraisal in the fra-mework of Structural Funds, CohesionFund and ISPA.
• Chapter Two. An agenda for the projectexaminer.
• Chapter Three. Outline of project analy-sis by sectors.
• Annexes
• Glossary
• Bibliography
Each chapter comprises:A) main text;B) tables and figures;C) boxes.
Boxes are of two different kinds:
• Regulation boxes, where the most impor-tant statements of SF, CF and ISPA regu-lations are reminded;
• Example boxes, where some examples,both qualitative and quantitative, aregiven about a specific issue illustrated inthe main text.
In some cases key information is reportedin boxes and tables, and we suggest the rea-der invests some time studying them.
Chapter One. Project appraisal in the fra-mework of Structural Funds, CohesionFund and ISPA.This chapter is an introduction to theobjectives, scope and uses of the Guide andthe main subjects it addresses. Startingfrom the ERDF, CF and the ISPA
Regulations the chapter focuses on the legalrequirements for the co-financing decisionand the related project appraisal process.The main point of the chapter is that despi-te the differences of procedures andmethods among the three funds the econo-mic logic of analysis and the methodologyshould be homogeneous.
1.1. Scope and Objectives. This sectionstresses the objectives and instruments ofthe ERDF, CF and ISPA. Starting from theRegulations this section focuses on themain scopes of the Funds.
1.2. Definition of the projects. This sec-tion defines the projects to which theappraisal process is applicable for theERDF, the CF and ISPA instruments. It illu-strates the principal sectors of applicationof the Funds, the financial thresholds forproject appraisal and the differences bet-ween the co-financing rates.
1.3. Responsibility for prior appraisal.The section illustrates, for each of the threefunds, the responsibility for prior appraisalof projects. This section focuses also on themain differences introduced by the newregulations on this issue.
1.4. Information required. A list of theinformation required for project prepara-tion and appraisal is provided.
Chapter Two. An agenda for the projectexaminer.This chapter provides operational tools forboth the preparation and the appraisal of
Outline of the new edition of the Guide
7
Cost-benefit analysis (CBA) of investmentprojects is explicitly required by the newEU Regulations for Structural Funds (SF),Cohesion Fund (CF) and Instrument forPre-Accession countries (ISPA), for pro-jects with a budget upper than to, respecti-vely, 50 Meuro, 10 Meuro and 5 Meuro.
While Member States are responsible for theprior appraisal, the EU Commission has toevaluate the quality of this appraisal in orderto admit the project proposal to co-finan-cing and to determine the co-financing rate.
Many differences occur between infra-structure and productive investments; manydifferences also occur between regions andcountries, between different theories andmethodologies of evaluation and moreoverbetween different administrative procedu-res between the three Funds.
Despite these differences most of the pro-jects have some aspect in common and theirappraisal should be expressed in a commonlanguage.
Beside general methodological aspects, thisverification of costs and benefits is a usefultool to stimulate dialogue between part-ners, Member States and Commission, pro-ject proposers, officials and consultants: asupporting tool for collective decision pro-
cess. It is also a tool to make more transpa-rent procedures for project selection andfinancing decision
Within the framework of its obligations asregards appraisal of projects which are sub-mitted to it by the Member States in the con-text of regional policy, the Commission (DGRegio) uses a Guide to cost benefit analysisof major projects. Three years since the lastupdating, the political, legal and technicalcontext has developed considerably andrequires a new update of the guide.
The present guide offers to EU officials,external consultants, and all the partiesconcerned an agenda for the evaluationprocess. The text is specifically addressed tothe EU officials but at the same time itoffers helpful indications to the projectproposer about the specific informationneeds by the Commission.
The specific tasks of this updated versionare:
• To incorporate into the document thedevelopment of Community policies,financial instruments and cost benefitanalysis;
• To feed into the Commission's reflectionon the modulation of rates of co-finan-cing for projects;
• To provide technical support to the reader.
Foreword
6

4. Energy transport and distribution5. Energy production6. Ports, airports and infrastructure net-works7. Training infrastructures8. Museums and archaeological parks 9. Hospitals10. Forests and parks11. Telecommunications infrastructure12. Industrial estates and technological parks13. Industries and other productive invest-ments.
Annexes This section discusses some technical issuesand gives some recommendations toimprove the effectiveness of the appraisalmethodology.More specifically the annexes deal with:A Project performance indicators;B The choice of the discount rate;C The determination of the co-financing
rate;D Sensitivity and risk analysis;E Monetary evaluation of environmental
services;
the projects: each section will consider theproposer’s and the evaluator’s points ofview. The structure will be strongly opera-tive and information will be also providedin the form of checklists, frequently askedquestions, common mistakes to be avoided.
The paragraphs are the following:
2.1. Objectives definition. This sectionfocuses on clearly defining the main objec-tives and expected results of the project. Itexplains how to stress the socio-economicvariables that the project can influence,how to measure them in order to assess theexpected socio-economic impact and thedegree of consistency of the specific objec-tives of the project with EU developmentpolicies.
2.2. Project identification. This sectioncontains indications about how to startdefining the general design and the logicalframework of the project, consistently withthe most common recommendations ofCBA analysis, financial thresholds, and theproject definition stated in the regulations.
2.3. Feasibility and options analysis. Pra-ctical recommendations are illustrated bysimple concrete examples especially for theoption analysis, distinguishing modal, tech-nological, geographical and chronologicaloptions. A typical index for a feasibilitystudy is given in appendix G.
2.4. Financial analysis. Information abouthow to conduct a financial analysis will begiven. Starting from the basic tables thissection explains how to conduct the study,from the definition of the main items toinclude in the tables to the calculation ofthe FRR and FNPV (both of the investmentand of the equity). The approach is strictlyoperative and some examples will be givenin the form of case studies (boxes).The main technical issues to be solvedwhen implementing the analysis are:
• the choice of time horizon;
• the determination of the total cost;
• the determination of the total revenues;
• the determination of the residual value atend year;
• the treatment of inflation;
• the financial sustainability;
• the choice of an appropriate discount rate(see also annex B);
• how to calculate the financial or econo-mic rate of return and use it for theappraisal (see also annex A).
2.5. Economic analysis. Starting from thefinancial analysis and the table of financialflows, the aim is to assess a standard metho-dology for the three steps for the definitionof the final table for the economic analysis:
• correction for fiscal aspects;
• correction for externalities;
• the determination of the conversion fac-tors.
The section focuses on how to calculate thesocial costs and benefits of a project andhow they can influence the final result. Thissection provides guidance on how to calcu-late the economic rate of return and tounderstand its economic meaning for pro-ject appraisal.
2.6. Multicriteria analysis. This sectionwill cover situations in which the rate ofreturn is insufficient as an impact indicatorand complementary analysis is needed.
2.7. Sensitivity and risk analysis. The sec-tion gives a broad outline on the treatmentof uncertainty in investment projects.Annex D is an operative instrument forimplementing the technique.
Chapter Three. Outline of project analysisby sectors.This chapter offers a more in-depth discus-sion of the CBA techniques for specific sec-tors. These comprise the following:1. Waste treatment;2. Water supply and depuration;3. Transport.A less detailed outline of the CBA approachis proposed for the following other sectors:
F The evaluation of distributive impacts;G Table of contents of a feasibility study.
GlossaryThe glossary contains key words for pro-ject analysis. It includes a list of the mostcommonly used technical terms for theCBA of investment projects.
Bibliography In this section selected references are givenfor a more in-depth study of the most com-mon techniques for CBA analysis.
The bibliography is structured as follows:
• General;
• Energy;
• Transport;
• Water;
• Environment;
• Education;
• Tourism and entertainment;
• Health;
• Agriculture;
• Industrial projects.
98
Outline of the new edition of the GuideOutline of the new edition of the Guide

The European Union SF can finance a widevariety of projects, from the point of viewof both the sector involved and the finan-cial size of the investment.
While the CF and the ISPA exclusivelyfinance projects in the transport and envi-ronment sectors, the SF, and the ERDF inparticular, may also finance projects in theenergy, industrial and service sectors.
1.2 Definition of the projectsIn the Regulations for the Structural Fundsthe financial size of the projects appraisedby the Commission is defined: it must notbe less than Euro 50 million.
In the regulations for the Cohesion fundand the ISPA, on the other hand, in addi-tion to the financial threshold (Euro 10million for the Cohesion fund and Euro 5million for the ISPA) in order to avoidexcessive fragmentation of the projects andto ensure the utilisation of the Funds in anintegrated and systematic manner, theterms ‘project’ and ‘project phase’ are defi-ned in detail. They establish that the follo-wing types of measures are financeable bythe Cohesion fund and by the ISPA:
• A project, that is an economically indivi-sible series of tasks related to a specifictechnical function and with identifiableobjectives;
• A project phase that is technically andfinancially independent and has its owneffectiveness;
• A group of projects, that is projects thatsatisfy the following three conditions:
- they are located in the same area or alongthe same transport corridor;
- they belong to a general plan for thatarea or corridor;
- they are supervised by the same agencythat is responsible for co-ordination andmonitoring.
For these projects, whatever their financialsize, the proposer must prepare a Cost-BenefitAnalysis that takes into account the direct andindirect effects on employment, possibly inte-grated with other evaluation methods in thecase of projects in the environmental field.
Some specifications for financial thresholdsare the following:
a) the key economic variable is the totalcost of the investment. To evaluate thatfigure one must not consider the sourcesof financing (for example only publicfinancing or only Community co-finan-cing), but the overall economic value ofthe infrastructural or productive invest-ment proposed;
1.2 Definition of the projects
OverviewThis chapter is an introduction to theobjectives, scope and uses of the Guide andthe main subjects it addresses. Startingfrom the ERDF, CF and the ISPA Regu-lations the chapter focuses on the regu-latory requirements for the co-financingdecision and the related project appraisalprocess.
The chapter illustrates the regulatory fra-mework, which rules the preparation,appraisal and co-financing process of aninvestment project. More precisely itdescribes:
• Scope and objectives of the Fund;
• project definition for the appraisal process;
• responsibility of the prior appraisal;
• information required for the ex-ante eva-luation.
The main point of the chapter is that despi-te the differences of procedures and me-
thods among the three funds the economiclogic of analysis and the methodologyshould be homogeneous.
1.1 Scope and objectivesInvestment projects co-financed by the SF,the CF and ISPA constitute the implemen-tation tools for EU regional policy.
This Guide refers to the Structural Fundsfor the major projects, especially the ERDF(reg. 1260/1999), to the Cohesion fund (reg.1264/1999 and 1164/94) and to the ISPA(reg. 1267/1999).
According to these regulations both infra-structural and productive investments maybe financed by one or more of theCommunity’s financial tools: mainly grantswithout security (SF,CF ) but also repayableaid for the ISPA, loans and other financialtools (European Investment Bank, Invest-ment Fund).
Project appraisal in the frameworkof the Structural Funds, CohesionFund and ISPA
Chapter One
10
BOX 1.1. Scope and objectives of the Funds
SF: Art. 1 reg. 1260/1999 (definition and objec-tives): The Structural Funds, the EIB and theother existing financial instruments shall eachcontribute in appropriate fashion to the attain-ment of the following three priority objectives: 1)promoting the development and structuraladjustment of regions whose development islagging behind, hereinafter referred to as:“objective 1”; 2) supporting the economic andsocial conversion of areas facing structural diffi-culties, hereinafter referred to as “objective 2”;3) supporting the adaptation and modernisationof policies and systems of education, training
and employment, hereinafter referred to as“objective 3”.CF: finances projects in the environmental field(aqueducts, dams and irrigation; purifiers,waste treatment plants and other environmentalworks, including those related to reforestation, tochecking erosion, safeguarding the natural envi-ronment, protecting beaches) and infrastructuralnetworks for trans-European transport (railways,airports, roads, motorways, ports) in the MemberStates with a per capita income of less than 90%of the EU average who adopt a programme whosetarget is to achieve conditions of economic con-
vergence as laid down in art. 104c of the EU treaty(Greece, Ireland, Portugal and Spain).ISPA: Art. 1 reg. 1267/1999 (definition andobjectives): ISPA shall provide assistance tocontribute to the preparation for accession tothe European Union of the following applicantcountries: Bulgaria, Czech Republic, Estonia,Hungary, Latvia, Lithuania, Poland, Romania,Slovakia and Slovenia, hereinafter referred to asthe “beneficiary countries”, in the areas of eco-nomic and social cohesion, concerning environ-ment and transport policies in accordance withthe provisions of this Regulation.
BOX 1.2 Financial thresholds.
SF: Art. 25 Reg.1260/1999: As part of any assistance, the Fundsmay finance expenditure in respect of major projects, i.e. those: a)which comprise an economically indivisible series of works fulfil-ling a precise technical function and which have clearly identifiedaims and b) whose total cost taken into account in determiningthe contribution of the funds exceeds EUR 50 million.
FC: Art. 10(3) cons..Reg.1164/94: Applications for assistance forprojectssunder Article 3 (1) shall be submitted by the beneficiaryMember State. Projects, including groups of related projects, shallbe of a sufficient scale to have a significant impact in the field ofenvironmental protection or in the improvement of trans-European transport infrastructure networks. In any event, thetotal cost of projects or groups of projects may in principle not beless than ECU 10 million. Projects or groups of projects costingless than this may be approved in duly justified cases.
ISPA: Art.2/4 Reg.1267/1999: Measures shall be of a sufficientscale to have a significant impact in the field of environmentalprotection or in the improvement of transport infrastructure net-works. The total cost of each measure shall in principle notbe less than EUR 5 million. In duly justified cases, taking intoaccount the specific circumstances concerned, the total cost ofa measure may be less than EUR 5 million.

regulations stipulate that for the evaluationof projects the Commission may avail itselfof the assistance of the EuropeanInvestment Bank, whenever appropriate. Inpractice, recourse to the experience of theEIB is very common in the case of projects,both when the Bank itself is financing theproject and when it is not.
In any case, the Commission’s decision willbe the result of a dialogue and a commoncommitment with the proposer, in order toobtain the best results from the investment.The Member States often have structuresand internal procedures for evaluating pro-jects of a certain size, but sometimes diffi-culties may emerge in carrying out a qualityevaluation. The Commission can help toovercome these difficulties in differentways. Technical assistance for the prepara-tion of the evaluation of a project may beco-financed by the Community SupportFramework or in other appropriate ways.
1.4 Information requi-red Community regulations indicate whichinformation must be contained in the appli-cation form for the purposes of an effectiveevaluation on the part of the Commission.Article 26 of reg. 1260/99 stipulates its ownrules for the submission of the request forco-financing of major projects. It asks for acost-benefit analysis, a risk analysis, an eva-luation of the environmental impact (andthe application of the Polluter PaysPrinciple) as well as the impact on equalopportunities and on employment.
Regulations for the Cohesion Fund and theISPA, in addition to stating that the propo-sals for co-financing must contain a cost-benefit analysis, a risk analysis and a detai-led indication of the alternatives rejected,also provide some indications of the crite-ria to be applied in order to ensure the qua-lity of the evaluation: in the case of envi-ronmental projects, a cost-benefit analysis
supplemented by other evaluationmethods, possibly of a quantitative naturesuch as the multicriteria analysis andrespect for Polluter pays principle (see art.10 (5), Reg. 1164/94 and the Council’samendments). Other information thatshould be provided in the request for finan-cing from the CF are: an evaluation of thedirect and indirect effects on employment;an indication of the contribution of theproject to European policies related to theenvironment and to trans-European trans-port networks; a “financial plan that inclu-des, wherever possible, information aboutthe economic viability of the project” (seeart. 10 (4), reg. 1164/94).
A project examiner should consider theseand other similar lists of regulatory normsmore as a general indication of the mini-mum information required rather than as arigid set of criteria. The applicant has theresponsibility to supply the required infor-mation but the Commission should verifythat the information provided are consistent,complete and of a sufficient quality to assessthe appraisal; otherwise the Commissionshould ask for additional information.
In general, for any type of investment afinancial analysis is always advisable. As weshall explain in the second part of theGuide, it is particularly important to
13
b) if one assumes that the investment costswill be spread over a number of years, thenone must consider the sum of all the annualcosts;
c) while one needs to consider only thecost of the investment, without the run-ning costs, it is advisable also to includeany one-off expenses incurred in thestart-up phases, such as hiring and trai-ning expenses, licences, preliminary stu-dies, planning and other technical studies,price revision, appropriation of operatingcapital, etc., in the calculation of the totalcost;
d) sometimes the interrelation among dif-ferent smaller projects is such that it is bet-ter to consider them as one large project(for example five stretches of the samemotorway, each costing Euro 6 million, canbe considered one large project of Euro 30million).
1.3 Responsibility for prior appraisalAccording to the SF reg. 1260/1999, art. 26,the Commission is responsible for the priorappraisal of major projects on the basis ofinformation given by the proposer.
The regulation for the Cohesion fund (Reg.1265/1999, art. 1), states that:
The beneficiary Member States shall provide allnecessary information, as set out in Article 10(4), including the results of feasibility studies andex-ante appraisals.
The regulation for the ISPA (reg.1267/1999, annex II (C)):
The beneficiary countries are to provide all neces-sary information, as set out in annex I, includingthe results of their feasibility studies and apprai-sals, an indication of alternatives not pursued andthe co-ordination of measures of common interestsituated on the same transport route, to make thisappraisal as effective as possible.
The Commission’s decisions about co-finan-ced projects must be based on an in-depthevaluation, carried out in the first instanceby whoever proposes the project. When theevaluation presented by the candidate isdeclared to be insufficient and not convin-cing, the Commission may ask for a revisionor a more thorough elaboration of the analy-sis, or it may conduct its own evaluation, ifnecessary, availing itself of an independentevaluation (art. 40 reg. 1260/99):
On the initiative of the Member States or theCommission, after informing the Member Stateconcerned, supplementary evaluations if appro-priate on a specific topic may be launched, witha view to identifying transferable experience.
In the case in point, with specific referenceto the Cohesion fund and the ISPA, the
12
1.3 Responsibility for prior appraisal
BOX 1.3 Definition of the project.
SF: Art. 5, Reg. 2081/93 (SF Framework Regu-lation).Forms of assistance“1. Financial assistance under the Structural Funds,from the EIB and the other existing Communityfinancial instruments shall be provided in a varietyof forms that reflect the nature of the operations.2. In the case of the Structural Funds and theFIFG, financial assistance may be provided prin-cipally in one of the following forms: (a) part-financing of operational programmes; … (d)part-financing of suitable projects; (…)”This Guide concerns both major individual pro-jects and those which are a part of an operationalprogramme.
CF: Art. 1, Reg. 1265/1999.1. The Commission may, in agreement with thebeneficiary member State, group projects toge-ther and designate technically and financiallyseparate stages of a project for the purpose ofgranting assistance.2. For the purpose of this Regulation, the follo-wing definitions shall apply: a) a “project” shallbe an economically indivisible series of worksfulfilling a precise technical function and withclearly identified aims from which to judge whe-ther the project complies with the criterion laiddown in the first indent of article 10, (5); b) a“technically and financially independent stage”,shall be a stage which can be identified as ope-
rational in its own right.3. A stage may also cover preliminary, feasibilityand technical studies needed for carrying out aproject.4. To comply with the criterion in the third indentof article 1 (3), projects meeting the followingthree conditions may be grouped: a) they must belocated in the same area or situated along thesame transport corridor; b) they must be carriedout under an overall plan for the area or corridor,with clearly identified goals, as provided for inarticle 1 (3); c) they must be supervised by a bodyresponsible for co-ordinating and monitoring thegroup of projects, in cases where the projects arecarried out by different competent authorities.
BOX 1.4 Role of the EIB and the World Bank.
CF: cons. Reg. 1164/94, article 13 (Appraisal, monitoring and evalua-
tion). In order to ensure the effectiveness of Community assistan-ce, the Commission and the beneficiary Member States shall, inco-operation with the EIB where appropriate, carry out a syste-matic appraisal and evaluation of projects.
ISPA: Reg. 1267/1999, Enclosure II (B). The Commission mayinvite the EIB, EBRD or World Bank to contribute to the appraisalof measures as necessary. The Commission is to examine appli-cations for assistance to verify in particular that the administrati-ve and financial mechanisms are adequate for the effectiveimplementation of the measure.
1.4 Information required

OverviewThis chapter offers a quick overview of theessential information that the proposer of aproject to be co-financed is advised toinclude in the application dossier. It alsoprovides a reading grid for the Commissionofficials or external consultants to be usedin their assessment of the cost-benefitanalysis of investment projects.
The agenda is structured in seven steps.
Some of these steps are preliminary butnecessary requirements for cost-benefitanalysis.
• Objectives definition
• Project identification
• Feasibility and options analysis
• Financial analysis
• Economic analysis
• Multicriteria analysis
• Sensitivity and risk analysis
Each section will take a strictly operationalperspective and each problem will be analy-sed both from the standpoint of the propo-ser and that of the project examiner.
2.1 Objectives definitionDefinition of the project’s objectives andthe object of the study is essential in orderto identify the project, which representsthe starting point for the appraisal.Generally speaking, the question the appli-cation dossier should be able to answer isthe following one:
What are the socio-economic benefitsthat can be attained with the project im-plementation?
The analysis of the objectives lies in verifyingthat:
1. The application dossier or the appraisalreport should set forth which socio-econo-mic variables the project is liable to in-fluence.
2. The proposer should indicate which ofthe specific objectives of EU regional andcohesion policies could be achieved by theproject and, in particular, how the project,if successful, will influence the attainmentof these objectives.
The objectives considered should besocio-economic variables and not justphysical indicators. They should be logi-
An agenda for the project examiner
Chapter 2
15
Reading this Guide will help to betterunderstand what information is requiredby the Commission for the questions men-tioned previously in the articles of the regu-lations of the FS, the CF, the ISPA and else-where, on how to evaluate the socio-econo-mic benefits and costs; how to consider theimpact on regional development and onthe environment; how to weight the directand indirect effects on employment, bothimmediate and permanent; how to evalua-te the economic and financial profitability,etc. There are different ways of respondingto these requests for information: theGuide stresses some fundamental que-stions, methods and criteria.
understand the extent to which the capitalinvested in the project may be at least par-tially recouped over the years. This maycome about, for example, via the sale of ser-vices, if this is contemplated, or throughother means of non-transitory financingthat may generate inflows of cash sufficientto cover expenditure for the whole periodof implementation of the project.
Another reason why a suitable financialanalysis is important for any project,regardless of whether it produces a positivefinancial return, is that this analysis is thebasis for the CBA and its existence impro-ves the quality of the project evaluation.
14
1.4 Information required
BOX 1.5 Information required by the ISPA.
ISPA: Reg. 1267/1999, annex I : Contents of theapplication [article 7, section 3, letter a)]Applications are to contain the following infor-mation: 1. the name of the body responsible forimplementation, the nature of the measure and adescription thereof; 2. the cost and location of themeasure, including, where applicable, an indica-tion of the inter-connection and interoperabilityof measures situated on the same transport axis;3. the timetable for implementation of the work;4. a cost-benefit analysis, including the directand indirect effects on employment to be quanti-fied where they lend themselves to be quantified;
5. assessment of the environmental impact simi-lar to the assessment provided for in CouncilDirective 85/337/EEC of 27 June on the asses-sment of the effects of certain public and privateprojects on the environment (1); 6. information oncompliance with competition law and public con-tract rules; 7. the financing plan including, wherepossible, information on the economic viability ofthe measure, and the total financing the benefi-ciary country is seeking from ISPA, the EIB inclu-ding its pre-accession facility and any otherCommunity or Member State source, the EBRDand the World Bank; 8. the compatibility of mea-
sures with Community policies; 9. information onthe arrangements for ensuring the efficient useand maintenance of facilities; 10. (environmentalmeasures) information on the place and priorityof the measure within the national environmentalstrategy as laid down in the national programmefor the adoption of the acquis communautaire;11. (transport measures) information on thenational transport development strategy and theplace and priority of the measures within thatstrategy, including the degree of coherence withthe guidelines for the trans-European networksand the pan-European transport policy.
BOX 1.6 Information required by the SF and CF.
SF: Art. 26 reg. 1260/99: “During the implementa-tion of assistance, where a Member State or managingauthority envisages the Funds contributing to amajor project, it shall inform the Commission inadvance, and provide the following information: a)the body to be responsible for implementation; b)the nature of the investment and a description ofit, its financial volume and location; c) the time-table for implementing the project; d) cost-benefitanalysis including financial costs and benefit, arisk assessment and informations on the econo-mic viability of the project; e) plus: - in the case ofinvestments in infrastructure: the analysis of thecosts and the socio-economic benefits of the pro-ject, including an indication of the anticipated rateof use, the foreseeable impact on the developmentor conversion of the region concerned, and theapplication of Community rules on public contrac-ting; - in the case of investment in production faci-lities: the analysis of the market prospects in the
sector concerned and the anticipated return on theproject; f) the direct and indirect effects on theemployment situation, as far as possible in theCommunity; g) information allowing an evaluationto be made of the environmental impact and theimplementation of the precautionary principlesand the principle that preventive action should betaken, that environmental damage should as apriority be rectified at source and that the pollutershould pay and compliance with the Communityrules on the environment; h) information needed toassess compliance with competition rules, interalias rules on State aids; i) an indication of theinfluence of the contribution of the Funds on whe-ther the project will be implemented; j) the finan-cing plan and the total financial resources expec-ted from the contribution of the Funds and anyother sources of Community finance.CF: Art. 10(4) cons. reg. 1164/94: Applications shallcontain the following information: the body
responsible for implementation, the nature of theinvestment and a description thereof, its costsand location, including, where applicable, an indi-cation of projects of common interest situated onthe same transport axis, the timetable for imple-mentation of the work, a cost-benefit analysis,including the direct and indirect effects onemployment, information enabling impact on theenvironment to be assessed, information onpublic contracts, the financing plan including,where possible, information on the economic via-bility of the project, and the total financing theMember State is seeking from the Fund and anyother Community source. They shall also containall relevant information providing the requiredproof that the projects comply with theRegulation and with the criteria set out in section5, and particularly that there are medium-termeconomic and social benefits commensuratewith the resources deployed.
Frequent ErrorsSocio-economic variables should be measurable, such as per capi-ta income, rate of employment, consumption value per capita, etc.It is important to avoid some frequent errors:
• a vague statement that the project will promote economic deve-lopment or social welfare is not a measurable objective;
• hectares of new forest are easily measurable, but they are notthemselves a social objective: they are project outputs, not out-comes.
• per-capita GDP within a given region is a measurable socialobjective, but only very large projects, probably those of interre-gional or national scale may have a measurable impact on it; onlyin such cases may it be worthwhile to try to forecast how aggre-gate regional GDP will change in the long term with and withoutthe project.

cally connected with the project and thereshould be some indications on how tomeasure their level of attainment.
With regard to the definition of socio-economic objectives, the proposer mustbe able to answer the following key que-stions.
First and foremost: can we say that the ove-rall welfare gains arising from the projectare worth its cost?
Secondly: have all the most importantdirect and indirect socio-economic effectsof the project been considered?
Thirdly: if it is not possible to measure alldirect and indirect social effects for lack ofdata, have some proxies related to theobjective been identified?Clear and complete definition of thesocio-economic objectives is necessary todetermine the impact of the project.However, it may often be difficult to fore-cast all the impacts of a given project.Welfare changes have also a number ofcomponents. For example, regional datado not usually allow us to make reliableestimates of the overall impact of indivi-dual projects on trade with other regions;indirect employment effects are difficultto quantify; competitiveness may dependon external trade conditions, exchangerates, changes in relative prices; all varia-bles for which it may be too expensive to
make project-specific ana-lysis.
However, variables correla-ted to the socio-economicobjectives may often befound in these cases. Forexample, if it is difficult todetermine the increase inproductivity and competi-tiveness of a region, it maybe possible to measure thechange in exports.
However the approach of the presentGuide is not to consider always all the indi-rect and maybe far-off effects of a project(which could be a large number and verydifficult to consider and quantify). Theprocedure the Guide suggests focuses onlyon cost-benefit analysis of microeconomicvariables.
Whilst the assessment of social benefits ofeach project depends on the economicpolicy objectives of the partners involved,the essential requisite from the Com-mission’s perspective is that the project belogically related to the main objectives ofthe funds involved: SF, CF and ISPA. Theproject promoter must be certain that theassistance proposed is coherent with the-se objectives and the examiner mustascertain that this coherence effectivelyexists and that it is well justified.Specifically, the projects are part of, forSF, CF and ISPA, programmes formulatedat the national or regional level (SPD,Operational Programmes and Pro-gramme Complements for objective 1,SPD for objectives 2 and 3 of the SF’s, theprogramme plan and national plan for CFand ISPA).
In addition to the general objectives of theindividual funds, the project must be cohe-rent with EU legislation in the specific sec-tor of assistance, mainly transport, envi-ronment and with regulation in terms ofcompetition.
16
2.1. Objectives definition
2.2 Project IdentificationIn order to identify the project, the follo-wing must be verified:
1. that the object is a clearly identified unitof analysis, according to general CBA prin-ciples;
2. that the object of assessment reflects thedefinition of the project provided byregulations;
3. that the financial thresholds set forth byregulations are respected (see box 1.2,chapter one, Financial Thresholds).
2.2.1 Clear identificationThe project must be clearly identified as aself-sufficient unit of analysis. Specifically,the activities included in the project mustlead back to a unique objective as well as toa coherent and co-ordinated entity ofactions and roles.
Obviously, the above also applies to the casein which the analysis report presents onlysome initial phases of the investment, who-se success hinges on the completion of theproject as a whole. It is particularly impor-
tant to stress this point because in practice,the administrative decision-making processmay entail the need to break the projectdown into various tranches.
In some cases, another risk may arise: acomprehensive project is presented but co-financing is requested only for one of theparts and it is not clear whether the otherfundamental parts will or will not be car-ried out.
The identification of projects necessitatinga better appraisal may in some cases entailrequesting Member States to reconsidersome sub-projects as one large project andprovide additional related information,such as the CBA, as required by the regula-tions mentioned above.
The proposer has the task of providing thejustification for the choice of identificationof the subject of analysis and the examinerhas the task of judging the quality of thischoice. In the event that the object of analy-sis is not clearly identified, the examinermay request that the proposer integrate thepresentation dossier with a clarification ofits identification.
2.2 Project Identification
17
Check list for objectives definition• Does the project have a clearly defined objective in terms of socio-economic variables?
• Are these socio-economic benefits attainable with implementation of the project?
• Are the objectives connected logically?
• Are the overall welfare gains arising from the project worth its cost?
• Have all the most important direct and indirect socio-economic effects of the projectbeen considered?
• If it is not possible to measure all direct and indirect social effects, have all proxies rela-ted to the objective been identified?
• Are the means of measuring the attainment of objectives indicated?
• Is the project coherent with the EU objectives of the funds? (pursuant to Art. 25 Reg.1260/1999, Art. 1, Reg. 1164/1994, Art. 2 Reg. 1267/1999)
• Is the project coherent with the EU objectives specific to the sector of assistance?
• A highway project connecting town A with town B, whichis justified only by the expectation that an airport will belocated in the vicinity of town B and that most of thetraffic will take place between the airport and town A:the project should be analysed in the context of the air-port-highway system as a whole;
• A hydroelectric power station, located in X and supposedto serve a new energy-intensive plant: again, if the twoworks are mutually dependent for the assessment ofcosts and benefits, the analysis should be integrated,even if the EU assistance is requested only for the energysupply part of the project;
• A large-scale productive forestation project, financedwith public funds and justified by the opportunity tosupply a privately owned cellulose company: the analy-
sis should consider both costs and benefits of bothcomponents, that is the forestation project and theindustrial plant;
• The construction of a water purification plant justifiedby expectations of the development of a tourist destina-tion, including hotel complexes, is justified only if thesite is developed;
• A waste treatment plant linked to urban planning thatprovides for the expansion of a given area justifies theassistance only in the context of new settlements of peo-ple. In many cases, the most appropriate unit of analysismay be more than its parts. Clearly, the CBA of only oneof its parts would give false results. Should the examinerreceive an incomplete appraisal dossier, s/he shouldrequest a broader analysis.
Examples of Identification of a Project

the scale of the pr oject, itslocation, physical inputs,timing and implementa-tion, phases of expansion,financial planning , envi-ronmental aspects. Inmany cases, the analysis oflarge pr ojects entails detai-led suppor t studies (eng i-neer ing , marketing , etc; seeanne x G, Table of Contentsof a Feasibility Study, sho-wing a t ypical table of con-tents of a feasibilit y study).
In some cases a pr oject ma ypass a CB A test, despit e being socially infe-rior to alternati ves.
Typical e xamples ar e transpor t projectswher e differ ent routes or differ ent con-struction timing or differ ent technolog iesmay be consider ed; large hospital st ructu-res rather than a mor e widespr ead offer ofhealth ser vices; the location of a plant inarea A versus ar ea B; differ ent peak-loadarrangements for energ y supply ; energ yefficiency impr ovements r ather than (or inaddition t o) the const ruction of newpower plants; etc.
For each project at least thr ee alt ernati vescould be consider ed:
• the do nothing alternative;
• the do minimum alternative;
• the do something alternative (or reaso-nable alternative, a project based on analternative technology or concept).
The do nothing alternative is the basicapproach of the project analysis that aims
at least to compare thesituations with and with-out the project. The donothing alternative is alsocalled the inertial scenario.
For example in order tolink two areas the do no-thing alternative is to usethe old ferry service, the dominimum alternative couldbe to renew/improve ferryservice and the projectcould be to construct abridge.
The calculation of the financial and econo-mic performance indicators must be per-formed on the basis of the difference bet-ween the do-something alternative and thedo-nothing alternative or the do-mini-mum alternative.
2.4 Financial AnalysisThe purpose of the financial analysis is touse the project’s cash flow forecasts in orderto calculate suitable return rates, specifi-cally the financial internal rate of return(FRR) on investment (FRR/C) and owncapital (FRR/K) and the correspondingfinancial net present value (FNPV).
While the CBA encompasses more than justthe consideration of the financial returns ofa project, most of project data on costs andbenefits is provided by financial analysis.This analysis provides the examiner withessential information on inputs and out-puts, their prices and the overall timingstructure of revenues and expenditures.
The financial analysis is made up of a seriesof tables that collect the financial flows ofthe investment, broken down by totalinvestment (Tab. 2.1), operating costs andrevenue (Tab. 2.2), sources of financing(Tab. 2.3) and cash flow analysis for finan-cial sustainability (Tab. 2.4).
19
2.4 Financial Analysis
In this regard, please also see the projectidentification sub-paragraphs in the thirdchapter.
2.2.2 Financial thresholdThe Regulations presented in Chapter 1show a financial threshold of acceptableprojects that must be respected. In fact,the total cost (eligible cost for ERDF) ofproposed investments must be higher thanthe values shown in Fig. 2.1 (for the dis-tinction between eligible and total cost ofthe investment, see the section on finan-cial analysis).
2.2.3 Project definitionFor project definition the reader is referredto paragraph 1.2.
As regards the assessment of a series ofprojects grouped together according to theprinciples outlined above, generally, theanalysis is not carried out on each indivi-dual project, but rather through samplechecks or on the major components.
On this point, the examiner’s check con-sists in reconstructing the technical-eco-nomic context that justifies the identifica-tion of the subject of the appraisal as thekey point for project evaluation. However,sometimes the CBA requires goingbeyond the administrative definitions.
For instance, in order to assess the qualityof a given project, the proposer must pro-duce an adequate ex ante evaluation, notonly for the part of the project to befinanced with the assistance of SF or CFor ISPA, but for the parts that are closelyconnected to it as well.
2.3 Feasibility and options analysisFeasibility does not relate only to enginee-ring aspects, but in many cases, it also con-cerns aspects of marketing, management,analysis of the implementation, etc. Wemay often adopt various project options inorder to achieve a socio-economic objecti-ve. The proposer should give evidence thathis project choice is the best option of allfeasible alternatives. In some cases, a pro-ject may be considered valid from the CBAstandpoint, but inferior to other alternativeoptions. In order to check that project is thebest of all alternative options, the followingquestions should be answered:
Firstly, has the application dossier given suf-ficient evidence of the project’s feasibility?
Secondly, has the applicant demonstratedthat alternative options have been adequa-tely considered?
The project examiner should be certainthat the applicant has carried out an appro-priate feasibility study as well as an analysisof alternative options. If there is not suffi-cient evidence to support this, the examinermay recommend that this be done and thatthe project be consequently revised.
Typical feasibility reports for major infra-structures may include information on theeconomic and institutional context, foreca-sted demand (either market or non-mar-ket), available technology, the productionplan (including the utilisation rate of theinfrastructure), personnel requirements,
2.3 Feasibility and option analysis
Fig. 2.1 Financial threshold for acceptable projects
Fund Threshold in millions of euro
ERDF 50CF 10ISPA 5
Example of optionsIn order to link town A and town B,there are three feasible alternati-ves: 1. build a new railway2. lay a new road3. strengthen the existing road (“dominimum” option)If a project providing for thelaying of a new road is proposed,evidence must be given to showthat it is better than the alternati-ves of the railway and the develo-ping of the existing road, despitetheir feasibility.
BOX 2.1 Options Analysis
CF: Art 1(2) Reg 1265/1999: Beneficiary Member States shallprovide all necessary information as set out in article 10 (4), inclu-ding the results of feasibility studies and ex ante appraisals. (..)Member States shall also provide, (…) where appropriate, an indi-cation of the possible alternatives that were not chosen.
Checklist for project identification • Does the project constitute a clearly identified unit of analysis?
• Is it a project, a phase of a project or a series of projects? (pur-suant to Art. 25 Reg. 1260/1999, Art. 1, Reg. 1265/1999, Art. 2 Reg.1267/1999)
• Is it a series of projects that satisfy the conditions with regard to loca-tion, part of a global plan, responsibility of the supervisory board?
• Does the project satisfy the financial thresholds established in bythe Regulations?

21
2.4 Financial Analysis
The financial analysis should finally resultin two tables summarising the cash flows:
1. one for investment returns (capacity ofoperating net revenues to sustain theinvestment costs, Tab. 2.5) regardless ofthe way in which they are financed;
2. the other for the calculation of thereturns on equity capital where in theoutflows there are the own equity of theprivate investor (when it is paid up), thenational contribution at three levels(local, regional and central), the finan-cial loans at the time they are paid back,in addition to operating costs and rela-ted interest, and revenues for theinflows. It does not consider the EUgrant. It gives the rate of return of the
project considering its financial burden,regardless its investment costs (Tab. 2.6).
In order to correctly draw up the tablesabove, careful attention must be paid to thefollowing elements:
• time horizon;
• the determination of total costs (totalinvestments costs, row 1.21, and totaloperating costs, row 2.9);
• revenues generated by the project (sales,row 2.13);
• the residual value of the investment(row 1.19);
• adjustment for inflation;
• verification of financial sustainability(Tab. 2.4);
• selection of the appropriate discount rate;
• determination of the main performanceindicators (Tables 2.5 and 2.6, FRR andFNPV of the investment and capital, row5.4, 5.5, 6.4, 6.5);
• determination of the co-financing rate.
2.4.1 The time horizonBy time horizon, we mean the maximumnumber of years for which forecasts areprovided. Forecasts regarding the future
20
2.4 Financial Analysis
Checklist for feasibility study and option analysis:Has the application dossier given sufficient evidence of the projec-t’s feasibility (from an engineering, marketing, management, imple-mentation, environmental…points of view)?Has the applicant demonstrated that alternative options have beenadequately considered (at least in terms of do nothing or do-mini-mum alternatives?).
Fig. 2.2 Structure of financial analysis
1. Total investment
3. Sources of finance 6. Calculation of FRR/K
5. Calculation of FRR/C
4. Financial sustainability2. Total operating costs and revenues
Tab. 2.1 Total Investments - Thousands of Euro
Years
1 2 3 4 5 6 7 8 9 10
1.1 Land 4001.2 Buildings 700 600 1501.3 New equipment 155 74 80 911.4 Used equipment 283 2811.5 Extraordinary Maintenance 200
1.6 Fixed assets 1100 1038 505 80 200 0 91 0 0 01.7 Licences 5001.8 Patents 5001.9 Other pre-production expenses 60
1.10 Pre-production expenses 0 60 1000 0 0 0 0 0 0 0
1.11 Investment costs (A) 1100 1098 1505 80 200 0 91 0 0 0
1.12 Cash 26 129 148 148 148 148 148 148 148 1481.13 Clients 67 802 827 827 827 827 827 827 827 8271.14 Stock 501 878 880 880 880 880 880 880 880 8801.15 Current Liabilities 508 1733 1694 1694 1694 1694 1694 1694 1694 16941.16 Net working capital (=1.12+1.13+1.14-1.15) 86 76 161 161 161 161 161 161 161 161
1.17 Variations in working capital (B) 86 -10 85 0 0 0 0 0 0 01.18 Replacement of short life equipment 2001.19 Residual value -1500
1.20 Other investment items (C) 0 0 0 0 200 0 0 0 0 -15001.21 Total investment costs (A)+(B)+(C) 1186 1088 1590 80 400 0 91 0 0 -1500
Tab. 2.2 Operating Revenues and Costs - Thousands of Euro
Years
1 2 3 4 5 6 7 8 9 10
2.1 Raw materials 1564 5212 5212 5212 5212 5212 5212 5212 02.2 Labour 132 421 421 421 421 421 421 421 02.3 Electric power 15 51 51 51 51 51 51 51 02.4 Combustible 5 18 18 18 18 18 18 18 02.5 Maintenance 20 65 70 70 70 70 70 70 02.6 General industrial costs 18 75 80 80 80 80 80 80 02.7 Administrative costs 48 210 224 224 224 224 224 224 02.8 Sales expenditures 220 1200 1400 1400 1400 1400 1400 1400 0
2.9 Total operating costs 2022 7252 7476 7476 7476 7476 7476 7476 02.10 Product A 400 1958 2458 2458 2458 2458 2458 2458 02.11 Product B 197 840 1140 1140 1640 1640 1640 1640 02.12 Product C 904 2903 3903 3903 4403 4403 4403 4403 0
2.13 Sales 1501 5701 7501 7501 8501 8501 8501 8501 02.14 Net operating revenue -521 -1551 25 25 1025 1025 1025 1025 0
Row numbers identifyitems. They should be usedto fill in the next tables.
Residual value should always be included at end year (seealso below). It is an inflow. It is considered with a ‘minus’ inthis table because all the other items are outflows.
During the first year no operating revenues andcosts occurs, but only investment costs (see tab.1).
BOX 2.2 Time Horizon
CF Guidelines: “The lifetime varies according tothe nature of the investments: it is longer for civilengineering works (30-40 years) than for technicalinstallations (10-15 years). In the case of a mixedinvestment comprising civil engineering worksand installations, the lifetime of the investmentmay be fixed on the basis of the lifetime of theprincipal infrastructure (in this case investment in
the renewal of infrastructure with a shorter lifeti-me must be included in the analysis). The lifetimemay also be determined by considerations of alegal or administrative nature: for example theduration of the concession where a concessionhas been granted”.ISPA Guidelines: “infrastructure projects are gene-rally appraised over a period of 20-30 years, which
represents a rough estimate of their economic lifespan. Although the physical assets may last signifi-cantly longer than this – e.g. a bridge may last for100 years - it is not generally worthwhile trying toforecast over longer periods. In the case of assetswith a very long life, a residual value may be addedat the end of the appraisal period to reflect theirpotential resale value or continuing use value”.

23
2.4 Financial Analysis
22
2.4 Financial Analysis
Tab. 2.3 Sources of Financing Table - Thousands of Euro
Years
1 2 3 4 5 6 7 8 9 10
3.1 Private equity 100 200 100 0 0 0 0 0 0 03.2 Local level3.3 Regional level 2003.4 Central level 200 200 100
3.5 Total national public contribution (=3.2+3.3+3.4) 400 200 100 0 0 0 0 0 0 03.6 EU grant 1132 1056 1013 532 4963.7 Bonds and other financial resources3.8 EIB Loans 0 18223.9 Other Loans
3.10 Total financial resources (=3.1+3.5+...+3.9) 1632 1456 3035 532 496 0 0 0 0 0
Loan is here an inflow and it isaccounted as a financial resourcecoming from third parties.
The EU grant should be included in thistable. It is also included in the financialsustainability table below.
Private equity is the contributionof a private investor.
Loan here is considered at the moment it is reim-boursed as an outflow. The inflow item of loan isincluded in the financial resources (row 3.8).
Financial sustainabilityyis verifiedif this rowwissmore than or equal tozero ffor all theyyearssconsidered.
In this table residual value isincluded only if the investment isreally liquidated at end year. Inthis case there is no residualvalue as there is no liquidationand consequently no real inflowof money.
As can be seen from the row numbers, all the itemsof this table have already been calculated in theprevious table. To draw up this table and the nextone it is necessary to include all the requesteditems and calculate the rates.
Tab. 2.5 Calculation of the Financial Internal Rate of Return of the Investment -Thousands of Euro
Years
1 2 3 4 5 6 7 8 9 10
2.13 Sales 0 1501 5701 7501 7501 8501 8501 8501 8501 05.1 Total revenues 0 1501 5701 7501 7501 8501 8501 8501 8501 0
2.9 Total operating costs 0 2022 7252 7476 7476 7476 7476 7476 7476 04.3 Retirement bonus 0 0 0 0 0 0 0 0 0 1971.21 Total investment costs 1186 1088 1590 80 400 0 91 0 0 -1500
5.2 Total expenditures 1186 3110 8842 7556 7876 7476 7567 7476 7476 -13035.3 Net cash flow (=5.1-5.2) -1186 -1609 -3141 -55 -375 1025 934 1025 1025 13035.4 Financial internal rate of return (FRR/C) of the investment -3.16%5.5 Financial net present value (FNPV/C) of the investment -2058
Tab. 2.6 Table for the Calculation of the Financial Internal Rate of Return of Capital -Thousands of Euro
Years
1 2 3 4 5 6 7 8 9 10
2.13 Sales 0 1501 5701 7501 7501 8501 8501 8501 8501 01.19 Residual value 0 0 0 0 0 0 0 0 0 1500
6.1 Total revenues 0 1501 5701 7501 7501 8501 8501 8501 8501 15002.9 Total operating costs 0 2022 7252 7476 7476 7476 7476 7476 7476 04.2 Interests 0 0 8 8 8 8 8 8 8 04.3 Retirement bonus 0 0 0 0 0 0 0 0 0 1974.4 Loans reimboursement 0 0 0 168 189 211 237 265 300 4513.1 Private equity 100 200 100 0 0 0 0 0 0 03.5 Total national public contribution 400 200 100 0 0 0 0 0 0 0
6.2 Total expenditures 500 2422 7460 7652 7673 7695 7721 7749 7784 6486.3 Net cash flow (=6.1-6.2) -500 -921 -1759 -151 -172 806 780 752 717 8526.4 Financial internal rate of return (FRR/K) of capital 2.04%6.5 Financial net present value (FNPV/K) of capital -439
Financial internal rate of return on investment iscalculated considering total investment costs as anoutflow (together with operating costs) and reve-nues as an inflow. It measures the capacity of ope-rating revenues to sustain the investment costs.
Often for EU co-financed projects FNPV/C is a nega-tive value. This is due to the negative net cash flowduring the first years which, for the discounting pro-cedure, weights more than the last positive years.
A discount rate of 5% has beenapplied to calculate these values
Financial internal rate of return on invested capital (shareholders'equity) is calculated with the shareholder’s equity of the member state(public and private) when it is paid up, the financial loans at the timethey are paid back, in addition to operating costs and related interest,and revenues for the inflows. It does not consider the EU grant.
Interest, retirement bonus, loansreimboursement and taxes arethe only items not already inclu-ded in the previous tables. All theother items should be taken bythe previous tables looking at therow number.
Tab. 2.4 Financial Sustainability Table - Thousands of Euro
Years
1 2 3 4 5 6 7 8 9 10
3.10 Total financial resources 1632 1456 3035 532 496 0 0 0 0 02.13 Sales 0 1501 5701 7501 7501 8501 8501 8501 8501 0
4.1 Total inflows 1632 2957 8736 8033 7997 8501 8501 8501 8501 02.9 Total operating costs 0 2022 7252 7476 7476 7476 7476 7476 7476 01.21 Total investment costs 1186 1088 1590 80 400 0 91 0 0 04.2 Interest 0 0 8 8 8 8 8 8 8 04.3 Retirement bonus 0 0 0 0 0 0 0 0 0 1974.4 Loans reimboursement 0 0 0 168 189 211 237 265 300 4514.5 Taxes 0 62 78 83 95 95 95 95 95 0
4.6 Total outflows 1186 3172 8928 7815 8168 7790 7907 7844 7879 6484.7 Total cash flow 446 -215 -192 218 -171 711 594 657 622 -6484.8 Cumulated total cash flow 446 231 39 257 86 797 1391 2048 2670 2022
Interest are paid onEIB loans (see row3.8) starting fromyear 3 in which loanis registered as aninflow.

trend of the project should be formulatedfor a period appropriate to its economicallyuseful life and long enough to encompassits likely mid/long term impact.
The choice of time horizon may have anextremely important effect on the resultsof the appraisal process. More concretely,the choice of time horizon affects the cal-culation of the main indicators of the cost-benefit analysis, and may also affect thedetermination of the co-financing rate.
The maximum numbers of years for whichforecasts are provided determine the timespan of a project and are tied to the sectorof the investment. For the majority ofinfrastructures, for example, this time hori-zon (indicatively) is at least 20 years; forproductive investments, and again indicati-vely, it is about 10 years.
Nevertheless, the time horizon should notbe so long as to exceed the economicallyuseful life of the project.This problem may be resolved by using astandard grid, differentiated by sector andbased on some internationally accepted
practices, in which reference time horizonsare provided, which can be applied to thetype of investment being examined. Anexample is that provided in Tab. 2.8.
2.4.2 Determining Total CostsThe data for the cost of a project are provi-ded by the sum of costs of investment(land, buildings, licences, patents, Tab. 2.1)and operating costs (personnel, raw mate-rials, supply of energy, Tab. 2.2).
The Application Forms for the CohesionFund and ISPA require the specification ofthe amounts of eligible costs and totalcosts. The difference between the two costitems derives mainly from:1. land purchase expenditure2. payment of VAT 3. expenses borne before the presentation
of the application4. related work or connected expenses.
The international methodology of financialanalysis of the project on a cash flow basissuggests conducting the financial analysisand the calculation of investment returnsusing the total costs of the investment (Tab.2.1) borne beginning on the date the applica-tion was presented (in other words, normallyno cost borne before may be considered todetermine the FRR or other indicators).
Nevertheless, in some cases, the Commis-sion may allow for the inclusion of someexpenses borne before the application inthe total costs (see annex C on determiningthe co-financing rate).
In the calculation of operating costs (Tab.2.2) in order to determine the financial
24
2.4 Financial Analysis
internal rate of return, all items that do notgive rise to an effective monetary expendi-ture must be excluded, even if they areitems normally included in companyaccounting (Balance Sheet and Profit andLoss Account). In particular, the followingitems are to be excluded, as they are notcoherent with the DCF method:
• depreciation and amortisation, as theyare not effective cash payments;
• any reserves for future replacement costs,in this case as well, they do not corre-spond to a real consumption of goods orservices;
• any contingency reserves, because theuncertainty of future flows is taken intoconsideration in the risk analysis
1and not
through figurative costs (see further).
2.4.3 Revenue Generated by the ProjectSome projects may generate their own reve-nue from the sale of goods and services.This revenue will be determined by theforecasts of the quantities of services provi-ded and by the relative prices and are ente-red in Tab. 2.2 for the financial analysiswith operating revenue.
The following items are usually not to be in-cluded in the calculation of future revenues:
• Costs and benefits should be net of VAT.Other indirect taxes should be includedonly if they are charged to the investor.
• any other subsidies (transfers from otherauthorities, etc.);
In some cases (for example, for railways oraqueducts) the investor may be differentthan the body that will operate the infra-structure and may the latter pays a tariff (orsimilar) to the former. This tariff may notreflect full costs, contributing to the crea-tion of a financing gap.
The revenues to consider for the financialanalysis are usually those that accrue to theowner of the infrastructure.Nevertheless, on a case by case basis, theCommission may also ask for a consolida-ted financial analysis for both parties.
2.4.4 Residual Value of the InvestmentAmong the revenue items at the final yearconsidered, there is the residual value ofthe investment (e.g., standing debt, stan-ding assets, such as buildings and machi-nery, etc.), which represents the residualvalue item in Tab. 2.1, taking into accountinvestment items. In this table all itemsare investment costs (outflows) and theresidual value must be included with theopposite sign (negative if the others arepositive) because it is an inflow. In thenext table (financial sustainability or cal-culation of FRR/K) it is considered with apositive sign because it is included in therevenues.
The residual value is considered in thesustainability table only if it corresponds toa real inflow for the investor.
It is always considered for the calculation ofFRR/C and FRR/K.
25
2.4 Financial Analysis
Tab. 2.7 Time horizon (years) in the appraisal of a sample of 400 large projects ‘92-‘94 and ‘94-’99 combined
Average Number*time horizon of projects
Energy 24.7 9Water and environment 29.1 47Transport 26.6 127Industry 8.8 96Other services 14.2 10Average total 20.1 289
The table is based on an ad hoc survey carried out in 1994 by aworking team of the Evaluation Unit, DG XVI Regional Policy. It is notnecessarily representative of the composition of the larger numberof major projects co-financed by SF in the period 1989-93.
In 1996, the Evaluation Unit carried out a new survey of a sam-ple of 200 major projects. In addition to the second generation ofprojects co-financed by the ERDF (1994-99), the analysis wasextended to projects co-financed by the CF since its temporaryestablishment in 1993 (as the “Cohesion Financial Instrument”).Although CF projects generally carry an investment cost of atleast 10 million ECU, for ease of comparison with projects co-financed by ERDF, only CF projects with a minimum investmentcost of 25 million ECU were considered in the survey. Once againthe new sample is not necessarily representative of the composi-tion of the larger number of major projects co-financed by SF andCF in the period concerned.
(*) Projects for which comparable data are available
BOX 2.3 Projects generating income
Structural Funds Regulation, Art. 29 1260/99: “Where the assi-stance concerned entails the financing of revenue-generatinginvestments, the contribution from the Funds to these investmentsshall be determined in the light of their intrinsic characteristics,including the size of the gross self-financing margin which wouldnormally be expected for the class of investments concerned in thelight of the macro-economic circumstances in which the invest-ments are to be implemented, and without there being any increa-se in the national budget effort as a result of the contribution bythe Funds.”
Cohesion Fund Regulation, art.1 Reg. 1264/1999: “this ratemay be reduced to take account, in co-operation with the MemberState concerned, of the estimated revenue generated by projectsand of any application of the polluter-pays principle”.
ISPA Regulation, art. 6 Reg. 1267/1999: “Save in the case ofrepayable assistance or when there is a substantial Communityinterest, the rate of assistance shall be reduced to take intoaccount; • the availability of co-financing • the measure’s capacity to generate revenues, and • an appropriate application of the polluter-pays principle”.
Tab. 2.8 Average time horizon (years) recommended for the 2000-2006 period.
Projects by sector Average time horizon
Energy 25Water and environment 30Railways 30Roads 25Ports and airports 25Telecommunications 15Industry 10Other services 15
Source: our elaboration of OECD and project data.
1In fact risk analysis (as shown in section 2.7 and annex D) considersprobability distribution of uncertain variables and deals with theirexpected values. Obviously there may be some variables for whichno probability distribution is available: this will be the case foruntreatable uncertainty that cannot be included in any reserve. Asmall flow of expenditure for unexpected events could be howevertreated as a flow of maintenance cost.

The financial net present value is defined as:
NPV (S)=
where Sn is the balance of cash flow fundsat time n (net cash flow, row 5.3 and 6.3 ofTables 2.5 and 2.6) and at is the financialdiscount factor chosen for discounting (seealso point 6 and the discount factors table).
The financial internal rate of return is defi-ned as the interest rate that zeros out thenet present value of the investment:
NPV (S) =
All the most commonly used data manage-ment software automatically calculates the
value of these indicators by applying theappropriate financial function.
For productive investments, such as indu-strial plants, financial rates of return beforethe EU grant are usually well over 10%(real). For infrastructure, financial rates ofreturn are usually lower or even negative,partly because of the tariff structure ofthese sectors.
Usually the examiner uses the financial rateof return in order to judge the future per-formance of the investment. It could alsocontribute to deciding the co-financing rate(see also annex C).
In any case the Commission should be awa-re of the net financial burden of the projectand should be sure that the project, even ifassisted by co-financing, does not riskbeing stopped by lack of cash.
A very low or even negative financial rate ofreturn does not necessarily mean that theproject is not in keeping with the objectivesof the Funds.Nevertheless, the rate of returns value letsit be known that the investment may notever be profitable from the financialstandpoint. In this case, the proposershould specify what, if any, resources theproject will draw on when the EU subsidydiminishes.
27
2.4 Financial Analysis
Residual value may be calculated in twoways:
• by considering the residual market valueof fixed capital, as if it were to be sold atthe end of the time horizon considered;
• the residual value of all assets and liabilities.
The discounted value of every net futurereceipt after the time horizon should beincluded in the residual value. In otherwords, the residual value is the liquidationvalue.
2.4.5 Adjusting for inflationIn project analysis, it is customary to useconstant prices, that is to say prices adjustedfor inflation and fixed at a base-year.However, in the analysis of financial flows,current prices may be more appropriate;these are nominal prices effectively observedyear by year. The effect of inflation, or ratherthe general increase in the price index, oroscillations in relative prices, may impact onthe calculation of the financial return of theinvestment. Therefore, the use of currentprices is in general recommended.
On the contrary, if constant prices are used,corrections must be entered for changes inthe relative prices when these changes aresignificant.
2.4.6 Financial Sustainability (Tab. 2.4)The financial plan should demonstratefinancial sustainability, which is that theproject does not run the risk of runningout of money; the timing of fund receiptsand payments may be crucial in imple-menting the project. Applicants shouldshow how in the project time horizon,sources of financing (including receiptsand any kind of cash transfers) will consi-stently match disbursements year by year.Sustainability occurs if the net flow ofcumulated generated cash flow row is posi-tive for all the years considered.
2.4.7 Determining the Discount RateTo discount financial flows to the presentand to calculate of net present value (NPV,Tab.s 2.5 and 2.6), the suitable discountrate must be defined.
There are many theoretical and practicalways of estimating the reference rate to useto discount of the financial analysis. Seeannex B for an in-depth analysis.
The key concept is that of the opportunitycost of capital. In this regard, we recom-mend determining the discount rate byapplying a standard criterion, takingaccounts of some benchmarks. Indicatively,for the period 2000-2006, a 6% real ratemay be considered the reference parameterfor the opportunity cost of capital in thelong term (see annex A).
2.4.8 Determination of performance in-dicators. The indicators used for financial analysis(Tables 2.5 and 2.6) are:
• the financial internal rate of return;
• the financial net present value of the project.
Both of these indicators are to be calculatedboth for the investment (Tab. 2.5) and forthe invested capital (Tab. 2.6).
2.4 Financial Analysis
Discount RateDiscount rate. The rate at which future values are discounted tothe present. Usually considered roughly equal to the opportunitycost of capital.1 euro invested at an annual discount rate of 5% will be 1+ 5%=1.05after one year; (1.05)x(1.05)=1.1025 after two years;(1.05)x(1.05)x(1.05)=1.157625 after three years, etc. The discountedeconomic value of an euro that will be spent or earned in two yearsis 1/1.1025= 0.907029; in three years 1/1.57625=0.863838. The lat-ter is the inverse operation of that shown above.
Discount Factors Table
Years 1 2 3 4 5 6 7 8 9 10
(1+5%)-n .952 381 .907 029 .863 838 .822 702 .783 526 .746 215 .710 681 .676 839 .644 609 .613 913(1+10%)-n .909 091 .826 446 .751 315 .683 013 .620 921 .564 474 .513 158 .466 507 .424 098 .385 543
n: number of years
Tab. 2.9. Expected financial internal rates of re-turn of a sample of 400 major projects of the ‘firstgeneration’ and ‘second generation’ combined.
Average Number*of projects
Energy 7.0 6Water and environment -0.1 15Transport 6.5 55Industry 19.0 68Other services 4.2 5Total 11.5 149
Source: see Tab. 2.7 (*) Projects for which data were availableThe financial rate of return here considered is FRR/C.
BOX 2.4 Co-financing Rate
• Art. 29.3 Structural Funds Regulation 1260/99.A maximum of 75% of the total eligible cost and,as a general rule, at least 50% of eligible publicexpenditure in the case of measures carried outin the regions covered by Objective 1. Where theregions are located in a Member State covered bythe Cohesion Fund, the Community contributionmay rise, in exceptional and duly justified cases,to a maximum of 80% of the total eligible costand to a maximum of 85% of the total eligiblecost for the outermost regions and for the outl-ying Greek islands which are under a handicapdue to their distant location; (b) a maximum of50% of the total eligible cost and, as a generalrule, at least 25% of eligible public expenditure inthe case of measures carried out in areas cove-
red by Objective 2 or 3. In the case of investmentin firms, the contribution of the Funds shallcomply with the ceilings on the rate of aid and oncombinations of aid set in the field of State aids”;
• Cohesion Fund Reg., art.1 §7 Reg. 1264/1999and art. 7 reg. 1164/94. “The rate of Communityassistance granted by the Fund shall be 80 % to85 % of public or equivalent expenditure, inclu-ding expenditure by bodies whose activities areundertaken within an administrative or legalframework by virtue of which they may be dee-med to be equivalent to public bodies. Howeverfrom 1 January 2000 this rate may be reducedto take account, in co-operation with theMember State concerned, of the estimated
revenue generated by projects and of any appli-cation of the polluter-pays principle”.
• ISPA Regulation, art. 6 Reg. 1267/1999. “Therate of community assistance granted underISPA may be up to 75% of public or equivalentexpenditure, including expenditure by bodieswhose activities are undertaken within anadministrative or legal framework by virtue ofwhich they are regarded as equivalent to publicbodies. The Commission may decide, in accor-dance with the procedure laid down in Article14, to increase this rate to up to 85%, in parti-cular where it considers that a rate higher than75% is required for realising projects essentialfor achieving the general objectives of ISPA”.
∑at St = + +n
t=0 (1+i)0
S0(1+i)1
S1(1+i)n
Sn
∑St / (1+FRR)t = 0n
t=0

2928
2.5 Economic Analysis
2.4.9 Determination of the co-financingRateThe co-financing rate (see also annex C) isthe percentage that defines how much ofthe eligible costs are covered by EU finan-cing by grants.
Regulations define the maximum ceiling toapply for each Fund and establish the gene-ral principles for the formulation of thepercentage. Generally by area of implemen-tation (higher percentages in more disad-vantaged areas) and, more specifically, bythe co-existence of more funds in the samearea. See also box 2.4, Co-financing Rate.
Currently, the procedure set forth by theCommission provides for the calculation ofthe financing gap, through which the co-financing rate to apply to eligible costs isdetermined. For details on the recommen-dations proposed for the co-financing ratecalculation, refer to annex C.
2.5 Economic AnalysisThe economic analysis appraises the pro-ject contribution to the economic welfareof the region or country. It is made onbehalf of the whole society (region orcountry) instead of just the owner of theinfrastructure like in the financial analysis.
Moving on from Tab. 2.5 of the financialanalysis (the performance of the investmentregardless of its financial sources), the eco-nomic analysis, by mean of the definition ofappropriate conversion factors for each ofthe inflow or outflow items, outlines a table(Tab. 2.10) which includes benefits andsocial costs not considered by the financialanalysis. The logic of methodology allowingthe transfer from financial to economicanalysis is summarised in fig. 2.3 It consistsof the transformation of market prices usedin the financial analysis into accounting pri-ces (that amend prices distorted by marketimperfections) and of the consideration ofexternalities leading to benefits and social
costs unconsidered by the financial analysisas they do not generate actual money expen-ditures or income (for example environ-mental impacts or redistributive effects).This becomes possible by attribution to eachof the inflow or outflow items of an ad-hocconversion factor (see below) to changemarket prices into accounting prices.
International practice has assumed stan-dardised factors for some input/outputclasses, others require specific factors to bedefined case by case.
The economic analysis, therefore, is repre-sented by:
Phase 1: taxes/subsidies and other tran-sfers corrections;
Phase 2: externalities corrections;
Phase 3: conversion of market prices intoaccounting prices to include also socialcosts and benefits (determination of con-version factors).
Once the table for the economic analysis isready, like in the financial analysis the firststep is the discounting made by the selec-tion of a correct social discount rate andthe calculation of the internal economicrate of return of the investment.
2.5.1 Phase 1 - Fiscal corrections This phase leads to the determination oftwo new elements for the economic analy-sis: the value of the row ‘fiscal correction’(Tab.2.10) and the value of the conversion factorfor market prices affected by fiscal aspects.
Market prices include taxes and subsidies,and some transfer payments, which mayaffect relative prices. While in some cases itwould be difficult to estimate net-of-taxprices, some rough, general rules can belaid down to correct such distortions:
• prices of inputs and outputs to be consi-dered for CBA should be net of VAT andof other indirect taxes;
2.5 Economic Analysis
Tab. 2.10 Calculation of the Economic Internal Rate of Return of the Investment -Thousands of Euro
Years
cf (3) 1 2 3 4 5 6 7 8 9 10
(1) Fiscal correctionTime saving 42 42 42 42 42 42 42 42Income from increased tourist flow 78 78 78 78 78 78 78 78
(2) Total external benefits 0 120 120 120 120 120 120 120 120 02.13 Sales 1.1 0 1651 6271 8251 8251 9351 9351 9351 9351 0
10.1 Total revenues 0 1651 6271 8251 8251 9351 9351 9351 9351 0Increased pollution 572 572 632 632 632 632 632 632
(2) External costs 0 572 572 632 632 632 632 632 632 02.9 Total operating costs 0.9 0 1820 6527 6728 6728 6728 6728 6728 6728 04.2 Retirement bonus 1.2 0 0 0 0 0 0 0 0 0 2361.21 Total investment costs 0.9 1067 979 1431 72 180 0 89 0 0 -1350
10.2 Total expenditures 1067 2799 7958 6800 6908 6728 6810 6728 6728 -111410.3 Net cash flow -1067 -1600 -2139 938 830 2111 2029 2111 2111 111410.4 Economic internal rate of return (ERR) 19.20%
of investment10.5 Economic net present value (ENPV) 3598
of investment
(2) Phase 2. Externalities correction. It is necessary to include in outflows andinflows also external costs and benefits for which there is no cash flow. Someexamples could be costs for health services or losses in fisheries due to increasedpollution, time saved by investment in transports, specific infrastructures sup-plied by public sector for the project (a road built specifically for the project…)increased touristic flows, increased accessibility of the region…
(3) Phase 3. From market to accoun-ting prices. It is necessary to determi-ne a vector of conversion factors.
In the present example there are no fiscalcorrections. It means that no transfers, sub-sidies or any other fiscal correction havebeen included in the financial analysis.
(1) Phase 1. Fiscal correction. It is necessary to deduct from theflows of financial analysis, payments that have no real resour-ces counterpart, as for subsidies and indirect taxes on inputand output. For direct public tranfers they are already not inclu-ded in the starting table for financial analysis which considersinvestment costs and not financial resources (Tab. 2.5).
Tab. 2.5 Calculation of the Financial Internal Rate of Return of the Investment -Thousands of Euro
Years
1 2 3 4 5 6 7 8 9 10
2.13 Sales 0 1501 5701 7501 7501 8501 8501 8501 8501 05.1 Total revenues 0 1501 5701 7501 7501 8501 8501 8501 8501 0
2.9 Total operating costs 0 2022 7252 7476 7476 7476 7476 7476 7476 04.3 Retirement bonus 0 0 0 0 0 0 0 0 0 1971.21 Total investment costs 1186 1088 1590 80 400 0 91 0 0 -1500
5.2 Total expenditures 1186 3110 8842 7556 7876 7476 7567 7476 7476 -13035.3 Net cash flow (=5.1-5.2) -1186 -1609 -3141 -55 -375 1025 934 1025 1025 13035.4 Financial internal rate of return (FRR/C) -3.16%of the investment5.5 Financial net present value (FNPV/C) -2058of the investment

importance in project appraisal, but overallconsistency is required.
2.5.2 Phase 2 - Externalities corrections The objective of this phase is to determineexternal benefits or external costs as one ormore rows in Tab. 2.10, not considered inthe financial analysis. Examples are costsand benefits coming from environmentalimpacts, the time saved by projects in thetransport sector, human lives saved by pro-jects in the health sector and so on.
Sometimes valuing external costs andbenefits will be difficult, even though theymay be easily identified. A project maycause some ecological damage, whoseeffects, combined with other factors, willtake place in the long run, and are difficultto quantify and value.
It is worthwile to at least listthe unquantifiable exter-nalities, in order to give thedecision-maker more ele-ments to make a decision,by weighing up the quanti-fiable aspects, as expressedin the economic rate ofreturn, against the un-quantifiable ones (see mul-ticriteria analysis below).
As a general rule any socialcost or benefit that spillsover from the project to-wards other subjects without
compensation, should be accounted for inCBA in addition to its financial costs.
The project examiner should check thatthese kinds of costs have been identified,quantified and given a realistic monetaryvalue, if possible. If this is difficult orimpossible this costs and benefits should bequantified at least in physical terms for aqualitative appraisal.
Many large projects, particularly in infra-structure, may be beneficial to subjects out-side those appropriating directly the socialincome generated by the project.
These benefits may accrue not only to thedirect users of the product but also to thirdparties for whom they were not intended. Inthis case, they must also be accounted for byappropriate evaluation. Examples of suchpositive externalities or beneficial spilloverstowards other consumers are the following:
• a railway may reduce traffic congestionon a highway;
• a new university may sustain appliedresearch and the future income of em-ployers will be increased by a better-edu-cated work force, etc.
Externalities should be given a monetaryvalue, if possible. If not, they should bequantified by non-monetary indicators.
Environmental impactsIn the context of projectanalysis, the environmen-tal impact should be pro-perly described and ap-praised, possibly with re-course to state of the artqualitative-quantitativemethods. Multicriteria ana-lysis is often useful in thisframework. A discussionof the assessment of envi-ronmental impact goesbeyond the scope of thisGuide, but CBA and envi-ronmental impact analysis
31
2.5 Economic Analysis
externalities. In this case, and in similarones, the inclusion of these taxes in pro-ject costs may be justified, but theappraisal should avoid double counting(e.g. including both energy taxation andestimates of external environmentalcosts in the appraisal).
Obviously, the treatment of taxation shouldbe less accurate whenever it has minor
30
2.5 Economic Analysis
Fig. 2.3 Structure of economic analysis.
Source: our adaptation from: Saerbeck, Economic appraisal of projects. Guidelines for a simplified cost benefit analysis. [1990].
• prices of inputs to be considered in theCBA should be gross of direct taxes;
• pure transfer payments to individuals,such as social security payments, shouldbe omitted;
• in some cases indirect taxes/subsidies areintended as correction of externalities.Typical examples are taxes on energy pri-ces to discourage negative environmental
Financial analysis Tab. 2.5
Fiscal correction: transfers, indirect taxes, etc. Phase 1
Phase 2
Phase 3
Non traded goods
Minor items
Use standard conversion factor
Major items
InputOutput
Sold
Use sectorial conversion factors
Not sold
Use long term marginal costs orwillingness to pay
Use conversionfactors for labourforce based onshadow wage
Disaggregate the itemor use specific sectorial
conversion factors
Labour force
ProducedInput
Traded goods
Turn directly intoborder prices
Real resources flow - PROJECT -
Correction for externalities
Real resources flow - ECONOMY -
From market to accounting prices
Real resources economic flows Tab. 2.10
Examples of social external benefits • advantages in terms of reduction of risk of accidents in
a congested area; • savings in transport time in an interconnected network; • increase of life expectancy from better health facilities
or from reduction of pollutants.
Examples of social external costs • loss of agricultural product because of different use of land; • additional net costs for local authorities to connect a new plant to
existing transport infrastructure; • increase in sewage costs.
Examples of environmental impacts• the environmental costs of a high-
way may be approximated by thepotential loss of value of proper-ties near it because of increasednoise and emissions, worsenedlandscape;
• the environmental costs of alarge polluting plant, e.g. an oilrefinery, may be estimated by thepotential increase in healthexpenditure among the residentsand workers.
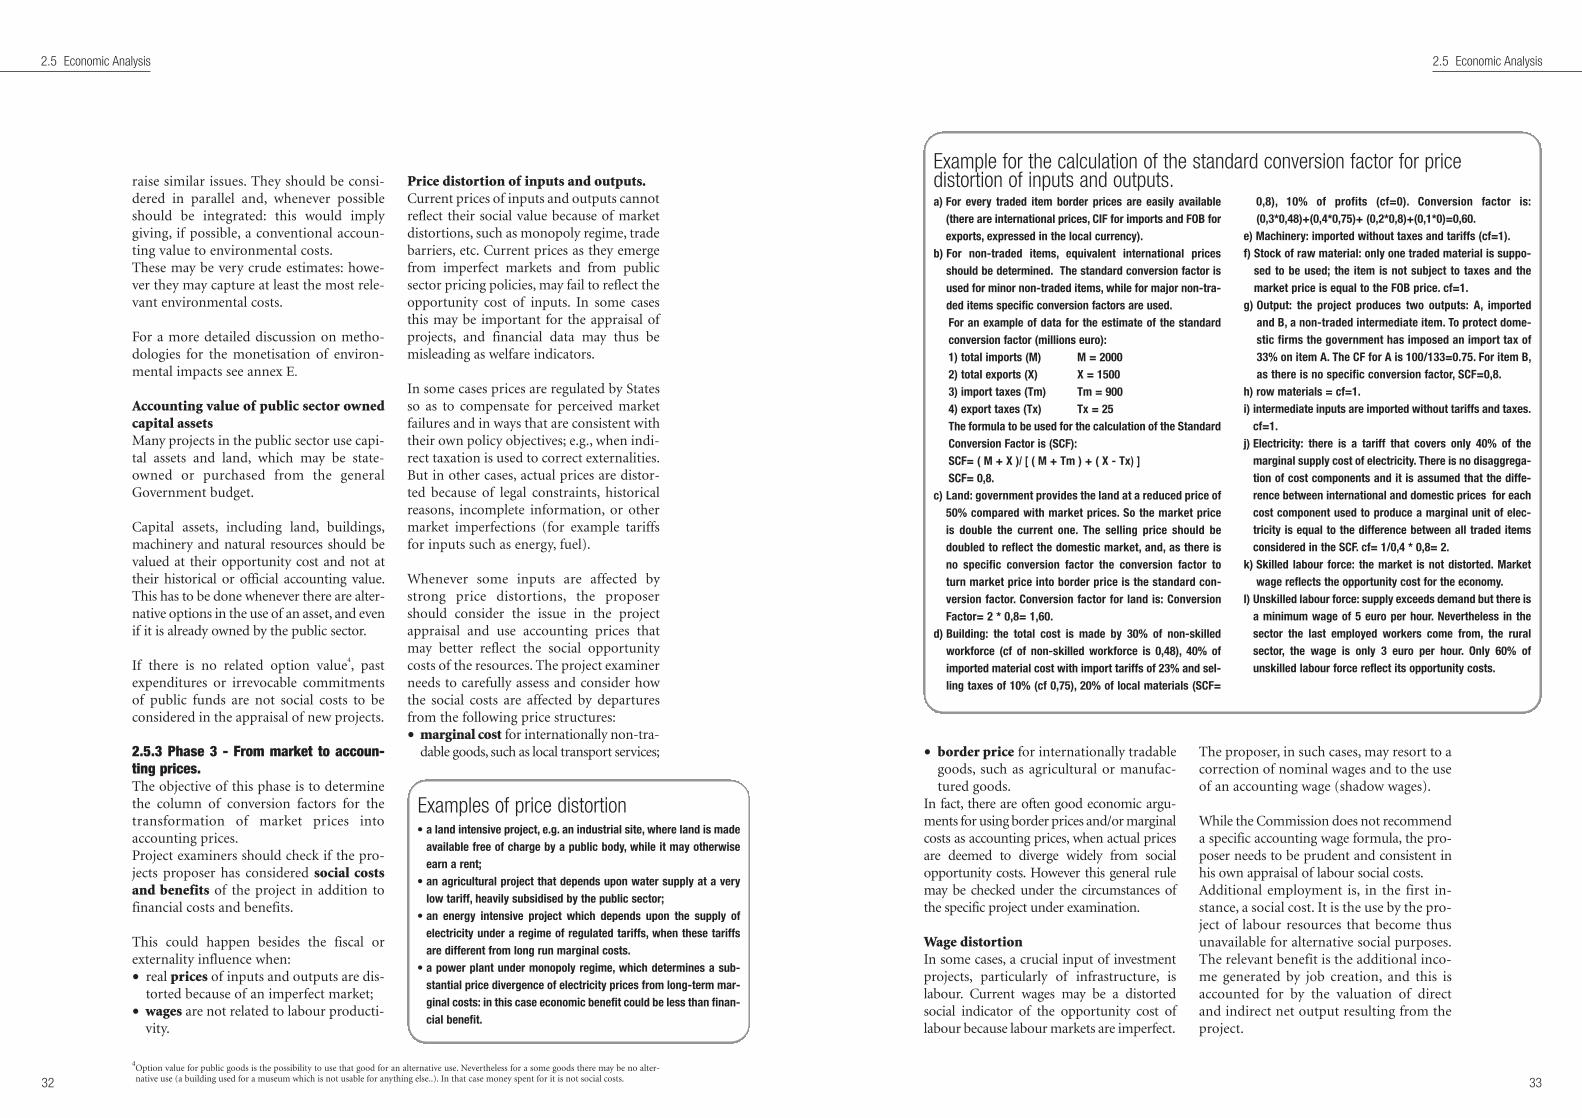
• border price for internationally tradablegoods, such as agricultural or manufac-tured goods.
In fact, there are often good economic argu-ments for using border prices and/or marginalcosts as accounting prices, when actual pricesare deemed to diverge widely from socialopportunity costs. However this general rulemay be checked under the circumstances ofthe specific project under examination.
Wage distortionIn some cases, a crucial input of investmentprojects, particularly of infrastructure, islabour. Current wages may be a distortedsocial indicator of the opportunity cost oflabour because labour markets are imperfect.
The proposer, in such cases, may resort to acorrection of nominal wages and to the useof an accounting wage (shadow wages).
While the Commission does not recommenda specific accounting wage formula, the pro-poser needs to be prudent and consistent inhis own appraisal of labour social costs.Additional employment is, in the first in-stance, a social cost. It is the use by the pro-ject of labour resources that become thusunavailable for alternative social purposes.The relevant benefit is the additional inco-me generated by job creation, and this isaccounted for by the valuation of directand indirect net output resulting from theproject.
33
2.5 Economic Analysis
raise similar issues. They should be consi-dered in parallel and, whenever possibleshould be integrated: this would implygiving, if possible, a conventional accoun-ting value to environmental costs.These may be very crude estimates: howe-ver they may capture at least the most rele-vant environmental costs.
For a more detailed discussion on metho-dologies for the monetisation of environ-mental impacts see annex E.
Accounting value of public sector ownedcapital assetsMany projects in the public sector use capi-tal assets and land, which may be state-owned or purchased from the generalGovernment budget.
Capital assets, including land, buildings,machinery and natural resources should bevalued at their opportunity cost and not attheir historical or official accounting value.This has to be done whenever there are alter-native options in the use of an asset, and evenif it is already owned by the public sector.
If there is no related option value4, past
expenditures or irrevocable commitmentsof public funds are not social costs to beconsidered in the appraisal of new projects.
2.5.3 Phase 3 - From market to accoun-ting prices. The objective of this phase is to determinethe column of conversion factors for thetransformation of market prices intoaccounting prices.Project examiners should check if the pro-jects proposer has considered social costsand benefits of the project in addition tofinancial costs and benefits.
This could happen besides the fiscal orexternality influence when:
• real prices of inputs and outputs are dis-torted because of an imperfect market;
• wages are not related to labour producti-vity.
Price distortion of inputs and outputs.Current prices of inputs and outputs cannotreflect their social value because of marketdistortions, such as monopoly regime, tradebarriers, etc. Current prices as they emergefrom imperfect markets and from publicsector pricing policies, may fail to reflect theopportunity cost of inputs. In some casesthis may be important for the appraisal ofprojects, and financial data may thus bemisleading as welfare indicators.
In some cases prices are regulated by Statesso as to compensate for perceived marketfailures and in ways that are consistent withtheir own policy objectives; e.g., when indi-rect taxation is used to correct externalities.But in other cases, actual prices are distor-ted because of legal constraints, historicalreasons, incomplete information, or othermarket imperfections (for example tariffsfor inputs such as energy, fuel).
Whenever some inputs are affected bystrong price distortions, the proposershould consider the issue in the projectappraisal and use accounting prices thatmay better reflect the social opportunitycosts of the resources. The project examinerneeds to carefully assess and consider howthe social costs are affected by departuresfrom the following price structures:
• marginal cost for internationally non-tra-dable goods, such as local transport services;
32
2.5 Economic Analysis
4Option value for public goods is the possibility to use that good for an alternative use. Nevertheless for a some goods there may be no alter-native use (a building used for a museum which is not usable for anything else..). In that case money spent for it is not social costs.
Examples of price distortion • a land intensive project, e.g. an industrial site, where land is made
available free of charge by a public body, while it may otherwiseearn a rent;
• an agricultural project that depends upon water supply at a verylow tariff, heavily subsidised by the public sector;
• an energy intensive project which depends upon the supply ofelectricity under a regime of regulated tariffs, when these tariffsare different from long run marginal costs.
• a power plant under monopoly regime, which determines a sub-stantial price divergence of electricity prices from long-term mar-ginal costs: in this case economic benefit could be less than finan-cial benefit.
a) For every traded item border prices are easily available(there are international prices, CIF for imports and FOB forexports, expressed in the local currency).
b) For non-traded items, equivalent international pricesshould be determined. The standard conversion factor isused for minor non-traded items, while for major non-tra-ded items specific conversion factors are used.For an example of data for the estimate of the standardconversion factor (millions euro):1) total imports (M) M = 20002) total exports (X) X = 15003) import taxes (Tm) Tm = 9004) export taxes (Tx) Tx = 25The formula to be used for the calculation of the StandardConversion Factor is (SCF):SCF= ( M + X )/ [ ( M + Tm ) + ( X - Tx) ]SCF= 0,8.
c) Land: government provides the land at a reduced price of50% compared with market prices. So the market priceis double the current one. The selling price should bedoubled to reflect the domestic market, and, as there isno specific conversion factor the conversion factor toturn market price into border price is the standard con-version factor. Conversion factor for land is: ConversionFactor= 2 * 0,8= 1,60.
d) Building: the total cost is made by 30% of non-skilledworkforce (cf of non-skilled workforce is 0,48), 40% ofimported material cost with import tariffs of 23% and sel-ling taxes of 10% (cf 0,75), 20% of local materials (SCF=
0,8), 10% of profits (cf=0). Conversion factor is:(0,3*0,48)+(0,4*0,75)+ (0,2*0,8)+(0,1*0)=0,60.
e) Machinery: imported without taxes and tariffs (cf=1).f) Stock of raw material: only one traded material is suppo-
sed to be used; the item is not subject to taxes and themarket price is equal to the FOB price. cf=1.
g) Output: the project produces two outputs: A, importedand B, a non-traded intermediate item. To protect dome-stic firms the government has imposed an import tax of33% on item A. The CF for A is 100/133=0.75. For item B,as there is no specific conversion factor, SCF=0,8.
h) row materials = cf=1.i) intermediate inputs are imported without tariffs and taxes.
cf=1.j) Electricity: there is a tariff that covers only 40% of the
marginal supply cost of electricity. There is no disaggrega-tion of cost components and it is assumed that the diffe-rence between international and domestic prices for eachcost component used to produce a marginal unit of elec-tricity is equal to the difference between all traded itemsconsidered in the SCF. cf= 1/0,4 * 0,8= 2.
k) Skilled labour force: the market is not distorted. Marketwage reflects the opportunity cost for the economy.
l) Unskilled labour force: supply exceeds demand but there isa minimum wage of 5 euro per hour. Nevertheless in thesector the last employed workers come from, the ruralsector, the wage is only 3 euro per hour. Only 60% ofunskilled labour force reflect its opportunity costs.
Example for the calculation of the standard conversion factor for pricedistortion of inputs and outputs.

• some objectives of the Structural Fundsare concerned with particular employ-ment targets (e.g. youth, long termunemployed) and it may be importantto consider the different impacts by tar-get groups.
2.5.4 DiscountingCosts and benefits occurring at differenttime must be discounted. The discountingprocess is undertaken, as for the financialanalysis, after the determination of thetable for the economic analysis.
The discount rate in the economic analysisof investment projects – the social discountrate - attempts to reflect the social view onhow future benefits and cost should bevalued against present ones. It may differfrom the financial discount rate when thecapital market is imperfect (which is alwaysthe case in reality).
Theoretical literature and internationalpractice shows a wide range of approachesin interpreting and choosing the value ofthe social discount rate to be adopted. Theinternational experience is very wide andhas involved different countries as well asinternational organisations. However a5% European social discount rate mayhave different justifications, and may pro-vide a standard benchmark for EU co-financed projects. But project proposersmay wish to justify a different value.
For a more detailed discussion about thesocial discount rate see annex B.
2.5.5 The calculation of the economic rateof returnAfter the correction of price distortion it ispossible to calculate the economic internalrate of return (ERR).
After the choice of an appropriate socialdiscount rate it is possible to calculate theeconomic net present value (ENPV) andthe B/C ratio.
The difference between ERR and FRR isthat the former uses accounting prices orthe opportunity cost of goods and servicesinstead of imperfect market prices, and itincludes as far as possible any social andenvironmental externalities. Because exter-nalities and shadow prices are now conside-red, most projects with low or negativeFRR/C will now show positive ERR.
Every project with an ERR less than 5% ora negative ENPV after the actualisationand with a discount rate of 5% should becarefully appraised or even rejected. Thesame applies with a B/C ratio less than 1.
In some exceptional cases a negativeENPV could be accepted if there areimportant non-monetized benefits, butthese must to presented in detail becau-se such a project will contribute only mar-ginally to the objectives of EU regionaldevelopment policy.
In any case the appraisal report should spe-cify in a convincing way, through a structu-red argument supported by adequate data,that social benefits exceed social costs.
2.6 Multicriteriaanalysis Multicriteria analysis considers simulta-neously a variety of objectives in relation tothe evaluated intervention. It facilitates con-sideration in the investment appraisal ofpolicy maker’s objectives that in some cases
35
2.6 Multicriteria analysis
It is important to under-stand that there may betwo different, mutuallyexclusive ways to estimatethe social benefit of addi-tional employment:
• as already said, one canuse an accounting wageinferior to the actual wagepaid by the project. This isone way to take intoaccount the fact that,under conditions ofunemployment, actualwages are higher than theopportunity cost oflabour. By reducinglabour costs, this accountingprocedure increases the social net presentvalue of the project income in comparisonwith its private value;
• alternatively, one can try to estimate theincome multiplier of output, and thesocial income of the project will again bemore than its private income because ofthis positive external impact.
Both methods, either subtracting a fractionof labour costs, or adding up some addi-
tional output, have theirdrawbacks and limitations,but under appropriate con-ditions they are equivalent.
The income multipliermethod is best applied atmacro-economic level orfor very big investmentprogram. Usually it is advi-sable to use shadow wageswhere effective wages arecut proportionally to theextent of unemployment.In any case:
• the two methodologiescannot be used simultane-ously (double counting!)
• if an investment project already has asatisfactory internal rate of return beforecorrections for employment, it is notnecessary to spend much time and efforton this kind of calculation.
However, it is important to consider that insome cases the employment impact of aproject may need a vary careful considera-tion:
• it is sometimes important to check foremployment losses in other sectors as aconsequence of the project: grossemployment benefits may overestimatethe net impact
• sometimes the project is said to main-tain jobs that otherwise would be lost:this may be particularly relevant forrenovation and modernisation of exi-sting plants: this kind of argumentshould be supported by an analysis ofcost structure and competitiveness withand without the project
34
2.5 Economic Analysis
Wage distortion • some people, particularly in public
sector employment, may receivewages above or below their coun-terparts in the private sector forsimilar work;
• in the private sector, costs oflabour for the private companymay be less than the social oppor-tunity cost because the Stategives special subsidies to employ-ment in some areas;
• there may be legislation fixing aminimum legal wage, even ifunder heavy unemployment theremay be people willing to work forless.
Fig. 2.4 Employment effects.
Source: “Counting the jobs. How to evaluate the employmenteffects of Structural Funds Interventions”, European Commission,Directorate General XVI Regional Policy and Cohesion, Co-ordina-tion and evaluation of operations.
Measure
Physical activity Non-employment outputs
Gross job creation
Net job creation
Previous Experience
Monitoring data
Evaluation Data
Coefficients
Multipliers
Method
deadweight
displacementAccounting wage or shadow wage.The highest possible remuneration the labour employed in the pro-ject could have earned elsewhere. Because of minimum wage laws,regulations and other rigidities, wages actually paid may not be acorrect measure of the real opportunity cost of labour. In an eco-nomy marked by extensive unemployment or underemployment, theopportunity cost of labour used in the project may be less thanactual wage rates.
Tab. 2.11 Expected economic internal rates of return of a sample of 400 major projects of the ‘first generation’ and ‘second generation’ combined
Average Numberrate of projects*
Energy 12.9 6Water and environment 15.8 51Transport 17.1 152Industry 18.4 14Other services 16.3 10Total 16.8 233
(*) Projects for which data was available.

5. Estimate of the effects of the interventionin terms of selected criteria; from theresults coming from the previous stage(both in qualitative and in quantitativeterms) a score is assigned;
6. Identification of the typology of subjectsinvolved in the intervention and collec-tion of respective preference function(weight) accorded to different criteria.
7. Scores aggregation of different criteriaon the basis of revealed preferences.Single scores could be aggregated givinga numerical evaluation of the interven-tion comparable with other similarinterventions.
In any case, the project examiner shouldverify if:
• forecasts for non-monetary aspects havebeen quantified in a realistic way in theex-ante evaluation;
• there is an accurate non-monetary costsand benefits analysis if it is the case;
• additional criteria have a reasonablepolitical weight as to determine signifi-cant changes in the financial and econo-mic results.
Such a methodology is particularly effecti-ve when the monetisation of costs andbenefits is difficult or even impossible. Letus suppose that a certain project shows, ata discount rate of 5%, a negative economicnet present value of one million Euro. Thismeans that the project examiner foresees anet social loss of the project in monetaryterms. The project proposer could assessthat, despite this, the project should befinanced by the Funds because it has a ‘verypositive' environmental impact that it isnot possible to monetize. The Commissioncould consider the environmental protec-tion a merit good.
Therefore the project proposer should beasked to make an estimate of environmen-tal benefits in physical terms. Let us suppo-se that this has been made and that the pro-
ject is supposed to cut the polluter Z emis-sions by 10% per year.
Now one should ask:
a) is the forecast of the emission cut inphysical terms reliable?
b) is one million Euro an acceptable “price”for the reduction of 10% in the emission(how much is the implicit unitary cost ofthe reduction of emission)?
c) is there any evidence that such a "price"of reduced emission is consistent withthe weight that the government of theMember State or the Commission atta-ches to similar projects?
For instance, one may see whether -regu-larly or even occasionally- Member Stateshave funded similar projects in order toobtain a similar cost/effectiveness ratio.Otherwise, if there is no evidence of con-sistency, one should enquire why this isproposed for the project under EU assi-stance.
One can substitute reduced emissions withmany kinds of other non-monetary bene-fits and repeat the check, when appropriate.If the benefits are not just non-monetary,but also physically unmeasurable, there isno way of appraising the project.
One should be very careful with proposalswhere the analysis of non-monetary bene-fits is vague and merely qualitative.
37
2.6 Multicriteria analysis
could not be included in the financial andeconomic analysis eg. social equity, environ-mental protection, equal opportunities.
For many regional development projectsequity is a relevant objective. If the projectproposer wishes to assign a specific weightto equity objectives, the main informationshould be a forecast of distributive effectsdue to the project implementation and adiscussion of the desirability of such effects inthe context of regional policy. For example,if the project needs to modify tariffs in apublic service it is probable that it will havesome effect in terms of equity, the level ofwhich should be analysed and appraised(i.e. through a presentation of the socialcategories that will pay some costs and theones who will gain some benefits; ‘winnersand losers table’). See also annex F for theevaluation of distributional impact.
Another fundamental principle for the eva-luation of EU projects is the Polluter PaysPrinciple which, according to regulationsshould be used for the modulation of thecofinancing rate. See the box 2.5,Application of the polluter-pays principle.
In these cases it is necessary to identify theeffects of the investments on social objecti-ves, assign a weight to each objective andcalculate the final impact. For example letus consider three objectives such as con-sumption incentive, social equity andenergy self-sufficiency. If a project causes avariation of 2% in consumption, of 1% inthe equality index, of 3% in the energy self-sufficiency index, three weights to evaluatethe relative importance of each objective
for the planning process need to be defi-ned. For example let us suppose that theweights are chosen as to have the totalamount of 1 (normalisation): 0.70 for con-sumption, 0.2 for redistribution, 0.1 forenergy self-sufficiency. The total impact onthe three objectives, given the public deci-sion-maker, is easily measured (see forexample tab. 2.12).
In general multicriteria analysis should beorganised as follows:
1. Objectives should be expressed in mea-surable variables. They should not beredundant but could be alternative (theachievement of a bit more of one objec-tive could partly preclude the achieve-ment of the other);
2. Once the ‘objectives vector’ is built atechnique should be found to aggregateinformation and to make a choice; theobjectives should have a weight assignedreflecting the relative importance givento them by the Commission;
3. Definition of the appraisal criteria; thesecriteria could refer to the priorities pur-sued by the different subjects involved orthey could refer to particular evaluationaspects (synergy degree with other inter-ventions, using up of reserves capacity,implementing difficulties etc.);
4. Impact analysis; this activity consists inanalysing, for each of the chosen crite-ria, the effects it produces. Results couldbe quantitative or qualitative (meritjudgement);
36
2.6 Multicriteria analysis
BOX 2.5 Application of the polluter-pays principle.
SF: Art. 29, par. 1 Reg. 1260/1999. “ The contribu-tion of the Funds shall be differentiated in thelight of the following: (…) c) within the frame-work of the objectives of the Funds set out inArticle 1, the importance attaching to the assi-stance and the priorities from the Communityviewpoint, where appropriate, for the eliminationof inequalities and the promotion of equality bet-ween men and women and for the protection and
improvement of the environment, principallythrough the application of the precautionary prin-ciple, of the principle of preventive action, andthe polluter-pays principle”.CF: Art. 7, par. 1 Reg. 1264/1999 “ However, from1 January 2000 this rate may be reduced to takeaccount, in co-operation with the Member Stateconcerned, of the estimated revenue generatedby projects and of any application of the polluter-
pays principle”.ISPA: Art. 6, par.2, Reg. 1267/1999: “Save in thecase of repayable assistance or when there is asubstantial Community interest, the rate of assi-stance shall be reduced to take into account: (a)the availability of co-financing; (b) the measu-re’s capacity to generate revenues, and (c) anappropriate application of the polluter-paysprinciple”.
Tab. 2.12 Multicriteria analysis for two projects.
Project A Scores* Weight Impact
Equity 2 0.6 1.2Equal opportunity 1 0.2 0.2Environmental protection 4 0.2 0.8Total 2.2: moderate impact
Project B Scores* Weight Impact
Equity 4 0.6 2.4Equal opportunity 1 0.2 0.2Environmental protection 2 0.2 0.2Total 2.8: relevant impact *
(*) 0: zero impact 1: scarce impact 2: moderate impact 3: relevant impact 4: very high impact

b) Identify possible deterministically de-pendent variables, which would give riseto distortions in the results and doublecounts. If, for example, labour producti-vity and general productivity appear inthe model, then the latter obviouslyincludes the former. In this case it isnecessary to eliminate the redundantvariables, choosing the most significant,or to modify the model to eliminateinternal dependencies. In conclusion thevariables considered must be as far aspossible independent variables.
c) It is advisable to carry out a qualitativeanalysis of the impact of the variables inorder to select those that have little ormarginal elasticity. The subsequentquantitative analysis can be limited to themore significant variables, verifying themif doubts exist. By way of an example onecan use Tab. 2.14. Furthermore the mostimportant parameters for the risk analy-sis of each type of investment are indica-ted in the sector profiles.
d) Having chosen the significant variables,one can then evaluate their elasticity bymaking the calculations, which areeasier if one has a simple computer pro-gramme to calculate the IRR and/orNPV indices. Each time it is necessary toassign a new value (higher or lower) toeach variable and recalculate the IRR orNPV, thus noting the differences (abso-lute and percentage) compared to thebase case.
A possible result is shown in figure 2.5.Since, generally speaking, there is no gua-
rantee that the elasticity of the variableswill always be a linear function, it is advisa-ble to verify this, repeating the calculationsfor different arbitrary deviations. In theexample in the figure, the elasticity of theproductivity parameter increases with theincrease in absolute value of the deviationcompared to the best estimate, while thedemand value decreases; the elasticity ofother variables is a linear function, at leastin the range of changes explored.
e) Identify the critical variables, applyingthe chosen criterion. Again with referenceto the example in figure 2.5, according tothe aforementioned general criterion, thecritical variables are tariffs, demand andproductivity.
2.7.3 Scenario analysis The combined consideration of certain“optimistic” and “pessimistic” values of agroup of variables could be useful todemonstrate different scenarios, withincertain hypotheses. In order to define theoptimistic and pessimistic scenarios it is ne-cessary to choose for each critical variable
39
2.7 Sensitivity and risk
For unquantifiable (or difficult to quan-tify) a qualitative analysis should be doneas follows. A set of criteria relevant for theproject appraisal (equity, environmentalimpact, equal opportunity) is collected in amatrix together with the impacts (measu-red with scores or percentage) of the pro-ject on the relevant criteria. An othermatrix should collect the relative impor-tance given to the considered criteria.Multiplying scores and weight the totalimpact of the project is given. In the exam-ple given in Tab. 2.12 project B has greatersocial impact, given preferences for thechosen social criteria.
2.7 Sensitivity and risk 2.7.1 Forecasting uncertaintiesRisk analysis consists of studying the pro-bability that a project will achieve a satisf-ying performance (in terms of IRR orNPV), as well as the variability of theresult compared to the best estimate pre-viously made.
The recommended procedure for assessingrisks is based on:
• as a first step a sensitivity analysis, that isthe impact that assumed changes in thevariables determining costs and benefitsare seen to have on the financial and eco-nomic indices calculated (IRR or NPV);
• a second step will be the study of proba-bility distributions of selected variablesand the calculation of the expected valueof the project performance indicators.
2.7.2 Sensitivity analysisThe purpose of the sensitivity analysis is toselect the “critical” variables and parame-ters of the model, that is those whosevariations, positive or negative, comparedto the value used as the best estimate in thebase case, have the greatest effect on theIRR or the NPV, that is they cause themost significant changes in these parame-ters. The criteria to be adopted for thechoice of the critical variables vary accor-ding to the specific project and must beaccurately evaluated case by case. As ageneral criterion we recommend conside-ring those parameters for which a varia-tion (positive or negative) of 1% gives riseto a corresponding variation of 1% (onepercentage point) in IRR or 5% in the basevalue of the NPV.
The following points illustrate schemati-cally the procedure that should be followedto conduct a sensitivity analysis.
a) Identify all the variables used to calcula-te the output and input of the financialand economic analyses, grouping themtogether in homogeneous categories.Table 2.13 may be of help.
2.7 Sensitivity and risk
Tab. 2.13 Identification of critical variables
Categories Examples of variables
Parameters of the model Discount rate
Price dynamics Rate of inflation, growth rate of real salaries, energy prices, changes in prices of goods and services
Demand data Population, demographic growth rate, specific consumption, sick rate, demand formation, volume of traffic, size of the area to be irrigated, market volumes of a given commodity
Investment costs Duration of the building site (delays in realisation), hourly labour cost, hourly productivity, cost of land,cost of transport, cost of concrete aggregate, distance from the quarry, cost of rentals, depth of the wells, useful life of the equipment and manufactured goods
Operating prices Prices of the goods and services used, hourly cost of personnel, price of electricity, gas, and other fuels
Quantitative parameters for the operating costs Specific consumption of energy and other goods and services, number of people employed
Prices of revenues Tariffs, sale prices of products, prices of semi-finished goods
Quantitative parameters for the revenues Hourly (or other period) production of goods sold, volume of services provided, productivity, number of users, percentage of penetration of the area served, market penetration
Accounting prices (costs and benefits) Coefficients for converting market prices, value of time, cost of hospitalisation, cost of deaths avoided, shadow prices of goods and services, valorisation of externalities
Quantitative parameters for costs and benefits Sick rate avoided, size of area used, added value per hectare irrigated, incidence of energy produced or secondary raw materials used
Tab. 2.14 Impact analysis of critical variables
Categories and parameters Elasticity
High Doubtful LowModel parameters discount rate XPrice dynamics rate of inflation X
real rate of salaries Xchange in energy prices Xchange in prices of goods and services X
Demand data specific consumption Xrate of demographic growth Xvolume of traffic X
Investment costs hourly labour cost X
IRR
Parameter
Energy cost Prices trend Tariffs Demand Productivity
-5% -4% -3% -2% -1% 1% 2% 3% 4% 5%
Fig. 2.5 Sensitivity analysis
10.0%7.5%5.0%2.5%0.0%
-2.5%-5.0%-7.5%
-10.0%

risk to the project, forexample verifying whetherthe cumulated probabilityis higher or lower than areference value that is con-sidered to be critical. Onecan also assess what theprobabilities are that the IRR(or NPV) will be lower than a certain valuewhich, also in this case, is adopted as thelimit. In the case in the figure, for example,there is a probability of about 53% that theIRR will be less than 5%.
In order to evaluate the result one veryimportant aspect is the compromise to be
made between high riskprojects with high socialbenefits, on the one hand,and low risk projects withlow social benefits, on theother.
There is sometime a priori reason to pre-fer neutrality to risk. However in somecases the evaluator or the proposer candeviate from neutrality and prefer to riskmore or less for the expected rate ofreturn: there must however be a clear defi-nition of this choice.
To illustrate this concept one can considerinnovative projects, which may be morerisky than traditional ones. If, for example,these have only a 50% probability of achie-ving the expected results, then their netsocial value, for an investor who is neutralto risk, should therefore be halved.However innovation itself is an additionalcriterion of preference: in that case innova-tive projects must be evaluated by awardinga prize to well-deserving “innovation” andby not overlooking the risk.
41
2.7 Sensitivity and risk
the extreme values among the range defi-ned by the probability distribution.Project performance indicators are thencalculated for each hypothesis. In this casean exactly specified probability distributionis not needed.
Scenario analysis is not a substitute for sen-sitivity analysis or risk analysis, it is only ashortcut procedure.
2.7.4 Risk probability analysis Once the critical variables have been iden-tified, in order to conduct the risk analysisit is necessary to associate a probability dis-tribution to each of them, defined in a pre-cise range of values around the best estima-te, used in the base case, in order to calcula-te the evaluation indices.
The probability distribution for each varia-ble may be derived from different sources(see also annex D).
Having established the probability distri-bution of the critical variables, it is possi-ble to proceed with the calculation of theprobability distribution of the IRR orNPV of the project. Only in the simplestcases is it possible to calculate this by usinganalytical methods for calculating the pro-babilities composed of a number of inde-pendent events.
With the increasing complexity of the CBAmodel, even for few variables, very soonthe number of combinations becomes toohigh for direct treatment. By way of anexample, it should be noted that if thereare only four variables, for each of whichthree values are considered (the best esti-mate and two deviations, one positive andone negative), then there are 81 possiblecombinations to be analysed.
Having said that, for investment projects itis possible to use the Montecarlo method,which can be applied using an appropriatecalculation software. The method consistsof the repeated random extraction of a setof values for the critical variables, takenwithin the respective defined intervals, andin calculating the performance indices forthe project (IRR or NPV) resulting fromeach group of extracted values. Obviouslycare should be taken to ensure that the fre-quency the values of the variables con-forms to the predetermined probabilitydistribution. By repeating this procedurefor a large enough number of extractions(generally not more than a few hundred)one can obtain a convergence of the calcu-lation with the probability distribution ofthe IRR or NPV.
The most helpful way of presenting theresult is to express it in terms of the proba-bility distribution or cumulated probabilityof the IRR or the NPV in the resultinginterval of values. Figures 2.6 and 2.7 pro-vide graphic examples.
The cumulated probability curve (or a tableof values) allows one to assign a degree of
40
2.7 Sensitivity and risk
Tab. 2.15 Example of scenario analysis.
Optimistic Baseline Pessimistic scenario case scenario
Inv. cost Euro 125000 130000 150000Traffic %var +2% +5% +9%Tolls Euro/unit 5 2 1FRR/C 2% -2% -8%FRR/K 12% 7% 2%ERR 23% 15% 6%
0.1400.1200.1000.0800.0600.0400.0200.000
3- 3.5- 4- 4.5- 5- 5.5- 6- 6.5-3.25 3.75 4.25 4.75 5.25 5.75 6.25 6.75
Prob
abili
ty d
istr
ibut
ion
FRR %
1.00
0.80
0.60
0.40
0.20
0.002.00 3.00 4.00 5.00 6.00 7.00 8.00
Cum
ulat
ive
prob
abili
ty
FRR %
Fig. 2.6 Probability distribution for FRR. Fig. 2.7 Cumulative probability distribution for FRR.
The operational role of sensitivity analysis is to identify criticalvariables, for which it is important to obtain further information. Theoperational role of risk analysis is to generate expected values offinancial and economic performance indicators (e.g. FRR and ERR).For instance if a project has a FRR/K of 10% but also the probabilityanalysis tells us that the FRR/K has a value between 4 and 10 witha probability of 70% and a value between 10 and 13 with a probabi-lity of 30%, then the expected value of FRR/K for that project is only8.35 ((average (4;10)*0.7)+(average(10;13)*0.3)).
It should be clear that a risky projectis a project where the probability ishigh that it will not overcome a cer-tain threshold of IRR. It is not a pro-ject where the IRR probability distri-bution has a great standard error.

5. Energy production6. Ports, airports and infrastructure networks7. Training infrastructure8. Museums and archaeological parks 9. Hospitals10. Forests and parks11. Telecommunications infrastructure12. Industrial estates and technological parks13. Industries and other productive invest-
ments
3.1 Waste treatmentIntroductionThis section is focussed both on newinvestments and investment in renovation,modernisation or normalisation of wastemanagement plants. Projects may refer tosolid waste collecting and solid waste sor-ting plants, incinerators (with or withoutenergy recovery), landfill or other wastedisposal and waste removal plants.
Solid waste involved are:
• waste listed in the apposite directives (seeBox 3.1, Legislative framework);
• waste enumerated in the European Cata-logue of Waste (published in January 1994);
• other available national typologies ofwaste.
3.1.1 Objectives definitionObjectives are related to general criteria,as local and regional development andenvironmental management, but alsoinvolve specific aims in the short and longterm, such as:
• the development of modern local andregional waste management sectors;
• the reduction of health risks linked to anuncontrolled management of municipaland industrial waste;
• the settle down in raw materials con-sumption and the closure of materialproduction and consumption cycles;
• the reduction in pollutant emissionssuch as water and air pollutants;
• innovation in new technologies for col-lection and waste treatments.
To highlight the general and specific objec-tives, the project should define carefullythe following characteristics:
• population concerned by the project,tons of waste collected and treated bytype of waste (hazardous waste, munici-pal waste, packaging waste…)
• type of technologies implemented (me-thods of treatment),
• economic impact on the local economy(in terms of employment and revenues),
• risks decrease due to the implementationof the waste management strategy,
• saving in raw material consumption,type of materials recovered and recycled,
• reduction in air, water and soil pollu-tants and type of environmental dama-ges on soil and groundwater avoided,for example.
3.1.2 Project identification
Typology of the investmentThe main types of waste managementfacilities are:
• investment in collecting and recyclingwaste facilities (with separate collectionor not), such as municipal separate col-lection centre;
• compost production facilities;
• investment in facilities for physical andchemical treatment, such as oil wastetreatment facilities;
43
3.1 Waste treatment
OverviewThis chapter extends the concepts expres-sed in the preceding sections, with referen-ce to the main sectors supported by EUfunds.
The outlines are of a schematic nature andnot comprehensive. Their main purpose isto act as a guide for readers and writers ofproject proposals, showing, on the onehand, the established methods whichshould be the basis of a good appraisal and,on the other, areas of uncertainty that meritparticular attention.
Obviously, all the general methodologicalelements mentioned in the previous chaptershould also be taken into consideration. Thefollowing outline is valid for all sectors:Objectives definition: it is necessary toconsider the local nature of the objectivesas well as the more general significance andimpact;Project identification: the functional andphysical links of the project to the existinginfrastructure system should always beclearly explained;Feasibility and options analysis: compari-son with the previous situation (withoutthe project) and possible alternatives forsatisfying the same demand should alwaysbe included;Financial analysis: it should be conductedeven if the services are totally free of char-ge and the financial rate of return is there-fore negative. The analysis should measurethe net cost to public finances and providea significant comparison with similarinvestments;Economic analysis: in addition to the ele-
ments derived from the financial analysis theevaluation of the main social costs and bene-fits should be included. Both for financialand economic analysis a comparison bet-ween the two situations with and withoutthe investment should be conducted;Multicriteria and other evaluation crite-ria: some indications on other evaluationcriteria should be discussed, particularly inrelation to on environmental impacts;Sensitivity and risk analysis: uncertaintyand risk about variables' trends are impor-tant points to be considered when apprai-sing investment projects.
The outlines follow a common structure tofacilitate the task of the user, and also toencourage standardisation in the procedu-res for analysis and reporting and to makecommunications smoother between pro-posers and appraisers.
In some cases, where possible, value rangesare given for the essential analysis variables,which have been taken from previous expe-rience. These value ranges should be consi-dered only a reference for the analyst andnot as target values.
A more in-depth discussion is proposed forthe following sectors:1. Waste treatment;2. Water supply, transport, distribution and
treatment;3. Transport.
In addition, a less detailed discussion isproposed for the following sectors:4. Energy transport and distribution
Outlines of project analysis by sector
Chapter Three
42
Main typologies of waste • Municipal Solid Waste is waste collected by or on behalf of the
Municipalities
• Packaging Waste
• Hazardous waste including industrial hazardous waste and hou-sehold hazardous waste (batteries, oils, paints and out-of-datemedicines)
• Specific waste such as oil waste, batteries and accumulators,end-of-life vehicles, electrical and electronic waste
• Garden and Bulky Waste from municipalities
• Healthcare waste mainly produced by hospitals
• Ash and Slag from Combustion Processes and Fly ash producedby waste treatment facilities
• Mining waste
• Agricultural waste included sludge

of self-sufficiency at Community level andif possible at Member State level. The pro-ject should detail the distance between thearea of production of the waste and thelocalization of the plant and the relatedcosts of transport. High transport costs orhigh distances should be justified by specifi-cally, for example, on the basis of the natureof the waste or the type of technology used.
3.1.3 Feasibility and options analysisSome scenarios have to be set up to makepossible the choice of the best option bet-ween different available alternatives. Thepotential scenarios are the following:
• a do-nothing scenario (“business asusual”), without investments;
• some available alternatives inside thepresent proposal;
• global alternatives to the project (forexample the study of an incinerator as analternative to a landfill, or a separate col-lection centre for recycling in the place ofa final disposal plant).
In the “business as usual” scenario, the pro-ject will give the reasons for the choice of“doing something” instead of maintainingthe status quo option. The arguments willfocus on the economic, social and environ-mental benefits of the project and shouldemphasize the cost occurring for the statusquo option in terms of economic costs,environmental and human health impacts.
In the second case, the project will exposethe technical alternatives to the option selec-ted. It could be for an incinerator, for exam-ple, the type of the furnace or the addition ofa steam boiler for energy recovery.
Finally, for the global scenario the studywill focus on the different methods forwaste management in the context of theproject. The project should distinguish onealternative focusing on the prevention, thereuse, the recycling or the recovery to becompared with the option chosen. The aimis to fulfill the hierarchy principles and ini-tiate its concrete integration in wastemanagement project analysis.
Analysis of the demandThe demand for waste recovery and dispo-sal is a key element in the decision to builda waste treatment facility.
The estimation should be based on the fol-lowing elements:
• the evaluation of the production by typeof waste and by type of producer, in thegeographical area of the project;
• present and expected changes in nationaland European norms in waste management.
The evaluation of the future demand formunicipal waste management should take
45
3.1 Waste treatment
• household and industrial waste incinera-tion plants and incinerators (with orwithout combined heat and power);
• landfill sites.
A map of the plant proposed should beattached to the project for a better compre-hension of local economic and environ-mental impacts. Some information on thearea concerned by the waste collectionshould also be included. In addition, detailsare needed on the origins of the waste:local, regional, national or country of ori-gin (for waste imported from anotherEuropean or non-European country).
Regulative frameworkThe selection of projects should pay atten-tion to compliance with the general andspecific legislation on waste managementand with the principles which guide theEU’s policy in the sector.
The European legislation and policy onwaste are set out in some key directives,such as the Waste Framework Directive(75/442/EEC), the Hazardous Waste Di-rective (91/689/EEC) and the Regulationon waste shipments (259/93). Othernumerous directives allow for manage-ment of particular waste and waste treat-ment methods.
The main principles are:
• The Polluter Pays Principle (PPP)6:The Polluter Pays Principle implies thatthose who cause environmental damageshould bear the costs of avoiding it orcompensating for it. Attention should bepaid to the part of the total cost which isrecovered through charges paid by pollu-ters (the holder of waste).
• Waste Management Hierarchy:Waste management strategies must aim pri-marily to prevent the generation of wasteand to reduce its harmfulness. Where this isnot possible, waste materials should be reu-sed, recycled, or used as a source of energy.As a final resort, waste should be disposed ofsafely (by incineration or in authorized land-fill sites). In project analysis an option to pre-vent the generation of waste or to reuse andrecycle should be systematically presented tocompare the difference in costs between pre-vention, recycling and final disposal wastefacilities. In any case, the choice of an incine-rator or a landfill should be justified by theexistence of very large costs occurring inwaste prevention and recycling options.
• Proximity principle:Waste should be disposed of as close to thesource as possible, at least with the objective
44
3.1 Waste treatment
6 “In accordance with the polluter pays principle, the cost of disposing of waste must be borne by: - the holder who has the waste handled by awaste collector or by an undertaking as referred to in Article 9 and/or the previous holders or producer of the product from which the wastecame” art.15. (Directive 75/442/CEE).
Biologicaltreatment
Recover/Reuse atsource
Landfill
Organic fraction
Incineration
Remainingfraction
Landfill(residues)
Collection/sorting
Separate collection
Municipal and special solid wastes from house-holds, commerce, industries and services
Ordinarycollection
Collection/sorting
Recycling facility
Fig. 3.1 Waste management systems from waste source to final disposal or removal
BOX 3.1 Legislative framework
Waste framework• Framework Directive on Waste (Council Directive 75/422/EEC
as amended by Council Directive 91/156/EEC)• Hazardous Waste Directive (Council Directive 91/689/EEC as
amended by Council Directive 94/31/EC)
Specific Waste• Disposal of waste oils (Council Directive 75/439/EEC)• Directives on waste from the titanium dioxide industry
(Council Directive 78/176/EEC)• Batteries and accumulators containing certain dangerous
substances (Council Directive 91/157/EEC)• Packaging and packaging waste (Council Directive 94/62/EC)• The disposal of PCB/PCV (Council Directive 96/59/EC)• Protection of the environment, and in particular of the soil,
when sewage sludge is used in agriculture (Council Directive86/278/EEC)
Processes and facilities• Reduction of air pollution from existing municipal waste-
incineration plants (Council Directive 89/429/EEC)• Reduction of air pollution from new municipal waste-incine-
ration plants (Council Directive 89/369/EEC)• Incineration of hazardous waste (Council Directive 94/67/EC)• Directive on the Landfill Waste (Council Directive 99/31/EC)
Transport, Import and Export• The supervision and control of shipments of certain types of
waste to non-OECD countries (Council Regulation 259/93)• Rules and procedures applying to shipments of certain
types of waste to non-OECD countries (Council Regulation1420/1999 and Commission regulation 1547/99)

and the type of productive structuresserved;
• basic data on waste: the type (municipalwaste, hazardous waste, packagingwaste…) and quantity (t/d, t/y, t/h,t/€…) of product to be treated; secon-dary raw material recovered; energy pro-duced (Mega joules of heat or Mwh ofpower);
• physical features: area occupied by theplant (thousand of m2), covered anduncovered storage areas (in thousandsm2), the position and discharge systemsfor effluent water;
• information on building techniques andbuilding phases;
• processing techniques for the treatmentplant: technology used, energy and mate-rial consumed and others goods and ser-vices consumed;
• other useful information: number of peo-ple employed during the building and themanagement phase, existence of remotecontrol or computerized equipment, etc.
This information could be relevant tohighlight the socio-economic impacts ofthe project, in terms of employment andincome distribution for example, as aninput for the environmental impact analy-sis (see below) and the financial and eco-nomic calculations.
3.1.4 Financial analysisThe financial revenue (inflow) is usually givenby the price for treatment, paid by private orpublic users, and the sales of products reco-vered (secondary materials and compost) orenergy production (heat and power) if any.Financial outflows are:
• Investment costs (land, buildings, equip-ment), including feasibility investmentstudies;
• Net residual values (residual value minuscosts of site remediation and decontami-nation if any);
• Stocks in raw materials or final products;
• Replacement costs for the componentswith a short life compared to the timehorizon of the project (machinery, etc.);
• Maintenance costs:
√ Purchases in energy, commodities, goodsand services used as inputs and neededfor the day to day working of the plants;
√ Management and administrative costs,including the insurance cost;
√ Technical and administrative person-nel costs.
The choice of a financial discount rate fol-lows the same guidelines as those appliedfor public investments in infrastructures.A time horizon of 30 years is advisablehere, but this depends on the type of wastetreatment facility used and the type ofwaste collected.
3.1.5. Economic analysisEconomic analysis is concerned with thesocial benefits of the project and requiresthe integration of externalities and the cor-rection of market failures in the calcula-tion of the ENPV or the EIRR.
The main stages of economic analysis arethe following:
• The financial analysis, which estimate therelevant financial flows calculated accor-ding to current market prices;
• The integration of externalities;
• The definition of conversion factors;
47
3.1 Waste treatment
into account the demographic growth andthe migratory flows. For industrial waste,the key parameter will be the expectedindustrial growth in relevant economic sec-tors. In any case, it is important to bear inmind the possible evolution in waste pro-ducer behaviors*, such as the increase of therecycling activities or the adoption of cleanproducts and clean technologies, with theirpotential consequences on waste streams:variation in the type of waste produced,decrease or increase in waste production.
Norm compliance must also be consideredfor the demand evaluation. According tothe waste management hierarchy and theconsiderations included in the applieddirectives (for example the PackagingDirective), needs for waste managementtreatment are expected to be increasinglysatisfied by prevention, recycling, compo-sting and energy recovery (heat or power).Consequently the sizes of an incinerator ora landfill should be calibrated in relation tothese future trends.
The steps of the demand evaluation are:
• the forecast demand, derived from thecurrent demand and demographic andindustrial growth predictions,
• the adjusted demand, according to thepotential changes in waste producerbehaviour and according to compliancewith current and expected policies andlegislation.
Cycle and phases of the projectThe following different phases of the pro-ject must be specified:
• conception and financial plan;
• technical studies;
• investigation phase to find an appropria-te site;
• building phase;
• management phase.
Delays occurring during of some phasescould be important, especially the timerequired for the research of an appropriatesite. For hazardous treatment plants, forexample, local hostility can feature, whichas a result can disturb the building and thenormal managing phases of the plant withnegative consequences on financial andeconomic flows.
The technical featuresThe description of the technical characteri-stics of the plant are crucial for compre-hension of the local economic and socialimpacts of the project, its environmentalimpacts and the total financial and econo-mic costs and benefits involved. In addi-tion, technical detailed information isrequired for the monitoring and evaluationactivities asked for the structural funds.
This section should at least give the follo-wing engineering data:
• basic socio-economic data: the num-ber of inhabitants served; the number
46
3.1 Waste treatment
Demographic growth rate
Current annual production of waste
ForecastDemand
Adjusted ForecastDemand
Economicgrowth rates
Changes in behaviour
RegulationChanges
Fig 3.2 The different steps of demand evaluation
* Such as the increase of the consumption correlated to the standard of living
Databases
Technical information
Socio-economicinformation
Environmentalinformation
Financial information
Socio-economicfeasibility
The best scenario
according to the feasibility
study Environmental
impacts
Total cost of the plan
Scenarios
Technical feasibility
Fig. 3.3 The different elements of a feasibility analysis

• Recycled materials Many recycled materials are traded, such asmetallic materials, paper or glass. Prices arestrongly correlated to international marketprices of raw materials and energy.Information required for the calculation ofconversion factors for traded items could beobtained from eco-industries, national andinternational statistical offices or Customs.
For non-traded items:
• BuildingsThe conversion factors are estimated accordingto a process analysis which differentiates tra-ded items from non-traded items. Informationrequired for the calculation of conversion fac-tors can be in some cases found in official sta-tistical compendia published regularly.
• Electricity produced, gas and heat recovery The conversion factor for electricity, consi-dered as an input, can be estimated as fol-lows: (1) a macroeconomic study which tryto estimate the opportunity costs of theelectricity production (“top down” ap-proach), (2) a process evaluation whichproceeds by breaking down the marginalcost structure of the production process(“bottom up” approach); (3) the applica-tion of the standard conversion factor whe-re electricity is a minor input.
If electricity is sold at prices below the longrun marginal cost (or, if not available, theconsumers' willingness to pay), this latterinformation should be used to calculate thecorrection for actual tariffs. In a final step,
49
3.1 Waste treatment
For landfills and incinerators, the majorpositive and negative externalities are asso-ciated with:
• Air emissions,
• Waste water emissions,
• Residual solid waste production,
• Energy recovery,
• Disamenity, such as noise and odour,
• Risk of accidents.
When methodologies proposed are contro-versial or data are lacking, the analysis ofthe externalities can be performed in a qua-litative way (see for example Tab. 3.1 andTab. 3.2 for qualitative analysis of externaleffects in incineration and land filling).However, in such cases, results cannot beused in the monetary analysis and must beinserted in a larger multicriteria analysis.
The conversion factors The items to be considered for the calcula-tion of the conversion factors for the wastetreatment facilities are the investment costs,the intermediate stocks, the products soldon the market (secondary materials, gas,heat or power), operational costs (inclu-ding labour costs) and decontaminationand dismantlement costs.
The estimate will be different when consi-dering traded items (raw materials, energy,commodities and other capital goods orservices) or non-traded items (electricityand gas recovery, land, some raw materialsor unskilled labour).Externalities should be considered as spe-cial non-marketed goods or services.For waste treatment plants conversion fac-tors will be calculated as follows:
For traded items:
• Equipment Equipment for waste management is fre-quently traded. This is the case for incine-ration equipment, such as furnaces, filtersand boilers, but also for collection andrecovery equipment. CIF (cost, insuranceand freights) and FOB (free on board) pri-ces can be applied.
3.1 Waste treatment
• The calculation of economic benefits andcosts.
Externalities generated by waste treatmentfacilities are mainly described by project’simpacts on human health (morbidity or mor-tality due to air, water or soil pollution), theenvironmental damages induced such aswater and soil contamination, the aestheticand landscape impacts and the economicimpacts, such as changes in land prices or eco-nomic development induced by the project.
Evaluation of external environmental costsand benefits can be based on the estimationof morbidity and mortality costs, the aver-ting costs and remediation costs. Somecontingent markets can also be set up forthe evaluation of the impacts on landscapeand an “hedonic price” can be calculatedwhere the plant induces market price chan-ges in lands or buildings.
Adjustment of market pricesThe economic analysis of the project requires adjustments of marketprices used in the financial analysis. Market prices are considered to befar from their long-term equilibrium because of numerous distortionssuch as those due to taxes, subsidies, import duties and other financialtransfers. To reflect opportunity costs, economic figures must take intoaccount externalities and remove all types of financial transfers.
A standard conversion factor is applied to internationally traded itemsto adjust market price and to calculate accounting prices reflectingopportunity costs. Prices on world markets represent the country’sactual trading opportunities and are thus an appropriate measure ofopportunity costs. The SCF conventionally reflects the weighted ave-rage divergence between border prices and domestic market pricesfor all traded goods and services in the economy and may be estima-ted based on foreign trade statistics using the following formula:
M + X(M+TM) + (X-TX)
Where: M = CIF value of total importsX = FOB value of total exportsTM = taxes on importsTX = taxes on exports
The standard conversion factor should be used by default, whenspecific sectoral conversion factors are unavailable.
Tab. 3.1 Overview of damages caused by emissions from incineration, illustrated as dose-response relations
Damage Medium Health effects Lower Forest Damage Climate Ecosystem(response) mortality morbidity agricultural Dis-back to buildings effectsEmission yield(doses)
Particulates Air + + 0 0 + 0 0(PM10)Nox (and O3) Air + + (-) + + 0 (-)SO2 Air (+) (+) + + + 0 -CO Air (+) (+) 0 0 0 + 0VOC Air (+) 0 0 0 0 0 0CO2 Air 0 0 0 0 0 + 0HCl, HF Air ? 0 (-) (-) (-) 0 ?Dioxins Air (+) - 0 0 0 0 -Heavy metals Air (+) - 0 0 0 0 -Dioxins Water ? ? 0 0 0 0 ?Heavy metals Water ? ? 0 0 0 0 (-)Salts Water 0 0 0 0 0 0 ?
Tab. 3.2 Overview of damages caused by emissions from landfills, illustrates as dose-response relations
Damage Medium Health Lower Forest Damage Climate Ecosystem(response) mortality morbidity agricultural Die-back to buildings effectsEmission yield(doses)
CH4 Air 0 0 0 0 0 + (-)CO2 Air 0 0 0 0 0 + (-)VOCs Air (+) 0 (-) 0 0 0 0dioxins Air (+) - 0 0 0 0 -Dust Air ? ? 0 0 ? 0 0Leach ate Soil ? ? 0 0 0 0 ?
and water
+ Measurable effect (+) Partly measurable effect - Non-measurable effect (-) Non-measurable but minor effects ? Non-measurable uncertain effects0 no Known effect
+ Measurable effect (+) Partly measurable effect - Non-measurable effect (-) Non-measurable but minor effects ? Non-measurable uncertain effects0 no Known effect
* Source: COWI Consulting Engineers and Planners AS., “A Study on the Economic Valuation Externalities from Landfill Disposal and Incineration of Waste”, Finalmain report, European Commission DG Environment, October 2000.

3.1.7 Sensitivity and risk analysis Critical factors influencing the success ofan investment in this sector are potentiallynumerous, such as: investment costs, keyinput dynamic costs (energy, raw mate-rials…), recovery product prices, costs ofremediation and other environmentalcosts.
According the list before, it would be advi-sable for the sensitivity analysis and riskanalysis to consider at least the followingvariables (potential critical variable):
• The cost of investment;
• The change in demand of waste disposalrelated to the diffusion of new productsor new technologies, changes in beha-viour, the variation in economic orpopulation growth;
• Variations in the sales price of recycledproducts;
• The dynamics of costs over time of somegoods and critical services for certainprojects (e.g. the cost of electricity and/orfuel or the cost of remediation anddecontamination of the sites).
A variation in 10 % (or 1 %) of the inputvariables could be used to assess the asso-ciated changes in ENPV or ERR or in anyother relevant variable (see Tab. 3.3). Forcritical variables a risk assessment must becarried out to calculate the probability dis-tribution of the final results.
Another type of risk analysis could be per-formed regarding social risk related to thepossible reject by people of the projectbecause of its potential impacts on qualityof life in the area concerned. The risk isusually called NIMBY (“Not In My Back-yard”) and can be investigated by a qualita-tive analysis based on questionnaire ordirect contacts with stakeholders involved.
3.1.8 Case study: Investment in an inci-nerator with energy recovery
Financial analysis The cost of the investment is fixed at EUR50 million:
• The capacity of the furnace is fixed at200,000 tons of municipal waste (per year).
• In order to make it easier in this example,the time horizon is only 10 years;
• The investment is financed by a loanwith a 3% interest rate, the investmentcost is split between 10% for land, 35 %for buildings and 55% for equipment(furnaces, boiler…);
• A 5% financial rate of discount is chosen
• The energy recycled is sold as heat andpower with a price of EUR 15 per ton(40% heat and 60% power);
• The price of treatment paid by final usersis fixed at EUR 25 per ton.
• Ten skilled employments (at 12000euro/person per year) and forty non-skil-led employments (at 10000 euro/personper year) are assumed;
• Functioning costs are fixed at EUR 10 per ton;
• Elimination cost of ash and slag waste areset at EUR 10 per ton;
• Renovation costs are assumed to be 5%of the initial cost of the investment andthe net residual value, over the 10 yearsof life of the plant, is fixed at 50% of theinitial cost of the investment.
The presentation of the financial analysiscan be viewed in the Tab 3.4. The numbersare expressed in 1000 of euro. The NetPresent Value (FNPV) calculated is 1862thousand euro, and the Internal Rate ofReturn (FRR) is approximately 6 %.
Economic analysisExternal costs and conversion factors arecalculated to adjust financials flows and areintended to reflect real opportunity costs.
51
3.1 Waste treatment
the domestic market price has to be conver-ted into a border price by an adequate con-version factor (the SCF may be used).
Gas and heat are products usually sold onlocal markets. If they are at the origin of aminor financial flow, as usually occurs, theSCF could be applied to convert local toborder prices. Otherwise (for example inthe case of methane), international priceto direct substitute could be used as adju-sted price.
• Land Land is generally of minor importance forindustrial projects, and may be convertedfrom market into border prices by the SCF.When land is important, for example in thecase of a landfill, its economic value isdetermined by the valuation – at borderprices – of the net output that would havebeen produced on the land if it had notbeen used by the project.
• Skilled and non-skilled labourLabour involved in waste management faci-lities is mainly non-skilled.The valuation of a price for skilled labourcould be done at the market prices, skilledlabour market is in fact reasonably compe-titive and market wage rates may reflectmarginal productivity.
For non-skilled labour, some distortionmay occur, due for example to a sectoralminimum salary. The output that unskilledlabour would have produced in its previousoccupation should be quantified. Theobtained value represents the economicopportunity cost of unskilled labour.
3.1.6 Other evaluation criteria
Environmental analysisFor a large number of waste treatment pro-jects, an environmental impact analysis(EIA) is required by regulatory texts7, espe-cially in the case of hazardous waste depo-sits or removal plants or for some types of
waste treatment plants such as authorizedlandfills. Furthermore many plants, aslandfills or incinerators, require permits forprescribed activities which set conditions torisk management, dangerous substancemanagement and pollution control8. In anycase it is advisable to insert a short environ-mental impact analysis even without speci-fic legal requirement.
The main elements of an environmentalimpact analysis are the following:
• Emissions in the atmosphere, speciallygreenhouse gas emissions (impacts rele-vant for incineration);
• Waste water discharges and soil contami-nation (impacts relevant for incinerationand land filling);
• Impacts on biodiversity (impact relevantfor major projects built near protectedarea);
• Impacts on human health, linked to pol-lutant emissions and contamination ofthe environment (impacts relevant forany waste treatment facility);
• Noises and odours (impacts relevant formany waste treatment plants);
• Aesthetic impacts on landscape (impactrelevant for incineration and land filling);
• Risk management of the site such as fireand explosions (impacts relevant for somespecific waste treatment plants such as oilwaste treatment plant and incineration).
In urban area, disturbances can also be regi-stered during the building phase of the plan-ts while in management phase perturba-tions, in addition to those listed above, arelikely to be linked to the collection of waste.
A qualitative approach of environmentalimpacts could always be used in order torank the potential environmental impactsaccording to the type of damage itinduced or its dangerousness. For examplethe major impacts of a landfill are likely tobe soil and water contamination, while, forincineration, impacts on air quality will bemore relevant.
50
3.1 Waste treatment
7At the European level see the Environmental Impact Assessment Directive (85/337/EEC).
8European legislation on pollution control and risk management sector is set out in the IPPC Directive (96/61/EC), in the Large CombustionPlants Directive (88/609/EEC) and the Seveso II Directive (96/82EC).
Tab. 3.3 Effects on the total cost of a 10% change in the main variable influencing the cost of incineration
Variables (inputs) Var. Effects on total cost of incineration
Volume of waste +10% -7,5%Energy price +10% -2,5% -3,5 %Ash and Slag from combustion Processes +10% +0,1%Transport cost of waste from combustion processes +10% +0,3%
Source IFEN (France), 2000
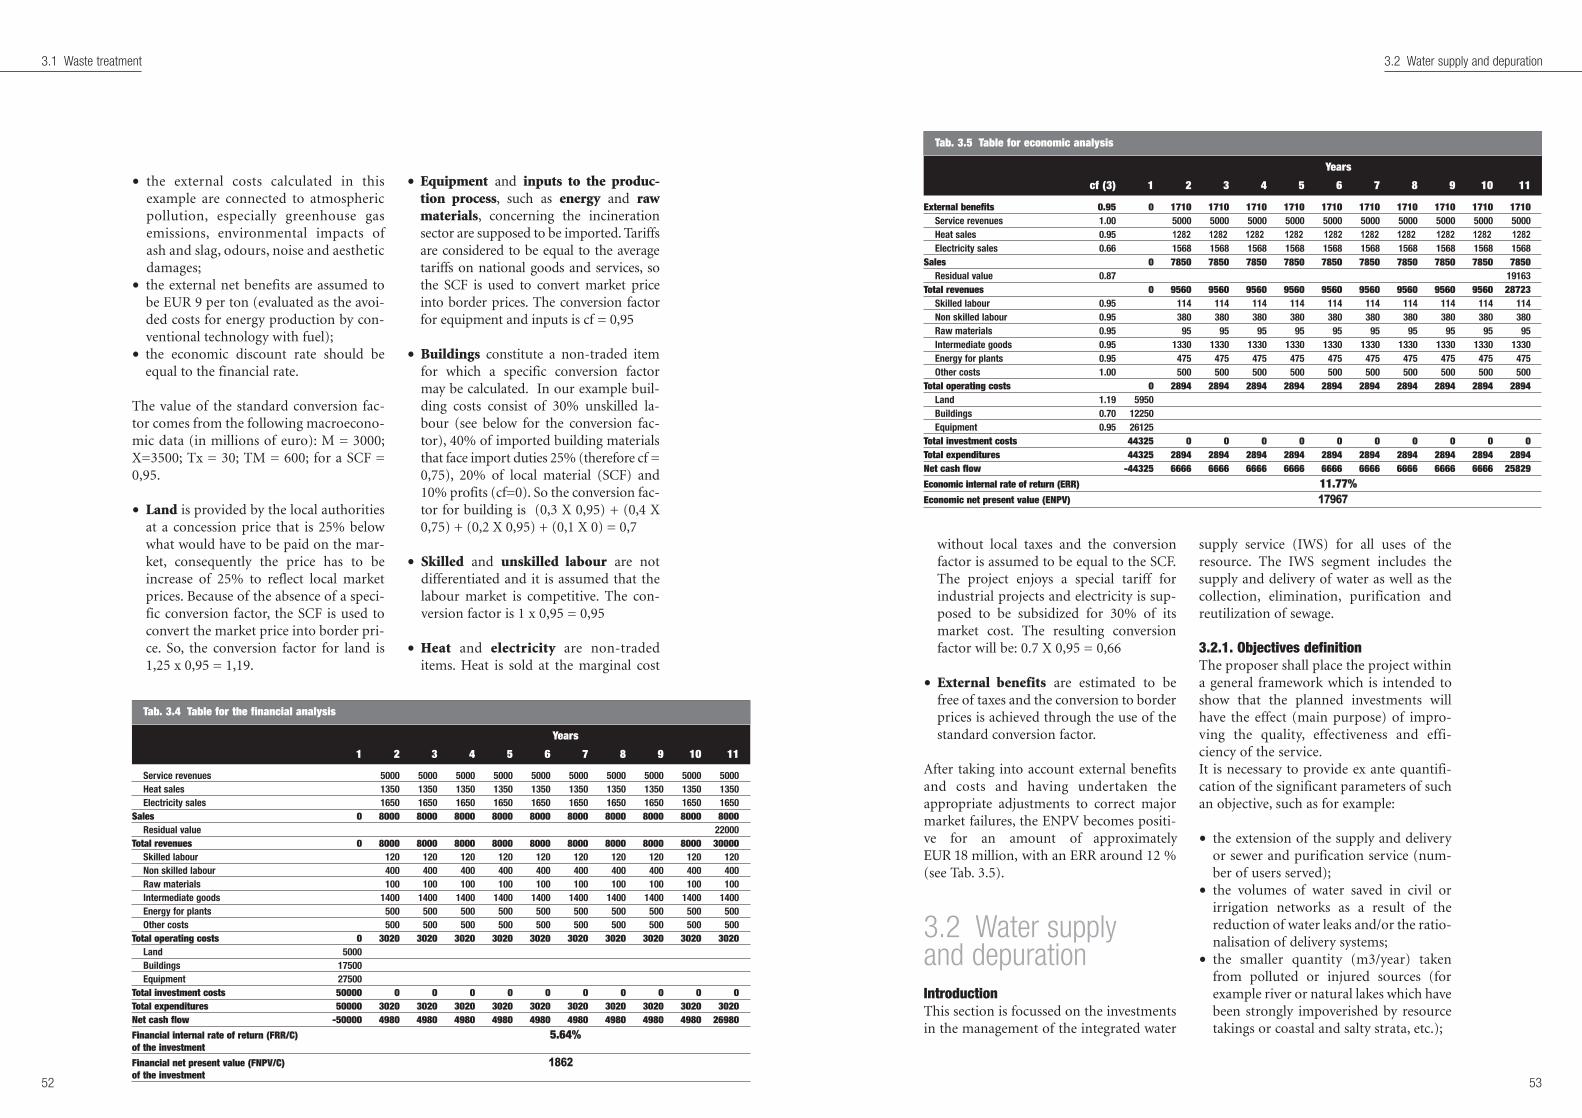
without local taxes and the conversionfactor is assumed to be equal to the SCF.The project enjoys a special tariff forindustrial projects and electricity is sup-posed to be subsidized for 30% of itsmarket cost. The resulting conversionfactor will be: 0.7 X 0,95 = 0,66
• External benefits are estimated to befree of taxes and the conversion to borderprices is achieved through the use of thestandard conversion factor.
After taking into account external benefitsand costs and having undertaken theappropriate adjustments to correct majormarket failures, the ENPV becomes positi-ve for an amount of approximatelyEUR 18 million, with an ERR around 12 %(see Tab. 3.5).
3.2 Water supply and depuration IntroductionThis section is focussed on the investmentsin the management of the integrated water
supply service (IWS) for all uses of theresource. The IWS segment includes thesupply and delivery of water as well as thecollection, elimination, purification andreutilization of sewage.
3.2.1. Objectives definitionThe proposer shall place the project withina general framework which is intended toshow that the planned investments willhave the effect (main purpose) of impro-ving the quality, effectiveness and effi-ciency of the service.It is necessary to provide ex ante quantifi-cation of the significant parameters of suchan objective, such as for example:
• the extension of the supply and deliveryor sewer and purification service (num-ber of users served);
• the volumes of water saved in civil orirrigation networks as a result of thereduction of water leaks and/or the ratio-nalisation of delivery systems;
• the smaller quantity (m3/year) takenfrom polluted or injured sources (forexample river or natural lakes which havebeen strongly impoverished by resourcetakings or coastal and salty strata, etc.);
53
3.2 Water supply and depuration
52
3.1 Waste treatment
Tab. 3.4 Table for the financial analysis
Years
1 2 3 4 5 6 7 8 9 10 11
Service revenues 5000 5000 5000 5000 5000 5000 5000 5000 5000 5000Heat sales 1350 1350 1350 1350 1350 1350 1350 1350 1350 1350Electricity sales 1650 1650 1650 1650 1650 1650 1650 1650 1650 1650
Sales 0 8000 8000 8000 8000 8000 8000 8000 8000 8000 8000Residual value 22000
Total revenues 0 8000 8000 8000 8000 8000 8000 8000 8000 8000 30000Skilled labour 120 120 120 120 120 120 120 120 120 120Non skilled labour 400 400 400 400 400 400 400 400 400 400Raw materials 100 100 100 100 100 100 100 100 100 100Intermediate goods 1400 1400 1400 1400 1400 1400 1400 1400 1400 1400Energy for plants 500 500 500 500 500 500 500 500 500 500Other costs 500 500 500 500 500 500 500 500 500 500
Total operating costs 0 3020 3020 3020 3020 3020 3020 3020 3020 3020 3020Land 5000Buildings 17500Equipment 27500
Total investment costs 50000 0 0 0 0 0 0 0 0 0 0Total expenditures 50000 3020 3020 3020 3020 3020 3020 3020 3020 3020 3020Net cash flow -50000 4980 4980 4980 4980 4980 4980 4980 4980 4980 26980
Financial internal rate of return (FRR/C) 5.64%of the investment
Financial net present value (FNPV/C) 1862of the investment
Tab. 3.5 Table for economic analysis
Years
cf (3) 1 2 3 4 5 6 7 8 9 10 11
External benefits 0.95 0 1710 1710 1710 1710 1710 1710 1710 1710 1710 1710Service revenues 1.00 5000 5000 5000 5000 5000 5000 5000 5000 5000 5000Heat sales 0.95 1282 1282 1282 1282 1282 1282 1282 1282 1282 1282Electricity sales 0.66 1568 1568 1568 1568 1568 1568 1568 1568 1568 1568
Sales 0 7850 7850 7850 7850 7850 7850 7850 7850 7850 7850Residual value 0.87 19163
Total revenues 0 9560 9560 9560 9560 9560 9560 9560 9560 9560 28723Skilled labour 0.95 114 114 114 114 114 114 114 114 114 114Non skilled labour 0.95 380 380 380 380 380 380 380 380 380 380Raw materials 0.95 95 95 95 95 95 95 95 95 95 95Intermediate goods 0.95 1330 1330 1330 1330 1330 1330 1330 1330 1330 1330Energy for plants 0.95 475 475 475 475 475 475 475 475 475 475Other costs 1.00 500 500 500 500 500 500 500 500 500 500
Total operating costs 0 2894 2894 2894 2894 2894 2894 2894 2894 2894 2894Land 1.19 5950Buildings 0.70 12250Equipment 0.95 26125
Total investment costs 44325 0 0 0 0 0 0 0 0 0 0Total expenditures 44325 2894 2894 2894 2894 2894 2894 2894 2894 2894 2894Net cash flow -44325 6666 6666 6666 6666 6666 6666 6666 6666 6666 25829
Economic internal rate of return (ERR) 11.77%Economic net present value (ENPV) 17967
• the external costs calculated in thisexample are connected to atmosphericpollution, especially greenhouse gasemissions, environmental impacts ofash and slag, odours, noise and aestheticdamages;
• the external net benefits are assumed tobe EUR 9 per ton (evaluated as the avoi-ded costs for energy production by con-ventional technology with fuel);
• the economic discount rate should beequal to the financial rate.
The value of the standard conversion fac-tor comes from the following macroecono-mic data (in millions of euro): M = 3000;X=3500; Tx = 30; TM = 600; for a SCF =0,95.
• Land is provided by the local authoritiesat a concession price that is 25% belowwhat would have to be paid on the mar-ket, consequently the price has to beincrease of 25% to reflect local marketprices. Because of the absence of a speci-fic conversion factor, the SCF is used toconvert the market price into border pri-ce. So, the conversion factor for land is1,25 x 0,95 = 1,19.
• Equipment and inputs to the produc-tion process, such as energy and rawmaterials, concerning the incinerationsector are supposed to be imported. Tariffsare considered to be equal to the averagetariffs on national goods and services, sothe SCF is used to convert market priceinto border prices. The conversion factorfor equipment and inputs is cf = 0,95
• Buildings constitute a non-traded itemfor which a specific conversion factormay be calculated. In our example buil-ding costs consist of 30% unskilled la-bour (see below for the conversion fac-tor), 40% of imported building materialsthat face import duties 25% (therefore cf =0,75), 20% of local material (SCF) and10% profits (cf=0). So the conversion fac-tor for building is (0,3 X 0,95) + (0,4 X0,75) + (0,2 X 0,95) + (0,1 X 0) = 0,7
• Skilled and unskilled labour are notdifferentiated and it is assumed that thelabour market is competitive. The con-version factor is 1 x 0,95 = 0,95
• Heat and electricity are non-tradeditems. Heat is sold at the marginal cost

In this case, the specific objectives shouldalso refer to the resource volumes madeavailable (millions of cubic metres peryear), the maximum flow rates(litres/second) conveyed, the overall capa-city of the long-term resource regulationwhich will be provided by the system.
3.2.2 Project identification
Typology of the investmentA precise definition of the type of availa-ble services is the first step to be taken indeveloping the analysis of the investment.From this point of view, it may be useful toconsider the analysis of demand, the suita-bility evaluation of the project also fromthe technological viewpoint and the studyof the components of costs, revenues andbenefits.
Territorial reference frameworkIf the project is placed within its territorialframework, this will provide for a preciseidentification of the investment.
The proposer should supply also the ele-ments required to ascertain the project’sconsistency with planning for the sector, atleast from the following three points ofview:
• consistency with the economic-finan-cial planning of the water sector, as maybe inferred from the pluriennial schedu-les for the use of community and natio-nal financing which have been approvedfor the various countries or regions;
• consistency with the national sectorpolicies, in particular the project shouldsignificantly foster the industrialisationobjectives of the sector, for the countrieswhere this process is under way;
• consistency with the community, natio-nal and regional environmental poli-cies, mainly for the use of water forhuman purposes, the treatment of sewageand the protection of water bodies.
The SWOT analysis, evaluating the projectpotentialities and risks deriving from the
context of incorporation, and the sustaina-bility analysis may also be of great help inmany cases.
3.2.3 Feasibility and options analysis
Analysis of the demandThe demand for water may be broken downinto additional components according tothe use (demand for drinking water, for irri-gation or industrial purposes, etc.), and thetiming of demand (daily, seasonally, etc.).
The estimation of the demand curve maybe based on data gained from previousexperience in the area involved or frompublished forecasting methods, particularlythose based on the concept of the consu-mer’s willingness to pay.
In case of replacements and/or completionsit is also useful to make reference to histori-cal data of consumption, provided that the-se data have been measured by reliablemethods (for example from the readings ofmeters).
Demand is made up of two fundamentalelements:
• the number of users in the case of civiluse, including temporary users like tou-rists of the surfaces to be irrigated incase of agricultural use and of produc-tion units to be served in the case ofindustrial use
• the quantity of water, which is being orwill be delivered to users for a givenperiod of time
It is important to note that, if the water net-work has been not well maintened in thepast, the analysis of demand should includethe problem of leakages. That is to say thatthe total water supply is made by the finalconsumption and the leakages.
An other important point is to considerthe elasticity of the demand to tariffs. Insome cases it will be necessary to estimatethe elasticity for different income groups
55
3.2 Water supply and depuration
• the continuity of service (frequency andduration of interruptions);
• the improvement of the water deliverysystem in dry weather conditions;
• the extent of the polluting load whichhas been removed;
• the improvement of environmental para-meters;
• the reduction of operating costs.
It is necessary to establish the specific ob-jectives. Investment in the sector may begrouped into two project categories fromthis point of view:
• projects intended to promote local deve-lopment1. In this case it is necessary to
establish the specific objectives of theinvestment, i.e. the population to be ser-ved and the average resource availability(litres/inhabitant*day)2 or the hectares tobe irrigated, the types of crops, the avera-ge expected production, the resourceavailability (litres/hectare*year), the timeand periodicity of irrigation, etc.
• the projects may have non-local objecti-ves, for example on a regional or interre-gional scale. This is the case of aqueductsfor long-distance transportation of waterfrom relatively rich areas to arid zones orthe construction of dams intended tosupply wide regions which may be alsofar away from their location.
54
3.2 Water supply and depuration
1Projects of sewers and depurators are almost always related to local development and they may be considered from a dual point of view: i)these actions are aimed at “closing” the water-cycle for hygienic-sanitary reasons and, as such, may be regarded as part of the integrated watersupply service, ii) they are also measures to safeguard the environment and in particular the quality of the bodies of water into which drainsflow. For this reason it is necessary to take into account also the specific objectives of the environment, as for example the quantity of remo-ved pollutants, the restoration of physical/chemical and biological quality parameters of water and soil, etc.
2If the resource is destined to the service of tourist areas, it is necessary to take into account the fluctuation of the population and the seaso-nality of the demand.
Type of actions:• construction of entirely new infrastructures (aqueducts, se-
wer systems, purifyers), intended to meet increasing needs,• works intended to complete aqueducts, sewers and purif-
yers which have been partially constructed, including thecompletion of water supply networks or sewer systems,the construction of trunk lines for the connection to theexisting conditioning systems, the construction of condi-tioning systems for the existing sewer systems, the con-struction of purifyers with tertiary treatment plants for thereutilization of conditioned sewage,
• partial modernisation and/or replacement of existinginfrastructure in compliance with the strictest rules andlaws in force,
• actions intended to save water resources and/or to provi-de for its efficient use,
• actions intended to rationally replace the use of theresource when it is not regulated (for example irrigationwith private uncontrolled wells),
• actions intended to improve management efficiency
Prevailing typology of investments:• works aimed at collection, regulation or production of the
resource, even on a pluriennial basis,• works meant for water transportation,• works meant for the local distribution of water resources
as well as for civil, industrial or irrigation purposes,• works meant for the treatment of primary water (clarifica-
tion, desalination, purification)• works meant for the collection and elimination of sewage,• works meant for the treatment and discharge of conditio-
ned sewage,• works meant for the reutilization of treated sewage.
Services offered:Civil services• infrastructures and/or plants serving high-density urban
areas,• infrastructures and/or plants serving the districts of towns
or villages,• infrastructures and/or plants serving small (agricultural,
mining, tourist) settlements and/or isolated houses,• infrastructures and/or plants serving high-density indu-
strial settlements and/or industrial areas,• rural aqueductsIrrigation service• district aqueducts for collective irrigation,• local aqueducts for individual or small-scale (oasis-like)
irrigation,Mixed service• aqueducts for irrigation and civil and/or industrial service,• industrial and civil aqueducts
Typology of investments and offered services

expected consumption. The actual startingdemand is represented by the actual con-sumption before the intervention.
A first obvious evaluation criterion for theinvestment depends upon the extent towhich the actual demand may be close tothe potential demand. It is necessary toconsider other factors, first of all those rela-ted to the environmental and economicsustainability of the investment. Thedemand the investment can actually fulfilcorresponds to the supply, net of any tech-nical resource loss and release.
Whenever the project may imply the use ofwater (surface or subsurface) resources, theactual availability of the resource volumesand flows required to fulfil the assumeddemand should be clearly shown by statisti-cally studying and analysing hydrology, thedown flows and regimes of strata and wha-tever may be of use.
If the project involves the purification anddischarge of sewage, it is necessary to analy-se the capacity of the body intended toreceive the load of polluting and nouris-hing substances, in a way compatible withenvironmental protection.
Cycle and phases of the projectGreat attention should be paid to the exi-stence of propaedeutic stages playing a fun-damental role for the completion of thework, such as for example the search fornew subsurface resources and their qualita-tive and quantitative assessment by meansof scout borings or hydrologic surveys andstudies intended to identify the best loca-tion of dams and crosspieces, their dimen-sions, the size of suppliers and so on.
It is also necessary to consider the institu-tional and administrative aspects relatedto the project as well as the expected exe-cution and building times.
The project must identify the manager(s)of any (public, private, local, national,multinational, etc) generated service,regardless of what its scale may be. The
economic, technical and entrepreneurialprofile of the manager(s) should be evalua-ted as an integral and essential part of theinvestment. In particular, if the project isexpected to be co-financed, with fundsowned by the constructor/ manager of theinfrastructure, it is necessary to ascertainthe manager’s capacity to support thefinancial and economic burden.
The technical featuresTo identify the functions of the action, it isnecessary to follow the pattern of the pre-vious point. The analysis should also becompleted through the identification oftechnical features.
Options analysisThe analysis should include comparisonswith:
• the previous situation (do-nothing sce-nario);
• the possible alternatives within the sameinfrastructure as for example: differentlocations of wells, alternative routes foraqueducts or trunk lines, different buil-ding techniques for dams, different posi-tioning and/or process technology forplants, utilisation of different energysources for desalination plants, etc;
• the possible alternatives of sewage drains(lagoons, different receptors, etc);
• the possible global alternatives, as forexample a dam or a system of crosspiecesinstead of a wells field or the agriculturalreutilization of properly treated sewage, aconsortial depurator instead of severallocal depurators, etc.
3.2.4 Financial analysisThe actions in the sector may fall within thecategory of infrastructure generating netrevenues. In this case, it is necessary to gua-rantee a significant co-financing sharethrough the proposer’s own funds. Sincemost of them derive from the “advances” ofthe future proceeds of services which willbe performed by using the infrastructureswhich have been built with the project, inthese cases the financial analysis shouldshow the proposer’s capacity to sustain theinvestment from this point of view.
57
3.2 Water supply and depuration
and between small and big users, becausethis may produce quite different values anddistributive impacts.
The project should focus on a demandforecast for the period corresponding tothe project cycle. It should take intoaccount demographic forecasts and migra-tion flows for an estimate of the users andthe agricultural or industrial developmentplans in the other cases. The time structu-re of the short-term demand (daily, seaso-nal, etc.) should be considered too.
In general, one can make a distinction bet-ween potential and actual demand. The
potential demand will correspond to themaximum requirement which should betaken into account for that investment. Forexample, demand may be evaluated forcivil purposes on the basis of water requi-rements for the same use (generally expres-sed on a daily and seasonal basis) arisingfrom a comparison with any situationwhich will be as close as possible to theproject’s and which has a good servicelevel. For irrigation purposes it may beestimated on the basis of specific agrono-mic studies or, in this case, even by ana-logy. The actual demand is the demandwhich is actually fulfilled by the investmentin question and which corresponds to the
56
3.2 Water supply and depuration
Identification of requirements
Definition of users
Coverage
Market pricesShadow prices
Availability
Check
YesNo
Environmental sustainability analysis
Context analysis(historical analyses,field studies, etc.)
Forecast estimates for the project life cycle
Definition and evaluation of requi-rements (Potential demand)
Definition and evaluation of consumption (Actual demand)
Direct socio-economic benefits Indirect socio-economic benefits
Fig.3.4 Chart for the analysis of the resource demand

the financial analysis should consider theresidual value of the investment, accordingto the methods which have been describedin the second chapter of the Guide.A time horizon of 30 years is advisable.
3.2.5 Economic analysisThe main social benefits to be introducedin the economic analysis may be usefullyevaluated according to estimates of expec-ted demand for water resources that theinvestment will satisfy. The basis for theestimation of an accounting price for watermay be the user’s willingness to pay for theservice. The willingness to pay can be quan-tified by applying the market prices ofalternative services (tank trucks, bottleddrinking water, distribution of drinks,purification by means of devices installedfor the users, in situ sanifying process ofpotentially infected waters, etc.) or byadopting other methods, which may befound in the literature (see bibliography).
For any water infrastructure meant for theservice of either industrial or agriculturalareas, it is possible to evaluate the addedvalue of the additional product which hasbeen gained through the water availability.
For any intervention which is intended toguarantee the availability of drinkingwater in areas with sanitary problems,where water sources are polluted, thebenefit may be directly estimated by valua-ting the deaths and illnesses which havebeen avoided by means of an efficientwater supply service. To make an econo-mic valuation, it is necessary to make refe-rence on the one hand (illnesses) to thetotal cost of hospital or out-patient treat-ments and to the income loss due to pos-sible absence from work and on the otherhand (deaths) to the human life valuequantified on the basis of the averageincome and residual life expectancy.
The social benefits of sewers and purifica-tors may be also evaluated on the basis ofthe potential demand for sewage4 which
should be fulfilled by the investment andestimated according to an adequate wateraccounting price.
Alternatively, if possible, direct valorisationmay be applied to benefits such as:
• the value of the illnesses and deaths avoi-ded thanks to an efficient drains service;
• the damage avoided to land, real estateand other structures due to potentialflooding or unregulated rainwater (for“white” or mixed drains), valorised onthe basis of the costs for recovery andmaintenance;
• in the case of purified discharges intorivers, lakes and land, the value of thewater resources in non-polluted collec-tors, to be estimated according to themethod shown for aqueducts.
In any case, if no standard economicappraisal method is applicable for the spe-cific project, it is possible to resort to anysimilar project which may have been deve-loped in a context as close as possible to theone of the affected area.
For the reasons stated in the section regar-ding objectives, the environmental externa-lities should be quantified in any case, con-sidering the following:
• the possible valorisation of the servedarea, quantifiable, for example, by therevaluation of real estate and building oragricultural area prices;
• the increased income due to the collateralactivities (tourism, fishing, coastal agri-culture, etc.) that may be settled or main-tained, for example in the case of artifi-cial lakes or projects intended to safe-guard rivers, lakes, straits and other col-lecting bodies;
• the negative externalities due to the pos-sible impacts on the environment (soilconsumption, inert consumption, spoi-ling of scenery, impact on the naturalcontext) and on any other infrastructure(e.g. roads and/or railways);
• the negative externalities during the con-struction phase due to the opening of
59
3.2 Water supply and depuration
For the outflow, the purchasing price of theproducts and services, necessary both for theoperation of plants and for the additionalservices supplied, should be considered.
The financial inflow generally derives fromtariffs or fees applied for the water supplyservice. Possible reimbursements (or otherforms of transfers) for the collection andtransport of rainwater as well as possible
proceeds for the sale of water in case of reu-se should also be considered, if they exist.Also in this case, the tariffs or sales prices ofany additional service the manager mayoffer to the user (for example hooking up,periodic maintenance, etc.) should be takeninto account.
Since water infrastructures are generallycharacterised by a long period of useful life,
58
3.2 Water supply and depuration
Identification of basic functional data:• Number of served inhabitants• Irrigated surface (hectares)• Number and type of served production structures• Water availability per capita (l/d*inhabitant) or per hectare
(l/d*hectare)• Water quality data (laboratory analysis)• Number of equivalent inhabitants, flow rates and parame-
ters of the polluting load of the water which should be trea-ted (laboratory analysis) and quality constraints of the waterwhich should be drained (defined by the law).
Identification of the territorial construction data of theinfrastructure:• Location of the works on the territory, shown by properly
scaled topographical maps (1:10000 or 1:5000 for net-works and plants; 1:100000 or 1:25000 for collection andsupply works, trunk lines);
• Physical connections between the structures and the (newor existing plants); it may be useful to enclose technical dra-wings of a schematic kind;
• Any interference and/or interconnection with the existinginfrastructures of any other type (streets, railways, electri-cal lines, etc).
Identification of physical and characteristic data:• Total length (Km), nominal diameters (mm), nominal flow
rate (l/s) and differences in height (m) of suppliers ortrunk lines,
• Nominal filled volumes (millions of m3) and height (m) ofdams (location plans and sections attached hereto),
• Number, length (m) and nominal flow rate (l/s) for runningwater taking works (location plans and sections attachedhereto),
• Number, depth (m), diameter (mm), drained flow rate (l/s) forwells fields (attach properly scaled location plan),
• Linear development (Km) and characteristic diameters(mm) of aqueducts or sewers (attach properly scaled loca-tion plan),
• capacity (m3) of tanks (attach location plans and sec-tions),
• occupied surface (m2), nominal flow rate (l/s) and diffe-rence in height (m) of any lifting apparatus (attach locationplans and sections),
• Nominal flow rate (l/s), production (m3/g) and absorbed /consumed power (KW or Kcal/h) of purification or desali-nation plants (attach lay-out and flow pattern);
• Technical features and configuration of the main structu-res, for example by enclosing one or several typical sec-tions and/or sketches (sections of ducts, layouts of con-trol rooms, etc.) and by specifying the parts which havebeen recently built;
• Technical and constructive features of the main liftingapparatus, production or treatment plants, by enclosingfunctional layouts in details;
• Nominal flow rate (l/s), capacities (equivalent inhabitants),conditioning efficiency (at least on BOD, on COD, on pho-sphorous and nitrogen) of purification plants as well as thetechnical and constructive features of drain pipes (attachlocation plans, lay-outs and flow patterns);
• Technical and constructive features of the buildings orother service structures, by enclosing location plansand sections;
• Relevant technical elements, such as crossings, cavetanks, galleries, remote control plants or computerisedservice management plants, etc. (by enclosing data andlay-outs)
• Identification of the main components and materials pro-posed by the project, by specifying their availability (oflocal production or importation) in the investment area.
• Identification of any technology which may have been pro-posed for the realisation of the infrastructure, by specif-ying its availability and convenience (for example from theviewpoint of maintenance).
• In case of conditioners, identify the options for the dispo-sal of treatment mud. In case of desalination plants, iden-tify the options and infrastructures for the disposal ofconcentrated brine.
4 Basically the same as the demand for water.

• the rate of demographic growth (for civiluse) and the forecasts of any migrationflow;
• the development rate of crops and thenational and/or international dynamicsof the sale prices of agricultural products(for irrigation purposes);
• the variation in tariffs or fees over aperiod of time;
• the demand and price dynamics of thewater which may be recycled in case ofreutilization;
• the operating costs (maintenance, mana-gement, etc) and their time dynamics,even with reference to the evaluated sui-tability of management systems;
• the dynamics of costs over time of somecritical goods and services for certainprojects (e.g. the cost of fuels and/or elec-tric energy for desalination plants, thecost of chemical additives and the muddisposal cost for depurators).
3.2.8 Case study: infrastructure sheet forthe management of the IWS
The project, represented schematically in thefigure below, is an investment in the field ofsewerage and water purification, and thereuse of wastewater for multiple purposesthrough intensive tertiary treatment.
This includes the construction of a newwater purifier, in keeping with currentregulations, to serve a medium-sized city(235,000 residents in the initial year) andan adjacent industrial area, undergoing fulldevelopment. The new water purifier sub-stitutes an existing plant, which is inade-quate since it only screens and removes gritfrom the wastewater.
The project also includes the completionof urban sewers for 25% of the popula-tion (new settlements) and interceptor
61
3.2 Water supply and depuration
building sites, especially for urban net-works (negative impacts on housing,production and service functions, onmobility, historical and cultural heritage,on the agricultural framework and oninfrastructures, etc.).
3.2.6 Other evaluation criteriaIn addition to what has already been statedin previous paragraphs, here it may be use-ful to produce a special evaluation of theeffectiveness of the proposed system whenthe location for the project is a sensitivearea from the environmental point of view.
Environmental analysisIn any case, during the evaluation stage, it isnecessary to analyse, even if briefly5, theenvironmental impact of the works to beundertaken with the project and to checkany deterioration of the soil, the waterbodies, the landscape, the natural environ-ment, etc. Particular attention should bepaid to the use of valuable areas, such asnatural parks, protected areas, natural sanc-tuaries, sensitive areas, etc. In some cases, itis also necessary to take into account towhich extent the wild fauna life may be dis-turbed by the infrastructures in course ofconstruction and by their management acti-vities. As to investment affecting urban cen-tres (sewerage systems or water networks),it necessary to consider the impacts due tothe opening of yards which may negativelyaffect house and service functions, mobility,existing infrastructure and so on.
The analysis above falls within a moregeneral evaluation of sustainability accor-ding to the environmental constraints anddevelopment hypotheses of the proposedinvestment, for which it is necessary to eva-luate not only the economic and environ-mental benefits, but also the extent towhich its development may cause such aconsumption and/or a deterioration of thenatural functions of the area that may com-promise any potential future utilisation, inthe broadest meaning of the term, i.e.including the natural use of wide areas.
Where required, such an evaluation shouldalso consider the alternative, even future, uti-lisation of the same (surface, subsurface)water body which should be understood as asource of water resource or as a receivingbody and, as a consequence, the impacts adecrease in the flow rate and a change in theriver regimen resulting from its barrage by adam may have on the anthropic activities per-formed in the same natural environment(flora, fauna, water quality, climate, etc.). Forsome countries it is necessary to evaluate thepositive or negative investment contributionto the desertification processes underway, etc.
A quantitative approach can successfully usemulti-criteria analysis methods. The resultsof this analysis may bring about a seriousmodification of the proposed investment orof its rejection. Whenever their quantifica-tion is methodologically possible, the esti-mated positive and negative impacts shouldfall within the monetary evaluation of thesocial benefits and costs of the investment.
3.2.7 Sensitivity and risk analysis The critical factors influencing the successof an investment in this sector are:
• any unexpected occurrence in the con-struction of the plants, which might con-siderably change the cost of the invest-ment in progress;
• the forecasts of the demand dynamics;
• the rate of change in tariffs or fees, largelydepending upon the decisions taken bythe national or regional regulatory bodies;
• the lack of capacity to respond to shocksin the investment (which often requiresexcess capacity in the first operatingperiods);
• the determining influence of collateralinterventions (for example, the effective-ness of water supply is strictly related tothe state of the distribution networks);
• the efficiency of management.
In this regard, it would be advisable for thesensitivity and risk analysis to consider atleast the following variables:
• the cost of the investment;
60
3.2 Water supply and depuration
5 Legislation in the majority of member countries requires the compulsory evaluation of the environmental impact for some of these infra-structures (e.g. dams, large aqueducts, depurators, etc.), in the approval stage of projects. Fig. 3.5 Project map
River
Industrial area and sewer system
Irrigated area
Urban areas
Wells
Spring
Lift station
Purification plants
Tertiary treatment
Discharge pipe
Transom
Discharge main
Divisor
Header tank
The water supplyFrom the point of view of water resources, the new supply willsignificantly supplement the industrial area’s existing supply froma small aqueduct fed by wells and springs; however only with theconstruction of the project under examination will the integratedwater service be completed and on-going industrial installations beable to take off and be fully functional.
As regards the area irrigated, the new resource will partly (46%)substitute some of the water currently provided by the water-tableand the river, both becoming impoverished because of the pressu-re of excessive abstraction, and will partly (54%) supplement theavailable volumes, allowing for the irrigation of the whole agricul-tural area covered by the distribution network (roughly 1,100 hec-tares), developed with previous public financing and at the momentonly partially utilised.

the new services generated by the project.The total supply is considered gross of lea-kages in the water network. The real con-suption is calculated as follow:
real consumption= total supply - leakages
Project analysis In the civil segment, the demand for purifi-cation comes from both the users of the exi-sting urban sewer network and those whowill be hooked up to the part to be develped.
In the initial year, the annual volumes ofcivil waste amount to 15.57 million cubicmetres (Mm3), and industrial waste to 3.95Mm3, for a total of 19.52 Mm3 to be col-lected by the effluent trunk line and treatedby the water purifier.In order to determine the demand for waterfor reuse a preliminary analysis of differentalternatives was made and the followingconclusions reached.
Since a drastic increase in demand is expec-ted from the industrial area, the optimumsolution is to supply it entirely with treatedwaste water, rather than to build a newaqueduct which would need to be fed by
sewers linking to the existing effluentmain1, and the development of a sewerand waste collection system in the indu-strial area.
For reuse the project contemplates thedevelopment of three modules of intensivetreatment (tertiary), which will treat anaverage of just over 60% of the flow ofpurified waste4. Both the irrigation network
and the water distribution network for theindustrial installations already exist.
The project proposer is the firm which hasmanaged the integrated water service of thearea object of the investment for the past 20years5. The proposer is prepared to co-finance the investment (the size of the cofi-nancing rate is yet to be decided), takinginto account the receipts it will gain from
springs providing suitable volumes, thatexist only in an area at some distance fromthat of use. The small existing aqueduct willstill be used to supplement supply and inpeak periods.
The needs to be satisfied in the case of irri-gation supply are twofold:
• it is necessary to significantly increasethe supply of this resource in order tofully utilise the area already equippedwith the distribution network in orderto encourage and accompany the cultu-ral transformation process underwaytowards non-surplus and higher addedvalue production;
• the current use of the water-table and of a small body of surface water has put excessive pressure on these naturalresources, which both show tangiblesigns of impoverishment and vulnerabi-lity; it is therefore necessary to reduceintake.
The development of these considerationsled to the solution described in the pre-vious section.
Financial analysisAn explanation of the financial analysis andthe result are shown in Tab. 3.7.
The time horizon is 25 years.
The analysis, conducted from the point ofview of the financing agency, takes intoconsideration the costs and differential
63
3.2 Water supply and depuration
62
3.2 Water supply and depuration
1The existing urban effluent trunk main and the discharge main from the water purifier will only be modified slightly (the area linking it to the new plant and tertiarytreatment), and the rest of the existing system will continue to be used. The purified water is discharged into the river.
2The volumes of wastewater take into account a dispersion co-efficient of 0.88. The contamination level (BOD Biochemical Oxygen Demand, COD, Chemical OxygenDemand) was estimated using standard environmental engineering methods.
3The volumes of waste take into account a dispersion co-efficient of 0.70 in the industrial processes and in the waste collection systems. A specific analysis of the indu-strial processes was carried out to determine their contamination levels.
4Below this plant a lift station and a discharge pipe carry the treated water to a separator reservoir, from which, thanks to the force of gravity, it passes down pipes tothe existing header tank of the irrigated area and the new reservoir above the industrial network.
5Although the firm has no specific experience in reuse technologies, it does have solid managerial experience in the civil field and has thus far achieved good qualitylevels in the service offered. It is also in a healthy economic-financial position and regularly and efficiently collects the proceeds from tariffs for the service.
The volume of water to be treated has been estimated on thebasis of an average daily water supply of 220 litres per inha-bitant and taking into account the fluctuation in the popula-tion (in the three summer months the population resident inthe city shrinks by an average of 25%).
The size of the daily water supply was determined on thebasis of a study of the needs of the civil population of areassimilar to those of the project (similar social customs, simi-
lar consumption levels, same geographic area, etc.) and cor-rected in the light of data on historic consumption in the cityin question, available from the service provider, who is, aswe have said, also the proposer of the investment2.
For the industrial area the water demand was estimated onthe basis of the specific consumption of industrial installa-tions and taking into account a period of activity of 11months per year3.
The water demand
The dynamics of demandThe dynamics of demand were determined bearing in mind the evolu-tion of the population resident in the city, which has two components:• a demographic rate of growth (the average for the region) of
0.20% per year;• a migratory flow with a positive balance (mainly due to the growth
in industrial activities) of 2,900 per year for the first 5 years, whichis reduced by a third (to 1,933 per year) from the 6th to the 10thyears and finally stabilises at a fifth (580 per year);
• no change in industrial demand is hypothesised.
Tab. 3.6 Some hypothesis for quantification of financial costs and revenues
Years
1 2 3 4 5 6 7 8 9 10 11 12 13 14 15 16 17 18 19 20 21 22 23 24 25
Demographic increase 235,470 235,941 236,413 236,886 237,359 237,834 238,310 238,786 239,264 239,743 240,222 240,702 241,184 241,666 242,150 242,634 243,119 243,605 244,093 244,581 245,070 245,560 246,051 246,543 247,036Migratory flow
Annual value 2,900 2,900 2,900 2,900 2,900 1,933 1,933 1,933 1,933 1,933 580 580 580 580 580 580 580 580 580 580 580 580 580 580 580Cumulative value 2,900 5,800 8,700 11,600 14,500 16,433 18,367 20,300 22,233 24,167 24,747 25,327 25,907 26,487 27,067 27,647 28,227 28,807 29,387 29,967 30,547 31,127 31,707 32,287 32,867Residents served by the water purifier 238,370 241,741 245,113 248,486 251,859 254,267 256,676 259,086 261,497 263,909 264,969 266,029 267,091 268,153 269,216 270,281 271,346 272,412 273,479 274,547 275,617 276,687 277,758 278,830 279,903Residents served by sewers 59,593 60,435 61,278 62,121 62,965 63,567 64,169 64,772 65,374 65,977 66,242 66,507 66,773 67,038 67,304 67,570 67,836 68,103 68,370 68,637 68,904 69,172 69,439 69,707 69,976
Annual volumes (millions of cubic metres)New civil sewer 3.95 4.00 4.06 4.12 4.17 4.21 4.25 4.29 4.33 4.37 4.39 4.41 4.42 4.44 4.46 4.48 4.49 4.51 4.53 4.55 4.56 4.58 4.60 4.62 4.64Urban purification 15.79 16.01 16.24 16.46 16.69 16.84 17.00 17.16 17.32 17.48 17.55 17.62 17.69 17.76 17.83 17.91 17.98 18.05 18.12 18.19 18.26 18.33 18.40 18.47 18.54Industrial sewer and purification 3.95 3.95 3.95 3.95 3.95 3.95 3.95 3.95 3.95 3.95 3.95 3.95 3.95 3.95 3.95 3.95 3.95 3.95 3.95 3.95 3.95 3.95 3.95 3.95 3.95Supplied the reservoir for the industrial area 4.77 4.77 4.77 4.77 4.77 4.77 4.77 4.77 4.77 4.77 4.77 4.77 4.77 4.77 4.77 4.77 4.77 4.77 4.77 4.77 4.77 4.77 4.77 4.77 4.77Supplied to the reservoir for the irrigation area 4.14 4.14 4.14 4.14 4.14 4.14 4.14 4.14 4.14 4.14 4.14 4.14 4.14 4.14 4.14 4.14 4.14 4.14 4.14 4.14 4.14 4.14 4.14 4.14 4.14Substituted to reduce the existing supply 1.90 1.90 1.90 1.90 1.90 1.90 1.90 1.90 1.90 1.90 1.90 1.90 1.90 1.90 1.90 1.90 1.90 1.90 1.90 1.90 1.90 1.90 1.90 1.90 1.90Additional supplying for the irrigation area 2.24 2.24 2.24 2.24 2.24 2.24 2.24 2.24 2.24 2.24 2.24 2.24 2.24 2.24 2.24 2.24 2.24 2.24 2.24 2.24 2.24 2.24 2.24 2.24 2.24
Tariffs of services
Civil sewerage service 0.09 0.10 0.10 0.11 0.12 0.12 0.12 0.13 0.13 0.13 0.14 0.14 0.14 0.15 0.15 0.16 0.16 0.16 0.17 0.17 0.18 0.18 0.18 0.19 0.19Civil purification service 0.28 0.30 0.32 0.33 0.35 0.37 0.38 0.39 0.40 0.41 0.42 0.43 0.44 0.45 0.46 0.48 0.49 0.50 0.51 0.52 0.54 0.55 0.56 0.58 0.59Industrial sewer and purification service 0.46 0.48 0.49 0.50 0.51 0.53 0.54 0.55 0.57 0.58 0.59 0.61 0.63 0.64 0.66 0.67 0.69 0.71 0.72 0.74 0.76 0.78 0.80 0.82 0.84Water supply to the reservoir 0.57 0.58 0.60 0.61 0.63 0.64 0.66 0.68 0.69 0.71 0.73 0.75 0.76 0.78 0.80 0.82 0.84 0.86 0.89 0.91 0.93 0.95 0.98 1.00 1.03for industrial purposesWater supply to the reservoir 0.15 0.16 0.16 0.17 0.17 0.18 0.18 0.18 0.19 0.19 0.20 0.20 0.21 0.21 0.22 0.22 0.23 0.24 0.24 0.25 0.25 0.26 0.27 0.27 0.28for irrigation purposes

The additional running costs, that is thosenecessary to carry out the services genera-ted by the investment (the new sewers for25% of the population, the purificationplant for the whole city and for the indu-strial area, the supply of water for industryand for agriculture), include costs for per-sonnel (subdivided between technical andadministrative staff), electricity, mainte-nance including spare parts, reagents andother goods for purification and tertiarytreatment, for eliminating treatment slud-ge, for the purchase of other goods andintermediary services (technical and admi-nistrative).
Wherever possible these costs have beenquantified on the basis of the technical datafor the project (electricity, maintenance,reagents, eliminating sludge), or by extra-polation of the data obtained from the
management experience of the proposer(personnel, other goods and services).
The calculation of the maintenance costswas carried out on the basis of prices on thelocal market, or, when these were not avai-lable, on those of the region or country.
In addition to the costs above, the costs forthe replacement of components with a“short” life compared to the time horizonof the project were considered: that is, basi-cally, machines and other electromechani-cal equipment for the treatment and raisingplants which, in accordance with the tech-nical data from the literature, are assumedto have a useful life of 15 years.
65
3.2 Water supply and depuration
revenue generated by the development ofthe proposed investment compared to tho-se of a scenario without the investment.
Some hypothesis on the calculation offinancial costs and benefits are summarizedin Tab. 3.6.
Among the costs considered are thosenecessary for the development of the pro-ject, including expenses for studies, plan-ning, management of the work, trials,other general expenses, and all costs rela-ted to the development and testing of theworks foreseen. The total cost (Euro89.15 million) has been subdivided intohomogeneous categories, whose valueshave been attributed (at constant prices)to the first three years, on the basis of theschedule for the implementation of theproject.
3.2 Water supply and depuration
The tertiary treatement of wasteThe plant for the intensive (tertiary) treatment of waste will be madeup of three modules which, using part (520 litres per second) of theflow discharged by the water purifier, will treat 11.88 Mm3 of waterper year with an output of water available for reuse of 8.91Mm3/year, which will be utilised as follows:
• 4.77 Mm3/year are destined for industry, which will be supple-mented (0.87 Mm3/year) by the existing aqueduct in order tocover all needs;
• 4.14 Mm3/year are destined for agriculture, during the irrigationseason of roughly seven months, which will serve to half the volu-mes currently abstracted from natural sources, which will thus fallfrom 3.80 Mm3/year to 1.90 Mm3/year and also to supply newresources; the total volume available will be 6.04 Mm3/year.
The non-treated flow from the re-use modules will still be dischar-ged into the river.
Tab. 3.7 Table for the financial analysis - Thousands of Euro
Years
1 2 3 4 5 6 7 8 9 10 11 12 13 14 15 16 17 18 19 20 21 22 23 24 25
New urban sewer system 140 449 480 512 529 548 567 586 603 621 639 657 677 696 716 737 759 781 803 827 850 875 900New urban purifying system 1711 5491 5871 6253 6471 6695 6926 7164 7373 7588 7808 8035 8269 8509 8756 9010 9272 9541 9817 10102 10394 10695 11005Industrial sewer and purification system 642 1975 2025 2075 2127 2180 2235 2291 2348 2407 2467 2528 2592 2656 2723 2791 2861 2932 3005 3081 3158 3237 3317Water supplying for industrial tank 949 2918 2991 3066 3142 3221 3302 3384 3469 3555 3644 3735 3829 3925 4023 4123 4226 4332 4440 4551 4665 4782 4901Water supplying for irrigation (additional) 121 374 383 393 402 412 423 433 444 455 467 478 490 502 515 528 541 555 568 583 597 612 627Revenue from services 3564 11207 11750 12299 12672 13056 13451 13858 14237 14625 15025 15435 15856 16289 16733 17189 17658 18140 18635 19143 19665 20201 20751Revenues from other services 51 156 160 164 169 173 178 183 188 193 198 203 209 215 220 226 233 239 245 252 259 266 273Residual value of infrastructures 39438Total revenues 3615 11363 11910 12463 12841 13229 13629 14041 14425 14818 15223 15638 16065 16503 16953 17416 17891 18379 18880 19395 19923 20467 60462Technical personnel 259 444 1372 1414 1456 1500 1545 1591 1639 1688 1738 1791 1844 1900 1957 2015 2076 2138 2202 2268 2336 2406 2479 2553Administrative personnel 76 157 806 830 855 881 907 934 962 991 1021 1052 1083 1116 1149 1184 1219 1256 1293 1332 1372 1413 1456 1499Reagents and other specialist materials 0 0 690 707 725 743 761 780 800 820 840 861 883 905 927 951 974 999 1024 1049 1076 1103 1130 1158Energy for lifting 0 0 52 53 54 55 56 57 58 60 61 62 63 64 66 67 68 70 71 73 74 76 77 79Energy for plants 0 0 555 566 577 589 601 613 625 637 650 663 676 690 704 718 732 747 762 777 793 808 825 841Maintenance 119 244 1248 1279 1311 1344 1378 1412 1447 1484 1521 1559 1598 1638 1678 1720 1763 1808 1853 1899 1947 1995 2045 2096Cost of eliminating mud 0 0 597 612 627 643 659 675 692 710 727 745 764 783 803 823 843 865 886 908 931 954 978 1003Intermediate goods and technical services 25 52 266 272 279 286 293 301 308 316 324 332 340 349 358 366 376 385 395 405 415 425 436 447Administrative, financial, economic services 0 29 146 150 154 158 161 165 170 174 178 183 187 192 197 202 207 212 217 223 228 234 240 246Total operating costs 479 925 5732 5883 6038 6198 6361 6529 6702 6879 7061 7248 7439 7636 7838 8046 8259 8478 8703 8934 9171 9415 9665 9921Labour 7698 14456 7860Materials 11688 21950 11934Rentals 1017 1909 1038Transports 895 1680 914Expropriations 1063 767 299Project studies, works management, trials 1796 1660 526Total investment costs 24156 42422 22571 0 0 0 0 0 0 0 0 0 0 0 0 0 0 0 0 0 0 0 0 0 0Replacement cost for “short life” components 16109Total expenditures 24156 42901 23495 5732 5883 6038 6198 6361 6529 6702 6879 7061 7248 7439 7636 23947 8046 8259 8478 8703 8934 9171 9415 9665 9921Net cash flow -24,156 -42,901 -19,881 5,631 6,027 6,425 6,643 6,868 7,100 7,340 7,546 7,758 7,975 8,199 8,429 -7,444 8,907 9,157 9,413 9,676 9,946 10,224 10,509 10,802 50,541Financial internal rate of return (FRR/C) 6.45%of the investmentFinancial net present value (FNPV/C) 15042of the investment
Inflation• An inflationary dynamic was applied to costs (constant annual
accrual of 2.5%)• for real salaries a growth accrual of +0.5% annually (accrual of
monetary wages = 3.0% annually),• prices for energy discount a differential of –0.5% compared to
inflation.
The calculation of revenuesThe revenue predicted for the initial year (Euro 9,818,000) has beencalculated as follows:• Civil sewerage service (new connections for 25% of residents):
3.89 Mm3/year x Euro 0.093 per m3 = Euro 362,000;• Civil purification service (in the current situation “without the
intervention” no purification charge is applied): 15.57 Mm3/year xEuro 0.28 per m3 = Euro 4,422,000;
• Industrial sewer and purification service: 3.95 Mm3/year x Euro0.46 per m3 = Euro 1,834,000;
• Industrial supply in the reservoir: 4.77 Mm3/year x Euro 0.57 per m3 =Euro 2,710,000;
• Irrigation supply (additional volumes): 2.24 Mm3/year x Euro 0.15per m3 = Euro 347,000;
• Revenue from other services (3% of the first and the second): Euro144,000.
In accordance with the regulations of the country in which the invest-ment will be made, the tariffs are revalued according to inflation6.To take into account the time necessary to construct the infrastructures,a receipts correction co-efficient was introduced into the calculation.
6Furthermore, when the investment is being partially co-financed bythe proposer/manager – as it is in this case – an increase greaterthan the rate of inflation is allowed. In the analysis we assume a fur-ther increase of 3% annually for the first 6 years, applied only to thetariffs for civil sewerage and purification services.

of the residual useful lifeof the cost of the invest-ment, revalued accordingto inflation.
The following indices areobtained from the cashflows: FNPV = 15,042 thou-sands Euro; FRR/C = 6.45%.
Economic analysisTo convert the prices ofthe financial analysis specificconversion factors (see Tab. 3.8) and stan-dard conversion factor (SCF) have beenused.
The conversion factors allow for the correc-tion of market prices for distortions whichdistance the value from that of long termequilibrium (transfers, state aid, etc.).
The conversion factorsallow for the calculation ofthe social costs due to theinvestments, the runningcosts and the renewal of“short” life equipment (seefinancial analysis).
Added to these are thenegative externalities: thecosts due to the opening ofthe site, which have an
impact mainly on the urbanarea, transport and other territorial func-tions, and the cost of using the land.
The costs due to the consumption of unu-sed land are absorbed in the revaluedinvestment costs.The overall impact of the opening of theconstruction sites must necessarily be esti-mated approximately on the basis of thevalue of the social cost due to the prolon-ged opening of the construction site. Thisproxy is roughly EUR 6,500,000 for eachyear’s delay in concluding the works. Thisamount, revalued according to inflation,was applied as a cost in the first threeperiods of the analysis.
The social cost due to the use of the land(about 37 ha) for constructing the newinfrastructure is not completely represen-ted by the cost of expropriation (to whichits own conversion factor was applied),inasmuch as this is not representative ofthe value attributable to the best use of the
3.2 Water supply and depuration3.2 Water supply and depuration
Tab. 3.9 Some hypothesis for quantification of economic costs and benefits
Years
1 2 3 4 5 6 7 8 9 10 11 12 13 14 15 16 17 18 19 20 21 22 23 24 25
QuantitiesResidents
Demographic increase 235,470 235,941 236,413 236,886 237,359 237,834 238,310 238,786 239,264 239,743 240,222 240,702 241,184 241,666 242,150 242,634 243,119 243,605 244,093 244,581 245,070 245,560 246,051 246,543 247,036Migratory flow
Annual value 2,900 2,900 2,900 2,900 2,900 1,933 1,933 1,933 1,933 1,933 580 580 580 580 580 580 580 580 580 580 580 580 580 580 580Cumulative value 2,900 5,800 8,700 11,600 14,500 16,433 18,367 20,300 22,233 24,167 24,747 25,327 25,907 26,487 27,067 27,647 28,227 28,807 29,387 29,967 30,547 31,127 31,707 32,287 32,867Residents served by the water purifier 238,370 241,741 245,113 248,486 251,859 254,267 256,676 259,086 261,497 263,909 264,969 266,029 267,091 268,153 269,216 270,281 271,346 272,412 273,479 274,547 275,617 276,687 277,758 278,830 279,903Residents served by sewers 59,593 60,435 61,278 62,121 62,965 63,567 64,169 64,772 65,374 65,977 66,242 66,507 66,773 67,038 67,304 67,570 67,836 68,103 68,370 68,637 68,904 69,172 69,439 69,707 69,976
Annual volumes (millions of cubic metres)New civil sewer 3.948 4.004 4.060 4.115 4.171 4.211 4.251 4.291 4.331 4.371 4.388 4.406 4.424 4.441 4.459 4.476 4.494 4.512 4.529 4.547 4.565 4.582 4.600 4.618 4.636Purification treatement for civil uses 15.791 16.015 16.238 16.462 16.685 16.845 17.004 17.164 17.324 17.483 17.554 17.624 17.694 17.764 17.835 17.905 17.976 18.047 18.117 18.188 18.259 18.330 18.401 18.472 18.543Industrial sewer and purification 3.946 3.946 3.946 3.946 3.946 3.946 3.946 3.946 3.946 3.946 3.946 3.946 3.946 3.946 3.946 3.946 3.946 3.946 3.946 3.946 3.946 3.946 3.946 3.946 3.946Reutilize volume for industrial and irrigation uses 8.909 8.909 8.909 8.909 8.909 8.909 8.909 8.909 8.909 8.909 8.909 8.909 8.909 8.909 8.909 8.909 8.909 8.909 8.909 8.909 8.909 8.909 8.909 8.909 8.909Gross discharged volume 10.828 11.052 11.275 11.499 11.722 11.882 12.041 12.201 12.361 12.520 12.591 12.661 12.731 12.801 12.872 12.942 13.013 13.084 13.154 13.225 13.296 13.367 13.438 13.509 13.580Net discharged volume 8.663 8.841 9.020 9.199 9.378 9.505 9.633 9.761 9.888 10.016 10.072 10.129 10.185 10.241 10.298 10.354 10.410 10.467 10.523 10.580 10.637 10.693 10.750 10.807 10.864
Wholesale industrial supply Supplied to the reservoir for the industrial area 4.770 4.770 4.770 4.770 4.770 4.770 4.770 4.770 4.770 4.770 4.770 4.770 4.770 4.770 4.770 4.770 4.770 4.770 4.770 4.770 4.770 4.770 4.770 4.770 4.770
IrrigationSupplied to the reservoir for the irrigated area 4.139 4.139 4.139 4.139 4.139 4.139 4.139 4.139 4.139 4.139 4.139 4.139 4.139 4.139 4.139 4.139 4.139 4.139 4.139 4.139 4.139 4.139 4.139 4.139 4.139Volumes previously supplied 3.800 3.800 3.800 3.800 3.800 3.800 3.800 3.800 3.800 3.800 3.800 3.800 3.800 3.800 3.800 3.800 3.800 3.800 3.800 3.800 3.800 3.800 3.800 3.800 3.800Volumes substituted 1.900 1.900 1.900 1.900 1.900 1.900 1.900 1.900 1.900 1.900 1.900 1.900 1.900 1.900 1.900 1.900 1.900 1.900 1.900 1.900 1.900 1.900 1.900 1.900 1.900Additional volumes 0.339 0.339 0.339 0.339 0.339 0.339 0.339 0.339 0.339 0.339 0.339 0.339 0.339 0.339 0.339 0.339 0.339 0.339 0.339 0.339 0.339 0.339 0.339 0.339 0.339
Accounting prices (euro)
Civil sewerage service (Euro per capita served) 104.80 107.60 110.48 113.44 116.47 119.59 122.79 126.08 129.45 132.92 136.48 140.14 143.89 147.75 151.71 155.78 159.96 164.25 168.66 173.18 177.83 182.61 187.51 192.55 197.72Civil and industrial purification 0.81 0.83 0.85 0.87 0.90 0.92 0.94 0.96 0.99 1.01 1.04 1.06 1.09 1.12 1.15 1.18 1.20 1.23 1.27 1.30 1.33 1.36 1.40 1.43 1.47Water supplied to the reservoir for industrial 0.97 0.99 1.02 1.04 1.07 1.10 1.12 1.15 1.18 1.21 1.24 1.27 1.30 1.33 1.37 1.40 1.44 1.47 1.51 1.55 1.59 1.63 1.67 1.71 1.75purposes (Euro/m3)Accounting price for irrigation water 0.17 0.17 0.17 0.18 0.18 0.19 0.19 0.20 0.20 0.21 0.21 0.22 0.22 0.23 0.23 0.24 0.25 0.25 0.26 0.26 0.27 0.28 0.28 0.29 0.30substituted (Euro/m3)Accounting price for additional irrigation 0.81 0.83 0.85 0.87 0.90 0.92 0.94 0.96 0.99 1.01 1.04 1.06 1.09 1.12 1.15 1.18 1.20 1.23 1.27 1.30 1.33 1.36 1.40 1.43 1.47water (Euro/m3)New civil sewerage service 2,257 7,047 7,334 7,602 7,879 8,166 8,463 8,770 9,041 9,320 9,608 9,905 10,211 10,526 10,851 11,186 11,531 11,887 12,254 12,631 13,021 13,422 13,836Civil and industrial purification service 2,563 8,037 8,398 8,725 9,063 9,413 9,775 10,149 10,461 10,782 11,113 11,454 11,805 12,166 12,538 12,921 13,316 13,722 14,141 14,572 15,015 15,472 15,942
Tab 3.8 Conversion factors for the economic analysis
Type of cost cf Notes
Labour and personnel 1.00 For simplicity and conservatismMaterials 0.83 55% machinery and manufactured goods, 45% building materialsRentals 0.88 40% personnel, 30% energy, 20% maintenance, 10% profits (cf = 0)Transport 0.88 40% personnel, 30% energy, 20% maintenance, 10% profits (cf = 0)Expropriation 1.25 100% landProject studies, works management, trials and other general expenses 1.00 Absorbed by personnelLand 1.25 Standard co-efficient x local price (30% higher than prices paid for expropriation)Machinery, manufactured goods, carpentry, etc... 0.82 50% local production (SCF), 40% imports (cf = 0.85), 10% profits (cf = 0)Building materials 0.85 75% local materials (SCF), 15% imports (cf = 0.85), 10% profits (cf = 0)Electricity, fuels, other energy prices 0.96 SCFMaintenance 0.97 80% personnel, 20% materialsReagents and other specialist materials 0.80 30% local production (SCF), 60% imports (cf = 0.85), 10% profits (cf = 0)Intermediate goods and technical services 0.95 70% personnel, 30% manufactured goodsAdministrative, financial and economic services 1.00 100% personnelResulting value of investment costs 0.91 Weighted by the types of project costs
The calculation of theresidual value of theinfrastructuresThe value applied (€ 39,438,000)was obtained using the followinglengths of useful life: • network and sewers: 40 years,• reservoirs and tanks: 50 years,• machinery: 15 years; • carpentry: 25 years; • building for the plant: 40 years.
The standard conversion factorThe SCF is defined according to the following formula and is basedon the macro-economic data given below (values in EUR million):
M + XSCF = ------------------------ = 0.96
(M+TM) + (X-TX)
where: M = value of imports = 4,000X = value of exports = 3,000TM = taxes on imports = 600TX = taxes on exports = 300
The calculation was carried out by intro-ducing, for simplicity’s sake, the whole costof the such equipment in the sixteenthyear, revalued according to inflation.
The revenue derives from the tariffreceipts for the new services provided,valued according to the respective tariffs
practised in the area of the investmentapplied to the volumes measured by meansof the meters installed.
In the last year of calculation the residualvalue of the infrastructures is added tothe previous financial input, which is cal-culated, simply, as a proportional quota

same land in the local situation. For thisreason this cost was evaluated consideringthe added value of the additional agricul-tural production obtainable from well irri-gated land (estimated to be Euro 4,462) –used also for the evaluation of the benefitdue to the additional supply of water forirrigation purposes. Obviously the reva-lued cost of the expropriation must besubtracted from the value obtained.
For the evaluation of the benefits - in allcases where it was deemed applicable - thewillingness to pay method was used, esta-blishing accounting prices for the servicesthat may have an alternative market. Since
the accounting price thus obtained refersto the service to the end-user, in order toobtain the price required for the analysisappropriate breakdown coefficients deri-ved from literature and experience weretaken into account7.
The benefits due to the new sewerage ser-vice have been assimilated into the socialvalue of diseases avoided, without consi-dering, conservatively, also the deathsavoided. Thus the average annual inciden-ce of potential infections and otherserious illnesses on children, adults ofworking age and old people was evalua-ted, calculating the costs of days of hospi-
talisation, treatment and the lack of pro-duction (only for adults); thus a value ofEuro 104.80 per year was obtained perresident served. The dynamics of this pri-ce were calculated as an average weightedbetween the inflationary coefficient andthe salary coefficient.
Civil and industrial water purificationgives rise to benefits in different sectors,first and foremost the environmental pro-tection of water and land, but also thesafeguarding of human health and theintegrity of the living species. A possibleconservative approximation to evaluatethese positive externalities can be obtai-ned by putting a value on the volumes ofpurified water discharged and susceptiblefor re-use for different purposes, also onother sites. In this case the volumes ofpurified water not used in situ and thusdischarged, reduced by a dispersion coef-ficient (0.80), are equal to roughly 8.5Mm3/year, hypothesising a potential irri-gation re-use, at an accounting price ofEuro 0.81 per m3, already used to evaluatethe benefits of the additional supply ofresources for irrigation purposes.
The conversion coefficients were alsoapplied to the benefits deriving from therevenue from the other services and to theresidual value of the infrastructure.
69
3.2 Water supply and depuration
68
3.2 Water supply and depuration
Tab. 3.10 Table for the economic analysis - Thousands of Euro
Years
cf(3) 1 2 3 4 5 6 7 8 9 10 11 12 13 14 15 16 17 18 19 20 21 22 23 24 25
New civil sewage service 2257 7047 7334 7602 7879 8166 8463 8770 9041 9320 9608 9905 10211 10526 10851 11186 11531 11887 12254 12631 13021 13422 13836Civil and industrial purification service 2563 8037 8398 8725 9063 9413 9775 10149 10461 10782 11113 11454 11805 12166 12538 12921 13316 13722 14141 14572 15015 15472 15942Water supplying for industrial tank 1618 4974 5098 5226 5356 5490 5628 5768 5913 6060 6212 6367 6526 6690 6857 7028 7204 7384 7569 7758 7952 8151 8354Water saved 110 338 347 355 364 373 383 392 402 412 422 433 444 455 466 478 490 502 515 527 541 554 568Additional water 636 1956 2005 2055 2107 2159 2213 2269 2325 2384 2443 2504 2567 2631 2697 2764 2833 2904 2977 3051 3127 3206 3286
Revenue from services 7183 22352 23182 23963 24770 25602 26461 27348 28141 28958 29798 30663 31552 32467 33409 34378 35374 36399 37454 38539 39656 40804 41986Revenues from other services 48 149 153 158 162 166 171 175 180 185 190 195 200 206 211 217 223 229 235 242 248 255 262Residual value of infrastructures 0.91 35885Total revenues 7232 22502 23335 24121 24932 25769 26632 27523 28321 29143 29988 30858 31753 32673 33620 34595 35597 36628 37689 38781 39904 41059 78132
Opening of the building sites 6508 6671 6838Consumption of landLoss of agricultural production 164 168 172 176 181 185 190 195 200 205 210 215 220 226 232 237 243 249 256 262 268 275 282 289 296Cost of expropriation already -1325 -957 -373consideredTotal net cost of consumption of land -1161 -789 -201 176 181 185 190 195 200 205 210 215 220 226 232 237 243 249 256 262 268 275 282 289 296
External costs 4187 5094 6436 353 362 371 380 390 399 409 419 430 441 452 463 475 486 499 511 524 537 550 564 578 593Technical personnel 1.00 259 444 1372 1414 1456 1500 1545 1591 1639 1688 1738 1791 1844 1900 1957 2015 2076 2138 2202 2268 2336 2406 2479 2553Administrative personnel 1.00 76 157 806 830 855 881 907 934 962 991 1021 1052 1083 1116 1149 1184 1219 1256 1293 1332 1372 1413 1456 1499Reagents and other specialist materials 0.80 550 564 578 592 607 622 638 654 670 687 704 722 740 758 777 797 817 837 858 879 901 924Energy for lifting 0.96 50 51 52 53 54 55 56 57 58 59 61 62 63 64 66 67 68 70 71 72 74 75Energy for plants 0.96 532 543 554 565 576 587 599 611 623 636 649 662 675 688 702 716 730 745 760 775 791 807Maintenance 0.97 115 235 1206 1236 1267 1299 1331 1365 1399 1434 1469 1506 1544 1582 1622 1663 1704 1747 1790 1835 1881 1928 1976 2026Intermediate goods and technical 0.95 24 49 251 258 264 271 278 284 292 299 306 314 322 330 338 347 355 364 373 383 392 402 412 422servicesAdministrative, financial, economic 0.55 29 146 150 154 158 161 165 170 174 178 183 187 192 197 202 207 212 217 223 228 234 240 246services
Total operating costs 473 914 4914 5045 5179 5317 5459 5605 5754 5908 6066 6228 6394 6565 6740 6921 7106 7296 7492 7693 7899 8111 8328 8552Labour 1.00 7698 14456 7860Materials 0.83 9721 18256 9925Rentals 0.88 896 1682 914Transports 0.88 788 1480 805Expropriations 1.25 1325 957 373Project studies, works, management, 1.00 1796 1660 526trials
Total investment costs 22223 38490 20404Replacement costs 0.91 14658
Total expenditures 26410 44057 27753 5267 5407 5550 5697 5849 6004 6163 6327 6495 6668 6846 7028 21873 7407 7605 7807 8016 8230 8449 8675 8907 9145Net cash flow -26410 -44057 -20521 17235 17929 18571 19234 19920 20628 21359 21994 22648 23320 24012 24725 10800 26213 26990 27790 28613 29460 30332 31229 32152 68988Economic internal rate of return (ERR) 18.23%Economic net present value (ENPV) 185034
7Accounting price for the supply of industrial water: Euro 1.29 per m3 x 0.60 (breakdown coefficient only for conduction) = Euro 0.97 per m3.Accounting price for the supply of irrigation water: Euro 0.21 per m3 x 0.80 (breakdown coefficient only for conduction) = Euro 0.17 per m3
Tab. 3.11 Table for sensitivity analysis
Change in the parameter % Change in FNPV %Change in ENPV
Price dynamicsInflation rate of 3% and 2% +44% / -41% +9.6% / -9.0%Dynamics of real salaries at +1% and at 0% -14% / +13% roughly constantDynamics of energy prices equal to inflation -3% roughly constant
Dynamics of tariffsReduction to 3 years of the period of tariff increases for investments -50% no change
Demographic dynamicsRate of annual increase in the population (0%) -16% -4%Costs of goods and servicesCost of reagents increased by +10% -7% -0.4%Cost of eliminating mud increased by +10% -6% roughly 0%Cost of electricity increased by +10% -5% roughly 0%
Revenue and benefitsTariffs for services +10% and –10% +116 / -116% roughly 0%Improvement in agricultural production increased by 10% no change +8%

laying of a second track or the electrificationand automation of an existing railway).
Territorial reference frameworkProjects can be parts of national, regionalor local transport plans or promoted bybodies of different natures. In both casesthe functional incorporation of the plan-ned infrastructure into the (existing orplanned) transportation system (whetherurban, regional, interregional or national)should be facilitate the consideration ofnetwork effects.
A second important aspect is consistencywith national and European transportpolicy: fiscal policies (i.e. on fuel), allocati-ve efficiency of the proposed tollingsystems, environmental constraint or tar-get, other incentive/transfer policies in thesector, technological standard.
Another element which should be consi-dered is the degree of consistency with anyother development project and/or planwhich may be drawn up for the invest-ment area both internal to transport sec-tor and related to sectors that could haveimpacts on transport demand (land use,development plan).
Regulatory frameworkRegulation of the transportation sector hassignificantly evolved in the past ten years.This evolution has arisen from the need toovercome the inefficiency of monopolisticsystems by introducing competition fortransportation services and regulationinstruments for “natural monopolies”, i.e.for infrastructures.
From a community viewpoint, the Euro-pean Union has gradually developed specific
actions and recommendations for the mem-ber countries, starting from the Ninenties.As to actions, community interventions havemainly focussed on the regulation and deve-lopment of the infrastructural network, onproblems of tariffs of infrastructure andinternalisation of external costs.
3.3.3 Feasibility and options analysis
Analysis of demandThe estimate of the existing demand andits forecast into the future is a complex andcritical task that often consumes a substan-tial part of the resources allocated to thefeasibility study.
71
3.3 Transport
From the cash flows shown in table 3.10, thefollowing indices are obtained: ENPV =185,034 thousands Euro; ERR = 18%.
Sensitivity analysisThe sensitivity analysis, carried out on tho-se parameters that the proposer felt weremost critical, produced the results shown inthe table 3.11 in terms ofchange in finan-cial and economic NPV compared to thevalues of the basic case.
Risk analysis was carried out on the mostcritical variables: inflation rate, tariffs, popu-lation (this analysis is not presented here).
3.3 TransportIntroductionThis section illustrates the investments forthe development of new transport infra-structures. These may include new trans-port lines or new transport nodes or thecompletion of existing networks, as well asthose intended to upgrade existing lines ornodes.
The proposed methodology is mainlyfocussed on road and rail transport modes.However, the general principles may also beapplied to other modes, for example to seaand air, whose specificity is not dealt with.
3.3.1 Objectives definitionThe socio-economic objectives of transportprojects are generally related to the impro-vement of travel conditions for goods andpassengers both inside the study area and toand from the study area (accessibility) aswell as the improvement of the quality ofthe environment and the well being of theserved population.More in details, the transport problems theprojects address and have as their purposemay be of the following types:
• reduction of congestion by eliminatingcapacity constraints on single networklinks and nodes or by building new andalternative links or routes;
• improvement of the performance of anetwork link or node, in particular byincreasing travel speeds and by reducingoperating costs and accident ratesthrough the adoption of safety measuresfor network links;
• shift of transport demand to specialtransport modes (many of the invest-ments which have been made in the pastfew years, where the problem of environ-mental externalities has arisen as a criticalfactor, aim at a modal shift of traveldemand, from the most polluting modesto those which impact less from an envi-ronmental viewpoint);
• completion of missing links or poorly lin-ked networks. Transport networks haveoften been developed on a nationaland/or regional basis, which may no lon-ger meet transport demand requirements.This is above all the case of railways;
• improvement of the accessibility of peri-pheral areas or regions.
The first step is intended to make clear theproject objectives which are strictly relatedto the transportation sector, (for examplein terms of mode rebalance), as well as tho-se of a more general kind (environmentalprotection, regional development, etc.).
After the project objectives have been madeclear, the following step is intended tocheck whether the identification of the pro-ject is consistent with the objectives.
3.3.2 Project identification
Typology of the investmentA good starting point for briefly, but clearlyand unequivocally, identifying the infra-structure is to state its functions, whichshould be coherent with the objectives of theinvestment. This should be followed by adescription of the type of action, that is whe-ther it is a completely new road, or a link ofa larger infrastructure, or part of an exten-sion or modification of an existing road orrailway (for example the construction of athird lane for a two-lane motorway, the
70
3.3 Transport
BOX 3.2 Legislative framework
White papersFuture development of the Common TransportPolicy - White Paper/COM (92) 494Fair payment for infrastructure use: a phasedapproach to a common transport infrastructurecharging framework in the EU - White Paper /*
COM/98/0466 finalEuropean transport policy for 2010: time to deci-de - White Paper/ COM/2001Trans European Networks - Transport (TEN-T)Decision No 1692/96/EC of the EuropeanParliament and of the Council of 23 July 1996 on
Community guidelines for the development of thetrans-European transport networkDecision of the European Parliament and of theCouncil amending Decision No 1692/96/EC onCommunity guidelines for the development of thetrans-European transport network COM/2001
Typology of investments• new infrastructures (road, rail, ports, airports) to satisfy increa-
sing transport demand• completion of existing networks (missing links)• extension of existing infrastructure• renovation of existing infrastructure• investment in safety measures on existing links or networks• improved use of the existing networks (i.e better use of under-uti-
lised network capacity)• improvement in intermodality (interchange nodes, accessibility to
ports and airports)• improvement in networks interoperability • improvement in the management of the infrastructure
Functional characteristics of the investments:• increasing capacity of existing networks• reducing congestion• reducing externalities• improving accessibility to peripheral regions• reducing transport-operating costs
Types of services:• infrastructures for densely populated areas• infrastructures for long distance travel demand• infrastructures for freight transport• infrastructures for passenger transportation

sticity to generalised transport costs(times, costs, comfort..). Since neverthe-less traffic is dependent upon the spatialdistribution of economic activities andhouseholds, for a correct estimate, it isrecommended that the changes in accessi-bility of the area induced by the projectare analysed. This will normally requirethe use of integrated regional develop-ment/transport models which have limi-ted application fields at present, but greatdevelopment prospects. In the absence ofthese instruments, it is necessary to esti-mate the generated traffic with cautionand to carry out sensitivity (see below) orrisk analysis on this traffic component.
The technical featuresThe demand/capacity ratio of the newinfrastructure will be analysed for any project alternative which is considerated.This will be based on:
• the service levels of the infrastructure interms of a traffic/capacity relationship(traffic flows on roads, passengers onpublic/collective transport systems, etc.).It is useful to separately analyse the diffe-rent traffic components both in terms offlow types (internal, exchange or crosstraffic) and on the basis of their origin(traffic diverted from other transportmodes and any generated traffic);
• the travel times and costs for users (disag-gregated by traffic and origin typology);
• transport indicators: passengers km andvehicles km for passengers, tons km andvehicles km for goods;
• the traffic safety levels in the new infra-structure or in the new configuration ofthe existing infrastructure;
In the presence of several alternatives andof congestion phenomena, it is importantto establish whether the demand is not ful-filled and, if this is the case, to find outwhich traffic has been “rejected”.This is an important element to evaluatethe economic consequences of solutionswhich are less rich from an infrastructuralviewpoint.
At the end of the feasibility analysis, itshould be necessary to define the relevantalternatives which will be evaluated from anenvironmental, financial and economicviewpoint. The ensemble of results willrepresent an input for the following envi-ronmental, financial and economic analysis.
Options analysis The construction of a reference solutionand the identification of promising alterna-tives are two aspects which will influence allthe results of the following evaluations.The reference solution will generally corre-spond to a do-nothing decision. However,in some cases it may involve a problem inthe transportation sector. If the referencesolution is “catastrophic”, i.e. if the decisionof not investing would result in a trafficparalysis and, therefore, in very high socialcosts, any project will bring high benefits,however expensive it may be.
In the case of great congestion phenomena,whether at present or in the future, to avoiddistorting the results of the analysis, it isnecessary to configure a reference solutionintegrating do-minimum interventions (ofmanagement, technological application,etc.). This could be probably put intoaction to provide for a transport demandadjustment in the absence of the projectand to reduce the future costs of the refe-rence solution to an acceptable level.
The analysis of alternative project solutionsis equally critical. After having defined thereference solution and analysed the criticalaspects in terms of a demand/capacity ratio(see below), it is necessary to identify allpromising technical alternatives on thebasis of physical circumstances and availa-ble technologies.
The main risk of distorting the evaluation isthe risk of neglecting relevant alternatives,in particular low-cost solutions (managingand pricing solutions, infrastructural inter-ventions which are considered as not “deci-sive” by designers and promoters, etc.).
73
3.3 Transport
for transport nodes, but also for the inter-ventions focussing on particularly densenetworks, above all long-distance traffic.
The estimates of the potential demandshould make clear as follows:
• the composition of the traffic which isattracted by the new infrastructure or bythe strengthened infrastructure, in termsof the existing traffic, the traffic whichhas been diverted from other modes andthe generated or induced traffic;
• the elasticity to time and costs which isimplicit in the estimates of the trafficwhich has diverted from other modes,properly disaggregated and comparedwith literature data or data taken fromother projects (travel demand characteri-stics, structure and elasticity are particu-larly important in the projects whichmay be related to charged infrastructuressince the expected volumes of traffic aredetermined by the level of fares);
• the sensitivity of the expected trafficflows for some critical variables: elasti-city to travel times and costs, congestionlevels of competing modes, strategies ofcompeting modes, for example in termsof fare policies. This point is particularlyimportant when it is necessary to makeinvestments requiring long executiontimes. In the span of time which is requi-red to complete the intervention, thetraffic, which may be potentially acqui-red by the new infrastructure, maymeanwhile shift to other modes and thenit may be difficult to move it back.
An aspect, which may be of relevance forthe financial and economic evaluation,concerns the generated traffic, i.e. the traf-fic which only occurs in the presence of anew infrastructure (or in case of an increa-se in the capacity/speed of the existinginfrastructure) and which is quite differentfrom the traffic diverted from other modesor routes.
At first instance induced traffic could beestimated on the basis of the demand ela-
72
3.3 Transport
As to the reference scenario (i.e the do-nothing or the do-minimum scenario), it isrecommended to make clear as follows:
• the area of influence of the project, thisaspect is important to identify the demandwithout the project and the impacts of thenew infrastructure as well as to identify theother transport modes which could beconsidered (for example in case of corri-dors where there are often several modes:road, rail and air transport);
• the procedure which has been applied toestimate existing demand and to estimatefuture demand (use of single or multi-modal models, extrapolations from pasttrends, fares and costs for users, pricingand regulation policies, the congestionand saturation levels of networks, thenew investments which are expectedwithin the time span of the analysis);
• the assumptions concerning the compe-ting modes and alternative routes (faresand costs for users, pricing and regula-tion policies, the congestion and satura-tion levels of networks, the new invest-ments which are expected within thetime span of the analysis);
• any deviation from past trends and com-parison with large-scale prospects (on aregional, national, European level).
In the presence of a high degree of uncer-tainty about future demand trends, it maybe advisable to develop two or more thantwo scenarios, an optimistic and a pessimi-stic one, and to relate the two hypotheses tothe trends of the GNP or of other macroe-conomic variables.
As to the solution/s with a project, it shouldbe firstly kept in mind that the transporta-tion system is a multi-modal system. Thesame transport demand may be, at leastpartially, met by various transport modes.Transport modes may compete for thesame demand.
There may be competition even inside thesame transport mode (for example amongports or airports, road routes or rail passes)

(“grand-fathers right”). The ensemble oftolls and regulatory constraints outlines aframework which is quite complex for thecorrect evaluation of the flows of futureproceeds, above all if in far-off times. Tollsmay have a significant feedback effect onthe expected traffic, thus changing the eco-nomic profitability of the project.
Similar problems may also affect ports andairports.
It is therefore important to make clear thepricing criteria, which have been appliedfor rated infrastructures (in considerationof the fact that external costs vary accor-ding to traffic levels).
3.3.4 Financial analysisFinancial analysis should be carried out ac-cording to standard methods, as they areset forth in the second chapter of thisGuide.
The analysis will be generally conductedfrom the viewpoint of the infrastructureowners (generally managers but not neces-sarily operators of the infrastructure). Ifrequired, it may be carried out for theowners and the operators, first separatelyand then in a consolidated way.
Financial investment costs, including theexpenses for renewals and extraordinarymaintenance operations as well as opera-ting costs (including the ordinary mainte-nance costs of planned works and thoserelated to tolling) are estimated during thetechnical analysis, disaggregated by the typeof works into which the intervention maybe broken down and allocated all over thetime and on the basis of elementary costcomponents (labour force, materials, car-riage and freightage) so as to enable thesubsequent application of the conversionfactors from financial into economic costs.
Financial inputs will be represented by theproceeds from the tolls and/or tariffsapplied for the sale of well-defined services.
The estimate of proceeds should be consi-stent with the hypotheses which have beenput forward for the evolution and elasticityof demand (see the previous section aboutpricing criteria). The financial analysis ofnon-rated infrastructures will show the netpresent cost at the public finance’s expense.
As to the recourse to private financing, it isnecessary to pay attention to any ineffi-ciency which may result from the adoptionof pricing criteria other than those relatedto marginal social costs.
3.3.5 Economic analysis The economic evaluation of the sectorshows some specific aspects since the trans-portation sector is often characterised by“administered prices” (for example subsi-dies for collective modes) and by high“external” costs (for example environmen-tal costs). These quantities are differentfrom those used in the financial analysis.
For economic investment and operatingcosts of vehicles, if market prices are dee-med to reflect the shortage of resources, itwill be necessary to eliminate transfersfrom the financial costs by applying a con-version factor to each elementary cost com-ponent (labour force, materials, carriageand freightage) and by taking tax burdensinto account. If market prices are not dee-med to reflect the shortage of resources forsome components, it will be necessary toapply shadow prices to correct costs (seethe general methodology described in thesecond chapter of the Guide).
Benefits traditionally result from the varia-tions in the area underlying the transportdemand curve (Consumer Surplus, seebelow) as well as from the variations in eco-nomic costs (the costs of resources, inclu-ding external costs).
Benefits are obtained by adding the follo-wing components:
• variations in the surplus of consumers(including the time multiplied by the
75
3.3 Transport
74
3.3 Transport
Investment costs and operating costsThe feasibility analysis is also intended toestimate for each alternative and referencesolution the investment costs and theexpenses for renewals and extraordinarymaintenance operations (which will becarried out at regular intervals) for thewhole analysis period. These costs shouldbe allocated all over the time, on the analy-sis period. It will be also necessary to defi-ne the technical life of the work and itsresidual value.
It is necessary to make sure that the projectincludes all the works required for its func-tionality (for example the links to the exi-sting networks, technological plants, etc.)as well as all the relevant costs of each alter-native, that the estimates of implementa-tion costs and times are realistic and pru-dent, “on the safe side”, mainly in the pro-jects which may have a special significancefor the local community.
The operating and ordinary maintenancecosts of the planned works should also bedescribed and quantified.
For collective transport modes, it is neces-sary to develop an operating model and tocalculate its costs. A hypothesis should beput forward for example for the operationof the railway, as to the number of trainswhich may be provided by type of train(goods, passengers, by making a distinc-tion between short and long-distancetraffic), where each service is associated tothe relating costs. The same applies fornode infrastructures, such as ports andairports.
Fares Just because transport demand may applyto other modes or routes, fares willinfluence the expected volumes of de-mand. It is therefore fundamentallyimportant for the various tariff hypothe-ses to reconsider the estimates of demandand to associate the correct traffic volumesto each of them.
The pricing criteria for transport infra-structures are complex and they may createconfusion during the financial and econo-mic evaluation. In particular, the fareswhich maximise the proceeds for themanagers/constructors of infrastructuresand which therefore maximise the capacityof self-financing may be quite differentfrom the efficiency fares. This because thelatter fares, which take into considerationthe surplus for the community consideralso the external costs (congestion as well asenvironment and safety costs).
Efficient pricing is based on long-termmarginal social costs and requires the“internalisation of external costs” (PolluterPays Principle), including congestion andenvironment costs. As to congestion, thistype of pricing should generally involve lowtolls where or when there is no congestionso as to maximise the use of the infrastruc-ture and high tolls where or when this phe-nomenon occurs. If the infrastructure isnot congested, a conflict will arise betweenthe need for self-financing and the optimaluse of the work. In this case, a toll which isintended to recover a fraction of the invest-ment costs can cause underutilisation andan inefficient use of the work.
The fares (“network access tolls”) of therailway sector represent the most innovati-ve factor which should be analysed withgreat care.
There are two opposite strategies: theAnglo-German strategy (average cost tolls)featuring very high values and the Frenchstrategy (marginal cost tolls) featuring verylow values. This will not completely solveeither the problem of congestion tolls(when demand exceeds supply) or the pro-blem of track allocation criteria. Specialservices, for example on a local level, mayenjoy partial or total benefits and the allo-cation of tracks (i.e. of capacity) may besubject to constraints for the protection ofthe operator who is historically present

any case, since it is a quantity which can behardly estimated, the general description ofthe project should make clear the values oftime (which have been disaggregated by rea-son of the travel and flow) and used in thedemand estimate and evaluation as well asthe ways by which they have been obtained.
Values of non-working travel time (includinghomework commuting) vary, in most coun-tries, from 10 to 42% of the working timevalue. Non-working travel time typicallymakes up a large proportion of the benefitsof transport investments.
• The external costs: environmental exter-nalities generally depend upon the traveldistances and exposure degrees to pollu-ting emissions (except for CO2 represen-ting a “global” pollutant). In order tomonetise the environmental effects, inthe absence of local values, it is possible toapply to the “physical” estimates of pollu-tants the “shadow prices” which havebeen inferred from the scientific literatu-re (properly adjusted for the fractions ofexternal costs already internalised forexample by taxes on fuel).
The present methods, which are intended toevaluate the external costs related to preven-ted accidents, should be referred to the avera-ge dangerousness levels by transport mode.For example, for road traffic, the average costby vehicle-km or by passenger-km is gene-rally calculated on the basis of the costs of allroad accidents (by adding all the costs ofdead and injured people), net of the compo-nent which has already been internalised byinsurance costs, and of the whole traffic.
Estimates of values of time per hour perperson during work by car taken can betaken from the EUNET project. The rangeof values is largely dependent on variationsin wage levels.
3.3.6 Other evaluation criteriaEnvironmental analysisCommunity and national laws require eva-luation of the environmental impact formost investments in the transportation sec-tor, in particular for the development ofnew infrastructure. In these cases, referenceshould be made to the evaluation methodswhich have been recommended.
However, even if is not prescribed by thelaw, it is advisable to analyse the environ-mental impact from a general viewpoint,to identify the impact the project alternati-ves may have and to provide for (if possi-ble) a quantitative evaluation on the basisof their impact and localisation in order todraw a comparison among the alternativesand to identify any mitigating and com-pensating measures.
Impact on the economic developmentThis is one of the most controversialaspects of the economic evaluation oftransportation projects from a theoreticaland an empirical viewpoint. However, it isimportant to keep in mind that the impactson the economic development may be bothpositive and negative. It means that in thepresence of market distortions, increasedaccessibility of a suburban area or regionmay result in a competitive advantage, butalso in a loss of competitiveness if industryis less efficient than in the central regions.In this case, increased accessibility may for-ce local industry out of the market. It is the-refore necessary to proceed with cautionwhen assigning the project such kinds ofbenefit and, in any case, it is advisable toexclude them from the calculation of profi-tability indicators.
The routine procedure for evaluating thesebenefits in terms of a income multiplier/ac-
77
3.3 Transport
value of time and all user charges,including fares, tariffs and tolls andchanges in vehicles operating costs metby the users, i.e. for private transport);
• variations in the surplus of producers(including the profits and losses of infra-structure managers, if available, and ofpublic transport operators as well as anyvariation in taxes and subsidies for thegovernment);
• changes in unperceived costs (car driversare in some cases assumed not to percei-ve non-fuel elements of costs, such astyres, maintenance and depreciation.Changes in car travel can lead to changesin these costs, that must be added to theconsume surplus calculation;
• variations in external costs.
Both the calculation of the surplus of con-sumers and the calculation of external costsshould take into account goods which haveno market (see below) and those whoseestimate may require special techniques.
When calculating the benefits, it is recom-mended to make a distinction between thebenefits for existing traffic (for example atime and cost reduction as a result of aspeeding up process), the benefits of thetraffic diverted from other modes (varia-tions in costs, times and externalities as aresult of the passage from a mode to ano-ther one) and the benefits of generatedtraffic (social surplus variation).
If the demand level is given, where time andmoney costs changes but demand stays thesame, i.e. in the absence of generated traffic,the analysis will be restricted to the varia-tions in the economic costs net of any trans-fer. In the presence of generated traffic, it isnecessary to reconstruct the demand curveand to calculate the social surplus for thepart of traffic which would not exist in theabsence of the project.
A series of goods which have no marketshould be given great importance in theeconomic evaluation of any project whichmay be related to transport infrastructure,i.e. the value of time, environmental effects,the value of avoided accidents.
• The value of time: time benefits oftenrepresent the most relevant part of thebenefits of transport projects. SomeEuropean countries put at the disposal ofevaluators the national estimates of thetime value by reason and sometimes bymode, in particular for passengers. In theabsence of these reference estimates, it ispossible to derive the values of time fromusers’ actual choices or to re-adjust and tore-weight the estimates from other studieson the basis of income levels.
With a few exceptions (the goods having avery high value), the time value of goods isgenerally very low and it should be calcula-ted on the basis of the capital lock-up. In
76
3.3 Transport
Tab. 3.12 Estimates of average external costs of transport (EU17)
Passenger (Euro/1000 pkm)
Car Motorcycle Bus Rail AviationAccidents 36.0 250.0 3.1 0.9 0.6Noise 5.7 17.0 1.3 3.9 3.6Air pollution 17.3 7.9 19.6 4.9 1.6Climate change 15.9 13.8 8.9 5.3 35.2
Freight (Euro/1000 tonkm)
LDV* HDV** Rail Aviation WaterborneAccidents 100.0 6.8 11.5Noise 35.7 5.1 3.5 19.3Air pollution 131.0 32.4 4.0 2.6 9.7Climate change 134.0 15.1 4.7 153.0 4.2
Source: INFRAS-IWW
* = LDV Light Duty Vehicles (Vans up to 3,5 tonnes gross weight)** = HDV Heavy Duty Vehicles (Roads truck above to 3,5 tonnes gross weight)
Fig. 3.6 Quantification of economic benefits.
Values of time per persons per hour business (1995 euro)
25
20
15
10
5
0Aus Bel Den Fin Fra Ger Gre Ire Ita Nrl Por Spa Swe Uk

Financial analysisFinancial investment costs have been disag-gregated by the type of works into whichthe intervention may be broken down andon the basis of elementary cost compo-nents (labour force, materials, carriage andfreightage) so as to enable the subsequentapplication of the conversion factors fromfinancial into economic costs.
Investment costs include the expenseswhich will be borne to build the motorwayand its crossings, the costs of the accessorynetwork required guaranteeing the connec-tions with the new motorway and the resto-ration of the ordinary network, expropria-tions and overheads.
An estimate has been made for the ordinaryand extraordinary maintenance costs of theplanned works as well as for the admini-strative costs, including those related to tol-ling costs. The personnel, materials, freigh-tage and carriage costs have been specifiedin this case too.
The costs for ordinary and extraordinarymaintenance have been calculated on a 90km project length and on the basis of theaverage value of maintenance costs forsimilar roads.
It has been assumed that the residual valueof the road will amount to 50% of the ini-tial value at the end of the analysis period,except for the expropriations whose resi-dual value will be equal to the initial value.
Proceeds will derive from the traffic usingthe new motorway. National fares will beapplicable. The internal financial rate ofreturn is 0.5%.
Economic analysisThe economic analysis will take intoaccount any cost and benefit of relevancefor society, which may be generated by theproject. Financial investment costs havebeen adjusted for fiscal components. As tothe labour force, the personnel cost has
3.3 Transport
celerator is distorting. Actually, these multi-pliers may be applied to public expenditu-re. It is therefore necessary to calculate thedifferential between the multiplier of theinvestments in the transportation sectorand the multiplier of other sectors. This is amethod which is not advisable, except forsome special cases.
In any case if there are no major distortionsin the transport-using sectors, i.e. marketsare reasonably competitive, the use oftransport costs and benefits (time savings,externalities...) could be considered as anacceptable approximation of the final eco-nomic impact of the transport projects.
3.3.7 Sensitivity, scenario and risk analysisSensitivity analysis consist in examining theextent to which the profitability indicatorsfor the various alternatives vary with somekey variables in order to check the sound-ness of the achieved results and the rankingof any tariff alternative as well as to identifythe riskiest areas.
Because of their criticality it is advisable tocarry out sensitivity analysis at the moneyvalues which have been assigned to thegoods without any market. Other sensiti-vity analysis may be focussed, for example,on investment and operating costs or onthe expected demand, in particular thegenerated traffic.
3.3.8 Case study: investment in a motorwayThe project is intended to realise a newmotorway which links two medium sizeurban areas and crosses a densely populatedarea. The local road network represents thetransportation offer. The recent increase intraffic volumes, which is expected to conti-nue in the future, is causing problems ofcongestion in some part of the existing net-work, and environmental and safety pro-blems to the people living in the area.
The general objectives of the project are:
• to reduce congestion on the existing net-work;
• to face the forecasted increase in passen-gers and fright demand due to the rapiddevelopment of the area;
• to reduce the exposure of people living inthe area to air pollution and noise;
As an accompanying measure, heavy vehi-cles will be banned from the most environ-mental sensible part of the existing link.
The whole traffic that will be attracted bythe new infrastructure is the traffic divertedfrom the existing roads plus some newlygenerated traffic. The pattern of land usedevelopment of the area is car dependent,and there are no significant alternatives toroad transport.
As the area is already densely populated, andcongestion is highly localised, the new roadis expected to have a limited impact in termsof additional traffic.The public funding ofthe new infrastructure cannot entirely coverthe amount of the investment costs, as aconsequence the new road will be tolled.
Traffic forecastThe following table shows the estimatedtraffic flows at the opening year of the newhighway.
78
3.3 Transport
Tab. 3.13 Traffic forecast
Daily traffic at the opening year
Diverted from the Generated Total on the highway Staying on theexisting network existing network
Tolled highwayHeavy vehicles 5 901 487 6 388 20 429 Passengers vehicles 24 228 3 720 27 948 126 331
Tab. 3.14 Table for financial analysis
Years
1 2 3 4 5 6 7 8 9 10 11 12 13 14 15 16 17 18 19 20 21 22 23 24 25 26 27 28 29 30
Passengers vehicles 20 22 24 26 29 31 34 37 40 44 47 51 55 60 64 70 72 72 72 72 72 72 72 72 72 72 72Heavy vehicles 12 13 14 16 17 19 20 22 24 26 28 30 33 36 38 42 45 45 45 45 45 45 45 45 45 45 45
Total revenues 32 35 38 42 46 50 54 59 64 70 75 81 88 95 103 111 117 117 117 117 117 117 117 117 117 117 117MaintenanceLabour 10 10 10 10 10 10 10 10 10 10 10 10 10 10 10 10 10 10 10 10 10 10 10 10 10 10 10Raw materials 8 8 8 8 8 8 8 8 8 8 8 8 8 8 8 8 8 8 8 8 8 8 8 8 8 8 8Freight 5 5 5 5 5 5 5 5 5 5 5 5 5 5 5 5 5 5 5 5 5 5 5 5 5 5 5Tolls collectionLabour 5 5 5 5 5 5 5 5 5 5 5 5 5 5 5 5 5 5 5 5 5 5 5 5 5 5 5Raw materials 1 1 1 1 1 1 1 1 1 1 1 1 1 1 1 1 1 1 1 1 1 1 1 1 1 1 1
Total operating costs 28 28 28 28 28 28 28 28 28 28 28 28 28 28 28 28 28 28 28 28 28 28 28 28 28 28 28Labour 321 321 161Raw materials 367 367 184Freight 142 142 71Carriage 88 88 88Expropriations 295Overheads 22 22 11
Total investment costs 1236 941 514 -1493Total expenditures 1236 941 514 28 28 28 28 28 28 28 28 28 28 28 28 28 28 28 28 28 28 28 28 28 28 28 28 28 28 -1465Net cash flow -1236 -941 -514 4 7 10 14 17 21 26 31 36 41 47 53 60 67 74 83 88 88 88 88 88 88 88 88 88 88 1581Financial internal rate of return (FRR/C) of the investment 0.5%Financial net present value (FNPV/C) of the investment -1,543

The benefits are made up of three itemsfor both categories of users: variations inoperating costs, variations in times, andvariations in the emissions of pollutingexternalities.
The variations in operating costs: onlyvariable costs (fuel, lubricant, tyres and afraction of maintenance and insurancecosts) and travel distances have been takeninto account for passengers’ vehicles. Thedecrease of covered kms is not deemed tohave an impact on the purchase of vehicles.
These variable costs have been deprived offiscal components.
No shadow price has been applied forenergy. Driving costs have been consideredfor the costs of goods vehicles, in additionto the costs mentioned above.
Variation in travel times: the time valuewhich has been applied for passengers willvary according to travel reasons. The value-sused are EUR 10 for business trips, EUR4.5 for any other reason. Only the mainpolluting emissions have been taken intoaccount for environmental externalities.
The reference values on which the cost esti-mation is based derive from those explicitlyrecommended for the country. The internaleconomic rate of return is 4.4%.
Analysis of scenariosTwo scenario analysis have been conducted:by decreasing the benefits of the two goodswithout any market, i.e. time and externalcost, by 50% and by removing the tolls fromthe new road, where the realisation of thesecond analysis was even more complex.
This has slightly decreased investmentcosts, completely removed tolling costs andprovided for a much more intensive utilisa-tion of the new road. This will considerablyincrease the benefits for the diverted trafficwhich will prove to be much heavier thanin the rated hypothesis and for the trafficremaining on the existing network.
Time saving for the new road, though solid, isnot enough to justify for many users, espe-cially the relatively short runs, the extramonetary cost due to tariff. So, the with-tariffsystem leads to an underutilization of the newinfrastructure and, consequently, a smallerflow of benefits, both of time for users than ofreduction of environmental external cost.
The results of the economic evaluationshow a relative fragility of the project. TheERR is slightly below the acceptabilitythreshold. The analysis also shows the rele-vance of the benefits of non-market goodsto the economic feasibility of the project,the evaluation of which maintains a certaindegree of uncertainty.
81
3.3 Transport
been adjusted for national insurance con-tributions and taxable income shares. Theconversion factor was equal to 0.56. Thematerials item has been deprived of thesole fiscal component, value added tax.Two items have been specified for freighta-ge and carriage: energy and others. Theshare of the energy component has beenreduced by the amount of the tax burdenamounting to 33%. The two conversionfactors have been set to 0.95 for carriageand 0.934 for freightage.
The financial cost of overheads has beenassumed as an indicative value of the eco-nomic cost. As to the land, expropriationcosts are reflecting market costs. The con-version factor which has been assumed isequal to 1 in this case too. Conversion fac-
tors have been applied to investment andmaintenance costs as well as to tolling.
The project benefits have been subdividedinto two components: the benefits for theusers who will use the new tolled road andthe benefits for the users who will continueto use the existing network.
The users of the new road (the divertedtraffic and the generated traffic) are due tothe fact that the new route is shorter andquicker and that it is crossing areas whichare less densely populated. The users whocontinue to use the existing network aredue to the fact that the new infrastructurewill reduce the traffic, increase the travelspeed and improve the use of the existingnetwork.
3.3 Transport
BOX 3 How to calculate economic benefits by quantification of consumer surplus
User benefits for transport projects can be defi-ned by the concept of the consumer surplus.Consumer surplus is defined as the excess ofconsumers willingness-to-pay17 over the prevai-ling generalised cost of i-j travel. Total consumer
surplus (CS0) for a particular i and j in the do-minimum scenario is shown diagramatically inthe figures. It is represented by the area beneaththe demand curve and above the equilibriumgeneralised cost, area CS0.
User benefit ij = Consumer surplus ij1 - Consumersurplus ij0Where 1 is the do-something scenario and 0 isthe do-nothing scenario.If there is an improvement in supply conditions
(for example for improvement in road infrastruc-ture) consumer surplus will increase of anamount of DCS, due to a reduction in equilibriumgeneralised cost.Usually we do not know the real shape of thedemand curve, we only know GC and T in the do-minimum situation and a forecast of GC and T in
the do-something situation. The demand curve isonly supposed to be a straight line as shown inthe figure, even it is not the case in reality. Theuser benefit can be approximated by the follo-wing function, known as the rule of a half18:
∆CS=∫ D(GC)dGC =12(GC0-GC1) (T0+T1) Rule of a Half
When the effect of a project can be captured inthe form of a reduction in generalised costs bet-ween particular origins and destinations, the ruleof a half is a useful approximation to true userbenefits.It is recommended to use the rule of a half to cal-culate user benefits in most cases.
GC0
T00
CS0
Supply, S ji0
Demand, Dji=f(GCji)
Trips, Tji
GC0
GC1
T0 T10
Supply, S ji0
Supply, S ji1
Benefit=∆CSDemand, Dji=f(GCji)
Trips, Tji
GC1
GC0
Source: TINA Appraisal Guidance, October 199917
Willingness-to-pay is the maximum amount of money that a consumer would be willing to pay to make a particular trip; generalised cost is an amount of money representing the overalldisutility of travelling between a particular origin (i) and a destination (j) by a particular mode (m).
18 (GC0- GC1) X T0 + (GC0- GC1) X T1-T0 = (GC0- GC1) (T0 + T1-T0
) = (GC0- GC1) x ( T0+T1 )2 2 2
Tab. 3.15 Conversion factors for goods vehicles (euro)
Financial costs Economic costs Conversion factors
Cost/1000km Cost/1000h Cost/1000km Cost/1000hGasoline, lubricants 403 177 0,44Other costs depending on km 291 228 0,79Labour costs 26.366 14.765 0,56Insurance, depreciation 1647 1521 0,92depending on driving times TOTAL 694 28.013 405 16.286
Tab. 3.16 Conversion factors for private cars (Euro* 1000km)
Financial Economic Taxes Conversion costs costs factors
Perceived cost (gasoline, lubricants) 107 48 59 0,44Overall operating cost (including 311 209 102 0,67maintenance, depreciation etc.)Unperceived cost 205 162 43 0,79

82
3.4.2 Project identificationIn order to correctly identify the project it isuseful to:
• state its scale and dimension, accompa-nied by an analysis of the market wherethe product will be placed
• describe the engineering features of theinfrastructure with:
• basic functional data: transport tension(KV) and capacity (MW) for powerlines, nominal load (m3/s) and amountof gas transported annually (millions ofm3) for gas pipelines, number of inhabi-tants served and power (MW) or avera-ge supply per inhabitant (m3/inhab.perday) for the networks
• physical features: route and length (Km)of power lines or gas pipelines (attachingpertinent chorographic sketches), sec-tion of electricity conductors (mm2) ornominal diameters (mm) of the gas pipe-
lines, size (Km2) of the area served by thenetworks and their routes (attaching per-tinent maps)
• characteristics of the network and loca-tion of internal nodes and links with net-works and/or pipelines;
• typical sections of the gas pipelines;
• typical construction of power lines;
• building techniques and technical featuresof the plants for depression and pumping(for gas) or transformation or sectoringstations (for electricity);
• building techniques and technical featu-res of the other service structures;
• significant technical elements: importantintersections, overcoming large gra-dients, marine pipelines for gas, remotecontrol and telecommunications systems(with data and sketches)
3.4.3 Feasibility and options analysisKey information: demand for energy, sea-sonal and long-term trends and demandcurve for a typical day.
The options analysis should consider diffe-rent technologies for transporting electri-city (direct or alternating current, trans-port tension etc.), alternative routes for gaspipelines or power lines, different districtnetworks, and alternatives for satisfyingthe demand for energy (e.g. mixed use ofgas and electricity instead of just electri-city, the construction of a new power sta-tion on an island instead of underwaterpower lines, etc.).
3.4.4 Financial analysisTime horizon: 25-30 years.
Forecasts for price dynamics are essen-tial.
83
3.4 Energy transport and distribution
The removal of tolls will enable a more effi-cient use of the infrastructure whose bene-fits will be such that the project is economi-cally justified and the ERR (9%) is defini-tely above the acceptability threshold(generally around 5%).
This should recommend, at least in the firstyears of infrastructure operation, a reconsi-
dered pricing scheme so as to maximisesocial benefits for the new road link.
3.4 Energy transportand distribution3.4.1 Objectives definitionMeasures may include:
• construction of a gas pipeline
• distribution networks for gas in industrialor urban areas
• construction of power lines and transfor-mation stations
• electrification of rural areas
3.4 Energy transport and distribution
Tab. 3.17 Table for economic analysis
Years
CF (3) 1 2 3 4 5 6 7 8 9 10 11 12 13 14 15 16 17 18 19 20 21 22 23 24 25 26 27 28 29 30
Diverted trafficOperating cost reduction 40 43 47 52 56 61 67 73 79 86 93 100 108 117 127 137 141 141 141 141 141 141 141 141 141 141 141Time saved 10 10 11 12 13 15 16 17 19 20 22 24 26 28 30 33 34 34 34 34 34 34 34 34 34 34 34Externalities reduction 5 5 6 6 7 7 8 9 10 10 11 12 13 14 15 17 17 17 17 17 17 17 17 17 17 17 17
Non diverted trafficOperating cost reduction 11 11 11 12 12 12 12 12 12 12 12 12 13 13 13 13 13 13 13 14 14 14 14 14 14 14 15Time saved 3 3 3 3 3 4 4 4 4 4 4 4 4 4 4 4 4 4 4 4 4 4 4 4 4 4 4Externalities reduction 2 2 2 2 2 2 2 2 2 2 2 2 2 2 2 3 3 3 3 3 3 3 3 3 3 3 3
Generated trafficOperating cost reduction 2 2 2 2 2 2 2 2 2 2 2 2 2 2 2 2 2 2 2 2 2 2 2 2 2 2 2Time saved 1 1 1 1 1 1 1 1 1 1 1 1 1 1 1 1 1 1 1 1 1 1 1 1 1 1 1
Total external benefit 73 78 84 90 96 103 111 119 128 137 147 157 169 181 194 208 214 214 214 214 214 215 215 215 215 216 216Externalities for generated traffic 8 8 8 8 8 8 8 8 8 8 8 8 8 8 8 8 8 8 8 8 8 8 8 8 8 8 8
Total external cost 8 8 8 8 8 8 8 8 8 8 8 8 8 8 8 8 8 8 8 8 8 8 8 8 8 8 8Maintenance
Labour 0.56 6 6 6 6 6 6 6 6 6 6 6 6 6 6 6 6 6 6 6 6 6 6 6 6 6 6 6Raw materials 0.83 7 7 7 7 7 7 7 7 7 7 7 7 7 7 7 7 7 7 7 7 7 7 7 7 7 7 7Freight 0.95 4 4 4 4 4 4 4 4 4 4 4 4 4 4 4 4 4 4 4 4 4 4 4 4 4 4 4
Tolls collectionLabour 0.56 3 3 3 3 3 3 3 3 3 3 3 3 3 3 3 3 3 3 3 3 3 3 3 3 3 3 3Raw materials 0.83 0.4 0.4 0.4 0.4 0.4 0.4 0.4 0.4 0.4 0.4 0.4 0.4 0.4 0.4 0.4 0.4 0.4 0.4 0.4 0.4 0.4 0.4 0.4 0.4 0.4 0.4 0.4
Total operating costs 20 20 20 20 20 20 20 20 20 20 20 20 20 20 20 20 20 20 20 20 20 20 20 20 20 20 20Labour 0.56 180 180 90Raw materials 0.83 306 306 153Freight 0.95 135 135 67Carriage 0.93 82 82 82Expropriations 1.00 295 0 0Overheads 0.83 19 19 9
Total investment costs 1017 722 402 -1218Total expenditures 1017 722 402 20 20 20 20 20 20 20 20 20 20 20 20 20 20 20 20 20 20 20 20 20 20 20 20 20 20 -1198Net cash flow -1017 -722 -402 45 51 56 62 68 76 83 92 101 110 119 130 141 153 166 180 186 186 186 187 187 187 187 187 188 188 1406Economic internal rate of return (ERR) 4.4%Economic net present value (ENPV) -203
Tab. 3.18 Traffic forecasts - Daily traffic at the opening year
Diverted from the Generated Total on the Staying on theexisting network highway existing network
Free highwayHeavy vehicles 9 070 912 9 982 17 260 Passengers vehicles 35 491 8 178 43 669 115 068
Tab. 3.19 Results of the scenario analysis
ERR
Baseline case 4.4%50% value of time and externalities 3.7%Removal of tolls 9.0%
Financial rate of return* Energy transportand distribution
minimum - 3.10maximum 11.00average 5.12standard deviation 5.37
* Sample data: 4 major projects out of 7 in the sector included in thesample of 400 projects combined.

• building techniques and technical featu-res of the other service structures;
• the waste water and fumes treatmentsystems, with the number and the posi-tion of stuks and water discharges;
• significant technical elements, such asthe constructions in caverns, dams, spe-cial technical solutions for treatingrefluences, computerised control sy-stems, telecommunications systems, etc.
3.5.3 Feasibility and options analysisKey information: the demand for energy,seasonal and long-term trends and also, forelectricity power stations, a typical graph ofthe daily demand for electricity.
The comparison in the options analysisshould consider possible alternatives withinthe same infrastructure (e.g. different tech-nologies for production and drilling, diffe-rent technologies for treating refluences, etc.)and possible realistic alternatives for produ-cing the energy required (e.g. launchingactions and policies aimed at energy savinginstead of building a new power station).
3.5.4. Financial analysisForecast estimates are required for:
• price dynamics
• development scenarios of the other sectors(trends in energy demand are strongly lin-ked to the dynamics in other sectors).
Time horizon: 30-35 years.
3.5.5 Economic analysisThe major problems to be faced are:
• the monetary value of benefits. Theyshould be quantified as the revenue fromthe sale of energy (at appropriate accoun-ting prices) and evaluated, wherever pos-sible, by estimating the community’s wil-lingness to pay for energy, by, for example,quantifying the costs the user must incurto acquire energy (e.g. installing and usingindependent generators, or direct purcha-sing of combustibles on the market).
• the evaluation of environmental externa-lities:
• the cost of the measures necessary toneutralise possible negative effects on air,water, land.
• the cost of other negative externalitieswhich cannot be avoided such as loss ofland, spoiling of scenery…
• the identification of the opportunity costof the various inputs. The economiccosts of raw materials should be evalua-ted by considering the loss to society bythe diversion of them from the best alter-native use.
• the value attributed to a greater or lesserdependence on energy from abroad. Theevaluation should be conducted by appl-ying appropriate shadow prices3 to thesubstituted imported energy (to quantifythese, it would be advisable to refer to thesuggested reading).
3.5.6 Other evaluation elementsThis section refers to:
• evaluation of the impact on the environ-ment (visual, noise, pollution, and refu-se) which, according to the laws of themajority of member states, must be apart of the approval procedures.
• evaluation of the indirect economiccosts, for example those deriving fromthe use of exhaustible resources, not pre-viously included in the estimates. Theycan be measured as standard physicalindicators and then subject the project toa multi-criteria analysis.
3.5.7 Sensitivity and risk analysisCritical factors: the high investment costsand the length of the cycle.
The sensitivity and risk analysis shouldconsider at least the following variables:
• cost of the research phase (meaning the
85
3.5 Energy production
3.4.5 Economic analysisEnvironmental impact and risk assessmentare essential aspects. Externalities to beconsidered are:
• the valuation of the area served, quanti-fiable by the revaluation of real estateand land prices,
• the negative externalities of possibleimpact on the environment (loss of land,spoiling of scenery, naturalistic impact)and on other infrastructure
• the negative externalities due to the ope-ning of building sites, especially forurban networks (negative impact onhousing, productive and service func-tions, mobility, agricultural frameworkand infrastructure).
3.4.6 Other evaluation criteriaSee the corresponding section for energy.
3.4.7 Sensitivity and risk analysisCritical factors: investment costs and lengthof the cycle.The variables that should be considered inthe sensitivity and risk analysis are:
• the cost of the investment,
• demand dynamics (i.e. forecasts ofgrowth rates, of the elasticity of electri-city consumption, etc.),
• the dynamics of the sale prices of substi-tutes electricity or gas.
3.5 Energy production3.5.1 Objectives definitionMeasures may include:
• construction of plants to produce electri-city from any source
• prospecting and drilling natural gas oroil fields
• actions directed at energy saving
Examples of objectives are:
• increased energy production to covergrowing demand
• reduction of energy imports by substitu-tion with local or renewable sources
• modernisation of the existing plants forenergy production, e.g. for reasons ofenvironmental protection
• modification of the mix of energy sour-ces, e.g. increasing the share of gas orrenewable sources.
3.5.2 Project identificationWhen defining the functions of the project,it is advisable to:
• state destination, dimension and loca-tion of the potential area served (e.g.research and drilling of a new well fieldmay have as its objective the supply ofenergy for more than one country, a newpower station may serve an entire region,and so on).
• describe the projected positioning of theproduct on the market
• state the phases of the investment; e.g.for a well field the prospecting andresearch within the target area, initial testdrilling, mining and commercial exploi-tation, closure.
• describe the engineering features of theinfrastructure:
• basic functional data, such as: type ofplant for producing electricity1, installedcapacity (MWe) and energy produced(TWh/year); annual potential capacity ofwell fields (millions of barrels/year ormillions of m3/year);
• physical characteristics2,
• building, technological and processingtechniques for the production plants;
• building techniques and technical featu-res of the plants for mining wells, e.g. off-shore platforms, attaching building andfunctional sketches;
84
3.5 Energy production
Economic rate of return* Energy transport and distribution
minimum 8.57maximum 25.00average 14.19standard deviation 7.65
* Sample data: 3 major projects out of 7 in the sector included in thesample of 400 projects combined.
1 In the case of hydroelectric plants (production and/or pumping) linked to aqueducts, one must also bear in mind the observations for theaqueduct sector.
2 For example: area covered by well field (Km2) and position. In the case of off-shore drilling, it would also be useful to provide local bathyme-tric profiles; average depth of deposits (m); area occupied (Km2) by plants (thermo-electricity) and relative storage areas, location of dams, pres-sure water-pipes and generators for hydro-electric production; area occupied by fields of photovoltaic generators (Km2) and their location.
Economic rate of return* Energy production
minimum 8.17maximum 16.10average 11.70standard deviation 3.29
* Sample data: 3 major projects out of 5 in the sector included in thesample of 400 projects combined.
3 If, as often happens, there are strong distortions in the energy market (duties, internal taxes, prices levied, incentives, etc.) it would be wrongto evaluate the value of import substitution using these distorted prices.

prospecting phase for new deposits or re-search into new technological processes),
• cost of the project implementation phase(site costs),
• demand dynamics (i.e. forecasts of growthrates, of the elasticity of electricity con-sumption. etc.),
• sales price dynamics for energy produced(or energy products),
• mix and dynamics of critical input costs(fuels, etc.).
3.6 Ports, airports andinfrastructure networks3.6.1 Objectives definitionIn general the aims of projects in this sectorare:
• promoting local development eitherbecause it provides a direct service toproductive activities or because it aims tosatisfy the wider transport needs of thelocal population (in the case of touristports, these needs are by far the mostimportant and consequently the analysisshould show and quantify a positiveimpact locally)
• completing and permitting maximumutilisation of national/internationaltransport networks.
3.6.2 Project identificationIn order to correctly identify the project it isuseful to:
• specify whether it is a completely new con-struction, extension or modification of anexisting structure (e.g. the automation oftraffic and the container park, the impro-vement of ground services at an airport).
• describe the engineering features of theinfrastructure:
• type and size (range) of the means oftransport (aeroplanes, ships, etc.) whichwill benefit from the structure;
• physical features: number and total lengthof airport runways, number and total
maintenance 2, technical andadministrative personnel costs and thepurchasing price of the products and ser-vices needed for the day to day working ofthe structure and the additional services.
Time horizon: 30 years.
3.6.5 Economic analysisThe economic analysis may follow the pat-tern of that for roads, taking into accountthe following costs and benefits:
• the time saved if compared to a situationwithout the realisation of the project, tobe quantified as suggested for roads andby dividing users into categories (e.g.passengers and goods).
• the time saved as a result of the substitutionof other, less efficient transport systems (orgoods handling); as an indication, the valueof time considered in 27 major projects ofthe second generation (1994-99) was anaverage of 7.44 ECU/h (resp. 3.17 ECU/h)regardless of the type of user;
• possible variation in the rate of accidents3,especially in modernisation projects; consi-dering not only the rate for users (passen-gers, staff, transporters, etc.) but also thatfor workers on the infrastructure itself;
• the reduced social income due to thedecrease in traffic in other existing trans-port systems which may have been (par-tially) substituted by the new, more effi-cient structure.
• Negative externalities, such as: the loss ofagricultural land, possible relocation ofother infrastructure and/or possible relo-cation of residential, commercial orindustrial areas, environmental pollution(acoustic, visual, etc.) and the raw mate-rial consumption4;
• positive externalities, as for example theincreased value of land and real estate inthe impact zone of a tourist port or thepossible increase in local earnings due tothe setting up of new enterprises (e.g.hotels, restaurants or shops in the newairport or port), with the warning toavoid double;
• additional income arising from trade.
3.6.6 Other evaluation elementsThis section refers to:
• the impact on the environment (visual,noise, pollution etc.) which, in any case,according to the laws of the member states,must be a part of the approval procedures.
• the local impact on the territory (parti-cularly in the case of new infrastructureor significant extensions), in terms ofurban and traffic congestion, etc., sho-wing that this has been kept to a mini-mum.
3.6.7 Sensitivity and risk analysisCritical factors: the forecast traffic flows(demand), the lack of elasticity of theinvestment (excessive capacity is oftenrequired in the early stages of the exercise),the determining influence of side activities.Variables that should be taken into account:
• the rate of change of traffic over a periodof time,
• the substitution rate of other existinginfrastructure,
• the value of time,
• the value of life and temporary disability.
3.7 Training infrastructure3.7.1 Objectives definitionProjects may concern:
• basic education
• vocational training
• higher levels (universities, businessschools, etc.)
• particular needs for specialisation in pro-ductive areas
• improvement of the positioning ofyoung people on the labour market
87
3.7 Training infrastructure
length of piers or quays for ports, coveredand uncovered storage area (in thousandsof m2) for the intermodal structures.
• physical or functional links with otherlocal transport systems e.g. motorways,roads, railways etc. (with schematic dra-wings); for an airport, the links with thecities it is to serve, for a tourist port thelinks with other tourist structures
• technical features and conformation ofthe major structures, including examplesof one or two typical sections or sketches(sections of runways, the structuralarrangement of the quays etc.) clearlyshowing the parts to be constructed,
• technical features of buildings and otherservice structures, with attached plansand sections;
• significant technical elements, such asinternal transport, crane systems, equip-ment for computerised traffic control,automation of goods traffic, etc.
3.6.3 Feasibility and options analysisKey issue: the volume of passenger and/orgoods traffic, based on daily and seasonaltrends.
Other essential information: the pattern oftraffic flows, forecast for trends over timeand technological solutions adopted.
3.6.4 Financial analysisIn the case of tourist ports or intermodalstructures the managing body and the inve-stors may be different.
• Financial inflows: rents, taxes and otherforms of payment for the use of the struc-ture and for any possible additional servi-ce offered (e.g. water and fuel supply, cate-ring, maintenance and storage services).
• Financial costs: the investment costs1,
86
3.6 Ports, airports and infrastructure networks
Financial rate of return* Airports Ports
minimum 6.19 3.66maximum 16.02 15.49average 10.73 8.49standard deviation 3.22 4.47
* Sample data. Airports: 5 major projects out of 12 in the sectorincluded in the sample of 400 projects combined.
Ports: 4 major projects out of 8 in the sector included in the sampleof 400 projects combined.
1 The investment cost includes e.g. the following: works, expropria-tion, indemnity and connection expenses, etc, expenses for specialmachinery and equipment, general expenses. In addition, the costof extraordinary maintenance may be charged to the investor or tothe licensee, according to the contract licence.
2 Ordinary maintenance; for extraordinary maintenance see previous note.
3 The valorisation mat follow the methodology described for roads.
4 The impact of environmental pollution may be valorised by referring to the loss in commercial value of real estate in that particular area.
Economic rate of return* Airports Ports
minimum 1.00 7.46maximum 36.34 41.00average 16.90 19.96standard deviation 9.28 4.15
* Sample data. Airports: 9 major projects out of 12 in the sectorincluded in the sample of 400 projects combined.
Ports: 5 major projects out of 8 in the sector included in the sampleof 400 projects combined.

Economic benefits:
• the number (or percentage) of pupils whohave found (or who are expected to find)productive employment and who,without this specific training, would havebeen unemployed or under-employed5. Ifthe prominent objective is to improve theopportunities for potential pupils on thelabour market, the benefits may be quan-tified and valorised by the expectedincreased income of the pupils due to thetraining received (avoided under-employ-ment, better positioning on the market)3.
• Social costs: may be evaluated on thebasis of the loss to society due to thedeviation of factors from their best alter-native use4.
• Externalities: loss of land, and other rawmaterials, possible mobility or construc-tion congestion brought about by theinstallation of the infrastructure. If it canbe predicted, the increase in incomes dueto other possible induced activities,(commercial activities, restaurants,recreational activities, etc.).
3.7.6 Other evaluation elementsAn independent evaluation from a panel ofqualified experts of the ability of the educa-tional investment to meet the proposedobjectives and social needs and of the suita-bility of the type of training programmes.
3.7.7 Sensitivity and risk analysisThe following parameters should be covered:
• rate of growth of the population (per agerange) in the catchment area,
• rate of growth of salaries for teachingand non-teaching staff (see exampleshown in the graph below),
• the actual enrolment rate,
• the rate of employment of pupils whohave completed their studies.
3.8 Museums andarchaeological parks3.8.1 Objectives definitionThe investments have generally local objec-tives but may also have a more generalvalue of a cultural nature.
3.8.2 Project identificationIn keeping with the objectives, it is neces-sary to:
• state the type of infrastructure affectedby the action (creation, renovation orextension): museums, historical monu-ments or buildings, archaeological parks,industrial archaeology
• list the services offered (research centres,information and catering services, inter-nal transport..)
• include a summary of the cultural and/orartistic programmes planned for themedium term
• give the following engineering data:√ basic data, primarily the number of expe-
cted users (per day, season, year, etc.) andthe maximum capacity of the structure;
√ physical features: covered and showroomareas (m2) for museums and historicalmonuments or buildings, total area ofparks or archaeological areas (m2), num-ber of seats, usable area (m3) for theatres,
√ architectural characteristics, construc-tion, and layout of museums, historicalmonuments or theatres,
√ technical features and layout of buil-dings or parts thereof dedicated toadditional services
3.8 Museums and archaeological parks
• homogenization of unequal geographicdistribution of school services (projectsin rural or isolated areas)
• elimination of discrimination betweensocial classes, genders
• improvement of opportunities for thedisabled.
3.7.2 Identification of the projectIt would be advisable to:
• give the following basic data: geographiclocation (attaching maps), level and typeof educational activity, number of pupilsand geographic catchment area, associatedservices (libraries, sports-recreational acti-vities, reception facilities, canteens, etc.).
• give the following engineering data forthe structure:
• covered area (m2) and uncovered equip-ped area (m2);
• data and typical construction designs forbuildings intended for pedagogical pur-poses (classrooms) and for related activi-ties (laboratories, libraries, etc.);
• functional data and sketches for servicestructures (management, offices, gymna-siums, stadiums, guest-quarters, can-teens, etc.);
• functional sketches and layout of themajor technological equipment (internalnetworks, central heating, electrical andcommunications systems, etc.);
• internal viability systems (and possiblecar parks) and links with local communi-cation routes;
• significant technical elements, such asparticularly important architectonicconstructions, laboratory or complexcalculating equipment, etc.
• Summarize the proposed training planover a number of years (number andtype of courses, length, number and typeof subjects taught, duration and timingof pedagogical and related activities,didactic methods, diplomas and otherqualifications obtainable, etc.).
3.7.3 Feasibility and options analysisKey issue: the demographic and labourmarket trends, which determine the poten-
tial number of pupils and the opportunitiesavailable to them.The description should include:
• demographic trends disaggregated by agerange and by geographic area,
• rate of enrolment, attendance and com-pletion of studies1,
• employment forecasts for various sec-tors, including forecasts of the organisa-tional changes within the various pro-ductive segments2.
3.7.4 Financial analysis• Financial inflows: school fees, annual
subscriptions, and prices of possible paidauxiliary services.
• Financial cost: the cost of the personnelnecessary to run the structure (in thelong term)
• Time horizon: 15-20 years
3.7.5 Economic analysisThe following variables may be a startingpoint for the identification of the benefits:
• effective enrolment rates compared topotential ones,
• the share of students repeating the year,
• the percentage of pupils who completethe whole training course,
• the average attendance rate per pupil,
• the achievement of pre-established, mea-surable learning standards,
• the quality of pedagogical material,
• the suitability of equipment and its rateof use,
• the level of preparation and the commit-ment of the teaching staff, based onobjective examination,
• the fungibility of the pedagogical con-tent in as many and varied contexts aspossible.
88
3.7 Training infrastructure
89
Financial rate of return* Schools,universities, etc.
minimum - 1.88maximum 20.00average 7.01standard deviation 9.23
* Sample data: 4 major projects out of 16 in the sector included inthe sample of 400 projects combined.
1 This information will be even more useful if broken down into sex, social class and geographic area.
2 It is important to forecast the growth of new professions and the decline of others.
5 Forecasts for this variable can be based on the long term studies carried out in other countries
3 An alternative method, theoretically valid for all cases, is to refer to the willingness to pay, valuable as the average fees students would have topay to take similar private courses. Great care should be taken when following this method due to possible distortionary effects: e.g. there maybe a difference in quality between the training offered by the investment and what is already available privately, or there may be differingdegrees of risk aversion according to income levels, and so forth. Wider discussion of the subject can be found in the suggested readings.
4 For example, the social opportunity cost of teaching and other staff is equivalent to the product of these people in alternative occupations(quantifiable as the average market salaries for people of a similar training). That of the pupils, which should not be forgotten, is based on theestimated product of young people outside the education system, on the marginal basis that the project in question does not affect salaries.
Economic rate of return* Schools,universities, etc.
minimum 3.35maximum 47.52average 17.53standard deviation 14.20
* Sample data: 6 major projects out of 16 in the sector included inthe sample of 400 projects combined.

√ professional conditions (traumatologycentres for industrial accidents, sportsor military hospitals, etc.).
• could be quantified by the increased lifeexpectancy1.
3.9.2 Project identificationIn order to correctly identify the project it isuseful to:
• clearly define the functions of the propo-sed infrastructure and in particular thegroup of pathologies involved, the rangeof the population, the diagnostic func-tions, the short or long term treat-ment/recovery, reception facilities andconnected services
• include the following data:√ basic data, such as: the average and
maximum numbers of users per day,month, year; a list of the departmentsfor assistance and prevention, treat-ment and diagnosis; for a hospital thenumber of beds in each ward;
√ physical data such as the surface areaand covered area (m2), usable space(m3), number of treatment rooms,wards, prevention and/or diagnosticconsulting rooms, existence and size ofoutpatients department;
√ the functional arrangement of inter-nal/external areas (lay-out), includingviability between the various buildingsand within them, under both normaland emergency conditions;
√ technical features of the principalequipment and machinery for diagno-sis and/or treatment (e.g. X-ray, scans,nuclear medicine, endoscopes etc.);
√ Layout of the auxiliary plants and ofthe major systems (electricity, lighting,water, refuse and possible incinerators,fire-fighting equipment, air-conditio-ning, gas distribution, remote monito-ring, communications, etc.);
√ architectural characteristics, construc-tion, and layout of buildings or parts
√ viability and access systems (plus pos-sible car parks) and links with the localcommunications routes, with possible
privileged access for the casualtydepartment, attaching appropriateblueprints;
√ significant technical elements, such asparticularly exacting architectonicconstructions, special or experimentaltreatment or diagnosis machinery.
3.9.3 Feasibility and options analysisKey issue: the patients flows and trends(determined on the basis of demographicdata) and epidemiological and morbiditydata for the pathologies involved2.
The comparison in the options analysisshould consider possible alternative medi-cal-technological solutions (different treat-ment systems, different diagnosis technolo-gies, etc.) and possible general alternativeswith the same socio-sanitary objectives(e.g. building an outpatients departmentinstead of wards in a hospital).
3.9.4 Financial analysis• Financial inflows: fees for hospital admis-
sion (e.g. the number of days the patientspends in hospital), diagnosis and treat-ment which are paid separately and addi-tional services (single rooms, etc.).
• Financial costs: personnel, medicinesand materials, out-sourced medical servi-ces necessary to run the structure.
Time horizon: at least 20 years.
3.9.5 Economic analysisThe key benefits are:
• the future saving in health costs, directlyproportional to the decrease in the num-ber of people affected and/or the lesserdegree of gravity of the illness due to theimplementation of the project (reducedoutpatient and home assistance costs forthose who avoided catching the illness,lower hospital and convalescence costsfor those who have been treated moreeffectively);
• the avoided loss in production, due tothe lower number of working days lostby the patient and his family;
91
3.9 Hospitals and other health infrastructure
√ process features and layout of theplants and of air-conditioning, ligh-ting, communications, etc.;
√ viability and access systems (plus pos-sible car parks) and links with the localcommunications routes;
√ significant technical elements, such asparticularly exacting architectonicconstructions, experimental restora-tion technologies, communicationsystems.
3.8.3 Feasibility and options analysisKey issue: the potential flow of users, bro-ken down according to type.The comparison in the options analysisshould consider:
• variations in structural arrangement orlay-out of the infrastructure,
• possible alternative technology andmethods of restoration/recovery for exi-sting buildings,
• alternative choices of infrastructure (e.g.one could consider establishing amuseum of technology instead of recove-ring a historical industrial structure, etc.).
3.8.4 Financial analysis• Financial inflows: admission fees (which
cover only a fraction of the real costs),sales of collateral services and relatedcommercial activities.
• Financial costs: personnel and mainte-nance (which may be predominant in themedium-long term).
Time horizon: 15-20 years.
3.8.5 Economic analysis• Social benefits: evaluation may be based
on the willingness to pay for the serviceon the part of the public1, for museums,archaeological parks etc.
• Social costs: evaluation may be based onthe loss to the society due to the diver-sion of factors from their best alternati-ve use. (e.g. the social opportunity costof the staff employed is equivalent to theproduct of these people in alternativeoccupations).
• Externalities: loss of land and other rawmaterials, possible mobility or con-struction congestion brought about bythe installation of the infrastructureand so on.
• Increases in incomes in the tourism sec-tor (increased flow and longer averagelength of stay) induced
• additional increase in income due toother possible induced activities (com-mercial activities, restaurants, recreatio-nal activities, etc.).
3.8.6 Other evaluation elementsThese should give a clear cultural and arti-stic profile of at least the medium-termprogrammes. The decisive element is theindependent experts’ opinion.
3.8.7 Sensitivity and risk analysisCritical factor: the high personnel andmaintenance costs and the long-term dyna-mics of admission fees.
Sensitivity and risk analysis should consi-der at least:
• the cost of the investment,
• the rate of growth of staff salaries,
• the rate of growth of effective demand(number of visitors per year),
• the admission fees
• with regard to maintenance, the risksrelated to possible damage, regardless ofthe cause.
3.9 Hospitals and otherhealth infrastructure3.9.1 Objectives definitionThe objectives:
• may include the prevention and/or treat-ment of numerous pathologies.
• may refer to different ranges of the popu-lation, according to:√ age (children’s or geriatric hospitals, etc.);√ gender (support structures for child-
birth, andrology, etc.);
90
3.9 Hospitals and other health infrastructure
1 It does not seem correct to include the indirect costs of the visitor (journey, food, lodging etc.) to the value attributed to the willingness topay, unless one can demonstrate that for the project in question, those expenses must be attributed exclusively to the desire to visit the struc-ture or see the particular show and not to other recreational activities e.g. tourism.
1 These are very rough indications. Obviously, in addition to the quantity there is also the quality of life: some indexes have been proposedwhich take this into account (Q.A.L.Y.), further details can be found in the publications suggested in the reading list.
2 If no specific data is available for the catchment area in question, it would not be wrong to use data referring to socially similar areas.

√ detailed description of projected ope-rations, the extent (number of trees tobe removed or planted, etc.) andmethodologies (chosen species, type ofcultivation, etc.), time period (years),form of management, type of treat-ment and execution period;
√ surface area (m2) and gradients (m) ofthe slopes to be consolidated;
√ number and length (Km) of the waterflows to put into regime;
√ number, length (Km) or surface area(m2) and type for access routes and forparking or picnic areas;
√ maps showing position and descrip-tion of biotypes and other interestingnatural phenomena (waterfalls, caves,springs, etc.);
√ number, position, surface area (m2) andlay-out of service buildings, such as visi-tor centres, lodgings, canteens, observa-tion posts, warehouses, sawmills.
√ number, position, surface area (m2)and capacity of possible tourist recep-tion structures, such as hotels, refuges,restaurants, etc.;
√ access routes and links with the localand regional road networks;
√ description of and data for importantinterventions, such as the re-introductionof rare or extinct species, remote fire pre-vention surveillance systems, communi-cation and information networks, etc.
3.10.3 Feasibility and options analysisKey issue:
• For projects for wood (or cork) arbori-culture: the demand for the type of wood(or cork) to be produced, in addition, ifthis is the case, to the objective of substi-tuting imports.
• For mostly tourist-recreational projects:the forecast trends for tourist flows,including their seasonal trends etc.
An impact analysis showing the sustainabi-lity of the proposed project also from anenvironmental point of view would behelpful. One possible method is to establisha series of physical indicators for each effectand then conduct a multi-criteria analysis.
Comparison in the options analysis shouldconsider:
• different areas of intervention within thesame forestry district,
• different methodologies for ameliora-tion, reforestation and cultivation,
• cultivation of alternative species, compa-tible with the chosen area (e.g. eucalyp-tus plantations instead of poplars for theproduction of cellulose pulp),
• different perimeters and zoning of theparks,
• different routes or typologies for foot-paths, tracks and equipped areas,
• different positioning of entrances, visitorcentres, car parks, camp sites, etc. for pro-jects for equipped parks and forestry areas,
• different destination (e.g. agriculturaland not forestal) for the areas to be refo-rested, for example, within a park.
3.10.4 Financial analysis• Financial costs: often the largest costs are
those for personnel and maintenance(ordinary and extraordinary).
Time horizon: 25-35 years can be conside-red appropriate1, but in some cases offorestry interventions the horizon shouldbe extended.
Available literature shows that interven-tions in this sector have rather low FRRvalues, which rarely exceed 5%.
3.10.5 Economic analysis• The benefits arising from the utilisation
and transformation of wood can be valo-rised using the added value of woodlandcompanies.
• The tourist-recreational benefits can bequantified and valorised using the visi-tors’ “willingness to pay” method or by aquantitative estimation of the touristproduct realised, evaluated at market pri-ces, net of distortions. If it can be predic-ted, the increased income for the tourismsector and related activities in the areasadjacent to or linked with the park orforest involved should be also added.
93
3.10 Forests and parks
• the increase in the welfare or the reduc-tion in suffering on the part of thepatients and their family, identifiable asthe number of deaths avoided, theincreased life expectancy of the patientand the improved quality of life for thepatient and his family as a result of theillness avoided or the more effectivetreatment administered.
Benefits may be given a money value recur-ring to the market prices of the service (wil-lingness to pay)3 or using standard methods,as the indices for increased life expectancy,suitably adjusted by the quality (e.g.Quality Adjusted Life Years) which can bevalorised according to the principle of lostincome or to similar actuarial criteria.
3.9.6 Other evaluation elementsIt may be helpful to evaluate the benefits interms of simple physical indicators e.g. ananalysis of the cost-effectiveness which islargely used in the health sector and offerscomparable data.
A panel of independent qualified expertsshould also illustrate the intrinsic value ofthe project for the health system.
3.9.7 Sensitivity and risk analysisCrucial factors:
• the availability and reliability of epide-miological data for the catchment area
• the risks incurred by administering(new) diagnostic, preventative or thera-peutic treatment, etc)
• the difficulty in correctly evaluatingtrends in the costs of personnel, medici-nes etc. in the long term.
Sensitivity and risk analysis should considerat least the following variables:
• the cost of the investment,
• the percentage incidence of pertinentmorbidity, disaggregated by pathologi-cal type, age range, sex, profession, etc.,
• tariffs for health services and their dyna-mics in time,
• dynamics in time of personnel costs,
• dynamics in time of the costs of medici-nes, products and critical services,
• the value and dynamics of the risksinvolved in carrying out diagnoses ortreatment.
3.10 Forests and parks3.10.1 Objectives definitionForestry projects can have different pri-mary objectives:
• projects aimed at increasing the produc-tion of wood or cork for commercial orenergy purposes;
• projects aimed at increasing the produc-tion of non-wood products1;
• projects of an environmental character,such as establishing parks and protec-ted areas, actions for the prevention oferosion, control of water, environmen-tal protection (naturalistic, improve-ment of scenery, vision and noisescreens, etc.);
• projects for promoting tourist-recreatio-nal activities2;
All investments in forestry bring aboutmultiple effects (land protection, waterregulation, species conservation, environ-mental protection).
3.10.2 Project identificationIt would be advisable to:
• identify the project according to a sche-me of typologies
• supply the following data:√ geographic position, altitude (m. above
s.l.) and surface area (hectares or Km2);
92
3.10 Forests and parks
1 The lowest values should be applied to tourist-recreational interventions and to those of a short cycle (e.g. forest fruits, etc.).
Economic rate of return* Hospitals
minimum 10.00maximum 23.10average 14.57standard deviation 6.03
* Sample data: 3 major projects out of 5 in the sector included in thesample of 400 projects combined.
3 This method may, for example, be applied in the case of an odontology clinic, as these services are generally offered by both the public andthe private sectors.
1 Such as truffles and mushrooms, fruits of the forest (strawberries, bilberries, raspberries, blackberries, aromatic and/or medicinal herbs, etc.),game, bee keeping, and others.
2 Such as bird watching, photographic safaris, camping, horse riding, trekking, etc.

frequency bands (GHz) and power(kW), electronic technologies for com-mutation/ connection, etc.;
√ physical data such as the length of cables(Km) and area covered by the network(Km2), the number and position ofcommutation/connection nodes, thenumber and position of radio stationsand the area covered (Km2);
√ data, building techniques and techni-cal features of networks;
√ data, building techniques and technicalfeatures, layout of commutation/con-nection centres or radio stations, atta-ching plans;
√ data, building techniques and techni-cal features, layout of auxiliary plantse.g. electricity supply, lighting, andremote control;
√ covered area (m2) and schematiclayout of possible buildings and otherservice structures, attaching blueprintsand sections;
√ significant technical elements, such assatellite transmission/receptionsystems, underwater cables.
3.11.3 Feasibility and options analysisKey issue: the volume of traffic, and thedaily, weekly and seasonal trends (theoptimum capacity must be a reasonablecompromise between the highest peaklevels of traffic and that which the systemcan handle).
In the options analysis comparison shouldconsider possible alternatives within thesame infrastructure (e.g. different types ofcables, different transmission protocols,different commutation/connection techno-logies etc.), alternative locations or radiostations and possible global alternatives forthe projected infrastructure, which canoffer similar services such as a satellitetransmission or mixed network (air-cable)rather than optic fibre cables.
3.11.4 Financial analysis• Financial inflows: sales tariffs for servi-
ces, rents for additional services.
In the case of telephony, the existence ofgovernment-controlled tariffs may help inforecasting price dynamics.
Time horizon: at least 10 years, except forcabled networks and long distance cables(20 years).
3.11.5 Economic analysisIt is necessary to quantify:
• the time saved for each communication(waiting time, transmission time, etc.),quantifiable by unit according to type ofservice (e.g. commercial telephone call,transmission of a text, transmission of adata file, transmission of graphics andso on); for valorisation purposes theusers may be divided into categories, forexample in the civil sector reference canbe made to the average income of citi-zens, and in the company sector to theaverage added value.
• The new additional services, which wouldbe impossible without the project. In somecases the preceding method can be appliedfor their quantification and valorisation(e.g. on line anagraphic services could leadto almost a 100% saving in the time takento request and obtain certificates), in othercases one can estimate the willingness topay for the service on the part of thepublic, quantifying the costs the userwould incur to obtain certain types of data(e.g. purchasing specialist publications).
3.11.6 Other evaluation elementsHere one should refer to the development ofthe new telematic and multi-media services.In this respect it could be helpful to subjectthe project to a flexibility examination, tosee how capable it is, in technological andconstruction terms, of satisfying the widerneeds stemming from future development.
3.11.7 Sensitivity and risk analysisCritical factors: forecast of future demand,high investment costs (e.g. for satellitesystems) and rapid technological evolution(the investment is totally or partly obsoletelong before expected ex-ante).
95
3.11 Telecom infrastructures
• The benefits arising from hydro-geologi-cal protection can be evaluated on thebasis of the costs due to flooding, land-slides etc., which will be avoided thanksto the project and, if demonstrable, thehigher added value of woodland pro-duction compared to a situation withoutthe intervention.
• The benefits arising from the improve-ment of the countryside and environ-mental protection can be evaluated onthe basis of the greater “willingness topay”2 or the higher income from touristactivities compared to a situationwithout the intervention.
3.10.6 Other evaluation elementsWhenever the proposed project containsany elements, which are of naturalistic,environmental or scientific importance inthemselves (e.g. the protection of threate-ned species), these should be confirmed bya panel of qualified independent sectorexperts.
3.10.7 Sensitivity and risk analysisIt is advisable to analyse the following va-riables:
• trend in tourist flows,
• cost trends for some critical factors, suchas personnel,
• the value and the dynamics of the risksrelated to possible damage, regardless,of the cause (natural, human error, te-chnical).
3.11 Telecominfrastructures3.11.1 Objectives definitionProjects with objectives of a local scale are
• local cabling or relay systems to extendservices to areas not covered,
• cabling a city, metropolitan or industrialareas, etc. to provide faster, more power-ful networks which will enable the deve-lopment of new local services (e.g. theso-called “wide band”) networks,
• the construction or modernisation ofunits for band switching with wider net-works (this type of project is often linkedto the previous type),
• the lying of cables, construction of relayor satellite stations to link isolated areas(mountainous areas, islands, etc.).
Projects with objectives of a non-local sca-le are:
• the development of international com-munications systems, to increase capa-city, power and speed (e.g. launchingtelecommunications satellites, buildingsatellite radio stations, laying long dis-tance cables underwater, etc.),
• increasing the capacity, power and speed ofinter-regional communications networks,
• the technological updating of the net-work to enable connection with new ser-vices (e.g. multi-media services, portabletelephones, cable television, civic net-works, virtual museums, etc.).
3.11.2 Project identificationIt is essential to have a clear idea of the fol-lowing two aspects, which are stronglyinter-related:
• the organisation of the interventionmanagement, including any possibledivision into sectors,
• the implementation programme for theproject itself and the proposed plan forpenetrating the catchment area with theservices offered by the new structure.
It is also useful to:
• Identify the potential catchment area theproject is designed to serve
• provide an analysis of the potential market.
• explain the functional and physical linksbetween the projected infrastructure andthe existing telecom-munications system.
• Describe the engineering features of theinfrastructure:√ basic functional data, such as: type of
communications infrastructure, trafficvolume and type, maximum commu-nication speed (baud), type of com-mutation, communication protocol,
94
3.11 Telecom infrastructures
2 See previous note.

3.12.5 Economic analysisThe analysis should consider:
• Social benefits: better positioning on themarket for existing companies, a diffusionof entrepreneurial knowledge and skillsamong the beneficiary companies, andexternally, the retraining of personnel, theeffects of various productive factors onemployment and incomes, the birth ofnew productive companies, the birth ofnew private service companies, etc.
• Quantification of social benefits: anapproach that may sometimes be adop-ted is that of subdividing the potentialbeneficiary companies of the catchmentarea by size and sector of activity. Foreach class it is then possible to evaluatethe benefit, with reference, for example,to increased added value thanks to themore advantageous location (e.g.savings in transport costs, greater pene-tration of a previously difficult to reachmarket, effect of possible promotionalactivities in the new exhibition areas,lower costs for basic services, etc.), or theavailability of real services (e.g. betterpositioning due to the marketing servi-ce, better penetration and cost-savingwith telemarketing, technologicalimprovements or new production tech-nologies, improved professional levelthanks to training, etc.).
• The economic costs of raw materials andthe land used in the construction of theproject should be evaluated according tothe loss to society by the diversion ofthese from an alternative better use.Personnel costs should be evaluated in asimilar manner.
• Environmental costs should also bequantified (land, water and air pollu-tion, spoiling of the visual impact, noise,refuse, etc.) as should any possible urbanand transport congestion caused by therealisation of the infrastructure. Note,however, that since the impacts conside-red will increase in the area surroundingthe new infrastructure, they shoulddecrease in the rest of the catchmentarea, the global effect - which is what
should be considered in the analysis -may be for the better or for the worse(e.g. systems for controlling refluencesmay be more effective, etc.).
3.12.6 Other evaluation elementsSocial costs may be measured by the physicalindicators directly or indirectly linked to themand cost/effectiveness ratio may be computed.
3.12.7 Sensitivity and risk analysisCritical factors: initial rigidity, difficulty inforecasting the real rate of penetration inthe catchment area, from the point of viewof both the relocation of companies2 andthe development of new businesses.
The sensitivity and risk analysis shouldconsider:
• the cost of the investment,
• the rate of installations in the area,
• the cost of some critical input (labour,out-sourced goods and services for theproduction of real services),
• if they have been quantified, the birth andearly mortality rate of new businesses.
3.13 Industries andother productiveinvestments3.13.1 Objectives definitionIntervention may be classified into:
• projects aimed at encouraging the indu-strialisation of all sectors in areas that arerelatively backward,
• strategically important, capital intensiveprojects (e.g. certain segments of theenergy sector),
97
3.13 Industries and other productive investments
Sensitivity and risk analysis should consi-der at least the following variables:
• investment costs, including those fortechnological development,
• forecast for substitution cycles (ageing,technical obsolescence) of the equip-ment installed,
• demand dynamics (i.e. forecast growthrates for the population and businesses),
• dynamics of the sales prices for services.
3.12 Industrial estatesand technological parks3.12.1 Objectives definitionObjectives can be classified in the followingcategories:
• creation of basic infrastructure for esta-blishing industrial estates, commercialand service areas;
• creation of basic infrastructure for the plan-ned relocation of productive plants fromexcessively congested or polluted areas;
• creation of centres supplying real servicesto companies in a specific area (accoun-ting, financial information, marketing,training..)
• creation of centres promoting the settingup of new companies and supportingexisting ones (technological parks, busi-ness innovation centres, etc.);
• a mix of the above, often aimed at sup-porting companies in one particularindustrial segment.
3.12.2 Project identificationIt would be useful to:
• identify the catchment area, that is thegeographic area, the size of target com-panies (e.g. craftsmen, SME’s, mediumand large.) and the productive segments
• give basic data, such as the number, sizeand type of companies involved, the typeof real services and scientific/technologi-cal laboratories, if present,
• provide the following engineering data:√ location and surface (Km2) of the equip-
ped area and the breakdown into plots;
√ number and covered area (m2) ofwarehouses, stores, office blocks, exhi-bition spaces, etc.;
√ internal viability and mobility (roadsand railways) and their links withexternal systems; features of possibleports, heliports, etc.;
√ internal networks and systems, e.g. aque-ducts, drains, depurators, electricity,lighting, telecommunications systems,security, etc., attaching data and layout;
√ number of and area covered by publicbuildings (real services, laboratories,logistics, canteens, telecommunica-tions centres, etc.);
√ significant technical elements, such asspecialised laboratories, multimediaservices centres, etc.
3.12.3 Feasibility and options analysisKey issue: estimated demand from existingcompanies to relocate in the catchmentarea and the birth rate of new companies,demand and dynamics for real services,environmental elements.
The options analysis should consider globalalternatives, e.g. increased funding direct tocompanies for the same end (moving pre-mises, purchase of real services, technologi-cal innovation, new production lines ornewly constituted companies, etc.)
3.12.4 Financial analysis• Financial inflows: rent or licensing costs
of land and warehouses and the sales pri-ces of services (water, electricity, drainsand purification, storage, logistics, etc.)and of real services.
• Financial outflows: costs of goods andservices necessary for the running of theinfrastructure and the production of realservices.
Time horizon: at least 20 years.
96
3.12 Industrial estates and technological parks
Financial rate of return* Infrastructure to support production
minimum 2.30maximum 16.87average 10.49standard deviation 5.28
* Sample data: 4 major projects out of 14 in the sector included inthe sample of 400 projects combined.
Financial rate of return* Infrastructure to support production
minimum 9.10maximum 36.00average 18.89standard deviation 6.91
* Sample data: 12 major projects out of 14 in the sector included inthe sample of 400 projects combined.
2 In some cases the relocation of industries has been accelerated by opportune territorial planning policies.

(producing goods and services) stimula-ted by the beneficiary company or groupof companies;
• the economic costs of raw materials andthe land used in the construction of theproject should be evaluated according tothe loss to society by the diversion of the-se from the best alternative use;
• the environmental costs (land, water andair pollution, spoiling of the visualimpact, noise, refuse, etc.) should for themost part be evaluated on the basis of thecosts (at distortion corrected market pri-ces) of the actions necessary to eliminatethe effects of pollution or by othermethods suggested in previous outline.
• the cost of any possible urban and trans-port congestion caused by the installa-tion of new companies or the increasedactivity of existing companies, estimablein terms of longer transport times(goods and passengers) on the commu-nications routes involved3 and the possi-ble depreciation in value of adjacent realestate and land.
3.13.6 Other evaluation elementsFurthermore, considering the difficulties inquantifying and valorising all of the socialbenefits, for the purpose of a more comple-
te evaluation of the project it would be use-ful to make a careful appraisal of these,even if only in terms of physical indicators,so that the direct and indirect effects maybe measured.
These should include the effects onemployment, bearing in mind that main-taining or developing employment is a cen-tral objective in many incentive program-mes for the productive sector.
3.13.7 Sensitivity and risk analysisCritical factors are specific to each type ofintervention (new companies, modernisa-tion or expansion of existing companies)for every productive segment (mature orpioneer segments, strong or weak competi-tiveness, processes with a considerable ornegligible impact on the environment, etc.).
Sensitivity and risk analysis should consi-der the following variables:
• the cost of the investment, for projectswith a high technological risk,
• the growth rate in demand for the goodsand services produced for the specificmarket,
• the cost of critical input,
• the price of the output.
99
3.13 Industries and other productive investments
• projects aimed at encouraging technolo-gical development in specific sectors orat applying new, more promising techno-logies which require a high initial invest-ment (e.g. applying new materials to thetransport industry, developing electricsuperconductors, applying technologiesfor the use of renewable energy)
• projects aimed at creating alternative em-ployment in areas where there has been adecline in the existing productive units,
• projects aimed at encouraging the instal-lation and development of new compa-nies, both craftsmen and SME’s (newenterprises).
3.13.2 Project identificationIt would be helpful to provide an accuratedescription of the company (or group ofcompanies) which will benefit from theintervention:
• a list of the categories of goods or servi-ces produced by the company before theintervention and those predicted as aresult;
• a list of the annual quantities of produc-tion input in terms of raw materials,semi-finished articles, services, workfor-ce (disaggregated according to categoryand specialisation), etc. both before andafter the intervention;
• the turnover, gross operating margin,gross and net profit, cash-flow, debt ratioand other balance sheet indicators, bothbefore and after the intervention;
• a description of the market covered bythe company and its positioning beforeand after the intervention (e.g. givingquotas per product and geographic areaand their respective dynamics);
• company structure (functions, depart-ments, procedures, quality systems,information systems, etc.) before andafter the intervention;
• a description of the production andauxiliary machinery and equipment;
• a description of the company buildingsand related areas;
• discharge points for liquid and/or gaswaste and a description of treatmentplants;
• waste products (type and quantity) anddisposal/treatment systems;
3.13.3 Feasibility and options analysisKey issue: the parameters are specific anddepend on factors such as the sector inwhich the company operates, the type ofproduct, the production technologiesemployed.
The options analysis should consider alter-native methods of financing (e.g. financingthe interest account instead of the capitalaccount, financing a leasing contract, orother methods of financing), technical ortechnological alternatives to the proposedproject and the global alternatives (e.g.supplying low-cost real services).
3.13.4 Financial analysisThe financial analysis can be carried outcomparing the cash flows produced by thecompany (or group of companies) as aresult of the investment, with those itwould have generated without the subven-tions2. The various cost and revenue itemsshould be evaluated according to marketprices, and discounting the cash flows.
Time horizon: around 10 years.
3.13.5 Economic analysisIt is necessary to take into account the ex-ternalities, such as:
• the benefit due to the increased incomecaused by the increase in business or bythe creation of new sector companies
98
3.13 Industries and other productive investments
2 The incremental cash flows coincide tout-court with total flows in the case of newly constituted companies. It should be emphasised that, inany case, it is necessary to consider two possible alternatives i.e. one where the company would have still made the investment (e.g. it wouldhave purchased the machinery) at a higher investment cost, and the other where the company would have been unable to purchase the machi-nery without the financial concessions.
3 For the quantification and valorisation of these effects, see the section on roads.
Financial rate of return* Industry
minimum 5.50maximum 70.00average 19.59standard deviation 14.45
* Sample data: 64 major projects out of 107 in the sector included inthe sample of 400 projects combined.

more heavily than the positive ones in the lastyears. This means that the choice of thetime horizon is crucial for the determina-tion of the NPV. Moreover the choice of thediscount factor (that means the interestrate in the at formula) influences the calcu-lation of the NPV (see also graph.1).
This indicator could be a very simple andprecise evaluation criteria for an invest-ment: NPV>0 means that the project gene-rates a net benefit (because the sum of theweighted Sn is still positive) and it is gene-rally desirable. In other words it can be agood measure of the value added of a pro-ject for the society in monetary terms. It isalso useful ranking projects on the basis oftheir NPV values and decide which is thebest. As in the graph 2 project 1 is moredesirable than project 2 as it has a biggerNPV value for every i value.
Sometimes NPV values could be non com-parable for every value of i, as in the case ofgraph 3. In this case the definition ofthe same i for every project could lead to aclear choice between projects.
As already described in chapter 2 net pre-sent value could be financial net presentvalue if it is calculated in the financialanalysis with financial variables, and eco-nomic net present value in the case it is cal-culated in the economic analysis.
A.2 The internal rateof return1
The internal rate of return is defined as theinterest rate that zeroes out the net presentvalue of the investment, that is to say theinterest rate IRR of the equation below:
NPV (S) =
All the most commonly used data manage-ment software automates the calculation ofthe value of these indicators by applyingthe appropriate financial function. Theresults of the calculation of the IRR are theinterest rates shown in graph. A.
101
A.2 The internal rate of return
This section explains the calculation anduse of the main performance indicatorsfor CBA analysis: IRR, NPV and B/C.These indicators are expressly required inthe financial and economic analysis and inthe Application Forms for the three Funds.IRR and NPV are included in the maintables for financial and economic analysis(see Tab. 5, 6 and 10, rows 5.4, 5.5, 6.4, 6.5,10.4, 10.5).
These indicators should give concise infor-mation about project performance andcould be the basis for ranking projects.
A.1 The net presentvalue (NPV)Financial and economic tables are definedby inflows (I1, I2, I3), outflows (O1, O2,O3) and balances (S1, S2, S3 for time 1, 2,3). The model is built in a number of yearsand this could generate problems if we wantto sum S at time 1 and S at time 2 and so on.This is due to the fact that the marginal uti-lity of one euro today is bigger than themarginal utility of a euro tomorrow. Somereasons justify this point, for example:
• risk aversity for future events;
• monetary income is an increasing func-tion and marginal utility for consump-tion decreases over time;
• pure preference for present utility com-pared to future utility.
Aggregation of heterogeneous data is possi-ble with specific weighting coefficients. Thesecoefficients should have the following cha-racteristics:
• decreasing during time;
• they should measure the loss of value ofthe numeraire during that time.
Such a coefficient is the financial discoun-ting factor at: at= (1+i)-t where t is the timehorizon, i the interest rate and at is thecoefficient for discounting a future finan-cial value to have the actual value.
Thus the net present value ofa project is defined as:
NPV (S) =
where Sn is the balance of cash flow funds attime n and at is the financial discount factorchosen for discounting.
This is a very concise performance indica-tor of an investment project: it is the actualamount of all the net flows generated by theinvestment expressed in one single valuewith the same unit of measurement used inthe accounting tables.
It is important to note that usually thebalance of the first years from the investmentare negative and become positive aftersome years. As they decrease over time,negative values in the first years are weighted
Project performance indicatorsAnnex A
100
Discount Factors Table
Years 1 2 3 4 5 6 7 8 9 10(1+5%)-n .952 381 .907 029 .863 838 .822 702 .783 526 .746 215 .710 681 .676 839 .644 609 .613 913(1+10%)-n .909 091 .826 446 .751 315 .683 013 .620 921 .564 474 .513 158 .466 507 .424 098 .385 543
n: number of years
∑at St = + +n
t=0 (1+i)0
S0(1+i)1
S1(1+i)n
Sn
NPV
i
NPV
i
Graph. 1 NPV as a function of i.
Graph. 3 A case of non-comparable NPV.
NPV
Project 1
Project 1
Project 2
Project 2
i
Graph. 2 Project ranking by NPV values.
∑St / (1+IRR)t = 0n
t=0
1Here we do not make distinction between financial internal rate ofreturn (both on investment and on equity) and economic rate ofreturn. For an in-depth explanation on that point see chapter 2.

NPV
i
NPV
i
NPV
i
As it is clear from the definition of IRR andits formula, no discount rate is needed forthe calculation of this indicator.
The examiner mainly uses the financial rateof return in order to judge the future perfor-mance of the investment. Infact, if i is consi-dered the opportunity cost of equity IRR isthe maximum value i could assume withoutmaking the investment a net loss comparedto an alternative use of the capital.
Thus IRR could be an evaluation criterionfor project appraisal: under a specificvalue of IRR the investment should be
considered not suitable.
Either NPV or IRR could be used as an eva-luation criteria for ranking projects.
Nevertheless it is useful considering al-ways NPV value and IRR together, asambiguous cases could occur (see graph 5and 6).
A.3 B/C ratioThe B/C ratio is defined by:
B/C = PV (I)/PV (O)
where I are the inflows and O outflows. IfB/C>1 the project is suitable because bene-fits, measured by the present value ofthe total inflows, are greater than costs,measured by the present value of thetotal outflows.
It is a pure number, like IRR, and it isindependent of the size of the investment.Moreover it is sometimes easier to usebecause there are no ambiguous cases likethose shown for IRR.
For this reason it is in some cases very sui-table to rank projects.
102
A.3 B/C ratio
B.1 The FinancialDiscount Rate In theoretical literature and in practice wecan find different points of view regardingthe discount rate to be considered in thefinancial analysis of investment projects.There is a substantial academic literatureon the definition and estimation of disco-unt rates, and it is not necessary to summari-se it here (see bibliography). Yet, projectproposers and appraisers should under-stand the basic ideas behind the selection ofone discount rate.
As a general, and quite uncontroversial,definition, the financial discount rate is theopportunity cost of capital. Opportunitycost means that when we use capital in oneproject we renounce to earn a return inanother project. Thus we have an implicitcost when we sink capital in an investmentproject: the loss of income from an alterna-tive project.
Having in mind this broad definition, weneed to estimate empirically the relevantopportunity cost of capital for a given pro-ject, in a given country and time.
There are basically three approaches thatmay be helpful to identify the appropriatefinancial discount rate, and we shouldbriefly mention them below.
The first approach estimates a minimumopportunity cost of capital. Sometimes thisapproach suggests that the real discountrate should measure the cost of the capitalused for the specific investment project. As
a consequence, the benchmark for a publicproject may be the real return onGovernment bonds (the marginal cost ofpublic deficit), or the long term real interestrate on commercial loans (if the projectneeds private finance).This approach is very simple, but it may bequite misleading. It is important to under-stand that under this approach we use theactual cost of capital to determine the oppor-tunity cost of capital, and the two conceptsare different. In fact the best alternative pro-ject could earn much more than the actualinterest rate on public or private loans.
The second approach establishes a max i-mum limit value for the discount rate as itconsiders the return lost from the bestinvestment alternative. In practice theopportunity cost of capital is estimatedlooking at the marginal return on a portfo-lio of securities in the international finan-cial market, in the long run and with mini-mum risk. In other words, the alternative tothe project income is not the buying backof public or private debt, but it is the returnon an appropriate financial portfolio.
However, some investors, particularly inthe private sector, on the basis of previous
The choice of the Discount Rate Annex B
103
IRR
NPV 1
NPV 2
DR
Project 1
Project 2
IRR 2
IRR’ IRR’’ IRR’’’IRR 1
Graph. A The internal rate of return.
Graph. 5 Ambiguous cases.
NPV1>NPV2 but IRR2>IRR1
DR: discount rate
Tab. 1. Some examples of financial discount rates in different sectors and countries*
Sector Country Discount rate
Transport Espana 5Transport Espana 6Transport Espana 6Transport Espana 6Transport France 8Environment Lituania 3Environment Poland 5Environment Poland 5Industry Portugal 10Energy Portugal 11
* Data refers to ISPA, FC and ERDF projects
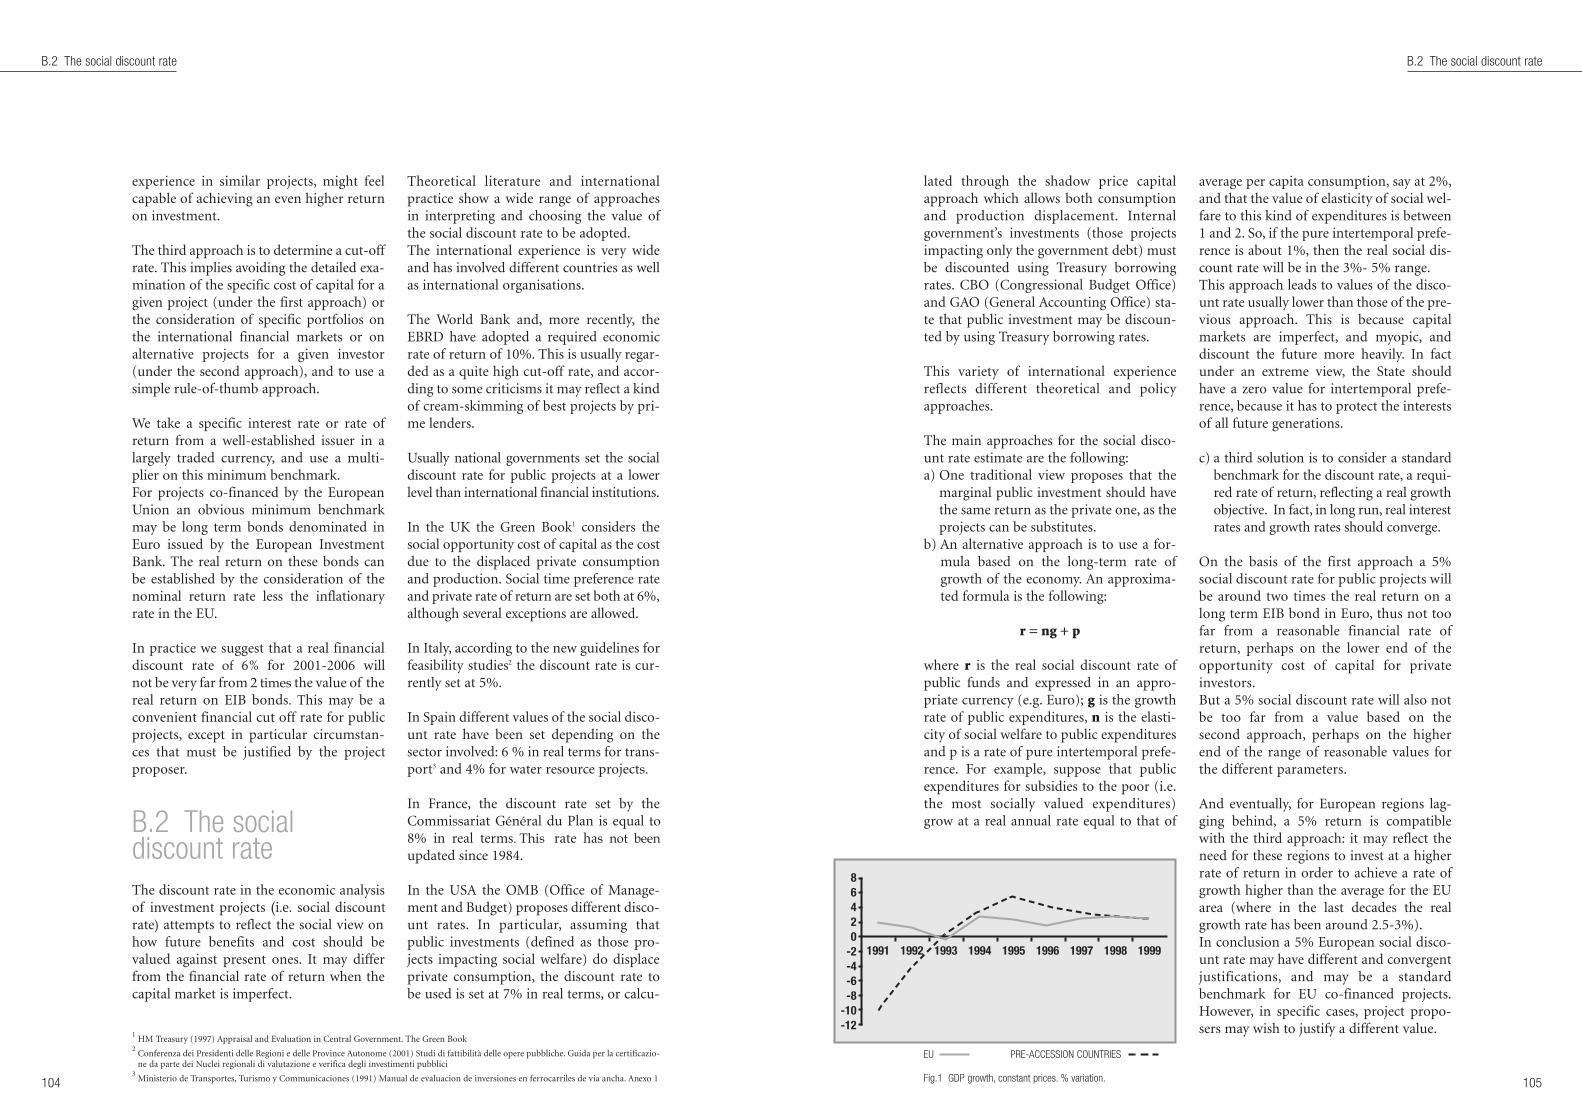
lated through the shadow price capitalapproach which allows both consumptionand production displacement. Internalgovernment’s investments (those projectsimpacting only the government debt) mustbe discounted using Treasury borrowingrates. CBO (Congressional Budget Office)and GAO (General Accounting Office) sta-te that public investment may be discoun-ted by using Treasury borrowing rates.
This variety of international experiencereflects different theoretical and policyapproaches.
The main approaches for the social disco-unt rate estimate are the following:a) One traditional view proposes that the
marginal public investment should havethe same return as the private one, as theprojects can be substitutes.
b) An alternative approach is to use a for-mula based on the long-term rate ofgrowth of the economy. An approxima-ted formula is the following:
r = ng + p
where r is the real social discount rate ofpublic funds and expressed in an appro-priate currency (e.g. Euro); g is the growthrate of public expenditures, n is the elasti-city of social welfare to public expendituresand p is a rate of pure intertemporal prefe-rence. For example, suppose that publicexpenditures for subsidies to the poor (i.e.the most socially valued expenditures)grow at a real annual rate equal to that of
average per capita consumption, say at 2%,and that the value of elasticity of social wel-fare to this kind of expenditures is between1 and 2. So, if the pure intertemporal prefe-rence is about 1%, then the real social dis-count rate will be in the 3%- 5% range.This approach leads to values of the disco-unt rate usually lower than those of the pre-vious approach. This is because capitalmarkets are imperfect, and myopic, anddiscount the future more heavily. In factunder an extreme view, the State shouldhave a zero value for intertemporal prefe-rence, because it has to protect the interestsof all future generations.
c) a third solution is to consider a standardbenchmark for the discount rate, a requi-red rate of return, reflecting a real growthobjective. In fact, in long run, real interestrates and growth rates should converge.
On the basis of the first approach a 5%social discount rate for public projects willbe around two times the real return on along term EIB bond in Euro, thus not toofar from a reasonable financial rate ofreturn, perhaps on the lower end of theopportunity cost of capital for privateinvestors.But a 5% social discount rate will also notbe too far from a value based on thesecond approach, perhaps on the higherend of the range of reasonable values forthe different parameters.
And eventually, for European regions lag-ging behind, a 5% return is compatiblewith the third approach: it may reflect theneed for these regions to invest at a higherrate of return in order to achieve a rate ofgrowth higher than the average for the EUarea (where in the last decades the realgrowth rate has been around 2.5-3%).In conclusion a 5% European social disco-unt rate may have different and convergentjustifications, and may be a standardbenchmark for EU co-financed projects.However, in specific cases, project propo-sers may wish to justify a different value.
105
B.2 The social discount rate
experience in similar projects, might feelcapable of achieving an even higher returnon investment.
The third approach is to determine a cut-offrate. This implies avoiding the detailed exa-mination of the specific cost of capital for agiven project (under the first approach) orthe consideration of specific portfolios onthe international financial markets or onalternative projects for a given investor(under the second approach), and to use asimple rule-of-thumb approach.
We take a specific interest rate or rate ofreturn from a well-established issuer in alargely traded currency, and use a multi-plier on this minimum benchmark.For projects co-financed by the EuropeanUnion an obvious minimum benchmarkmay be long term bonds denominated inEuro issued by the European InvestmentBank. The real return on these bonds canbe established by the consideration of thenominal return rate less the inflationaryrate in the EU.
In practice we suggest that a real financialdiscount rate of 6% for 2001-2006 willnot be very far from 2 times the value of thereal return on EIB bonds. This may be aconvenient financial cut off rate for publicprojects, except in particular circumstan-ces that must be justified by the projectproposer.
B.2 The social discount rateThe discount rate in the economic analysisof investment projects (i.e. social discountrate) attempts to reflect the social view onhow future benefits and cost should bevalued against present ones. It may differfrom the financial rate of return when thecapital market is imperfect.
Theoretical literature and internationalpractice show a wide range of approachesin interpreting and choosing the value ofthe social discount rate to be adopted.The international experience is very wideand has involved different countries as wellas international organisations.
The World Bank and, more recently, theEBRD have adopted a required economicrate of return of 10%. This is usually regar-ded as a quite high cut-off rate, and accor-ding to some criticisms it may reflect a kindof cream-skimming of best projects by pri-me lenders.
Usually national governments set the socialdiscount rate for public projects at a lowerlevel than international financial institutions.
In the UK the Green Book1 considers thesocial opportunity cost of capital as the costdue to the displaced private consumptionand production. Social time preference rateand private rate of return are set both at 6%,although several exceptions are allowed.
In Italy, according to the new guidelines forfeasibility studies2 the discount rate is cur-rently set at 5%.
In Spain different values of the social disco-unt rate have been set depending on thesector involved: 6 % in real terms for trans-port3 and 4% for water resource projects.
In France, the discount rate set by theCommissariat Général du Plan is equal to8% in real terms. This rate has not beenupdated since 1984.
In the USA the OMB (Office of Manage-ment and Budget) proposes different disco-unt rates. In particular, assuming thatpublic investments (defined as those pro-jects impacting social welfare) do displaceprivate consumption, the discount rate tobe used is set at 7% in real terms, or calcu-
104
B.2 The social discount rate
1HM Treasury (1997) Appraisal and Evaluation in Central Government. The Green Book
2Conferenza dei Presidenti delle Regioni e delle Province Autonome (2001) Studi di fattibilità delle opere pubbliche. Guida per la certificazio-ne da parte dei Nuclei regionali di valutazione e verifica degli investimenti pubblici
3Ministerio de Transportes, Turismo y Communicaciones (1991) Manual de evaluacion de inversiones en ferrocarriles de via ancha. Anexo 1
86420
-2-4-6-8
-10-12
1991 1992 1993 1994 1995 1996 1997 1998 1999
EU PRE-ACCESSION COUNTRIES
Fig.1 GDP growth, constant prices. % variation.

the determination of the cofinancing rate.This would be possible through both theharmonisation of the accounting rules forfinancial and economic analysis (see chap-ter 2) and a triple checks system based onfixing benchmarks for FRR/C, FRR/K andERR. The logic of this system is showed inthe diagram.
C.2.1 Calculation of the financial rate ofreturn on the total investment cost (befo-re EU intervention). The project proposer should present a cal-culation of the (real) financial rate of re-turn on the total investment, FRR/C, id estthe internal rate of return when total
investment costs, total operative costs andtotal revenues are considered (withoutconsidering grants, equity capital, loansand interests) in order to evaluate the ove-rall financial profitability of the project or,as more often it will be the case, the netcost for public finance when project reve-nues are zero or insufficient.If the FRR/C is less than a threshold theapplicant should be asked by the Com-mission to give evidence on how the projectwill be sustainable in the long term, beyondthe time horizon. This will include a com-plete financial plan with indication of allfinancial resources (national subsidies,loans, shareholder’s equity..).
107
C.2 Rules for modulation
This section proposes a practical ap-proach to determine the modulation ofthe cofinancing rate as required by theRegulations.
C.1 Regulatory frameworkThe new Regulations, while fixing maxi-mum rates (see Tab. 1) explicitly requirethe Commission to determine the actualrate, taking into account various circum-stances, particularly:
• the existence of project revenues;
• the polluter pays principle.
The Regulations require the Commissionto state how it determines its cofinancingrate, in a transparent and verifiable way.The current approach for the CohesionFund (imitated by ISPA), is the “equity gap”or “financing gap” approach.
The basic idea is to fill the “financing gap”by EU grants. That means that, if C is thepresent value of total cost of the invest-
The determination of the co-financing rate
Annex C
106
Tab. 1 Ceilings for the cofinancing rate as from the Regulations.
Structural Funds and Cohesion Fund
Types of region/country Max co-financing rate% of total eligible cost
Obj. 1 75Obj. 1-Cohesion fund region 80Obj. 1-Cohesion fund region/ultra peripheral 85Obj. 2 and 3 50
Higher co-financing rate% of total eligible cost
Cohesion Fund country 80-85
ISPA
ISPA country 75 (85 in exceptional cases)
Tab.2 The discount rate and the co-financing gap: an example*
Basic project data
Total eligible cost € 36.000.000Proposed ISPA grant € 27.000.000Co-financing required € 9.000.000Grant rate 75%
The choice of a discount rate
Scenario (DR) 6% 8% 11%financing gap 47% 51% 11%
* This example is based on an ISPA project
Calculation of FRR/C before EU aid
Determination of the EU grant G by the financing gap method
Calculation of FFR/C after EU aid ( ie C is diminishedby the amount of EU aid )
Community aid rate:r= Min (G/E; ceiling rate)
Examination of the financial sustainability
Reject the project or modify financial structure
Calculation of the ERR
Community aid rate:r= Min (G/C; ceiling rate)
Calculation of FFR/K (NPV/K)
Change G
Presentation of the financial structure(grants, own capital, loans, etc.)
Eligible cost <T1 Eligible cost >T1
If FRR/K > T2 (NPV/K > 0)
If FRR/K < T2 (NPV/K < 0)
Non sustainable
Sustainable
FRR > 0% FRR < 0%
Presentation of thefinancial structure
T1=50MEUR T2=6% by way of illustration
ment, R the present value of the netrevenues generated by the project, inclu-ding its residual value, E the eligible cost,(C-R) is the financing gap, we have that r isthe cofinancing rate and G is the EU grantdefined as follows:
r= (C-R)/C and G= E*r
C.2 Rules for modulationThe rule of the financing gap needs somerecommendations to be followed in orderto better accomplish Commission objecti-ves and use cost-benefit analysis to modu-late the cofinancing rate. Infact the generalrule stated in the CF Guidelines states:
The rate will be fixed in the light of the charac-teristics of the project and with particularattention to the results of the economic analysis.
This should mean that rates calculated wi-thin the financial and economic analysis,such as FRR/C, FRR/K and ERR might beused to check the quality of the project before

The uncertainty of the forecasts carried outin the CBA stem from different causes. As atypical example, figures 1, 2 and 3 show theresults of field surveys conducted to deter-mine which values to attribute to the threevariables to be used in the analysis. As wecan see, even if it is possible to determine avalue as the best estimate for the data underexamination (for example the mean), theparameters show a variability of values.
Once the critical variables have been iden-tified, in order to conduct the risk analysisit is necessary to associate a probability dis-tribution to each of them, defined in a pre-cise range of values around the best estima-te, used in the base case, in order to calcula-te the evaluation indices.
The probability distribution for each varia-ble may be derived from different sources.The most common one is made up of theresults of studies carried out to obtain thedesired experimental values, in situationsthat are as similar as possible to those of theproject. This is the case shown as an exam-ple in the previous figures 1, 2 and 3. It ispossible in almost all cases, with variousmethods found in specialist literature (sta-tistical inference), to obtain a probabilitydistribution from the experimental data,which is expressible graphically and/oranalytically. When there are no experimen-tal data, one can use the distributionsfound in literature, which are valid for casessimilar to the one being studied.
Sensitivity and risk analysisAnnex D
108
C.2 Rules for modulation
C.2.2 Calculation of the financial rate ofreturn on national capital (after EU grant). As explained in detail in the Guide, thereare two ways to consider financial returns.FRR/C gives an indication of the overallfinancial efficiency of the project. It consi-ders investment cost, and deliberately igno-res how they are financed.
However it is important to look also at thefinancial return of the investor’s own capi-tal. This is done by considering, instead oftotal investment, the cost of capital for theinvestor: equity disbursed, reimbursementof loans and interest (including EIB andcommercial bank loans). EU grants shouldnot be included. This is the same as the cal-culation of the FRR ‘without EU’, when thecosts of the investments not covered by theEU grant are completely covered by inve-stor’s capital (no loans and interests).
The applicant should present thefinancial structure he proposes for the pro-ject (by a simple table of financial planning,see financial sustainability table 2.3 in
chapter 2), on the basis of his expectationsof the EU cofinancing (in other words theapplicant should state how much own capi-tal, including national public funds or pri-vate equity, and third parties loans andinterests he/she will be prepared to afford).The financial internal return on nationalcapital (FRR/K) usually should not exceeda real 6%2. For projects with a FRR/K>6%more contribution with own capital couldbe asked and the FRR/K should be recalcula-ted with this new financial structure.
C.2.3 Calculation of the economic rate of return.The project proposer should calculate theERR, with the methods suggested in thepresent CBA guide. The difference betweenERR and FRR is that the former usesaccounting prices or the opportunity costof goods and services instead of imperfectmarket prices, and it includes as far as pos-sible any social and environmental exter-nalities. Because externalities and shadowprices are now considered, most projectswith low or negative FRR/C will now showpositive ERR.
1“Without EU” means before EU intervention: the total cost of the project is used. “With EU” means after EU financing intervention: the totalcost, minus the community aid, is used.
2This threshold value is given by way of illustration and can be modified by the Commission. Any project that earns a FRR/K of more thanthis value can be considered as asking an excessive grant.
100
80
60
40
20
0700- 800- 900- 1000- 1100- 1200- >1300800 900 1000 1100 1200 1300
Obse
rved
cas
es
Price ranges
30%
25%
20%
15%
10%
5%
0%< 30- 35- 40- 45- 50- 55- 60- 65- >30 35 40 45 50 55 60 65 70 70
Freq
uenc
y
Thousands of vehicles
600
500
400
300
200
100
0%10 20 30
Fig. 1 Distribution of commodity price - Average 1.017 euro - Standard deviation 164 euro
Fig. 3 Per capita consumption - (average: 230 litre/day-Standarddeviation: 96 litre/day)
Fig. 2 Daily traffic - average 46.800 - SD 2.400
N° sample
L/da
y
109

111
D Sensitivity and risk analysis
Another possibility (the Delphi method) isto consult a group of experts (panel),asking each of them to estimate the proba-bility to be assigned to defined intervals ofvalues – generally only a few - of the para-meter in question, and then combine thevalues obtained with the rules of statistics.
Figures 4 to 8 show graphically some typi-cal probability distributions which arecommonly found in literature and espe-
cially in the analysis of the risks associatedwith investment projects.
Fig. 4 is a typical symmetrical bell-shaped,or Gaussian curve, while fig.5 is a discreteprobability distribution in constant valuesfor defined intervals of the variable. Thissimplified representation is commonlyused because it is easier to calculate. Forthe same reason symmetrical or non-symmetrical triangular distributions arealso used, shown by way of illustration infigures 6 and 7. The last figure shows a stepdistribution (in this case with threevalues), a typical result of applying theDelphi method.
Having established the probability distri-bution of the critical variables, it is possi-ble to proceed with the calculation of theprobability distribution of the IRR orNPV of the project. Only in the simplestcases is it possible to calculate this by usingdirect methods, using analytical methodsof calculating the probabilities composed
of a number of independent events. Thefollowing table shows a possible calcula-tion procedure that uses the tree develop-ment of the independent variables.
For example there is a 3% probability(0.15*0.20) that the NPV has a value of 5.
In fact if investment costs are decreasing by 56and other costs are decreasing by 13 (with aprobability of 20%), benefits will increase by 74(with 15% probability). If these new valuesare included in the NPV formula, the resultis 5.
110
D Sensitivity and risk analysis
Fig. 6 Symmetric triangular distribution
0.20
0.15
0.10
0.05
0.004 6 8 10 12 14 16
0.15
0.10
0.05
0.000 5 10 15 20 25
Fig. 5 Discrete probability
Tab. 1 Probability calculation for NPV from variations of critical varibles
Critical variables Result
Investment Other costs Benefit NPV
Value Value Probability Value Probability Value Probability
-56.0
-13.0 0.20
-15.6 0.50
-18.7 0.30
74.0 0.15 5.0 0.0377.7 0.30 8.7 0.0681.6 0.40 12.6 0.0885.7 0.15 16.7 0.0374.0 0.15 2.4 0.0877.7 0.30 6.1 0.1581.6 0.40 10.0 0.2085.7 0.15 14.1 0.0874.0 0.15 -0.7 0.0577.7 0.30 3.0 0.0981.6 0.40 6.9 0.1285.7 0.15 10.9 0.05
Fig. 8 Project cost
50%
40%
30%
20%
10%
0%65.0 67.5 70.0 72.5 75.0 77.5
60
40
20
0-2.00% -1.00% 0.00% 1.00% 2.00% 3.00%
Prob
abili
ty
Meuro
Fig. 4 Gaussian curve
1.00
0.75
0.50
0.25
0.000.20% 0.30% 0.40% 0.50% 0.60% 0.70%
Fig. 7 Asymmetric triangular distribution

113
E.2 Evaluating environmental impacts in development projects
E.1 Why do we valuethe environment?The economic evaluation of the environ-ment helps decision-makers to integrate indecision-making processes the value ofenvironmental services provided by ecosy-stems. Internal and external environmentaleffects produced by economic projects arecalculated and expressed in monetaryterms1. Monetary evaluation is a useful wayto express in the same dimension differentsocial and economic costs and benefits andis required to calculate a homogenousaggregate indicator of net benefits.
In the context of strong uncertainty andirreversibility in the future availability ofthe environmental resource or for ethicalreasons, other economic evaluation me-thods can be applied, such as Environ-mental Impact Assessment, multi-criteriaanalysis or public referenda. These me-thods avoid the need to express all envi-ronmental impacts and individual’s prefe-rences in a single numeraire.
E.2 Evaluating environmental impactsin development projectsMost public infrastructure projects havenegative, or positive, impacts on the localand global environment. Typical environ-mental impacts are associated with local airquality, climate changes, water quality, soiland groundwater quality, biodiversity and
landscape degradation, technological andnatural risks. These impacts alter the nor-mal functioning of ecosystems and reduce(or in some cases increase) the quality ofecological services provided by ecosystems.Decrease, or increase, in the quality or thequantity of environmental goods and servi-ces will produce some changes, gains or los-ses, in social benefits associated with theirconsumption.
For example, a road infrastructure will beexpected to reduce the superficies of usefulrural land, will change rural landscape
Monetary evaluation of environmental services
Annex E
112
Environment impacts and environmentalservices in the projectRelevant environmental impacts in major projects are related with thefollowing environmental dimensions:• Water: surface water and groundwater availability and quality• Air pollution: urban air pollution and greenhouse gas emissions• Soil pollution: contamination by chemicals and heavy metals• Waste: urban and industrial waste production and treatment• Biodiversity loss• Landscape deterioration• Natural and technological risk• Noise and human health
Environmental impacts affect the furniture in environmental goods andservices consumed by consumers or used as input by producers.Example of direct and indirect environmental services provided byecosystems:• Direct production of oxygen, water, fresh food, fodder and fertilizer,
genetic resources, fuel and energy, raw materials,• Indirect services as regulation of hydrological cycle, water catch-
ments and groundwater recharge, regulation of climate, storage andrecycling of nutriment, biomass production, production of top soils,assimilation of waste, maintenance of biological diversity and so on.
1 An internal effect can be directly observed on markets (through the variation of price and quantity) or in the decision-making process, whileexternal effects arise when the economic behaviour of an individual (or a firm) affects the behaviour of another (individual or firm), withoutany economic compensation or transaction from the former to the latter. In economics, pollution or resource depletions are often analysedwith the help of the externality concept.
The monetary measure of a change in an individual’s well beingdue to a change in environmental quality is called the total eco-nomic value of the change. Total economic value of a resourcecan be divided into use values and non-use values:Total economic value = use values + non-use values.
Use values include benefits from physical use of environmentalresources, such as a recreational activity (sport fishing) or pro-ductive activities (agriculture and forestry). Option value takesplace in this category, even if concerning only future uses. Itstems from the combination of the individual’s uncertaintyabout future demand for the resource and uncertainty about itsfuture availability. Non-use values refer to the benefits indivi-duals may obtain from environmental resources without directlyusing them. For example, many people value tropical ecologicalsystems without directly consuming or visiting them. The com-ponents of non-use values are existence value and bequestvalue. Existence value measures willingness to pay for a resour-ce for some “moral”, altruistic or other reason and is unrelatedto current or future uses. Bequest value is the value that the cur-
rent generation obtains from preserving the environment forfuture generations. Non-use values are less tangible than usevalues since they often do not refer to a physical consumption ofgoods and services.
Values are directly linked to ecological services produced byecosystems, which support them. For example, fishery dependson ecological productivity of water ecosystem as wetlands.Water availability is linked to the entire hydro geological cycleand groundwater quality depends on the filtering capacity ofsoils. A reduction in the provision of ecological services (by pol-lution for example) will be likely to depreciate values expressedby people on environmental quality with, as a final result, adecrease of social benefits associated with.
It is important to understand that economic value does not mea-sure environmental quality per se, rather it reflects people’s pre-ferences for that quality.Evaluation is “anthropocentric” in that it relates preferencesheld by people.
Total economic value
Total economic value (TEV)
Use Non-use
Direct use Indirect use Option value Bequest value Existence value
Goods andservicesDirectly
consumed
Functionalcurrent benefits
Future uses Futuregeneration
consumption
FixedValues on
non-use value
• food• wood and biomass• recreation• health• education• sport
• production function
• ecological function
• recreation• regulation
function
• maintenance of ecologicalfunctions
• production of biodiversity
• maintenance of landscape
• famous species and ecosystems
• irreversible change• maintenance of life support
function
Tangibility

change, instead of spending money inbuilding renovation, owners would pre-fer sell and move away for example;
• Averting behaviour may have other bene-ficial effects which are not consideredexplicitly, sound isolation for examplemay also reduce heat loss from a home;
• Much defensive expenditure is often notcontinuous and not a reversible decisionbut is rather discrete and irreversible, suchas double-glazing which is expensive toremove once installed. In that context, itcould be difficult to measure other futurevariations of environmental quality.
For these reasons the method often over orunder estimates benefits associated withenvironmental quality changes.
2. Dose-response functionsThe dose-response technique aims to esta-blish a relationship between environmentalimpacts (the response) and physical envi-ronmental impacts as pollution (the dose).The technique is used when the dose-response relationship between the cause ofenvironmental damage, such as air or waterpollution, and the impacts, morbidity dueto air pollution or water contamination by
chemical products for example, is wellknown. The technique takes natural scienceinformation on the physical effects of pol-lution and uses this in an economic modelof evaluation. Economic evaluation will beperformed by estimation, through a pro-duction or a utility function, of the firmprofit variations or the individual revenuegains or losses.
The two steps of the method are:
• The calculation of the pollutant dose andreceptor function, and
• The economic evaluation by the choiceof an economic model.
To assess the monetary gain or loss of bene-fits due to the variation in environmentalquality requires the analysis of biological andphysical processes, their interactions with theeconomic agent decisions (consumer or pro-ducer) and the final effect on welfare.
The major fields of application of themethodology are the evaluation of losses(in crops for example) due to pollution, thepollution effects on ecosystems, vegetationand soil erosion and the impacts of urbanair pollution on health, materials and buil-dings. The approach cannot estimate non-use value.
3. Hedonic price methodThe hedonic price technique analyses exi-sting markets for goods and services whe-re environmental factors have an influen-ce on the price. Hedonic price approach ismost often used in analysing the effect of
115
E.3 What do we do measuring monetary benefits?
availability, will increase pressures on bio-diversity and reduce the general air qualityrelated to the traffic cars in the area. As aresult, each of these impacts will reduce theprovision of environmental services byecosystems and will lower economic bene-fits, such as farm activity, landscape con-sumption and other recreational activitiesassociated with the economic use of thearea. On the other hand, investments inwaste treatment facilities will decreaseenvironmental negative impacts on soiland water and will increase economicbenefits related to the furniture of highquality environmental services to econo-mic agents (consumers and producers).
Not taking into account environmentalimpacts, through the calculation of asso-ciated externalities, will lead to an over orunder estimation of social benefits of theproject and will induce bad economicdecisions.
E.3 What do we domeasuring monetarybenefits?In practice, economic evaluation tries toreveal (or state) individual willingness topay (or to receive) for benefits associatedwith use (consumption) of environmentalgoods and services. The aim of evaluation isto appraise total economic value, conside-ring explicit use and implicit non use values.The core concept of the methodology is theconcept of consumer (or producer) surplus.
When environmental service markets areavailable, the easiest way to measure econo-mic value is to use the actual related marketprice. For example, when marine pollutionreduces fish catches, market values for thelost harvest are easily observed on fish mar-ket. When there is no “market”, the pricecan be derived through non-market evalua-tion procedures. This is the case for exam-ple in measuring the social cost of urban airpollution since no market can be associatedwith air pollution. There are two broadapproaches to evaluation, each comprisingseveral different techniques (see figure): theindirect approach seeks to infer preferencesfrom actual, observed market-based infor-mation, the direct approach is based on thesimulation of market goods and uses sur-vey and experimental methods.
1. Averting expenditures and avoided costs When changes in the quality of the envi-ronment occur, firms’ and households'reactions can be observed through themoney they spend to mitigate the impacts.For instance, expenditure or sound insula-tion can indicate householders’ evaluationof noise reduction and expenditures inbuilding renovation might reflect the bene-fits of reduced air pollution. Avertingexpenditures are used for evaluation ofenvironmental degradation and avoidedcosts are rather used for the evaluation ofenvironmental quality improvements.Several problems are associated with themethod:
• Individuals or firms may undertakemore than one form of averting beha-viour in response to any environmental
114
E.3 What do we do measuring monetary benefits?
Valuation approachesand techniques
Direct methods
Surrogate markets Hypothetical Markets
Avertingexpenditures
Hedonic prices
Travel costs
Contingent valuation
Dose response
Indirect methods
Infrastructure
Environmental impacts on water, soil, air and biodiversity
Damagefunction
Marginalcost for
mitigatingthe impacts
(€/unit)
Total ofpopulation
(or re-ceptors)involved
Damage on materials,buildings, crops
or other receptors
Total averting expenditures
Benefits associated withthe environmental quality
Example of use of an hedonic price for aneconomic evaluation on the noiseDue to the extension of an airport, the indices of noise B in the neigh-bourhood area increase by 10 points (so ∆B is assumed to be equal to10). For a number L of 15000 houses located in this area, an averagevalue V of 100000 € and for an elasticity of depreciation e equal to 0,5,the social cost of noise would be calculated as follow:
C = ∆B x e x V x L
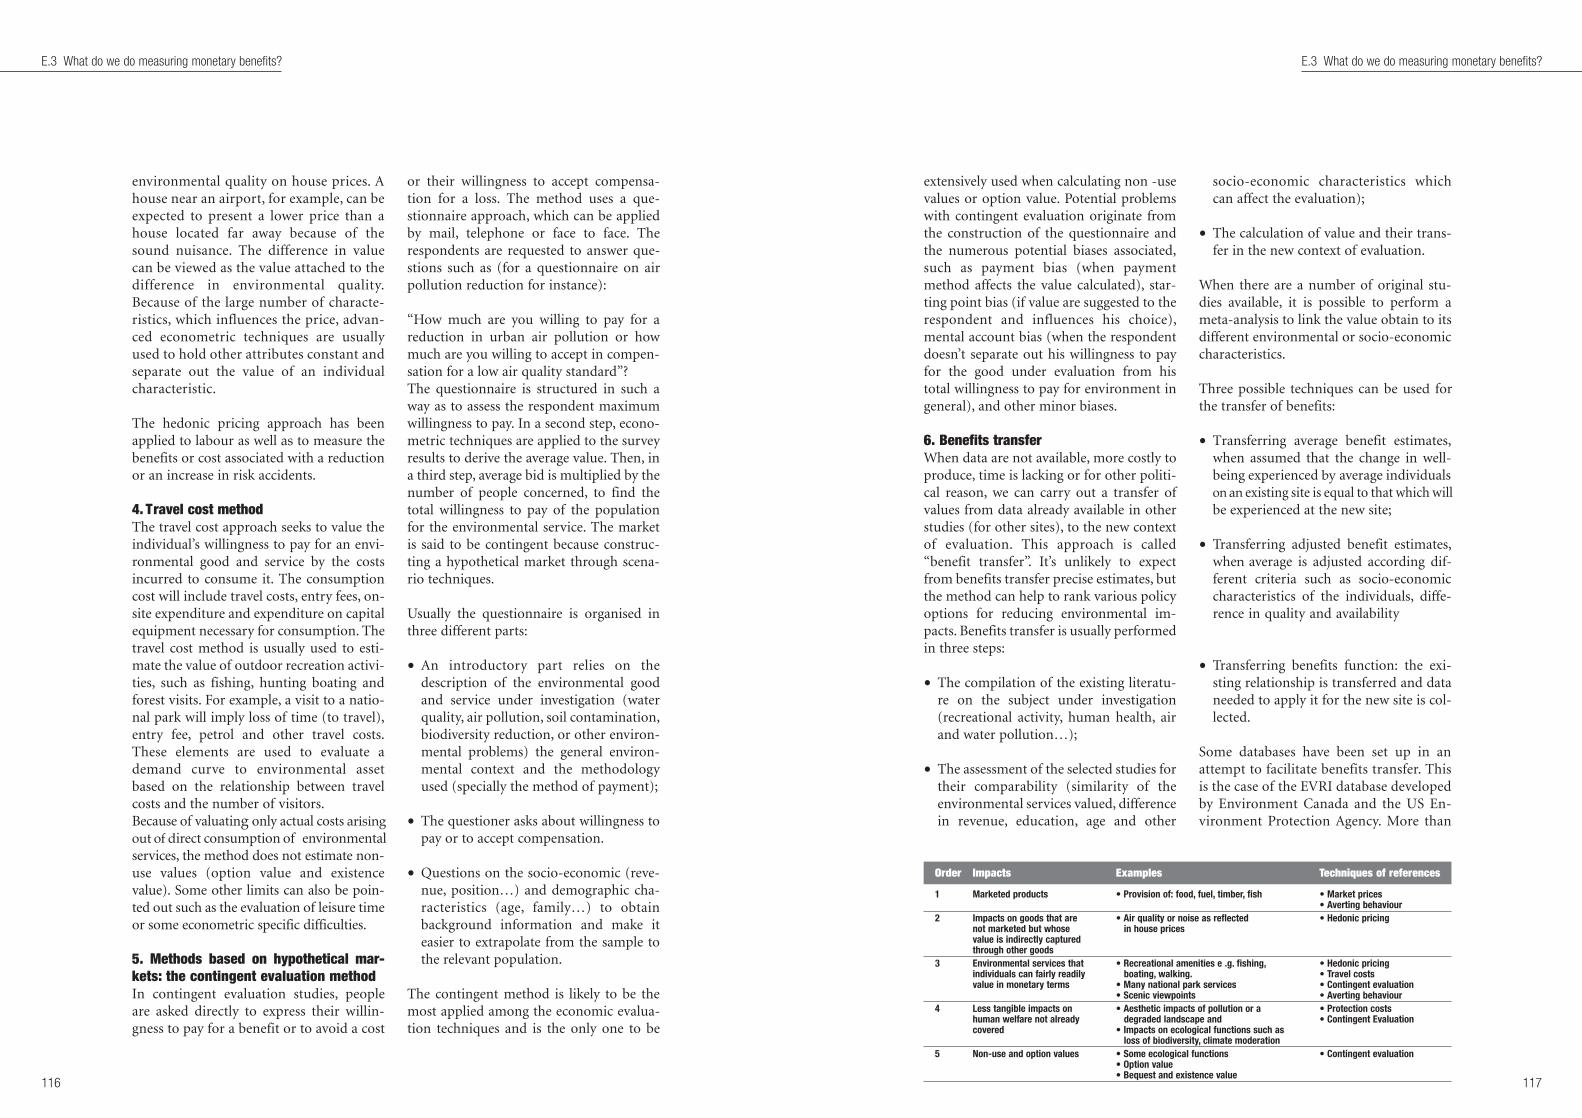
extensively used when calculating non -usevalues or option value. Potential problemswith contingent evaluation originate fromthe construction of the questionnaire andthe numerous potential biases associated,such as payment bias (when paymentmethod affects the value calculated), star-ting point bias (if value are suggested to therespondent and influences his choice),mental account bias (when the respondentdoesn’t separate out his willingness to payfor the good under evaluation from histotal willingness to pay for environment ingeneral), and other minor biases.
6. Benefits transferWhen data are not available, more costly toproduce, time is lacking or for other politi-cal reason, we can carry out a transfer ofvalues from data already available in otherstudies (for other sites), to the new contextof evaluation. This approach is called“benefit transfer”. It’s unlikely to expectfrom benefits transfer precise estimates, butthe method can help to rank various policyoptions for reducing environmental im-pacts. Benefits transfer is usually performedin three steps:
• The compilation of the existing literatu-re on the subject under investigation(recreational activity, human health, airand water pollution…);
• The assessment of the selected studies fortheir comparability (similarity of theenvironmental services valued, differencein revenue, education, age and other
socio-economic characteristics whichcan affect the evaluation);
• The calculation of value and their trans-fer in the new context of evaluation.
When there are a number of original stu-dies available, it is possible to perform ameta-analysis to link the value obtain to itsdifferent environmental or socio-economiccharacteristics.
Three possible techniques can be used forthe transfer of benefits:
• Transferring average benefit estimates,when assumed that the change in well-being experienced by average individualson an existing site is equal to that which willbe experienced at the new site;
• Transferring adjusted benefit estimates,when average is adjusted according dif-ferent criteria such as socio-economiccharacteristics of the individuals, diffe-rence in quality and availability
• Transferring benefits function: the exi-sting relationship is transferred and dataneeded to apply it for the new site is col-lected.
Some databases have been set up in anattempt to facilitate benefits transfer. Thisis the case of the EVRI database developedby Environment Canada and the US En-vironment Protection Agency. More than
117
E.3 What do we do measuring monetary benefits?
environmental quality on house prices. Ahouse near an airport, for example, can beexpected to present a lower price than ahouse located far away because of thesound nuisance. The difference in valuecan be viewed as the value attached to thedifference in environmental quality.Because of the large number of characte-ristics, which influences the price, advan-ced econometric techniques are usuallyused to hold other attributes constant andseparate out the value of an individualcharacteristic.
The hedonic pricing approach has beenapplied to labour as well as to measure thebenefits or cost associated with a reductionor an increase in risk accidents.
4. Travel cost methodThe travel cost approach seeks to value theindividual’s willingness to pay for an envi-ronmental good and service by the costsincurred to consume it. The consumptioncost will include travel costs, entry fees, on-site expenditure and expenditure on capitalequipment necessary for consumption. Thetravel cost method is usually used to esti-mate the value of outdoor recreation activi-ties, such as fishing, hunting boating andforest visits. For example, a visit to a natio-nal park will imply loss of time (to travel),entry fee, petrol and other travel costs.These elements are used to evaluate ademand curve to environmental assetbased on the relationship between travelcosts and the number of visitors.Because of valuating only actual costs arisingout of direct consumption of environmentalservices, the method does not estimate non-use values (option value and existencevalue). Some other limits can also be poin-ted out such as the evaluation of leisure timeor some econometric specific difficulties.
5. Methods based on hypothetical mar-kets: the contingent evaluation methodIn contingent evaluation studies, peopleare asked directly to express their willin-gness to pay for a benefit or to avoid a cost
or their willingness to accept compensa-tion for a loss. The method uses a que-stionnaire approach, which can be appliedby mail, telephone or face to face. Therespondents are requested to answer que-stions such as (for a questionnaire on airpollution reduction for instance):
“How much are you willing to pay for areduction in urban air pollution or howmuch are you willing to accept in compen-sation for a low air quality standard”?The questionnaire is structured in such away as to assess the respondent maximumwillingness to pay. In a second step, econo-metric techniques are applied to the surveyresults to derive the average value. Then, ina third step, average bid is multiplied by thenumber of people concerned, to find thetotal willingness to pay of the populationfor the environmental service. The marketis said to be contingent because construc-ting a hypothetical market through scena-rio techniques.
Usually the questionnaire is organised inthree different parts:
• An introductory part relies on thedescription of the environmental goodand service under investigation (waterquality, air pollution, soil contamination,biodiversity reduction, or other environ-mental problems) the general environ-mental context and the methodologyused (specially the method of payment);
• The questioner asks about willingness topay or to accept compensation.
• Questions on the socio-economic (reve-nue, position…) and demographic cha-racteristics (age, family…) to obtainbackground information and make iteasier to extrapolate from the sample tothe relevant population.
The contingent method is likely to be themost applied among the economic evalua-tion techniques and is the only one to be
116
E.3 What do we do measuring monetary benefits?
Order Impacts Examples Techniques of references
1 Marketed products • Provision of: food, fuel, timber, fish • Market prices• Averting behaviour
2 Impacts on goods that are • Air quality or noise as reflected • Hedonic pricingnot marketed but whose in house pricesvalue is indirectly capturedthrough other goods
3 Environmental services that • Recreational amenities e .g. fishing, • Hedonic pricingindividuals can fairly readily boating, walking. • Travel costsvalue in monetary terms • Many national park services • Contingent evaluation
• Scenic viewpoints • Averting behaviour 4 Less tangible impacts on • Aesthetic impacts of pollution or a • Protection costs
human welfare not already degraded landscape and • Contingent Evaluationcovered • Impacts on ecological functions such as
loss of biodiversity, climate moderation 5 Non-use and option values • Some ecological functions • Contingent evaluation
• Option value• Bequest and existence value

119
Affordability is an important issue in evalua-ting investments projects, especially in somecountries. Income streams will for instancetake the form of charges for environmentalservices, such as water supply or waste dispo-sal. A project affordability analysis will helpassess the ability of consumers to pay at leasta share of the proposed charges and contri-bute to operating and maintenance expendi-tures, as well as assess the effect of the chargeson demand. A Polish study has estimated that4% of household income for water use is theupper limit of affordability for consumers.Another importan issue is to take redistributi-ve effect into account in evaluating an invest-ment project, especially in some regions.When project evaluation is carried out fromthe point of view of the public sector, distribu-tive equity could be one of the themes of thesocial welfare function that should influencethe choice of public intervention. For examplean intervention that contemplates changes intariffs influences the distributive profiles.There are two methods for taking the distri-butive effects into account.The first is to attribute so-called welfareweights (see section on multicriterion analy-sis). This approach allows the social objectivesof the public planner to be incorporated inthe shadow prices. The accounting Euro isweighted to take the distributive effects ondifferent social groups into consideration.The correction is then included in the subse-quent step for the economic analysis.Public redistributive preferences in this caseare expressed by weighting1 the aggregatedper-capita consumption (or income) for thevarious consumer groups. When there isincome disparity, one Euro at the margindoes not have the same value for individualswith different incomes (that is it has a diffe-rent weight in public evaluation). Let us con-
sider a society made up of two groups of indi-viduals, one rich group and one poor, wherethe income of the poor group is half that ofthe rich group. An increase of one Euro in theprice of a consumer good (or a tariff for theuse of a public service) does not have thesame social effect for both groups. In fact itmay have double the impact (from the welfa-re point of view) on the poorer group. Thepublic planner expresses his redistributiveintent if he considers the consumption of thepoorer group be more important than that ofthe richer group. Thus, if we wish to expressthis effect in monetary terms, the accountingunits can be weighted by distributiveweights, considering 1 Euro for every Euro ofthe poor group and 0.5 Euro for every Euroof the rich group. At this point one can recal-culate the effects of the project including the-se considerations in the economic analysis.The second method for evaluating the redi-stributive impact is impact analysis: as wasthe case with the environmental analysis, aseparate study is carried out of the redistribu-tion of income that the project involves. Oneconstructs an indicator of social inequality(for example a Gini index2 of the consump-tion structure) and one calculates whetherthe project determines a gain or a loss interms of equity. The result is then processedas a multicriteria analysis tool (see par. 2.6).
Affordability and evaluation of distributive impact
Annex F
1 These weights are not comparable with weight used for multicriteria analysis expressing preferences of the public body for social objectives.
2The Gini index incorporates the more detailed shares data into a single statistic which summarizes the dispersion of the income shares acrossthe whole income distribution. The Gini coefficient may be expressed as a proportion or as a percentage. The Gini coefficient will be equalto 0 when the distribution is completely egalitarian. If the society’s total income accrues to only one person/household unit, leaving the restwith no income at all, then the Gini coefficient will be equal to 1, or 100%.
Tab. 2 Example distributive impact analysiswith Gini index
Gini index Without With Impactproject project
Project A 0.6 0.7 +Project B 0.6 0.5 -
700 studies are currently available in thedatabase, but only a minority are Euro-pean in origin, this still reduce the usabi-lity of the database in a European contextof evaluation.
Except perhaps transfer analysis, the use ofthe methodologies reviewed above, willdepend on the socio-economic context, onthe type of environmental impacts studiedand other characteristics such as the costand the time for carrying out a new eval-uation in a new site.
The list below shows the main types of costsand benefits that a cost-benefit analysisshould appraise. When you move down thelist, it becomes harder to derive robust esti-mations of the value people place in thegood and there will probably be more dis-agreement with the use of evaluations basedon the public’s preferences. Consequently,as you move down the list, other methodo-logies of evaluation which take into accountassessed ethical considerations, such aspublic consultation or multi-criteria analy-sis, are likely to be accepted more easily bystakeholders, with a greater consensus thananalysis with monetary values.
E.4 The different stepsof an environmentalcost-benefit analysisMonetary analysis is usually split in diffe-rent steps, which are the following:
1. The definition and the technical descrip-tion of the different options of the project.Useful information is likely to be availablein the feasibility studies and should beenough to state the technical and socio-economical context of the project;
2. The assessment of environmental impactsand damages to the ecosystem and humanhealth associated with the different scena-rios available. For major projects anEnvironmental Impacts Analysis is usuallyrequired and will contain enough infor-mation on the most important localimpacts on air, water and soil pollution.
3. The description of external effects andeconomic agents affected directly or indi-rectly by the environmental impacts ofthe project. The idea is to describe moreaccurately the relationship between theprovision of environmental services byecosystems and the social benefits derivedfrom their consumption. A list of peopleinvolved must be set up at this stage.
4. The choice of an evaluation method andthe validation of the monetary value cal-culated. The most satisfactory method ofevaluation will be chosen, which dependson the type of project, on the environ-mental goods and services and on thegeneral socio-economic and politicalcontext. In an ideal evaluation procedu-re, stakeholders would validate calculatedvalues in order to assure a consensus onthe methodology selected.
5. The choice of a discount rate and theestimation of the environmental netbenefit of the project. The use of a lowdiscount rate is sometimes justified bythe fact that environmental impacts pro-duce negative effects in the long term.Some people argue for a zero discountrate because of ethical considerations forfuture generations. In any case, wherestrong environmental impacts occur, alow discount rate (approximately 3 or 5%) should be selected in order to inclu-de some ethical principles such as theprecautionary principle.
118
E.4 The different steps of an environmental cost-benefit analysis
Tab. 1 Example of weight for distributive impact
Polation Weight Benefits Distrib.(cf) impact
High income 0.5 1200 600Medium income 0.7 1000 700Low income 1 1500 1500Total 3700 2800

121
Table of contents of a feasibility study
120
A.1 Summary
Table of contents of a feasibilitystudy
Annex G
1.1 Project Promoters and Authorities1.2 Object of Analysis
1.2.1 Project Name1.2.2 Brief Description of the Project
1.2.2.1 Sector 1.2.2.2 Location1.2.2.3 Area Impacted by the Project (regional,
national, international..)1.3 Promoter’s Objectives 1.4 Previous Experiences with Similar Projects
1.5 Brief Description of the Appraisal Report 1.5.1 Authors of this Report 1.5.2 Scope of the Report. Ties to other Projects.1.5.3 Methodology of the Project Analysis.
1.6 Main Results of the Analysis1.6.1 Financial Returns1.6.2 Economic Returns1.6.3 Impact on Employment 1.6.4 Environmental Impact 1.6.5 Other Results
2.1 Salient Elements of the Socio-economic Context2.1.1 Territorial and Environmental Aspects2.1.2 Demographics2.1.2 Socio-cultural Elements 2.1.4 Economic Aspects
2.2 Institutional and Political Aspects2.2.1 General Political Outlook.2.2.2 Sources of Financing (specify if loans or grants); EU
tools (ERDF, BEI, CF, FSE, etc.); national authorities (cen-
tral goverments, regions, others); private individuals2.2.3 Financial Coverage on the part of the Afore-
mentioned Sources 2.2.4 Administrative and Procedural Obligations;
Decision-making Authorities for the Project;Territorial Planning Obligations; licences/permits;requirements for licences and incentives.
2.2.5 Expected times for: licences/permits; licen-ces/incentive to pay..
A.2 Socio-economic Context
3.1 Potential Demand Expectations3.1.1 Needs the Project Meets within a Set Period of Time3.1.2 Current and Future Trends in Demand 3.1.3 Demand Breakdown by Consumer Type3.1.4 Means of Purchase or Distribution 3.1.5 Specific Market Research: Results
3.2 Competition3.2.1 Supply Features of Similar Outputs3.2.2 Competitive Structure, if existing or can be foreca-
sted3.2.3 Success Factors
3.3 Proposed Strategy 3.3.1 Outputs 3.3.2 Prices3.3.3 Promotion3.3.4 Distribution3.3.5 Marketing
3.4 Estimate on the Percentage of Potential Use3.4.1 Sales Forecasts for the Project 3.4.2 Market shares, coverage of the shares of various
needsForecasting hypothesis and techniques
A.3 Supply and Demand of the Project’s Outputs
4.1 Description of Significant Technological Alternatives4.2 Selection of Appropriate Technology4.3 Buildings and Plants4.4 Physical Inputs for Production4.5 Personnel Requirements4.6 Energy Requirements4.7 Technology Providers
4.8 Investment Costs4.8.1 Planning and Know-how4.8.2 Buildings4.8.3 Machinery
4.9 Production Plan over the Project Time Horizon4.10 Combined Output Supply4.11 Production Organisation
A.4 Technological Alternatives and Production Plan
6.1 Ideal Requirements for the Location6.2 Alternative Options6.3 Choice of Site and its Characteristics
6.3.1 Climatic Conditions, Environmental Aspects (if rele-vant)
6.3.2 Site or Territory6.3.3 Transport and Communications6.3.4 Water and Electricity Provisioning
6.3.5 Waste Disposal6.3.6 Government Regulations6.3.7 Policies of the Local Authorities6.3.8 Description of the Pre-chosen Site (details in the
Appendix)6.4 Cost of Land and Site Preparation 6.5 Site Availability6.6 Infrastructure Requirements
A.6 Location
7.1 Analysis of Construction/Start-up Times (project cycle)7.1.1 Selection of Management Group for the Project7.1.2 Definition of Information System7.1.3 Negotiations for the Purchase of Know-how and
Machinery7.1.4 Building Planning and Contract Scheduling 7.1.5 Financing Negotiations7.1.6 Acquisition of Land and Licences
7.1.7 Organisational Structure7.1.8 Staff Hiring7.1.9 Personnel Hiring and Training7.1.10 Supply Agreements7.1.11 Distribution Agreements
7.2 Bar Graph (or PERT chart) of the main phases 7.3 Main Information on Execution Times to consider in
the Financial Analysis
A.7 Implementation
8.1 Basic Assumptions of the Financial Analysis8.1.1 Time Horizon 8.1.2 Prices of Productive Factors and Project Outputs 8.1.3 Real Financial Discount Rate
8.2 Fixed Investments8.3 Expenses before Production (Goodwill)8.4 Working Capital8.5 Total Investment8.6 Operating Revenue and Costs8.7 Sources of Financing
8.8 Financial Plan (a table showing cash flow for eachyear)
8.9 Balance Sheet (assets and liabilities) 8.10 Profit and Loss Account 8.11 Determining the Net Cash Flow
8.11.1 Net Flow to Calculate the Total Return on theInvestment (investments in the total project)
8.11.2 Net Flow to Calculate the Return on Shareholders’Equity or Funded Capital (public/private)
8.12 Net Present Value/Internal Rate of Return
A.8 Financial Analysis
5.1 Organisational Diagram 5.2 List of Personnel and Salary Parameters
5.2.1 Managers5.2.2 Office Workers5.2.3 Technicians5.2.4 Manual Workers
5.3 External Services
5.3.1 Administrative Staff5.3.2 Technicians5.3.3 Other
5.4 Hiring Procedures5.5 Training Procedures5.6 Annual Costs
(before and after project start-up)
A.5 Human Resources
10.1 Defining the Critical Variables with the help of theSensitivity Analysis
10.1.1 Supply/Demand Variables10.1.2 Output Variables10.1.3 Human Resources
10.1.4 Time and Implementation Variables10.1.5 Financial Variables10.1.6 Economic Variables
10.2 Best and Worse Case Scenario Simulation 10.3 Probability Analysis
A.10 Risk Analysis
9.1 Accounting and Discount Unit for the Cost-BenefitAnalysis
9.2 Social Cost Analysis9.2.1 Output Price Distortions9.2.2 Salary Distortions 9.2.3 Fiscal Aspects9.2.4 External Costs9.2.5 Non-monetary Costs, including Environmental
Aspects9.3 Analysis of social benefits
9.3.1 Output Price Distortions9.3.2 Social Benefits from Increased Employment 9.3.3 Fiscal Aspects 9.3.4 External Benefits
9.3.5 Non-monetary Benefits, including EnvironmentalAspects
9.4 Economic Rate of Return or Net Present Value of theProject in Monetary Terms
9.5 Additional Appraisal Criteria 9.5.1 Presentation of Results in terms of General
Objectives of European Union Policies9.5.2 Increase in EU Social Income 9.5.3 Reduction in the Disparities with regard to per capi-
ta GDP between EU regions9.5.4 Increase in Employment9.5.5 Improvement in the Quality of the Environment9.5.6 Other Objectives of the Commission, Regional and
National Authorities
A.9 Socio-economic Cost-Benefit Analysis

according to a predetermined calendarand on the basis of significant and repre-sentative indicators.
Mutually exclusive projects: projects that,by their nature, are such that if one is cho-sen the other one cannot be undertaken.
Programme: a co-ordinated series of diffe-rent projects where the policy frameworkproject purpose, the budget and the deadli-nes are clearly defined.
Project: it refers to an investment activityupon which resources (costs) are expendedto create capital assets that will producebenefits over an extended period of time,and that logically lends itself to planning,financing, and implementing as a unit. Aproject is thus a specific activity, with aspecific starting point and a specific endingpoint, that is intended to accomplish a spe-cific objective. It can also be thought of asthe smallest operational element preparedand implemented as a separate entity in anational plan or program. A project mayproduce benefits that can be valued inmoney terms or it may produce benefitsthat are intangible.
Project analysis: the analytical frameworkthat compares costs with benefits to deter-mine if, given the alternatives, a proposedproject will sufficiently advance the objecti-ves of the entity from whose standpoint theanalysis is being undertaken to justifyundertaking the project.
Project cycle: a sequence of the series ofnecessary and predefined activities carriedout for each project. Typically it is separa-ted into the following phases: program-ming, identification, formulation, finan-cing, implementation and evaluation.
Project evaluation: the last phase of theproject cycle. It is carried out to identify thesuccess factors and the critical areas inorder to understand and to diffuse the les-sons leant for the future.
Short run the time period in the produc-tion process during which the fixed factorsof production cannot be changed, but thelevel of utilization of variable factors canbe altered.
Financial analysisAccrual accounting: the method thatrecords revenues in financial statements forthe period during which the revenues areearned or realized, and expenses in theperiod incurred, regardless of whether thecorresponding cash transactions took placepreviously or subsequently.
Benefit-cost ratio: the present value of thebenefit stream divided by the present valueof the cost stream. When the benefit-costratio is used, the selection criterion is toaccept all independent projects with abenefit-cost ratio of one or greater whendiscounted at a suitable discount rate, mostoften the opportunity cost of capital. Thebenefit-cost ratio may give incorrect ran-king among independent projects, and can-not be used for choosing among mutuallyexclusive alternatives.
Cash basis accounting: the method ofrecording accounting transactions only whencash receipts or expenditures occur. It shouldbe distinguished from accrual accounting.
Constant prices: prices at a base year inorder to exclude inflation from economicdata. They may refer either to market pricesor shadow prices. They should be distin-guished from current prices.
Current prices: (Nominal prices) prices asactually observed at a given time. They referto prices that include the effects of generalprice inflation and should be contrasted toconstant prices.
Cut-off rate: the rate below which a projectis considered unacceptable. It is often takento be the opportunity cost of capital. The
123
Financial analysis
Basic glossary Accounting period: the interval betweensuccessive entries in an account. In projectanalysis, the accounting period is generallya year, but it could be any other convenienttime period.
Accounting unit: the measure that makes itpossible to add and subtract unlike items.Euro may be the unit of account for theappraisal of EU financed projects.
Appraisal: refers to the ex-ante analysis of aproposed investment project to determineits merit and acceptability in accordancewith established decision making criteria.
Ex ante evaluation: an evaluation carriedout in order to take the financing decision. Itserves to direct the project in the most cohe-rent and relevant way possible. It providesthe necessary base for the monitoring andsubsequent evaluations ensuring that, whe-rever possible, the objectives are quantified.
Ex post evaluation: an evaluation carriedout a certain length of time after the con-clusion of the initiative. It consists of verif-ying the impact effectively achieved by theinitiative compared to the overall objectivesand project purpose.
Feasibility study: a study of a proposedproject to indicate whether the proposal isattractive enough to justify more detailedpreparation.
Final evaluation: an evaluation carried outimmediately after the complete implemen-tation of the initiative and whose object is
the results obtained. It serves to establishwhether and to what extent the expectedresults have been achieved and what werethe factors for its success or failure.
Identification: it consists of the selectionof the possible intervention ideas for aninstrument project that will then be theobject of a specific pre-feasibility study.
Implementation: the intervention is car-ried out and the forecast activities of pro-duction or services become fully functio-nal. During this phase it will be necessary tostart the monitoring activity and, whenappropriate, the in itinere evaluation.
Independent projects: projects that in prin-ciple can all be undertaken at the sametime. These should be distinguished frommutually exclusive projects.
In itinere evaluation (on-going evalua-tion): an evaluation carried out concur-rently with the implementationin order to allow a re-orientation ofthe activity. It considers critically the firstresults that allow for an initial judgementto be made of the quality of the imple-mentation.
Long run: the time period relating to theprocess of production during which there istime to vary all factors of production, butnot sufficient time to change the basic tech-nological processes being used.
Monitoring: the systematic examinationof the state of advancement of an activity
Some key-words for projectanalysis
Glossary
122

Economic analysisAccounting prices: the opportunity cost ofgoods, generally different from actual mar-ket prices and from regulated tariffs. Theyshould be used in project appraisal toreflect better the real costs of inputs tosociety, and the real benefits of the outputs.Often used as a synonym of shadow prices.
Border price: the unit price of a tradedgood at the country’s border. For exports, itis the f.o.b. (free on board) price, and forimports, it is the c.i.f. (cost, insurance andfreight) price.
Conversion factor: a number that can bemultiplied by the domestic market price orvalue in use of a non traded item to convertit to an accounting price. In other words,actual prices are converted in shadow pri-ces, approximated by the use of ACB.
Cost-Benefit analysis: conceptual frame-work applied to any systematic, quantitati-ve appraisal of a public or private projectto determine whether, or to what extent,that project is worthwhile from a public orsocial perspective. Cost-benefit analysisdiffers from a straightforward financialappraisal in that it considers all gains(benefits) and losses (costs) regardless ofto whom they accrue. CBA usually impliesthe use of accounting prices. Results maybe expressed in many ways, includinginternal rate of return, net present valueand benefit cost ratio.
Distortion: a state in which the market pri-ce of an item differs from the price it wouldbring in the absence of government policyfailures or market failures. This generates agap between the opportunity cost of a goodand its actual price, e.g. monopoly pricing,externalities, indirect taxes, duties, regula-ted tariffs, etc.
Economic analysis: analysis that is under-taken using economic values, reflecting thevalues that society would be willing to pay
for a good or service. In general, economicanalysis values all items at their value in useor their opportunity cost to society (often aborder price for tradable items). It has thesame meaning of cost-benefit analysis.
Economic rate of return (ERR): an indexof the socio-economic profitability of aproject. It may be different from financialrate of return (FRR), because of price dis-tortion. ERR implies the use of accountingprices and the calculation of the discountrate that makes project benefits equal topresent costs, i.e. makes economic net pre-sent value (ENPV) equal to zero.
Externalities: in project analysis, an exter-nality is an effect of a project felt outside theproject, and consequently not included inthe valuation. In general, an externality issaid to exist when the production or con-sumption of a good or service by one eco-nomic unit has a direct effect on the welfareof producers or consumers in another unit.Externalities may be positive or negative.
Non-tradeable goods: goods that cannotbe exported or imported, e.g. local services,unskilled labour and land. In economicanalysis, non traded items are valued attheir marginal value product if they areintermediate goods or services or accordingto the willingness to pay criterion if theyare final goods or services.
Social discount rate: to be contrasted tofinancial discount rate. It attempts to reflectthe social view on how the future should bevalued against the present.
Socio-economic costs and benefits:opportunity costs or benefits for the eco-nomy as a whole. They may differ from pri-vate costs to the extent that actual pricesdiffer from accounting prices. (social cost =private cost + external cost).
Tradeable goods: goods that can be tradedinternationally in the absence of restrictivetrade policies.
125
Economic analysis
cut-off rate would be the minimum accep-table internal rate of return for a project orthe discount rate used to calculate the netpresent value, the net-benefit investmentratio, or the benefit-cost ratio.
Discount rate: the rate at which futurevalues are discounted to the present.Financial discount rate and economic dis-count rate may differ, in the same way thatmarket prices may differ from accountingprices, see economic analysis key-words.
Discounting: the process of adjusting thefuture value of a cost or benefit to the pre-sent by a discount rate, i.e. by multiplyingthe future value by a coefficient that decrea-ses with time.
Financial analysis: this allows for the accu-rate forecasting of which resources willcover future expenses. It allows one to : 1)verify and guarantee cash equilibrium(verify the financial sustainability), 2) cal-culate the indices of financial return of theinvestment project based on the net time-discounted cash flows, related exclusively tothe economic unit that activates the project(firm, managing agency).
Financial rate of return: the internal rateof return (see definition below) calculatedusing financial values and expressing finan-cial profitability of a project.
Internal rate of return: the discount rateat which a stream of costs and benefits hasa net present value of zero. Financial rateof return (FRR), when values are estima-ted at actual prices. Economic rate ofreturn, (ERR) when values are estimatedat accounting prices. The internal rate ofreturn is compared with a benchmark inorder to evaluate the performance of theproposed project.
Market price: the price at which a good orservice is actually exchanged for anothergood or service or for money, in which caseit is the price relevant for financial analysis.
Net benefit: the amount remaining after alloutflows have been subtracted from allinflows. Discounting the incremental netbenefit before financing gives a measure ofproject worth of all resources engaged; dis-counting the incremental net benefit afterfinancing gives a measure of project worthof the entity’s own resources or equity.
Net present value (NPV): the sum thatresults when the discounted value of theexpected costs of an investment are deduc-ted from the discounted value of theexpected benefits. Economic net presentvalue ENPV. Financial net present valueFNPV.
Opportunity costs: the value of a resour-ce in its best alternative use. For thefinancial analysis the opportunity cost ofa purchased input is always its marketprice. In economic analysis the opportu-nity cost of a purchased input is its mar-ginal value product in its best non projectalternative use for intermediate goodsand services, or its value in use (as mea-sured by willingness to pay) if it is a finalgood or service.
Real rates: rates deflated to exclude thechange in the general or consumption pri-ce level (for example real interest rates arenominal rates less inflation rate).
Relative prices: the exchange value of twogoods, constituted by the ratio between thequantity exchanged and their absolutenominal prices.
Residual value: the net present value ofassets at the final year of the period selectedfor evaluation analysis.
With and without project scenario:in project analysis, the relevant compari-son is the net benefit with the projectcompared with the net benefit without the project, in order to measure the addi-tional benefits that can be attributed to theproject.
124
Financial analysis

1 GeneralBelli, P., Anderson, J. R., Barnum, H.N,Dixon, J. A., Tan, J-P, 2001, Economic Analy-sis of Investment Operations. Analytical Toolsand Practical Applications, WBI, WorldBank, Washington D.C.,
Brent, R.J., 1996, Applied cost-benefit analy-sis, Cheltenham (UK), Edward Elgar.
Chervel M., 1995, L’évaluation économiquedes projets: Calcul économique publique etplanification: les methodes d’evaluation deprojets, nuova edizione, Publisud, Paris.
Conseil scientifique de l’évaluation, Mai1996, Petit guide de l’evaluation des politi-ques publiques, La Documentation Fran-çaise, Paris.
Dinwiddy C., Teal F., Principles of cost-bene-fits analysis for developing countries,Cambridge University Press, 1996.
Economic Development Institute, 1996,The economic evaluation of projects, WorldBank, Washington DC.
European Commission, 1997, Financial andeconomic analysis of development projects,Office for Official Publications of theEuropean Communities, Luxembourg.
European Commission, 2001, Project cyclemanagement, EuropeAid Co-operationOffice, Evaluation Unit, Brussells.
Florio, M., 1997, The economic rate ofreturn of infrastructures and regional po-licy in the European Union, in “Annals ofPublic and Cooperative Economics”,68:1.
G. Gauthier, M. Thibault, 1993, L’analysecoûts-avantages, défis et controverses, HEC-CETAI, Economica.
HM Treasury, 1997, Appraisal and evalua-tion in Central Government. The GreenBook, HMSO, London.
Imboden N., 1978, A management approachto project appraisal and evaluation with spe-cial reference to non-directly productive pro-jects, OECD, Paris.
Keeney, R.L., Raiffa, H., 1993, Decisionswith multiple objectives: preferences andvalue tradeoffs, Cambridge, CambridgeUniversity Press.
Kirkwood, C.W., 1997, Strategic decisionmaking: multiobjective decision analysis withspreadsheets, Belmont, Duxbury Press.
Kirkpatrick, C., Weiss, J., 1996, Cost BenefitAnalysis and Project Appraisal in DevelopingCountries, Elgar, Cheltennan.
Kohli, K.N., 1993, Economic analysis ofinvestment projects: A practical approach,Oxford, Oxford University Press for theAsian Development Bank.
Layard R., Glaister S. (eds), 1994, Cost Be-nefit Analysis, 2nd edition, Cambridge Uni-versity Press.
Little, I.M.D., Mirrlees, J.A., 1974, Projectappraisal and planning for developing coun-tries, London, Heinemann.
Mishan, E.J., 1994, Cost Benefit Analysis: aninformal introduction, 4th edition, New York,Routledge.
Bibliography
127
Willingness to pay: the amount consumersare prepared to pay for a final good or ser-vice. If a consumer willingness to pay for agood exceeds its price, the consumer enjoysa rent (consumer surplus).
Shadow prices see accounting prices.
Other evaluation elementsCost/effectiveness analysis: an appraisaland monitoring technique used when bene-fits cannot be reasonably measured inmoney terms. It is usually carried out by cal-culating the cost per unit of benefit andrequires that means exist for quantifyingbenefits but not necessarly for attaching amonetary price or economic value to thebenefits.
Chronogramme: a technique used to makea realistic and verifiable estimate of the timesnecessary, showing the critical points of theimplementation of the initiative. It definesthe logical-temporal links between thevarious activities of the initiative and esti-mates the time for the implementation itself.
Environmental impact analysis: analysisthat identify the effects on the environ-ment of any investment project. Thiswould include the forecasting of potentialpollution emissions, loss of visual amenity,and so on.
Impact analysis: an evaluation of thechange or the long term effect on societythat can be attributed to the action of inter-vention, linked to the achievement of theoverall objectives. It must be expressed inthe unit of measurement adopted to indica-te the problems it is meant to resolve.
Multicriteria analysis: an evaluationmethodology that considers many objecti-ves by the attribution of a weight to eachmeasurable objective.
Risk analysis: a study of the odds of theproject’s earning a satisfactory rate ofreturn and the most likely degree of varia-bility from the best estimate of the rate ofreturn. Although risk analysis provides abetter basis than sensitivity analysis for jud-ging the riskiness of an individual projector the relative riskiness of alternative pro-jects, it does nothing to diminish the risksthemselves.
Sensitivity analysis: the analytical techniqueto test systematically what happens to a pro-ject’s earning capacity if events differ fromthe estimates made about them in planning.It is a rather crude means of dealing withuncertainty about future events and values. Itis carried out by varying one element or acombination of elements and determiningthe effect of that change on the outcome.
Financial sustainability analysis: analysiscarried out in order to verify that financialresources are sufficient to cover all financialoutflows, year after year, for the whole timehorizon of the project. Financial sustaina-bility is verified if the cumulated net cashflow is never negative, during all the yearsconsidered.
SWOT analysis: briefly describes both theintrinsic characteristics of the initiative andthe context in which it is realised; enablingalternative development scenario to be analy-sed. It analyses the context in which oneintends to intervene and shows the internalfactors upon which to concentrate (strengths)or which need to be cancelled out (weaknes-ses), as well as the favourable (opportunities)or unfavourable (threats) external factors.
126
Other evaluation elements

carbon/energy tax, Sec (92) 1996, 23October 1992 Luxembourg, Office forOfficial Publications of the EuropeanCommunities.
Hewlett, James G., 1991, A Cost/BenefitPerspective of Extended Unit Service as aDecommissioning Alternative, in «EnergyJournal», Vol. 12 (0), “Special Issue”.
Newbery, D.M., 2000, Privatization, restruc-turing, and Regulation of network Utilities,The MIT Press.
OECD, 2000, World Energy Outlook 2000,Paris.
EnvironmentCoopers & Lybrand and the CSERGE., Costbenefit Analysis of the Different MunicipalSolid Waste Management Systems:Objectives and Instruments for the Years2000, European Commission, Final report,March 1996.
COWI Consulting Engineers and PlannersAS., A Study on the Economic ValuationExternalities from Landfill Disposal andIncineration of Waste, Final main report,European Commission DG Environment,October 2000.
Department of the Environment, 1994,Environmental Appraisal in GovernmentDepartments, in «British Reports».
Dixon, J.A., Scura, L.F., Carpenter, R.A.,Sherman, P.B., 1994, Economic Analysis ofEnvironmental Impact, seconda edizione,London, Earthsca Publications.
Eurostat, Waste generated in Europe - data1985-1997, European Communities,Luxembourg, 2000.
European Commission DG Environment.,Handbook on the Implementation of ECEnvironmental Legislation, 1999.
European Commission, 1997, Cost-Benefitanalysis of the different municipal solid waste
management system: objectives and instru-ments for the year 2000.
FAO, 1992, Economic assessment of forestryprojects impacts, Forestry papers n.103,Roma.
FAO, 1995, Valuating forests: context, issuesand guidelines, Roma.
Naurud, S., 1992, Pricing the EuropeanEnvironment, Scandinavian UniversityPress, Oslo.
Pearce, D. e altri, 1994, Project and PolicyAppraisal: integrating economics and envi-ronment, Paris, OECD.
RDC – Environment & Pira International,Evaluation of costs and benefits for the achie-vement of reuse and recycling targets for thedifferent packaging materials in the frame ofthe packaging and packaging waste directive,94/62/EC, Proposed draft final Report,European Commission, May 2001.
HealthCosta, C., Ramos, V., 1995, A Cost-Effectiveness Analysis of Prevention in theEstonia Health Project, Staff Appraisalreport, Washington D.C., World Bank.
Culyer, A.J., Wagstaff, A., 1992, QUALY ver-sus HYEs; A theoretical exposition, York,Centre for Health Economics.
Department of Health, 1995, PolicyAppraisal and Health, The Health of theNation, United Kingdom Government.
Donaldson, C., 1993, Theory and practice ofwillingness to pay for health care, University ofAberdeen, Health Economics Research Unit.
Gerard, K., 1991, A Review of cost-utilitystudies: Assessing their policy making rele-vance, University of Aberdeen, HealthEconomic Research Unit.
Gudex, C., Kind, P., Van Dalen, H., Durand,M.A., Morris, J., Williams, H., 1993,
129
Health
Pohl, G., Mihaljek, D., 1991, Uncertaintyand the discrepancy between rate of returnestimates at project appraisal and projectcompletion, Washington D.C., WorldBank.
Saerbeck R., 1990, Economic appraisal ofprojects. Guidelines for a simplified cost-benefit analysis, EIB Paper n.15, EuropeanInvestment Bank, Luxembourg.
Shofield J.A., 1989, Cost benefit analysis inurban and regional planning, Allen &Unwin, London.
Ward, W.A., Deren, B.J., D’Silva, E.H.,1991, The economics of project analysis: apractitioner’s guide, EDI technical mate-rials, World bank.
Weiss, C.H., 1998, Evaluation: methods forstudying programs and policies, Weiss,London, Prentice Hall.
World Bank, June 1994, An overview ofMonitoring and Evaluation in the WorldBank, Operations Evaluation Department,Washington D.C.
AgricultureDufumier, M. 1996, Les projets de déve-loppement agricole-Manuel d’expertise,Paris.
FAO, 1977, Guidelines for the Preparation ofAgricultural Investment Projects, InvestmentCentre, Roma.
Fao, 1992, Sociological analysis in agricul-tural investment project design, Roma.
FAO, 1995, Directives pour la conception etl’elaboration de projets d’investissementagricole, Document technique du centred’investissement n 7, Rome.
D’Arcy, D.C., 1992, The community toolbox.The idea, methods and tools for partecipa-tory assessment, monitoring and evaluatio-nin community forestry, communityforestry- Field manual 2, FAO, Rome.
Gittinger, JP., 1994, A World Bank Inter-American Institute for Cooperation onAgriculture (IICA) Glossary: annotated glos-sary of terms used in the economic analysis ofagricultural projects, Washington D.C.,World Bank Glossary.
OECD,1997, Enviromental indicators foragricolture, Paris.
EducationAA.VV., 2001, Budgeting, programme analy-sis and cost-effectiveness in educational plan-ning, Paris, OCSE.
Haveman, R., Wolfe, B., 1995, SuccedingGenerations. On the Effects of investments inChildren, New York, Russel Sage Foundation.
Heckman, J.J., 1998, What Should Be OurHuman Capital Investment Policy?, in«Fiscal Studies», Vol. 19 (2), maggio.
ILO, 1981, Procedures for the Design andEvaluation of ILO Project, maggio.
OECD, 1994, New technology and its impacton educational buildings, Paris.
OECD, 1995, Evaluation of the decisionmaking process in higher education: French,German, and Spanish experiences, Paris.
OECD, 2000, The appraisal of investment ineducational facilities, Paris.
Psacharopoulos, G., 1995, The Profitabilityof Investment in Education: Concepts andMethods, Washington,D.C., World Bank.
World Bank, 1995b, Guidelines on Eco-nomic Analysis of Educational Project, Wa-shington D.C.
EnergyCommission of the European Commu-nities. Directorate General for Energy,1993, Energy consequences of the proposed
128
Agriculture

Transport Interaction Models, London1999.
Department of the Environment, Transportand the Regions, The Welfare implications oftransport improvements in the presence ofmarket failure, London 1999.
Department of the Environment, Transportand the Regions, Transport and theEconomy, London 2000
Department of Transport, 1994, Valuationof Road Accidents, London.
ECMT, Efficient Transport for Europe:Policies for Internalisation of External Costs,Paris, 1998.
European Commission, CORINAIR,Working Group on Emission Factors, 1991
European Commission, DGVII, TRENENII STRAN Transport energy environment,Project No. ST-96-SC116 4th FrameworkTransport ResearchProgramme
European Commission, DGVII, PETSPricing European Transport System, ProjectNo. ST-96-SC172 4th FrameworkTransport Research Programme
European Commission, EURET Cost-benefit and multi-criteria analysis for newroad construction, 2nd Framework Pro-gramme
European Commission, EUNET Socio-eco-nomic and spatial Impacts of transports, 4thFramework Programme, 1998
European Commission, Transport Re-search, APAS, Strategic Transport, Cost-benefit and multi-criteria analysis for railinfrastructure, 15
European Commission, Transport Re-search, APAS , Cost-benefit and multi-crite-ria analysis for inland waterways infrastruc-ture, VII - 16
European Commission, Transport Re-search, APAS , Cost-benefit and multi-crite-ria analysis for nodal centres for goods, VII 17
European Commission, Transport Re-search, APAS , Cost-benefit and multi-crite-ria analysis for nodal centres for passengers,VII - 18.
European Commission ExternE core Appli-cation of critical loads, levels of sustaianbilityindicators, Joule III programme
European Commission, ExternE core Exter-nal costs of transport, Joule III programme
Galvez, T.E., Jara-Diaz, S.R., 1998, On theSocial Valuation of Travel Time Savings, in«International Journal of TransportEconomics», Vol. 25 (2)
Gwilliam,K.M., 1997, The Value of Time inEconomic Evaluation of Transport Projects:Lessons from Recent Research, Infra-structure Notes, Washington, D.C., WorldBank.
INFRAS-IWW, External Effects of Trans-port, 1994 and 2000
Mackay K., Evaluation Capacity Deve-lopment: A Diagnostic Guide and ActionFramework, The World Bank Group,Operations Evaluation Department,1999.
Ministry of Transportation and Highways,1992, The Economic Appraisal of HighwayInvestment, A Guidebook, Version 1.1,British Columbia, Canada.
Morisugi H., Hayashi Y. (editors),International comparison of EvaluationProcess of Transport Projects, Special Issue ofthe Journal of the World Conference ontransport research Society, Volume 7,Number 1, January 2000.
Nash, C.A., Preston, J., 1995, Appraisal ofrail investment projects: recent Britishexperience, in «Transport Reviews», n.11,Paris.
OECD, 1992, Recherche Routière.Consommation de carburant par les automo-biles dans des conditions de circulation réel-les, Paris, trad. it. in Quaderno n.59,Ministero dei Lavori Pubblici, 1992.
131
Transport
Comparing scaling methods for health statevaluations: Rosser revisited, York, Centre forHeath Economics.
Mooney, G.H., 1992, Economics, Medicine andHealth Care, Harvester, Hemel Hempstead.
OCDE, 1997, New directions in health carepolicy, Paris.
Parsonage, M., Neuberger, H., 1992,Discounting and health benefits, in «HealthEconomics, 1:71-6.
Robinson, R., 1993, Economic evaluationand health care: what does it mean?, BMJ.
Shortell, S.M., Richardson, W.C., 1978,Health Program evaluation, St. Louis,Missouri, The C.V. Mosby Company.
Industrial projects Fröhilich, E.A., 1994, The manual for smallindustrial business: project design andappraisal, Vienna, UNIDO.
Marton, K., 1995, Governments and indu-strialization: the role of policy intervention,Vienna, UNIDO.
UNIDO, 1995, Manual for the preparationof industrial feasibility studies, New York.
UNIDO, 1999, Industry for growth into thenew millennium, Vienna.
Tourism and entertainmentBeau, B., 1992, Developpement et amenage-ment touristiques, Rosny, Breal.
Clawson, M., Knetsch M., 1966, Economicsof outdoor recreation, Baltimore, JohnsHopkins University Press.
Courty, P., 2000, An Economic Guide toTicket Pricing in the Entertainment Industry,in «Recherches Economiques de Louvain»,Vol. 66 (2).
Echevin, C., Gerbaux, F., 1999, L’impacteconomique local du tourisme rural,(Economic Impact of Rural Tourism.With English summary.), in «RevueD’Economie Regionale et Urbaine», Vol.0 (2).
Frey, B., 2000, Arts and economics: Analysisand cultural policy, Heidelberg, Springer.
Ginsburgh, V., Menger, P.M., 1996,Economics of the arts: selected essays,Amsterdam, North Holland.
Hunter, C., Green, H., 1995, Tourism andthe environment: a sustainable relationship?,London ; New York, Routledge.
Inskeep, E., 1991, Tourism planning: anintegrated and sustainable developmentapproach, New York, Van NostrandReinhold.
Vellas, F., Becherel, L., 1995, Internationaltourism: an economic perspective, New York,St. Martin’s Press.
TransportAdler, H.A., 1971, Economic appraisal oftransport projects: a manual with case stu-dies, Bloomington Indiana University Press,riedizione Johns Hopkins, University Press,Baltimore, 1987.
Commissariat Général du Plan, Trans-ports: pour un meilleur choix des investisse-ments, La Documentation Français, Paris,1994.
Commission of European Communities,1992, Cost-benefits and multicriteria analy-sis for new road construction, Brussels, EuretProgram.
Department of the Environment, Transportand the Regions, Guidelines on the Metho-dology for Multi-Modal Studies, London2000
Department of the Environment, Transportand the Regions, Review of Land-use/
130
Industrial projects

133
OECD, 1994, Évaluation de l’impact des rou-tes sur l’enviroment, Paris.
OECD, 1995, Why do we need railways?,Paris.
European Commission, DG IA, PHARE,TINA, Transport Infrastructure NeedsAssessment, Appraisal Guidance, ViennaOctober 1999
Transport Research Laboratory, OverseasUnit, 1997, Value of time (Personal Traveland Freight Transport) 1992-1996,in Current Topics in Transport, vol.144, Crowthorne, Berkshire, UnitedKingdom.
Venables, A. and Gasiorek, M. The WelfareImplications of Transport Improvements inthe Presence of Market Failure, report toSACTRA, 1998.
World Bank, Operations EvaluationDepartment, Designing Project Monitoringand Evaluation, Lessons and Practices,Number 8, January 1996.
WaterCunning, R. et al., 1996, New evaluationprocedures for a new generation of waterrelated projects, World Bank.
FAO, 1994, Irrigation water delivery models,Roma.
Madanat, S., Humplick, F., 1993, A model ofhousehold choice of water supply system, in«Water Resource Research», 29(5).
Peacock, T., 1996, Guidelines for planningirrigation and drainage investment projects,Roma, Fao.
Renzetti, S., 1992, Evaluating the WelfareEffects of Reforming Municipal Water Prices,in «Journal of Environmental Economics &Management», Vol. 22 (2), marzo.
Rogers, P., 1992, Comprehensive waterresources management: a concept paper,Research working papers, WPS 879. Waterand sanitation, World Bank.
Winpenny J., 1994, Managing Water as aneconomic resource, London, Routledge.
132
Water

133
Addendum
The preparation of the Guide has involvedconsultation with different CommissionServices, the Member Statesrepresentatives on the Technical Group onEvaluation and the participants in internalseminars at DG Regio. The authors arevery grateful for a number of helpfulcomments and look forward to receivingfurther suggestions for any future follow-up of the Guide.Most comments have been considered inthe main text or in the Annexes. Someadditional remarks have been included inthe following, as a response to some of themost interesting questions raised duringthe consultation process.
GENERAL DEFINITIONS, CONTEXT,AND TECHNICAL ISSUES (Chapter 2)Spatial ImpactThe Guide does not offer a specificdiscussion about the spatial dimension ofproject analysis. This does not imply thatin some cases this study is not relevant.For example a project in one region mayspill over on other regions. There arespecific EU measures for transfrontierproblems, but it may occasionally happenthat a project in an Objective 1 region haspositive or negative effects on an Objective2 region or vice versa. Good projectidentification (par. 2.2.1), andcomprehensive discussion of externalities,including environmental impact, haveoften a spatial dimension that should betaken into account : economic analysisshould include spill over effects, wheneverthey accrue (e.g. a neighbouringmunicipality, region or state).As an example, according to a recent studyby Prof. Beutel, University of Konstanz,24% of financial resources of Objective 1for the six less developed regions willhave positive spill over also on other,more developed, EU regions. (see alsohttp://europa.eu.int/comm/regional_policy/sources/docgener/studies/study_en.htm).
Internal Rate of Return vs. Net PresentValueThe two criteria are usually equivalent,and while the NPV is in principle morereliable than IRR, it suffers from beingexpressed in money value rather than as apure number. However they offer thesame insight into expected projectperformance, provided that the discountrate used to compute the NPV is the sameas the required rate of return used to saywhether an IRR is “high” or “low”. Seepar. 2.5.5 and Annexes A, B.
ExternalityExternality as defined in the Glossary(Economic Analysis) and Par. 2.5.2 pointsto real project effects falling on thirdparties without compensation. The typicalexample of negative externality ispollution. Sometimes a “pecuniaryexternality” has been defined as anindirect impact of a project (or policy)through price changes. This Guide doesnot recommend the consideration underCBA of this kind of indirect effects. Insome cases some of the output of theproject are zero-priced, e.g. roads. In thiscase, we just suggest using shadow pricesof the direct benefit produced (e.g. timesaved), as if it were a positive externalityto the consumer, exactly as pollution is anegative externality that should beshadow-priced as well. Obviously one hasto avoid double counting these directbenefits and financial revenues whenprices are non-zero but are insteadpositive but below the opportunity cost(par. 2.5.3). This is a simplified, butsensible, approach to a complex issue:other kinds of externalities has beenidentified: for a history of the notion seePapandreou A., Externalities andinstitutions, Clarendon Press, Oxford,1994.
Shadow wagesThe Commission does not recommend aspecific shadow wage formula (see par.2.5.3). Shadow wages should reflect actualvalue of labour, under differentunemployment regimes. Usually, thehigher the unemployment, the lower theshadow wage, because there is excesslabour force available, whatever the

134
official (legal or contractual) wages. Thusshadow wages may differ amongcountries and regions. However withineach Member State similar formulasshould be used across regions. Resultsmay differ, because economic conditionsdiffer, but in principle the computingmethod should be consistent. Techniquesfor estimating shadow wages arecontained in several manuals cited in theBibliography (1. General).
ADDITIONAL REMARKS ONSPECIFIC SECTORSWaste treatmentThe list of possible environmental impactsof waste treatment projects (par. 3.1.6) ispurely indicative. Many different types ofimpacts are associated with wastetreatment facilities, not only incineratorsand landfills, and depend on external andinternal technical attributes of the plant,for example, geographical location of theplant, size of the plant and technologyused, type of environmental managementapplied, and so on.
On the socio-economic impact ofpollution (energy projects, transport, etc.)A helpful source of information is theExternE project, a comprehensive attemptto use a consistent methodology toevaluate the external costs associated witha range of different fuel cycles. The projectinvolves over 30 teams from researchinstitutes. The project has successfully: (1)developed an effective “bottom-up”methodology, (2) Assessed many differentfuel cycles consistently, (3) Made reliableassessments of marginal costs, (4)Identified the key externality issues.Impact assessment and valuation areperformed using ‘damage function’ or‘impact pathway approach’.Much information currently available onenvironmental externalities, as a result ofthe ExternE research project, is especiallyuseful for sections on transport, energyand industry and can obviously be seen asa source of illustration for methodologiespresented in annexe E “Monetaryevaluation of environmental services” ofthe manual. More information is availableon the project web site:http://externe.jrs.es/overview.html
Time horizon in energy transportdistribution and other projects.Par 3.4.4 states that 25-30 years may be anappropriate time horizon for some energyprojects. However for some components ofthe system a longer horizon may beappropriate. The indication of a timehorizon should be understood as aminimum, not as a maximum.
Ports and airportsThe Guide does not offer a specificdiscussion about the effects of port andairport development on inland connectingmodes. The text only mentions provisionof links, but the effect of increased port orairport traffic on all users of existing linkscould be an important issue for this kindof project.
Training infrastructuresPar. 3.7.1 offers an indicative list of specificobjectives for project appraisal. This listshould be viewed in conjunction with thediscussion in par. 3.5.5 where the Guidestates that the final socio-economicbenefits of the project are related toemployability and prospective earnings oftrainees. No educational project can bejustified without a sound analysis of itsimpact on the relevant segment of thelabour market.
Transport projectsIn the economic analysis of transportprojects (par 3.3.5) we discuss changes inconsumer surplus. We would clarify asfollows : consumer surplus is usuallymeasured in transport projects in terms ofgeneralised transport costs, which includeall costs perceived by consumers eithermonetary costs or time costs.In the context of our discussion in thatparagraph we should add that thedemand for transport may be rigid, but itcan shift between different modes.We do not discuss in this Guide modelsfor traffic generation forecasts, which is arather specialised and difficult researchfield. For a wider discussion on transportproject appraisal see Transports: choix desinvestissements et coût des nuisances,Commissariat général du Plan, Paris, Juin2001.

135
Water projectsWater demand may be price inelastic inthe short term and for some kind of uses,for example drinkable water, while in thelonger-term –when water is moreavailable and income raises- the priceelasticity for water can rise for other uses.Thus the analysis of demand shouldcarefully distinguish between kind of usesand forecast price elasticities (in the longerterm, e.g., users of irrigation water canswitch to more efficient forms of irrigationsuch as trickle systems).It is also important in some cases toconsider derived demand, that is demandof water derived from the demand of thefinal good or crop produced.In the discussion about shadow pricing ofwater projects, an alternative towillingness-to-pay is to forecast long runmarginal costs (including operation,maintenance, administration and a normalreturn on capital).
ForestryWe do not recommend using a specificdiscount rate for forestry or otherenvironment related projects. Someagencies in the EU Member Statessometimes use multiple discount rates fordifferent sectors and assign a lowerdiscount rate to forestry or other long termprojects. This practice is a shortcut, but isnot easy to justify: the best practice is totry to identify all the benefits of thisproject and include them in cost-benefitanalysis, without allowing them theimplicit premium implied by a lowerdiscount rate.
Forestry is typically associated withmultiple objectives. The list in par. 3.10.1 isjust indicative. In some cases, landscape,education and health benefits may beimportant. Investment in forestry in facttends to create multiple effects, includingnon-market effects associated with forestenvironments and landscapes,biodiversity, and outdoor recreationactivities. The former effect is enhancedwhen the project is located near cities,because forests may attract more visitors.However displacement effects from otherareas should be considered and the netimpact appraised.The time horizon for forestry projectsclearly varies with the particular speciesinvolved and with their rotation in asustainable cycle.There is a wide literature on the economicappraisal of forestry projects, particularlypromoted by FAO and the World Bank.Their web sites offer recent updates ofresearch in this area (seehttp://www.worldbank.org andhttp://www.fao.org/forestry/index.jsp).
BibliographyCost-benefit analysis literature is huge,and the small number of references in thisguide are just a sample, not necessarilyrepresentative of all strands of researchand experience in related publications,most of them in English and French.Readers interested in more comprehensiveor more specific reading may consulteconomic literature databases, such asEconlit.


