Online Continuing Education for Professional Engineers
Since 2009
PDH Credits:
6 PDH
Course No.:
PCF101
Publication Source:
US Corp of Engineers (Unified Facilities Criteria)
“Engineering and Design Precipitation/Coagulation/Flocculation”
EM 1110-1-4012
Manual No. 1110-1-4012
Release Date:
Nov. 2001
CECW-ET
DEPARTMENT OF THE ARMY U.S. Army Corps of Engineers Washington, DC 20314-1000
EM 1110-1-4012
Manual 15 November 2001 No. 1110-1-4012
Engineering and Design PRECIPITATION/COAGULATION/FLOCCULATION
1. Purpose. This engineer manual (EM) was written to provide guidance for determining if precipitation, coagulation, flocculation (PIC/F) systems are applicable and guidance on how to properly design, specify, and operate P/C/F systems to remove dissolved heavy metals from aqueous waste streams.
2. Applicability. This EM applies to HQUSACE/OCE elements and USACE commands with responsibility for Hazardous, Toxic and Radioactive Wastes (HTRW) projects.
3. Distribution Statement. Approved for Public release: distribution is unlimited.
4. References. Appendix A contains all references.
5. Discussion. USACE personnel responsible for design and review ofHTRW projects utilizing P/C/F technology will use this information. It is strongly recommended that input be sought from the appropriate technical staff for all phases of scoping, pre-design, design, and construction ofP/C/F systems. The involvement of in-house technical expertise is essential to providing a cost effective, high quality service to the customer.
FOR THE COMMANDER:
3 Appendices App A - References App B - List of Abbreviations App C - Design Examples
ROBERT CREAR Colonel, Corps of Engineers Chief of Staff
DEPARTMENT OF THE ARMY EM 1110-1-4012 U.S. Army Corps of Engineers CECW-ET Washington, DC 20314-1000 Manual 15 November 2001 No. 1110-1-4012
Engineering and Design PRECIPITATION/COAGULATION/FLOCCULATION
Table of Contents
Subject Paragraph Page CHAPTER 1 INTRODUCTION Background 1-1 1-1 Scope 1-2 1-1 CHAPTER 2 PRECIPITATION Introduction 2-1 2-1 Theory and Discussion 2-2 2-3 CHAPTER 3 HYDROXIDE PRECIPITATION Introduction 3-1 3-1 Advantages and Disadvantages of Hydroxide Precipitation 3-2 3-2 Hydroxide Precipitation Using Lime 3-3 3-2 Hydroxide Precipitation Using Caustic Soda 3-4 3-4 Hydroxide Precipitation Using Magnesium Oxide 3-5 3-6 Process Performance 3-6 3-6 CHAPTER 4 SULFIDE PRECIPITATION Introduction 4-1 4-1 Advantages and Disadvantages of Sulfide Precipitation 4-2 4-2 Soluble Sulfide Precipitation (SSP) 4-3 4-3 Insoluble Sulfide Precipitation 4-4 4-4 Calcium Sulfide Precipitation 4-5 4-6
EM 1110-1-4012 15 NOV 01 Subject Paragraph Page CHAPTER 5 CARBONATE PRECIPITATION Introduction 5-1 5-1 Advantages and Disadvantages of Carbonate Precipitation 5-2 5-1 Carbonate Precipitation Using Calcium Carbonate 5-3 5-2 Carbonate Precipitation Using Sodium Carbonate 5-4 5-3 CHAPTER 6 OTHER PRECIPITATION Introduction 6-1 6-1 Xanthate Precipitation 6-2 6-1 Combined Precipitation 6-3 6-2 CHAPTER 7 COAGULATION AND FLOCCULATION Introduction 7-1 7-1 Theory and Discussion 7-2 7-2 CHAPTER 8 COAGULANTS, POLYELECTROLYTES, AND COAGULANT AIDS Introduction 8-1 8-1 Inorganic Coagulants 8-2 8-1 Polyelectrolytes 8-3 8-3 Polyelectrolytes vs. Inorganic Coagulants 8-4 8-3 Coagulant Aids 8-5 8-4 Chapter 9 MIXING—GENERAL DISCUSSION AND THEORY Introduction 9-1 9-1 Rapid Mixing 9-2 9-2 Rapid Mixing Vessel Considerations 9-3 9-2 Flucculation Mixing/Agitation 9-4 9-3 Chapter 10 TREATABILITY TESTING Introduction 10-1 10-1 Determination of Optimum pH Level 10-2 10-1 Determination of Coagulant and Coagulant Aid Dosage Rates 10-3 10-2 Determination of Settling Rates 10-4 10-4 Determination of Sludge Characteristics 10-5 10-4 Oxidation Considerations (Iron and Manganese Removal) 10-6 10-5
EM 1110-1-4012 15 NOV 01 Subject Page APPENDIX A REFERENCES A-1 APPENDIX B LIST OF ABBREVIATIONS B-1 APPENDIX C DESIGN EXAMPLE C-1
iv
EM 1110-1-4012 15 NOV 01
LIST OF TABLES Subject Table Page Theoretical Solubilities of Hydroxides, Sulfides, and Carbonates of Selected Metals in Pure Water at 25°C. 2-1 2-3 Solubility Product Constant vs. Solubility 2-2 2-5 Advantages and Disadvantages of Hydroxide Precipitation 3-1 3-3 Comparison of Hydroxide Reagent Properties 3-2 3-7 Advantages and Disadvantages of Sulfide Precipitation 4-1 4-3 Advantages and Disadvantages of Carbonate Precipitation 5-1 5-2 Advantages and Disadvantages of Xanthate Precipitation 6-1 6-2 Relative Coagulating “Power” of Cations 7-1 7-2 Advantages and Disadvantages of Alternative Inorganic Coagulants 8-1 8-2 How Viscosity Varies with Temperature 9-1 9-1 EPA Assumptions Used to Develop Costs 13-1 13-1 Cost for Continuous Flow P/C/F System using Hydrated Lime 13-2 13-3 Cost of Continuous Flow P/C/F System using Soluble Sulfide Precipitation 13-3 13-4 Cost of Continuous Flow P/C/F System using Sodium Carbonate Precipitation 13-4 13-5
v
EM 1110-1-4012 15 NOV 01 LIST OF FIGURES Subject Figure Page Continuous Metals P/C/F System 2-1 2-1 Solubility of Metal Hydroxides and Sulfides as a Function of pH 2-2 2-2 Metal Chelate with EDTA 2-3 2-6 Typical Titration Curve for an Acidic Waste Stream 3-1 3-5 Xanthate Chemical Structure 6-1 6-1 Charge Neutralization (Coagulation) 7-1 7-1 Flocculation 7-2 7-2 Mechanisms of Coagulation and Flocculation 7-3 7-3 Jar Test Analysis 10-1 10-3 Alternating Flow Diversion Equalization System 11-1 11-1 Intermittent Flow Diversion System 11-2 11-2 Completely Mixed Combined Flow System 11-3 11-2 Completely Mixed Fixed Flow System 11-4 11-3 Turbine Mixer in a Baffled Tank 12-1 12-4 Propeller Mixer 12-2 12-5 Mixer Clarifier 12-3 12-6 Inclined Plate Clarifier 12-4 12-7
vi
EM 1110-1-4012 15 NOV 01
CHAPTER 1 INTRODUCTION 1-1. Background. Chemical precipitation is the most common technique used for treatment of metal-contaminated waters (Patterson and Minear 1975, EPA 625/8-80-003, EPA 600/8-80-042c, Peters et al. 1985, Patterson 1988). Chemical precipitation of heavy metals has long been used as the primary method of treating wastewaters in industrial applications, such as metal fin-ishing and plating. Owing to this past success, chemical precipitation is often selected to reme-diate hazardous, toxic, and radioactive waste (HTRW) sites containing ground water contami-nated by heavy metals or landfill leachate, or both. For the precipitation process to be effective, an efficient solids removal process must be employed. To separate the solid and liquid phases of the wastestream, coagulation, flocculation, and clarification or filtration, or both, are typically used along with precipitation. Precipitation/coagulation/ flocculation (P/C/F) systems are often used as a pre-treatment step to stop metals from interfering with subsequent treatment processes (e.g., UV–oxidation or air stripping). Depending on the required treatment standards, a P/C/F system may also be used as the final stand-alone treatment. 1-2. Scope. This EM addresses P/C/F systems and includes the following:
• General discussion of theory of precipitation, coagulation and flocculation. • Precipitation methods. • Discussion and comparison of coagulants and coagulant aids. • Pre-design treatability requirements. • Pre-treatment requirements. • Operational considerations. • Equipment requirements. • Specification preparation.
1-1
EM 1110-1-4012 15 NOV 01
CHAPTER 2 PRECIPITATION—GENERAL DISCUSSION AND THEORY 2-1. Introduction. All precipitation processes operate under the same fundamental chemical principles. Precipitation is a physical–chemical process, in which soluble metals and inorganics are converted to relatively insoluble metal and inorganic salts (precipitates) by the addition of a precipitating agent. Most often, an alkaline reagent is used to raise the solution pH to lower the solubility of the metallic constituent, and, thus, bring about precipitation.
a. For example, using caustic soda as the precipitating agent to lower the amount of soluble nickel by forming nickel hydroxide precipitate (“s” denotes solid precipitate) creates the follow-ing reaction: Ni+2 + NAOH = Na+ + Ni (OH)2 (s) Soluble Caustic Sodium Nickel Nickel Soda Hydroxide Precipitates, which are small or colloidal, are then coagulated, flocculated, settled, clarified, or filtered out of solution, leaving a lower concentration of metals and inorganics in the effluent. Figure 2-1 is a typical schematic of a metals P/C/F system.
Figure 2-1. Continuous metals P/C/F system.
2-1
EM 1110-1-4012 15 NOV 01
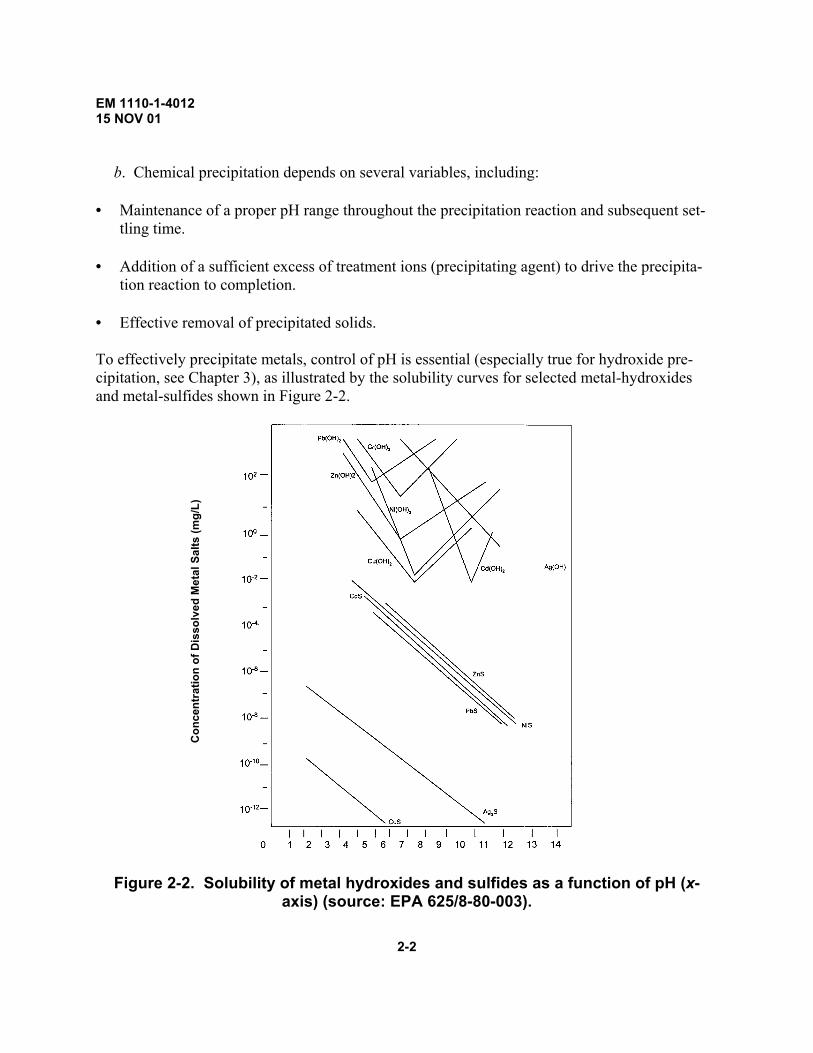
b. Chemical precipitation depends on several variables, including: • Maintenance of a proper pH range throughout the precipitation reaction and subsequent set-
tling time. • Addition of a sufficient excess of treatment ions (precipitating agent) to drive the precipita-
tion reaction to completion. • Effective removal of precipitated solids. To effectively precipitate metals, control of pH is essential (especially true for hydroxide pre-cipitation, see Chapter 3), as illustrated by the solubility curves for selected metal-hydroxides and metal-sulfides shown in Figure 2-2.
Con
cent
ratio
n of
Dis
solv
ed M
etal
Sal
ts (m
g/L)
Figure 2-2. Solubility of metal hydroxides and sulfides as a function of pH (x-
axis) (source: EPA 625/8-80-003).
2-2
EM 1110-1-4012 15 NOV 01
c. Hydroxide precipitation effectively removes cadmium, chromium(+3), copper, iron, man-
ganese, nickel, lead, and zinc (EPA, 1987). Sulfide precipitation effectively removes cadmium, chromium (+6), cobalt, copper, iron, mercury, manganese, nickel, silver, tin, and zinc. Carbon-ate precipitation effectively removes nickel, cadmium, lead and zinc.
d. Theoretical solubilities of selected metal-hydroxides, sulfides, and carbonates are listed in Table 2-1. Solubility is defined as the number of moles (or milligrams) of a solid (precipitate) that will dissolve in a liter of solution. This is an important concept to the designer, as it dictates the theoretical minimum concentration of soluble metals that will be present in the supernatant (clear effluent water) after the precipitation and clarification. Table 2-1 Theoretical Solubilities of Hydroxides, Sulfides, and Carbonates of Selected Metals in Pure Water at 25°C (All Units are mg/L) Metal As Hydroxide As Sulfide As Carbonate Cadmium (Cd2+) 2.3 × 10⁻⁵ 6.7 × 10⁻¹⁰ 1.0 × 10⁻⁴ Chromium (Cr+3) 8.4 × 10⁻⁴ No precipitate — Cobalt (Co2+) 2.2 × 10⁻¹ 1.0 × 10⁻⁸ — Copper (Cu2+) 2.2 × 10⁻² 5.8 × 10⁻¹⁸ — Iron (Fe2+) 8.9 × 10⁻¹ 3.4 × 10⁻⁵ — Lead (Pb2+) 2.1 3.8 × 10⁻⁹ 7.0 × 10⁻³ Manganese (Mn2+) 1.2 2.1 × 10⁻³ — Mercury (Hg2+) 3.9 × 10⁻⁴ 9.0 × 10⁻²⁰ 3.9 × 10⁻² Nickel (Ni2+) 6.9 × 10⁻³ 6.9 × 10⁻⁸ 1.9 × 10⁻¹ Silver (Ag+) 13.3 7.4 × 10⁻¹² 2.1 × 10⁻¹ Tin (Sn2+) 1.1. × 10–4 3.8 × 10⁻⁸ — Zinc (Zn2+) 1.1 2.3 × 10⁻⁷ 7.0 × 10⁻⁴ 2-2. Theory and Discussion. Precipitation alters the ionic equilibrium of a metallic com-pound to produce a relatively insoluble precipitate. In other words, it means inducing supersatu-rated conditions (i.e., the solubility-product constant, typically denoted as KSP, is exceeded). For the solid precipitate CaAb (s), the following general solubility expression can be written: CaAb (s) = aC + bA where
2-3
EM 1110-1-4012 15 NOV 01
Ksp = [C]a[A]b and [A] and [C] are in moles per liter. Note that solid precipitates do not enter into the solubility-product constant calculation. Ksp represents the maximum value the product that the ion concen-trations can have at equilibrium conditions for a given temperature. Therefore, for precipitation to take place, supersaturated conditions (non-equilibrium, by definition) must be present.
a. Given the following example equation, where Ni(OH)2 is a solid precipitate: Ni (OH)2 (s) Ni2+ + 2OH– Where Ksp = [Ni2+] [OH–]2 and Ksp = 1.6 × 10⁻¹⁶, at 25°C (Benefield et al., 1982). There exist two corollary statements, which relate to the solubility-product constant principle, that explain the phenomena of precipitation and solution of precipitates. These statements are as follows:
(1) Unsaturated Solution. In an unsaturated solution, the product of the molar concentra-tions of the ions is less than the solubility-product constant, or [Ni2+] [OH–]2 < Ksp. In this case, if undissolved Ni(OH)2 is present, it will dissolve to the extent that (Ni2+] [OH–]2 = Ksp.
(2) Supersaturated Solution. In a supersaturated solution, the product of the molar concen-trations of the ions is greater than the solubility-product constant, or [Ni2+] [OH–]2> Ksp. In this case, if internal forces allow formation of crystal nuclei, then precipitation will occur until the ionic concentrations are reduced equal to those of a saturated solution.
b. The designer should be aware that the relative solubilities of compounds cannot be pre-dicted by a simple comparison of the solubility-product constant values because of the squares and cubes that enter into the calculation. See Table 2-2, which gives solubility-product constant values and solubility values for examples of different types of precipitates. For example, note that the solubility-product constant, Ksp, for Cr (OH)3 is greater than Ca3 (PO4)2; however, Cr (OH)3 is less (more than 10 times less) soluble than Ca3(PO4)2. It is important to closely exam-ine the units used in the literature, as solubility is expressed in both moles/L and mg/L. A mole of a substance is its gram molecular weight (e.g., 1 mole of zinc is 65.4 g).
2-4
EM 1110-1-4012 15 NOV 01
Table 2-2 Solubility Product Constant vs. Solubility (Values are for 25°C) Salt Example Solubility Product, Ksp Solubility, S AB CaCO3 [Ca2+][CO3
c. Removal efficiencies (or solubilities) observed in actual practice will often differ (both higher and lower) considerably from theoretical solubilities. In most cases, actual solubilities will be greater than theoretical solubilities because of incomplete reactions, poor separation of colloidal precipitates, and the formation of soluble metal-complexes (metal-chelates) not con-sidered in the equilibrium model. However, actual solubilities may be lower than theoretical solubilities because of coprecipitation (Benefield et al., 1982).
d. Owing to the difficulty of theoretically predicting actual solubilities, it is essential that jar testing be conducted before the P/C/F system is designed to best simulate in-field conditions. Jar testing is discussed further in Chapter 10. A summary of factors that influence the solubility of metal ions and precipitates is given below.
(1) Complex Formation. Solubility relationships are generally much more complicated than what has been discussed earlier. Complex formation in wastewaters or natural waters must be considered to make realistic solubility calculations. Reactions of the cations or anions with water to form hydroxide complexes or protonated anion species are common. In addition, the cations or anions may form complexes with other materials in solution, thus reducing their ef-fective concentration. Soluble molecules or ions, which can act to form complexes with metals, are called ligands. Common ligands include OH–, CO3
2–, NH3, F–, CN–, S2O32–, as well as
numerous other inorganic and organic species. In complex formation equilibria equations, the formation constant is also known as the instability constant (often denoted as Ki in the literature). Waste streams containing complexing/chelating agents are often untreatable with established technologies (see Chapter 11). The following references discuss complex formation: Benefield et al. (1982), and Anderson (1994).
(2) Chelating Agents. The solubility of metal ions is also increased by the presence of chelating agents. A chelating agent forms multiple bonds with the metal ion. These bonds es-sentially form a ring in which the metal ion is held so that it is not free to form an insoluble salt. The “pinchers” of the chelating molecule consist of ligand atoms. Common chelating agents are ethylenediamine tetraacetic acid (EDTA, see Figure 2-3, where cobalt is the metal ion), citrate, and tartrate (see Chapter 11).
2-5
EM 1110-1-4012 15 NOV 01
Figure 2-3. Metal chelate with EDTA.
(3) Temperature. Solubility depends on temperature; solubilities of inorganic and metal
precipitates generally increase with increasing solution temperatures. The designer should be aware that Ksp and Ki values are valid for only a single temperature. References typically show Ksp and Ki values at 25°C. Ground water temperatures depend on geographical location and typically range from 4 to 10°C (40 to 50°F), in the northern U.S., to 10 to 25°C (50 to 75°F), in the southern U.S., in wells 10–20 m deep (Tchobanoglous and Schroeder, 1985).
(4) Coprecipitation. The actual solubilities of metal precipitates are lower than the theo-retical solubilities if coprecipitation occurs. When the presence and precipitation of other metals in solution aid in the removal of target metals through surface adsorption, it is called coprecipi-tation. An example of this is improved cadmium removal by adsorption onto calcium carbonate precipitates (Anderson, 1994). Coprecipitation is discussed further in the paragraph 6-3.
(5) Oxidation/Reduction. Certain metals may require oxidation (e.g., Fe2+ to Fe3+) or chemical reduction (e.g., Cr+6 to Cr+3) to change the valence state so that a particular precipita-tion method can be effective. Oxidation and reduction methods are further discussed in Chapter 11.
e. EPA lists the following advantages and limitations of the precipitation and coprecipitation processes:
2-6
EM 1110-1-4012 15 NOV 01
(1) Advantages.
• Processes are reliable and well proven. • Processes are relatively simple.
(2) Limitations. • Reagent addition must be carefully controlled to preclude unacceptable concentrations in the
effluent. • Efficacy of the system requires that solids be adequately separated (e.g., clarification,
flocculation, or filtration). • Process may generate hazardous sludge, requiring proper disposal. • Process can be costly, depending on the reagents used, and the required system controls,
sludge disposal methods, and operator time. • Process is not stable for large concentration variations in the influent. • Start-up and shut down times are longer than those for packed-bed and membrane processes.
f. Several precipitation methods are available for removing heavy metals. For industrial ap-plications, at least seven technologies have been demonstrated at full-scale, including the fol-lowing:
• Hydroxide precipitation. • Sulfide precipitation. • Carbonate precipitation. • Xanthate precipitation. • Combined precipitation. • Sodium borohydride (SBH) treatment. • Dithiocarbamate precipitation. In addition, there are many other chemicals that have not been demonstrated at full-scale, such as polysaccharides, which are believed to be effective in the removal of metals from wastewaters (EPA, 1989).
g. The following five precipitation processes are addressed within this Manual: • Hydroxide. • Sulfide. • Carbonate. • Xanthate.
2-7• Combined.
EM 1110-1-4012 15 NOV 01
CHAPTER 3 HYDROXIDE PRECIPITATION 3-1. Introduction. In hydroxide precipitation, soluble heavy metal ions are converted to rela-tively insoluble metal-hydroxide precipitates by adding an alkali-precipitating agent. The most common hydroxide precipitating agents are: • Caustic soda (NaOH). • Hydrated Lime (Ca (OH)2). • Magnesium Hydroxide (Mg(OH)2).
a. The first step is adding and thoroughly mixing the precipitating agent with the influent waste stream. Precipitation reactions, which originate in a rapid-mix tank to form metal-hydroxide precipitates, are given below, where M2+ is the soluble metal cation being removed. Chemical equations, for simplicity, show metals and other ions in their uncomplexed state.
(1) For Hydrated Lime. M2+ + Ca (OH)2 = M (OH)2 (s) + Ca2+
(2) For Caustic Soda. M2+ + 2NaOH = M (OH)2 (s) + 2Na+
(3) For Magnesium Hydroxide. M2+ + Mg (OH)2 = M (OH)2 (s) + Mg2+
b. The solubilities of the metal-hydroxide precipitates vary, depending on the metal ion being precipitated, the pH of the water, and, to a limited extent, the precipitating agent used. Typically, the solubilities of most metal-hydroxide precipitates decrease with increasing pH to a minimum value (termed the isoelectric point) beyond which the precipitates become more soluble, owing to their amphoteric (soluble in both acidic and basic solutions) properties. Figure 2-2 shows the solubility of various metal-hydroxide precipitates. The extent of precipitation depends on a number of factors, namely:
• The solubility product constant (Ksp) of the metal-hydroxide. • The equilibrium (stability) constants( Ki) of the metal-hydroxyl constants. • The stability constants of ligands or chelating agents (e.g., EDTA, citrate, tartrate, gluconic
acid, cyanide, or ammonia) that may be present.
3-1
EM 1110-1-4012 15 NOV 01 Metal ions effectively removed via hydroxide precipitation include cadmium, copper, trivalent chromium, iron, manganese, nickel, lead, and zinc. 3-2. Advantages and Disadvantages of Hydroxide Precipitation.
a. Removing metals via hydroxide precipitation has several advantages. Hydroxide precipi-tation is a well-established, simple technology, which is relatively inexpensive. It has proven its ability to achieve regulatory effluent limits for several metals, and it is well suited for automa-tion. In addition to heavy metals, hydroxide precipitation can also remove many non-metal pol-lutants, such as soaps and fluorides.
b. Hydroxide precipitation of heavy metals also has several disadvantages. Some metals, in-cluding lead, manganese, and silver, may not be adequately treated by hydroxide precipitation. Some metals require reduction before they can be precipitated as a hydroxide. For example, chromium (+6) must be first reduced to chromium (+3). Similarly, selenium (+6) should be re-duced to selenium (+4). Other metals may require oxidation before they can be effectively pre-cipitated as a hydroxide. For example, arsenic (+3) must be oxidized to arsenic (+5). Iron and manganese are other metals that require oxidation before they can be precipitated as a hydroxide. In addition, strong chelating agents, organo-metallic complexes, and metal-cyanide complexes inhibit the formation of the hydroxide precipitate, making it impossible to achieve minimum theoretical solubilities. Introducing a strong oxidant (e.g., ozone) before the precipitation step may destroy some of the metal complexes. Table 3-1summarizes the advantages and disadvan-tages of hydroxide precipitation.
3-3. Hydroxide Precipitation Using Lime. Treating waste streams containing metals with lime is the most common way that industrial wastes are treated (EPA, 1987). It is widely used because line is pumpable, has low cost, and is effective. A major disadvantage of the lime process is that large amounts of sludge are formed.
a. Lime is available in either high-calcium (CaO) or dolomitic (CaOMgO) form. These pure, oxidized products are called quicklime. Quicklime is available in lump (63–255 mm), pebble (6.3 to 63 mm), ground (1.45–2.38 mm), or pulverized (0.84 to 1.49 mm) forms. As lime parti-cle size decreases, experimental evidence has shown that dissolution rates increase (EPA, 1987). High-calcium hydrate is much more reactive than dolomitic hydrate. However, heat and agita-tion can be used to accelerate dolomitic hydrate reactivity.
3-2
EM 1110-1-4012 15 NOV 01
Table 3-1 Advantages and Disadvantages of Hydroxide Precipitation Advantages: Ease of automatic pH control. Well proven and accepted in industry. Relatively simple operation. Relatively low cost of precipitant. Disadvantages: Hydroxide precipitates tend to resolubilize if the solution pH is changed. Removal of metals by hydroxide precipitation of mixed metal wastes may not be effective because the minimum solubilities for different metals occur at different pH conditions. The presence of complexing agents has adverse effects on metal removal. Chromium (+6) is not removed by this technique. Cyanide interferes with heavy metal removal by hydroxide precipitation. Hydroxide sludge quantities can be substantial and are generally difficult to dewater because of their amorphous particle structure. Little metal hydroxide precipitation occurs at pH<6.
b. Although lime can be fed dry, it is most often slaked (hydrated) and slurried for the best ef-ficiency. The slaking process is carried out at temperatures of 82 to 99°C with 10- to 30-minute retention times. After slaking, a lime putty or paste is then slurried with water to a concentration of 10 to 35% (EPA, 1987).
c. Lime is mostly sold as quicklime, high-calcium, and dolomitic limes; however, lime is also available in its hydrated form—either Ca (OH)2 or Ca (OH)2-MgO. It is supplied in either bulk or in 23-kg (50-lb) bags. Hydrated lime is suitable for dry feeding or for slurrying and the re-sulting purities and uniformities are generally superior to slaked lime prepared on-site (EPA, 1987).
d. Since both quicklime and hydrated lime deteriorate in the presence of carbon dioxide and water, lime is typically stored in moisture-proof containers and used within weeks of manufac-ture. Dry hydrated lime can be stored for longer periods than can quicklime; however, carbona-tion may still occur, causing physical swelling, marked loss of chemical activity, and clogging of discharge valves and piping (EPA, 1987).
e. Dry lime feed systems are either manually fed 50-lb bags or they have an automatic mixing and feeding apparatus. The two types of automatic feed systems available are volumetric feed and gravimetric feed. Gravimetric systems discharge a known weight, whereas volumetric sys-tems deliver a known volume. Although gravimetric feeders can guarantee a minimum accuracy
3-3
EM 1110-1-4012 15 NOV 01 of 1% at the set rate, versus 30% for volumetric feeders, they are roughly twice as expensive and require more maintenance (EPA 430/9-79-18).
f. Lime precipitation is typically done under atmospheric conditions and at room tempera-tures. Adequate venting may be required because heat and noxious gases can be produced (EPA, 1987). The precipitation unit is typically a reinforced tank with an acid-proof lining. To promote the best mixing of the metals-containing waste stream and the lime (slurry) solution, the unit usually has an agitator installed. Often, vertical ribs are built into the perimeter of the unit to enhance mixing (also see Chapter 9). 3-4. Hydroxide Precipitation Using Caustic Soda. Pure anhydrous sodium hydroxide (NAOH) is a white crystalline solid manufactured primarily through the electrolysis of brine. Caustic soda (or caustic) is a highly alkaline sodium hydroxide solution. Caustic soda is com-monly used to precipitate heavy metals and to neutralize strong acids.
a. NAOH is available as either a solid or a liquid; however, it is used almost exclusively in a solution form of 50% or less. Caustic soda is available in lined 55-gal. drums or in bulk (tank car or truck). Caustic is easier to store, handle, and pump than is lime. In addition, it will not clog valves, form insoluble reaction products, or cause density control problems (EPA, 1987). However, in caustic storage areas where ambient temperatures are likely to fall below 12°C, heated tanks should be provided to prevent reagent freezing.
b. Caustic, after lime, is the most commonly used hydroxide-precipitating reagent. Its main advantage is that it rapidly dissociates into available hydroxyl (OH–) ions, resulting in minimal holdup time, and reducing feed system and tankage requirements. The main disadvantage of caustic is cost. Because caustic is a monohydroxide, precipitating divalent metals (e.g., cad-mium) requires two parts of hydroxide per part of divalent metal precipitated. In contrast, lime, a dihydroxide base, only requires one part hydroxide to do the same job. Increased reagent re-quirements, combined with a higher cost/mole (roughly five times that of hydrated lime), make caustic soda more expensive than lime.
c. Generally, lime is the reagent of choice in applications where reagent costs constitute the bulk of the operating expenses. However, in low flow applications where a reagent is selected on the basis of limited space, rapid reaction rates, and ease of handling, caustic is clearly superior (EPA, 1987). In addition, caustic will be a better choice when sludge disposal costs are high.
d. NAOH is approximately 100 times more soluble in water than lime (at 25°C). This re-duces the need for complex slaking, slurrying, and pumping equipment. Typically, caustic is added through an air-activated valve controlled by a pH analyzer (EPA, 1987). Caustic is added as long as the pH of the waste stream remains below the control set point required for optimum precipitation. Typically, a mechanical mixer agitates the waste stream to prevent excessive lag
3-4
EM 1110-1-4012 15 NOV 01
time between reagent addition and observable change in pH. Precipitation using caustic is typi-cally conducted under standard operating temperatures and pressures.
e. Caustic soda precipitation processes are set up on the basis of waste type, volume, and raw waste pH level and variability. For example, a system to precipitate concentrated acidic metals out of waste streams with low dead times (time interval between the addition of caustic—or an-other chemical—and its first observable effect on pH) would be set up as follows:
• A single reactor for feeds ranging in pH between 4 and 10. • A reactor plus a smoothing tank for feeds with pH fluctuating between 2 and 12. • Two reactors plus a smoothing tank for feeds with pH less than 2 or greater than 12 (EPA
600/2-81-148).
Although retention times vary with the rate of reaction and mixing, 15–20 minutes is a common range for optimal, complete precipitation. To maintain good process control, the dead time should be less than 5% of the reactor residence time (EPA 600/2-81-148). Typically, a caustic precipitation system is designed to have most of the reagent added in the preliminary precipita-tion stage, while a second stage acts as a smoothing or finishing tank. This enables the second reactor to compensate for pH control overshoots or concentrated batch dumps, which could overwhelm the primary precipitation system (Hoffman, 1972). Overshoot is caused primarily by a lack of buffering capacity in the solution. Figure 3-1 shows a typical titration curve for
Figure 3-1. Typical titration curve for acidic waste stream.
3-5
EM 1110-1-4012 15 NOV 01
neutralizing an acidic waste stream. The waste enters at pH 2.0, where the titration curve is steep and a strong demand for reagent exists; over- or under-correction is often unavoidable. For con-tinuous precipitation systems that process a waste stream that flows in at more than 20 gpm, with a pH that lies in the portion of the curve that is nearly vertical, pH control is often achieved in a second reactor to prevent the use of excess reagent or to prevent effluent discharge violations. 3-5. Hydroxide Precipitation Using Magnesium Oxide. An alternative to lime and caustic soda for hydroxide precipitation is magnesium oxide (MgO). It is available in slurry form typically prepared of 55 to 60% magnesium hydroxide (Mg(OH)2). The slurry must be mildly agitated during storage because of its low solubility (0.0009 g/100 mL) (EPA, 1987).
a. Magnesium hydroxide’s main advantage is that a more dense precipitate forms (because of longer reaction times). Thus, the sludge volumes are much smaller (about 50% less) than those of lime and caustic. In addition, use of magnesium hydroxide as the precipitating agent im-proves sludge handling and dewatering characteristics. Studies have shown that when influent metals concentrations are low, increased chemical costs will be offset by savings from easier sludge dewatering, compactness and greater stability (EPA, 1987). Also, mixing magnesium hy-droxide with caustic in a dual reagent system can reduce sludge amounts by almost 50% (EPA, 1987). As disposal costs for metal-hydroxide sludges increase, magnesium hydroxide becomes a favorable choice.
b. The main disadvantage of magnesium hydroxide is cost, which is approximately three times as much as hydrated lime. In addition, magnesium hydroxide precipitation systems are not as easy to operate as lime or caustic. Because of the slow reaction times, equipment-sizing re-quirements may prove to be very costly owing to higher retention time requirements.
c. Table 3-2 compares typical physical, chemical, and filtered sludge properties after use of hydroxide precipitating agents: caustic, lime, and magnesium hydroxide.
3-6. Process Performance. Performance among the three hydroxide precipitation methods does not vary significantly. The minimum metal-hydroxide solubilities attained by each method are approximately the same. However, as earlier discussed, sludge characteristics can vary tre-mendously. Figure 2-2 shows solubility curves for various metal-hydroxide precipitates at 25°C. Hydroxide precipitation can decrease several metals (e.g., chromium, nickel, cadmium, copper, and zinc) in solution to concentrations that are less than 1.0 mg/L. Suggested references that dis-cuss hydroxide precipitation performance summaries are Anderson (1994), EPA (1987), EPA 600/2-77-049, EPA 625/8-80-003, and EPA 600/8-80-042c. Anderson (1994) is especially good for summarizing how well the precipitation methods perform for mixed-metal solutions and so-lutions containing various complexing and chelating agents.
3-6
EM 1110-1-4012 15 NOV 01
Table 3-2 Comparison of Hydroxide Reagent Properties Property NaOH Ca(OH)2 Mg (OH)2 Molecular weight 40 74.1 58.3 Hydroxide content (%) 42.5 45.9 58.3 Heat of solution (kg-cal/mole) 9.94 2.79 0.0 Solubility (g/100 mL H2O) 42.0a 0.185a 0.0009b Reactive pH maximum 14.0 12.5 9.0 Weight equivalency 1.47 1.27 1.0 Freezing Point 16.0 0.0d 0.0e Solids content of sludge (%)f 30.0 35.0 55.0 Sludge density kg/m3 (lb/ft3) 1300
(80.0) 1400 (85.0) 1600–1750
(100–110) Filtration time (hr) 7–8 7–9 1.5–2.0 Sludge volume m3/metricton 5.0 (3.0) 4.2 (2.5) 2.2 (10.6) aTemperature, 0°C. bTemperature, 18°C. c50% solution. d30% slurry. e58% slurry. fSludge from a plate and frame filter press. gConsists of metal hydroxide and gypsum.
3-7
EM 1110-1-4012 15 NOV 01
CHAPTER 4 SULFIDE PRECIPITATION 4-1. Introduction. Sulfide precipitation works under the same basic principle as does hy-droxide precipitation. The precipitation process converts soluble metal compounds into relatively insoluble sulfide compounds through the addition of precipitating agents, such as: • Sodium sulfide (Na2S). • Sodium hydrosulfide (NaHS). • Ferrous sulfide (FeS). • Calcium sulfide (CaS). This technology is an effective alternative to hydroxide precipitation (Bhattacharyya et al., 1979; Ku and Peters, 1986; EPA 625/8-80-003; EPA 600/8-80-042c). Over a broad pH range, sulfides (S2–, HS–) are extremely reactive with heavy metal ions. Sulfide precipitation is used to remove lead, copper, chromium (+6), silver, cadmium, zinc, mercury, nickel, thallium, antimony, and vanadium from wastewaters (EPA, 1987). The precipitation reaction is generally induced under near neutral conditions (pH 7.0 to 9.0). In a way that is similar to hydroxide precipitation, metal-sulfide precipitates most often must be physically removed from solution (through coagulation, flocculation, and clarification or filtration), leaving a metal-sulfide sludge. a. Figure 2-2 shows the relative solubilities of metal-sulfides versus metal-hydroxides, in
water, as a function of pH. Increases in the sulfide ion concentration directly cause more metals to be precipitated (EPA, 1987). Sulfides, theoretically, will precipitate metals in preferential or-der (i.e., from lower Ksp to higher Ksp) (Talbot, 1984). For example, copper and lead (Ksp CuS = 1.2 × 10–37 and Ksp PbS = 7.0 × 10⁻²⁹) are some of the easiest metals to precipitate as sulfides, whereas manganese and iron (+2) (Ksp MnS = 7.0 × 10⁻¹⁶ and Ksp FeS = 4.0 × 10⁻¹⁹) are some of the most difficult (Benefield et al., 1982) b. Consider the sulfide precipitation reaction below, where soluble nickel is precipitated using
sodium sulfide (Na2S). Nickel sulfide (NiS) is the solid precipitate formed from this reaction. Again, equations are simplified by showing metals in their uncomplexed state.
The initial step in this process is to prepare a sodium sulfide solution. The solution is then added to a reaction tank, in excess, to precipitate the pollutant metal (Ni2+). Detention times vary; however, 30 minutes is common.
4-1
EM 1110-1-4012 15 NOV 01 c. A feedback control loop, using ion selective electrodes, typically controls this process
(EPA, 1987). Thickeners or clarifiers, or both, are often used to help separate the metal sulfides from the effluent. A final step typically employed in this process is to oxidate the excess sulfide ions in the supernatant using aeration or by adding hydrogen peroxide. d. Two major sulfide precipitation processes exist: soluble sulfide precipitation (SSP) and in-
soluble sulfide precipitation (ISP or “Sulfex”), the difference being the way in which the sulfide ion is introduced into the treatment process. SSP uses water-soluble reagents such as sodium hydrosulfide (NAHS) or sodium sulfide (Na2S), whereas ISP uses ferrous sulfide (FeS), which is only slightly water-soluble. Calcium sulfide (CaS) is sometimes used as an alternative to FeS. 4-2. Advantages and Disadvantages of Sulfide Precipitation. Sulfide precipitation of-fers several advantages over hydroxide precipitation. As earlier discussed, the principal advan-tage is the low metal-sulfide solubilities that can be obtained (see Figure 2-2). Secondly, with sulfide precipitation, good heavy metal removal is possible even with weak chelating agents pre-sent. Strong chelating agents such as EDTA will hinder the sulfide precipitation process some-what; however, metal will still be removed (Ku and Peters, 1986; Peters et al., 1985). Third, sul-fide precipitation can be operated over a wide pH range, typically from pH 2 to 12. Metal-sulfide precipitates are less amphoteric than corresponding metal-hydroxides, and, therefore, less likely to resolubilize because of changes in pH. Fourth, with the ISP process, there is no need to pre-treat chromium (+6), as reduction of hexavalent chromium is catalyzed by the ferrous ions (EPA 625/8-80-003, EPA 600/8-80-042c). Last, the sludge produced using sulfide precipitation is typically easier to dewater, and is less subject to leaching than metal-hydroxide sludges (Peters et al., 1984). a. Sulfide precipitation also has a few disadvantages. Although sulfide precipitation proc-
esses do not produce significant air emissions, they must be controlled (pH must be high enough) to prevent the release of toxic H2S gas to protect workers’ health. The Occupational Safety and Health Administration (OSHA) workplace concentration limit for H2S gas is 10 ppm. b. Sulfide precipitation does not effectively treat the trivalent states of iron or chromium. As
earlier discussed, chromium (+6) may be reduced to chromium (+3) by ISP; however, the proc-ess must be carried out under high pH conditions to allow the hydroxide precipitate of chromium (+3) to form. In addition, the ISP process does not treat manganese, as manganese sulfide has a higher solubility than ferrous sulfide. Also, sulfide precipitation does not adequately treat cyanide compounds. Therefore, pre-treatment of such compounds is required. A major concern with sulfide precipitation is the generation of metal-sulfide sludge. This sludge is considered toxic and hazardous under 40 CFR 261 (RCRA Waste Code F006). ISP produces more sludge (as much as three times) than does hydroxide precipitation.
4-2
EM 1110-1-4012 15 NOV 01
Table 4-1 Advantages and Disadvantages of Sulfide Precipitation Advantages: Attainment of a high degree of metal removal, even with low pH values (pH = 2 to 3). Low detention time requirements in the reactor owing to the high reaction rates of sulfides. Selective metal removal and recovery are feasible. Metal-sulfide sludge exhibits better thickening and dewatering characteristics than the corre-sponding metal-hydroxide sludge. Sulfide precipitation is less influenced by the presence of complexing and chelating agents than hydroxide precipitation. Metal-sulfide sludge is reportedly three times less subject to leaching at pH 5 than is metal- hydroxide sludge (Whang et al., 1981). Metal-sulfide sludges generally have smaller volumes (exception ISP) and are easier to dewater than corresponding metal-hydroxide sludge. Disadvantages: Potential for toxic hydrogen sulfide gas emissions. Potential for residual sulfide in treatment effluent. Soluble sulfide process may result in odor problem. Higher capital and operating costs than hydroxide precipitation. Process can be relatively complex. 4-3. Soluble Sulfide Precipitation (SSP). The SSP process uses two main precipitating agents: • Sodium sulfide (Na2S). • Sodium hydrosulfide (NaHS). a. Commercial sodium sulfide (light yellow or pink) crystallizes from aqueous solutions as
nonahydrate (Na2S.H2O). Sodium sulfide is sold as 30 to 34% fused crystals and 60 to 62% flakes (EPA, 1987). Owing to its corrosive nature, sodium sulfide can cause severe burns to eyes or skin, and can form toxic H2S gas when in contact with acid. The material is nonflammable, noncombustible, and nonexplosive (EPA, 1987). b. Commercial sodium hydrosulfide is highly soluble in water. When exposed to air, it is
converted to sodium thiosulfate and sodium carbonate. In the presence of organic matter, it can
4-3
EM 1110-1-4012 15 NOV 01 burn. Toxic H2S gas can be released by heating sodium hydrosulfide. Sodium hydrosulfide is sold as 70 to 72% by weight flakes (EPA, 1987). Tank trucks are typically used to ship the product in solution form, whereas drums are typically used when the product is in flake form. c. Because sodium sulfide and sodium hydrosulfide are highly soluble, there is no need for
slaking and slurrying equipment. Liquid form reagents are typically added from storage, whereas solid reagents are added from rapid-mix tanks (EPA 600/2-77-049). Reagent demand is typically determined through a specific-ion sulfide reference electrode pair, which is set to a se-lected potential (Kim, 1981). Sulfide reagent demand generally depends on the total metals con-centration. For continuous operations, where metals concentrations are fairly constant, electrode set points can be set at the potential, which corresponds to the maximum electrical potential sul-fide concentration gradient (Kim, 1981). As with all precipitating agents, jar testing should be used to determine optimal sulfide dosages. d. In the SSP process, high sulfide concentration typically causes rapid precipitation of metal
sulfides, which results in small particulate fines and colloidal particles that have poor settling characteristics and poor filterability. Through the effective use of coagulants and coagulant aids, separately or combined, this problem may be solved by forming large, fast-settling floc. e. The potential for excess sulfide is greatest when SSP is employed. Excess soluble sulfide
in the treated effluent may result in taste and odor problems, or present health or biotoxic haz-ards. The rate of evolution of H2S from a sulfide solution per unit of water/air interface depends on:
• Solution temperature (which determines the H2S solubility). • Concentration of dissolved sulfide. • pH (EPA 625/8-80-003).
Because measurement instruments typically have a lag in their response, and because reagent is added incrementally, fine-tuning and rigorous maintenance are required to control the concentra-tion of dissolved sulfide and pH to prevent an H2S problem (EPA, 1987). H2S problems can be eliminated by enclosing and vacuum evacuating the process tanks.
4-4
4-4. Insoluble Sulfide Precipitation (ISP). The ISP process, first patented as the “Sulfex” Process (Scott, 1979), removes dissolved metals by mixing the wastewater with an FeS slurry in a solid/liquid contact chamber. The FeS dissolves to maintain a sulfide ion concentration of ap-proximately 2 mg/L (EPA 600/2-77-049). Because of its instability, ferrous sulfide has to be generated on-site from sodium sulfide and ferrous sulfate. When other metals with lower equi-librium constants (Ksp) are present, the sulfide ion is released from the ferrous ion. The liberated ion will form a hydroxide, as well as a precipitate, when the pH is maintained between 8.5 and 9. The excess (unreacted) is then settled or filtered out of solution with the metal sulfide precipitate, leaving the effluent practically sulfide free (EPA, 1987). Coagulants and coagulant aids may be
EM 1110-1-4012 15 NOV 01
used to aid in the settling process. When FeS is added to a solution containing dissolved metals and metal hydroxide, the following reactions occur. FeS = Fe+2 + S–2 M+2 + S–2 MS M (OH)2 M+2 + 2 (OH–) Fe+2 + 2 (OH–) = Fe (OH)2
a. Typically, the ISP process requires 2 to 4 times the stoichiometric amount of FeS (EPA
625/8-80-003). Because of the very low solubility of FeS, using excess FeS stops toxic H2S gas from forming. However, the use of an excess amount of FeS adds significantly to the chemical cost of the process as well as sludge volumes. A considerably larger (up to 3 times that of lime precipitation) quantity of sludge is produced from this process because ferrous ions are added to the wastewater and they subsequently precipitate as ferrous hydroxide (Fe(OH)2) (Cushnie, 1984). Although FeS has a low solubility, residual sulfide levels could be in the range of 1 to 10 µg/L, possibly exceeding water quality criteria for marine organisms or drinking water (EPA, 1987). b. The following results were reported during jar test studies and pilot plant demonstration
tests that compared the Sulfex process to hydroxide precipitation (EPA 600/2-77-049):
(1) The Sulfex process produces lower residuals for copper, cadmium, nickel, and zinc than the hydroxide process.
(2) Satisfactory effluent quality is usually obtained with the Sulfex process within the 8.5 to 9.0 pH range, which is within the 6.0 to 9.5 pH range generally permitted by EPA for dis-charge.
(3) A particular metal is more effectively removed when it is in a solution containing other heavy metals rather than when it is the only metal in solution.
(4) The Sulfex process can be applied at loading rates up to 2.0 gpm/ft2 when tube or la-mella type settlers are used.
(5) The required dosage of ferrous sulfide depends on the type of waste being treated. Typically, for wastes free of complexing agents, dosage is normally 1.5 to 3 times the theoretical requirement. For wastes containing complexing agents, typical FeS dosages are 3, or more, times the theoretical dosage. 4-5
EM 1110-1-4012 15 NOV 01
(6) The following factors are important to obtaining satisfactory results with the Sulfex process:
• Concentration of ferrous sulfide solids in the mixing zone. • pH. • Effective use of coagulants and coagulant aids.
(7) It may be more economically prudent to pre-treat wastes containing high concentra-tions (above 50 mg/L) using hydroxide precipitation before “polishing” with the Sulfex process. 4-5. Calcium Sulfide Precipitation. As an alternative to using FeS, calcium sulfide (CaS) can be used as the precipitating agent (Kim, 1981; Kim and Amodeo, 1983). Using calcium sul-fide as the sulfide source can minimize some of the problems associated with soluble and insolu-ble sulfide precipitation (i.e., H2S evolution and excess reagent requirements). Solid calcium sulfide is typically slurried before it is added and it produces easily settable precipitates. Calcium particles act as nuclei for producing metal-sulfide precipitates and the dissolved calcium functions similarly to a coagulant. Calcium, added as CaS, is mostly dissolved after reaction and does not significantly add to the sludge volume. For this same reason, the CaS dosage requirement, unlike FeS, is near stoichiometric (EPA 600/2-77-049). a. Calcium sulfide is stable only in the dry, solid form. In aqueous solutions, CaS reacts with
water to produce Ca (HS)2 and Ca (OH)2 as follows: 2CaS + 2H20 = Ca (HS)2 + CA(OH)2 b. After CaS is added, the main reactions that precipitate metal sulfides are:
M+2 + HS– = MS + H+ H+ + OH– = H2O M+2 + S–2 MS
4-6
EM 1110-1-4012 15 NOV 01
CHAPTER 5 CARBONATE PRECIPITATION 5-1. Introduction. Dissolved heavy metals can be removed from wastewaters by direct pre-cipitation using a carbonate precipitating agent, such as soda ash (Na2CO3), sodium bicarbonate (Na(HCO3)2), or calcium carbonate (CaCO3). Carbonate precipitation is an effective treatment alternative to hydroxide precipitation. The solubilities of metal-carbonates depend on the spe-cific metal ion precipitated and the pH of the wastewater. Generally, the solubilities of metal-carbonates are intermediate between metal-hydroxide and metal-sulfide solubilities (see Table 2-1). a. Carbonate precipitation is oftentimes preferred over hydroxide precipitation for the re-
moval of cadmium, lead, and nickel. Industry prefers the precipitate cadmium carbonate to cad-mium hydroxide for metals recovery processes. Also, lead and nickel precipitation using cal-cium carbonate gives lower final residual metals concentrations than those of hydroxide. b. Carbonate precipitation processes are not significant sources of air emissions. However,
this technology may release gaseous CO2 if it is not operated correctly (EPA, 1987). In addition, the process produces metal-carbonates and metal-hydroxides, and the resulting sludge is classi-fied as a hazardous waste under 40 CFR 261 (Waste Code F006). Therefore, sludges from car-bonate precipitation processes may need to be encapsulated or fixed in some other way to stop the metals from leaching in an acidic environment. 5-2. Advantages and Disadvantages of Carbonate Precipitation. a. The main advantage of using carbonate precipitation is that it can operate at a lower pH
range, typically between 7 and 9 (EPA, 1987). At this range, adjusting pH after precipitation wouldn’t normally be required. Also, carbonate precipitation is competitively priced in relation to hydroxide precipitation, and carbonates form easily filterable precipitates. b. There are a few disadvantages of using carbonate precipitation. The treatment chemicals
used for this process tend to be abrasive and can damage feed equipment. In addition, the sludge produced in this process is gelatinous and difficult to settle, and pre-treatment of chromium (+6) by reduction is required. A summary of the advantages and disadvantages of using carbonate precipitation is shown in Table 5-1.
5-1
EM 1110-1-4012 15 NOV 01 Table 5-1 Advantages and Disadvantages of Carbonate Precipitation Advantages: Carbonate reagents are relatively easy to handle and can be obtained in bulk by railcar or truck in 100-lb bags. Calcium carbonate forms easily filtered precipitates. Sodium carbonate imparts buffering capacity and generates less sludge than lime precipitation. Optimum treatment occurs at lower pH conditions. Carbonate sludges generally have better dewatering characteristics than corresponding hydroxide sludges. Disadvantages: Because of slower reacting carbonate-based chemistry, retention times are longer. Carbonates do mix easily into solution and have the potential for evolving carbon dioxide, which, without aeration, will slow reaction times further. Calcium carbonate particles have the potential to become deactivated. Sodium carbonate sludges do not filter as readily, or to as high a solids content, as calcium-based sludges. Calcium carbonate is only able to achieve an operational pH range of 5–7. Chromium (+6) requires pre-treatment, by reduction, prior to using carbonate precipitation. 5-3. Carbonate Precipitation Using Calcium Carbonate. a. Limestone is available in either high calcium (CaCO3) or dolomitic (CaCO3 MGCO3) form.
Both types are available in powder or crushed stone form. Owing to its faster reaction rate and its more widespread availability, the high calcium form is more often used. Powder form is de-sirable because both reactivity and completeness of reaction increase proportionately to the available surface area (EPA, 1987). b. The primary advantage of limestone is the low cost and widespread availability of the re-
agent. The main disadvantage of calcium carbonate precipitation is that it is only effective for precipitating metal ions in its operational range (5.0 to 7.0) (EPA, 1987). Attempts have been made to use lime in combination with limestone as dual alkali. The limestone is used as a pre-treatment step to raise the pH to about 6.0, with lime completing the precipitation process. The limestone/lime process is typically more complicated than a simple lime process; however, in high volume applications, the savings in reagent may offset any increase in capital costs (EPA, 1987).
5-2
EM 1110-1-4012 15 NOV 01
5-4. Carbonate Precipitation Using Sodium Carbonate. Sodium carbonate (Na2CO3) is marketed most commonly as an anhydrous powder. Soda ash is an alternative to sodium hy-droxide for acidic-metals waste streams, which lack buffering capacity. Through the use of so-dium carbonate (a weak base), a buffering capacity will be imparted, thereby allowing pH to be controlled and precipitation to take place within the neutral range. Buffering agents produce a smaller change in pH per unit addition than comparable unbuffered reagents, such as lime and caustic. a. Precipitation, using soda ash, proceeds at much slower rates than comparable hydroxide
methods, such as lime or caustic. Accordingly, reactors should be sized to provide a minimum of 45 minutes of hydraulic retention time (EPA, 1987). Because soda ash is commercially available only in dry form, on-site batch mixing and solution preparation facilities, similar to those for hy-drated lime, are required (EPA, 1987). Because of its solubility, chemical solution feed strength of only 20% by weight can be maintained at ambient temperatures without salt recrystallization. To maintain homogeneity, continuous mixing of the solution feed is recommended. Materials suitable for handling the compound, or its solutions, include plastic, iron, rubber, and steel. So-dium carbonate is shipped in bags, barrels, or in bulk.
b. Soda ash provides the advantage of lower sludge generation rates (lower than using cal-
cium carbonate) since sodium-based end products are more soluble than calcium-based products. However, sodium-based sludges do not filter as readily or attain as high a solids content as cal-cium-based sludges. In addition, the supernatant may not be as low in metals content or total dissolved solids as when lime is used as the precipitating agent (EPA, 1987).
5-3
EM 1110-1-4012 15 NOV 01
CHAPTER 6 OTHER PRECIPITATION TECHNIQUES 6-1. Introduction. Other precipitation techniques discussed below include xanthate precipita-tion and combined precipitation. 6-2. Xanthate Precipitation. a. Heavy metals can also be removed from wastewaters by xanthate precipitation. Xanthate
precipitation is a relatively new technology compared to other precipitation methods. Xanthates are sulfonated organic compounds. The xanthate acts as an ion exchange material, where heavy metals ions are replaced with sodium and magnesium. Starch xanthate (SX) treatment has been demonstrated numerous times at full-scale, (EPA, 1989) and has proven ability to remove the following heavy metals: Cd2+, Cr3+ , CU3+, Fe2+, Pb2+, Mn2+, Hg2+, Ni2+, Ag+, Zn2+ (Anderson, 1994). For mixed-metal solutions, the hierarchy for selective removal of some cations and heavy metals by xanthate precipitation is in the following: Na << Ca-Mg-Mn < Zn < Ni < Cd < Pb < Cu-Hg. The xanthate-metal precipitation process can be represented as follows: NaOH ROCSSNA + M+ = ROCSS-M + Na+
or NAOH 2(ROCSSNa) + M2+ = (ROCSS)2M + 2Na+ where M+ and M2+ are the metal ions and NAOH indicates that the reaction occurs at a high pH (pH typically greater than 9.0). ROCSS represents the xanthate material with a chemical struc-ture shown in Figure 6-1, where “R” denotes any organic compound.
Figure 6-1. Xanthate chemical structure. b. Xanthate precipitation offers several advantages and disadvantages as outlined in Table 6-
1, below. Suggested references for xanthate precipitation include Anderson (1994), and EPA (1989).
6-1
EM 1110-1-4012 15 NOV 01 Table 6-1 Advantages and Disadvantages of Xanthate Precipitation Advantages: Xanthate precipitation offers a high degree of metal removal (most metals to < 0.1 mg/L). Less sensitivity to fluctuations in pH (i.e. metal xanthates do not exhibit amphoteric solubilities). Less sensitivity to the presence of complexing agents. Improved sludge dewatering properties. Capability to selectively remove metals. Disadvantages: At pH values of less than 3, xanthates decompose rapidly. Relatively large amounts of sludge are generated (up to 1000 times the weight of metal). Reagent shelf life is relatively short (approximately 7 days). 6-3. Combined Precipitation. With the exception of hydroxide precipitation, each precipi-tation method involves a combined precipitation system, because precipitations are generally performed at a particular pH. For example, when employing sulfide precipitation at pH levels greater than 6.0, hydroxide precipitation can also occur. Numerous bench scale treatability test-ing studies have been conducted using combined precipitation. A suggested reference summa-rizing the results of these studies is Anderson (1994).
6-2
EM 1110-1-4012 15 NOV 01
CHAPTER 7 COAGULATION AND FLOCCULATION 7-1. Introduction. Coagulation and flocculation are used to remove the insoluble and colloi-dal heavy metal precipitates formed during the precipitation step. Colloidal heavy metal precipitates are tiny particles that possess electrical properties, which create repelling forces and prevent agglomeration and settling. Coagulation is the process of making the particle less stable by neutralizing its charge, thus encouraging initial aggregation of colloidal and finely divided suspended matter. Particles no longer repel each other, and can be brought together.
a. When suspended in water, the charge on organic and inorganic colloids is typically nega-tive. Because of electrostatic forces, the negative colloid charge attracts positive ions. Figure 7-1 illustrates how coagulants reduce the electric charges on the colloidal surfaces, allowing colloi-dal particles to join.
Figure 7-1. Charge neutralization (coagulation).
b. Flocculation is the process of bringing together the destabilized or “coagulated” particles to form a larger agglomeration of floc by physical mixing or addition of chemical coagulant aids, or both. Figure 7-2 illustrates the bridging of agglomerated colloidal particles to form settable flocs.
7-1
EM 1110-1-4012 15 NOV 01
Figure 7-2. Flocculation. 7-2. Theory and Discussion. Zeta potential is a measurable quantity and is sometimes used to predict the potential for coagulation. Effective coagulation has been found experimentally to occur at zeta potential values ranging from ± 0.5 mV. More information on zeta potential is pre-sented in chapter 10. Inorganic compounds (typically iron and aluminum derivatives) are com-monly used as coagulants. During dissolution, the cations serve to neutralize the particle charge and the effective distance of the double layer, thereby reducing the zeta potential. In inorganic coagulants, a trivalent ion can be as much as 1000 times more effective than a monovalent ion. This is the reason that alum and iron salts are extremely efficient coagulants. Table 7-1 illus-trates the increasing coagulation “power” with cation reactivity. Table 7-1 Relative Coagulating "Power" of Cations Cation Relative Coagulating Power Na+ 1 Mg2+ 63 Al3+ 570
a. Colloids can also be destabilized through the addition of polyelectrolytes, which can bring the system to the isoelectric point without a change in pH.
b. These polyelectrolytes are 10 to 15 times more effective than alum as a coagulant; how-ever, they are considerably more expensive.
c. The coagulation and flocculation processes typically include the following four steps: • If necessary, adding alkalinity (bicarbonate has the advantage of providing alkalinity without
raising pH).
7-2
EM 1110-1-4012 15 NOV 01
• Adding the coagulant and coagulant aid to the influent after precipitation. • Rapid mixing of the coagulant throughout the liquid. • Adding the coagulant aid, followed by slow and gentle mixing to allow for contact between
small particles and subsequent agglomeration into larger particles. Coagulant aids typically require a short, rapid mix followed by gentle mixing (see Chapter 9). Figure 7-3 shows the mechanisms of the coagulation and flocculation processes.
Figure 7-3. Mechanisms of coagulation and flocculation.
d. The overall success of the coagulation and flocculation processes depends on the floccu-
lating and settling characteristics of the particles. The frequency of collisions between the parti-cles is directly proportional to the rate at which coagulated particles coalesce. The collision fre-quency is proportional to the concentration of particles and the difference in settling velocities. Because the total number of particle collisions increases with time, the degree of flocculation generally increases with residence time. The agglomeration of particles cannot be predicted
7-3
EM 1110-1-4012 15 NOV 01 from collision frequency alone. The rate of flocculation depends upon several factors, which include:
• The nature of the particle surface. • The presence of charges. • The shape of the particles. • The density of the particles.
7-4
EM 1110-1-4012 15 NOV 01
CHAPTER 8 COAGULANTS, POLYELECTROLYTES, AND COAGULANT AIDS 8-1. Introduction. Numerous chemicals are used in coagulation and flocculation processes. There are advantages and disadvantages associated with each chemical. The designer should consider the following factors in selecting these chemicals: • Effectiveness. • Cost. • Reliability of supply. • Sludge considerations. • Compatibility with other treatment processes. • Environmental effects. • Labor and equipment requirements for storage, feeding, and handling.
a. A suggested reference for summarizing the above factors is EPA (430/9-79-018), Chemical Aids Manual for Wastewater Treatment Facilities. For a more complete bibliography, see Appendix A, References.
b. Coagulants and coagulant aids commonly used are generally classified as inorganic co-agulants and polyelectrolytes. Polyelectrolytes are further classified as either synthetic-organic polymers or natural-organic polymers. 8-2. Inorganic Coagulants. The three main classifications of inorganic coagulants are: • Aluminum derivatives. • Iron derivatives. • Lime. With exception of sodium aluminate, all common iron and aluminum coagulants are acid salts and, therefore, their addition lowers the pH of the treated water. Depending on the influent's pH and alkalinity (presence of HC03–, C03
2–, and OH–), an alkali, such as lime or caustic, may be required to counteract the pH depression of the coagulant. This is important because pH affects both particle surface charge and floc precipitation during coagulation. The optimum pH levels for forming aluminum and iron hydroxide flocs are those that minimize the hydroxide solubility (EPA, 1987). However, the optimum pH for coagulating suspended solids does not always coin-cide with the optimum pH for minimum hydroxide floc solubility. Table 8-1 lists several common inorganic coagulants along with associated advantages and disadvantages.
8-1
EM 1110-1-4012 15 NOV 01 Table 8-1 Advantages and Disadvantages of Alternative Inorganic Coagulants Name Advantages Disadvantages Aluminum Sulfate (Alum) Al2(SO4)3.18H2O
Easy to handle and apply; most commonly used; produces less sludge than lime; most effective between pH 6.5 and 7.5
Adds dissolved solids (salts) to wa-ter; effective over a limited pH range.
Sodium Aluminate Na2Al2O4
Effective in hard waters; small dos-ages usually needed
Often used with alum; high cost; ineffective in soft waters
Polyaluminum Chloride (PAC) Al13(OH)20(SO4)2.Cl15
In some applications, floc formed is more dense and faster settling than alum
Not commonly used; little full scale data compared to other aluminum derivatives
Ferric Sulfate Fe2(SO4)3
Effective between pH 4–6 and 8.8–9.2
Adds dissolved solids (salts) to wa-ter; usually need to add alkalinity
Ferric Chloride FeCl3.6H2O
Effective between pH 4 and 11 Adds dissolved solids (salts) to wa-ter; consumes twice as much alka-linity as alum
Ferrous Sulfate (Copperas) FeSO4.7H2O
Not as pH sensitive as lime Adds dissolved solids (salts) to wa-ter; usually need to add alkalinity
Lime Ca(OH)2
Commonly used; very effective; may not add salts to effluent
Very pH dependent; produces large quantities of sludge; overdose can result in poor effluent quality
a. Aluminum Derivatives. Common aluminum coagulants include aluminum sulfate (alum),
sodium aluminate, and polyaluminum chloride. Dry alum is available in several grades, with a minimum aluminum content (expressed as %A1203) of 17%. Liquid alum is about 49% solution, or approximately 8.3% by weight aluminum as A1203. Alum coagulation works best for a pH range of 5.5 to 8.0; however, actual removal efficiency depends on competing ions and chelating agent concentrations.
(1) Sodium aluminate is an alternative to alum and is available in either dry or liquid forms, containing an excess of base. Sodium aluminate provides a strong alkaline source of wa-ter-soluble aluminum, which is useful when adding sulfate ions is undesirable. It is sometimes used in conjunction with alum for controlling pH.
8-2
EM 1110-1-4012 15 NOV 01
(2) Polyaluminum chloride (PAC), another aluminum derivative, is a partially hydrolyzed aluminum chloride solution. Although still not widely used, it has been reported to provide stronger, faster settling flocs than alum in some applications.
b. Iron Derivatives. Iron coagulants include ferric sulfate, ferric chloride, and ferrous sulfate (copperas). Compared to aluminum derivatives, iron coagulants can be used successfully over a much broader pH range of 5.0 to 11.0. However, when ferrous compounds are used, the solution is typically chlorinated before it is sent into the coagulation vessel. As this reaction produces both ferric chloride and ferric sulfate, chlorinated ferrous sulfate has the same field of usefulness as the other iron coagulants. Because ferrous sulfate works better in feeding devices, compared with the ferric coagulants, chlorinated copperas is sometimes preferred. The ferric hydroxide floc is heavier than alum floc and therefore settles more rapidly.
c. Lime. Although lime is primarily used for pH control or chemical precipitation, it is also commonly used as a co-coagulant. 8-3. Polyelectrolytes. Polyelectrolytes are water-soluble organic polymers that are used as both primary coagulants and coagulant aids. Polyelectrolytes are generally classified as follows: • Anionic—ionize in solution to form negative sites along the polymer molecule. • Cationic—ionize to form positive sites. • Non-ionic—very slight ionization. Polyelectrolyte primary coagulants are cationic, containing materials with relatively low-mo-lecular weights (generally less than 500,000). Cationic charge density (available positive-charged sites) is very high.
a. Coagulant aids, which are polyelectrolytes, may be anionic, cationic, or near-neutrally charged. Their molecular weights are relatively high (range up to 20,000,000). They function primarily through interparticle bridging.
b. The efficiencies of polyelectrolyte primary coagulants depend greatly on the exact nature of the turbidity particles to be coagulated, the amount of turbidity present, and the turbulence (mixing) available during coagulation. 8-4. Polyelectrolytes vs. Inorganic Coagulants. Although they cannot be used exclu-sively, polyelectrolytes do possess several advantages over inorganic coagulants. These are as follows. • During clarification, the volume of sludge produced can be reduced by 50 to 90%. • The resulting sludge is more easily dewatered and contains less water.
8-3
EM 1110-1-4012 15 NOV 01 • Polymeric coagulants do not affect pH. Therefore, the need for an alkaline chemical such as
lime, caustic, or soda ash is reduced or eliminated. • Polymeric coagulants do not add to the total dissolved solids concentration. • Soluble iron or aluminum carryover in the clarifier effluent can result from inorganic coagu-
lant use. By using polymeric coagulants, this problem can be reduced or eliminated. 8-5. Coagulant Aids. The coagulation process is often enhanced through the use of coagulant aids (or flocculants). Sometimes, excess primary coagulant is added to promote large floc sizes and rapid settling rates. However, in some waters, even large doses of primary coagulant will not produce a satisfactory floc. In these cases, a polymeric coagulant aid can be added after the coagulant, to hasten reactions, to produce a denser floc, and thereby reducing the amount of pri-mary coagulant required. Because of polymer “bridging,” small floc particles agglomerate rap-idly into larger more cohesive floc, which settles rapidly. Coagulant aids also help to create sat-isfactory coagulation over a broader pH range. Generally, the most effective types of coagulant aids are slightly anionic polyacrylamides with very high-molecular weights. In some clarifica-tion systems, non-ionic or cationic types have proven effective. The two types of coagulant aids discussed below are synthetic-organic and natural-organic.
a. Synthetic Organic Coagulant/Coagulant Aids. Synthetic organic polymers are the most commonly used coagulant aids for coagulation/flocculation of heavy metal precipitates (EPA, 1987). This is because metallic precipitates typically possess a slight electrostatic positive charge resulting from charge density separation. The negatively charged reaction sites on the anionic polyelectrolyte attract and adsorb the slightly positive charged precipitate (EPA, 1987). Syn-thetic organic polyelectrolytes are commercially marketed in the form of dry powder, granules, beads, aqueous solutions, aqueous gels, and oil-in-water emulsions (EPA, 1987). Generally, liq-uid systems are preferred because they require less floor space, reduce labor requirements, and reduce the potential for side reactions because the concentrate can be diluted in the automatic dispensing systems (EPA, 1987). Typical dosage requirements for metals-containing waters are in the 0.5- to 2.0-mg/L range. Polyelectrolytes work most effectively at alkaline and intermedi-ate pHs but lose effectiveness at pH levels lower than 4.5 (EPA, 1987).
b. Natural Organic Coagulant Aids. Coagulant aids derived from natural products include starch, starch derivatives, proteins, and tannins (EPA, 1987). Of these, starch is the most widely used. The price per kilogram for these natural products tends to be low; however, dosage re-quirements tend to be high (EPA, 1987). In addition, because of the composition of natural products, they are more susceptible to microbiological attack, which can create storage problems.
8-4
EM 1110-1-4012 15 NOV 01
CHAPTER 9 MIXING—GENERAL DISCUSSION AND THEORY 9-1. Introduction. Mixing provides greater uniformity of the wastewater feed and disperses precipitating agents, coagulants, and coagulant aids throughout the wastewater to ensure the most rapid precipitation reactions and subsequent settling of precipitates possible. To quantify the de-gree of mixing, the following factors must be considered: • The amount of energy supplied. • The mixing residence time. • The related turbulence effects of the specific size and shape of the tank. Additional information on the equations listed below can be found in Metcalf & Eddy (1991). a. The root mean square velocity gradient (typically denoted as G, units, (m/s)/m [fps/ft])
represents a measure of shear intensity over the mixing basin. For mechanically stirred mixing basins, G can be calculated as follows: G = (P/Vµ)0.5 where: P = power applied to stirring, W (ft-lbf/s = HP × 550) V = reactor volume m3(ft3) µ = dynamic viscosity N-s/m2 (lbf-s/ft2) b. Viscosity varies with temperature as shown in Table 9-1.
62.4 lb slug 1.94 slugsfor water at 20 C, ft 32.174 lb ft
ρ
° = × =
3
1000 kg m
ρ =
v = relative velocity of paddles in fluid (m/s [fps]), typically about 0.6 to 0.75 of paddle
tip speed.
Paddle tip speed should be kept in the range of 0.3 to 1 m/s (1 to 3 fps) to minimize deposition and yet avoid destruction of the floc. d. This is an estimate of the power required. Manufacturers must be contacted to determine
accurate power requirements. 9-2. Rapid Mixing. Chemicals such as coagulants generally require rapid mixing. Chemical mixing systems should be designed to provide a thorough and complete dispersal of the chemical throughout the influent. Rapid or flash mixing residence times typically range from 30 seconds to 2 minutes, with 1 minute being the most common (EPA, 1987). The intensity and duration of the mixing of the coagulant must be controlled to prevent undermixing or overmixing. Over-mixing may breakup newly formed floc, whereas undermixing can cause inadequate dispersal of coagulants, resulting in uneven dosing. For rapid-mix applications, a typically accepted G-value is 300 s–1. 9-3. Rapid Mixing Vessel Considerations. Generally, circular mixing tanks are more ef-ficient for rapid mixing than square or rectangular tanks. For tanks under 3800 L (1000 gallons) in capacity, portable turbine mixers are most practical. Typically, heavy-duty, top-entry turbine
9-2
EM 1110-1-4012 15 NOV 01
mixers are used for larger tanks. For square tanks, where the top dimension is much greater than the liquid depth, several side-entry mixers positioned next to each other are generally used. Design of mixing vessels requires consideration of several factors including: • Detention time. • Bottom scour. • Transport conditions. • Flow distribution. • Short circuiting. 9-4. Flocculation Mixing/Agitation. Slow mixing/agitation is typically carried out in a flocculator. Values of G for flocculation units typically range from 20 to 80 s–1. Values of G × t (where t = seconds of residence time) ranging from 30,000 to 150,000 are commonly used for flocculation. Flocculator retention times of 20–30 minutes are typical. Suggested flocculation references are Metcalf & Eddy (1991) and Clark et al. (1971).
9-3
EM 1110-1-4012) 15 NOV 01
CHAPTER 10 TREATABILITY TESTING 10-1. Introduction. Treatability testing is required to obtain the following necessary design and operating parameters: • Optimum pH levels for maximum removal of target metals. • Chemical reagent dosage rates and application points. • Mixing requirements. • Settling rates. • Sludge volume. • Sludge characteristics. Before bench-scale testing begins, representative influent samples should be analyzed for the following parameters: • pH. • Temperature. • Total suspended solids (TSS). • Total dissolved solids (TDS)—including specific heavy metals and respective concentrations. • Oil and grease (O&G). • Alkalinity. • Conductivity (TDS). • Turbidity. Note that many vendors of pre-packaged P/C/F treatment systems offer treatability testing capabilities.
10-1
10-2. Determination of Optimum pH Level. A series of jar tests should be conducted to determine optimum pH levels for effective precipitation. Note that using hydroxide precipitation in mixed-metal applications may require more than one precipitating stage. These tests are con-ducted by adding differing amounts of precipitating agent, thus varying the pH levels. After the precipitates settle out, the metal concentrations of the supernatants are measured. The pH levels at which all the target metals have the lowest concentrations, or which are within the required regulatory limits, are chosen as the optimum reaction pHs. For hydroxide precipitation, this testing is typically conducted using lime or sodium hydroxide. Sodium hydroxide, from a main-tenance viewpoint, is generally easier to add. However, with dilute metals concentrations (typi-cal in ground water remediation work), lime adds bulk to the solution and can thereby enhance sedimentation. During these tests, it is important to note the volume of chemicals used to in-crease the pH to optimum levels as these data will be used to size such items as chemical feed
EM 1110-1-4012 15 NOV 01 pumps and chemical storage facilities, as well as to estimate operational expenses. It is also im-portant to note precipitate characteristics (e.g., size, settling characteristics, etc.). 10-3. Determination of Coagulant and Coagulant Aid Dosage Rates. If after pH ad-justment, the solid precipitates settle rapidly and leave a clear supernatant, it may not be neces-sary to add coagulants and coagulant aids. This, however, is not typical and adding a coagulant or a coagulant aid, or both, usually becomes necessary. Two types of treatability testing com-monly conducted include: • Jar testing. • Zeta potential measurements.
a. Jar Testing. Jar testing is the most commonly used and reliable treatability test to select the most effective coagulant or coagulant aid, as well as respective optimum dosage rates. The objective of the test is simply to simulate the plant-scale coagulation and flocculation processes. To do jar testing, a series of jars or beakers containing pH-adjusted influent samples are lined up beneath a series of mixers. Optimal pH has already been established as described in Paragraph 10-2. To each jar is added simultaneously either different coagulants with the same dosage, or a different dosage of the same coagulant. The samples are then mixed for a pre-determined time. Resulting supernatants with the best visual appearance are then analyzed for residual metals con-centrations. The desirable performance characteristics of a coagulant are that it produce a dense, rapid settling floc, and that the resulting supernatant be clear with little residual metal remaining in suspension. Adding a coagulant aid may be necessary if adding the coagulant alone is not satisfactory. A suggested jar testing reference is ASTM D2035-80. Step-by-step jar testing procedures for determining optimum pH, as well as for determining optimum coagulant and coagulant aid dosages, are as follows:
(1) Place 1000 mL of sample in each beaker. Note that jar testing equipment typically has enough capability for six beakers per jar test run.
(2) On the basis of the operating range of a precipitating agent and the solubility charac-teristics (see Figure 2-2) of the target metal or metals, select an appropriate range to test for op-timum pH (e.g., if using hydroxide precipitation for removal of target metal zinc, use a pH range of 8.5 to 11 in 0.5 pH unit increments). Note that mixed-metal wastes may require more than one precipitation stage.
(3) Rapidly mix (80–100 rpm) each sample for 3 minutes, followed by 12–15 minutes of slow mixing (15–30 rpm). Then allow samples to settle for 20–30 minutes.
(4) Take a representative sample (about 100 mL) from the midpoint of the supernatant layer of each beaker and measure the target metal concentration. 10-2
EM 1110-1-4012) 15 NOV 01
(5) Plot the residual target metal concentration versus pH and select the optimum pH. Fig-ure 10-1a shows that, for a particular jar test, more than 95% of the target metal was removed at a pH of approximately 10.3.
(6) Using this optimum pH, repeat steps 1, 3, and 4, varying coagulants and dosages. A method to select a starting dosage is as follows: Using 200 mL of sample in a magnetic stirrer, add coagulant in small increments at a pH of 6.0. After each addition, provide a rapid mix of 1 minute followed by a 3-minute slow mix. Continue adding coagulant until a visible floc is formed. Use this as a starting dosage.
a. Determination of optimum pH.
b. Optimum coagulant dosage (mg/L).
Figure 10-1. Jar test analysis.
10-3
EM 1110-1-4012 15 NOV 01
(7) Plot the residual metal concentration versus the coagulant dosage and select the opti-
mum dosage (see Figure 10-1b). As in Figure 10-1b, the curves typically “flatten” out after a certain point, and increasing coagulant dosages beyond 45 mg/L give diminishing benefits and increasing sludge quantities. Therefore, the optimum coagulant dosage may not correspond ex-actly with percentage of target metal removed.
(8) If a coagulant aid is used, repeat this procedure, adding the coagulant aid toward the end of the rapid mix.
b. Zeta Potential Testing. Zeta potential is a measurement of particle strength surrounding the colloid. Zeta potential relates to the repulsive force between particles and the distance over which particles (colloids) can repel each other and thus prevent coagulation. Zeta potential measurements have been used experimentally to predict coagulant requirements and optimum pH levels. By measuring how fast particles move across a microscopic grid toward an anode or cathode (positive or negative poles), zeta potential defines the charge on particles and colloids in water. Zeta potential indicates the degree of neutralization; therefore, it measures how well a coagulant is working. As discussed earlier, effective coagulation has been demonstrated over a range of plus or minus 0.5 mV. Zeta potential is not an on-line method and cannot signal me-tering pumps to alter delivery rate. Because zeta potential only measures one aspect of the co-agulation process, the validity of the measurements as a meaningful indicator is often in ques-tion. Jar testing best simulates clarification chemistry and operation. 10-4. Determination of Settling Rates. After optimum coagulant/coagulant aid dosage rates are determined, settling tests are required. First, the pH-adjusted water is added to a gradu-ated cylinder or other container designed for settling tests. Next, the optimum established co-agulant and coagulant aid are added and mixed. Immediately after mixing, the operator records the height of the sludge interface and the time. The operator continues to record sludge heights with time until the settling rate approaches zero. These values are then graphed to produce a characteristic settling curve, which is used to determine the overflow rate for a sedimentation process (see the example problem in Appendix C). Metal hydroxides that are properly coagu-lated typically settle quickly. However, a safety factor should be applied because of potential plant upset conditions. The calculated overflow rate for a thick floc that settles immediately could be as high as 60 m3/m2-d (1500 gpd/ft2) (Water Environment Federation, 1994). However, the design overflow rate should not exceed 40 m3/m2-d (1000 gpd/ft2). For metal hydroxide sludges, values typically range between 10 and 33 m3/m2-d (250 and 800 gpd/ft2) (Water Envi-ronment Federation, 1994). Typically, maximum loading rates for metal-hydroxide precipitates, recommended by manufacturers of inclined plate clarifiers, are less than 0.25 gpm/ft2 (360 gpd/ ft2). 10-5. Determination of Sludge Characteristics. A treatability study should be conducted to determine sludge dewatering capability. After settling, metal hydroxide sludge is typically 96 10-4
EM 1110-1-4012) 15 NOV 01
to 99% water and can normally be dewatered to 65–85% water (Water Environment Federation, 1994). The most common methods for sludge dewatering are sand drying beds, vacuum filters, or filter presses. How well sand drying beds perform depends on climate, but this may be par-tially simulated in the laboratory by setting up a sand column, applying sludge to the surface, and monitoring the filtrate quantity, quality, and final sludge moisture content. With most new sys-tems, plate and frame pressure filters or belt filter presses are used; sand and vacuum filters are declining in use (Water Environment Federation, 1994). Various manufacturers have developed bench-scale tests to simulate filter press applications.
a. To determine the filterability of a sludge, a specific resistance test is normally conducted. Before filtering, the sludge is typically chemically conditioned with a compound such as lime, polymer, or ferric chloride. This test is used to determine what chemical to use and the optimum dosage for filtering particular sludges. The optimum dosage provides the lowest specific resis-tance value. A sample of conditioned or MP unconditioned sludge is applied to a Buchner fun-nel apparatus under vacuum, and the quantity of filtrate is measured versus time. The initial and final sludge moisture contents are also measured. The specific resistance can be obtained by plotting filtrate volume versus time divided by volume (Water Environment Federation, 1994).
b. Sludges should also be evaluated under the Resource Conservation and Recovery Act (RCRA) regulations for hazardous waste classification. For example, metal-plating sludge is an RCRA-listed hazardous waste, category F006, and may not be transported to a landfill permitted for non-hazardous waste only. 10-6. Oxidation Considerations (Iron and Manganese Removal). In waters contain-ing dissolved oxygen, iron (+3) and manganese (+4) are the only stable oxidation states for these metals. These chemical forms are highly insoluble and, therefore, waters containing dissolved oxygen contain very little soluble iron or manganese. Conversely, significant levels of iron and manganese can be found in the bottom levels of lakes or in ground water, where anaerobic con-ditions favor the reduction of iron (+3) and manganese (+4) to the soluble iron (+2) and manga-nese (+2) forms. Although, not considered hazardous or toxic, significant levels of iron and manganese can create problems for a treatment system. For example, iron precipitates promote the growth of gelatinous iron bacteria, which can clog process piping and valves or can foul sub-sequent treatment units (e.g., air stripping towers or UV-oxidation systems).
a. Soluble iron and manganese can be effectively precipitated through simple oxidation tech-niques. Commonly used oxidizing agents are oxygen, chlorine, and potassium permanganate (KMnO4). Oxidation rates depend on the oxidant used, pH, the alkalinity of the waste stream, and the presence of organic matter. Generally, potassium permanganate oxidizes the quickest, followed by chlorine, and finally oxygen. However, regardless of the oxidant used, manganese (+2) oxidation is always slower than iron (+2) oxidation. A pH of near 10 is required to completely oxidize manganese (+2) within a reasonable (less than 1 hr) reactor retention time. Permanganate will oxidize manganese (pH 11) to MnO2 within 5 minutes over a broad pH range. 10-5
EM 1110-1-4012 15 NOV 01 In situations where only iron removal is necessary, the reaction is typically conducted at a near neutral pH (7–8). Studies have shown that low alkalinity levels can lessen oxidation rates because the buffer system is slow to respond to acidity changes induced by the oxidation reaction. Further studies have shown that the presence of organic matter may also lessen the oxidation rates. The presence of complexing and chelating agents can also slow oxidation rates. So-called organic iron and manganese are not effectively removed by oxidation; in these cases, studies have shown that coagulation with alum followed by sedimentation can be effective.
b. By far, the most common method used to remove soluble iron and manganese is aeration (oxidant is O2) in conjunction with sedimentation or filtration. By stripping carbon dioxide, aeration raises the pH of the water and introduces the oxygen required for oxidation of iron (+2) and manganese (+2). In designing aeration systems, small or slow settling floc may actually indicate success rather than failure. Aeration adds no extra precipitating agents and, therefore, the floc formed is typically pure metal, thus reducing sludge volumes, oftentimes dramatically. Small and slow settling floc problems can often be solved through adding polymers and gentle stirring to produce larger, denser floc. When an aeration precipitation system is designed, it low production of suspended solids should be the primary goal.
c. Typically, in an iron and manganese removal system, an oxidation-reduction potential (ORP) probe connected to an ORP controller is used to continually monitor iron and manganese ion concentrations. On the basis of these concentrations, the controller adjusts the rate of oxidant addition to ensure that iron and manganese are sufficiently oxidized to form the hydroxide pre-cipitates.
d. Suggested references for iron and manganese removal systems are EPA 625/8-80-003, and 600/8-80-42c.
10-6
EM 1110-1-4012 15 NOV 01
CHAPTER 11 PRE-TREATMENT REQUIREMENTS 11-1. Introduction. Prior to the precipitation process, waste streams may require pre-treat-ment steps consisting of the following: flow equalization, neutralization, or treatment of indi-vidual waste streams prior to combination with other waste streams. Oil removal, chromium re-duction, and cyanide destruction are examples of other pre-treatment steps. 11-2. Flow Equalization. To prevent flow rate, temperature, and contaminant concentrations from varying widely, flow equalization is often used. For all methods of flow equalization, the designer has to be sure that the flow rate, temperature, and contaminant concentration of the in-fluent are well characterized so that flow rates and concentrations that would overload the system are avoided. In addition, the designer has to be sure that the system is flexible enough that it could be moved or expanded in the future, or that the flow rate could be changed. There are four commonly used flow equalization techniques: • Alternating flow diversion. • Intermittent flow diversion. • Completely mixed combined flow. • Completely mixed fixed flow. a. In the alternating flow diversion, shown in Figure 11-1, one equalization basin is designed
to collect the total flow of the influent for a given time while a second basin is discharging. For successive periods, the basins alternate between filling and discharging. Mixing is typically maintained so that the pollutant levels in the discharge remain constant with relatively constant flow. This type of system can provide a large degree of equalization; however, the disadvantage is that the cost of constructing a second basin is high (Water Environment Federation, 1994).
Influent
Equalization Basin 1
Equalization Basin 2
Treatment Facility Effluent
Figure 11-1. Alternating flow diversion equalization system. b. The intermittent flow diversion system, shown in Figure 11-2, allows the waste stream to
be diverted to an equalization basin for short periods. The diverted flow is then metered back
11-1
EM 1110-1-4012 15 NOV 01 into the main stream at a controlled rate. The volume and variance of the pollutants in the di-verted water will dictate the rate at which the diverted flow is fed back into the main stream.
Influent
Equalization Basin
Treatment Facility Effluent
Figure 11-2. Intermittent flow diversion system.
c. The completely mixed combined flow system, shown in Figure 11-3, is designed to pro-
vide complete mixing of multiple flows (or wells) at the front end of the treatment facility. By thoroughly mixing multiple flows, this type of system can reduce variance in each stream. This system should only be used when flows are compatible and can be combined without creating additional problems.
d. The completely mixed fixed flow system, shown in Figure 11-4, is designed to completely
mix waste streams in a large holding basin directly before the treatment facility. This system levels variations in influent stream parameters and provides constant discharge.
11-2
EM 1110-1-4012 15 NOV 01
Equalization Basin
Treatment
Facility
Influent
Effluent
Figure 11-4. Completely mixed fixed flow system.
e. Mixing within an equalization basin is a necessity. The waste stream can be mixed through
baffling, through mechanical means, and through aeration. Mixing power levels vary with basin geometry; however, as a general rule, 0.3 L/m3-s (18 cfm/1000 ft3) of basin volume is the mini-mum required to keep light solids in suspension (approximately 0.02 kW/m3 (0.1 hp/1000 gal) f. Baffling, although not a true form of mixing and less efficient than other mixing methods,
prevents short-circuiting and is typically the most economical. Over-and-under or around-the-end baffles may be used. In wide equalization tanks, over-and-under baffles are preferable be-cause they provide more efficient horizontal and vertical distribution. To prevent suspended solids in the wastewater from settling and remaining on the bottom, the influent should be intro-duced at the tank bottom. Typically, baffling is not advisable as a proper way of mixing waste-waters that have high concentrations of settable solids (Water Environment Federation, 1994). g. Owing to its higher efficiencies, mechanical mixing is typically recommended for smaller
equalization tanks, wastewater with higher suspended solid concentrations, and waste streams in which waste strength frequently fluctuates. Mechanical mixers are typically selected on the basis of manufacturer’s data or laboratory pilot tests. Geometrical similarity should be preserved and the power input per unit volume should be maintained if pilot plant results are to be used at full scale. Vortexes should be avoided, which reduces wasted power, by mounting the mixer off center or at a vertical angle or by extending the baffles out from the wall. h. Mixing by aeration is the most energy intensive method. Aeration, in addition to mixing,
chemically oxidizes reducing compounds, as well as physically stripping volatile organic com-pounds (VOCs). The designer should note that some states require air discharge permits for VOC emissions to the atmosphere or that the equalization tank be classified as a process tank. Equalization tanks should be sloped to drains and be provided with a water supply for flushing, otherwise odor and health nuisances may occur after the tank is drained. i. Design of equalization facilities begin with detailed pre-design studies, which include gath-
ering data on flow and all pollutants of consequence. Many references outline design procedures for the equalization techniques described above. Suggested references are Water Environment Federation (1994), EPA (1987), and Water Environment Federation (1991).
11-3
EM 1110-1-4012 15 NOV 01 11-3. Oil and Grease Removal. Oil and grease in solution can inhibit the settling of pre-cipitates by creating emulsions. Oil droplets suspended in water tend to suspend particles, such as metal precipitates, that would otherwise settle out of solution. Oil and grease can be removed through emulsion breaking, dissolved air flotation, skimming, or coalescing. Specialty chemi-cals such as cationic polymers and emulsion breakers can help provide this treatment step. 11-4. Chromium Reduction. Hexavalent chromium must be reduced to the trivalent form prior to hydroxide precipitation. If sulfide precipitation is used, this reduction, or pre-treatment, is not necessary. Reduction typically occurs at pH 2.0 to 3.0 through adding acid and a reducing agent (e.g., sulfur dioxide, ferrous sulfate, sodium metabisulfite, or sodium bisulfite). An oxida-tion-reduction potential (ORP) meter can be used to monitor the reaction, notifying operators when it is complete. The ORP reading may vary with wastewater characteristics. A color change from yellow to green is typically evident. Suggested references are available describing this process are EPA (1987) and the Naval Civil Engineering Laboratory (1984). 11-5. Cyanide Destruction. Destroying cyanide (CN–) is an important pre-treatment step before metals are removed because cyanide forms complexes with metals and prevents them from precipitating as hydroxides. However, once the cyanide–metal bond is broken, the metal is free to precipitate under the appropriate pH conditions. a. Because stable organo-metallic complexes may form or toxic hydrogen cyanide gas may
evolve, cyanide wastes should not be mixed with metal-containing wastes. Aquatic life can be destroyed when cyanides are discharged into surface waters. Free cyanides, hydrogen cyanide, and the cyanide ions are the most toxic forms of cyanides in the environment. The threshold toxicity limit for free cyanide in well-oxygenated waters is approximately 0.05 mg/L. For metal-cyano complexes, the threshold toxicity limits are in the range of 0.1 to 1.0 mg/L. In addition, cyanate, an oxidation product of cyanide ions, is also toxic with a threshold toxicity limit as low as 75 mg/L. b. A two-step process is typically used to destroy cyanide. In the first step, cyanide is con-
verted to cyanate using sodium hypochlorite at pH 10 or greater. This first step typically re-quires 30 minutes. The reaction endpoint may be monitored with an ORP meter or by a visual color change in solution, from green to blue. In the second step, cyanate is converted to carbon dioxide and nitrogen. This is done by decreasing the pH with acid to 8.5. The second step re-quires approximately 10 minutes. In operation, feedback ORP and pH meters may control the reactions. c. Common technologies available for treatment of cyanides are chemical oxidation, electro-
lytic oxidation, and electrodialysis. Suggested references are Naval Civil Engineering Labora-tory (1984) and EPA (1987).
11-4
EM 1110-1-4012 15 NOV 01
11-6. Chelating/Complexing Agent Removal. Established methods exist to remove che-lating/complexing agents. Chemical methods include using starch xanthate, ferrous sulfate, waste acids, sulfide ions, sodium hydrosulfite, and high pH lime (EPA, 1987). A common in-dustry practice is to use a combination waste treatment method using acid and high pH lime. This process first adjusts the pH of the organo-metallic waste to approximately 2 with dilute acid (sulfuric, nitric, or hydrochloric). After the chelate/complex breaking step, the pH is then raised to 9.5–11 to form insoluble metal hydroxides (EPA, 1987). Chemical oxidation using potassium permanganate (KMno4), I ozone, chlorine dioxide, or hydrogen peroxide (H202) has also been used to “break” metal-complexes and metal-chelates to precipitate the metal ions.
11-5
EM 1110-1-4012 15 NOV 01
CHAPTER 12 EQUIPMENT REQUIREMENTS 12-1. Introduction. P/C/F systems generally consist of the following equipment: • Equalization basin. • pH control system, including pH/ORP sensors, analyzers and recorders. • Precipitation tanks and reactors. • Chemical feed apparatus. • Mixers and flocculators (or agitators). • Clarifiers, including thickener. • Sludge dewatering equipment. • Ancillary or miscellaneous equipment.
a. The designer should note that numerous vendors offer pre-packaged P/C/F systems. Pre-packaged systems are typically mounted on skids and usually contain all necessary equipment, in-cluding a pH control system, an oxidation/reduction system (if required), reaction tanks, mixers, clarifier, sludge dewatering device, and an effluent holding tank. Pre-packaged plants are available with flow rates typically ranging from 0.63 L/s (10 gpm) to 93 L/s (1500 gpm). Pre-packaged sys-tems typically do not include equalization; however, this can be added as ancillary equipment. Skids, for pre-packaged systems, are typically up to 6 m (20 ft) long and 1.5 to 2.4 m (5 to 8 ft) wide (NEESA, 1993). For a design flow rate of 0.8 m3/min (20 gpm), approximately 37 m2 (400 ft2) of skid space is required, whereas a 65-gpm system requires approximately 92 m2 (1000 ft2) of skid space (NEESA, 1993). Package systems usually include plumbing and electrical wiring ade-quate for connection to on-site water and power supplies. A 480-V, 3-phase power supply is typi-cally required.
b. The designer should note that individual components can become very large at higher design rates (especially if certain reagents, such as carbonate precipitating agents, are used). Consider the following example where hydroxide precipitation is used for a 100-gpm operation. For this exam-ple tankage requirements would include
• A 45-m3 (12,000-gal.) (2-hour retention time) equalization tank. • A 23-m3 (6000-gal.) mixing tank. • A 76-m3 (20,000-gal.) clarifier. • A 3-m3 (800-gal.) thickener tank (NEESA, 1993).
Should design flow rates call for tanks in excess of 150 m3 (40,000 gal.), field erection is usually necessary. In some cases, this can increase construction time by several months.
12-1
EM 1110-1-4012 15 NOV 01 12-2. Equalization Tanks/Systems. See Paragraph 11-2. 12-3. pH Control System. The pH scale corresponds to hydrogen ion concentrations from 100
to 10–14 moles per liter and, therefore, systems for pH control cover an extreme range. No other common measurement covers such a tremendous range. In addition, the measuring electrodes can respond to changes as small as 0.001 pH, and, therefore, systems for pH control are also extremely sensitive. The design of these pH control systems is complicated by pH being a logarithmic func-tion of concentration. For example, if a certain amount of base added to a solution of strong acid would increase the pH from 2 to 3, increasing the pH further to 4 may only require 10% of the original volume. If it is necessary to increase the pH to 5, only 1% of the original volume is re-quired, and for pH 6, only about 0.1%. Therefore, taking a waste stream from pH 2 to 7 can be a difficult control problem.
a. The pH control system typically has the following equipment:
• pH sensor. • Analyzer. • Recorder.
In addition, there is typically a control panel with an indicator, starters, and controls for chemical metering pumps, high/low pH alarms, switches, and mixer motor starters.
(1) pH/ORP Sensors. A pH sensor is an electrochemical device that produces a voltage pro-
portional to the pH/ORP of the solution into which it is placed. ORP probes are used when agents other than hydroxide precipitating agents are used. The following things should be done when se-lecting the proper pH/ORP sensors: • Determine mounting requirements and sensor body style. • Ensure that the measuring electrode fits process temperature, chemistry, and physical parame-
ters. • Determine if an automatic temperature compensator is required (becomes critical as the
temperature changes from 25°C, or the pH from 7.0). • Determine what accessory hardware is required to mount a particular type of sensor. • Determine cabling requirements to connect the sensor to the analyzer. ORP displays should be capable of reading both positive and negative millivolt values.
(2) pH Analyzers. The key function of the pH analyzer is to receive the voltage signal from the pH sensor and convert it to a pH value. The pH scale has an equivalent y mV scale. The mV scale ranges from +420 to –420. At a pH of 7.0 the mV value is zero. Each pH unit change corre-sponds to a change of + or –60 mV. As the pH becomes more acidic, the values become greater.
12-2
EM 1110-1-4012 15 NOV 01
For most processes, a pH analyzer is required to do more than simply display a pH value. Based on specific pH setpoints, the analyzer also transmits signals to recorders or control systems that acti-vate (or deactivate) alarms, valves, or pumps.
b. For batch systems, the pH control device can be relatively simple with only on–off control provided via a solenoid or air-activated valves. For continuous flow systems, pH control is more complicated because of the greater potential for fluctuation in both flow and contaminant concen-tration. Continuous flow pH control systems are called proportional, cascade, feed-forward, or feedback pH control.
c. Many industrial instrumentation controllers and analyzers, because microprocessor-based technology has been introduced, now use configurable algorithms to characterize their function curves. The segmented function curves, generated by these algorithms, are inversely proportional to the titration curve for the influent wastewater and the selected neutralizing (or precipitating) agent. This results in a near-linear controller output with respect to reagent demand. For pH val-ues between 4 and 10 (most common for ground water remediation projects), a single characterized curve typically will be sufficient for pH control. If the control detects a pH outside of this range, an alternate curve can be developed and electronically switched to replace the normal curve.
d. Suggested references for further reading for design of pH control are Water Environment Federation (1994, 1993), Hoyle (1976), Cushnie (1984), and Hoffman (1972). 12-4. Tanks/Reactors. Precipitation tanks (or reactors) are built from a wide range of con-struction materials, such as masonry, plastic, metal, fiberglass, or elastomers. Coatings and liners may be used to prevent corrosion and premature decomposition of the tank walls. For example, concrete reactors susceptible to corrosion can be installed with a multi-layered coating of glass-reinforced epoxy polyamide covered by a coating of polyurethane elastomer to extend the service life (EPA, 1987).
a. Precipitation reactors are typically cubical or cylindrical. Cubical tanks typically do not need baffling, whereas cylindrical tanks are typically constructed with “ribs” that prevent swirling and maintain adequate contact between the reactants. A general rule-of-thumb is that the depth of the liquid should be roughly equivalent to the tank diameter or width. Reactor sizing is based on flow rate and retention time required to complete chemical reactions. Carbonate reagents, as discussed earlier, generally require longer retention times, thus larger reactors.
b. Reactors can operate in either batch or continuous modes, and can be configured as either single-or multi-stage tanks. Multi-stage, continuous setups are generally required to neutralize and precipitate concentrated wastes with various feed rates (EPA, 1987). In these units, most of the chemical reagent is used in the first reactor, with only final pH adjustments (polishing) made in the remaining reactor or reactors. This is particularly true when using reagents that require extensive reaction times. The batch or single-stage continuous precipitation setup is most suitable for use 12-3
EM 1110-1-4012 15 NOV 01 with highly buffered solutions, dilute wastewaters not subject to rapid pH or flow rate changes, or small, inconsistent flows. 12-5. Rapid Mixers. The most common type of mixing device used for wastewater treatment (including P/C/F system) is the rotating propeller mixer. Impeller mixers are classified into three groups: • Paddles. • Turbines. • Propellers. Of these, only turbine and propeller mixers are used for rapid mixing.
a. Turbine Mixers. Figure 12-1 shows a typical turbine mixer. Generally, turbine mixers re-semble multibladed paddle mixers with short blades turning at high speeds on a shaft typically lo-cated near the center of the mixing chamber. The impeller may be shrouded, semi enclosed, or open. The diameter of the impeller is typically 30 to 50% of the diameter of the mixing vessel. Turbine mixers, especially in thin liquids, impart strong currents that persist throughout the vessel. Baffles or diffuser rings must often be used to prevent vortexes. Turbine mixers are typically mounted vertically and in the center of the mixing chamber, 50 to 100% of a diameter above the chamber floor.
Figure 12-1. Turbine mixer in a baffled tank.
b. Propeller Mixers. Figure 12-2 shows a typical propeller mixer. These mixers have high speed, low impellers and are generally used for thicker solutions. At full motor speed, small pro-peller mixers revolve at about 1750 rpm, whereas larger mixers turn at 400–800 rpm. Typically, propeller mixers are much smaller in diameter than either paddle or turbine mixers, rarely exceeding 0.46 m (18 in.) in diameter, regardless of the size of the mixing vessel. Deep mixing vessels typically require two or more propellers on the same shaft. Where top entry is required for a propeller mixer, the mixer is mounted angled and off-center. Flow should parallel the long axis of the basin. For small, open tanks of less than 3800 L (1000 gal.) capacity, top-entry mixers are 12-4
EM 1110-1-4012 15 NOV 01
best. In this case either an angle-mounted propeller mixer or a vertically mounted turbine mixer is typically satisfactory. For nonstandard tank geometry and larger tanks, side-entering mixers are generally used.
Figure 12-2. Propeller mixer.
c. Other Rapid Mixing Methods. Although mechanical mixing is the most common, a waste stream can be rapidly mixed through: • Baffled channels. • Hydraulic jump mixers. • Pneumatic mixing through compressed air injection. • In-line static mixers. Baffled channels and pneumatic mixing are techniques better suited for flocculation than rapid mixing. In-line static mixers are commonly used for rapid mixing; however, they possess two dis-tinct disadvantages: high head loss (up to 0. 9 m [3 ft]) and the mean velocity gradient G, cannot be changed to meet varying requirements.
d. Suggested Rapid Mixing References. These are EPA (625/1-75-003a, 430/9-79-018), EPA (1987), and TM 5-814-3. 12-6. Flocculators/Agitators. The two most commonly used mechanical flocculators for slow mixing are the paddle type and the reel type. For the removal of heavy metal contaminants, flocculator/clarifiers come in three basic types:
12-5
EM 1110-1-4012 15 NOV 01 • Basic settling chambers. • Mixer clarifiers. • Inclined plate clarifiers. Of the three types, inclined plate clarifiers are the most commonly used and will be discussed in more detail.
a. Basic settling chambers. Feed is distributed at one end and overflows at the other. This type of unit usually requires a mixing zone to flocculate the particles before clarification. Rectangular or circular shaped units are available with either flat or conical bottoms. Numerous references are available in the literature.
b. Reactor Clarifiers. A reactor clarifier is a sludge blanket unit that combines coagulation, flocculation, and settling in a single unit. Colloidal destabilization (coagulation) may be less effec-tive than a conventional settling chamber; however, there are distinct advantages in recycling pre-formed floc. By seeding the influent wastewater with previously formed floc or by recycling a portion of the precipitated sludge, it is possible to reduce both coagulant dosage and the time of floc formation. The sludge blanket serves as a filter for improved effluent clarity. A reactor clarifier is shown in Figure 12-3.
Figure 12-3. Mixer clarifier.
c. Inclined Plate Clarifier. A plate settler is a deep, rectangular unit equipped with parallel plates slanted at an angle (typically 45 or 55°) and spaced 25 to 50 mm (1 to 2 in.) apart. Figure 12-4 shows a schematic of a plate settler. Most common materials of construction include 0.635-cm (1/4-in.) thick ASTM A36 structural quality carbon steel, or 304 and 316 stainless steel. Inte-rior carbon surfaces are typically coated with epoxy.
12-6
EM 1110-1-4012 15 NOV 01
Figure 12-4. Inclined plate clarifier.
(1) By the use of parallel plates, a large settling area can be incorporated into a relatively small space. Plate settlers often require only a quarter of the floor space of conventional clarifiers (EPA, 1987). In buildings where ceiling height is limited, the use of plate settlers can become a major benefit.
(2) Because of its overall smaller size, the unit can be manufactured elsewhere and delivered to the construction site for installation.
(3) After the flocculation process is complete, the wastewater flows upward through the plates. Floc particles settle onto the plates and slide into the sludge-holding area of the unit. The sludge compartment typically has pitched sides, access hatches, and a mechanical thickening de-vice. Through the use of inclined plates, floc particles have a shorter distance over which to settle, and an effective laminar flow condition is easier to attain, thereby facilitating the settling process (Water Environment Federation, 1994).
(4) The plate settler plate packs typically consist of smooth-surfaced polypropylene plates as-sembled into packs. Typical construction uses stainless steel rods and PVC spacers to “lock” the plates in at the proper angle. Plate packs are typically equipped with lifting eyes.
(5) Plate settlers are available in models ranging from 5.1 m2 (55 ft2) to 204.5 m2 (2200 ft2). A typical maximum recommended loading rate for metal hydroxides is approximately 0.25 gpm/ft2.
12-7
EM 1110-1-4012 15 NOV 01
(6) The designer should be aware that under contaminant-heavy loadings, operational prob-lems can develop, causing solids to “bridge” in the sludge-holding area, making their subsequent removal difficult. Excessive polymer addition can further compound the problem. 12-7. Chemical Feed Equipment. As discussed earlier, chemical feed equipment consists of chemical storage tanks, agitation, level instrumentation, dissolving tanks, gravimetric or volumetric feeders, metering pumps, and slaking and slurrying equipment. Storage tanks should be sized ac-cording to maximum anticipated feed rate, shipping time required, and quantity of shipment. The total storage capacity should be more than sufficient to guarantee a chemical supply while awaiting delivery. Storage containers should be compatible with the reagent being used. High calcium quicklime, for example, is hygroscopic, and therefore must be stored in moisture-proof tanks to prevent atmospheric degradation. Suggested chemical feed system references are EPA (430/9-79-18) and CEGS 11242. 12-8. Sludge Dewatering Equipment.
a. The slurry of thickened precipitate is typically dewatered to increase the solids content, prior to disposal. Commonly used dewatering techniques are:
• Vacuum filtration. • Filter press. • Belt press.
Of the three listed dewatering techniques, plate and frame filter presses are the most commonly used for HTRW site remediations. Numerous references are available in the literature. A couple of suggested references are CEGS 11360, Plate and Frame Filter Press System, and Water Environ-ment Federation (1991).
b. Typically, recovery and reuse of metals separated from the sludge does not prove economi-cal. This is attributable to the low commercial value of the metals normally found in ground water (e.g., iron and manganese) and the costs associated with separating these metals from the sludge (and from the other metals in the sludge). 12-9. Miscellaneous Equipment. Miscellaneous equipment requirements include flow moni-toring and effluent pH recording equipment necessary to prevent discharge of insufficiently treated waste. It also includes electrical and mechanical fit-up as well as spare parts such as pH probes, pH controller circuit board, metering pump ball valves, o-rings, etc., to prevent any excessive down-time (EPA, 1987).
12-8
EM 1110-1-4012 15 NOV 01
CHAPTER 13 P/C/F SYSTEM COSTS, STARTUP, AND OPERATIONS 13-1. Introduction. Basic equipment for a hydroxide precipitation system consists of an equalization tank, piping system, precipitation reactor, chemical feed system, floccula-tion/clarification unit, sludge storage tank, and sludge dewatering equipment. 13-2. System Costs. EPA developed the capital and operation and maintenance (O&M) cost information detailed below. They calculated direct costs, indirect costs, and working capital as a percentage of the purchased equipment and installation (PE&I) costs. The assumptions made by EPA are summarized in Table 13-1. Table 13-1 EPA Assumptions Used to Develop Costs Cost Elements Assumed Value (% PE&I) Direct costs (DC): Instrumentation and controls 10 Piping 21 Electrical equipment and materials 13 Buildings 26 Yard Improvements 7 Service Facilities 41 Total Direct Cost (DC): 118 Indirect costs (IC): Engineering and supervision 29 Construction expenses 32 Contractor's fees 7 Contingency 27 Total Indirect Cost (IC): 95 Fixed capital investment (FCI): PE&I + DC + IC Working capital (WC): 47 Total capital investment (TCI): FCI + WC = 360% PE&I
13-1
EM 1110-1-4012 15 NOV 01
a. Annual O&M costs include variable costs, plant overhead costs, general administrative costs, and fixed costs. Variable costs include costs for labor, maintenance, materials, chemicals, and contracted sludge disposal. Fixed costs include taxes and insurance.
b. Chemical requirements for each treatment were based on stoichiometric requirements. To further obtain annual O&M costs, the following assumptions were made: • Plant overhead costs are 6% of the total capital investment costs. • Taxes and insurance costs are 1% of total capital investment costs. • Labor costs are based on 4 hr/shift at $20/hr. • Power costs are at 2% of total capital investment. • Nonhazardous contracted sludge disposal costs are based on $440/metric ton ($200/ton). • Sludge transportation costs are based on $0.35/metric ton-km ($0.25/ton-mile) and a
transportation distance of 25 km (15 miles). • All hazardous wastes generated by the treatment processes would be encapsulated and dis-
posed of as nonhazardous wastes. Other assumptions included in the cost model are: • Treatment system will handle 200 mg/L of heavy metal ions. • There will be two different flow rates: 3.8 and 38 m3/hr (1000 and 10,000 gal/hr). • The system will operate 24 hr/day, 300 days/year. • Equalization tank is sized for 1-hour retention time and is made of reinforced concrete. • Reagent feed and storage system is sized for a 1-week supply. • Hydroxide precipitating agent is lime. • Sulfuric acid capability is included in case of pH overshoot. • Precipitation reactor is sized for 30-minute retention time. • Flocculation/clarification unit has a separate flocculation tank, a polymer feed system, and an
inclined plate separator with a separate sludge collection zone. • Solids concentration is 2% before dewatering stage. • Sludge holding tanks are sized for 10 hours of clarifier underflow. • Plate and frame filter press is provided for sludge dewatering. The cake solids concentration
is 20% with an 8-hour press cycle. • Cost items not included are high pressure feed pumps, filtrate return lines to clarifier, and cake
solids handling equipment.
c. Table 13-2 outlines the cost estimate for a continuous hydrated lime hydroxide precipita-tion/coagulation/flocculation system.
13-2
EM 1110-1-4012 15 NOV 01
Table 13-2 Cost for Continuous Flow P/C/F System Using Hydrated Lime* Flow Rate (gallons/hour): 1,000 10,000 Purchased Equipment and Installation (PE&I): Equalization Tank $17,000 $29,000 Precipitation Reactor 24,000 40,000 Flocculator/Clarifier 18,000 50,000 Sludge holding tanks 6,000 6,000 Filter Press 10,000 25,000 72,000 150,000 Total Capital Investment: $259,000 $540,000 (360% of PE&I) Operation and Maintenance Costs (O&M): Operating Labor $72,000 $72,000 Maintenance (6% of TCI) 15,500 32,500 General Plant Overheard 15,000 31,400 Utilities (2% of TCI) 5,200 10,800 Taxes and Insurance (1% of TCI) 2,600 5,400 Chemical Costs ($40/ton) 500 5,300 Sludge Transportation 200 2,300 Sludge Disposal ($200/ton) 12,000 120,000 Total O&M cost per Year: $123,000 $279,000 Cost per 1000 gallons: $17 $4 *1987 Dollars
d. Table 13-3 presents cost data for a continuous soluble sulfide precipitation system. An ad-ditional aeration vessel, consisting of a reinforced concrete reactor, four–six acid resistant spargers ($82/sparger), and 30 ft of 6-in. pipe ($2.40/ft), was included in the treatment train to re-duce H2S gas evolution. In addition, operating labor requirements have increased from 4 to 6 hours per shift because greater process control is necessary. Also, reagent chemical costs have greatly increased from $90/metric ton ($40/ton) for lime to $900/metric ton ($410/ton) for sodium sulfide.
13-3
EM 1110-1-4012 15 NOV 01 Table 13-3 Cost for Continuous Flow P/C/F using Soluble Sulfide Precipitation* Flow Rate m3/hr (gal/hour): 3.8 m3/hr (1,000) 38 m3/hr (10,000) Purchased Equipment and Installation (PE&I): Equalization Tank $17,000 $29,000 Precipitation Reactor 24,000 40,000 F1occulator/Clarifier 18,000 50,000 Aeration Vessel 17,400 29,500 Sludge holding tanks 3,000 6,000 Filter Press 10,000 25,000 89,400179,000 Total Capital Investment: $321,000 $646,200 (360% of PE&I) Operation and Maintenance Costs (O&M): Operating Labor $108,000 $108,000 Maintenance (6% of TCI) 19,300 38,000 General Plant Overheard 18,700 37,500 Utilities (2% of TCI) 6,400 12,900 Taxes and Insurance (1% of TCI) 3,200 6,500 Chemical Costs: Na2S $900/metric ton ($410/ton) 4,050 40,500 FeSO4 $319/metric ton ($145/ton) 350 3,600 Sludge Transportation 300 2,600 Sludge Disposal $440/metric ton ($200/ton) 13,800 138,100 Total O&M cost per Year: $174,100 $388,500 Cost per 3.8 m3 (1000 gallons): $24 $5.4 * 1987 Dollars
13-4
e. Table 13-4 presents estimated cost data for a continuous sodium carbonate precipitation system. The purchased equipment and installation costs are equivalent to those of the hydrated lime system with the exception of retention time. Because of the slower reactivity of sodium car-bonate, a retention time of 1 hour was used in lieu of 30 minutes. In addition, chemical reagent costs as well as usage rates are higher for sodium carbonate than for hydrated lime. The advan-
EM 1110-1-4012 15 NOV 01
tage of this technology, as discussed earlier, is the lower pH requirements (usually 8–9) for car-bonate precipitation. The lower pH requirements result in lower alkali demand for neutralization and consequently less sludge generation (EPA, 1987). Table 13-4 Cost for Continuous Flow P/C/F System using Sodium Carbonate Precipitation* Flow Rate (gallons/hour): 1,000 10,000 Purchased Equipment and Installation (PE&I): Equalization Tank $17,000 $29,000 Precipitation Reactor 24,000 60,000 Flocculator/Clarifier 18,000 50,000 Sludge holding tanks 3,000 6,000 Filter Press 10,000 25,000 72,000 170,000 Total Capital Investment: $259,000 $612,000 (360% of PE&I) Operation and Maintenance Costs (O&M): Operating Labor $72,000 $72,000 Maintenance (6% of TCI) 15,500 36,700 General Plant Overheard 15,000 35,500 Utilities (2% of TCI) 5,200 12,200 Taxes and Insurance (1% of TCI) 2,600 6,100 Chemical Costs ($120/ton) 2,100 20,600 Sludge Transportation 200 2,100 Sludge Disposal ($200/ton) 12,800 128,400 Total O&M cost per Year: $125,400 $313,600 Cost per 1000 gallons: $17 $4.4 * 1987 Dollars
13-5
f. The following cost data for pre-packaged systems were obtained from NEESA (1993). Capital costs of 0.8-m3/min (20 gpm) and 0.246-m3/min (65 gpm) pre-packaged hydroxide metals precipitation systems are approximately $85,000 and $115,000 respectively. Operating costs, ex-cluding sludge disposal, are typically in the range of $0.08 to $0.175/m3 ($0.30 to $0.70 per 1000 gal.) of ground water containing up to 100 mg/L of metals. Sludge disposal costs can increase operating costs by approximately $0.12/m3 ($0.50 per 1000 gal.) of ground water treated. Actual sludge disposal costs (including fixation and transportation) have been estimated at approximately
EM 1110-1-4012 15 NOV 01 $660/metric ton ($300 per ton) of sludge. Operating costs for removal of iron (initial concentra-tion of 15 mg/L) and manganese (original concentration of 6 mg/L) from ground water to levels of 0.04 and 0.3 mg/L, respectively, have been estimated at approximately $0.1/m3 ($0.40 per 1000 gal.) of ground water. This assumes 2 hours per shift of operating labor. 13-3. Pre-startup Checkouts. The pre-startup checkouts are designed to verify the integrity of the system components before pre-startup testing. The following items components must be tested:
a. Check any foundations to verify that they are placed and sealed properly.
b. Verify that all equipment has been installed.
c. Check rotating equipment that requires lubrication to ensure that manufacturer’s procedures have been followed.
d. Check equipment for proper alignment, attachment, and level, particularly if it has level controls.
e. Check piping and hoses to ensure that connections are tight, and make sure that they are flushed clean.
f. Check valves for position and operability and make sure that they are flushed clean.
g. Check electrical wiring and lighting to verify that wiring has been completed correctly.
h. Check the continuity of wiring loops.
i. Check high liquid level alarms on tanks, as well as pump on/off level controls, for proper in-stallation.
j. Check chemical feed system for proper installation.
k. Check reagents for proper type and required supply quantity.
1. Check lockout devices and site security devices for proper installation. 13-4. Pre-startup Testing. The pre-startup testing of a system is designed to verify the integ-rity of the whole system before it is actually started. Test each component of the system as de-scribed below:
13-6
EM 1110-1-4012 15 NOV 01
a. Pressure-test piping and hoses transporting liquid with clean water for at least 1 hour, with no loss of pressure at 1.5 times the working pressure; pressure-test tanks at the maximum hydrau-lic head using clean water.
b. Test electrical wiring to verify that there is no wiring damage or deterioration that could harm personnel or equipment.
c. Turn on power to test equipment and control systems only after the electrical systems are tested and certified by the contractor as being ready for operation.
d. Test lighting and put it in service to support work in all areas of the plant.
e. Test all rotating equipment, such as pumps, mixers, and blowers, with hand switches to ex-amine rotation and operability.
f. Operate each pump for a period of time, at a point of maximum horsepower required under operating or simulated test conditions. Assure that the units and appurtenances have been in-stalled correctly, and that there is no over-heating, vibration, or excessive noise from any parts.
g. At this point test the control system to verify that manual and automatic controls function properly, depending on their complexity.
h. Test safety shutdown sequences, controls/alarms, and interlocks in the control system to en-sure that they are installed properly and functioning as intended.
i. Test an emergency shutoff switch, clearly labeled, at all machinery units, to verify operabil-ity.
j. Test electrical “lockout” facilities with padlocks to ensure that accidental starts are pre-vented when machinery and equipment are being worked on or otherwise taken out of service.
k. Calibrate instrumentation before systems are put into service, and test pressure and tem-perature gauges against standardized gauges. 13-5. Startup. The actual startup can begin once the pre-startup testing is complete. The startup check and functional performance tests should be done in accordance with the vendor’s recommended procedures. The startup should proceed methodically, following a plan prepared well in advance. Performance testing begins with equipment or components, proceeds through systems, and ends with the complete treatment system passing its performance specifications and contractual requirements testing. Once the system is operating at steady state , conduct a func-tional performance test as described in the following startup checklist: 13-7
EM 1110-1-4012 15 NOV 01
a. Check flow rates, temperatures, pH, and contaminant levels of the wastewater feeding the reactor tank.
b. Check pump-operating points to verify that the actual operating point matches the pump curve specification for flow and pressure.
c. Start/stop pumps from all control mechanisms.
d. Check that current draw and voltage balance match specifications for all phases.
e. Check the reagent feeding systems to verify that the actual chemical feed rate is within the specified accuracy range.
f. Check the pH in the reactor to verify that operating values are within the design range.
g. Adjust the reagent feed rates and the pH control system as required to achieve maximum metal removals.
h. Monitor the composition of the effluent to verify that it meets the specified performance re-quirements.
i. Check the clarifier overflow rate to verify that it is within the design range.
j. Check the sludge-collecting device to verify that it is operating properly, and no sludge is overflowing the weir.
k. Check the filtration system to verify that the filtration rates do not exceed the design values, and the filter backwash cycle is adequate.
1. Check the sludge dewatering system to verify that the sludge-conditioning system is func-tioning and that the sludge cake solids produced meet specifications.
m. Check the control system to verify that the system operates within set parameters.
n. Check the monitoring systems and instruments to verify that they hold calibration. 13-6. Field Training. The contract shall contain a paragraph that states that when the installa-tion is completed, and at a time designated by the contracting officer, the contractor must conduct a field-training course for a representative of the Government that details how to operate and maintain the equipment furnished under the contract. These field instructions must cover all of the items contained in the operation and maintenance instructions. Training shall be provided for a total period, as specified, of normal working time and shall start after the system is functionally 13-8
EM 1110-1-4012 15 NOV 01
complete but prior to final acceptance tests. Field instructions shall cover the items contained in the operating and maintenance instructions, as well as demonstrations of routine maintenance op-erations. A videotape of the field-training course shall be prepared as a permanent record for fu-ture training use. 13-7. Shutdowns. The P/C/F system can be automatically or manually shut down to minimize hazards and or damage to the system. The P/C/F system will shut down in the following situations:
a. When power fails at the site, the system will shut down automatically.
b. If some item of equipment fails (e.g., reactor mixer or reagent feed pump) automatic shut-
down controls will terminate the flow to the reactor.
c. When the control systems identify an operating condition that warrants shut down (e.g., blower amperage too high or high level), a warning will first be issued, an alarm will sound (au-dible, visible, and remote dialing), and the system will shut down if dangerous conditions are reached.
d. When the system requires shutdown for maintenance.
e. When the system requires shutdown after completion of the project. 13-8. Operation and Maintenance Manual Updates. The O&M Manual is intended for use by operating personnel and will be adapted to the particular features of the equipment in-stalled; therefore, the document must be written for the operator. Only simple descriptive litera-ture should be given, and any material or brochures that require a specialist or research should be excluded. The following should be included:
a. General description of the treatment process.
b. Detailed description of equipment.
c. Process flow and instrumentation diagram.
d. Certified drawings for equipment components and equipment layout.
e. Practical operating procedures, including performance testing, influent, and effluent con-centrations, and trend analysis of influent.
13-9
EM 1110-1-4012 15 NOV 01
f. Complete set of fully updated and annotated piping and instrument diagrams, process flow diagrams, instrument indexes, control ladder logic diagrams, description of controls, alarms, in-strument interface, and maintenance procedures.
g. Specialty items, such as type of oil and grease, desiccants, etc.
h. Initial startup procedures.
i. Emergency and scheduled shutdown procedures.
j. Monitoring and quality control.
k. Equipment specifications.
1. List of faults and failures for each piece of equipment.
m. Fault/failure analysis, and trouble shooting guide.
n. List of spare parts.
o. Process safety and protective equipment requirements.
p. Record keeping (electronic or other) requirements.
q. Maintenance schedule. To plan all the inspection and maintenance activities required for plant operation, the maintenance schedule must include:
(1) Systematic checkup operations for each piece of equipment.
(2) Sensor and measurement device calibration frequency.
(3) Periodic reports regarding consumption of chemicals, such as acid, caustic, polymer, and coagulants.
(4) Electronic or other recording data.
(5) Personnel training requirements.
(6) Time required for each task.
(7) Shutdown requirements during maintenance and repair. 13-10
EM 1110-1-4012 15 NOV 01
(8) Mothballing and preservation procedures.
r. Records of the entire schedule and the results of each task for future analysis. Other items shall be included as follows:
(1) Spare parts list with suppliers and costs.
(2) Plant utility requirements, such as electrical, air, drinking water, service water, and tele-phone.
(3) Detailed safety procedures for chemical handling.
(4) Name, address, and telephone number of technical personnel to contact in case of an emergency related to the treatment system. 13-9. Operation. After the performance testing has been accepted by the contracting officer, the contractor will continue to operate the system for a period, as specified. The construction contractor will be responsible for operations, maintenance, chemical testing, and record keeping in conformance with this specification until a remediation contractor takes over.
13-11
EM 1110-1-4012 15 NOV 01
APPENDIX A REFERENCES A-1. Required Publications ER 1110-345-100 Design Policy for MilitaryConstruction ER 1110-345-700 Design Analysis, Drawings, and Specifications A-2. Related Publications 40 CFR 261 Resource Conservation and Recovery Act. TM 5-800-4 Programming Cost Estimates for Military Construction TM 5-805-4 Noise and Vibration Control TM 5-810-5 Plumbing TM 5-811-1 Electrical Power Supply and Distribution TM 5-811-2 Electrical Design Interior Electrical System TM 5-813-3/AFM 88-10 Volume 3, Water Supply, Water Treatment TM 5-814-1 Sanitary and Industrial Wastewater Collection—Gravity Sewers and Appurtenances TM 5-814-3 Domestic Wastewater Treatment
A-1
EM 1110-1-4012 15 NOV 01 TM 5-814-8 Evaluation Criteria Guide for Water Pollution Prevention, Control, and Abatement Programs ER 385-1-92 Safety and Occupational Health Document Requirements for Hazardous, Toxic, and Radioactive Waste (HTRW) ER 1110-1-12 Quality Management ER 1110-1-263 Chemical Data Quality Management for Hazardous Waste Remedial Activities ER 1110-345-100 Design Policy for Military Construction EM 385-1-1 Safety and Health Requirements Manual EM 1110-1-501 Design Manual Wastewater Treatment EM 1110-1-502 Technical Guidelines for Hazardous and Toxic Waste Treatment and Cleanup Activities UFGS 01110 Safety, Health and Emergency Response (HTRW/UST) UFGS 01440 Contractor Quality Control UFGS 01450 Chemical Data Quality Control UFGS 02688 Liquid Process Piping UFGS 11211 Pumps: Water, Centrifugal
A-2
EM 1110-1-4012 15 NOV 01
UFGS 11212 Pumps: Water, Vertical Turbine UFGS 11220 Precipitation/Coagulation/Flocculation Water Treatment UFGS 11242 Chemical Feed Systems UFGS 11310 Pumps: Sewage and Sludge UFGS 11360 Plate and Frame Filter Press System UFGS 16370 Electrical Distribution System, Aerial UFGS 16375 Electrical Distribution System, Underground UFGS 16415 Electrical Work, Interior ANSI/AWWA B402-95 Standard for Ferrous Sulfate, January 1996. ANSI/AWWA B403-93 Standard for Aluminum Sulfate, October 1993. ANSI/AWWA B405-94 Standard for Sodium Aluminate, November 1994. ANSI/AWWA B406-92 Standard for Ferric Sulfate, October 1992. ANSI/AWWA B407-93 Standard for Ferric Chloride, September 1993. ANSI/AWWA B408-93 Standard for Liquid Polyaluminum Chloride, December 1993. A-3
EM 1110-1-4012 15 NOV 01 ANSI/AWWA 202-93 Standard for Quicklime and Hydrated Lime, March 1994. AWWA-10062JU Standard Methods for the Examination of Water and Wastewater, 1992. ASTM D 2035-80 Standard Practice for Coagulation-Flocculation Jar Test of Water, 1980 (reapproved 1990). EPA 430/9-79-018 Chemical Aids Manual for Wastewater Treatment Facilities, Office of Water Program Operations (WH-547), Washington D.C., 1979. EPA 540-G-89 004 Guidance for Conducting Remedial Investigations and Feasibility Studies Under CERCLA, 1988.
EPA 600/8-80-042c Treatability Manual, Vol. III, 1980. EPA 600/2-77-049 Treatment of Metal Finishing Wastes by Sulfide Precipitation, 1977. EPA 600/2-81-148 Manual of Practice for Wastewater Neutralization and Precipitation, 1981. EPA 625/1-75-003a Process Design Manual for Suspended Solids Removal. Technology Transfer, 1975. EPA 625/8-80-003 Summary Report: Control and Treatment Technology for the Metal Finishing Industry; Sulfide Precipitation, Technology Transfer Division, Washington, D.C., 1980. EPA (1987) Technical Resource Document, Treatment Technologies for Metal/Cyanide-Containing Wastes. Hazardous Waste Engineering Research Laboratory, NTIS Order Number PB 38-143896. EPA (1989) Multimedia Assessment of Pollution Control Options for Metal Finishing Operations, Risk Reduction Engineering Laboratory. A-4
EM 1110-1-4012 15 NOV 01
Naval Civil Engineering Laboratory (1984) Navy Electroplating Pollution Control Technology Assessment Manual, CR 84.019. NEESA (1993) NEESA/Remedial Action Tech Data Sheet, Metals Precipitation, March, Document No. 20.2-051.6. Port Hueneme, CA. Anderson (1994) Anderson, W.C. (ed.), Innovative Site Remediation Technology—Chemical Treatment. American Academy of Environmental Engineers. Bhattacharyya et al. (1979) Bhattacharyya, D., A.B. Jumawan, and R.B.Grieves, Separation of Toxic Heavy Metals by Sulfide Precipitation. Sep. Sci. Technol., 14:441–452. Clark et al. (1971) Clark, J.W., Viessman, W. Jr. and Hammer, M.J., Water Supply and Pollution Control. International Textbook Company, Scranton, NY. Cushnie (1984) Cushnie, G.C., Removal of Metals from Wastewater: Neutralization and Precipitation. Pollution Technology Review, No. 107, Noyes Publications, Park Ridge N.J. Grosse (1986) Grosse, D.W., A Review of Alternative Treatment Processes for Metal-Bearing Hazardous Waste Streams. Journal of the Air Pollution Control Association. Hoffman (1972) Hoffman, F., How to Select a pH Control System for Neutralizing Waste Acids. Chemical Engineering. Hoyle (1976) Hoyle, D.L., Designing for pH Control. Chemical Engineering. Kim (1981) Kim, B.M. Treatment of Metal Containing Wastewater with Calcium Sulfide. In AIChE Symposium Series, Water 1980, 77(209): 39–48.
Kim and Amadeo (1983) Kim, B.M. and P.A. Amadeo, Calcium Sulfide Process for Treatment of Metal-Containing Wastes. Environ. Prog., 2(3): 175–180. A-5
EM 1110-1-4012 15 NOV 01 Ku and Peters (1986) Ku, Y., and R.W. Peters, The Effect of Weak Chelating Agents on the Removal of Heavy Metals by Precipitation Processes. Environ. Prog., 5(3): 147–153. Meltcalf & Eddy, Inc. (1991) Wastewater Engineering—Treatment, Disposal, and Reuse, 3rd ed. McGraw-Hill, Inc. Patterson (1988) Patterson, J.W., Metal Treatment and Recovery. Patterson and Minear (1975) Patterson, J.W. and R.A. Minear, Physical-Chemical Methods of Heavy Metals Removal. In Heavy Metals in the Aquatic Environment (P.A. Krenkel, ed.), pp. 261–276. Oxford, England: Pergamon Press. Peters et al. (1985) Peters, R.W., Y.Ku, and D. Bhattacharyya, Evaluation of Recent Treatment Techniques for Removal of Heavy Metals from Industrial Wastewaters. AICHE Symposium Series, Separation of Heavy Metals and Other Contaminants, 81(243): 165–203. Public Works (1994) Coagulation Control and Optimization, November, pp. 32–33. Scott (1979) Scott, M.C., An EPA Demonstration Plant for Heavy Metals Removal by Sulfide Precipitation. In Proc. 2nd Conference Advanced Pollution Control for Metal Finishing Industry. Talbot (1984) Talbot, R.S., Co-precipitation of Heavy Metals with Soluble Sulfides Using Statistics for Process Control. In Proc. 16th Mid-Atlantic Industrial Waste Conf., 16: 279–88. Terringo (1986) Terringo, J., Magnesium Hydroxide for Neutralizing Acid Waste-Containing Metals. Plating and Surface Finishing. Tchobanoglous and Schroeder (1985) Tchobanoglous G. and E.D. Schroeder, Water Quality. Addison-Wesley Publishers. Water Environment Federation (1991) Design of Municipal Wastewater Treatment Plants. Manual of Practice No. 8.
A-6
EM 1110-1-4012 15 NOV 01
Water Environment Federation (1993) Instrumentation in Wastewater Treatment Facilities. Manual of Practice No. 21. Water Environment Federation (1994) Pretreatment of Industrial Wastes. Manual of Practice FD-3. Water Pollution Control Federation (1977) Wastewater Treatment Plant Design—A Manual of Practice. Whang et al. (1981) Whang, J.S., D. Young, and M. Pressman, Design of Soluble Sulfide Precipitation System for Heavy Metals Removal. In Proc. 14th Mid-Atlantic Indus. Waste Conf., pp. 13.63–71. A-5
A-7
EM 1110-1-4012 15 NOV 01
APPENDIX B LIST OF ABBREVIATIONS ANSI - American National Standards Institute AWWA American Water Works Association C - Celsius Ca (OH)2 - Hydrated Lime CaO - Quicklime CFR - Code of Federal Regulations EC - Engineer Circular EM - Engineer Manual EPA - Environmental Protection Agency ER - Engineer Regulation gpm - Gallons per minute HP - Horsepower HTRW - Hazardous, toxic, and radioactive waste Ki - Instability constant Ksp - Solubility product kW - Kilowatts M+, M+2 - Metal ion mg/L - Milligrams per liter mV - Millivolts O&G - Oil and grease O&M - Operation and maintenance ORP - Oxidation reduction potential P/C/F - Precipitation/coagulation/flocculation TDS - Total dissolved solids TM - Technical Manual TSS - Total suspended solids USACE - U.S. Army Corps of Engineers
B-1
EM 1110-1-4012 15 NOV 01
APPENDIX C DESIGN EXAMPLES C-1. Problem (English Units). 300,000 gal/day of landfill leachate and ground water have the following characteristics: • pH: 6.5. • Cr+6: 15 mg/L. • Total Cr: 75 mg/L. • Zn2+: 35 mg/L. • Suspended solids: 25 mg/L. • Dissolved oxygen: 2 mg/L.
a. The Feasibility Study determined that the method of treatment would be chemical reduc-tion of chromium (Cr+6 to Cr+3) using sulfur dioxide, followed by hydroxide precipitation using lime, followed by coagulation, flocculation, and clarification. The full-scale treatment system will be designed to operate 24 hours/day.
b. During initial bench-scale testing, a 1-L sample of raw wastewater was titrated with 0.1 N sulfuric acid and then neutralized with lime, yielding the results shown in Figures C-1 and C-2 below.
Figure C-1. Titration curve for acidication of chromium waste.
C-1
EM 1110-1-4012 15 NOV 01
(0.41 m)
c. Column testing was also conducted to deterfier. Results of column testing are shown in Figu
d. From the data given above, determine the f
(1) The chemical requirements to precipitatwater, assuming that sulfur dioxide will be used aas the precipitant. Assume that the final neutraliz
(2) The daily sludge production, assuming coagulant and that 1 mg/L polymer will be used aspecific gravity of 1.02 and is 3% solids. C-
Figure C-2. Titration curve for neutralization of waste following chromium reduction.
Figure C-3. Column testing results.
mine the expected solidre C-3.
ollowing:
e chromium and neutras the reducing agent aned pH will be 8.5.
that 10 mg/L ferric chlos a coagulant aid. Assu
2
s loading to the clari-
lize the treated waste-d that lime will be used
ride will be used as a me that the sludge has a
EM 1110-1-4012 15 NOV 01
(3) The required coagulation and flocculation tank volumes, using a 1-minute rapid-mix
(coagulation) time and a 30-minute slow-mix (flocculation) time.
(4) The theoretical power requirement and required paddle area for the flocculation step, assuming a paddle tip speed of 1.2 ft/s.
(5) The solids settling area required for an inclined plate clarifier,assuming continuous treatment. Note the results of the column testing shown in Figure C-3.
(6) The effectiveness of the proposed method of treatment if the leachate originally con-tained 5 mg/L of cadmium.
(7) Additional testing to confirm the theoretical (stoichiometric calculations) results. C-2. Solution.
a. Chemical Requirements.
(1) Sufuric Acid. Sulfuric acid is required because chromium reduction using sulfur diox-ide is typically conducted at a pH of 2.5 to 3. Examining Figure C-1 shows that approximately 25 mL of 0.1 N H2SO4 is required to acidify 1 L of wastewater to pH 3.0. This is equal to an acid dose of:
( ) 2 4mL 2.5 meq. H SO25 0.1 N L L
× =
The acid feed rate required to achieve this dose will depend on the normality of acid used for treatment. (Note: Typical required retention times for chromium reduction at a pH of 3 range from 2 to 20 minutes, depending on the initial hexavalent chromium concentration.)
(2) Sulfur Dioxide. The equations that govern the reduction of hexavalent chromium to trivalent chromium using sulfur dioxide are as follows:
2 2 2 3
2 4 2 3 2 4 3 2
22 3 2 4
SO + H O H SO2H CrO + 3H SO Cr (SO ) + 5H O
1H SO + O H SO2
→→
→
C-3
EM 1110-1-4012 15 NOV 01 Using the above equations and molar ratios, and assuming that the reactions go to completion, gives the SO2 requirements as follows for Cr+6: Because 3 moles of SO2 yield 3 moles of H2SO3, then:
2 +3 (32 2(16)) mg mg1.85 SO per Cr 2 52 L L
× + =×
6
(Note: The quantity (32 + 2(16)), or 64, is the gram atomic weight of sulfur dioxide. The quan-tity 52 is the gram atomic weight of chromium.) And the requirements for O2 are:
2 232 2(16) mg mg4 SO per O 1 L L2(16)2
+ =×
Therefore, SO2 required mgL
=
+62
mg mg mg(1.85)15 Cr + 4 (2.0) O = 35.8 L L L
(3) Lime. Lime is required to raise the pH of the wastewater to precipitate chromium. As-
sume that the lime is 90% pure.
(a) The amount of lime required to neutralize the wastewater to pH 8.5, as indicated in Figure C-2, is approximately 107 mg/L.
(b) The amount of lime required to precipitate the chromium can be calculated using the equation below:
2 4 3 2 3 4
3+2
Cr (SO ) + 3Ca (OH) 2Cr (OH) + 3CaSO
3 (40 + 2 (16) + 2(1)) mg mg= 2.14 of Ca (OH) per of Cr 2 (52) L L
→
The total lime requirement to precipitate trivalent chromium is based on the combined total of trivalent and hexavalent chromium present in the raw wastewater (75 mg/L).
C-4
EM 1110-1-4012 15 NOV 01
2
2.14 × 75 mgCa (OH) required (90% pure) = 0.90 L
mg= 178.3L
(c) Lime is also required to precipitate zinc (35 mg/L). The minimum solubility of zinc
hydroxide occurs at approximately pH 9.0 (relatively close to 8.5, see Figure 2-2). Therefore, for simplicity, assume that the lime reaction with zinc goes to completion at pH 8.5. The amount of lime can be calculated using the equation below:
2+ 2+2 2
2+2
Ca (OH) + Zn Zn (OH) + Ca
(40 + 2 (16) + 2 (1) mg mg= 1.13 of Ca(OH) per of Zn 65.4 L L
→
21.13× 35 mgCa (OH) required (90% pure) = = 43.9
0.90 L
(d) The amount of lime required to neutralize the H2SO4 produced from dissolved oxy-
gen initially present in the wastewater can be calculated from the equations below:
22 3 2 4
2 4 2 4 2
1H SO + O H SO2
H SO + Ca (OH) CaSO + 2H O
→
→
( ) ( )( )
( ) ( )2 4 2
2 4 2
2 1 + 32 + 16 4 mg mg= 6.12 H SO produced per O present 1 L L2 162
mg mgH SO produced = 6.12 × 2 O = 12.2L L
Therefore, the lime requirement, from the second equation, is:
C-5
EM 1110-1-4012 15 NOV 01
( ) ( )( )( ) ( )( ) 2 4
2
40 + 2 16 + 2 1 mg mg= 0.76 lime per H SOL L2 1 + 32 + 4 16
(e) Therefore, the total amount of lime = 107 + 178.3 + 43.9 + 10.3 = 339.5 mg/L
Or, in lb/day:
mg 8.34 lb× L 0.3 MG lb339.5 × × = 849.4 L mg × MG day day
b. Daily Sludge Production.
(1) Chromium Hydroxide Sludge.
2
2 3
mgCa (OH) dosage (90% pure):178.3L
1 mole178.3 mg × = 0.00241 mol74,000 mg
3 moles of Ca (OH) forms 2 moles of Cr (OH) sludge.
Therefore, mg of Cr(OH)3 formed per liter =
( )2 mg0.00241 mol 103,000 = 165.5 mg 3 mol
(2) Zinc Hydroxide Sludge.
C-6
EM 1110-1-4012 15 NOV 01
2
2 2
mgCa (OH) dosage: 43.9L
1 mole43.9 mg × = 0.000593 mol74,000 mg
1 mole of Ca (OH) forms 1 mole of Zn (OH)
Therefore, mg of Zn(OH)2 formed per liter
( ) mg0.000593 mol 99,400 = 58.9 mg L
(3) Suspended Solids. Given in problem statement (25 mg/L). (4) Coagulant and Coagulant Aid. Given in problem statement. Assume that all coagulant
and coagulant aid settle out of solution and subsequently contribute to the sludge volume. There-fore, coagulant at 10 mg/L + coagulant aid at 1 mg/L = 11 mg/L.
(5) Total Sludge. 165.5 mg + 58.9 mg + 25 mg +11 = 260.4 mg/L or
mg 8.34 lb× L 0.3 MG lb260.4 × × = 651 L mg × MG day day
As mentioned in the problem statement, with the assumption that the sludge is 3% solids and that the specific gravity of the sludge is 1.02, the volume that will require disposal each day can be calculated as follows:
( ) ( )
( )3
33
lb651ftday = 340.9 12.6 yd daylb62.4 1.02 0.03
ft
c. Required Volumes of Coagulation and Flocculation Units.
C-7
EM 1110-1-4012 15 NOV 01
(1) Coagulation Tank.
( )3
3gal day ft300,000 1 min = 27.9 ft day 1440 min 7.48 gal
for a cubicle tank, approximately 3 × 3 × 3 ft.
(2) Flocculation Tank.
( )3
3gal day ft300,000 30 min = 835.6 ft day 1440 min 7.48 gal
Assume a length-to-width ratio of 2:1. A rectangular tank, 5 ft. deep, would be approximately 18 × 9 × 5 ft = 810 ft3.
d. Calculate the Theoretical Power Requirement and Required Paddle Area for the Floccu-lation Step.
(1) Theoretical Power Requirement. Rearranging the equation
0.5
= in Paragraph 9-1: PGV µ
P = µG2V where:
µ = absolute fluid viscosity, lb-s/ft2 (for water at 20°C = 2.1 ×10⁻⁴ lb-s/ft2) V = tank volume ft3 P = power, ft-lb/s
G = mean velocity gradient, ft/s-ft (Note that typical G Value for flocculation is 30 ft/s-ft, see Chapter 9). Therefore P = (0.21 ×10⁻⁴ lb-s/ft2) (30 ft/s-ft)2(810 ft3) = 15.3 ft-lb/s
C-8
EM 1110-1-4012 15 NOV 01
= 15.3/500 = 0.031 HP.
(2) Paddle Area Requirement. Rearranging the equation P = CA ρ V3/2 in Paragraph 9-1:
A = 3D
2 PC v ρ
use a paddle tip speed of 1.2 fps, where: A = paddle area P = power requirement (ft-lb/s) CD = dimensionless coefficient of drag (typically taken as 1.8)
v = relative velocity of paddle in fluid, fps (Assume to be 0.75 times the paddle tip speed) ρ = mass fluid density (at 20°C, 1.94 lb-s/ft3, or slugs/ft3). Therefore:
( )( ) ( )( ) ( )( )3
2
2 15.3
1.8 0.75 1.2 1.94
12.0 ft
A =×
=
e. Calculate the Solids Settling Area Required for Inclined Plate Clarifier. Figure C-3 shows
the results of the column testing. The column tests determined that the settling rate was 1.34 ft in 18 minutes. Convert this to commonly used units. (Note: 1.34 ft is the height of the solid/liquid interface at time zero, when the column is filled to 1000 mL.)
3 21.34 ft ×7.48gal/ft = 0.56 gpm/ft 18 min
(1) For continuous rate divide by 2 (per manufacturer):
C-9
EM 1110-1-4012 15 NOV 01
2
22
0.56 gpm= 0.282 ft
gal day300,000 = 208.3gpmday 1440 min
ftSolids settling area required = 208.3 gpm × = 744 ft 0.28 gpm
(Note: Most manufacturers of inclined plate clarifiers recommend a rate of 0.25 gpm/ft2 for metal hydroxide precipitates. Rates should not exceed 1.0 gpm/ft2.)
(2) For one manufacturer, the required dimensions of an inclined plate clarifier to accom-modate 744 ft2 of effective settling area would be: 6 ft × 10 ft × 12 ft Operating weight would be approximately 34,000 lb.
f. How Effective Would the Proposed Method of Treatment be if the Leachate Originally Contained 5 mg/L of Cadmium? See Figure 2-2. Cadmium is removed through hydroxide pre-cipitation as follows: Ca(OH)2 + Cd2+ → Cd(OH)2 + Ca2+ Note that the minimum solubility of cadmium hydroxide occurs at pH > 11. At a pH of 8.5, the solubility of cadmium hydroxide is high (greater than 100 mg/L). Therefore, by raising the pH to only 8.5 or 9 (to remove chromium and zinc), the cadmium concentration would not be re-duced below the original concentration of 5 mg/L. To effectively remove cadmium, a second stage precipitation/clarification step would be required where the pH would be raised to 11. (Note: Results of jar testing could show that co-precipitation of cadmium hydroxide may occur, thereby effectively lowering the cadmium hydroxide concentration.)
g. Should Additional Tests be Conducted to Confirm the Theoretical Results? Yes, it is im-portant that jar testing be conducted to determine if the theoretical results are accurate. Often-times, actual chemical requirements can differ significantly with stoichiometric calculations. This can be caused by a number of things (see Paragraph 2-2).
C-10
EM 1110-1-4012 15 NOV 01
C-3. Problem (SI Units). 1000 m3/day of landfill leachate and ground water have the follow-ing characteristics:
a. The Feasibility Study determined that the method of treatment would be chemical reduc-
tion of chromium (Cr+6 to Cr+3) using sulfur dioxide, followed by hydroxide precipitation using lime, followed by coagulation, flocculation, and clarification. The full-scale treatment system will be designed to operate 24 hours/day.
b. During initial bench-scale testing, a 1-L sample of raw wastewater was titrated with 0.1 N sulfuric acid and then neutralized with lime, yielding the results shown in Figures C-1 and C-2.
c. Column testing was also conducted to determine the expected solids loading to the clari-fier. Results of column testing are shown in Figure C-3.
d. From the data given above, determine the following:
(1) The chemical requirements to precipitate chromium and neutralize the treated waste-water, assuming that sulfur dioxide will be used as the reducing agent and that lime will be used as the precipitant. Assume that the final neutralized pH will be 8.5.
(2) The daily sludge production, assuming that 10 mg/L ferric chloride will be used as a coagulant and that 1 mg/L polymer will be used as a coagulant aid. Assume that the sludge has a specific gravity of 1.02 and is 3% solids.
(3) The required coagulation and flocculation tank volumes, using a 1 minute rapid-mix (coagulation) time and a 30 minute slow-mix (flocculation) time.
(4) The theoretical power requirement and required paddle area for the flocculation step, assuming a paddle tip speed of 0.4 m/s.
(5) The solids settling area required for an inclined plate clarifier, assuming continuous treatment. Note the results of the column testing shown in Figure C-3.
C-11
EM 1110-1-4012 15 NOV 01
(6) If the leachate originally contained 5 mg/L of cadmium, how effective would the pro-posed method of treatment be?
(7) Should additional testing be conducted to confirm the theoretical (stoichiometric cal-culations) results? C-4. Solution.
a. Chemical Requirements.
(1) Sufuric Acid. Sulfuric acid is required because chromium reduction using sulfur diox-ide is typically conducted at a pH of 2.5 to 3. Figure C-1 shows that approximately 25 mL of 0.1 N H2SO4 is required to acidify 1 L of wastewater to pH 3.0. This is equal to an acid dose of:
( ) 2 4mL meq. H SO25 0.1N 2.5 L L
× =
The acid feed rate required to achieve this dose will depend on the normality of acid used for treatment. (Note: Typical required retention times for chromium reduction at a pH of 3 range from 2 to 20 minutes, depending on the initial hexavalent chromium concentration.)
(2) Sulfur Dioxide. The equations that govern the reduction of hexavalent chromium to trivalent chromium using sulfur dioxide are as follows:
( )2 2 2 3
2 4 2 3 2 4 23
2 3 2 2 4
SO + H O H SO
2H CrO + 3H SO Cr SO + 5H O
1H SO + O H SO2
→
→
→
Using the above equations and molar ratios, and assuming that the reactions go to completion, gives the SO2 requirements follows for Cr+6. Because 3 moles of SO2 yield 3 moles of H2SO3, then:
( )( ) +6
2
3× 32 + 2 16 mg mg= 1.85 SO per Cr 2 52 L L×
(Note that the quantity (32 + 2(16)), or 64, is the gram atomic -weight of sulfur dioxide. The quantity 52 is the gram atomic-weight of chromium.) And the requirements for O2 are:
C-12
EM 1110-1-4012 15 NOV 01
( )( )
2 2
32 + 2 16 mg mg= 4 SO per O 1 L L× 2 162
Therefore, SO2 required (mg/L) =
( ) ( )+62
mg mg mg1.85 15 Cr + 4 2.0 O = 35.8 L L L
(3) Lime. Lime is required to raise the pH of the wastewater to precipitate chromium. As-
sume that the lime is 90% pure.
(a) The amount of lime required to neutralize the wastewater to pH 8.5, as indicated in Figure 2-2, is approximately 107 mg/L.
(b) The amount of lime required to precipitate the chromium can be calculated using the equation below:
( ) ( ) ( ) ( )( ) ( )( )( ) ( )
2 4 3 2 3 4
3+2
Cr SO + 3Ca OH 2Cr OH + 3Ca SO
3 40 + 2 16 + 2 1 mg mg= 2.14 of Ca OH per of Cr 2 52 L L
→
The total lime requirement to precipitate trivalent chromium is based on the combined total of trivalent and hexavalent chromium present in the raw wastewater (75 mg/L).
( ) ( )2
2.14 ×75 mgCa OH required 90% pure = 0.90 L
mg= 178.3L
(c) Lime is also required to precipitate zinc (35 mg/L). The minimum solubility of zinc
hydroxide occurs at approximately pH 9.0 (relatively close to 8.5—see Figure 2-2). Therefore, for simplicity, assume that the lime reaction with zinc goes to completion at pH 8.5. The amount of lime can be calculated using the equation below:
C-13
EM 1110-1-4012 15 NOV 01
( ) ( )( ) ( ) ( )
( )
2+2+2 2
2+2
2
Ca OH + Zn Zn OH + Ca
40 + 2 16 + 2 1 mg mg= 1.13 of Ca OH per of Zn 65.4 L L
1.13× 35 mgCa OH required (90%pure) = = 43.90.90 L
→
(d) The amount of lime required to neutralize the H2SO4 produced from dissolved oxy-
gen initially present in the wastewater can be calculated from the equations below:
( )
2 3 2 2 4
2 4 4 22
1H SO + O H SO2
H SO + Ca OH CaSO + 2H O
→
→
( ) ( )( )( )( )
2 4 2
2 4 2
2 1 + 32 + 16 4 mg mg= 6.12 H SO produced per O present 1 L L2 162
mg mgH SO produced = 6.12 × 2 O = 12.2L L
Therefore, the lime requirement, from the second equation, is:
( ) ( )( )( ) ( )
( )
2 4
2
40 + 2 16 + 2 1 m mg= 0.76 lime per H SO2 1 + 32 + 4 16 L L
mg0.76 ×12.2LCA OH required (assuming 90% pure) =
0.90mg= 10.3L
(e) Therefore, the total amount of lime = 107 = 339.5 mg/L 3.109.433.178 +++
Or, in kg/day:
3
3 6
mg L m kg kg339.5 1000 1000 = 339.5 L m day 10 mg day
C-14
EM 1110-1-4012 15 NOV 01
b. Daily Sludge Production.
(1) Chromium Hydroxide Sludge.
( ) ( )
( ) ( )( )
( )
2
2 3
3
mgCa OH dosage 90% pure :178.3L
1 mole178.3 mg × = 0.00241 mol74,000 mg
3 moles of Ca OH forms 2 moles of Cr OH sludge.
Therefore, mg of Cr OH formed per liter =
2 mg0.00241 mol 103,000 = 165.5 mg3 mol
(2) Zinc Hydroxide Sludge.
( )
( ) ( )( )
( )
2
2 2
2
mgCA OH dosage: 43.9L
1mole43.9 mg × = 0.000593 mol74,000 mg
1 mole of Ca OH forms 1 mole of Zn OH
Therefore, mg of Zn OH formed per liter =
mg0.000593 mol 99,400 = 58.9 mgmol
(3) Suspended Solids. Given in problem statement (25 mg/L).
(4) Coagulant and Coagulant Aid. Given in problem statement. Assume that all coagulant
and coagulant aid settle out of solution and subsequently contribute to the sludge volume. There-fore 10 mg/L of coagulant + 1mg?L of coagulant aid = 11 mg/L.
(5) Total Sludge.
C-15
EM 1110-1-4012 15 NOV 01
3
3 6
165.5 mg + 58.9 mg + 25 mg + 11 = 260.4 mg/Lor
mg L m kg kg260.4 1000 1000 = 260.4 L m day 10 mg day
As mentioned in the problem statement, with the assumption that the sludge is 3% solids and that the specific gravity of the sludge is 1.02, the volume that will require disposal each day can be calculated as follows:
( ) ( )
3
3
kg260.4mday 8.51 kg day1000 1.02 0.03
m
=
c. Required Volumes of Coagulation and Flocculation Units.
(1) Coagulation Tank.
( )3
3m day1000 1min = 0.69 m day 1440min
for a cubicle tank, approximately 0.9 × 0.9 × 0.9 m.
(2) Flocculation Tank.
( )3
3m day1000 30 min = 20.8 m day 1440 min
Assume a length-to-width ratio of 2:1. A rectangular tank, 2 m deep, would be approximately, 5 × 2 × 2 = 20 m3.
d. Calculate the Theoretical Power Requirement and Required Paddle Area for the Floccu-lation Step.
(1) Theoretical Power Requirement. Rearranging the equation:
C-16
EM 1110-1-4012 15 NOV 01
0.5
2
2
32
3
in Paragraph 9-1:
N-swhere : absolute fluid viscosity,m
N-s(for water at 20 C, 1 10 m
tank volume, mpower, W
mmean velocity gradient,s-m
PGV
P G V
VP
G
−
=
=
=
° = × −
==
=
µµ
µ
µ
(Note that the typical G value for flocculation is 30/s, see Chapter 9.) Therefore
( )2
3 32
N - s m1.00 10 30 20 m m s-m
18 W
P − = ×
=
(2) Paddle Area Requirement. Rearranging the equation
3
D
3d
2
D
in Paragraph 9 1:2
2 0.4 muse a paddle tip speed ofs
where: paddle area, mPower requirement, Wdimensionless coefficient of drag (typically taken as1.8)
mrelative velocity of paddle in fluid,s
(
pvP C A
PAC
APC
ν ρ
ν
= −
=
===
=
3
Assume to be 0.75 times the paddle tip speed.)kgmass fluid density (at 20 C, )m
ρ = °
Therefore
C-17
EM 1110-1-4012 15 NOV 01
( )( ) ( )( ) ( )( )3
2
2 18
1.8 0.75 0.4 1000
0.74 m
A =×
=
e. Calculate the Solids Settling Area Required for Inclined Plate Clarifier. Figure C-3 shows
the results of the column testing. The column tests determined that the settling rate was 0.41 m in 18 minutes. Convert this to commonly used units (Note: 0.41 m is the height of the solid/liquid interface at time zero, when the column is filled to 1000 mL):
3
3
0.41 m m /min= 0.023 18 min m
For continuous rate divide by 2 (per manufacturer):
3
3
33
3 33
3
0.023 0.11 m /min=2 m
1000 m day = 0.694 m /min day 1440 min
Solids settling area required :0.694 m m= = 63 m
min 0.011 m /min
×
(Note: Most manufacturers of inclined plate clarifiers recommend a rate of 0.010 (m3/min)/m2 for metal hydroxide precipitates. Rates should not exceed 0.04 (m3/min)/m2.)
f. How Effective Would the Proposed Method of Treatment be if the Leachate Originally Contained 5 mg/L of Cadmium? See Figure 2-2. Cadmium is removed through hydroxide pre-cipitation as follows: ( ) ( )2+ 2+
2 2Ca OH + Cd Cd OH + Ca →
Note that the minimum solubility of cadmium hydroxide occurs at pH > 11. At a pH of 8.5 the solubility of cadmium hydroxide is high (greater than 100 mg/L). Therefore, by raising the pH to only 8.5 or 9 (to remove chromium and zinc), the cadmium concentration would not be re-duced below the original concentration of 5 mg/L. To effectively remove cadmium, a second stage precipitation/clarification step would be required where the pH would be raised to 11.
C-18
EM 1110-1-4012 15 NOV 01
(Note: Results of jar testing could show that co-precipitation of cadmium hydroxide may occur, thereby effectively lowering the cadmium hydroxide concentration.)
g. Should Additional Tests be Conducted to Confirm the Theoretical Results? Yes, it is im-portant that jar testing be conducted to determine if the theoretical results are accurate. Often-times, actual chemical requirements can differ significantly with stoichiometric calculations. This can be caused by a number of things (see Paragraph 2-2).