46
RETIREMENT INSIGHTS Guide to Retirement 2016 Edition RETIREMENT INSIGHTS SM
RETIREMENT INSIGHTS
Guide to Retirement2016 Edition
RETIREMENT INSIGHTS
SM
2
2Table of contents
Retirement landscape Factors that shape today’s retirement experience
Saving Behaviors and best practices while saving for retirement
Spending Behaviors and considerations for living in retirement
InvestingBuilding a retirement portfolio
Reference
4
14
21
29
37
S. Katherine Roy, CFP®
Chief Retirement StrategistSharon Carson, CRPC®
Retirement Strategist
Lena Rizkallah, J.D.Retirement Strategist
J .P. MORGAN RETIREMENT STRATEGIST TEAM
Certified Financial Planner Board of Standards Inc. owns the certification marks CFP®, CERTIFIED FINANCIAL PLANNER™ and CFP® in the U.S., which it awards to individuals who successfully complete CFP Board’s initial and ongoing certification requirements.
3
3
Retirement landscape 5 The retirement equation6 Life expectancy probabilities7 Older Americans in the workforce8 Managing expectations of ability to work9 Social Security timing tradeoffs10 Maximizing Social Security benefits 11 Older individuals experience higher inflation 12 Spending and inflation13 Historic income tax rates
Saving15 Retirement savings checkpoints16 Benefit of saving and investing early17 Savings rate18 The toxic effect of loans and withdrawals19 Evaluate a Roth20 The power of tax-deferred compounding
Spending22 Dollar cost ravaging—timing risk of withdrawals23 Changes in spending24 Effects of withdrawal rates and portfolio allocations25 Rising annual health care costs in retirement26 Variation in Medicare Advantage costs27 Long-term care planning28 Annual cost of nursing home care (private room)
Page reference
Investing30 Goals-based wealth management31 Structuring a portfolio to match investor goals in retirement32 Structuring a portfolio in retirement: The bucket strategy33 Maintain a diversified approach and rebalance 34 Diversification35 Impact of being out of the market36 Major asset classes vs. inflation
Reference37 Traditional IRAs vs. Roth IRAs—2015/201638 Retirement plan contribution and deferral limits—2015/201639 Options to consider when retiring or changing jobs40 What is Medicare?41 65 and working: Should I sign up for Medicare?42 Annuity basics43 A closer look at tax rates—201644 Top state income tax rates—2016
4
4
Retirement landscape
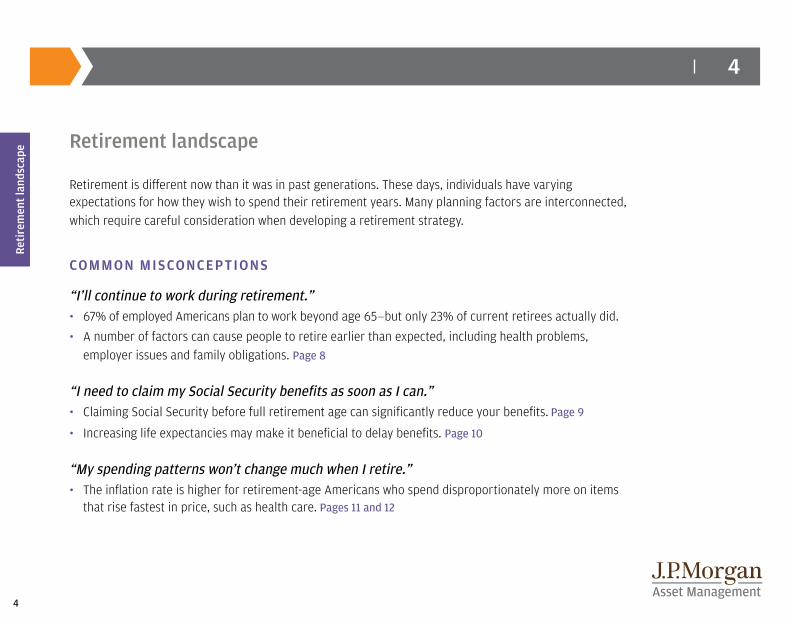
Retirement is different now than it was in past generations. These days, individuals have varying expectations for how they wish to spend their retirement years. Many planning factors are interconnected, which require careful consideration when developing a retirement strategy.
COMMON MISCONCEPTIONS
“I’ll continue to work during retirement.”• 67% of employed Americans plan to work beyond age 65—but only 23% of current retirees actually did.
• A number of factors can cause people to retire earlier than expected, including health problems, employer issues and family obligations. Page 8
“I need to claim my Social Security benefits as soon as I can.”• Claiming Social Security before full retirement age can significantly reduce your benefits. Page 9
• Increasing life expectancies may make it beneficial to delay benefits. Page 10
“My spending patterns won’t change much when I retire.”• The inflation rate is higher for retirement-age Americans who spend disproportionately more on items
that rise fastest in price, such as health care. Pages 11 and 12
Reti
rem
ent l
ands
cape
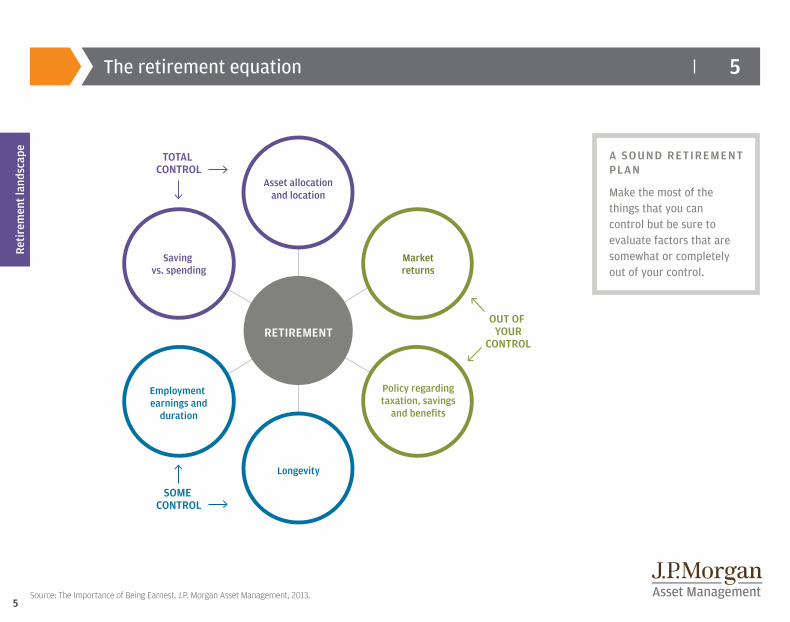
Longevity
Saving vs. spending
Employmentearnings and
duration
Marketreturns
Policy regardingtaxation, savings
and benefits
Asset allocationand location
TOTAL CONTROL
OUT OF YOUR
CONTROL
SOME CONTROL
RETIREMENT
Source: The Importance of Being Earnest, J.P. Morgan Asset Management, 2013.5
A SOUND RETIREMENT PLAN
Make the most of the things that you can control but be sure to evaluate factors that are somewhat or completely out of your control.
The retirement equation 5
Reti
rem
ent l
ands
cape
6
6
Reti
rem
ent l
ands
cape
Life expectancy probabilities
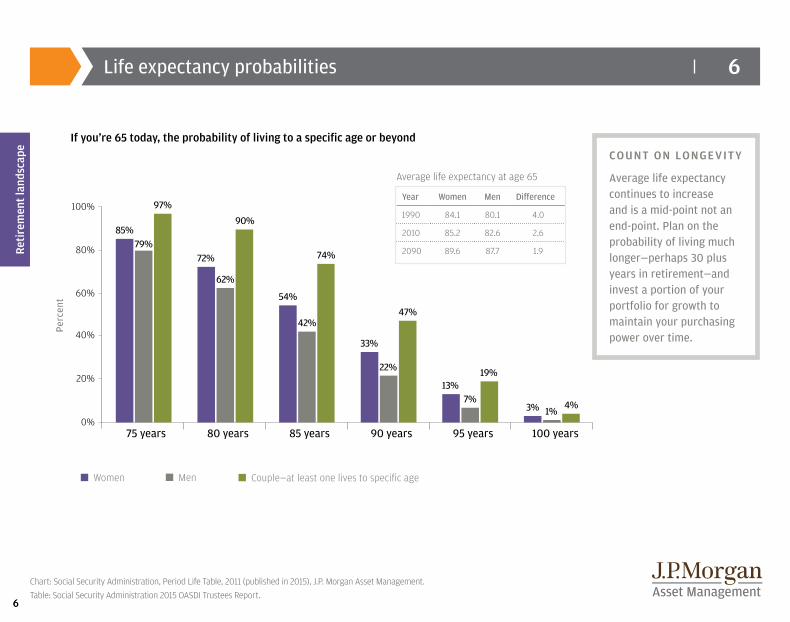
Chart: Social Security Administration, Period Life Table, 2011 (published in 2015), J.P. Morgan Asset Management.Table: Social Security Administration 2015 OASDI Trustees Report.
COUNT ON LONGEVITY
Average life expectancy continues to increase and is a mid-point not an end-point. Plan on the probability of living much longer—perhaps 30 plus years in retirement—and invest a portion of your portfolio for growth to maintain your purchasing power over time.
If you’re 65 today, the probability of living to a specific age or beyond
100%
80%
60%
40%
20%
0%75 years 80 years 85 years 90 years 95 years 100 years
Perc
ent
85%
72%
54%
33%
13%
3%
79%
62%
42%
22%
7%1%
97%
90%
74%
47%
19%
4%
Women Men Couple
n Women n Men n Couple—at least one lives to specific age
6
Year Women Men Difference
1990 84.1 80.1 4.0
2010 85.2 82.6 2.6
2090 89.6 87.7 1.9
Average life expectancy at age 65
7
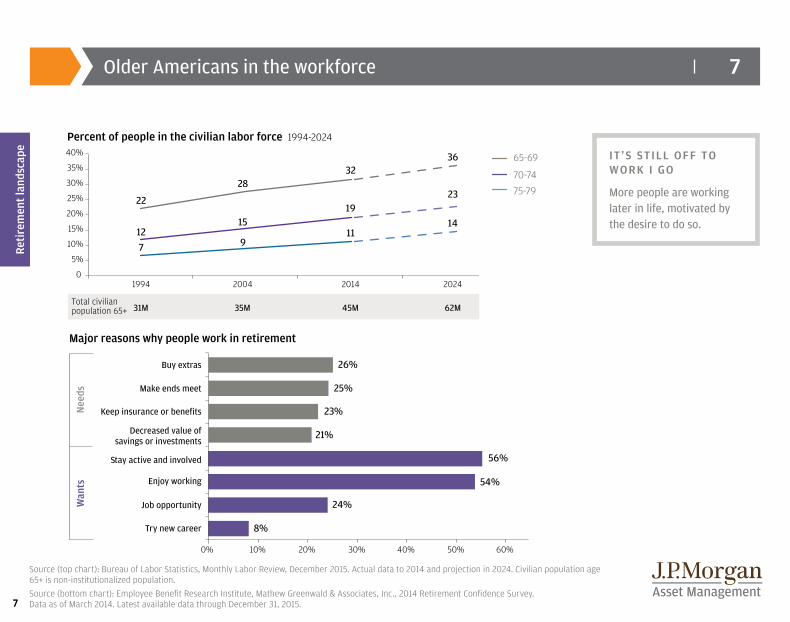
7Older Americans in the workforce
IT ’S STILL OFF TO WORK I GO
More people are working later in life, motivated by the desire to do so.
Reti
rem
ent l
ands
cape
Major reasons why people work in retirement
Percent of people in the civilian labor force 1994-2024
7
65-69
70-74
75-79
Stay active and involved
Enjoy working
Job opportunity
Try new career
10% 20% 30% 40% 50% 60%0%
Nee
dsW
ants
40%
35%
30%
25%
20%
15%
10%
5%
01994 2004 2014 2024
22
127
28
15
9
1923
14
32
11
36
Decreased value ofsavings or investments
21%
Buy extras 26%
Make ends meet 25%
Keep insurance or benefits 23%
56%
54%
24%
8%
Total civilianpopulation 65+
Age 65+
31M 35M 45M 62M
Stay active and involved
Enjoy working
Job opportunity
Try new career
10% 20% 30% 40% 50% 60%0%
Nee
dsW
ants
40
35
30
25
20
15
10
5
0
1992 2002 2012 2022
20.6
11.1
6.3
26.1
14.0
7.4
19.524.0
14.9
32.1
11.4
38.3
Decreased value ofsavings or investments
21%
Buy extras 26%
Make ends meet 25%
Keep insurance or benefits 23%
56%
54%
24%
8%
Source (top chart): Bureau of Labor Statistics, Monthly Labor Review, December 2015. Actual data to 2014 and projection in 2024. Civilian population age 65+ is non-institutionalized population.Source (bottom chart): Employee Benefit Research Institute, Mathew Greenwald & Associates, Inc., 2014 Retirement Confidence Survey. Data as of March 2014. Latest available data through December 31, 2015.
8
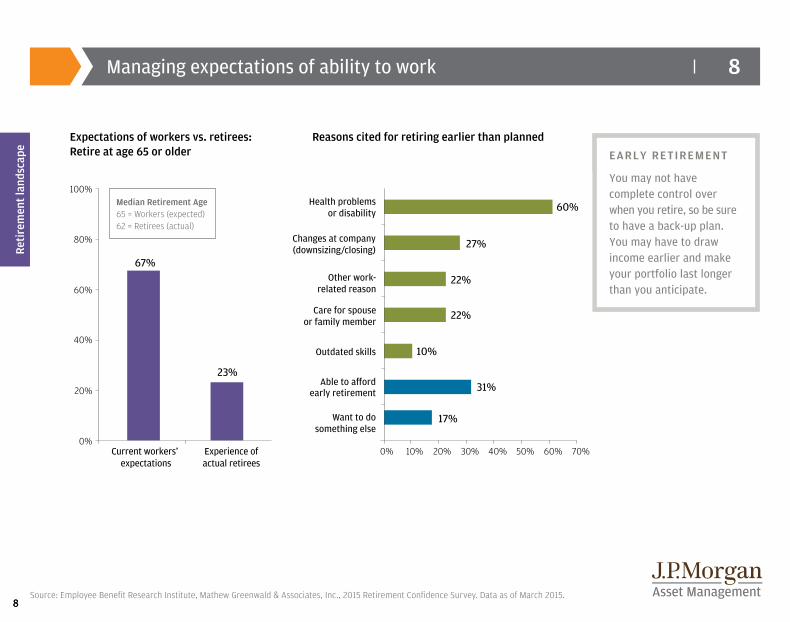
8Managing expectations of ability to work
Source: Employee Benefit Research Institute, Mathew Greenwald & Associates, Inc., 2015 Retirement Confidence Survey. Data as of March 2015.
Reti
rem
ent l
ands
cape EARLY RETIREMENT
You may not have complete control over when you retire, so be sure to have a back-up plan. You may have to draw income earlier and make your portfolio last longer than you anticipate.
17%
31%
10%
22%
22%
27%
67%
23%
100%
80%
60%
40%
20%
0%Experience ofactual retirees
Current workers’ expectations
0% 10% 20% 30% 40% 50% 60% 70%
Outdated skills
Want to do something else
early retirementAble to a�ord
60%Health problems or disability
Perc
ent
Changes at company(downsizing/closing)
Other work- related reason
Care for spouse or family member
Median Retirement Age65 = Workers (expected)62 = Retirees (actual)
Expectations of workers vs. retirees:Retire at age 65 or older
Reasons cited for retiring earlier than planned
17%
31%
10%
22%
22%
27%
67%
23%
100%
80%
60%
40%
20%
0%Experience ofactual retirees
Current workers’ expectations
0% 10% 20% 30% 40% 50% 60% 70%
Outdated skills
Want to do something else
early retirementAble to a�ord
60%Health problems or disability
Perc
ent
Changes at company(downsizing/closing)
Other work- related reason
Care for spouse or family member
8
9
9
Age 66(Full Retirement Age)
+8% per year
Increased benefitsDecreased benefits
(Age 62)(Age 70)
-6.25% average per year +8% per year-6.25% average per year75% 100%benefit 132%
2.47% Average Cost of Living Adjustment (2000-2013)
+8% per year
IncreasedbenefitsDecreased benefits
-6.00% average per year
Age 67(Full Retirement Age)
124%
(Age 70)(Age 62)
70% 100%benefit
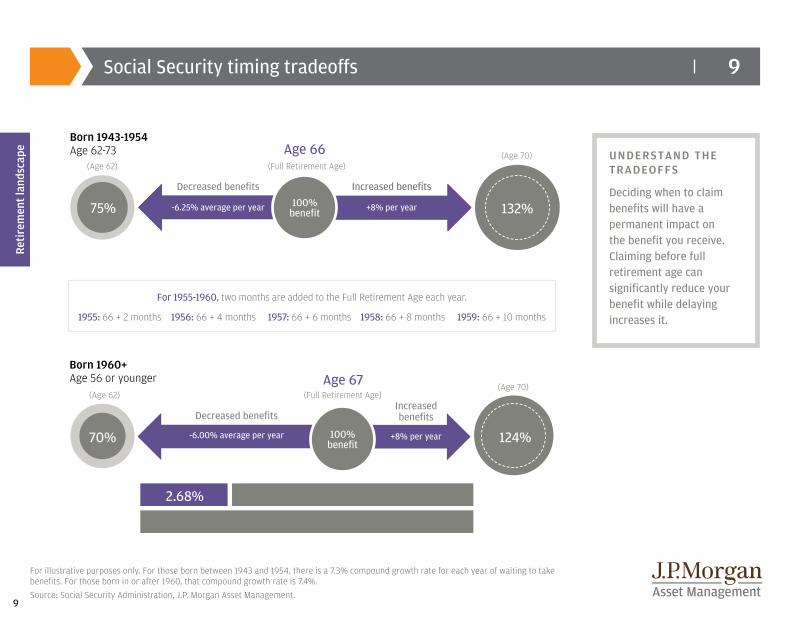
UNDERSTAND THE TRADEOFFS
Deciding when to claim benefits will have a permanent impact on the benefit you receive. Claiming before full retirement age can significantly reduce your benefit while delaying increases it.
Social Security timing tradeoffs
Reti
rem
ent l
ands
cape
Born 1943-1954 Age 62-73 Age 66
(Full Retirement Age)
+8% per year
Increased benefitsDecreased benefits
(Age 62)(Age 70)
7.3% compound growth rate for each year of waiting to take benefits
-6.25% average per year +8% per year-6.25% average per year75% 100%benefit 132%
2.68% Average cost of living adjustment (1985-2016)
No cost of living adjustment for 2016 benefits
7.4% compound growth rate for each year of waiting to take benefits
+8% per year
IncreasedbenefitsDecreased benefits
-6.00% average per year
Age 67(Full Retirement Age)
100%benefit 124%
(Age 70)(Age 62)
70%
Age 66(Full Retirement Age)
+8% per year
Increased benefitsDecreased benefits
(Age 62)(Age 70)
-6.25% average per year +8% per year-6.25% average per year75% 100%benefit 132%
2.47% Average Cost of Living Adjustment (2000-2013)
+8% per year
IncreasedbenefitsDecreased benefits
-6.00% average per year
Age 67(Full Retirement Age)
124%
(Age 70)(Age 62)
70% 100%benefit
Born 1960+ Age 56 or younger
For illustrative purposes only. For those born between 1943 and 1954, there is a 7.3% compound growth rate for each year of waiting to take benefits. For those born in or after 1960, that compound growth rate is 7.4%.Source: Social Security Administration, J.P. Morgan Asset Management.
For 1955-1960, two months are added to the Full Retirement Age each year.
1955: 66 + 2 months 1956: 66 + 4 months 1957: 66 + 6 months 1958: 66 + 8 months 1959: 66 + 10 months
10
10
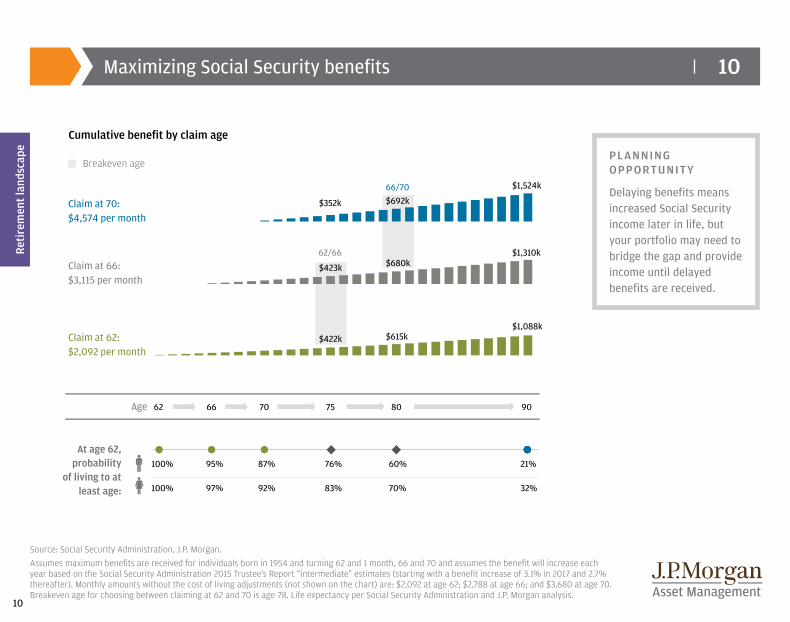
PLANNING OPPORTUNITY
Delaying benefits means increased Social Security income later in life, but your portfolio may need to bridge the gap and provide income until delayed benefits are received.
Maximizing Social Security benefits
Reti
rem
ent l
ands
cape
Source: Social Security Administration, J.P. Morgan. Assumes maximum benefits are received for individuals born in 1954 and turning 62 and 1 month, 66 and 70 and assumes the benefit will increase each year based on the Social Security Administration 2015 Trustee’s Report “intermediate” estimates (starting with a benefit increase of 3.1% in 2017 and 2.7% thereafter). Monthly amounts without the cost of living adjustments (not shown on the chart) are: $2,092 at age 62; $2,788 at age 66; and $3,680 at age 70. Breakeven age for choosing between claiming at 62 and 70 is age 78. Life expectancy per Social Security Administration and J.P. Morgan analysis.
Cumulative benefit by claim age
Social Security breakeven data
76%
83%
60%
70%
21%
32%
$422k
$423k
$352k
$615k
$680k
$692k
$1,088k
$1,310k
$1,524k
100%
100%
87%
92%
95%
97%
66/70
62/66
Claim at 62: $2,092 per month
Claim at 66: $3,115 per month
Claim at 70: $4,574 per month
62 66 70 75 80Age 90
Breakeven age
At age 62, probability
of living to at least age:

11
11
$100
$120
$140
$160
$180
$200
$220
$240
1985 1990 1995 2000 2005 2010 2015
CPI-U CPI-W CPI-E
EROSION OF PURCHASING POWER
Older Americans experi-ence a higher degree of inflation than both urban consumers (Headline CPI) and the inflation measure used to adjust Social Security benefits (CPI-W). Your investment strategy will need sufficient growth to outpace this higher inflation particularly as Social Security covers less over time.
Older individuals experience higher inflation
Reti
rem
ent l
ands
cape
*CPI-E is an experimental index from BLS that is based on elderly households with the referenced individuals at age 62 and older.Headline CPI is also referred to as CPI-U, including food and energy. Graph: Based on Consumer Price Indexes, BLS, J.P. Morgan Asset Management. Data as of December 31, 2015.Table: Weightings: BLS, as of December, 2011. Inflation: BLS, Consumer Price Index, J.P. Morgan Asset Management. Data represents annual percentage increase from December 1981 through December 2015 with the exception of entertainment and education, which date back to 1993. The inflation rate for the Other category is derived from personal care products and tobacco. Tobacco has experienced more than 7% inflation since 1986 but each age group only spends 0.5%-0.8% on tobacco (27%-37% of combined personal care products and tobacco), which is a lower proportion than represented in the Other inflation rate.
Comparison of inflation 1985–2015 1985 = 100
CPI-E is 5.5% over Headline CPI and 7.3% over CPI-W after 30 years
CPI-E (Elderly)*
Headline CPI (All Urban Consumers)CPI-W (Urban Wage Earners)
Health care Housing
Food & bev. Transport. Entertain. Apparel Edu. Other
Headline CPI 6.9 40.2 15.0 16.5 5.9 3.5 6.7 5.3
CPI-W 5.6 39.2 15.7 18.7 5.5 3.6 6.7 5.1
CPI-E 11.3 44.5 12.8 14.5 5.3 2.4 3.8 5.4
Inflation 5.0 2.8 2.9 2.1 1.1 0.7 5.2 4.8
Weighting and inflation by spending category (%)
12
12
50%
40%
30%
20%
10%
0%
6%
4%
2%
0%
Health
care
Food an
d bever
age
Housing
Transp
ortatio
n
Entertai
nment
Apparel
Other
4.8%5.0%
2.9% 2.8%2.1%
Educa
tion
5.2%
1.1% 0.7%
Health
care
Other
Food an
d bever
age
Housing–
Other
*
Housing–
Mortgag
e*
Transp
ortatio
n
Entertai
nment
Apparel
Charita
ble co
ntributio
ns
and gi
fts*
Trave
l*
Educatio
n
10%
2% 4%
13%
28%
11%
17%
5% 4% 3% 4%
14%
1%4%
13%
30%
7%
15%
5% 3% 6% 3%
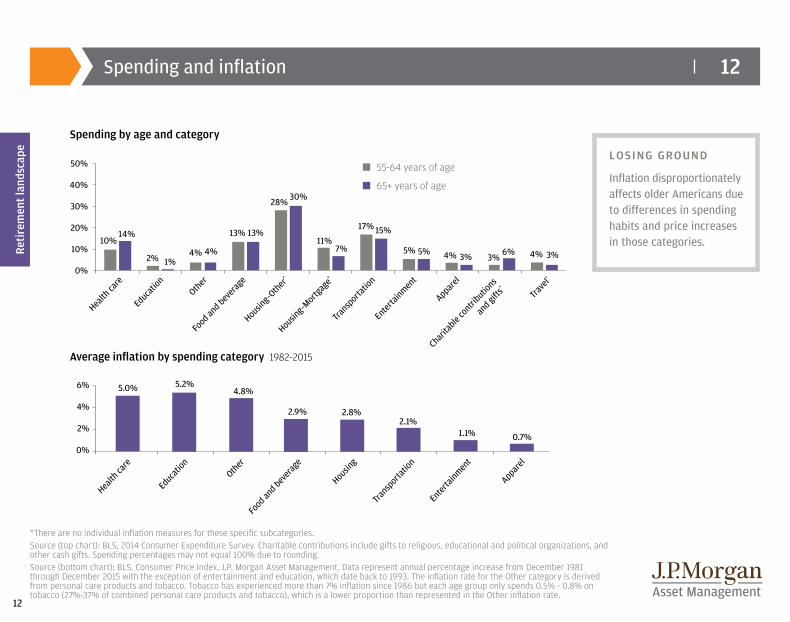
LOSING GROUND
Inflation disproportionately affects older Americans due to differences in spending habits and price increases in those categories.
Spending and inflation
Reti
rem
ent l
ands
cape
*There are no individual inflation measures for these specific subcategories.Source (top chart): BLS, 2014 Consumer Expenditure Survey. Charitable contributions include gifts to religious, educational and political organizations, and other cash gifts. Spending percentages may not equal 100% due to rounding.Source (bottom chart): BLS, Consumer Price Index, J.P. Morgan Asset Management. Data represent annual percentage increase from December 1981 through December 2015 with the exception of entertainment and education, which date back to 1993. The inflation rate for the Other category is derived from personal care products and tobacco. Tobacco has experienced more than 7% inflation since 1986 but each age group only spends 0.5% - 0.8% on tobacco (27%-37% of combined personal care products and tobacco), which is a lower proportion than represented in the Other inflation rate.
Spending by age and category
Average inflation by spending category 1982–2015
n 55-64 years of age
n 65+ years of age
13
13
Top marginal tax rateTop e�ective tax rate
100%
80%
60%
40%
20%
0%1979 1986 1993 2000 2009
Average top marginal tax rate: 41.0%
Average top eective tax rate: 25.5%
100%
90%
80%
70%
60%
50%
40%
30%
20%
10%
0%1913 1920 1927 1934 1941 1948 1955 1962 1969 1976 1983 1990 1997 2004 2011 2016
Average top marginal tax rate: 58.1%
2016: 43.4%
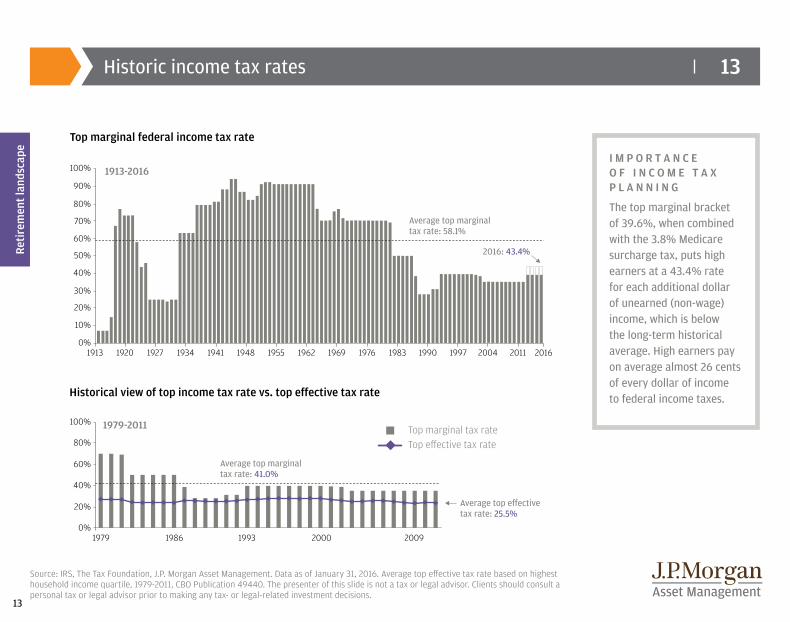
I M P O R T A N C E O F I N C O M E T A X P L A N N I N G
The top marginal bracket of 39.6%, when combined with the 3.8% Medicare surcharge tax, puts high earners at a 43.4% rate for each additional dollar of unearned (non-wage) income, which is below the long-term historical average. High earners pay on average almost 26 cents of every dollar of income to federal income taxes.
Historic income tax rates
Reti
rem
ent l
ands
cape
Source: IRS, The Tax Foundation, J.P. Morgan Asset Management. Data as of January 31, 2016. Average top effective tax rate based on highest household income quartile, 1979-2011, CBO Publication 49440. The presenter of this slide is not a tax or legal advisor. Clients should consult a personal tax or legal advisor prior to making any tax- or legal-related investment decisions.
Top marginal federal income tax rate
Historical view of top income tax rate vs. top effective tax rate
1913-2016
1979-2011
14
14
*Source: Employee Benefit Research Institute, Mathew Greenwald & Associates, Inc., 2015 Retirement Confidence Survey.
Savi
ng
Saving
The single most important decision individuals can make about retirement is to take responsibility for funding it themselves. Living expenses, health care costs, Social Security, pensions and future employment are all uncertain. But saving today is one way to prepare for a more stable tomorrow.
COMMON MISCONCEPTIONS
“I’ve already started saving a little—I should be okay.”• In 2015, only 48% of workers (and/or spouses) had tried to calculate how much money they would
actually need to save for a comfortable retirement.*
• Use the retirement savings checkpoint chart to see if you are on track to reach your goals. Page 15
“Retirement is so far away—I have plenty of time to think about it.”• The sooner you begin, the more time you have to maximize the power of compounding. Page 16
• Start saving early and regularly. Early withdrawals, loans and missed contributions can result in lower savings, less compounding and fewer assets at retirement. Page 18
15
15Retirement savings checkpoints
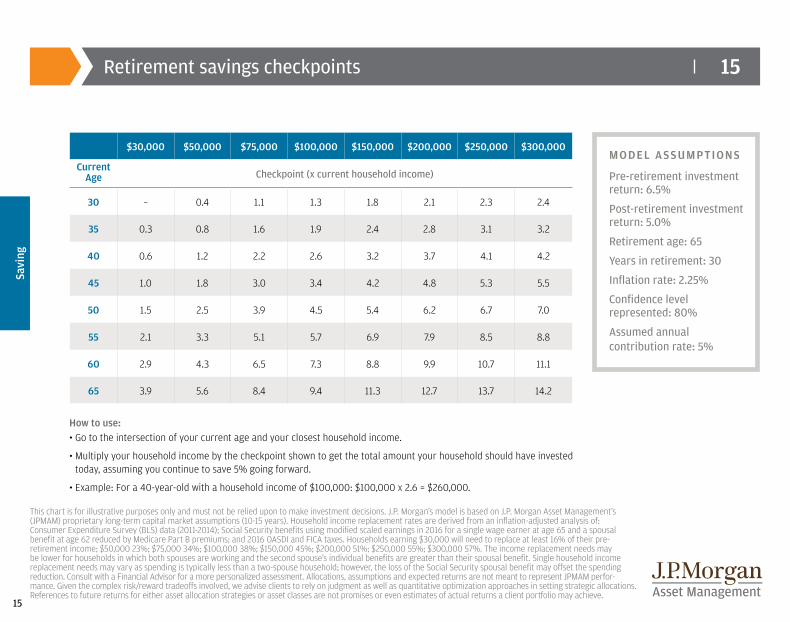
This chart is for illustrative purposes only and must not be relied upon to make investment decisions. J.P. Morgan’s model is based on J.P. Morgan Asset Management’s (JPMAM) proprietary long-term capital market assumptions (10-15 years). Household income replacement rates are derived from an inflation-adjusted analysis of: Consumer Expenditure Survey (BLS) data (2011-2014); Social Security benefits using modified scaled earnings in 2016 for a single wage earner at age 65 and a spousal benefit at age 62 reduced by Medicare Part B premiums; and 2016 OASDI and FICA taxes. Households earning $30,000 will need to replace at least 16% of their pre- retirement income; $50,000 23%; $75,000 34%; $100,000 38%; $150,000 45%; $200,000 51%; $250,000 55%; $300,000 57%. The income replacement needs may be lower for households in which both spouses are working and the second spouse’s individual benefits are greater than their spousal benefit. Single household income replacement needs may vary as spending is typically less than a two-spouse household; however, the loss of the Social Security spousal benefit may offset the spending reduction. Consult with a Financial Advisor for a more personalized assessment. Allocations, assumptions and expected returns are not meant to represent JPMAM perfor-mance. Given the complex risk/reward tradeoffs involved, we advise clients to rely on judgment as well as quantitative optimization approaches in setting strategic allocations. References to future returns for either asset allocation strategies or asset classes are not promises or even estimates of actual returns a client portfolio may achieve.
Savi
ng
MODEL ASSUMPTIONS
Pre-retirement investment return: 6.5%
Post-retirement investment return: 5.0%
Retirement age: 65
Years in retirement: 30
Inflation rate: 2.25%
Confidence level represented: 80%
Assumed annual contribution rate: 5%
Age $30,000 $50,000 $75,000 $100,000 $150,000 $200,000 $250,000 $300,000
Current Age Checkpoint (x current household income)
30 – 0.4 1.1 1.3 1.8 2.1 2.3 2.4
35 0.3 0.8 1.6 1.9 2.4 2.8 3.1 3.2
40 0.6 1.2 2.2 2.6 3.2 3.7 4.1 4.2
45 1.0 1.8 3.0 3.4 4.2 4.8 5.3 5.5
50 1.5 2.5 3.9 4.5 5.4 6.2 6.7 7.0
55 2.1 3.3 5.1 5.7 6.9 7.9 8.5 8.8
60 2.9 4.3 6.5 7.3 8.8 9.9 10.7 11.1
65 3.9 5.6 8.4 9.4 11.3 12.7 13.7 14.2
How to use: • Go to the intersection of your current age and your closest household income.
• Multiply your household income by the checkpoint shown to get the total amount your household should have invested today, assuming you continue to save 5% going forward.
• Example: For a 40-year-old with a household income of $100,000: $100,000 x 2.6 = $260,000.
16
16
$0
$400,000
$800,000
$1,200,000
$1,600,000
$2,000,000
25 30 35 40 45 50 55 60 65
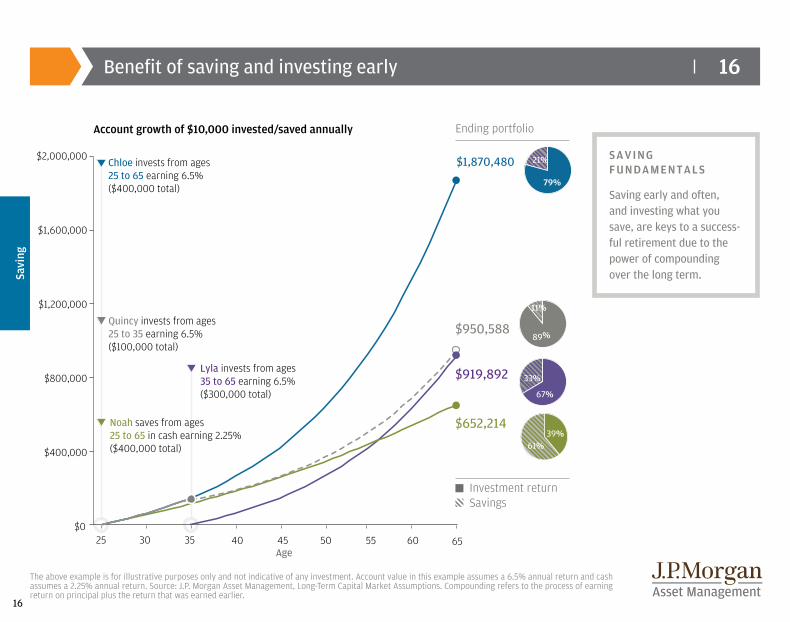
Quincy invests from ages 25 to 35 earning 6.5% ($100,000 total)
Lyla invests from ages 35 to 65 earning 6.5% ($300,000 total)
Chloe invests from ages 25 to 65 earning 6.5% ($400,000 total)
Noah saves from ages 25 to 65 in cash earning 2.25% ($400,000 total)
Account growth of $10,000 invested/saved annually
$1,870,480
$950,588
$919,892
$652,214
Investment returnSavings
Age
Ending portfolio
79%
21%
89%
11%
67%
33%
61%39%
SAVING FUNDAMENTALS
Saving early and often, and investing what you save, are keys to a success-ful retirement due to the power of compounding over the long term.
Benefit of saving and investing early
The above example is for illustrative purposes only and not indicative of any investment. Account value in this example assumes a 6.5% annual return and cash assumes a 2.25% annual return. Source: J.P. Morgan Asset Management, Long-Term Capital Market Assumptions. Compounding refers to the process of earning return on principal plus the return that was earned earlier.
Savi
ng
Account growth of $10,000 invested/saved annually
17
17
0%
2%
4%
6%
8%
10%
12%
14%
1961
1963
1965
1967
1969
1971
1973
1975
1977
1979
1981
1983
1985
1987
1989
1991
1993
1995
1997
1999
2001
2003
2005
2007
2009
2011
2013
2015
1959
Recessions
Expansions
1973-’75 Oil Crisis
‘ 1980-’82Energy Crisis
1990-’91S&L Crisis
2001Dot.com Bust
2007-’09Great Recession
1969-’70VietnamWar era
High inflation 1968-1984
Slide 17 Savings Rate
Easing of interstate banking laws leading to greater access to credit
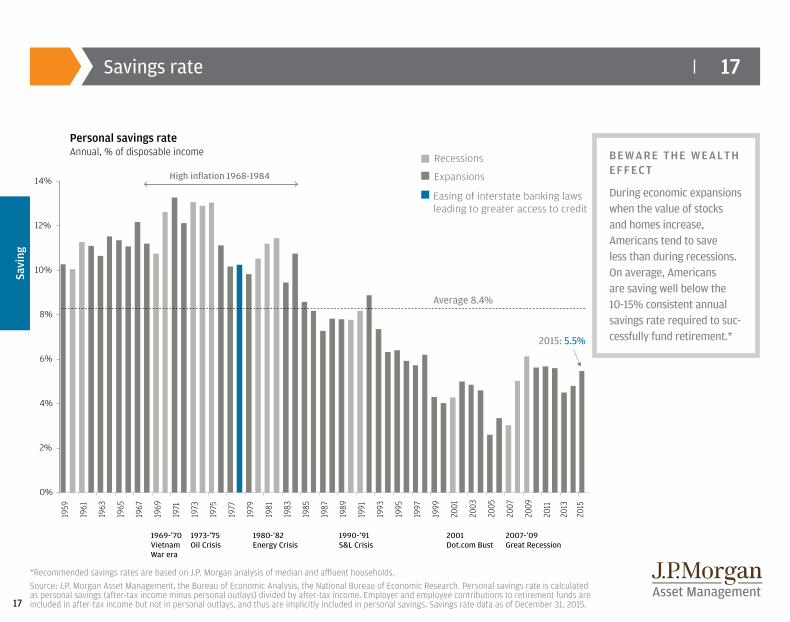
Average 8.4%
2015: 5.5%
Savings rate
*Recommended savings rates are based on J.P. Morgan analysis of median and affluent households. Source: J.P. Morgan Asset Management, the Bureau of Economic Analysis, the National Bureau of Economic Research. Personal savings rate is calculated as personal savings (after-tax income minus personal outlays) divided by after-tax income. Employer and employee contributions to retirement funds are included in after-tax income but not in personal outlays, and thus are implicitly included in personal savings. Savings rate data as of December 31, 2015.
Savi
ng
Personal savings rateAnnual, % of disposable income BEWARE THE WEALTH
EFFECT
During economic expansions when the value of stocks and homes increase, Americans tend to save less than during recessions. On average, Americans are saving well below the 10-15% consistent annual savings rate required to suc-cessfully fund retirement.*
18
18
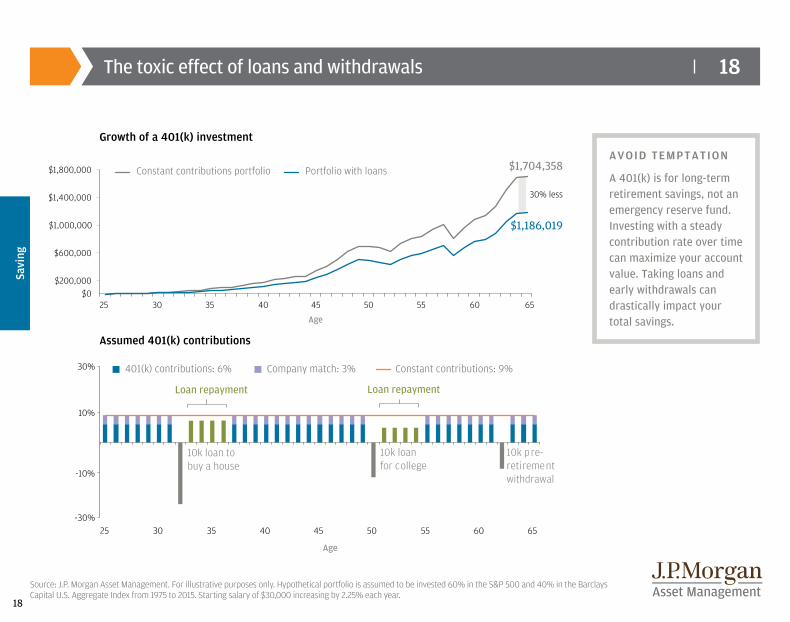
Source: J.P. Morgan Asset Management. For illustrative purposes only. Hypothetical portfolio is assumed to be invested 60% in the S&P 500 and 40% in the Barclays Capital U.S. Aggregate Index from 1975 to 2015. Starting salary of $30,000 increasing by 2.25% each year.
The toxic effect of loans and withdrawals
AVOID TEMPTATION
A 401(k) is for long-term retirement savings, not an emergency reserve fund. Investing with a steady contribution rate over time can maximize your account value. Taking loans and early withdrawals can drastically impact your total savings.
Savi
ng
25$0
30 35 40 45 50 55 60 65
Age
$200,000
$600,000
$1,000,000
$1,400,000
$1,800,000 Constant contributions portfolio Portfolio with loans $1,704,358
$1,186,019
30% less
Growth of a 401(k) investment
Assumed 401(k) contributions
30%
10%
-10%
-30%25 30 35 40 45
Age
50 55 60 65
401(k) contributions: 6% Company match: 3% Constant contributions: 9%
Loan repayment
10k loan to buy a house
10k loan for college
Loan repayment
10k pre-retirementwithdrawal
19
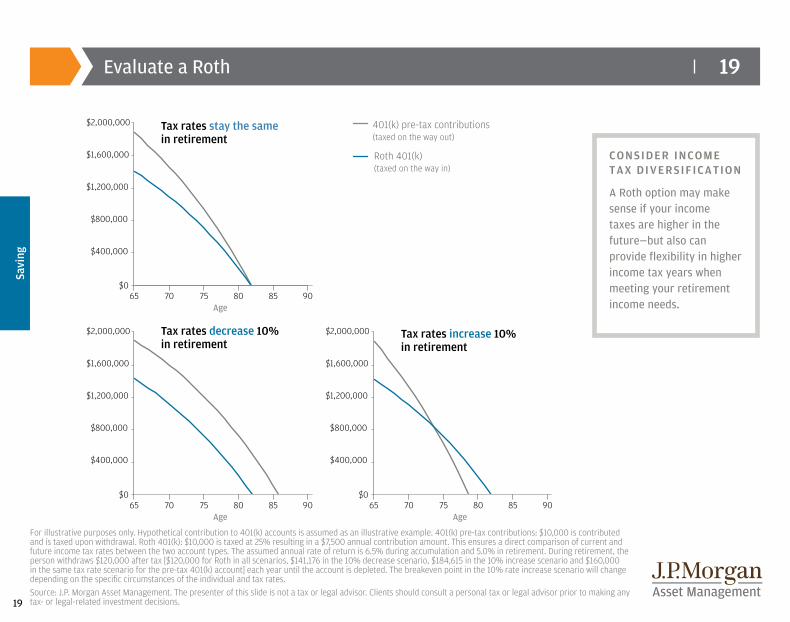
19Evaluate a Roth
For illustrative purposes only. Hypothetical contribution to 401(k) accounts is assumed as an illustrative example. 401(k) pre-tax contributions: $10,000 is contributed and is taxed upon withdrawal. Roth 401(k): $10,000 is taxed at 25% resulting in a $7,500 annual contribution amount. This ensures a direct comparison of current and future income tax rates between the two account types. The assumed annual rate of return is 6.5% during accumulation and 5.0% in retirement. During retirement, the person withdraws $120,000 after tax [$120,000 for Roth in all scenarios, $141,176 in the 10% decrease scenario, $184,615 in the 10% increase scenario and $160,000 in the same tax rate scenario for the pre-tax 401(k) account] each year until the account is depleted. The breakeven point in the 10% rate increase scenario will change depending on the specific circumstances of the individual and tax rates.Source: J.P. Morgan Asset Management. The presenter of this slide is not a tax or legal advisor. Clients should consult a personal tax or legal advisor prior to making any tax- or legal-related investment decisions.
Savi
ng
CONSIDER INCOME TAX DIVERSIFICATION
A Roth option may make sense if your income taxes are higher in the future—but also can provide flexibility in higher income tax years when meeting your retirement income needs.
$065 70 75
Age80 85 90
$065 70 75
Age80 85 90
$065 70 75
Age80 85 90
$400,000
$800,000
$1,200,000
$1,600,000
$2,000,000
$400,000
$800,000
$1,200,000
$1,600,000
$2,000,000
$400,000
$800,000
$1,200,000
$1,600,000
$2,000,000
Tax rates stay the same in retirement
Tax rates decrease 10% in retirement
Tax rates increase 10% in retirement
401(k) pre-tax contributions (taxed on the way out)
Roth 401(k) (taxed on the way in)
20
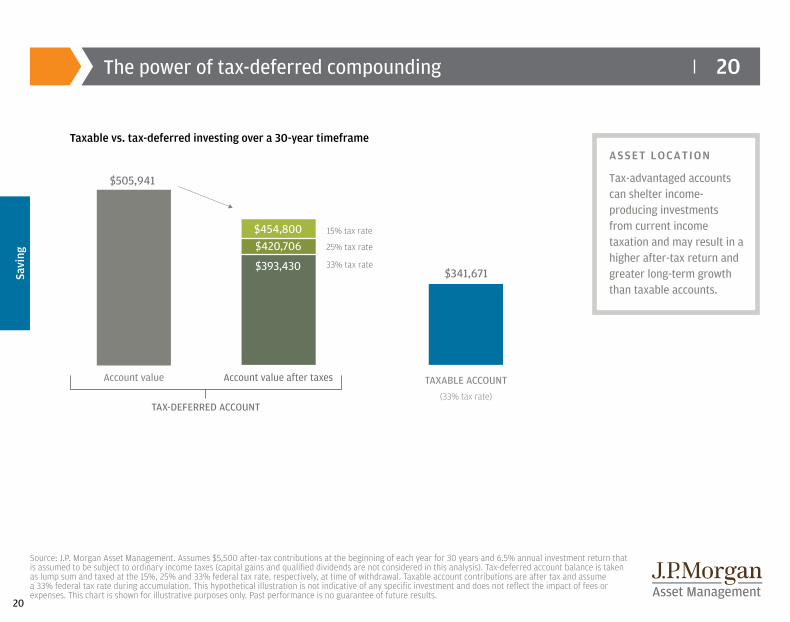
20The power of tax-deferred compounding
Source: J.P. Morgan Asset Management. Assumes $5,500 after-tax contributions at the beginning of each year for 30 years and 6.5% annual investment return that is assumed to be subject to ordinary income taxes (capital gains and qualified dividends are not considered in this analysis). Tax-deferred account balance is taken as lump sum and taxed at the 15%, 25% and 33% federal tax rate, respectively, at time of withdrawal. Taxable account contributions are after tax and assume a 33% federal tax rate during accumulation. This hypothetical illustration is not indicative of any specific investment and does not reflect the impact of fees or expenses. This chart is shown for illustrative purposes only. Past performance is no guarantee of future results.
Savi
ng
Taxable vs. tax-deferred investing over a 30-year timeframeASSET LOCATION
Tax-advantaged accounts can shelter income-producing investments from current income taxation and may result in a higher after-tax return and greater long-term growth than taxable accounts.
$505,941
Account value TAXABLE ACCOUNT(33% tax rate)
Account value after taxes
TAX-DEFERRED ACCOUNT
33% tax rate
15% tax rate
25% tax rate
$341,671
$420,706
$393,430
$454,800
21
21
Spen
ding
Spending
Determining income needs during retirement is a complex equation. During working years, the goal was to save and accumulate as much as possible for the future. Now the challenge becomes managing a portfolio by withdrawing some money for today’s expenses and investing the rest for tomorrow.
COMMON MISCONCEPTIONS
“I’ve already hit my savings target. I should be fine in retirement with the lower cost of living.”• Spending may not decrease at all in the first few years of retirement. Some expenses tend to
decline with age—while others remain steady or increase. Page 23
“As long as I withdraw a steady amount, I will be okay.”• Withdrawing assets in volatile markets early in retirement can ravage a portfolio. Adjust your
plan and strategy regularly. Page 22
• There is potential danger in investing too conservatively or withdrawing too aggressively. Either may increase the risk of tapping into principal and running out of money. Page 24

22
22
Age
35%
25%
15%
5%
-5%
-15%
61 65 69 73 77 81 85 89
40 / 60 Blended ReturnAverage rate of return = 8%
61 65 69 73 77 81 85 89
40 / 60 Blended Return Average rate of return = 8%
$0
Age
$200,000
$400,000
$600,000
$800,000
$1,000,000
$1,200,000
$1,400,000
Dollar cost ravaging—timing risk of withdrawals
Source: J.P. Morgan Asset Management. Returns are based on a hypothetical portfolio, which is assumed to be invested 40% in the S&P 500 Total Return Index and 60% in the Barclays Capital U.S. Aggregate Index. The assumptions are presented for illustrative purposes only. They must not be used, or relied upon, to make investment de-cisions. There is no direct correlation between a hypothetical investment and the anticipated future return of an index. Past performance does not guarantee future results.
Growth of investment 1966–1995
Assumptions: Enter retirement at age 60 with $1,000,000. Start with a 5.4% withdrawal of $54,000. Increase dollar amount of withdrawal by overall rate of inflation (3%) each year, which is lower than the average inflation rate of the period between 1966-1995.
SEQUENCE RETURN RISK
Withdrawing assets in volatile markets early in retirement can ravage a portfolio. Adjust your plan regularly and consider investment solutions that provide downside protection.
Spen
ding
Age
35%
25%
15%
5%
-5%
-15%
61 65 69 73 77 81 85 89
40 / 60 Blended ReturnAverage rate of return = 8%
61 65 69 73 77 81 85 89
40 / 60 Blended Return Average rate of return = 8%
$0
Age
$200,000
$400,000
$600,000
$800,000
$1,000,000
$1,200,000
$1,400,000
Rate of return: actual vs. average 1966–1995
40/60 portfolio: Actual average annual return: 9.1%Assumed annual rate of return: 8%
n 40/60 portfolio: Actual average annual return: 9.1%Assumed annual rate of return: 8%
23
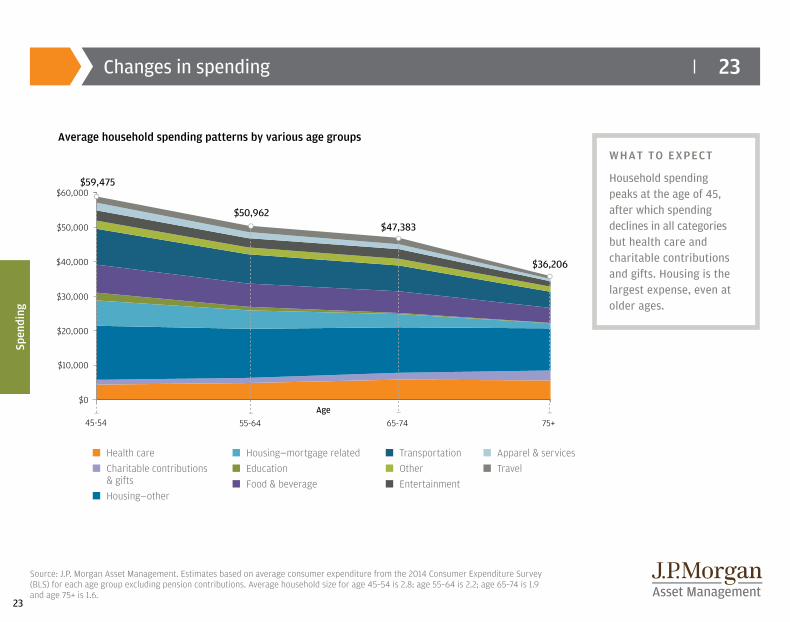
23Changes in spending
Source: J.P. Morgan Asset Management. Estimates based on average consumer expenditure from the 2014 Consumer Expenditure Survey (BLS) for each age group excluding pension contributions. Average household size for age 45–54 is 2.8; age 55–64 is 2.2; age 65–74 is 1.9 and age 75+ is 1.6.
WHAT TO EXPECT
Household spending peaks at the age of 45, after which spending declines in all categories but health care and charitable contributions and gifts. Housing is the largest expense, even at older ages.
Spen
ding
Average household spending patterns by various age groups
n Health caren Charitable contributions
& giftsn Housing—other
n Housing—mortgage relatedn Educationn Food & beverage
n Transportationn Othern Entertainment
n Apparel & servicesn Travel
$60,000
$0
45-54 55-64 65-74 75+
$59,475
$50,962$47,383
$36,206
Age
$50,000
$40,000
$30,000
$20,000
$10,000
24
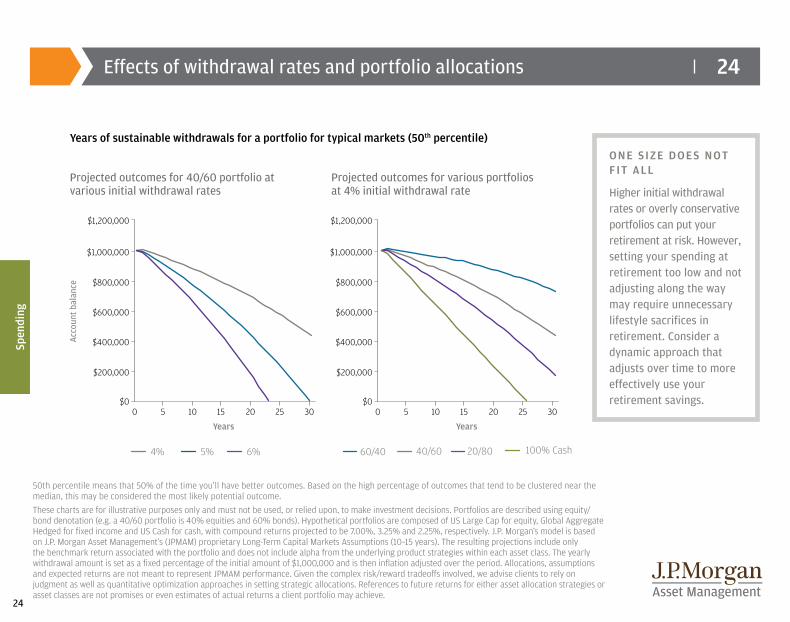
24Effects of withdrawal rates and portfolio allocations
50th percentile means that 50% of the time you’ll have better outcomes. Based on the high percentage of outcomes that tend to be clustered near the median, this may be considered the most likely potential outcome. These charts are for illustrative purposes only and must not be used, or relied upon, to make investment decisions. Portfolios are described using equity/bond denotation (e.g. a 40/60 portfolio is 40% equities and 60% bonds). Hypothetical portfolios are composed of US Large Cap for equity, Global Aggregate Hedged for fixed income and US Cash for cash, with compound returns projected to be 7.00%, 3.25% and 2.25%, respectively. J.P. Morgan’s model is based on J.P. Morgan Asset Management’s (JPMAM) proprietary Long-Term Capital Markets Assumptions (10–15 years). The resulting projections include only the benchmark return associated with the portfolio and does not include alpha from the underlying product strategies within each asset class. The yearly withdrawal amount is set as a fixed percentage of the initial amount of $1,000,000 and is then inflation adjusted over the period. Allocations, assumptions and expected returns are not meant to represent JPMAM performance. Given the complex risk/reward tradeoffs involved, we advise clients to rely on judgment as well as quantitative optimization approaches in setting strategic allocations. References to future returns for either asset allocation strategies or asset classes are not promises or even estimates of actual returns a client portfolio may achieve.
Years of sustainable withdrawals for a portfolio for typical markets (50th percentile)ONE SIZE DOES NOT FIT ALL
Higher initial withdrawal rates or overly conservative portfolios can put your retirement at risk. However, setting your spending at retirement too low and not adjusting along the way may require unnecessary lifestyle sacrifices in retirement. Consider a dynamic approach that adjusts over time to more effectively use your retirement savings.
Spen
ding
Projected outcomes for 40/60 portfolio at various initial withdrawal rates
Projected outcomes for various portfolios at 4% initial withdrawal rate
Acco
unt b
alan
ce
$1,200,000
$1,000,000
$800,000
$600,000
$400,000
$200,000
$00 5 10 15 20 25 30
Years
$1,200,000
$1,000,000
$800,000
$600,000
$400,000
$200,000
$00 5 10 15
Years
20 25 30
6% 40/6060/40 20/80 100% Cash5%4%
25
25
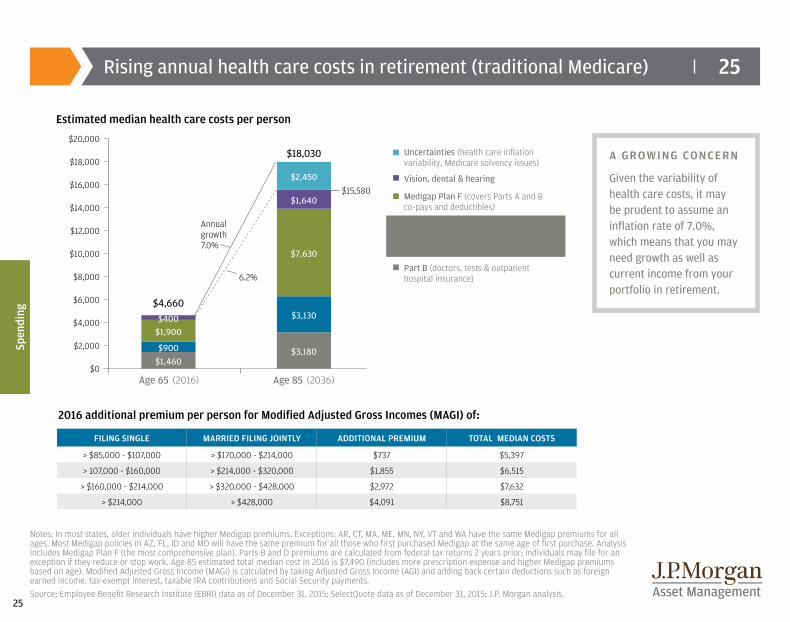
$2,000
$4,000
$6,000 $4,660
$15,580
Annualgrowth7.0%
6.2%$8,000
$10,000
$12,000
$14,000
$16,000
$18,000
$20,000
$0Age 65 Age 85
$18,030
(2016) (2036)
$1,460$3,180$900
$3,130
$1,900
$7,630
$400
$1,640
$2,450
Uncertainties (health care inflationvariability, Medicare solvency issues)
Vision, dental & hearing
Medigap Plan F (covers Parts A and Bco-pays and deductibles)
Part D premiums and prescription out-of-pocket costs (varies: may be up to approximately $4,000 in 2016)
Part B (doctors, tests & outpatienthospital insurance)
Rising annual health care costs in retirement (traditional Medicare)
Notes: In most states, older individuals have higher Medigap premiums. Exceptions: AR, CT, MA, ME, MN, NY, VT and WA have the same Medigap premiums for all ages. Most Medigap policies in AZ, FL, ID and MO will have the same premium for all those who first purchased Medigap at the same age of first purchase. Analysis includes Medigap Plan F (the most comprehensive plan). Parts B and D premiums are calculated from federal tax returns 2 years prior; individuals may file for an exception if they reduce or stop work. Age 85 estimated total median cost in 2016 is $7,490 (includes more prescription expense and higher Medigap premiums based on age). Modified Adjusted Gross Income (MAGI) is calculated by taking Adjusted Gross Income (AGI) and adding back certain deductions such as foreign earned income, tax-exempt interest, taxable IRA contributions and Social Security payments.Source: Employee Benefit Research Institute (EBRI) data as of December 31, 2015; SelectQuote data as of December 31, 2015; J.P. Morgan analysis.
Spen
ding
Estimated median health care costs per person
2016 additional premium per person for Modified Adjusted Gross Incomes (MAGI) of:
A GROWING CONCERN
Given the variability of health care costs, it may be prudent to assume an inflation rate of 7.0%, which means that you may need growth as well as current income from your portfolio in retirement.
FILING SINGLE MARRIED FILING JOINTLY ADDITIONAL PREMIUM TOTAL MEDIAN COSTS
> $85,000 - $107,000 > $170,000 - $214,000 $737 $5,397
> 107,000 - $160,000 > $214,000 - $320,000 $1,855 $6,515
> $160,000 - $214,000 > $320,000 - $428,000 $2,972 $7,632
> $214,000 > $428,000 $4,091 $8,751
26
26
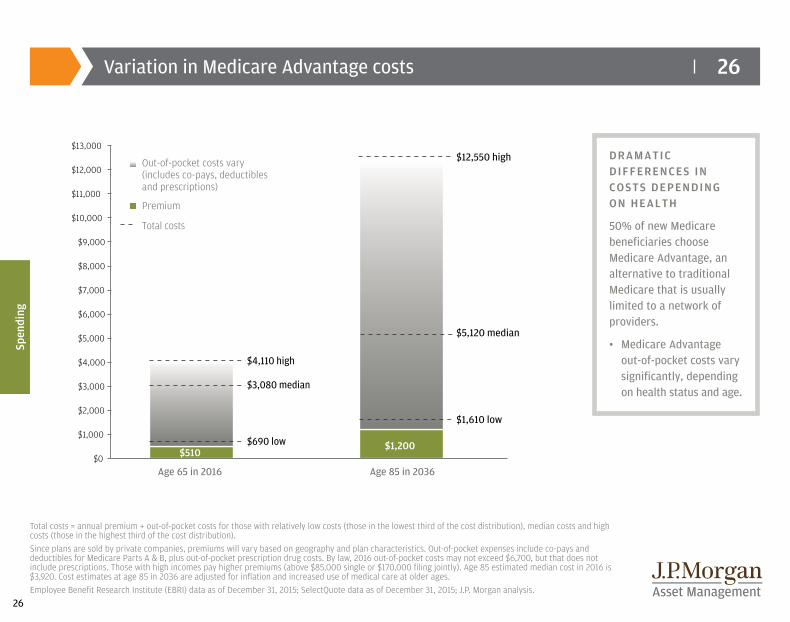
$510 $1,200
Age 65 in 2016 Age 85 in 2036
Out-of-pocket costs vary(includes co-pays, deductiblesand prescriptions)
Premium
Total costs
$0
$1,000
$2,000
$3,000
$4,000
$5,000
$6,000
$7,000
$8,000
$9,000
$10,000
$11,000
$12,000
$13,000
$5,120 median
$3,080 median
$690 low
$4,110 high
$1,610 low
$12,550 high
Variation in Medicare Advantage costs
Total costs = annual premium + out-of-pocket costs for those with relatively low costs (those in the lowest third of the cost distribution), median costs and high costs (those in the highest third of the cost distribution).Since plans are sold by private companies, premiums will vary based on geography and plan characteristics. Out-of-pocket expenses include co-pays and deductibles for Medicare Parts A & B, plus out-of-pocket prescription drug costs. By law, 2016 out-of-pocket costs may not exceed $6,700, but that does not include prescriptions. Those with high incomes pay higher premiums (above $85,000 single or $170,000 filing jointly). Age 85 estimated median cost in 2016 is $3,920. Cost estimates at age 85 in 2036 are adjusted for inflation and increased use of medical care at older ages.Employee Benefit Research Institute (EBRI) data as of December 31, 2015; SelectQuote data as of December 31, 2015; J.P. Morgan analysis.
Spen
ding
DRAMATIC DIFFERENCES IN COSTS DEPENDING ON HEALTH
50% of new Medicare beneficiaries choose Medicare Advantage, an alternative to traditional Medicare that is usually limited to a network of providers.
• Medicare Advantage out-of-pocket costs vary significantly, depending on health status and age.
27
27
35%
55%
73% 72%
50%
40%
30%
20%
80%
70%
60%
10%
0%Marriedage 65
All individualsage 75
30.5%
18.5%
51.0%
58.0%
17.0%
25.0%
35%
55%
73% 72%
50%
40%
30%
20%
80%
70%
60%
10%
0%Marriedage 65
All individualsage 75
30.5%
18.5%
51.0%
58.0%
17.0%
25.0%
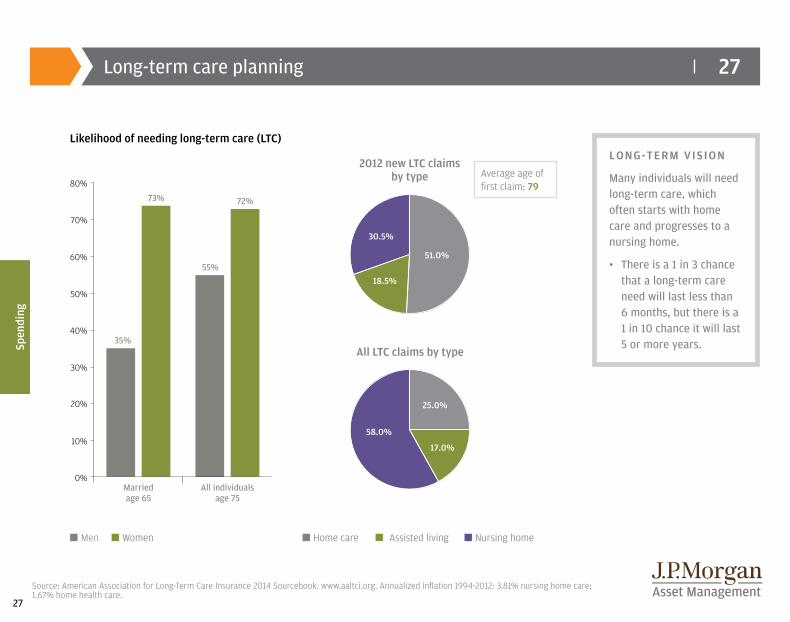
Long-term care planning
Source: American Association for Long-Term Care Insurance 2014 Sourcebook. www.aaltci.org. Annualized inflation 1994-2012: 3.81% nursing home care; 1.67% home health care.
Likelihood of needing long-term care (LTC)LONG-TERM VISION
Many individuals will need long-term care, which often starts with home care and progresses to a nursing home.
• There is a 1 in 3 chance that a long-term care need will last less than 6 months, but there is a 1 in 10 chance it will last 5 or more years. Sp
endi
ng
Average age of first claim: 79
All LTC claims by type
2012 new LTC claims by type
n Men n Women n Home care n Assisted living n Nursing home
28
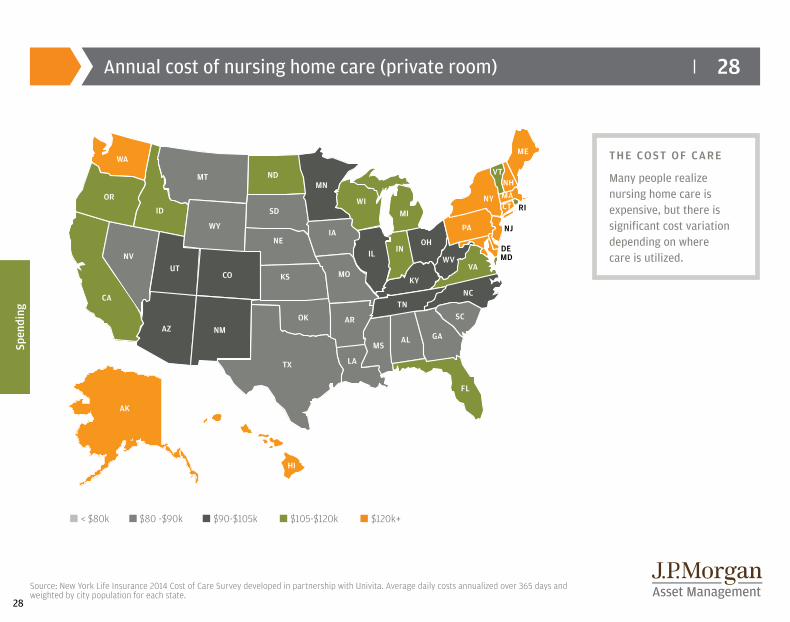
28Annual cost of nursing home care (private room)
Source: New York Life Insurance 2014 Cost of Care Survey developed in partnership with Univita. Average daily costs annualized over 365 days and weighted by city population for each state.
THE COST OF CARE
Many people realize nursing home care is expensive, but there is significant cost variation depending on where care is utilized.
Spen
ding
WA
OR
ID
NVUT
AZ
MT
WY
CO
NM
ND
SD
OK
TX LA
VTNH
ME
MA
VA
TNNC
SC
GAALMS
FL
RI
DE
NY
NE
KS
MN
IA
MO
AR
WIMI
OH
KY
WVWV
PA NJ
MDIL INIL
CA
CT
AK
HI
n < $80k n $80 -$90k n $90-$105k n $105-$120k n $120k+
29
29
Inve
stin
g
Investing
Invest for long-term growth potential and consider investing in a broader mix of assets. Financial risks don’t end when careers do. Individuals planning for a long, rewarding retirement must anticipate and overcome the obstacles that are likely to arise along the way.
COMMON MISCONCEPTIONS
“The market is too volatile. I’m going to sit on the sidelines for a bit so I don’t lose money.”• Don’t avoid investing in volatile times. It can cause you to miss out on potential market rallies. Page 35
• Set specific retirement goals upfront—and keep focused on the long term during periods of volatility and uncertainty. Page 31
“I should invest conservatively so I don’t run the risk of losing my retirement assets.”• Retirement-age investors have potentially long time horizons, due to rising life expectancies.
By maintaining an exposure to equities in retirement, you may better keep pace with rising prices, protecting your standard of living throughout retirement. Page 36
• A well-diversified portfolio may provide a smoother ride over the long term. Pages 33 and 34
30
30
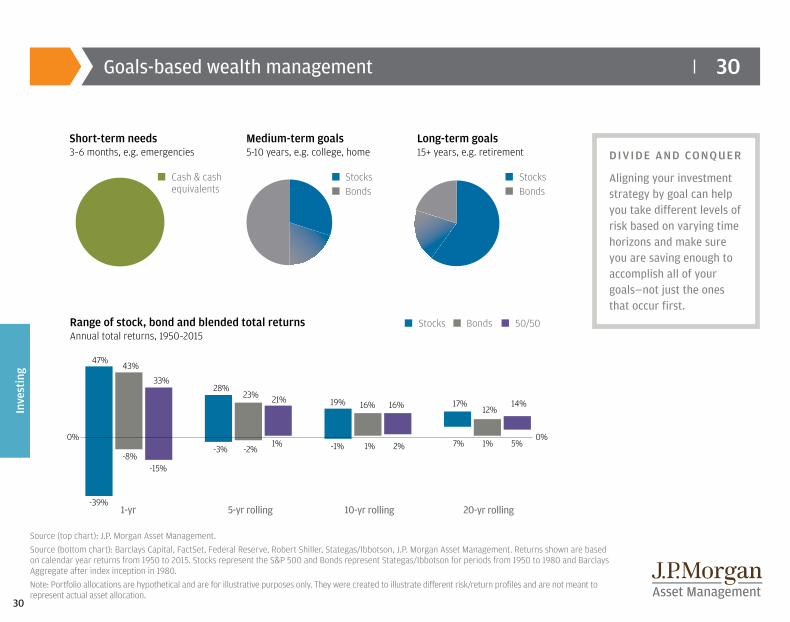
Source (top chart): J.P. Morgan Asset Management.Source (bottom chart): Barclays Capital, FactSet, Federal Reserve, Robert Shiller, Stategas/Ibbotson, J.P. Morgan Asset Management. Returns shown are based on calendar year returns from 1950 to 2015. Stocks represent the S&P 500 and Bonds represent Stategas/Ibbotson for periods from 1950 to 1980 and Barclays Aggregate after index inception in 1980. Note: Portfolio allocations are hypothetical and are for illustrative purposes only. They were created to illustrate different risk/return profiles and are not meant to represent actual asset allocation.
DIVIDE AND CONQUER
Aligning your investment strategy by goal can help you take different levels of risk based on varying time horizons and make sure you are saving enough to accomplish all of your goals—not just the ones that occur first.
Goals-based wealth management
Range of stock, bond and blended total returnsAnnual total returns, 1950–2015
Short-term needs3–6 months, e.g. emergencies
Medium-term goals5-10 years, e.g. college, home
Long-term goals15+ years, e.g. retirement
n Cash & cash equivalents n Bonds n Bonds
n Stocks n Stocks
47%43%
-39%
0% 0%
1-yr 5-yr rolling 10-yr rolling 20-yr rolling
-8%
33%
-15%
28%
-3%
23%
-2%
21%
1%
19%
-1%
16%
1%
16%
2%
17%
7%
12%
1%
14%
5%
n Stocks n 50/50n Bonds
Inve
stin
g
31
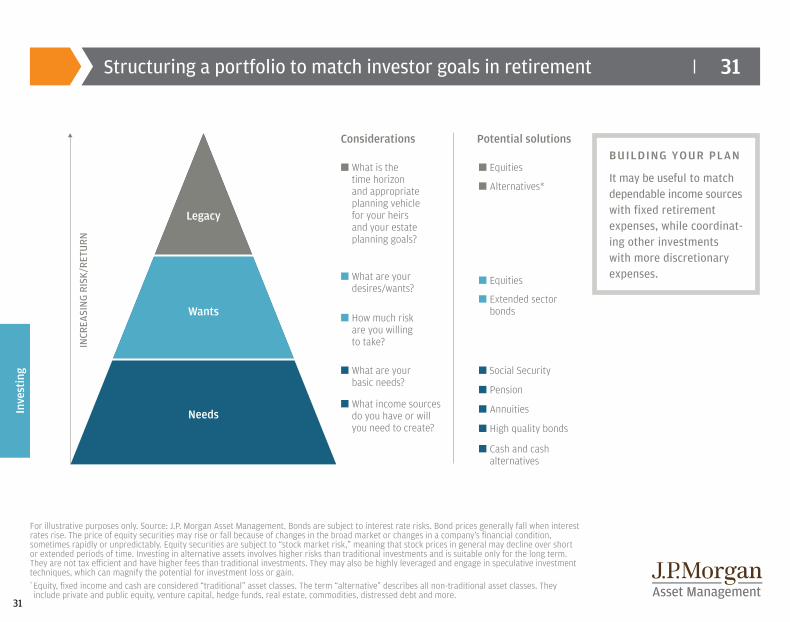
31Structuring a portfolio to match investor goals in retirement
For illustrative purposes only. Source: J.P. Morgan Asset Management. Bonds are subject to interest rate risks. Bond prices generally fall when interest rates rise. The price of equity securities may rise or fall because of changes in the broad market or changes in a company’s financial condition, sometimes rapidly or unpredictably. Equity securities are subject to “stock market risk,” meaning that stock prices in general may decline over short or extended periods of time. Investing in alternative assets involves higher risks than traditional investments and is suitable only for the long term. They are not tax efficient and have higher fees than traditional investments. They may also be highly leveraged and engage in speculative investment techniques, which can magnify the potential for investment loss or gain.* Equity, fixed income and cash are considered “traditional” asset classes. The term “alternative” describes all non-traditional asset classes. They include private and public equity, venture capital, hedge funds, real estate, commodities, distressed debt and more.
BUILDING YOUR PLAN
It may be useful to match dependable income sources with fixed retirement expenses, while coordinat-ing other investments with more discretionary expenses.
Inve
stin
g
Potential solutions
n Equities
n Alternatives*
n Equities
n Social Security
n Annuities
n Extended sector bonds
n Cash and cash alternatives
n Pension
n High quality bonds
Considerations
n What is the time horizon and appropriate planning vehicle for your heirs and your estate planning goals?
n What are your desires/wants?
n What are your basic needs?
n How much risk are you willing to take?
n What income sources do you have or will you need to create?
INCR
EASI
NG
RISK
/RET
URN
Legacy
Wants
Needs
32
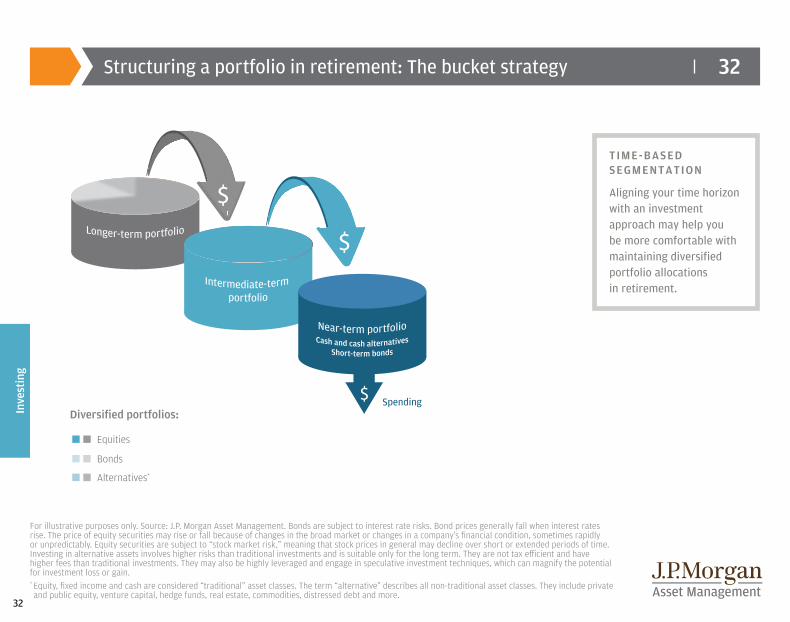
32Structuring a portfolio in retirement: The bucket strategy
For illustrative purposes only. Source: J.P. Morgan Asset Management. Bonds are subject to interest rate risks. Bond prices generally fall when interest rates rise. The price of equity securities may rise or fall because of changes in the broad market or changes in a company’s financial condition, sometimes rapidly or unpredictably. Equity securities are subject to “stock market risk,” meaning that stock prices in general may decline over short or extended periods of time. Investing in alternative assets involves higher risks than traditional investments and is suitable only for the long term. They are not tax efficient and have higher fees than traditional investments. They may also be highly leveraged and engage in speculative investment techniques, which can magnify the potential for investment loss or gain.* Equity, fixed income and cash are considered “traditional” asset classes. The term “alternative” describes all non-traditional asset classes. They include private and public equity, venture capital, hedge funds, real estate, commodities, distressed debt and more.
n n Equities
n n Bonds
n n Alternatives*
Inve
stin
g
SpendingDiversified portfolios:
TIME-BASED SEGMENTATION
Aligning your time horizon with an investment approach may help you be more comfortable with maintaining diversified portfolio allocations in retirement.
33
33
10-years ’06-’152006 2007 2008 2009 2010 2011 2012 2013 2014 2015 Ann. Vol.
REITs35.1%
EM Equity39.8%
Fixed Income
5.2%
EM Equity79.0%
REITs27.9%
REITs8.3%
REITs19.7%
Small Cap
38.8%REITs28.0%
REITs2.8%
REITs7.4%
REITs25.0%
EM Equity32.6%
Cmdty16.2%
Cash1.8%
High Yield
59.4%
Small Cap
26.9%
Fixed Income
7.8%
High Yield19.6%
Large Cap
32.4%
Large Cap
13.7%
Large Cap
1.4%
Large Cap7.3%
Cmdty.20.4%
DM Equity 26.9%
DM Equity 11.6%
AssetAlloc.
-25.4%
DM Equity 32.5%
EM Equity19.2%
High Yield3.1%
EM Equity18.6%
DM Equity 23.3%
Fixed Income6.0%
Fixed Income
0.5%
High Yield7.3%
Small Cap
20.0%
Small Cap
18.4%
AssetAlloc.7.1%
High Yield
-26.9%REITs28.0%
Cmdty16.8%
Large Cap2.1%
DM Equity17.9%
AssetAlloc.14.9%
AssetAlloc.5.2%
Cash0.0%
Small Cap
6.8%
EM Equity18.5%
Large Cap
15.8%
Fixed Income
7.0%
Small Cap
-33.8%
Small Cap
27.2%
Large Cap
15.1%Cash0.1%
Small Cap
16.3%
High Yield7.3%
Small Cap
4.9%
DM Equity -0.4%
AssetAlloc.5.6%
DM Equity 16.1%
AssetAlloc.15.3%
Large Cap
5.5%Cmdty-35.6%
Large Cap
26.5%
High Yield
14.8%
AssetAlloc.-0.7%
Large Cap
16.0%REITs2.9%
Cash0.0%
AssetAlloc.-2.0%
Fixed Income
4.5%
Large Cap
15.8%
High Yield13.7%
Cash4.8%
Large Cap
-37.0%
AssetAlloc.25.0%
AssetAlloc.13.3%
Small Cap
-4.2%
AssetAlloc.12.2%
Cash0.0%
High Yield0.0%
High Yield-2.7%
EM Equity3.9%
AssetAlloc.13.0%
Cash4.8%
High Yield3.2%
REITs-37.7%
Cmdty18.9%
DM Equity8.2%
DM Equity -11.7%
Fixed Income4.2%
Fixed Income-2.0%
EM Equity-1.8%
Small Cap
-4.4%
DM Equity 3.5%
High Yield12.3%
Fixed Income4.3%
Small Cap
-1.6%
DM Equity -43.1%
Fixed Income
5.9%
Fixed Income
6.5%Cmdty-13.3%
Cash0.1%
EM Equity-2.3%
DM Equity -4.5%
EM Equity-14.6%
Cash1.2%
Fixed Income
3.2%
Cmdty2.1%
REITs-15.7%
EM Equity-53.2%
Cash0.1%
Cash0.1%
EM Equity-18.2%
Cmdty-1.1%
Cmdty-9.5%
Cmdty-17.0%
Cmdty-24.7%
Cmdty-6.4%
Cash0.9%
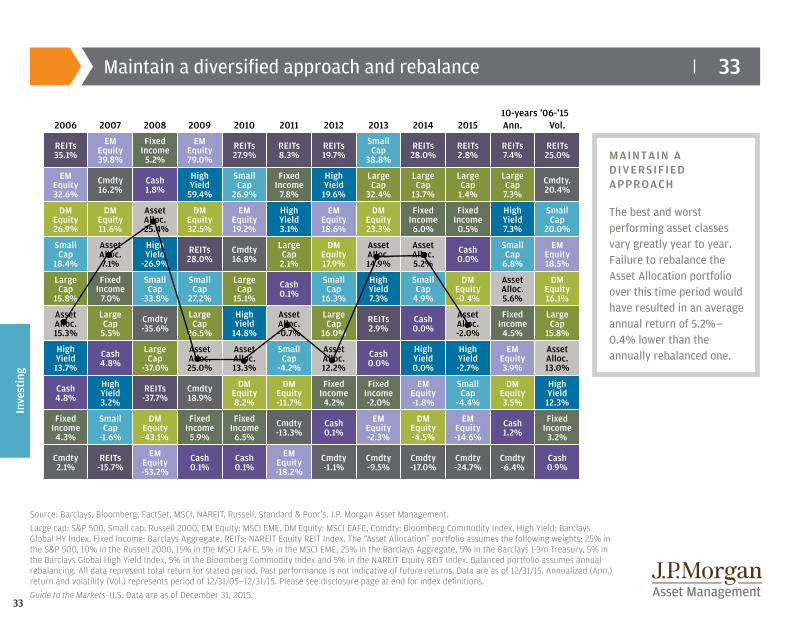
Source: Barclays, Bloomberg, FactSet, MSCI, NAREIT, Russell, Standard & Poor’s, J.P. Morgan Asset Management. Large cap: S&P 500, Small cap: Russell 2000, EM Equity: MSCI EME, DM Equity: MSCI EAFE, Comdty: Bloomberg Commodity Index, High Yield: Barclays Global HY Index, Fixed Income: Barclays Aggregate, REITs: NAREIT Equity REIT Index. The “Asset Allocation” portfolio assumes the following weights: 25% in the S&P 500, 10% in the Russell 2000, 15% in the MSCI EAFE, 5% in the MSCI EME, 25% in the Barclays Aggregate, 5% in the Barclays 1-3m Treasury, 5% in the Barclays Global High Yield Index, 5% in the Bloomberg Commodity Index and 5% in the NAREIT Equity REIT Index. Balanced portfolio assumes annual rebalancing. All data represent total return for stated period. Past performance is not indicative of future returns. Data are as of 12/31/15. Annualized (Ann.) return and volatility (Vol.) represents period of 12/31/05—12/31/15. Please see disclosure page at end for index definitions. Guide to the Markets–U.S. Data are as of December 31, 2015.
Maintain a diversified approach and rebalance
Inve
stin
g
MAINTAIN A DIVERSIFIED APPROACH
The best and worst performing asset classes vary greatly year to year. Failure to rebalance the Asset Allocation portfolio over this time period would have resulted in an average annual return of 5.2%— 0.4% lower than the annually rebalanced one.
34
34
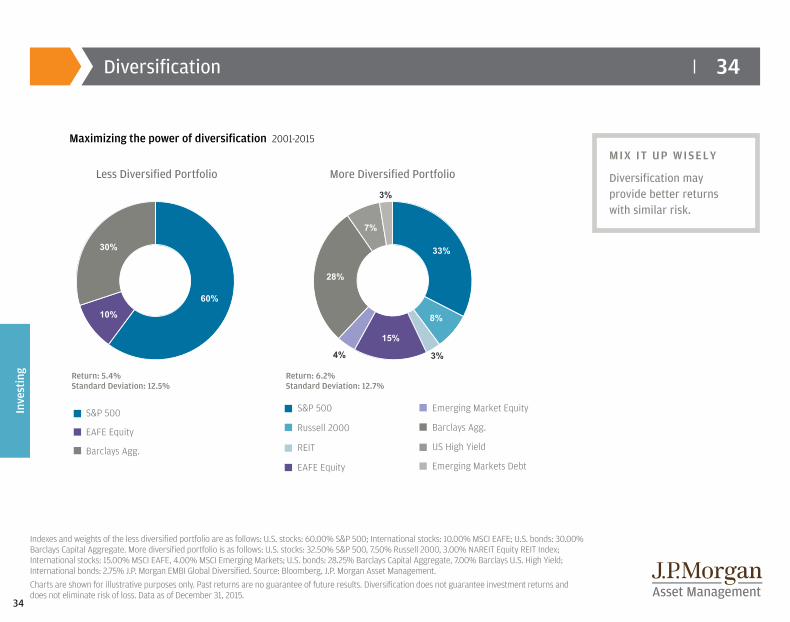
Indexes and weights of the less diversified portfolio are as follows: U.S. stocks: 60.00% S&P 500; International stocks: 10.00% MSCI EAFE; U.S. bonds: 30.00% Barclays Capital Aggregate. More diversified portfolio is as follows: U.S. stocks: 32.50% S&P 500, 7.50% Russell 2000, 3.00% NAREIT Equity REIT Index; International stocks: 15.00% MSCI EAFE, 4.00% MSCI Emerging Markets; U.S. bonds: 28.25% Barclays Capital Aggregate, 7.00% Barclays U.S. High Yield; International bonds: 2.75% J.P. Morgan EMBI Global Diversified. Source: Bloomberg, J.P. Morgan Asset Management.Charts are shown for illustrative purposes only. Past returns are no guarantee of future results. Diversification does not guarantee investment returns and does not eliminate risk of loss. Data as of December 31, 2015.
MIX IT UP WISELY
Diversification may provide better returns with similar risk.
Diversification
Inve
stin
g
Maximizing the power of diversification 2001-2015
Return: 5.4%Standard Deviation: 12.5%
Return: 6.2%Standard Deviation: 12.7%
33%
8%
3%
15%
4%
28%
7%
3%
60%
10%
30%
S&P 500
EAFE Equity
Barclays Agg. REIT
EAFE Equity
Russell 2000
S&P 500
US High Yield
Emerging Markets Debt
Barclays Agg.
Emerging Market Equity
Less Diversified Portfolio More Diversified Portfolio
35
35
$70,000
Fully invested
Missed 10 best days
Missed 20 best days
Missed 30 best days
Missed 40 best days
Missed 50 best days
Missed 60 best days
$65,453(9.85% return)
$32,665(6.10% return)
$20,354(3.62% return)
$13,446(1.49% return)
$9,140(-0.45% return) $6,392
(-2.21% return) $4,570(-3.84% return)
$60,000
$50,000
$40,000
$30,000
$20,000
$10,000
$0
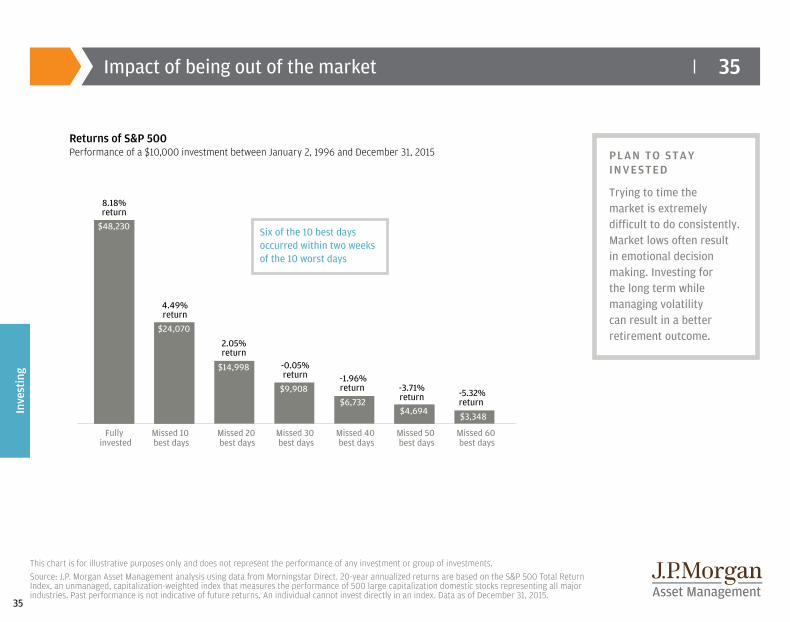
This chart is for illustrative purposes only and does not represent the performance of any investment or group of investments.Source: J.P. Morgan Asset Management analysis using data from Morningstar Direct. 20-year annualized returns are based on the S&P 500 Total Return Index, an unmanaged, capitalization-weighted index that measures the performance of 500 large capitalization domestic stocks representing all major industries. Past performance is not indicative of future returns. An individual cannot invest directly in an index. Data as of December 31, 2015.
PLAN TO STAY INVESTED
Trying to time the market is extremely difficult to do consistently. Market lows often result in emotional decision making. Investing for the long term while managing volatility can result in a better retirement outcome.
Impact of being out of the market
Inve
stin
g
Returns of S&P 500Performance of a $10,000 investment between January 2, 1996 and December 31, 2015
$48,230
$24,070
$14,998
$9,908$6,732
$4,694$3,348
$0
$10,000
$20,000
$30,000
$40,000
$50,000
$60,000
Fully Invested Missed 10 bestdays
Missed 20 bestdays
Missed 30 bestdays
Missed 40 bestdays
Missed 50 bestdays
Missed 60 bestdays
8.18%return
4.49%return
2.05%return
-0.05%return -1.96%
return -3.71%return -5.32%
return
Six of the 10 best days occurred within two weeks of the 10 worst days
36
36
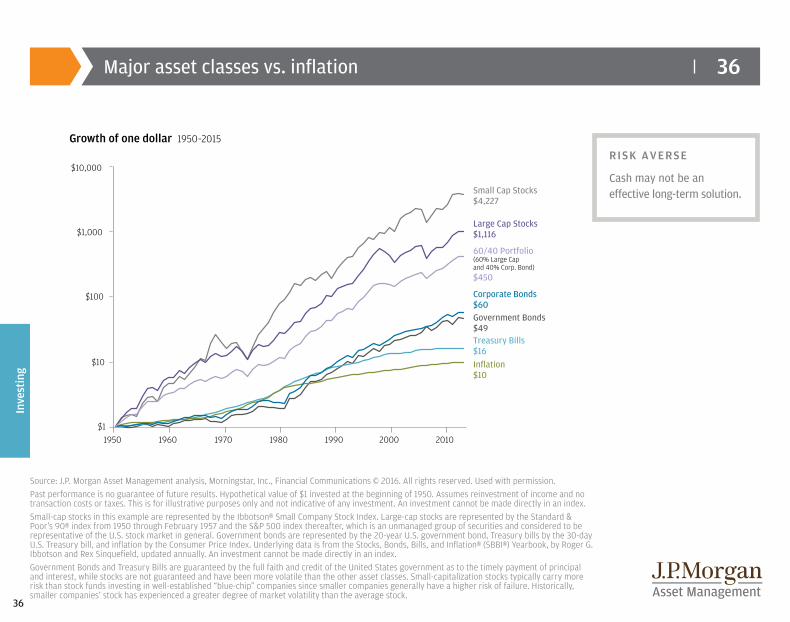
Source: J.P. Morgan Asset Management analysis, Morningstar, Inc., Financial Communications © 2016. All rights reserved. Used with permission.Past performance is no guarantee of future results. Hypothetical value of $1 invested at the beginning of 1950. Assumes reinvestment of income and no transaction costs or taxes. This is for illustrative purposes only and not indicative of any investment. An investment cannot be made directly in an index. Small-cap stocks in this example are represented by the Ibbotson® Small Company Stock Index. Large-cap stocks are represented by the Standard & Poor’s 90® index from 1950 through February 1957 and the S&P 500 index thereafter, which is an unmanaged group of securities and considered to be representative of the U.S. stock market in general. Government bonds are represented by the 20-year U.S. government bond, Treasury bills by the 30-day U.S. Treasury bill, and inflation by the Consumer Price Index. Underlying data is from the Stocks, Bonds, Bills, and Inflation® (SBBI®) Yearbook, by Roger G. Ibbotson and Rex Sinquefield, updated annually. An investment cannot be made directly in an index.Government Bonds and Treasury Bills are guaranteed by the full faith and credit of the United States government as to the timely payment of principal and interest, while stocks are not guaranteed and have been more volatile than the other asset classes. Small-capitalization stocks typically carry more risk than stock funds investing in well-established “blue-chip” companies since smaller companies generally have a higher risk of failure. Historically, smaller companies’ stock has experienced a greater degree of market volatility than the average stock.
Major asset classes vs. inflation
Inve
stin
g
Growth of one dollar 1950–2015
$10,000
$1,000
$100
$10
$11950 1960 1970 1980 1990 2000 2010
Small Cap Stocks$4,227
Large Cap Stocks$1,116
Government Bonds$49
Corporate Bonds$60
60/40 Portfolio(60% Large Cap and 40% Corp. Bond)$450
Treasury Bills$16Inflation$10
RISK AVERSE
Cash may not be an effective long-term solution.
37
37
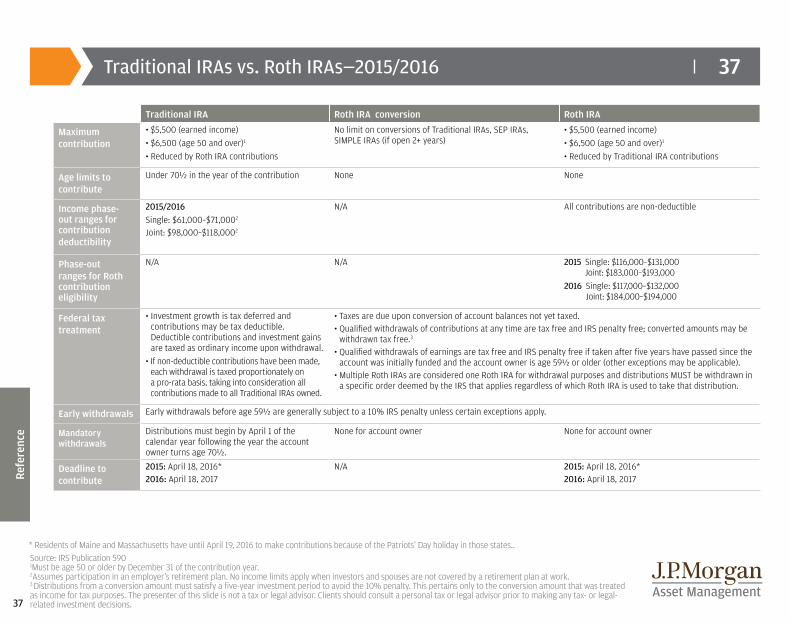
Source: IRS Publication 5901Must be age 50 or older by December 31 of the contribution year.2Assumes participation in an employer’s retirement plan. No income limits apply when investors and spouses are not covered by a retirement plan at work.3 Distributions from a conversion amount must satisfy a five-year investment period to avoid the 10% penalty. This pertains only to the conversion amount that was treated as income for tax purposes. The presenter of this slide is not a tax or legal advisor. Clients should consult a personal tax or legal advisor prior to making any tax- or legal-related investment decisions.
Traditional IRAs vs. Roth IRAs—2015/2016
Refe
renc
e
Traditional IRA Roth IRA conversion Roth IRA
Maximum contribution
• $5,500 (earned income)• $6,500 (age 50 and over)1
• Reduced by Roth IRA contributions
No limit on conversions of Traditional IRAs, SEP IRAs, SIMPLE IRAs (if open 2+ years)
• $5,500 (earned income)• $6,500 (age 50 and over)1
• Reduced by Traditional IRA contributions
Age limits to contribute
Under 70½ in the year of the contribution None None
Income phase-out ranges for contribution deductibility
2015/2016Single: $61,000–$71,0002 Joint: $98,000–$118,0002
N/A All contributions are non-deductible
Phase-out ranges for Roth contribution eligibility
N/A N/A 2015 Single: $116,000–$131,000 Joint: $183,000–$193,000
2016 Single: $117,000–$132,000 Joint: $184,000–$194,000
Federal tax treatment
• Investment growth is tax deferred and contributions may be tax deductible. Deductible contributions and investment gains are taxed as ordinary income upon withdrawal.
• If non-deductible contributions have been made, each withdrawal is taxed proportionately on a pro-rata basis, taking into consideration all contributions made to all Traditional IRAs owned.
• Taxes are due upon conversion of account balances not yet taxed.• Qualified withdrawals of contributions at any time are tax free and IRS penalty free; converted amounts may be
withdrawn tax free.3
• Qualified withdrawals of earnings are tax free and IRS penalty free if taken after five years have passed since the account was initially funded and the account owner is age 59½ or older (other exceptions may be applicable).
• Multiple Roth IRAs are considered one Roth IRA for withdrawal purposes and distributions MUST be withdrawn in a specific order deemed by the IRS that applies regardless of which Roth IRA is used to take that distribution.
Early withdrawals Early withdrawals before age 59½ are generally subject to a 10% IRS penalty unless certain exceptions apply.
Mandatory withdrawals
Distributions must begin by April 1 of the calendar year following the year the account owner turns age 70½.
None for account owner None for account owner
Deadline to contribute
2015: April 18, 2016*2016: April 18, 2017
N/A 2015: April 18, 2016*2016: April 18, 2017
* Residents of Maine and Massachusetts have until April 19, 2016 to make contributions because of the Patriots’ Day holiday in those states..
38
38
Refe
renc
e
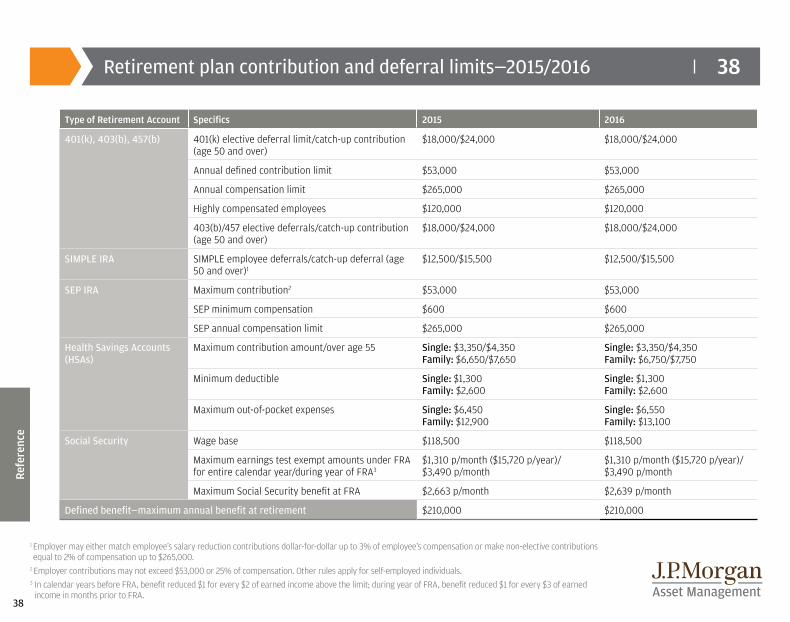
Type of Retirement Account Specifics 2015 2016
401(k), 403(b), 457(b) 401(k) elective deferral limit/catch-up contribution (age 50 and over)
$18,000/$24,000 $18,000/$24,000
Annual defined contribution limit $53,000 $53,000
Annual compensation limit $265,000 $265,000
Highly compensated employees $120,000 $120,000
403(b)/457 elective deferrals/catch-up contribution (age 50 and over)
$18,000/$24,000 $18,000/$24,000
SIMPLE IRA SIMPLE employee deferrals/catch-up deferral (age 50 and over)1
$12,500/$15,500 $12,500/$15,500
SEP IRA Maximum contribution2 $53,000 $53,000
SEP minimum compensation $600 $600
SEP annual compensation limit $265,000 $265,000
Health Savings Accounts (HSAs)
Maximum contribution amount/over age 55 Single: $3,350/$4,350Family: $6,650/$7,650
Single: $3,350/$4,350Family: $6,750/$7,750
Minimum deductible Single: $1,300Family: $2,600
Single: $1,300Family: $2,600
Maximum out-of-pocket expenses Single: $6,450Family: $12,900
Single: $6,550Family: $13,100
Social Security Wage base $118,500 $118,500
Maximum earnings test exempt amounts under FRA for entire calendar year/during year of FRA3
$1,310 p/month ($15,720 p/year)/ $3,490 p/month
$1,310 p/month ($15,720 p/year)/ $3,490 p/month
Maximum Social Security benefit at FRA $2,663 p/month $2,639 p/month
Defined benefit—maximum annual benefit at retirement $210,000 $210,000
Retirement plan contribution and deferral limits—2015/2016
1 Employer may either match employee’s salary reduction contributions dollar-for-dollar up to 3% of employee’s compensation or make non-elective contributions equal to 2% of compensation up to $265,000.
2 Employer contributions may not exceed $53,000 or 25% of compensation. Other rules apply for self-employed individuals.3 In calendar years before FRA, benefit reduced $1 for every $2 of earned income above the limit; during year of FRA, benefit reduced $1 for every $3 of earned
income in months prior to FRA.
39
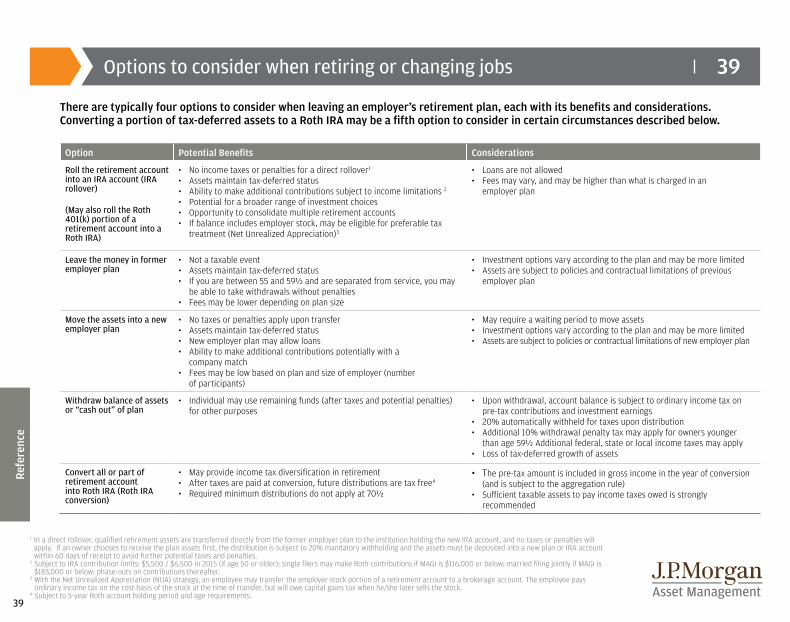
39Options to consider when retiring or changing jobs
Refe
renc
e
There are typically four options to consider when leaving an employer’s retirement plan, each with its benefits and considerations. Converting a portion of tax-deferred assets to a Roth IRA may be a fifth option to consider in certain circumstances described below.
1 In a direct rollover, qualified retirement assets are transferred directly from the former employer plan to the institution holding the new IRA account, and no taxes or penalties will apply. If an owner chooses to receive the plan assets first, the distribution is subject to 20% mandatory withholding and the assets must be deposited into a new plan or IRA account within 60 days of receipt to avoid further potential taxes and penalties.
2 Subject to IRA contribution limits: $5,500 / $6,500 in 2015 (if age 50 or older); single filers may make Roth contributions if MAGI is $116,000 or below; married filing jointly if MAGI is $183,000 or below; phase-outs on contributions thereafter.
3 With the Net Unrealized Appreciation (NUA) strategy, an employee may transfer the employer stock portion of a retirement account to a brokerage account. The employee pays ordinary income tax on the cost basis of the stock at the time of transfer, but will owe capital gains tax when he/she later sells the stock.
4 Subject to 5-year Roth account holding period and age requirements.
Option Potential Benefits Considerations
Roll the retirement account into an IRA account (IRA rollover)
(May also roll the Roth 401(k) portion of a retirement account into a Roth IRA)
• No income taxes or penalties for a direct rollover1
• Assets maintain tax-deferred status• Ability to make additional contributions subject to income limitations 2
• Potential for a broader range of investment choices• Opportunity to consolidate multiple retirement accounts• If balance includes employer stock, may be eligible for preferable tax
treatment (Net Unrealized Appreciation)3
• Loans are not allowed• Fees may vary, and may be higher than what is charged in an
employer plan
Leave the money in former employer plan
• Not a taxable event• Assets maintain tax-deferred status• If you are between 55 and 59½ and are separated from service, you may
be able to take withdrawals without penalties• Fees may be lower depending on plan size
• Investment options vary according to the plan and may be more limited• Assets are subject to policies and contractual limitations of previous
employer plan
Move the assets into a new employer plan
• No taxes or penalties apply upon transfer• Assets maintain tax-deferred status• New employer plan may allow loans• Ability to make additional contributions potentially with a
company match• Fees may be low based on plan and size of employer (number
of participants)
• May require a waiting period to move assets• Investment options vary according to the plan and may be more limited• Assets are subject to policies or contractual limitations of new employer plan
Withdraw balance of assets or “cash out” of plan
• Individual may use remaining funds (after taxes and potential penalties) for other purposes
• Upon withdrawal, account balance is subject to ordinary income tax on pre-tax contributions and investment earnings
• 20% automatically withheld for taxes upon distribution• Additional 10% withdrawal penalty tax may apply for owners younger
than age 59½ Additional federal, state or local income taxes may apply • Loss of tax-deferred growth of assets
Convert all or part of retirement account into Roth IRA (Roth IRA conversion)
• May provide income tax diversification in retirement• After taxes are paid at conversion, future distributions are tax free4
• Required minimum distributions do not apply at 70½
• The pre-tax amount is included in gross income in the year of conversion (and is subject to the aggregation rule)
• Sufficient taxable assets to pay income taxes owed is strongly recommended
40
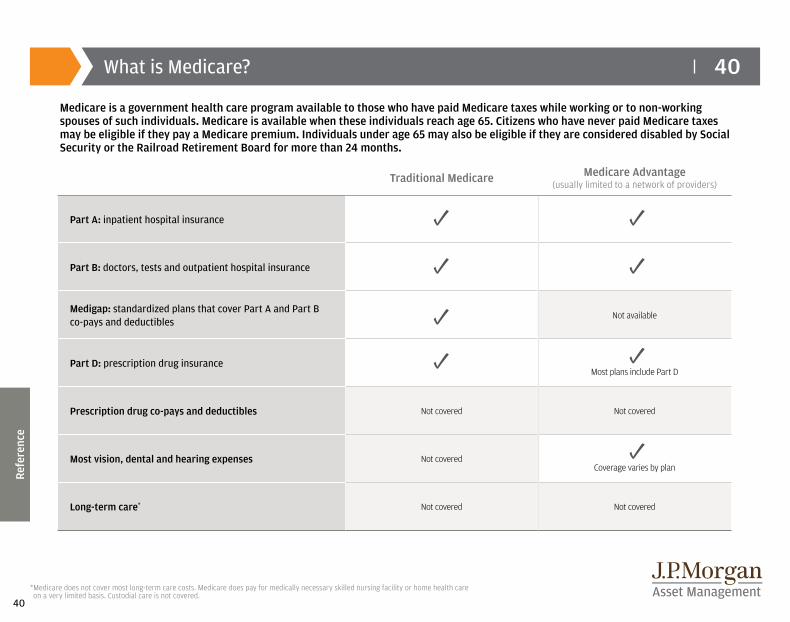
40What is Medicare?
Refe
renc
e
Traditional Medicare Medicare Advantage (usually limited to a network of providers)
Part A: inpatient hospital insurance
Part B: doctors, tests and outpatient hospital insurance
Medigap: standardized plans that cover Part A and Part B co-pays and deductibles
Not available
Part D: prescription drug insuranceMost plans include Part D
Prescription drug co-pays and deductibles Not covered Not covered
Most vision, dental and hearing expenses Not coveredCoverage varies by plan
Long-term care* Not covered Not covered
* Medicare does not cover most long-term care costs. Medicare does pay for medically necessary skilled nursing facility or home health care on a very limited basis. Custodial care is not covered.
Medicare is a government health care program available to those who have paid Medicare taxes while working or to non-working spouses of such individuals. Medicare is available when these individuals reach age 65. Citizens who have never paid Medicare taxes may be eligible if they pay a Medicare premium. Individuals under age 65 may also be eligible if they are considered disabled by Social Security or the Railroad Retirement Board for more than 24 months.
41
41
Refe
renc
e
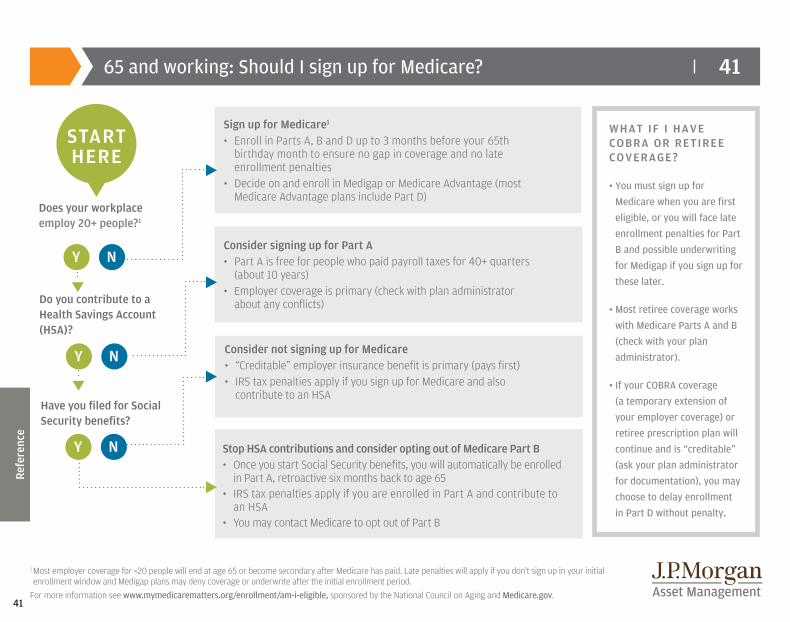
1 Most employer coverage for <20 people will end at age 65 or become secondary after Medicare has paid. Late penalties will apply if you don’t sign up in your initial enrollment window and Medigap plans may deny coverage or underwrite after the initial enrollment period.
For more information see www.mymedicarematters.org/enrollment/am-i-eligible, sponsored by the National Council on Aging and Medicare.gov.
65 and working: Should I sign up for Medicare?
WHAT IF I HAVE COBRA OR RETIREE COVERAGE?
• You must sign up for Medicare when you are first eligible, or you will face late enrollment penalties for Part B and possible underwriting for Medigap if you sign up for these later.
• Most retiree coverage works with Medicare Parts A and B (check with your plan administrator).
• If your COBRA coverage (a temporary extension of your employer coverage) or retiree prescription plan will continue and is “creditable” (ask your plan administrator for documentation), you may choose to delay enrollment in Part D without penalty.
Does your workplace employ 20+ people?1
Do you contribute to a Health Savings Account (HSA)?
Have you filed for Social Security benefits?
Sign up for Medicare1 • Enroll in Parts A, B and D up to 3 months before your 65th
birthday month to ensure no gap in coverage and no late enrollment penalties
• Decide on and enroll in Medigap or Medicare Advantage (most Medicare Advantage plans include Part D)
Consider signing up for Part A• Part A is free for people who paid payroll taxes for 40+ quarters
(about 10 years)• Employer coverage is primary (check with plan administrator
about any conflicts)
Consider not signing up for Medicare• “Creditable” employer insurance benefit is primary (pays first)• IRS tax penalties apply if you sign up for Medicare and also
contribute to an HSA
START HERE
N
N
N Stop HSA contributions and consider opting out of Medicare Part B• Once you start Social Security benefits, you will automatically be enrolled
in Part A, retroactive six months back to age 65• IRS tax penalties apply if you are enrolled in Part A and contribute to
an HSA• You may contact Medicare to opt out of Part B
Y
Y
Y
42
42
Refe
renc
e
Variable annuity guarantees are only as good as the insurance company that gives them. While it is an uncommon occurrence that the insurance companies that back these guarantees are unable to meet their obligations, it may happen. Annuity withdrawals prior to 59 ½ may be subject to tax penalties, are subject to market risk and may lose value. Riders have additional fees and costs associated with them and are subject to additional condition, restrictions and limitation.
US Securities and Exchange Commission
FINRA Investor Education Series1 Subject to the claims paying ability of the insurance company.2 Indexed annuities are not registered with the SEC.
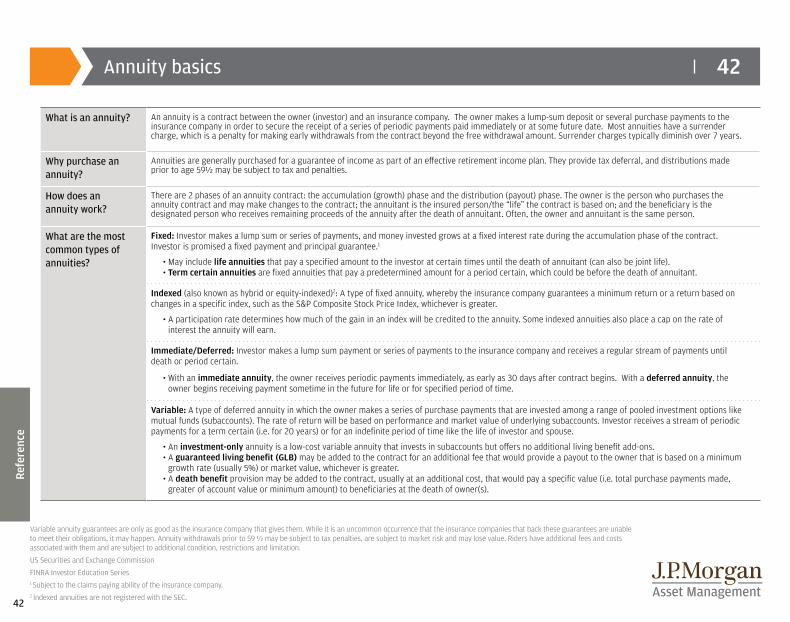
What is an annuity? An annuity is a contract between the owner (investor) and an insurance company. The owner makes a lump-sum deposit or several purchase payments to the insurance company in order to secure the receipt of a series of periodic payments paid immediately or at some future date. Most annuities have a surrender charge, which is a penalty for making early withdrawals from the contract beyond the free withdrawal amount. Surrender charges typically diminish over 7 years.
Why purchase an annuity?
Annuities are generally purchased for a guarantee of income as part of an effective retirement income plan. They provide tax deferral, and distributions made prior to age 59½ may be subject to tax and penalties.
How does an annuity work?
There are 2 phases of an annuity contract: the accumulation (growth) phase and the distribution (payout) phase. The owner is the person who purchases the annuity contract and may make changes to the contract; the annuitant is the insured person/the “life” the contract is based on; and the beneficiary is the designated person who receives remaining proceeds of the annuity after the death of annuitant. Often, the owner and annuitant is the same person.
What are the most common types of annuities?
Fixed: Investor makes a lump sum or series of payments, and money invested grows at a fixed interest rate during the accumulation phase of the contract. Investor is promised a fixed payment and principal guarantee.1
• May include life annuities that pay a specified amount to the investor at certain times until the death of annuitant (can also be joint life).• Term certain annuities are fixed annuities that pay a predetermined amount for a period certain, which could be before the death of annuitant.
Indexed (also known as hybrid or equity-indexed)2: A type of fixed annuity, whereby the insurance company guarantees a minimum return or a return based on changes in a specific index, such as the S&P Composite Stock Price Index, whichever is greater.
• A participation rate determines how much of the gain in an index will be credited to the annuity. Some indexed annuities also place a cap on the rate of interest the annuity will earn.
Immediate/Deferred: Investor makes a lump sum payment or series of payments to the insurance company and receives a regular stream of payments until death or period certain.
• With an immediate annuity, the owner receives periodic payments immediately, as early as 30 days after contract begins. With a deferred annuity, the owner begins receiving payment sometime in the future for life or for specified period of time.
Variable: A type of deferred annuity in which the owner makes a series of purchase payments that are invested among a range of pooled investment options like mutual funds (subaccounts). The rate of return will be based on performance and market value of underlying subaccounts. Investor receives a stream of periodic payments for a term certain (i.e. for 20 years) or for an indefinite period of time like the life of investor and spouse.
• An investment-only annuity is a low-cost variable annuity that invests in subaccounts but offers no additional living benefit add-ons.• A guaranteed living benefit (GLB) may be added to the contract for an additional fee that would provide a payout to the owner that is based on a minimum
growth rate (usually 5%) or market value, whichever is greater.• A death benefit provision may be added to the contract, usually at an additional cost, that would pay a specific value (i.e. total purchase payments made,
greater of account value or minimum amount) to beneficiaries at the death of owner(s).
Annuity basics
43
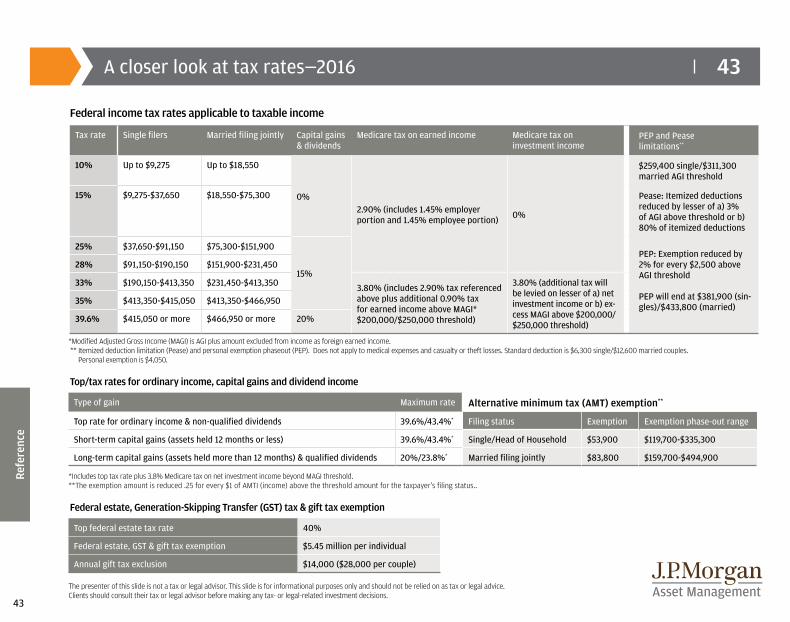
43A closer look at tax rates—2016
Federal income tax rates applicable to taxable income
Top/tax rates for ordinary income, capital gains and dividend income
Federal estate, Generation-Skipping Transfer (GST) tax & gift tax exemption
Refe
renc
e
*Modified Adjusted Gross Income (MAGI) is AGI plus amount excluded from income as foreign earned income. ** Itemized deduction limitation (Pease) and personal exemption phaseout (PEP). Does not apply to medical expenses and casualty or theft losses. Standard deduction is $6,300 single/$12,600 married couples.
Personal exemption is $4,050.
*Includes top tax rate plus 3.8% Medicare tax on net investment income beyond MAGI threshold. **The exemption amount is reduced .25 for every $1 of AMTI (income) above the threshold amount for the taxpayer’s filing status..
The presenter of this slide is not a tax or legal advisor. This slide is for informational purposes only and should not be relied on as tax or legal advice. Clients should consult their tax or legal advisor before making any tax- or legal-related investment decisions.
Refe
renc
e
Tax rate Single filers Married filing jointly Capital gains & dividends
Medicare tax on earned income Medicare tax on investment income
PEP and Pease limitations**
10% Up to $9,275 Up to $18,550
0%2.90% (includes 1.45% employer portion and 1.45% employee portion) 0%
$259,400 single/$311,300 married AGI threshold
15% $9,275-$37,650 $18,550-$75,300 Pease: Itemized deductions reduced by lesser of a) 3% of AGI above threshold or b) 80% of itemized deductions
25% $37,650-$91,150 $75,300-$151,900
15%
PEP: Exemption reduced by 2% for every $2,500 above AGI threshold
PEP will end at $381,900 (sin-gles)/$433,800 (married)
28% $91,150-$190,150 $151,900-$231,450
33% $190,150-$413,350 $231,450-$413,350 3.80% (includes 2.90% tax referenced above plus additional 0.90% tax for earned income above MAGI* $200,000/$250,000 threshold)
3.80% (additional tax will be levied on lesser of a) net investment income or b) ex-cess MAGI above $200,000/ $250,000 threshold)
35% $413,350-$415,050 $413,350-$466,950
39.6% $415,050 or more $466,950 or more 20%
Type of gain Maximum rate Alternative minimum tax (AMT) exemption**
Top rate for ordinary income & non-qualified dividends 39.6%/43.4%* Filing status Exemption Exemption phase-out range
Short-term capital gains (assets held 12 months or less) 39.6%/43.4%* Single/Head of Household $53,900 $119,700-$335,300
Long-term capital gains (assets held more than 12 months) & qualified dividends 20%/23.8%* Married filing jointly $83,800 $159,700-$494,900
Top federal estate tax rate 40%
Federal estate, GST & gift tax exemption $5.45 million per individual
Annual gift tax exclusion $14,000 ($28,000 per couple)
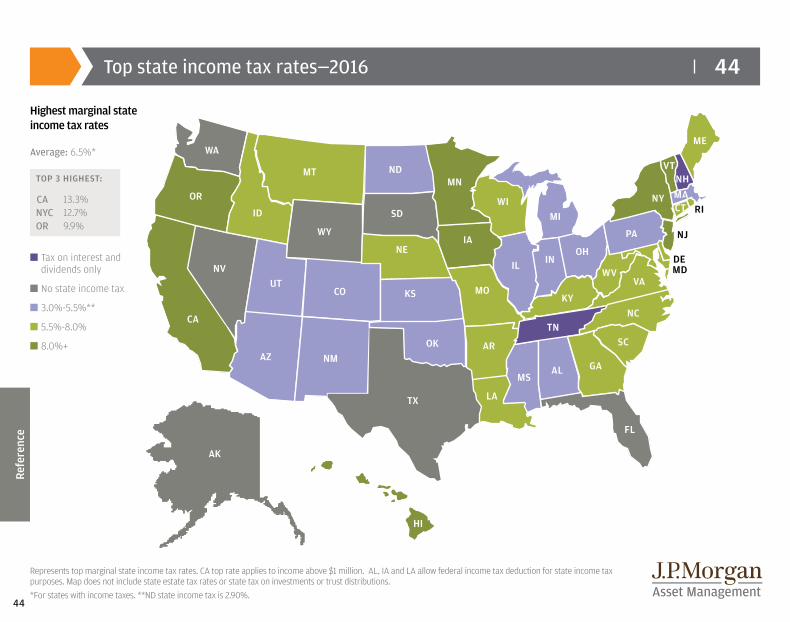
44
44
Refe
renc
e
Top state income tax rates—2016
Represents top marginal state income tax rates. CA top rate applies to income above $1 million. AL, IA and LA allow federal income tax deduction for state income tax purposes. Map does not include state estate tax rates or state tax on investments or trust distributions.*For states with income taxes. **ND state income tax is 2.90%.
WA
OR
ID
NVUT
AZ
MT
WY
CO
NM
ND
SD
TX LA
VTNH
ME
MA
VA
TNNC
SC
GAALMS
FL
RI
DE
NY
NE
KS
MN
IA
MO
AR
WIMI
OH
KY
WVWV
PA NJ
MDIL INIL
CA
CT
AK
HI
OK
n Tax on interest and dividends only
n No state income tax
n 3.0%-5.5%**
n 5.5%-8.0%
n 8.0%+
Average: 6.5%*
TOP 3 HIGHEST:
CA 13.3% NYC 12.7% OR 9.9%
Highest marginal state income tax rates
45
45J.P. Morgan Asset Management—Index definitions
Indexes are unmanaged and an individual cannot invest directly in an index. Index returns do not include fees or expenses. The S&P 500 Index is widely regarded as the best single gauge of the U.S. equities market. This world-renowned index includes a representative sample of 500 leading companies in leading industries of the U.S. economy. Although the S&P 500 Index focuses on the large cap segment of the market, with approximately 75% coverage of U.S. equities, it is also an ideal proxy for the total market. An investor cannot invest directly in an index. The S&P MidCap 400 Index tracks a diverse basket of medium-sized U.S. firms. A mid cap stock is broadly defined as a company with a market capitalization ranging from about $2 billion to $10 billion.The S&P SmallCap 600 Index invests in a basket of small cap equities. A small cap company is generally defined as a stock with a market capitalization between $300 million and $2 billion.The Russell 2000 Index® measures the performance of the 2,000 smallest companies in the Russell 3000 Index.The MSCI® EAFE (Europe, Australia, Far East) Net Index is recognized as the pre-eminent benchmark in the United States to measure international equity performance. It comprises 21 MSCI country indexes, representing the developed markets outside of North America. The MSCI Emerging Markets IndexSM is a free float-adjusted market capitalization index that is designed to measure equity market performance in the global emerging markets. As of June 2007, the MSCI Emerging Markets Index consisted of the following 25 emerging market country indices: Argentina, Brazil, Chile, China, Colombia, Czech Republic, Egypt, Hungary, India, Indonesia, Israel, Jordan, Korea, Malaysia, Mexico, Morocco, Pakistan, Peru, Philippines, Poland, Russia, South Africa, Taiwan, Thailand and Turkey.The CS/Tremont Equity Market Neutral Index takes both long and short positions in stocks with the aim of minimizing exposure to the systematic risk of the market (i.e., a beta of zero).*Market Neutral returns for November 2008 are estimates by J.P. Morgan Funds Market Strategy and are based on a December 8, 2008 published estimate for November returns by CS/Tremont in which the Market Neutral returns were estimated to be +0.85% (with 69% of all CS/Tremont constituents having reported return data). Presumed to be excluded from the November return are three funds, which were later marked to $0 by CS/Tremont in connection with the Bernard Madoff scandal. J.P. Morgan Funds believes this distortion is not an accurate representation of returns in the category. CS/Tremont later published a finalized November return of -40.56% for the month, reflecting this mark-down. CS/Tremont assumes no responsibility for these estimates.The NCREIF Property Index is a quarterly time series composite total rate of return measure of investment performance of a very large pool of individual commercial real estate properties acquired in the private market for investment purposes only. All properties in the NPI have been acquired, at least in part, on behalf of tax-exempt institutional investors — the great majority being pension funds. As such, all properties are held in a fiduciary environment.
The FTSE NAREIT EQUITY REIT Index is designed to provide the most comprehensive assessment of overall industry performance and includes all tax-qualified real estate investment trusts (REITs) that are listed on the NYSE, the American Stock Exchange or the NASDAQ National Market List.The Barclays Capital U.S. Aggregate Index represents securities that are SEC-registered, taxable and dollar denominated. The index covers the U.S. investment-grade fixed rate bond market, with index components for government and corporate securities, mortgage pass-through securities and asset-backed securities. These major sectors are subdivided into more specific indexes that are calculated and reported on a regular basis. The HFRI Equity Market Neutral Index is an equally weighted performance index. The HFRI is broken down into 33 different categories by strategy. The strategy of this index seeks to profit by exploiting inefficiencies between related equity securities, neutralizing exposure to market risk by combining long and short positions. In many cases, portfolios are structured to be market, industry, sector and dollar neutral. One example of this strategy is to build portfolios made up of long positions in the strongest companies in several industries and take corresponding short positions in those showing signs of weakness. Due to the mutual agreements with the hedge fund managers listed in the HFRI database, the index is not at liberty to disclose the particular funds behind this index.The Merrill Lynch Global Government Index tracks the performance of investment-grade sovereign debt publicly issued and denominated in the issuer’s own domestic market and currency. In order to qualify for inclusion in the Index, a country (i) must be an OECD member; (ii) must have an investment-grade foreign currency long-term sovereign debt rating (based on an average of Moody’s, S&P and Fitch); (iii) must have $50 billion (USD equivalent) outstanding face value of Index qualifying debt (i.e., after imposing constituent level filters on amount outstanding, remaining term to maturity, etc.) to enter the Index; (iv) must have at least $25 billion (USD equivalent) in outstanding face value of Index qualifying debt in order to remain in the Index; (v) must be available to foreign investors; and (vi) must have at least one readily available, transparent price source for its securities.The Merrill Lynch U.S. High Yield Index tracks the performance of US dollar-denominated below-investment-grade corporate debt publicly issued in the U.S. domestic market. Qualifying securities must have a below-investment-grade rating (based on an average of Moody’s, S&P and Fitch) and an investment-grade-rated country of risk (based on an average of Moody’s, S&P and Fitch foreign currency long-term sovereign debt ratings).The Dow Jones Industrial Average measures the stock performance of 30 leading blue-chip U.S. companies.The Bloomberg Commodity Index is composed of futures contracts on physical commodities and represents twenty two separate commodities traded on U.S. exchanges, with the exception of aluminum, nickel, and zinc.
Refe
renc
e
46
46J.P. Morgan Asset Management—Disclosures
Unless otherwise indicated, all illustrations are shown in U.S. dollars.Past performance is no guarantee of comparable future results.Diversification does not guarantee investment returns and does not eliminate the risk of loss.Bonds are subject to interest rate risks. Bond prices generally fall when interest rates rise.The price of equity securities may rise or fall because of changes in the broad market or changes in a company’s financial condition, sometimes rapidly or unpredictably. These price movements may result from factors affecting individual companies, sectors or industries, or the securities market as a whole, such as changes in economic or political conditions. Equity securities are subject to “stock market risk,” meaning that stock prices in general may decline over short or extended periods of time. Small capitalization investing typically carries more risk than investing in well-established “blue-chip” companies since smaller companies generally have a higher risk of failure. Historically, smaller companies’ stock has experienced a greater degree of market volatility than the average stock.Mid capitalization investing typically carries more risk than investing in well-established “blue-chip” companies. Historically, mid cap companies’ stock has experienced a greater degree of market volatility than the average stock.Real estate investments may be subject to a higher degree of market risk because of concentration in a specific industry, sector or geographical sector. Real estate investments may be subject to risks including, but not limited to, declines in the value of real estate, risks related to general and economic conditions, changes in the value of the underlying property owned by the trust and defaults by borrower.International investing involves a greater degree of risk and increased volatility. Changes in currency exchange rates and differences in accounting and taxation policies outside the U.S. can raise or lower returns. Also, some overseas markets may not be as politically and economically stable as the United States and other nations. Investments in emerging markets can be more volatile. As mentioned above, the normal risks of investing in foreign countries are heightened when investing in emerging markets. In addition, the small size of securities markets and the low trading volume may lead to a lack of liquidity, which leads to increased volatility. Also, emerging markets may not provide adequate legal protection for private or foreign investment or private property.Investments in commodities may have greater volatility than investments in traditional securities, particularly if the instruments involve leverage. The value of commodity-linked derivative instruments may be affected by changes in overall market movements, commodity index volatility, changes in interest rates or factors affecting a particular industry
or commodity, such as drought, floods, weather, livestock disease, embargoes, tariffs and international economic, political and regulatory developments. Use of leveraged commodity-linked derivatives creates an opportunity for increased return but, at the same time, creates the possibility for greater loss.Investing in alternative assets involves higher risks than traditional investments and is suitable only for sophisticated investors. Alternative investments involve greater risks than traditional investments and should not be deemed a complete investment program. They are not tax efficient and an investor should consult with his/her tax advisor prior to investing. Alternative investments have higher fees than traditional investments and they may also be highly leveraged and engage in speculative investment techniques, which can magnify the potential for investment loss or gain. The value of the investment may fall as well as rise and investors may get back less than they invested.Opinions and estimates offered constitute our judgment and are subject to change without notice, as are statements of financial market trends, which are based on current market conditions. We believe the information provided here is reliable, but do not warrant its accuracy or completeness. This material is not intended as an offer or solicitation for the purchase or sale of any financial instrument. The views and strategies described may not be suitable for all investors. This material has been prepared for informational purposes only and is not intended to provide, and should not be relied on for, accounting, legal or tax advice. References to future returns are not promises or even estimates of actual returns a client portfolio may achieve. Any forecasts contained herein are for illustrative purposes only and are not to be relied upon as advice or interpreted as a recommendation.The views expressed are those of J.P. Morgan Asset Management. They are subject to change at any time. These views do not necessarily reflect the opinions of any other firm. J.P. Morgan Asset Management is the marketing name for the asset management businesses of JPMorgan Chase & Co. Those businesses include, but are not limited to, J.P. Morgan Investment Management Inc., Security Capital Research & Management Incorporated and J.P. Morgan Alternative Asset Management, Inc.JPMorgan Distribution Services Inc., member FINRA/SIPC© JPMorgan Chase & Co., February 2016JP-GTR
NOT FDIC INSURED | NO BANK GUARANTEE | MAY LOSE VALUE
Refe
renc
e


