40
Guide to Using FORAGE Grazing Land Systems - Science Delivery June 2018 / Version 1.8
| Date post: | 13-Sep-2018 |
| Category: |
Documents |
| Upload: | nguyenhanh |
| View: | 273 times |
| Download: | 1 times |
Guide to Using FORAGE Grazing Land Systems - Science Delivery
June 2018 / Version 1.8
Department of Environment and Science
Prepared by
Grazing Land Systems Science Division Department of Environment and Science (DES)
GPO Box 2454
Brisbane QLD 4001
© The State of Queensland, 2018
The Queensland Government supports and encourages the dissemination and exchange of its information. The copyright in this publication is licensed under a Creative Commons Attribution 3.0 Australia (CC BY) licence.
Under this licence you are free, without having to seek our permission, to use this publication in accordance with the licence terms.
You must keep intact the copyright notice and attribute the State of Queensland as the source of the publication.
For more information on this licence, visit http://creativecommons.org/licenses/by/3.0/au/deed.en
Disclaimer
This document has been prepared with all due diligence and care, based on the best available information at the time of publication. The department holds no responsibility for any errors or omissions within this document. Any decisions made by other parties based on this document are solely the responsibility of those parties. Information contained in this document is from a number of sources and, as such, does not necessarily represent government or departmental policy.
If you need to access this document in a language other than English, please call the Translating and Interpreting Service (TIS National) on 131 450 and ask them to telephone Library Services on +61 7 3170 5725
This publication can be made available in an alternative format (e.g. large print or audiotape) on request for people with vision impairment; phone +61 7 3170 5470 or email <[email protected]>.
Attribution
Content from this document should be attributed as: The State of Queensland (DES), Guide to Using FORAGE Version 1.8, 2018.
Acknowledgements
The Department of Environment and Science (DES) acknowledges the funding support, guidance and collaboration provided by the Department of Environment and Science (and past associated departments), under the Reef Water Quality Science Program, in developing FORAGE reports for the Burdekin in Queensland. DES also acknowledges the funding assistance, guidance and collaboration from the Department of Natural Resources, Mines and Energy (and past associated departments) and valuable contribution from officers of the Department of Agriculture and Fisheries (and past associated departments).
June 2018

Guide to Using FORAGE Version 1.8
i
Contents Guide to Using FORAGE ................................................................................................................................... 1
1 Background ................................................................................................................................................ 1
2 How FORAGE works .................................................................................................................................. 1
3 Obtaining FORAGE products ..................................................................................................................... 2
4 FORAGE products...................................................................................................................................... 4
4.1 FORAGE Report: Rainfall and Pasture ............................................................................................. 4
4.2 FORAGE Report: Rainfall and Pasture by Land Type ...................................................................... 6
4.3 FORAGE Report: Ground Cover ....................................................................................................... 9
4.4 FORAGE Report: Ground Cover – Regional Comparison .............................................................. 12
4.5 FORAGE Report: Indicative Land Type .......................................................................................... 18
4.6 FORAGE Report: Foliage Projective Cover .................................................................................... 21
4.7 FORAGE Report: Rainfall and Pasture Growth Outlook ................................................................. 24
4.8 FORAGE Report: Regional Climate Projections ............................................................................. 27
4.9 FORAGE Report: Crop Frequency and Type .................................................................................. 30
4.10 Satellite imagery and derived products ........................................................................................... 32
5 Common access problems ....................................................................................................................... 34
5.1 Time ................................................................................................................................................. 34
5.2 Saving a report ................................................................................................................................ 34
5.3 No Report......................................................................................................................................... 34
6 Glossary ................................................................................................................................................... 35
7 References ............................................................................................................................................... 36

Department of Environment and Science
ii
List of figures
Figure 1. The FORAGE framework. ................................................................................................ 1
Figure 2. An example of Rainfall and Pasture report. ..................................................................... 5
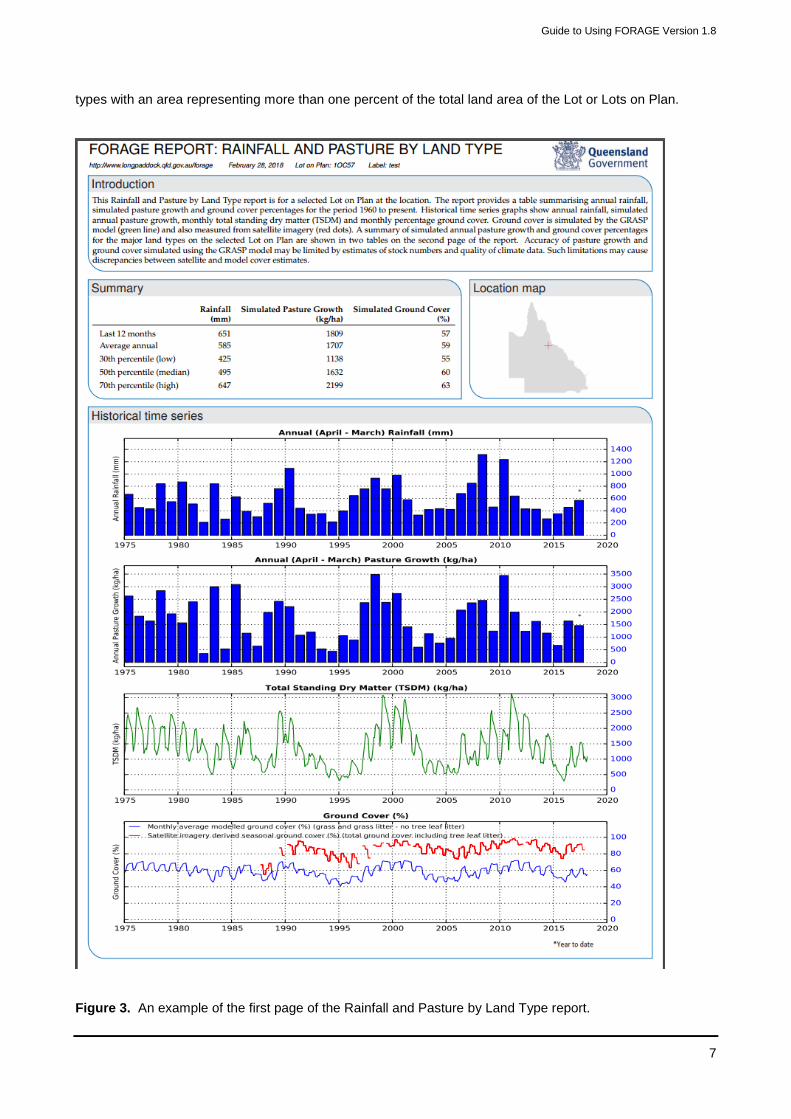
Figure 3. An example of the first page of the Rainfall and Pasture by Land Type report................. 7
Figure 4. An example of the second page of the Rainfall and Pasture by Land Type report. .......... 8
Figure 5. An example of the first page of the Ground Cover report. ............................................. 10
Figure 6. An example of the second page of the Ground Cover report. ........................................ 11
Figure 7. The ‘help guide’ provides example maps and graphs with details about how to interpret the information in each of them. .................................................................................... 14
Figure 8. An example of the Ground Cover – Regional Comparison report showing ground cover levels over time for each of the Lot on Plan dominant land types relative to the same land types in the local region. ........................................................................................ 15
Figure 9. An example of the Ground Cover – Regional Comparison report. Graphs show ground cover levels over time for all Lot on Plan dominant land types relative to the same land types in the local region. ............................................................................................... 16
Figure 10. An example of the Ground Cover – Regional Comparison report. Graphs show ground cover levels over time for an individual land type for a selected Lot on Plan relative to the same land type in the local region. ................................................................................ 17
Figure 11. An example of the front page of an Indicative Land Type report. ................................. 19
Figure 12. An example of the second page of an Indicative Land Type report. ............................ 20
Figure 13. An example of the front page of the Foliage Projective Cover report. .......................... 22
Figure 14. An example of the second page of the Foliage Projective Cover report. ...................... 23
Figure 15. An example of the rainfall and pasture growth pie diagrams, from a FORAGE: Rainfall and Pasture Growth Outlook report, showing likelihoods of rainfall and pasture growth. 24
Figure 16. An example of the front page of the Rainfall and Pasture Growth Outlook report. ....... 25
Figure 17. An example of the second page of the Rainfall and Pasture Growth Outlook report. ... 26
Figure 18. An example of the front page of the Regional Climate Projections report. ................... 28
Figure 19. An example of the second page of the Regional Climate Projections report. ............... 29
Figure 22. An example of a Foliage Projective Cover (FPC) image obtained from FORAGE. ...... 32
Figure 23. An example of a seasonal ground cover image obtained from FORAGE. ................... 32

Guide to Using FORAGE Version 1.8
1
Guide to Using FORAGE
1 Background FORAGE is an online, web and email based system which generates and distributes climate and pasture related information in customised reports for a requested location. FORAGE is also a delivery mechanism for satellite imagery developed by DES’s Remote Sensing Centre (https://www.qld.gov.au/environment/land/vegetation/mapping/remote-sensing/).
Information which has been incorporated in individual FORAGE reports includes, for example, property scale mapping, remotely sensed imagery of tree cover and ground cover, pasture growth model output, historical climate data, seasonal climate outlooks and longer-term climate projections. FORAGE allows rural landholders, graziers and extension officers to readily gain access to such information for a location of interest. The information is presented in easy to understand PDF reports which are emailed directly to a nominated email address. Information generated through FORAGE can be used to facilitate both land condition assessment and decision support for grazing and environmental land management practices (see Zhang and Carter, 2018 for a full description of the system).
2 How FORAGE works The FORAGE system (Figure 1) includes:
a user interface on the Long Paddock website
a background information-processing system on government servers
an email delivery system.
Individual FORAGE reports are requested from the Long Paddock website on forms which require specific information including the type of report requested, location of interest (e.g. Lot on Plan) and a return email address. Once a form is filled out and submitted on the website, a request is sent to the DES high performance computer which then accesses data to generate the report from relevant databases and models. The requested report is then generated and sent to the nominated email address. Various types of remote sensing imagery can also be requested in a similar manner on the Long Paddock website.
Unless otherwise stated, FORAGE reports are available for any location in Queensland (excluding urban areas). Some reports are, however, currently restricted to specific regions due to availability of data.
Figure 1. The FORAGE framework.

Department of Environment and Science
2
3 Obtaining FORAGE products FORAGE reports, satellite imagery and derived products can be accessed through the DES Long Paddock website: http://www.longpaddock.qld.gov.au/forage/
You can now select multiple reports at the same time, by using the drop down menu in ‘Select FORAGE reports’ (see illustration below).

Guide to Using FORAGE Version 1.8
3
There are several ways to locate and select the property of interest for requesting:
Provide the Lot(s) on Plan by typing in the Lot(s) on Plan in the space under “Enter lot(s) on plan” (e.g. 3MZ594 for Lot 2, Plan MZ594) and select from list. Select ‘add’ and continue to select if required; or
Use geolocation tool, the address bar to add the property name, road address, town or just zoom in on the map to find your Lot(s) on Plan and click to select (one or more).
Select information such as start year and end year if required (report specific), enter your email address, add a label (optional) and then click on the ‘submit’ button to submit the request.
A PDF report (or link to product requested) will be emailed to the email address provided.
Completing requests can range from 10 minutes to a few hours, depending on the complexity of the report and number of request running on the system.
Short awareness videos are available on how you might use FORAGE for grazing land management decision making https://www.longpaddock.qld.gov.au/forage/videos/.
A 2-page “Quick guide” is available at https://data.longpaddock.qld.gov.au/static/forage_2pager.pdf
FORAGE delivers visual satellite images, ground cover and Foliage Projective Cover (FPC) images but, unlike other FORAGE products, the satellite imagery is not sent by email, due to file size limitations. On completion of your satellite Imagery request you will receive a notification email. This email contains a link to a compressed ‘.zip’ file containing the images. Click the link in the email to download the zip file. You will need decompression software, such as WinZip, to open the compressed file.

Department of Environment and Science
4
4 FORAGE products
4.1 FORAGE Report: Rainfall and Pasture
The FORAGE Report: Rainfall and Pasture (Figure 2) provides broad scale information on both recent and
historical rainfall, pasture growth and pasture cover for a selected Lot on Plan or adjoining Lots on Plan in
Queensland.
The information presented in a Rainfall and Pasture report (Figure 2) includes:
a map showing the requested location and its surrounds
summary statistics of rainfall and simulated pasture growth
time series graphs showing annual rainfall and pasture growth, pasture biomass (total standing dry matter or TSDM) and ground cover.
Rainfall and pasture statistics shown on the front page of the report include the most recent twelve-month
totals for both rainfall and pasture growth and the most recent twelve-month average for pasture cover.
These recent statistics can be compared with historical statistics including the long-term mean, median, 30th
percentile and 70th percentile values. The percentile rank indicates where a value lies in the range of
historically measured or simulated records. For example, if last year’s rainfall was ranked in the 20th
percentile, then last year’s rainfall was higher than the lowest 20% of annual rainfall values on record but
lower than the remaining 80% of values.
Four time series graphs (from 1970 to current) indicate:
1. monthly pasture biomass expressed as total standing dry matter (TSDM kg/ha)
2. modelled monthly average ground cover
3. annual rainfall (April to March)
4. simulated annual pasture growth (April to March).
Rainfall is estimated for the specified location, based on regional Bureau of Meteorology (BoM) rainfall
records obtained from DES’s SILO database (https://silo.longpaddock.qld.gov.au/). Since regional rainfall
stations may not be located on or near the selected property, rainfall values are best considered
approximations only.
Pasture growth statistics and time series are also estimates for the specified location. Pasture growth is
calculated using DES’s GRASP (Grass Production) model from daily inputs of interpolated rainfall, solar
radiation, minimum and maximum temperature, vapour pressure and potential evapotranspiration. Other
inputs to the GRASP model which influence pasture growth and/or cover include, for example, the water
holding capacity of the soil, potential pasture production, livestock numbers and tree density. These inputs
are determined at a broad scale and are likely not to be accurate at a property scale.
While the specific values for rainfall and pasture variables (growth, biomass and cover) may not be accurate
at a property scale, the statistics and time series provide a useful indication of the range in annual district
rainfall and pasture growth over time and provide an historical context for assessing current pasture
conditions.

Guide to Using FORAGE Version 1.8
5
Figure 2. An example of Rainfall and Pasture report.
Department of Environment and Science
6
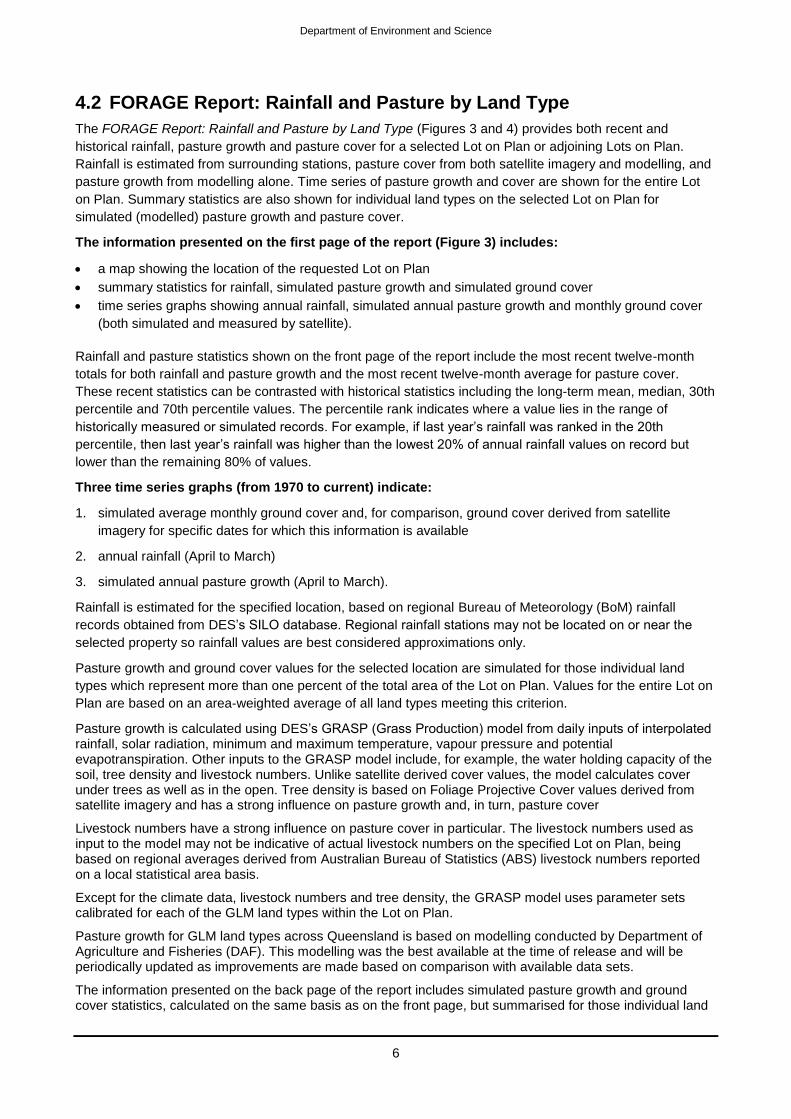
4.2 FORAGE Report: Rainfall and Pasture by Land Type
The FORAGE Report: Rainfall and Pasture by Land Type (Figures 3 and 4) provides both recent and
historical rainfall, pasture growth and pasture cover for a selected Lot on Plan or adjoining Lots on Plan.
Rainfall is estimated from surrounding stations, pasture cover from both satellite imagery and modelling, and
pasture growth from modelling alone. Time series of pasture growth and cover are shown for the entire Lot
on Plan. Summary statistics are also shown for individual land types on the selected Lot on Plan for
simulated (modelled) pasture growth and pasture cover.
The information presented on the first page of the report (Figure 3) includes:
a map showing the location of the requested Lot on Plan
summary statistics for rainfall, simulated pasture growth and simulated ground cover
time series graphs showing annual rainfall, simulated annual pasture growth and monthly ground cover
(both simulated and measured by satellite).
Rainfall and pasture statistics shown on the front page of the report include the most recent twelve-month
totals for both rainfall and pasture growth and the most recent twelve-month average for pasture cover.
These recent statistics can be contrasted with historical statistics including the long-term mean, median, 30th
percentile and 70th percentile values. The percentile rank indicates where a value lies in the range of
historically measured or simulated records. For example, if last year’s rainfall was ranked in the 20th
percentile, then last year’s rainfall was higher than the lowest 20% of annual rainfall values on record but
lower than the remaining 80% of values.
Three time series graphs (from 1970 to current) indicate:
1. simulated average monthly ground cover and, for comparison, ground cover derived from satellite
imagery for specific dates for which this information is available
2. annual rainfall (April to March)
3. simulated annual pasture growth (April to March).
Rainfall is estimated for the specified location, based on regional Bureau of Meteorology (BoM) rainfall
records obtained from DES’s SILO database. Regional rainfall stations may not be located on or near the
selected property so rainfall values are best considered approximations only.
Pasture growth and ground cover values for the selected location are simulated for those individual land
types which represent more than one percent of the total area of the Lot on Plan. Values for the entire Lot on
Plan are based on an area-weighted average of all land types meeting this criterion.
Pasture growth is calculated using DES’s GRASP (Grass Production) model from daily inputs of interpolated rainfall, solar radiation, minimum and maximum temperature, vapour pressure and potential evapotranspiration. Other inputs to the GRASP model include, for example, the water holding capacity of the soil, tree density and livestock numbers. Unlike satellite derived cover values, the model calculates cover under trees as well as in the open. Tree density is based on Foliage Projective Cover values derived from satellite imagery and has a strong influence on pasture growth and, in turn, pasture cover
Livestock numbers have a strong influence on pasture cover in particular. The livestock numbers used as input to the model may not be indicative of actual livestock numbers on the specified Lot on Plan, being based on regional averages derived from Australian Bureau of Statistics (ABS) livestock numbers reported on a local statistical area basis.
Except for the climate data, livestock numbers and tree density, the GRASP model uses parameter sets calibrated for each of the GLM land types within the Lot on Plan.
Pasture growth for GLM land types across Queensland is based on modelling conducted by Department of Agriculture and Fisheries (DAF). This modelling was the best available at the time of release and will be periodically updated as improvements are made based on comparison with available data sets.
The information presented on the back page of the report includes simulated pasture growth and ground cover statistics, calculated on the same basis as on the front page, but summarised for those individual land
Guide to Using FORAGE Version 1.8
7
types with an area representing more than one percent of the total land area of the Lot or Lots on Plan.
Figure 3. An example of the first page of the Rainfall and Pasture by Land Type report.

Department of Environment and Science
8
Figure 4. An example of the second page of the Rainfall and Pasture by Land Type report.
Guide to Using FORAGE Version 1.8
9
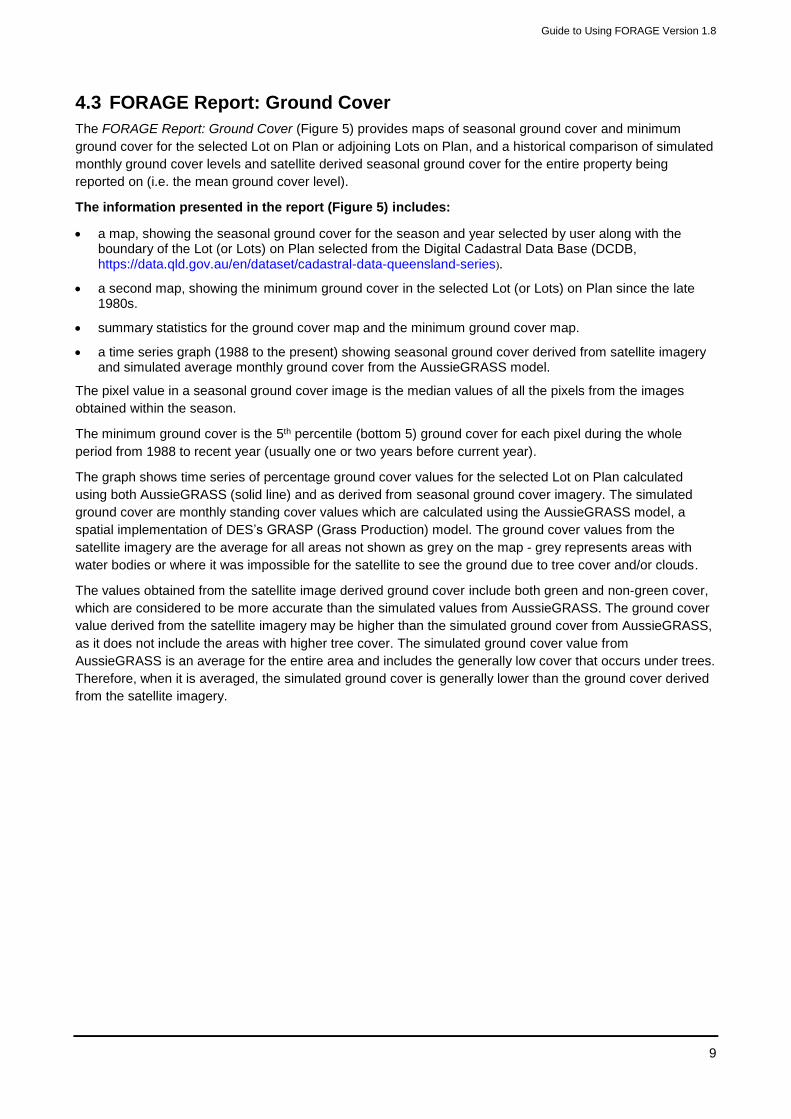
4.3 FORAGE Report: Ground Cover
The FORAGE Report: Ground Cover (Figure 5) provides maps of seasonal ground cover and minimum
ground cover for the selected Lot on Plan or adjoining Lots on Plan, and a historical comparison of simulated
monthly ground cover levels and satellite derived seasonal ground cover for the entire property being
reported on (i.e. the mean ground cover level).
The information presented in the report (Figure 5) includes:
a map, showing the seasonal ground cover for the season and year selected by user along with the boundary of the Lot (or Lots) on Plan selected from the Digital Cadastral Data Base (DCDB, https://data.qld.gov.au/en/dataset/cadastral-data-queensland-series).
a second map, showing the minimum ground cover in the selected Lot (or Lots) on Plan since the late 1980s.
summary statistics for the ground cover map and the minimum ground cover map.
a time series graph (1988 to the present) showing seasonal ground cover derived from satellite imagery and simulated average monthly ground cover from the AussieGRASS model.
The pixel value in a seasonal ground cover image is the median values of all the pixels from the images
obtained within the season.
The minimum ground cover is the 5th percentile (bottom 5) ground cover for each pixel during the whole
period from 1988 to recent year (usually one or two years before current year).
The graph shows time series of percentage ground cover values for the selected Lot on Plan calculated
using both AussieGRASS (solid line) and as derived from seasonal ground cover imagery. The simulated
ground cover are monthly standing cover values which are calculated using the AussieGRASS model, a
spatial implementation of DES’s GRASP (Grass Production) model. The ground cover values from the
satellite imagery are the average for all areas not shown as grey on the map - grey represents areas with
water bodies or where it was impossible for the satellite to see the ground due to tree cover and/or clouds.
The values obtained from the satellite image derived ground cover include both green and non-green cover,
which are considered to be more accurate than the simulated values from AussieGRASS. The ground cover
value derived from the satellite imagery may be higher than the simulated ground cover from AussieGRASS,
as it does not include the areas with higher tree cover. The simulated ground cover value from
AussieGRASS is an average for the entire area and includes the generally low cover that occurs under trees.
Therefore, when it is averaged, the simulated ground cover is generally lower than the ground cover derived
from the satellite imagery.

Department of Environment and Science
10
Figure 5. An example of the first page of the Ground Cover report.

Guide to Using FORAGE Version 1.8
11
Figure 6. An example of the second page of the Ground Cover report.
Department of Environment and Science
12
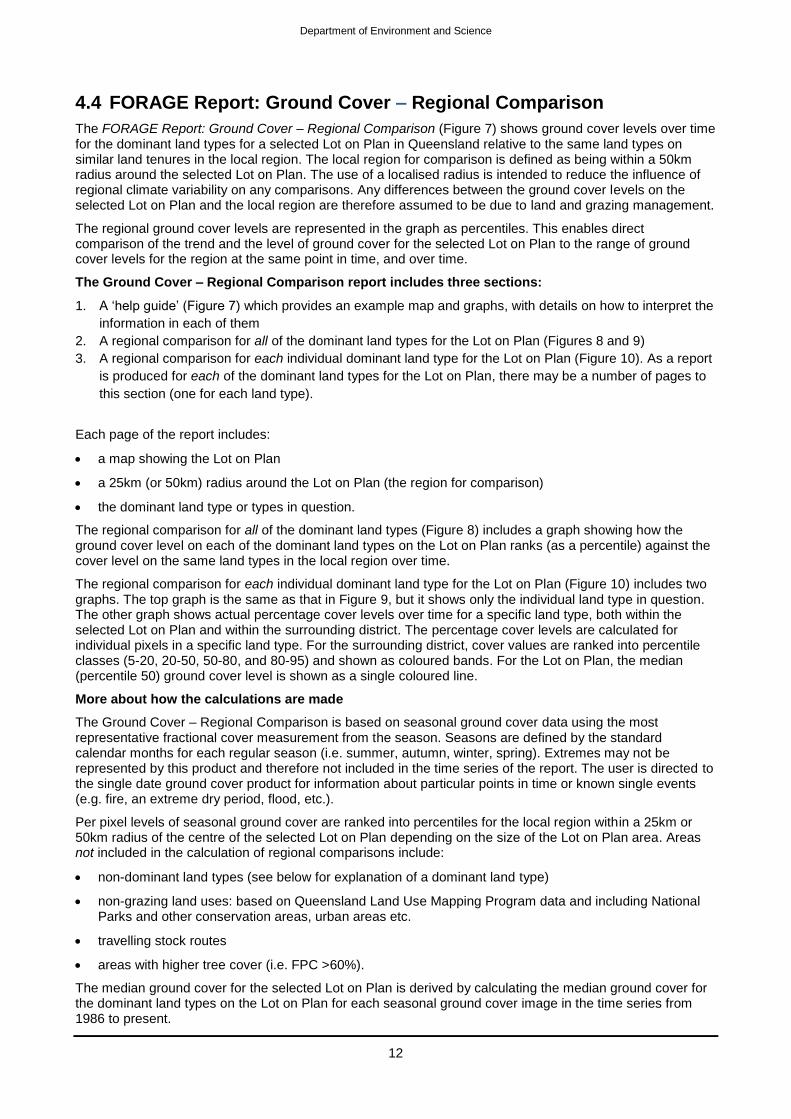
4.4 FORAGE Report: Ground Cover – Regional Comparison
The FORAGE Report: Ground Cover – Regional Comparison (Figure 7) shows ground cover levels over time for the dominant land types for a selected Lot on Plan in Queensland relative to the same land types on similar land tenures in the local region. The local region for comparison is defined as being within a 50km radius around the selected Lot on Plan. The use of a localised radius is intended to reduce the influence of regional climate variability on any comparisons. Any differences between the ground cover levels on the selected Lot on Plan and the local region are therefore assumed to be due to land and grazing management.
The regional ground cover levels are represented in the graph as percentiles. This enables direct comparison of the trend and the level of ground cover for the selected Lot on Plan to the range of ground cover levels for the region at the same point in time, and over time.
The Ground Cover – Regional Comparison report includes three sections:
1. A ‘help guide’ (Figure 7) which provides an example map and graphs, with details on how to interpret the
information in each of them
2. A regional comparison for all of the dominant land types for the Lot on Plan (Figures 8 and 9)
3. A regional comparison for each individual dominant land type for the Lot on Plan (Figure 10). As a report
is produced for each of the dominant land types for the Lot on Plan, there may be a number of pages to
this section (one for each land type).
Each page of the report includes:
a map showing the Lot on Plan
a 25km (or 50km) radius around the Lot on Plan (the region for comparison)
the dominant land type or types in question.
The regional comparison for all of the dominant land types (Figure 8) includes a graph showing how the ground cover level on each of the dominant land types on the Lot on Plan ranks (as a percentile) against the cover level on the same land types in the local region over time.
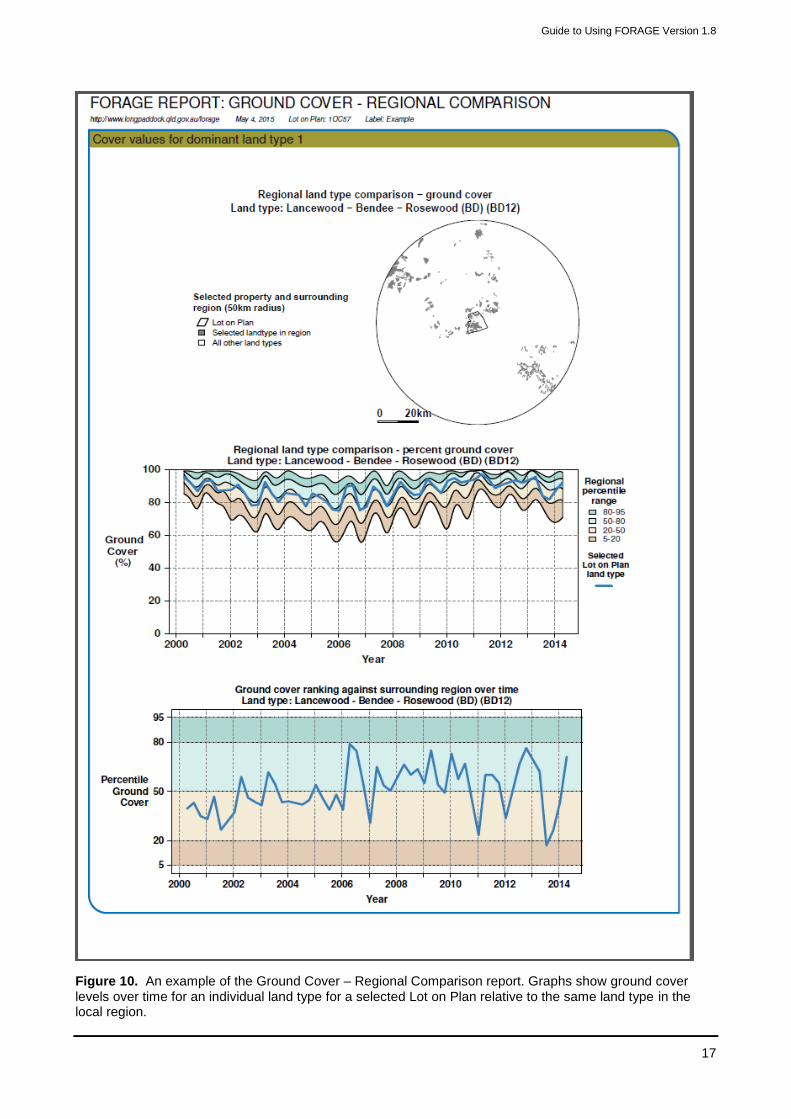
The regional comparison for each individual dominant land type for the Lot on Plan (Figure 10) includes two graphs. The top graph is the same as that in Figure 9, but it shows only the individual land type in question. The other graph shows actual percentage cover levels over time for a specific land type, both within the selected Lot on Plan and within the surrounding district. The percentage cover levels are calculated for individual pixels in a specific land type. For the surrounding district, cover values are ranked into percentile classes (5-20, 20-50, 50-80, and 80-95) and shown as coloured bands. For the Lot on Plan, the median (percentile 50) ground cover level is shown as a single coloured line.
More about how the calculations are made
The Ground Cover – Regional Comparison is based on seasonal ground cover data using the most representative fractional cover measurement from the season. Seasons are defined by the standard calendar months for each regular season (i.e. summer, autumn, winter, spring). Extremes may not be represented by this product and therefore not included in the time series of the report. The user is directed to the single date ground cover product for information about particular points in time or known single events (e.g. fire, an extreme dry period, flood, etc.).
Per pixel levels of seasonal ground cover are ranked into percentiles for the local region within a 25km or 50km radius of the centre of the selected Lot on Plan depending on the size of the Lot on Plan area. Areas not included in the calculation of regional comparisons include:
non-dominant land types (see below for explanation of a dominant land type)
non-grazing land uses: based on Queensland Land Use Mapping Program data and including National Parks and other conservation areas, urban areas etc.
travelling stock routes
areas with higher tree cover (i.e. FPC >60%).
The median ground cover for the selected Lot on Plan is derived by calculating the median ground cover for the dominant land types on the Lot on Plan for each seasonal ground cover image in the time series from 1986 to present.
Guide to Using FORAGE Version 1.8
13
Land type data are based on the Grazing Land Management (GLM) land types. Dominant land types for the selected Lot on Plan are determined by selecting the least number of land types which constitute at least 80% of the area of the selected Lot on Plan.
How to use the report
The FORAGE Report: Ground Cover – Regional Comparison is intended for comparative purposes. It allows the user to compare the current and past levels of cover on their selected Lot on Plan with the current and past levels of ground cover for their local region. This can help indicate, for the particular land types on the Lot on Plan, what the lower and higher levels of ground cover were in the local region at any point in the time series. The user may then compare the ground cover levels for the land types on their selected Lot on Plan with those of the local region.
This can be used to identify, for example:
potential levels of ground cover possible for particular land types during each season and climate period. These may be useful as benchmarks for the region
impacts of different management practices (e.g. stocking rates, use of fire) on the ground cover levels on different land types
particular land types which may be more resilient in dry times or which may be more susceptible to lower levels of cover or greater variability. This can help with adjusting stocking rates for example
areas in the local region with higher fuel loads and therefore more likely to represent a fire hazard.
The Ground Cover – Regional Comparison is intended for comparative purposes only. It is important to consider actual ground cover levels as well as the percentile rank. For instance, ground cover levels could be high across the region but cover for the Lot on Plan could be in a lower percentile range, showing that the cover levels for the Lot on Plan are generally high, but are lower in comparison to the region.
It is important to note that this report is based on ground cover data derived from satellite imagery. The satellite imagery can separate ground cover into the green and non-green fractions (and bare ground). For this report, the green and non-green fractions are summed to obtain total cover, therefore the ground cover levels reported may include high litter or non-green fractions which are useful for protection of the soil against erosion, but may not offer useful nutrition content to livestock. Likewise, the green fraction may have a high proportion of undesirable pasture species or weeds. The satellite imagery does not distinguish between pasture composition, biomass or feed on offer.
It is also important to note that the GLM land type data included in the report has limitations due to the scale and accuracy of the base data used to derive the land types.

Department of Environment and Science
14
Figure 7. The ‘help guide’ provides example maps and graphs with details about how to interpret the
information in each of them.

Guide to Using FORAGE Version 1.8
15
Figure 8. An example of the Ground Cover – Regional Comparison report showing ground cover levels over time for each of the Lot on Plan dominant land types relative to the same land types in the local region.

Department of Environment and Science
16
Figure 9. An example of the Ground Cover – Regional Comparison report. Graphs show ground cover
levels over time for all Lot on Plan dominant land types relative to the same land types in the local region.
Guide to Using FORAGE Version 1.8
17
Figure 10. An example of the Ground Cover – Regional Comparison report. Graphs show ground cover levels over time for an individual land type for a selected Lot on Plan relative to the same land type in the local region.
Department of Environment and Science
18
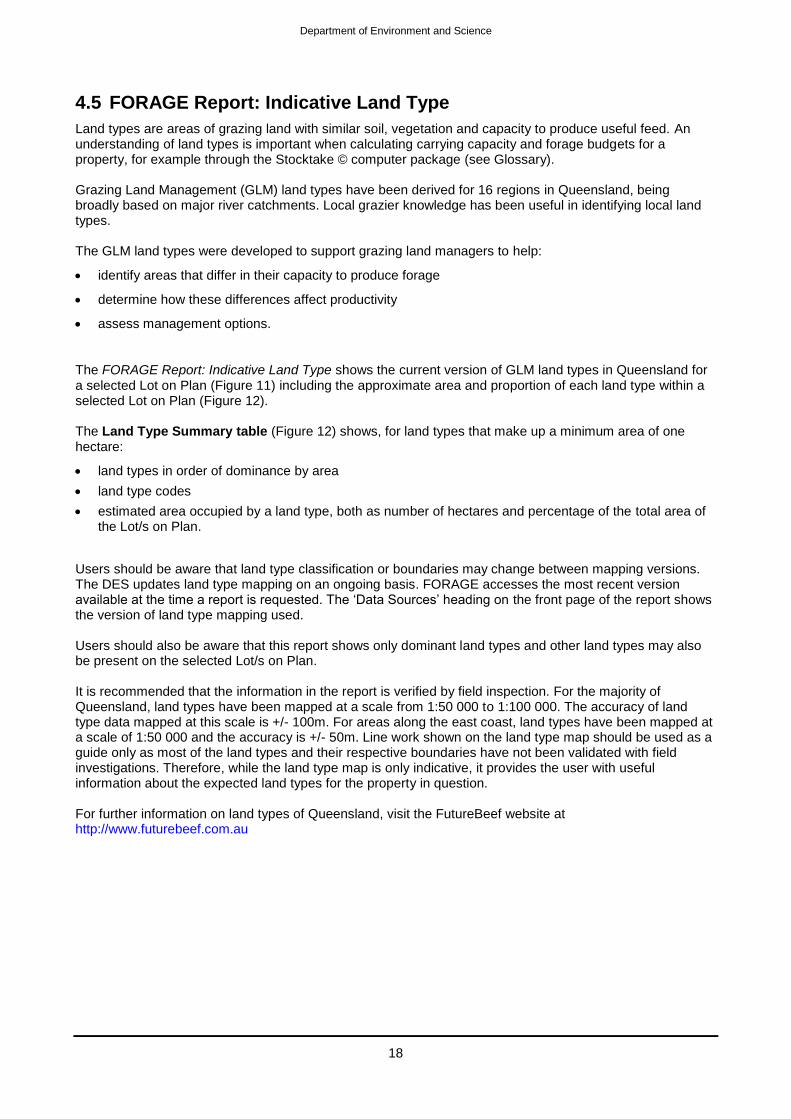
4.5 FORAGE Report: Indicative Land Type
Land types are areas of grazing land with similar soil, vegetation and capacity to produce useful feed. An understanding of land types is important when calculating carrying capacity and forage budgets for a property, for example through the Stocktake © computer package (see Glossary). Grazing Land Management (GLM) land types have been derived for 16 regions in Queensland, being broadly based on major river catchments. Local grazier knowledge has been useful in identifying local land types. The GLM land types were developed to support grazing land managers to help:
identify areas that differ in their capacity to produce forage
determine how these differences affect productivity
assess management options.
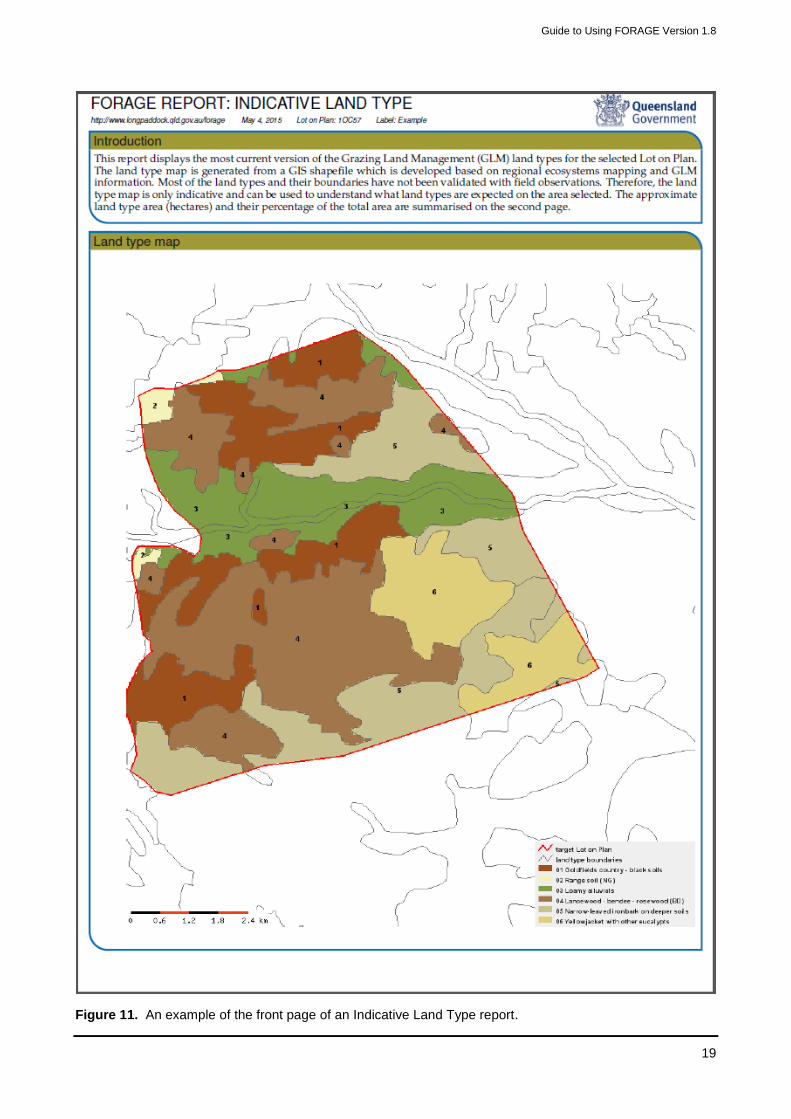
The FORAGE Report: Indicative Land Type shows the current version of GLM land types in Queensland for a selected Lot on Plan (Figure 11) including the approximate area and proportion of each land type within a selected Lot on Plan (Figure 12). The Land Type Summary table (Figure 12) shows, for land types that make up a minimum area of one hectare:
land types in order of dominance by area
land type codes
estimated area occupied by a land type, both as number of hectares and percentage of the total area of the Lot/s on Plan.
Users should be aware that land type classification or boundaries may change between mapping versions. The DES updates land type mapping on an ongoing basis. FORAGE accesses the most recent version available at the time a report is requested. The ‘Data Sources’ heading on the front page of the report shows the version of land type mapping used. Users should also be aware that this report shows only dominant land types and other land types may also be present on the selected Lot/s on Plan. It is recommended that the information in the report is verified by field inspection. For the majority of Queensland, land types have been mapped at a scale from 1:50 000 to 1:100 000. The accuracy of land type data mapped at this scale is +/- 100m. For areas along the east coast, land types have been mapped at a scale of 1:50 000 and the accuracy is +/- 50m. Line work shown on the land type map should be used as a guide only as most of the land types and their respective boundaries have not been validated with field investigations. Therefore, while the land type map is only indicative, it provides the user with useful information about the expected land types for the property in question. For further information on land types of Queensland, visit the FutureBeef website at http://www.futurebeef.com.au
Guide to Using FORAGE Version 1.8
19
Figure 11. An example of the front page of an Indicative Land Type report.
Department of Environment and Science
20
Figure 12. An example of the second page of an Indicative Land Type report.
Guide to Using FORAGE Version 1.8
21
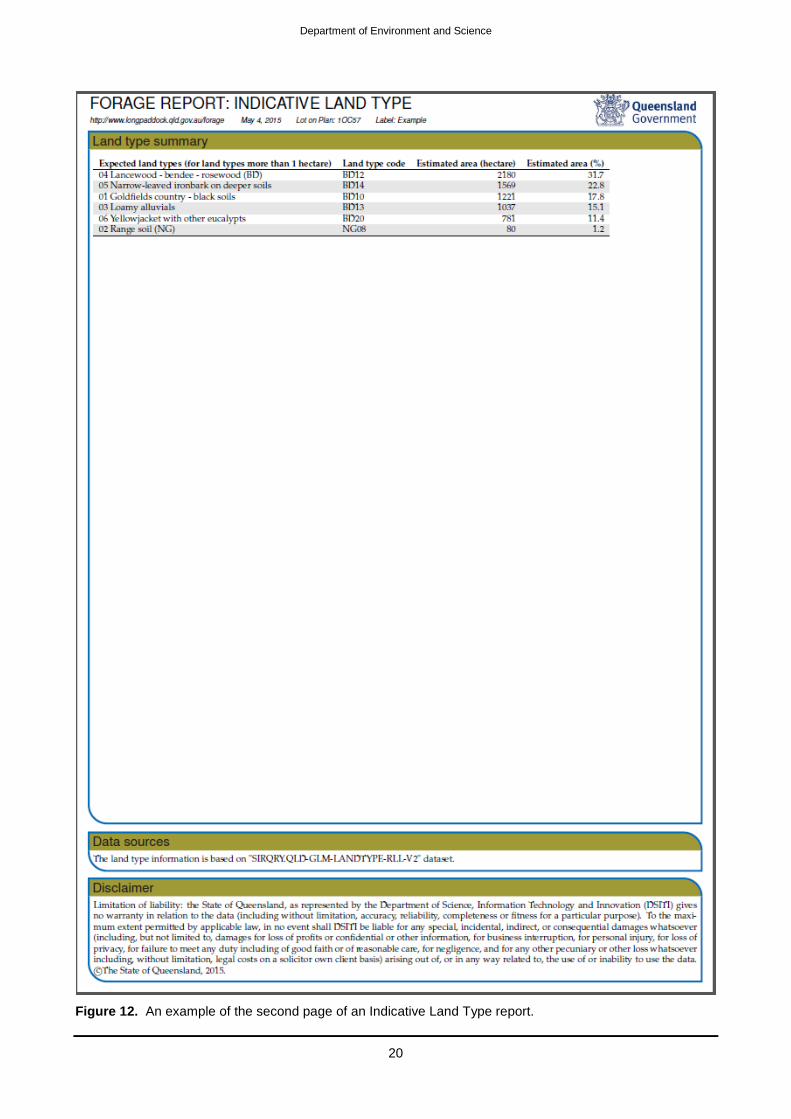
4.6 FORAGE Report: Foliage Projective Cover
Woody vegetation can have a major impact on grass production. Basal area (m2/ha), either of trees alone or
both trees and shrubs, is the most commonly used and convenient measure of woody vegetation density.
Tree Basal Area (TBA), for example, is simply the cross-sectional area of all the trees at breast height per
hectare. However, a better indication of the influence of woody vegetation on grass productivity can be
gained by measuring Foliage Projective Cover (FPC), which is defined as the vertically projected percentage
cover of photosynthetic foliage from trees and shrubs greater than two metres in height (see Glossary). This
is because FPC is more closely related to light interception and tree water use than basal area.
The FORAGE Report: Foliage Projective Cover (Figures 13 and 14) report shows tree and shrub FPC
classes obtained from the most recent satellite imagery available for a selected Lot on Plan or adjoining Lots
on Plan in Queensland. As a guide for most users more familiar with TBA as a measure of tree density, the
FPC thresholds used in the report (15, 30 and 70 per cent) equate to a TBA of approximately six, twelve and
thirty-two square metres per hectare for mature tree communities (Armston, et al. 2009).
An FPC report includes:
a map showing FPC calculated from satellite imagery overlain on:
– the selected Lot on Plan boundaries
– Grazing Land Management (GLM) land types
a summary of FPC statistics for each GLM land type within the Lot on Plan.
For further information about GLM land types go to: http://www.futurebeef.com.au
FPC levels are modelled from satellite imagery. The purpose of modelling is to minimise the influence of
grass cover on FPC estimates and ‘smooth’ short term fluctuations in FPC due, for example, to wet or dry
conditions (Kitchen, et al. 2010). However, it is not possible to smooth all short term fluctuations.
The FPC information presented in this report is for general use only. It is recommended that the information
provided in this report be supported by further field investigation for accuracy.

Department of Environment and Science
22
Figure 13. An example of the front page of the Foliage Projective Cover report.

Guide to Using FORAGE Version 1.8
23
Figure 14. An example of the second page of the Foliage Projective Cover report.
Department of Environment and Science
24
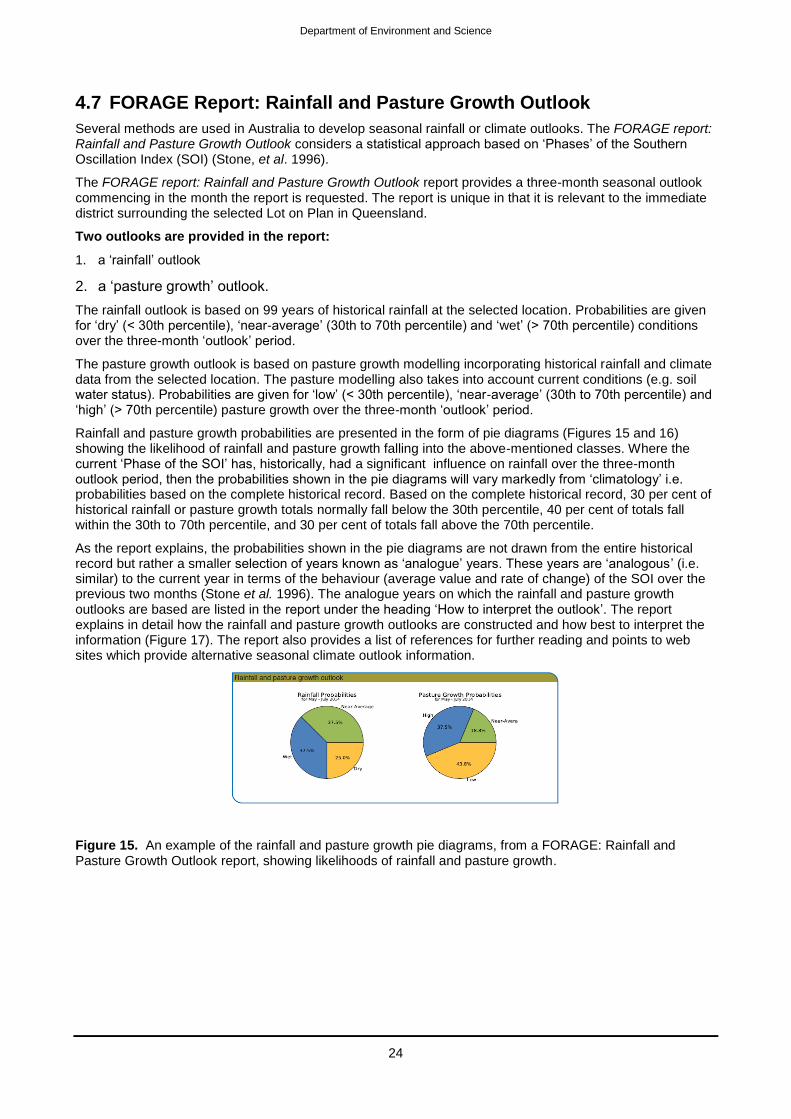
4.7 FORAGE Report: Rainfall and Pasture Growth Outlook
Several methods are used in Australia to develop seasonal rainfall or climate outlooks. The FORAGE report: Rainfall and Pasture Growth Outlook considers a statistical approach based on ‘Phases’ of the Southern Oscillation Index (SOI) (Stone, et al. 1996).
The FORAGE report: Rainfall and Pasture Growth Outlook report provides a three-month seasonal outlook commencing in the month the report is requested. The report is unique in that it is relevant to the immediate district surrounding the selected Lot on Plan in Queensland.
Two outlooks are provided in the report:
1. a ‘rainfall’ outlook
2. a ‘pasture growth’ outlook.
The rainfall outlook is based on 99 years of historical rainfall at the selected location. Probabilities are given for ‘dry’ (< 30th percentile), ‘near-average’ (30th to 70th percentile) and ‘wet’ (> 70th percentile) conditions over the three-month ‘outlook’ period.
The pasture growth outlook is based on pasture growth modelling incorporating historical rainfall and climate data from the selected location. The pasture modelling also takes into account current conditions (e.g. soil water status). Probabilities are given for ‘low’ (< 30th percentile), ‘near-average’ (30th to 70th percentile) and ‘high’ (> 70th percentile) pasture growth over the three-month ‘outlook’ period.
Rainfall and pasture growth probabilities are presented in the form of pie diagrams (Figures 15 and 16) showing the likelihood of rainfall and pasture growth falling into the above-mentioned classes. Where the current ‘Phase of the SOI’ has, historically, had a significant influence on rainfall over the three-month outlook period, then the probabilities shown in the pie diagrams will vary markedly from ‘climatology’ i.e. probabilities based on the complete historical record. Based on the complete historical record, 30 per cent of historical rainfall or pasture growth totals normally fall below the 30th percentile, 40 per cent of totals fall within the 30th to 70th percentile, and 30 per cent of totals fall above the 70th percentile.
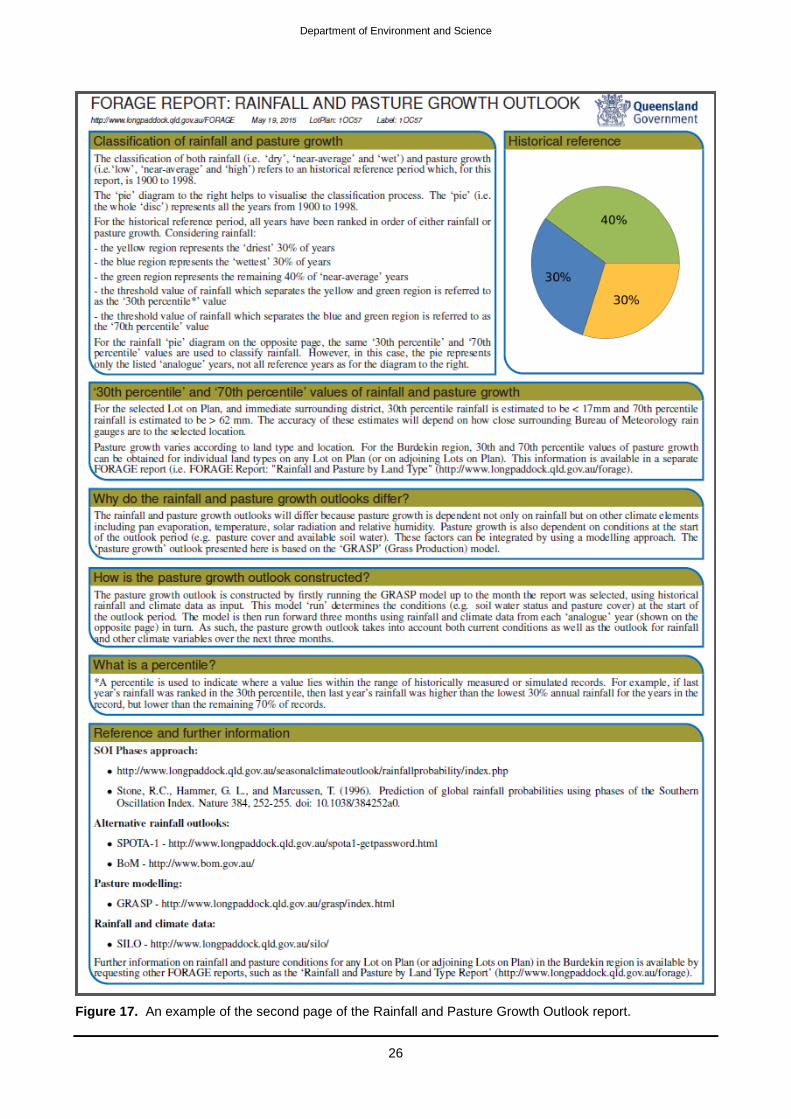
As the report explains, the probabilities shown in the pie diagrams are not drawn from the entire historical record but rather a smaller selection of years known as ‘analogue’ years. These years are ‘analogous’ (i.e. similar) to the current year in terms of the behaviour (average value and rate of change) of the SOI over the previous two months (Stone et al. 1996). The analogue years on which the rainfall and pasture growth outlooks are based are listed in the report under the heading ‘How to interpret the outlook’. The report explains in detail how the rainfall and pasture growth outlooks are constructed and how best to interpret the information (Figure 17). The report also provides a list of references for further reading and points to web sites which provide alternative seasonal climate outlook information.
Figure 15. An example of the rainfall and pasture growth pie diagrams, from a FORAGE: Rainfall and Pasture Growth Outlook report, showing likelihoods of rainfall and pasture growth.

Guide to Using FORAGE Version 1.8
25
Figure 16. An example of the front page of the Rainfall and Pasture Growth Outlook report.
Department of Environment and Science
26
Figure 17. An example of the second page of the Rainfall and Pasture Growth Outlook report.

Guide to Using FORAGE Version 1.8
27
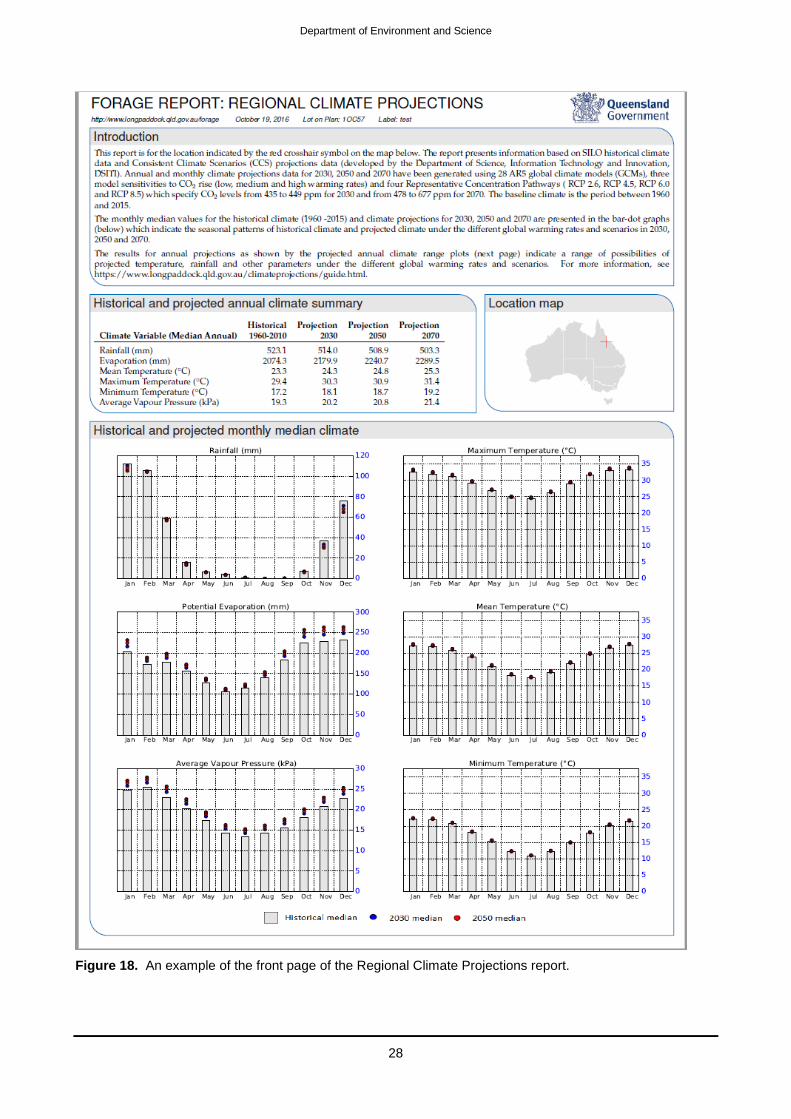
4.8 FORAGE Report: Regional Climate Projections
The FORAGE Report: Regional Climate Projections can be generated for the immediate district surrounding a selected Lot/s on Plan in Queensland. The report provides historical and projected climate information for 2030, 2050 and 2070 using the SILO climate dataset and Consistent Climate Scenarios (CCS) projections data developed by DES. The climate information presented in the Regional Climate Projections report includes rainfall, evaporation, temperature (mean, minimum, maximum) and vapour pressure (a measure of humidity).
The projected climate information is based on an aggregate of information from 28 Intergovernmental Panel on Climate Change (IPCC) Fifth Assessment Report (AR5) Global Climate Models (GCMs) deemed to be most reliable for the Australian region (Suppiah et al. 2007; Smith and Chiew, 2009). For each GCM, three model warming sensitivities to CO2 rise (high, medium and low) have been used. Furthermore, the FORAGE Regional Climate Projections incorporate four Representative Concentration Pathways (RCP 2.6, RCP 4.5, RCP 6.0 and RCP 8.5) that have been recommended in the CCS Project. The GCMs, model warming sensitivities to CO2 rise, Representative Concentration Pathways and the methodology DES has used to produce the projected climate information are all outlined in the CCS User Guide on the Long Paddock website.
The front page of the Regional Climate Projections report (Figure 18) includes:
an introduction summarising the projection years, GCMs, model warming sensitivities to CO2 rise, Representative Concentration Pathways and baseline climate period
a tabular summary of the historical and projected annual climate
a map showing the location of the selected Lot on Plan
bar-dot graphs showing the historical and projected monthly median climate.
The second page of the Regional Climate Projections report (Figure 19) includes:
information on how to interpret the annual climate summary plot
box and whisker plots of historical and projected annual climate range.
The tabular summary on the front page of the report (Figure 18) shows historical (1960-2015) median annual values for rainfall, evaporation, temperature and vapour pressure and projected values for those climate variables for 2030, 2050 and 2070.
The series of bar-dot graphs on the same page show historic median monthly values and future climate projections. This information provides the user with a visual indication of the seasonal patterns of both historical climate and projected climate under the different global warming rates and Representative Concentration Pathways in 2030, 2050 and 2070. The bars in each graph represent the historical median monthly value for the listed climate variable (e.g. rainfall) and the coloured dots in each graph represent the projected monthly median values of the that climate variable in 2030 (blue dot), 2050 (red dot) and 2070 (brown dot).
The series of box and whisker plots on the second page of the report show the annual historical (1960-2015) range and the projected range of possibilities for selected climate variables in 2030, 2050 and 2070 (Figure 19). The plots for historical and projected climate include annual values for rainfall, evaporation, vapour pressure, maximum temperature, mean temperature and minimum temperature. In each plot, the top horizontal bar represents the highest historical value and highest projection and the bottom horizontal bar represents the lowest historical value and lowest projection. The box represents the data range between the 10th and 90th percentiles. The red line in each box represents the median value of the data range which, for the projections data, could be interpreted as the best estimate for 2030, 2050 and 2070.
Further information on DES’s Consistent Climate Scenarios project is available on the Long Paddock website (http://www.longpaddock.qld.gov.au/climateprojections/).
Department of Environment and Science
28
Figure 18. An example of the front page of the Regional Climate Projections report.

Guide to Using FORAGE Version 1.8
29
Figure 19. An example of the second page of the Regional Climate Projections report.
Department of Environment and Science
30
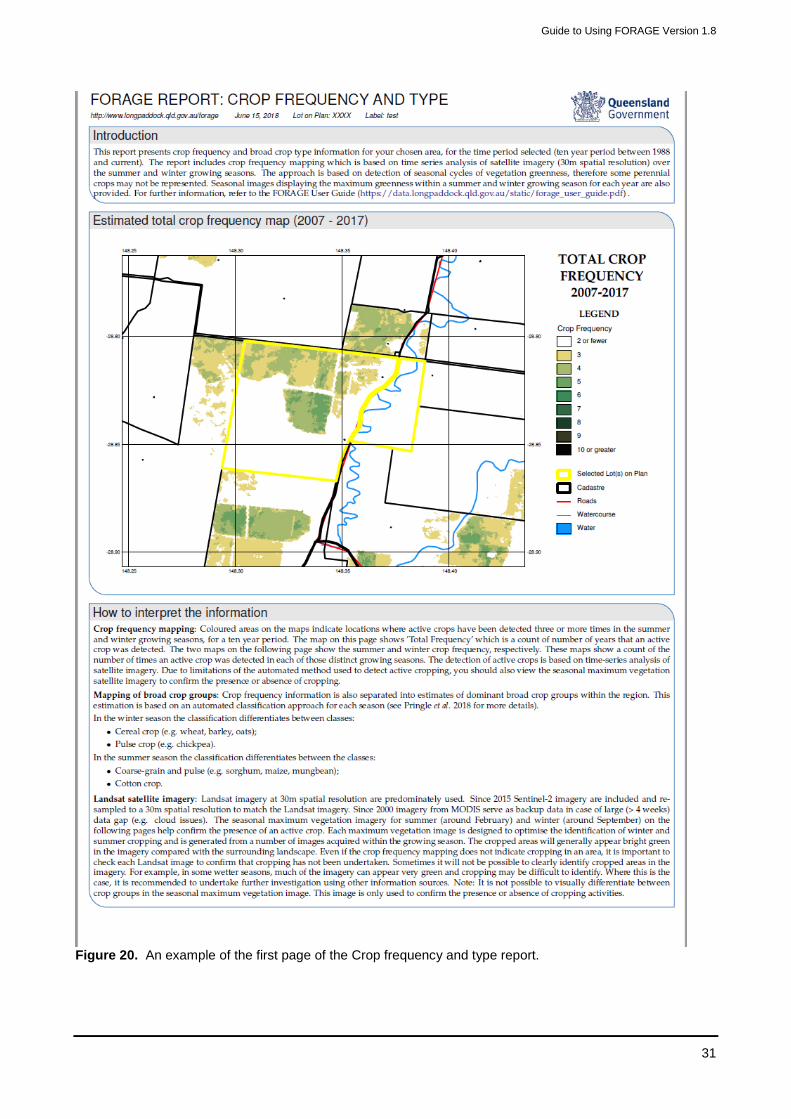
4.9 FORAGE Report: Crop Frequency and Type
The FORAGE crop frequency and type report provides a range of maps showing the presence, frequency and also some crop types. The estimated total crop frequency map shows locations where active crops have been detected three or more times in the summer and winter growing seasons (coloured areas on the map), for a ten year period. The ‘total frequency’ is a count of number of years in which an active crop was detected.
Two additional maps show the summer and winter crop frequency. This is a count of the number of times an active crop was detected in each of those growing seasons. The detection of active crops is based on a within season time-series analysis of satellite imagery. Due to potential limitations of the automated method used to detect active cropping, you should also view the seasonal maximum green vegetation satellite imagery to confirm the presence or absence of cropping.
Crop frequency information is also separated into estimates of dominant, broad crop groups within the region. This estimation is based on an automated classification approach for each season (Pringle et al., 2018).
In the winter season the classification differentiates between classes:
Cereal crop (e.g. wheat, barley, oats);
Pulse crop (e.g. chickpea).
In the summer season the classification differentiates between the classes:
Coarse-grain & Pulse (e.g. sorghum, maize, mungbean);
Cotton crop.
This crop mapping is a further development of the superseded version 1 (Schmidt el al., 2016).
Guide to Using FORAGE Version 1.8
31
Figure 20. An example of the first page of the Crop frequency and type report.

Department of Environment and Science
32
4.10 Satellite imagery and derived products
FORAGE offers automated web-based delivery of Landsat 5 TM and Landsat 7 ETM+ satellite imagery derived products through DES’s Remote Sensing Centre. The Remote Sensing Centre provides an extensive archive of Landsat satellite imagery dating back to 1986, with at least annual dry season coverage for all of Queensland. The imagery products are commonly referred to as SLATS satellite imagery and are used extensively in land management activities.
FORAGE provides four satellite based image products:
1. Multispectral Landsat 5 Thematic Mapper (TM) and/or Landsat 7 Enhanced Thematic Mapper (ETM+), Landsat 8 Operational Land Imager (OLI) imagery for specified dates (Visual Image, a true colour composite) (Figure 20).
2. Foliage Projective Cover (FPC) (Figure 21). 3. Seasonal ground cover (Figure 22). 4. Summary ground cover statistics including 5th, 50th and 95th percentile derived from the entire collections
of the ground cover images from 1988 to a year approximately before current year.
Further information on the Remote Sensing Centre and remote sensing products is available on: http://www.qld.gov.au/environment/land/vegetation/mapping/remote-sensing/. The products are based on radiometric and geometrically calibrated sequences of Landsat TM ETM+ and OLI imagery. The primary FPC and ground cover images are produced from regression against a large number of field observations across Queensland and are regularly recalibrated as more field data are collected. FORAGE uses the most recent calibration of the ground cover images to generate the ground cover report.
The visual image (Figure 21) provides a landscape background of the selected property. The FPC image (Figure 22) indicates woody density. Generally if the FPC value is greater than 20%, the area has a high tree density.
Please note that the FPC value on the image is not an exact FPC. It is a value of 100 plus the actual FPC. For example, if the FPC value on a pixel is 145, the actual FPC is 45%. Similarly the value presented in the seasonal ground cover and the summary ground cover statistics images is the ground cover plus 100. For example, if the pixel value is 155, the real ground cover is 55%.
Figure 21. An example of a Landsat reflective image obtained from FORAGE.
Figure 202. An example of a Foliage Projective Cover (FPC) image obtained from FORAGE.
Figure 213. An example of a seasonal ground cover image obtained from FORAGE.

Guide to Using FORAGE Version 1.8
33
For help in interpreting the imagery, visit:
http://www.qld.gov.au/environment/land/vegetation/mapping/remote-sensing/.
Department of Environment and Science
34
5 Common access problems
5.1 Time
The time taken, from ordering to receipt of a FORAGE time report, can vary from as little as a few minutes to a few hours, depending on system processing. A problem may have occurred if you do not receive your report after six hours. However, if a report is not received within three hours, this is likely to be due to a system fault (e.g. computer servers being offline or a computer database outage). FORAGE administrators are available to resolve problems during office hours ([email protected]).
5.2 Saving a report
Occasionally a FORAGE report will not save when the report is open and you attempt to save through the ‘File’ tab and ‘save as’ option. If this occurs, close the report and try either:
saving the unopened report directly from the email attachment by right clicking the mouse on the attachment, then select the ‘save as’ option in the drop down menu to save the document to a selected folder
left click and hold the mouse on the email attachment, and ‘drag’ the attachment to a folder or computer desktop.
5.3 No Report
From time to time, when you request a report from FORAGE, you may receive either no response or a message stating that there is no image available for the requested location (for Ground Cover reports or SLATS satellite imagery).
If there is no response, first check that you have submitted the correct Lot on Plan for the location. It may be that your selection is correct, but one of our computer servers is busy or off-line. In this case, try re-submitting your request or contact the FORAGE administrator during office hours.

Guide to Using FORAGE Version 1.8
35
6 Glossary AussieGRASS – Australian Grassland and Rangeland Assessment by Spatial Simulation (Carter et al. 2000). An Australian climate and biological modelling system run by Grazing Land Systems – Science Delivery, Department of Science, Information Technology and Innovation (DSITI), using advanced spatial simulation techniques and super computing facilities. http://www.longpaddock.qld.gov.au/about/researchprojects/aussiegrass/
Bare ground – Bare ground refers to the proportion of ground which is either bare soil or covered by rock.
Consistent Climate Scenarios (CCS) projections data – Projected climate information for 2030 and 2050, prepared by the former Department of Science, Information Technology and Innovation (DSITI) now Department of Environment and Science (DES) in collaboration with CSIRO and based on IPCC AR5 global climate models deemed most suitable for Australia Long Paddock website http://www.longpaddock.qld.gov.au/climateprojections/, using the SILO climate dataset.
Digital Cadastral Data Base (DCDB) – This is the spatial representation of the property boundaries and the related property descriptions of Queensland. The DCDB (https://data.qld.gov.au/en/dataset/cadastral-data-queensland-series) provides the map base for systems dealing with land and land related information and provides data for generating of hard copy map products.
Foliage Projective Cover – Foliage Projective Cover (FPC) is a widely adopted metric of vegetation cover that is used in vegetation classification frameworks in Australia. FPC is defined as the vertically projected percentage cover of photosynthetic foliage from tree and shrubs greater than two metres in height. This is the definition of woody vegetation cover adopted by the Department of Environment and Science (DES) in the Statewide Landcover and Tree Study (SLATS).
GRASP – A computer model of variable climate and animal impacts upon grasses and soils, principally in northern Australia (McKeon et al. 1990).
Ground cover – Ground cover refers to the proportion of ground covered by green and dead foliage, cryptogram and detached plant litter.
Percentile – The percentile of a number indicates where the number lies in an ordered list of numbers. For example, if last year's rainfall was ranked at the 30th percentile of the long-term annual rainfall record, then the rainfall in 30% of the years in the record are less than (or equal to) last year's rainfall and the rainfall in the remaining 70% of years in the record are greater than last year’s rainfall. Percentiles that are multiples of 25 are called quartiles. The 25th percentile is the first quartile, the 50th percentile is the second quartile and so on.
SILO – A climate database, accessible through the internet, hosted by Science Information Delivery – Science Delivery, Department of Environment and Science (DES), containing Australian climate data from 1889 to current, in a number of ready-to-use formats, suitable for research and climate applications. https://silo.longpaddock.qld.gov.au/.
SLATS – The Statewide Landcover and Trees Study (SLATS) is a Department of Environment and Science (DES) research project, monitoring Queensland's forests and woodlands to assess woody vegetation extent and change, supporting the Vegetation Management Act 1999 and regional planning initiatives. The project provides satellite images and detailed spatial data and reports to help landholders, scientists, industry and government improve land management practices. http://www.qld.gov.au/environment/land/vegetation/mapping/slats/

Department of Environment and Science
36
Stocktake – Stocktake © is a paddock-scale land condition monitoring and management software package, developed by the Queensland Department of Agriculture and Fisheries to provide grazing land managers with a practical, systematic way to assess land condition and long-term carrying capacity, and to calculate short-term forage budget.
TSDM – Total standing dry matter, refers to the above-ground total standing green and dead plant material, reported on a dry weight basis. TSDM does not include plant litter.
7 References Armston, J., Denham, R., Danaher, T., Scarth, P. and Moffiet, T. (2009) Prediction and validation of foliage
projective cover from Landsat-5 TM and Landsat-7 ETM+ imagery for Queensland, Australia. Journal
of Applied Remote Sensing, 3: 033540.
Carter, J.O., Hall, W.B., Brook, K.D., McKeon, G.M., Day, K.A. and Paull, C.J. (2000). AussieGRASS:
Australian Grassland and Rangeland Assessment by Spatial Simulation. In Applications of seasonal
climate forecasting in agricultural and natural ecosystems—the Australian experience. (Eds G.
Hammer, N. Nicholls and C. Mitchell) pp. 329–349. Kluwer. Academic Press, Netherlands.
Kitchen J., Armston J. Clark, A., Danaher T. and Scarth P. 2010. Operational use of annual Landsat-5 TM
and Landsat-7 ETM+ image time-series for mapping wooded extent and foliage projective cover in
north-eastern Australia. In Proceedings of the 15th Australasian Remote Sensing and
Photogrammetry Conference, Alice Springs, Australia, 13 -17 September 2010.
McKeon, G., Day, K., Howden, S., Mott, J., Orr, W., Scattini, W. and Weston, E. (1990). Northern Australia
savannahs: Management for pastoral production. Journal of Biogeography, 17, 355-372.
Pringle, M., Schmidt, M., and Tindall, D. (revised): Multi-decade, multi-sensor time-series modelling based on geostatistical concepts to predict broad groups of crops. Remote Sensing of Environment.
Schmidt, M., Pringle, M. Devadas, R. Denham, R. and Tindall, D. (2016): A Framework for Large-Area
Mapping of Past and Present Cropping Activity Using Seasonal Landsat Images and Time Series
Metrics. Remote Sensing, 8, 312; DOI:10.3390/rs8040312.
Smith, I. and Chiew, F. (2009). Document and assess methods for generating inputs to hydrological models
and extend delivery of projections across Victoria. Final report for SEACI Phase 1 Project 2.2.5P.
http://www.seaci.org/publications/documents/SEACI-1%20Reports/S1_FR225P.pdf.
Stone, R.C., Hammer, G. L., and Marcussen, T. (1996). Prediction of global rainfall probabilities using
phases of the Southern Oscillation Index. Nature 384, 252-255. doi: 10.1038/384252a0.
Suppiah, R., Hennessy, K.J., Whetton, P.H., McInnes, K., Macadam, I., Bathols, J., Ricketts, J., & Page,
C.M. (2007). Australian climate change projections derived from simulations performed for the IPCC
4th Assessment Report. Aust. Met. Mag. 56 (2007) 131-152. CSIRO Marine & Atmospheric Research,
Australia. http://www.bom.gov.au/amm/docs/2007/suppiah.pdf
Zhang, B. and Carter, J (2018). FORAGE – An online system for generating and delivering property-scale
decision support information for grazing land and environmental management. Computers and
Electronics in Agriculture, 150, 302-311.


