20
Ozarks Technical Community College GUIDED SELF-PLACEMENT TASK FORCE REPORT: SPRING 2016 TERM
Ozarks Technical Community College
GUIDED SELF-PLACEMENT TASK FORCE REPORT: SPRING 2016
TERM
Executive Summary
To evaluate the first semester results of guided self-placement, Dr. Higdon convened a task
force consisting of:
o Andrew Aberle, Math Instructor
o Jennifer Dunkel, English Instructor
o Matthew Simpson, College Director of Research and Strategic Planning
The task force was also directly assisted by:
o Vivian Elder, Dean of Academic Services
o Abby Benz, Assistant Director of Research and Strategic Planning
o Misty Tollett, Research Analyst
The goal of this task force was to conduct a robust assessment effort to evaluate the ongoing
impact of guided self-placement and identify opportunities for improvement moving
forward.
This task force first met in December 2015 and continued to meet weekly throughout the
spring 2016 semester to plan and implement data collection.
Quantitative data (including enrollment, withdrawal rates, first week movement between
classes, midterm grades, support center usage and final grades) was collected and analyzed
throughout the semester.
o In order to provide results in time to act on any accepted recommendations, grades
were analyzed before the completion of the processing period for Incomplete grades.
The final numbers will change as this processing occurs, but the number of affected
grades is too small to change the substantive findings.
Qualitative data collection mechanisms included:
o A survey to all English, reading, and math instructors sent during the 5th week of
classes and completed by 102 instructors.
o A survey to all instructors in other subjects with courses that could be affected by
prerequisite changes sent during the 10th week of classes and completed by 152
instructors across all divisions.
o An online open portal for instructor feedback, which remained available throughout
the semester, and received 56 submissions from 47 faculty representing all four
divisions.
o Large and small group open faculty comment sessions were held, attended by a total
of 121 faculty representing over 30 different subjects.
o A survey to all students in relevant English, reading, and math courses during the
10th week of classes and completed by 660 students.
o Two faculty work-groups evaluating reading and affective behaviors.
o Feedback received through governance council meetings.
o Review of external literature and best practices.
Analysis of this research led to 14 findings:
1. Guided self-placement increased enrollment in college level courses and decreased
enrollment in developmental level courses.
2. Very few students took advantage of the opportunity to move between class levels in
the first week.
3. Guided self-placement did not have an effect on college-wide withdrawal or course
completion rates but did have an effect within math and English courses.
4. Guided self-placement increased the number of first-time students who enrolled in
and passed gateway math and English courses.
5. Support center usage increased among specific groups and courses, although overall
visits decreased.
6. Students who visited a support center for their course were significantly more likely
to be successful.
7. High School GPA, for recent graduates, and date of registration were identified as
strong predictors of student success in English and math courses.
8. Math and English faculty reported moderately lower levels of student preparedness
relative to past terms.
9. Faculty in other courses affected by prerequisites reported no significant change in
student preparedness relative to past terms.
10. Students were satisfied with their course level placement and indicated that the skill
levels required were consistent with their expectations.
11. The leading decision factor for OTC students’ course level selection was their degree
or career plan; OTC-provided resources were not widely used.
12. Instructors served as the primary support resource for students outside of class.
13. The lack of soft skill abilities and understanding of college expectations represented a
growing barrier to student success.
14. The majority of faculty comments submitted to the open portal this semester
indicated a higher workload, due to student preparedness levels and/or soft skill
challenges.
Based on these findings, the task force offers the following recommendations:
1. Integrate completion of the guided self-placement process into student onboarding
and incorporate research findings to improve placement results.
2. Increase focus on the provision of soft skill training and early establishment of
college expectations for students with risk factors.
3. Increase the promotion and availability of support resources for students and faculty
in English, reading and math.
4. Continue to monitor and evaluate guided self-placement results.
NOTE: these findings and recommendations are organized by data source
(instrumentation), and the order is not intended to convey level of importance.
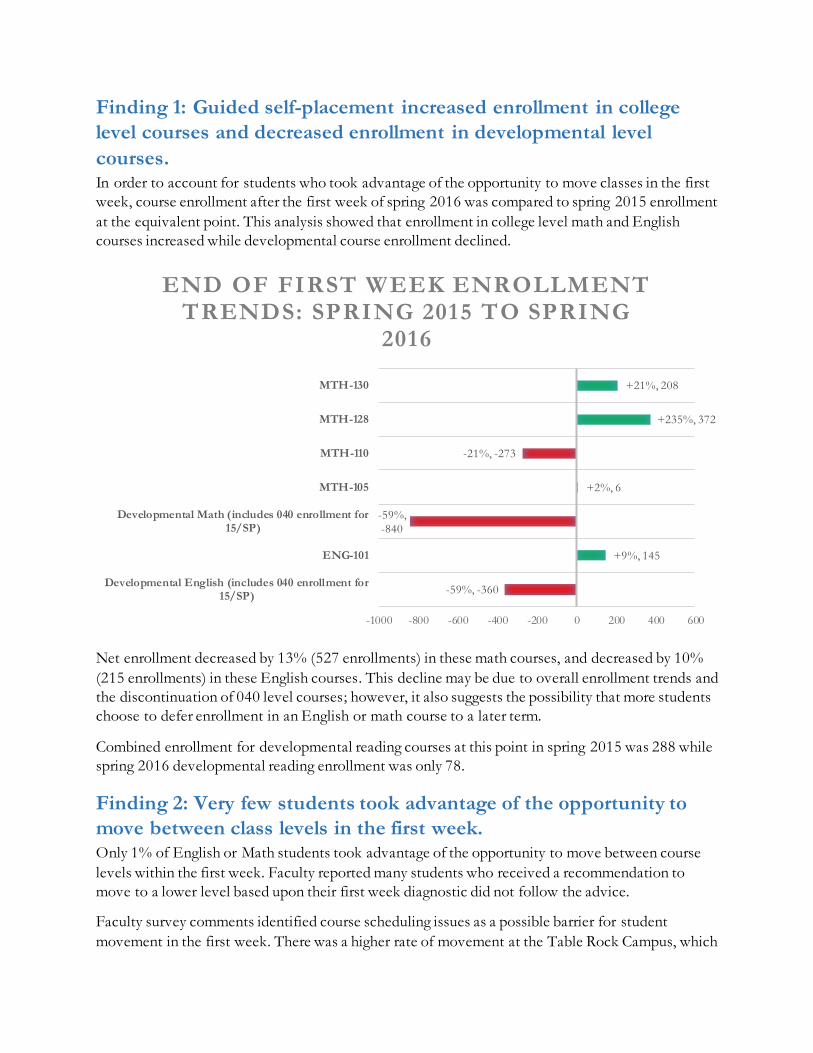
Finding 1: Guided self-placement increased enrollment in college
level courses and decreased enrollment in developmental level
courses. In order to account for students who took advantage of the opportunity to move classes in the first
week, course enrollment after the first week of spring 2016 was compared to spring 2015 enrollment
at the equivalent point. This analysis showed that enrollment in college level math and English
courses increased while developmental course enrollment declined.
Net enrollment decreased by 13% (527 enrollments) in these math courses, and decreased by 10%
(215 enrollments) in these English courses. This decline may be due to overall enrollment trends and
the discontinuation of 040 level courses; however, it also suggests the possibility that more students
choose to defer enrollment in an English or math course to a later term.
Combined enrollment for developmental reading courses at this point in spring 2015 was 288 while
spring 2016 developmental reading enrollment was only 78.
Finding 2: Very few students took advantage of the opportunity to
move between class levels in the first week. Only 1% of English or Math students took advantage of the opportunity to move between course
levels within the first week. Faculty reported many students who received a recommendation to
move to a lower level based upon their first week diagnostic did not follow the advice.
Faculty survey comments identified course scheduling issues as a possible barrier for student
movement in the first week. There was a higher rate of movement at the Table Rock Campus, which
-59%, -360
+9%, 145
-59%,
-840
+2%, 6
-21%, -273
+235%, 372
+21%, 208
-1000 -800 -600 -400 -200 0 200 400 600
Developmental English (includes 040 enrollment for15/SP)
ENG-101
Developmental Math (includes 040 enrollment for15/SP)
MTH-105
MTH-110
MTH-128
MTH-130
END OF FIRST WEEK ENROLLMENT TRENDS: SPRING 2015 TO SPRING
2016
took a different approach to scheduling, but the number of students moving is still too small for
meaningful conclusions.
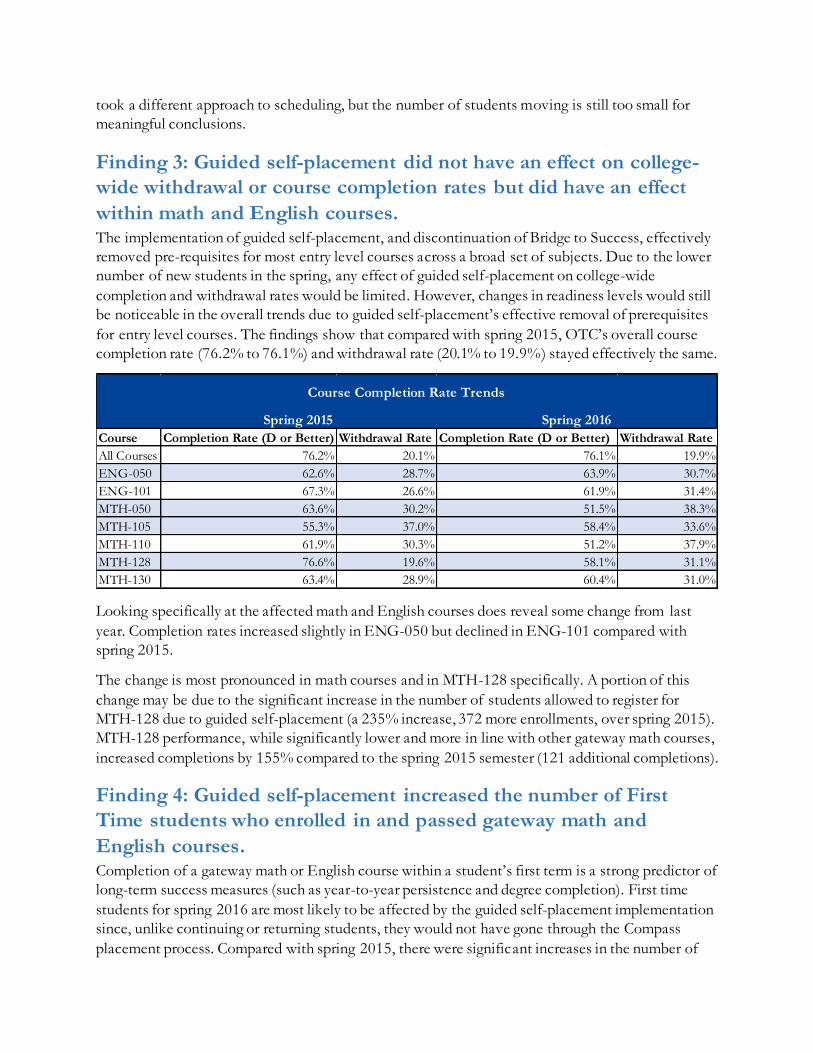
Finding 3: Guided self-placement did not have an effect on college-
wide withdrawal or course completion rates but did have an effect
within math and English courses. The implementation of guided self-placement, and discontinuation of Bridge to Success, effectively
removed pre-requisites for most entry level courses across a broad set of subjects. Due to the lower
number of new students in the spring, any effect of guided self-placement on college-wide
completion and withdrawal rates would be limited. However, changes in readiness levels would still
be noticeable in the overall trends due to guided self-placement’s effective removal of prerequisites
for entry level courses. The findings show that compared with spring 2015, OTC’s overall course
completion rate (76.2% to 76.1%) and withdrawal rate (20.1% to 19.9%) stayed effectively the same.
Looking specifically at the affected math and English courses does reveal some change from last
year. Completion rates increased slightly in ENG-050 but declined in ENG-101 compared with
spring 2015.
The change is most pronounced in math courses and in MTH-128 specifically. A portion of this
change may be due to the significant increase in the number of students allowed to register for
MTH-128 due to guided self-placement (a 235% increase, 372 more enrollments, over spring 2015).
MTH-128 performance, while significantly lower and more in line with other gateway math courses,
increased completions by 155% compared to the spring 2015 semester (121 additional completions).
Finding 4: Guided self-placement increased the number of First
Time students who enrolled in and passed gateway math and
English courses. Completion of a gateway math or English course within a student’s first term is a strong predictor of
long-term success measures (such as year-to-year persistence and degree completion). First time
students for spring 2016 are most likely to be affected by the guided self-placement implementation
since, unlike continuing or returning students, they would not have gone through the Compass
placement process. Compared with spring 2015, there were significant increases in the number of
Course Completion Rate (D or Better) Withdrawal Rate Completion Rate (D or Better) Withdrawal Rate
All Courses 76.2% 20.1% 76.1% 19.9%
ENG-050 62.6% 28.7% 63.9% 30.7%
ENG-101 67.3% 26.6% 61.9% 31.4%
MTH-050 63.6% 30.2% 51.5% 38.3%
MTH-105 55.3% 37.0% 58.4% 33.6%
MTH-110 61.9% 30.3% 51.2% 37.9%
MTH-128 76.6% 19.6% 58.1% 31.1%
MTH-130 63.4% 28.9% 60.4% 31.0%
Course Completion Rate Trends
Spring 2015 Spring 2016
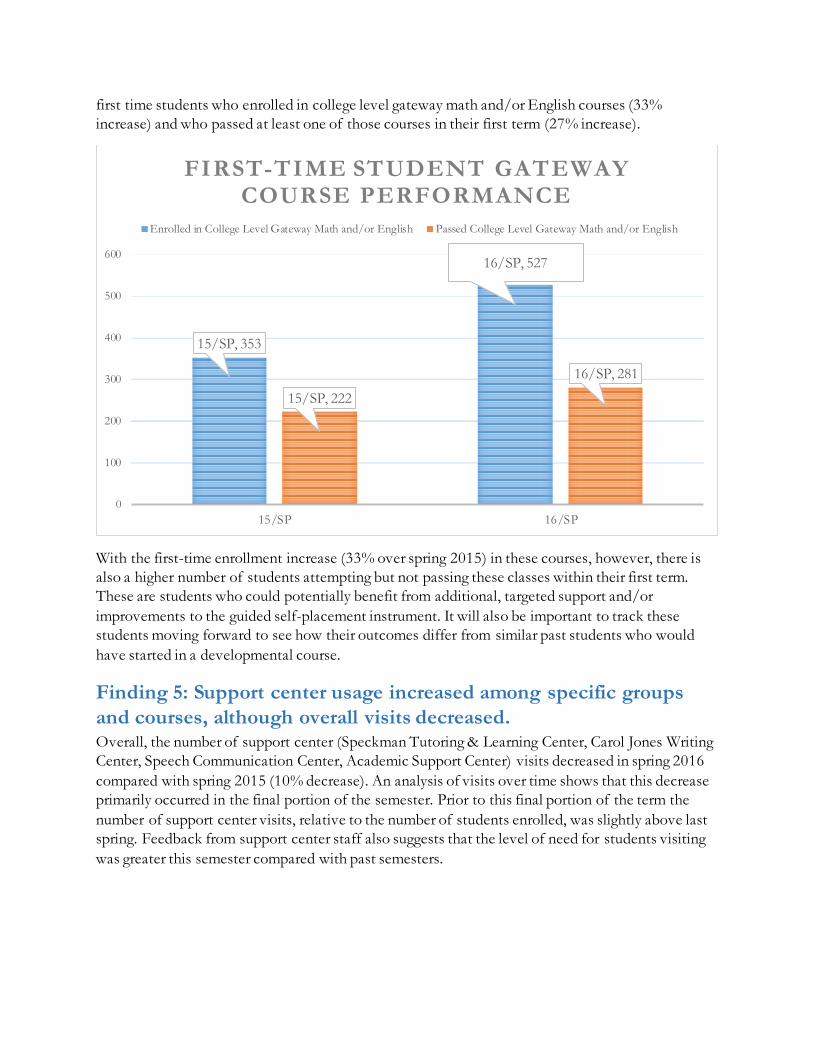
first time students who enrolled in college level gateway math and/or English courses (33%
increase) and who passed at least one of those courses in their first term (27% increase).
With the first-time enrollment increase (33% over spring 2015) in these courses, however, there is
also a higher number of students attempting but not passing these classes within their first term.
These are students who could potentially benefit from additional, targeted support and/or
improvements to the guided self-placement instrument. It will also be important to track these
students moving forward to see how their outcomes differ from similar past students who would
have started in a developmental course.
Finding 5: Support center usage increased among specific groups
and courses, although overall visits decreased. Overall, the number of support center (Speckman Tutoring & Learning Center, Carol Jones Writing
Center, Speech Communication Center, Academic Support Center) visits decreased in spring 2016
compared with spring 2015 (10% decrease). An analysis of visits over time shows that this decrease
primarily occurred in the final portion of the semester. Prior to this final portion of the term the
number of support center visits, relative to the number of students enrolled, was slightly above last
spring. Feedback from support center staff also suggests that the level of need for students visiting
was greater this semester compared with past semesters.
15/SP, 353
16/SP, 527
15/SP, 222
16/SP, 281
0
100
200
300
400
500
600
15/SP 16/SP
FIRST-TIME STUDENT GATEWAY COURSE PERFORMANCE
Enrolled in College Level Gateway Math and/or English Passed College Level Gateway Math and/or English
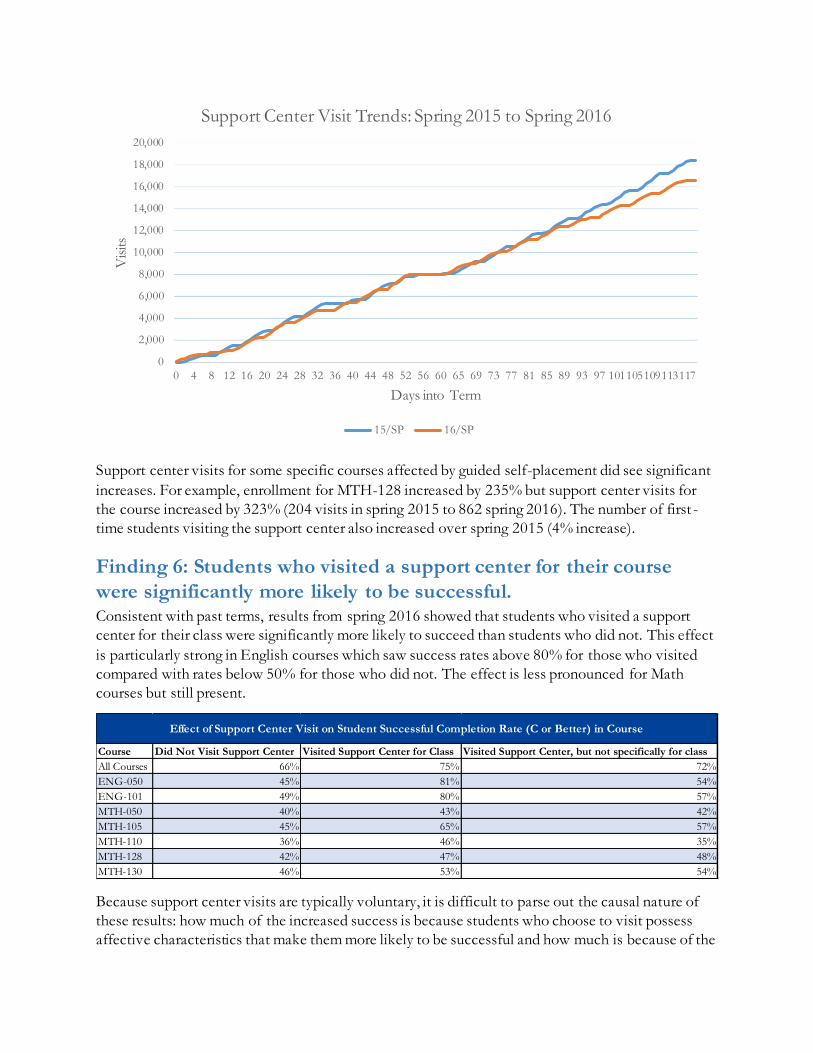
Support center visits for some specific courses affected by guided self-placement did see significant
increases. For example, enrollment for MTH-128 increased by 235% but support center visits for
the course increased by 323% (204 visits in spring 2015 to 862 spring 2016). The number of first -
time students visiting the support center also increased over spring 2015 (4% increase).
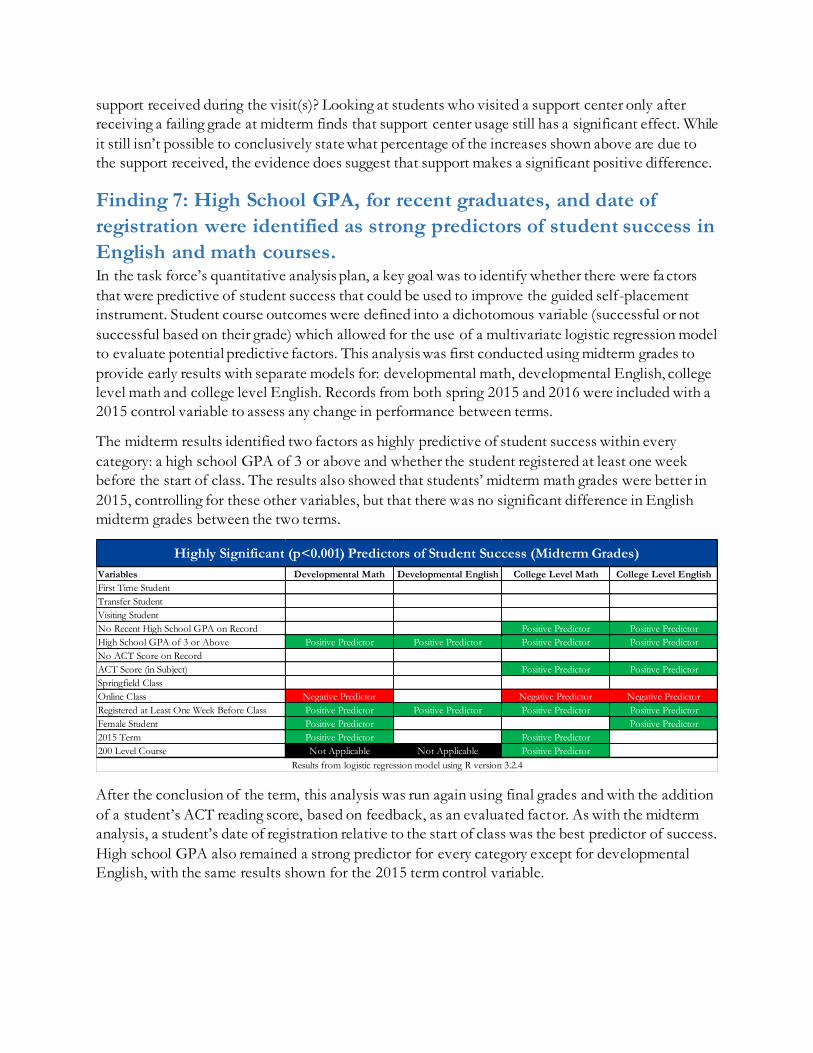
Finding 6: Students who visited a support center for their course
were significantly more likely to be successful. Consistent with past terms, results from spring 2016 showed that students who visited a support
center for their class were significantly more likely to succeed than students who did not. This effect
is particularly strong in English courses which saw success rates above 80% for those who visited
compared with rates below 50% for those who did not. The effect is less pronounced for Math
courses but still present.
Because support center visits are typically voluntary, it is difficult to parse out the causal nature of
these results: how much of the increased success is because students who choose to visit possess
affective characteristics that make them more likely to be successful and how much is because of the
0
2,000
4,000
6,000
8,000
10,000
12,000
14,000
16,000
18,000
20,000
0 4 8 12 16 20 24 28 32 36 40 44 48 52 56 60 65 69 73 77 81 85 89 93 97 101105109113117
Vis
its
Days into Term
Support Center Visit Trends: Spring 2015 to Spring 2016
15/SP 16/SP
Course Did Not Visit Support Center Visited Support Center for Class Visited Support Center, but not specifically for class
All Courses 66% 75% 72%
ENG-050 45% 81% 54%
ENG-101 49% 80% 57%
MTH-050 40% 43% 42%
MTH-105 45% 65% 57%
MTH-110 36% 46% 35%
MTH-128 42% 47% 48%
MTH-130 46% 53% 54%
Effect of Support Center Visit on Student Successful Completion Rate (C or Better) in Course
support received during the visit(s)? Looking at students who visited a support center only after
receiving a failing grade at midterm finds that support center usage still has a significant effect. While
it still isn’t possible to conclusively state what percentage of the increases shown above are due to
the support received, the evidence does suggest that support makes a significant positive difference.
Finding 7: High School GPA, for recent graduates, and date of
registration were identified as strong predictors of student success in
English and math courses. In the task force’s quantitative analysis plan, a key goal was to identify whether there were factors
that were predictive of student success that could be used to improve the guided self-placement
instrument. Student course outcomes were defined into a dichotomous variable (successful or not
successful based on their grade) which allowed for the use of a multivariate logistic regression model
to evaluate potential predictive factors. This analysis was first conducted using midterm grades to
provide early results with separate models for: developmental math, developmental English, college
level math and college level English. Records from both spring 2015 and 2016 were included with a
2015 control variable to assess any change in performance between terms.
The midterm results identified two factors as highly predictive of student success within every
category: a high school GPA of 3 or above and whether the student registered at least one week
before the start of class. The results also showed that students’ midterm math grades were better in
2015, controlling for these other variables, but that there was no significant difference in English
midterm grades between the two terms.
After the conclusion of the term, this analysis was run again using final grades and with the addition
of a student’s ACT reading score, based on feedback, as an evaluated factor. As with the midterm
analysis, a student’s date of registration relative to the start of class was the best predictor of success.
High school GPA also remained a strong predictor for every category except for developmental
English, with the same results shown for the 2015 term control variable.
Variables Developmental Math Developmental English College Level Math College Level English
First Time Student
Transfer Student
Visiting Student
No Recent High School GPA on Record Positive Predictor Positive Predictor
High School GPA of 3 or Above Positive Predictor Positive Predictor Positive Predictor Positive Predictor
No ACT Score on Record
ACT Score (in Subject) Positive Predictor Positive Predictor
Springfield Class
Online Class Negative Predictor Negative Predictor Negative Predictor
Registered at Least One Week Before Class Positive Predictor Positive Predictor Positive Predictor Positive Predictor
Female Student Positive Predictor Positive Predictor
2015 Term Positive Predictor Positive Predictor
200 Level Course Not Applicable Not Applicable Positive Predictor
Highly Significant (p<0.001) Predictors of Student Success (Midterm Grades)
Results from logistic regression model using R version 3.2.4
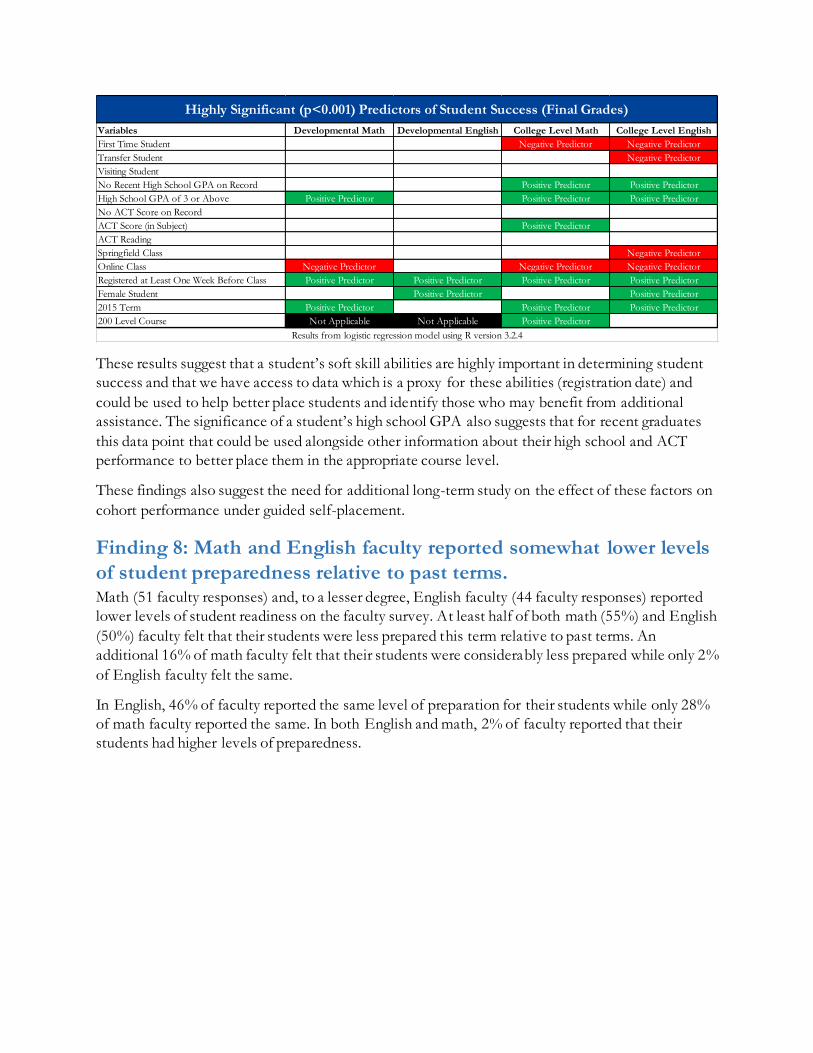
These results suggest that a student’s soft skill abilities are highly important in determining student
success and that we have access to data which is a proxy for these abilities (registration date) and
could be used to help better place students and identify those who may benefit from additional
assistance. The significance of a student’s high school GPA also suggests that for recent graduates
this data point that could be used alongside other information about their high school and ACT
performance to better place them in the appropriate course level.
These findings also suggest the need for additional long-term study on the effect of these factors on
cohort performance under guided self-placement.
Finding 8: Math and English faculty reported somewhat lower levels
of student preparedness relative to past terms. Math (51 faculty responses) and, to a lesser degree, English faculty (44 faculty responses) reported
lower levels of student readiness on the faculty survey. At least half of both math (55%) and English
(50%) faculty felt that their students were less prepared this term relative to past terms. An
additional 16% of math faculty felt that their students were considerably less prepared while only 2%
of English faculty felt the same.
In English, 46% of faculty reported the same level of preparation for their students while only 28%
of math faculty reported the same. In both English and math, 2% of faculty reported that their
students had higher levels of preparedness.
Variables Developmental Math Developmental English College Level Math College Level English
First Time Student Negative Predictor Negative Predictor
Transfer Student Negative Predictor
Visiting Student
No Recent High School GPA on Record Positive Predictor Positive Predictor
High School GPA of 3 or Above Positive Predictor Positive Predictor Positive Predictor Positive Predictor
No ACT Score on Record
ACT Score (in Subject) Positive Predictor
ACT Reading
Springfield Class Negative Predictor
Online Class Negative Predictor Negative Predictor Negative Predictor Negative Predictor
Registered at Least One Week Before Class Positive Predictor Positive Predictor Positive Predictor Positive Predictor
Female Student Positive Predictor Positive Predictor
2015 Term Positive Predictor Positive Predictor Positive Predictor
200 Level Course Not Applicable Not Applicable Positive Predictor
Highly Significant (p<0.001) Predictors of Student Success (Final Grades)
Results from logistic regression model using R version 3.2.4
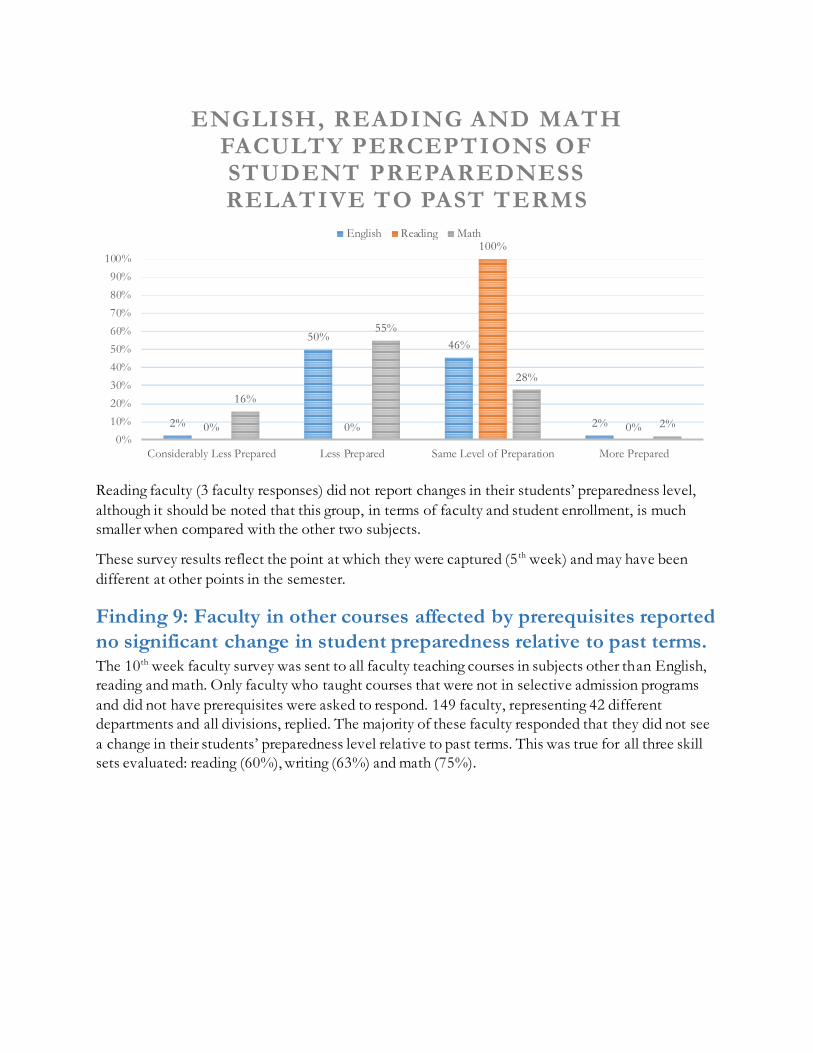
Reading faculty (3 faculty responses) did not report changes in their students’ preparedness level,
although it should be noted that this group, in terms of faculty and student enrollment, is much
smaller when compared with the other two subjects.
These survey results reflect the point at which they were captured (5 th week) and may have been
different at other points in the semester.
Finding 9: Faculty in other courses affected by prerequisites reported
no significant change in student preparedness relative to past terms. The 10th week faculty survey was sent to all faculty teaching courses in subjects other than English,
reading and math. Only faculty who taught courses that were not in selective admission programs
and did not have prerequisites were asked to respond. 149 faculty, representing 42 different
departments and all divisions, replied. The majority of these faculty responded that they did not see
a change in their students’ preparedness level relative to past terms. This was true for all three skill
sets evaluated: reading (60%), writing (63%) and math (75%).
2%
50%46%
2%0% 0%
100%
0%
16%
55%
28%
2%
0%
10%
20%
30%
40%
50%
60%
70%
80%
90%
100%
Considerably Less Prepared Less Prepared Same Level of Preparation More Prepared
ENGLISH, READING AND MATH FACULTY PERCEPTIONS OF STUDENT PREPAREDNESS RELATIVE TO PAST TERMS
English Reading Math
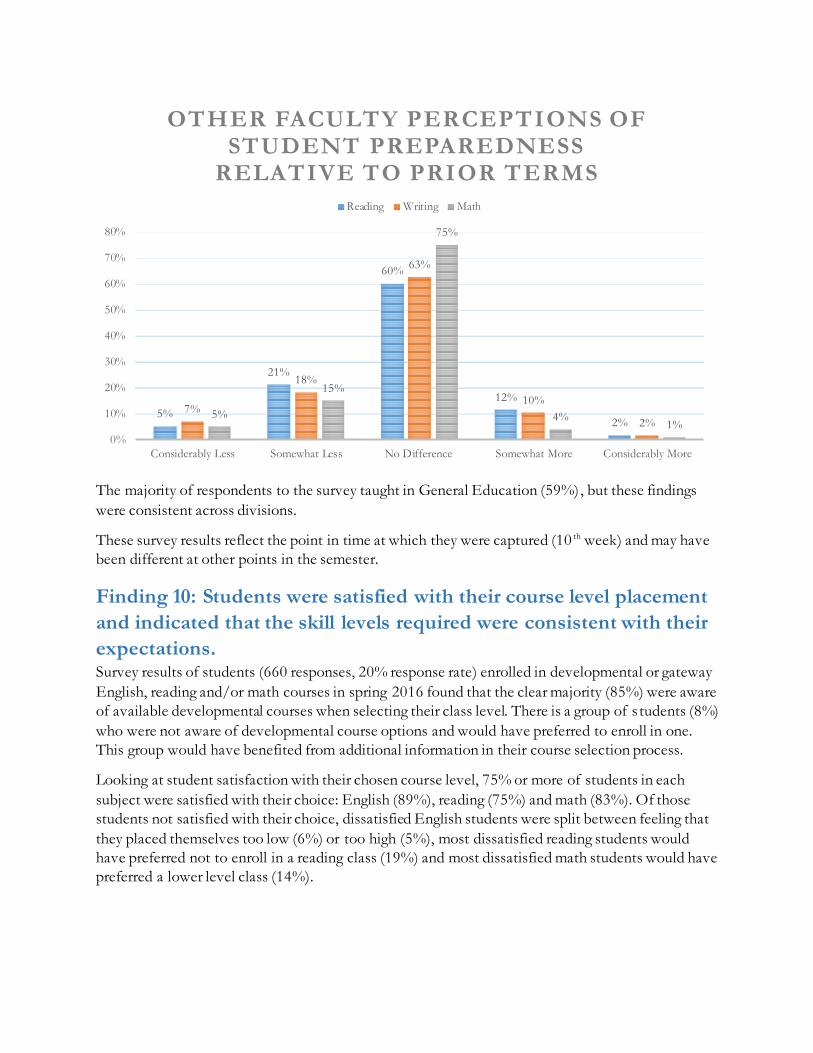
The majority of respondents to the survey taught in General Education (59%), but these findings
were consistent across divisions.
These survey results reflect the point in time at which they were captured (10 th week) and may have
been different at other points in the semester.
Finding 10: Students were satisfied with their course level placement
and indicated that the skill levels required were consistent with their
expectations. Survey results of students (660 responses, 20% response rate) enrolled in developmental or gateway
English, reading and/or math courses in spring 2016 found that the clear majority (85%) were aware
of available developmental courses when selecting their class level. There is a group of s tudents (8%)
who were not aware of developmental course options and would have preferred to enroll in one.
This group would have benefited from additional information in their course selection process.
Looking at student satisfaction with their chosen course level, 75% or more of students in each
subject were satisfied with their choice: English (89%), reading (75%) and math (83%). Of those
students not satisfied with their choice, dissatisfied English students were split between feeling that
they placed themselves too low (6%) or too high (5%), most dissatisfied reading students would
have preferred not to enroll in a reading class (19%) and most dissatisfied math students would have
preferred a lower level class (14%).
5%
21%
60%
12%
2%7%
18%
63%
10%
2%5%
15%
75%
4%1%
0%
10%
20%
30%
40%
50%
60%
70%
80%
Considerably Less Somewhat Less No Difference Somewhat More Considerably More
OTHER FACULTY PERCEPTIONS OF STUDENT PREPAREDNESS
RELATIVE TO PRIOR TERMS
Reading Writing Math
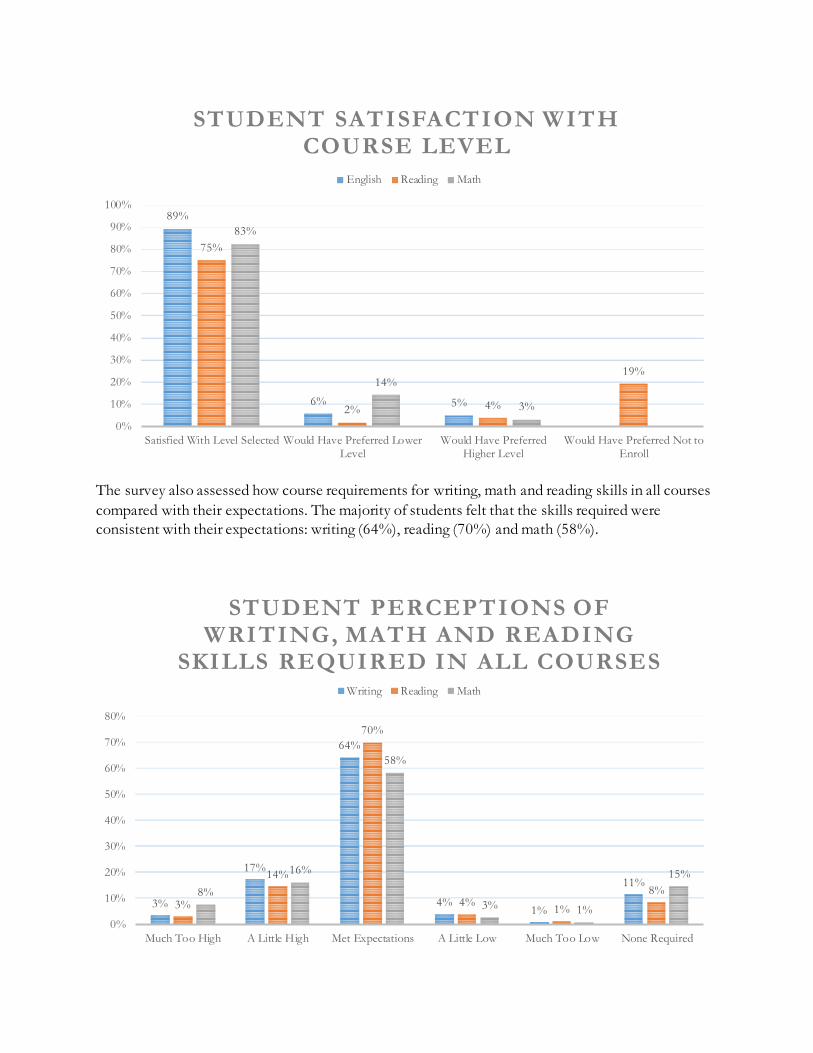
The survey also assessed how course requirements for writing, math and reading skills in all courses
compared with their expectations. The majority of students felt that the skills required were
consistent with their expectations: writing (64%), reading (70%) and math (58%).
89%
6% 5%
75%
2% 4%
19%
83%
14%
3%
0%
10%
20%
30%
40%
50%
60%
70%
80%
90%
100%
Satisfied With Level Selected Would Have Preferred LowerLevel
Would Have PreferredHigher Level
Would Have Preferred Not toEnroll
STUDENT SATISFACTION WITH COURSE LEVEL
English Reading Math
3%
17%
64%
4%1%
11%
3%
14%
70%
4%1%
8%8%
16%
58%
3% 1%
15%
0%
10%
20%
30%
40%
50%
60%
70%
80%
Much Too High A Little High Met Expectations A Little Low Much Too Low None Required
STUDENT PERCEPTIONS OF WRITING, MATH AND READING
SKILLS REQUIRED IN ALL COURSESWriting Reading Math
Of the three subjects, students were most likely to feel that the math skills required by their courses
were higher than expected (24%).
These survey results reflect the point in time at which they were captured (10 th week) and may have
been different at other points in the semester.
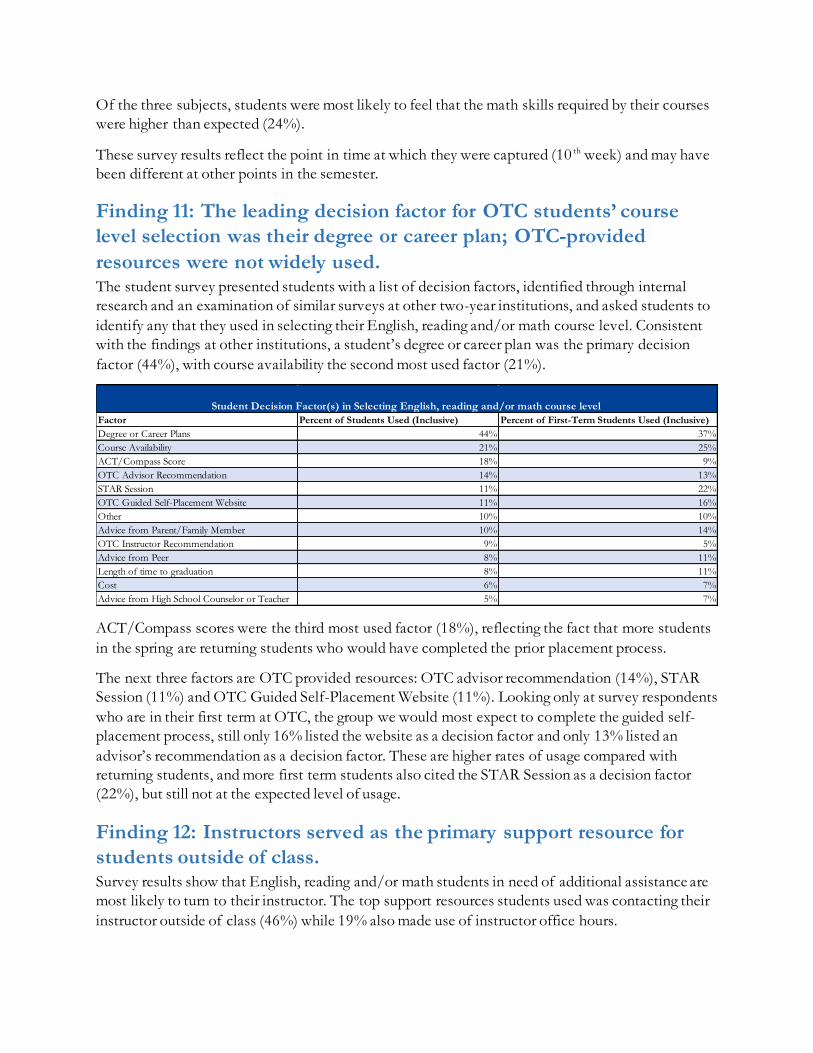
Finding 11: The leading decision factor for OTC students’ course
level selection was their degree or career plan; OTC-provided
resources were not widely used. The student survey presented students with a list of decision factors, identified through internal
research and an examination of similar surveys at other two-year institutions, and asked students to
identify any that they used in selecting their English, reading and/or math course level. Consistent
with the findings at other institutions, a student’s degree or career plan was the primary decision
factor (44%), with course availability the second most used factor (21%).
ACT/Compass scores were the third most used factor (18%), reflecting the fact that more students
in the spring are returning students who would have completed the prior placement process.
The next three factors are OTC provided resources: OTC advisor recommendation (14%), STAR
Session (11%) and OTC Guided Self-Placement Website (11%). Looking only at survey respondents
who are in their first term at OTC, the group we would most expect to complete the guided self-
placement process, still only 16% listed the website as a decision factor and only 13% listed an
advisor’s recommendation as a decision factor. These are higher rates of usage compared with
returning students, and more first term students also cited the STAR Session as a decision factor
(22%), but still not at the expected level of usage.
Finding 12: Instructors served as the primary support resource for
students outside of class. Survey results show that English, reading and/or math students in need of additional assistance are
most likely to turn to their instructor. The top support resources students used was contacting their
instructor outside of class (46%) while 19% also made use of instructor office hours.
Factor Percent of Students Used (Inclusive) Percent of First-Term Students Used (Inclusive)
Degree or Career Plans 44% 37%
Course Availability 21% 25%
ACT/Compass Score 18% 9%
OTC Advisor Recommendation 14% 13%
STAR Session 11% 22%
OTC Guided Self-Placement Website 11% 16%
Other 10% 10%
Advice from Parent/Family Member 10% 14%
OTC Instructor Recommendation 9% 5%
Advice from Peer 8% 11%
Length of time to graduation 8% 11%
Cost 6% 7%
Advice from High School Counselor or Teacher 5% 7%
Student Decision Factor(s) in Selecting English, reading and/or math course level
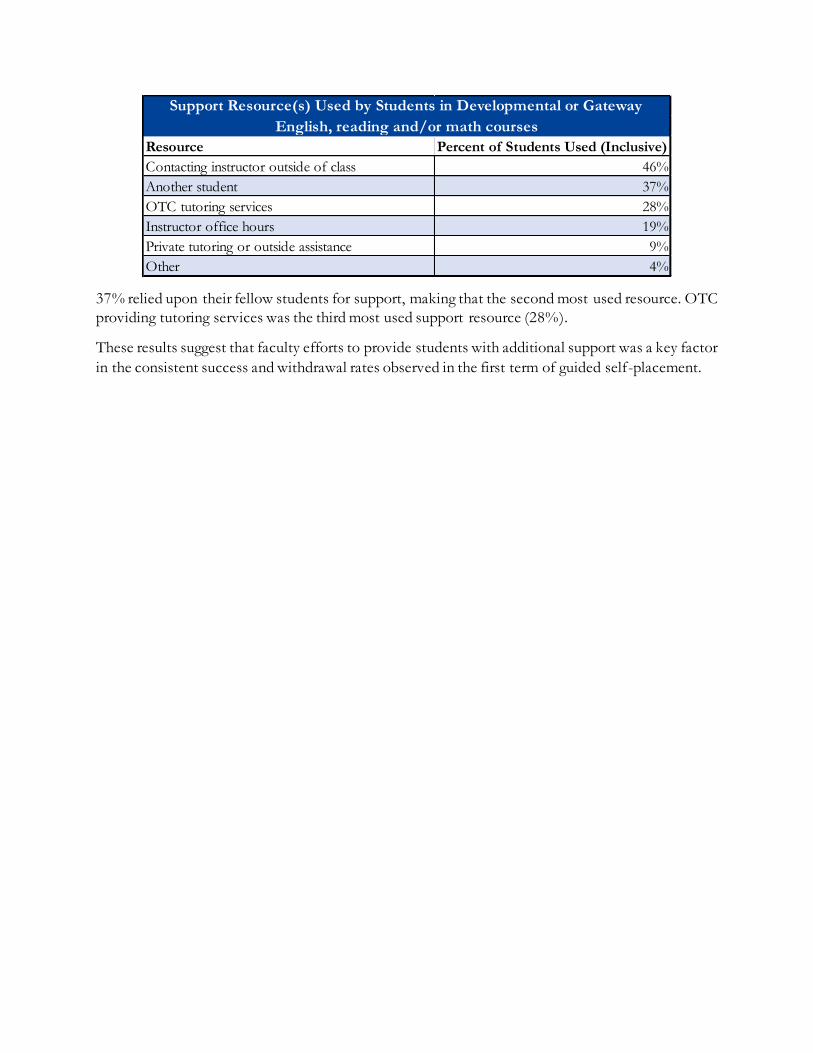
37% relied upon their fellow students for support, making that the second most used resource. OTC
providing tutoring services was the third most used support resource (28%).
These results suggest that faculty efforts to provide students with additional support was a key factor
in the consistent success and withdrawal rates observed in the first term of guided self-placement.
Resource Percent of Students Used (Inclusive)
Contacting instructor outside of class 46%
Another student 37%
OTC tutoring services 28%
Instructor office hours 19%
Private tutoring or outside assistance 9%
Other 4%
Support Resource(s) Used by Students in Developmental or Gateway
English, reading and/or math courses
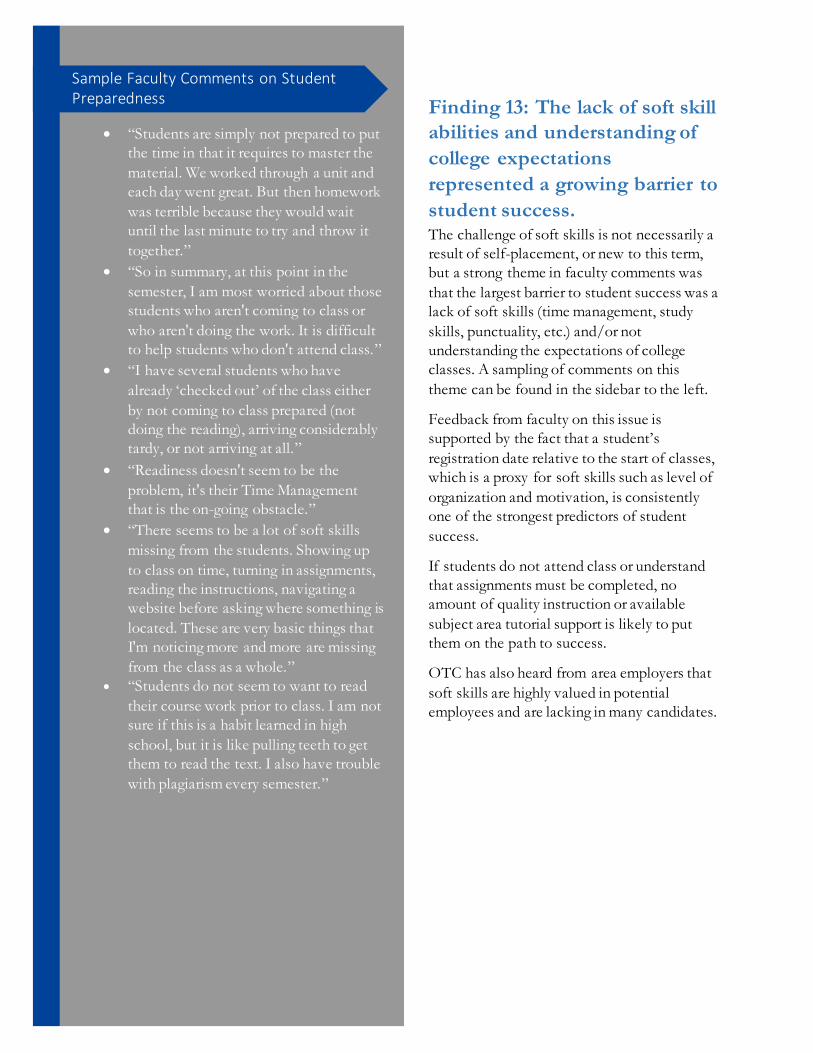
Finding 13: The lack of soft skill
abilities and understanding of
college expectations
represented a growing barrier to
student success. The challenge of soft skills is not necessarily a
result of self-placement, or new to this term,
but a strong theme in faculty comments was
that the largest barrier to student success was a
lack of soft skills (time management, study
skills, punctuality, etc.) and/or not
understanding the expectations of college
classes. A sampling of comments on this
theme can be found in the sidebar to the left.
Feedback from faculty on this issue is
supported by the fact that a student’s
registration date relative to the start of classes,
which is a proxy for soft skills such as level of
organization and motivation, is consistently
one of the strongest predictors of student
success.
If students do not attend class or understand
that assignments must be completed, no
amount of quality instruction or available
subject area tutorial support is likely to put
them on the path to success.
OTC has also heard from area employers that
soft skills are highly valued in potential
employees and are lacking in many candidates.
“Students are simply not prepared to put
the time in that it requires to master the
material. We worked through a unit and
each day went great. But then homework
was terrible because they would wait
until the last minute to try and throw it
together.”
“So in summary, at this point in the
semester, I am most worried about those
students who aren't coming to class or
who aren't doing the work. It is difficult
to help students who don't attend class.”
“I have several students who have
already ‘checked out’ of the class either
by not coming to class prepared (not
doing the reading), arriving considerably
tardy, or not arriving at all.”
“Readiness doesn't seem to be the
problem, it's their Time Management
that is the on-going obstacle.”
“There seems to be a lot of soft skills
missing from the students. Showing up
to class on time, turning in assignments,
reading the instructions, navigating a
website before asking where something is
located. These are very basic things that
I'm noticing more and more are missing
from the class as a whole.”
“Students do not seem to want to read
their course work prior to class. I am not
sure if this is a habit learned in high
school, but it is like pulling teeth to get
them to read the text. I also have trouble
with plagiarism every semester.”
Sample Faculty Comments on Student Preparedness
Finding 14: The majority of
faculty comments submitted to
the open portal this semester
indicated a higher workload,
due to student preparedness
levels and/or soft skill
challenges. While some faculty did share that they saw no
difference in the preparedness levels of their
students, the majority who participated in the
open portal (approximately 60%) did report at
least some difference.
Many of these comments identified soft skill
issues, or life challenges manifesting as soft
skill issues, as a growing challenge to student
success and burden on instructors. This
feedback is consistent with the faculty survey
results.
While the grade results show that many of
these students can succeed at the level which
they have placed themselves, this feedback
suggests that many require additional support
to do so and that this is adding to faculty
workload. This is also supported by what
students tell us about their primary resources
for support as they rely primarily on their
instructor for support outside of class.
Concern was also expressed about the
difficulty of creating a positive class climate in
the first week while also having to administer a
diagnostic that may inform some students that
they are in the wrong class level.
“My students have had more major medical crises than ever before. I have
had XXX, one XXX, one XXX, one
student with XXX, one brother who had
XXX, and one brother XXX. This is all in
one class. All but two of those students
are still attending, but most are not
passing.”
“(Student) said his XXX class is consuming his time and that he knows it is taking away from his other classes. . . . this student’s situation is a good example of how a significant deficiency in one class can have an impact on another class.”
“I do not believe that I was able to get much useful information about student success in the first week from the XXX
diagnostic , but I couldn’t say whether
another method would have done any
better.”
“We have long been (rightly) encouraged to make the beginning of the semester upbeat, to start out on a good note, to have some positivity. Now, at the beginning of XXX, I have to tell my students that many of them are probably in the wrong class. . . It wasn’t at all upbeat for the first week of class.”
“This class is immature and not ready for
college. I have chronic tardies. During a
test, 8 students were tardy –some as late
as 30 minutes for a 50-minute exam!
Because of this, I instituted a policy of
locking the door after 5 minutes. Tardy
students will not be admitted. I’ve had to
spend class time talking to my students
about college expectations.”
XXX = specific information redacted for confidentiality
Sample Faculty Comments from Open Portal
Recommendation One: Integrate completion of the guided self-
placement process into student onboarding and incorporate research
findings to improve placement results. The survey results from spring 2016 showed that a majority of students did not use the guided self-
placement process or advising resources to select their English, reading or math course level. To
ensure all students benefit from guidance, completion of the guided self-placement process should
become an integrated step for student onboarding.
The lack of significant movement by students in the first week, combined with concerns expressed
by faculty, provides further support for ensuring that students use available resources and that those
resources are improved to best resolve placement issues before the start of class.
The guided self-placement instrument could be incorporated into a different platform, such
as OTC’s new online orientation software, to better integrate into the onboarding process
while still being made available as a resource to prospective students.
For recent graduates, high school GPA has consistently shown to be a strong predictor of
success. Screening questions at the beginning of the self-placement process could help best
place those students using known factors. In addition to high school GPA, these screening
questions could include their ACT score within each subject, as well as questions on the
number and type of classes students completed within that subject on high school. Faculty
from each discipline could help map which types of high school courses within each subject
cover the pre-requisite skills for each OTC course level.
A student’s level of soft skills, for which registration date relative to the start of classes is an
effective proxy, should also be incorporated more significantly into the process. This could
aid in proper placement as well as help to identify those students who would most benefit
from additional soft skill training to help prepare them for success.
Students identified their degree or career plans as their primary deciding factor in course
selection. This could be incorporated in the self-placement process by the inclusion of an
early question identifying a student’s plans and then providing them a description of the
skills required for success within that field. This could help all students understand that their
English, reading or math course is not simply a box to check for graduation but provides
valuable skills for success. It could also help ensure that a student’s course selection,
particularly in math, best aligns with their plan of study.
Integrate the Adult Education and Literacy (AEL) and English as a Second Language (ESL)
resources into the placement process to inform students of their availability.
Further improve the guided self-placement process’ utility for students by analyzing
questions for readability and the presence of unnecessary jargon. Provide practical questions
and information that help establish student expectations for the level of skills required in
each area to succeed in college courses.
If possible, collect individual student responses to the self-placement questions and provide
the results to advisors (to help provide appropriate guidance) and instructors (to have an
earlier understanding students’ skill levels in their classes).
Aligned with Findings: 1, 2, 7, 8 and 11
Recommendation Two: Increase focus on the provision of soft skill
training and early establishment of college expectations for students
with risk factors. Feedback from faculty, combined with quantitative analysis showing that factors strongly related to
students’ soft skill abilities are the best predictors of success, shows that the lack of soft skills and/or
an understanding of college expectations represent an increasing barrier to student success. Without
these abilities, students are unlikely to succeed while at OTC or after leaving OTC to pursue a career
or further education.
A more intrusive approach to providing support for those students identified as needing it
could better help promote student success. With most resources in this area currently
provided on a voluntary basis, those students most likely to benefit from these resources are
often also the least likely to use them without outside intervention. For example, new
students with known risk factors could be strongly encouraged to enroll in a soft skills
course (such as CAC-120).
Evaluate and develop soft skill course offerings to ensure that they meet the needs of OTC’s
student population. Consider creation of co-requisite soft skill courses paired with
developmental and/or gateway English, reading and math courses.
Because online courses often require higher levels of soft skills for student success, and have
higher withdrawal rates, it is particularly important that students are made aware of course
expectations prior to starting and that soft skills support is also available to students in an
online format.
Soft skill development workshops should be held throughout the semester to help students
who may need assistance in a specific area and provide ongoing support resources that
students can be directed to as needs are identified.
Provide mechanisms faculty can use to help establish early expectations for their course and
professional development opportunities to aid in their use.
Increase collaboration with area high schools to establish expectations early and better
prepare future OTC students.
Aligned with Findings 7, 8, 12, 13 and 14
Recommendation Three: Increase the promotion and availability of
support resources for students and faculty in English, reading and
math. The results from guided self-placement’s initial term of implementation suggest that students
generally can succeed in their level of placement but that they often require additional support to do
so. To better provide for student success, while also reducing the additional burden this has created
for faculty, additional support resources for both students and faculty would be helpful.
Support resources beyond the instructor should help to provide the needed individualized support
without monopolizing instructor time at the potential expense of other students.
Ensure that support centers have the capacity and ability to meet student demand in each
subject and at each location or course modality and that instructors have the ability to refer
students to receive needed support. Analysis of support center visits consistently shows that
these visits are highly effective in improving student performance and should be a key
resource in providing this additional external support.
Evaluate the need for creating a reading support center given the identification of reading
skills as a barrier to student success across disciplines.
Expand the support center mentoring programs to provide additional opportunities for
peer-to-peer assistance.
Utilize instructors who previously taught developmental courses to provide subject area
tutorial support for students.
Increase the availability of co-requisite PASS courses in the English department and evaluate
the implementation of similar co-requisite courses for math. Evaluation of the co-requisite
model for math courses, or additional support resources, is particularly important because it
is the subject showing the most change so far from guided self-placement. The co-requisite
model allows instructors to effectively continue providing students with additional support
outside of traditional class-time.
Provide subject area workshops and boot camps for students who do not need a full
developmental course but could benefit from some remediation. Identify ways to better
promote attendance for students who would benefit.
Create accessible websites with links to useful external and internal support resources by
subject that can be provided to students at the beginning of relevant courses.
Faculty in these courses could also benefit from additional support resources:
In the surveys, many faculty shared impressive classroom techniques and innovative
approaches used in their classes. It would be beneficial to create a mechanism for the sharing
of these experiences to allow for collaboration among faculty.
Provide professional development to faculty to aid in dealing with students that have
challenging soft skill levels. This should include education on the resources that are available
to help students dealing with life and/or financial challenges as well as how to refer students
to receive assistance.
Provide support for faculty to identify students with reading deficiencies and inform them of
the resources available to assist those students.
Develop a referral system for instructors to send students identified as needing additional
assistance to the appropriate support center. Create different visit types to better align with
the varying skill levels of students in need of additional support.
Re-consider the first week assessment process to ensure that it best aligns with creating a
successful classroom environment and provide improved guidance.
Ongoing evaluation of faculty feedback and support needs.
Aligned with Findings 3, 5, 6, 8, 12 and 14
Recommendation Four: Continue to monitor and evaluate guided
self-placement results. While results from the spring term did provide valuable information, there will be a significantly
larger number of first-time students in the fall and it will take several terms to fully transition away
from the institutional memory of students who went through the old placement process. Continued
data collection, both quantitative and qualitative, is required to assess the impact of self-placement
on this larger group. This continued monitoring will also allow for the assessment of any reforms
implemented prior to the fall term and allow for the possible identification of additional reforms or
policy changes. It will also allow for the assessment of more comprehensive measures of student
success including: year-to-year persistence, graduation rates, transfer rates and employment
outcomes. This research should also include regular, meaningful analysis of student learning
outcomes in affected courses and expand qualitative data collection to include advisors and relevant
support staff, as well as faculty.
The task force model of research, including faculty representatives, has been effective and would be
beneficial to continue.
Aligned with Findings 4, 9 and 10


