The European Agency for the Evaluation of Medicinal Products Evaluation of Medicines for Veterinary Use Public 7 Westferry Circus, Canary Wharf, London E14 4HB, UK Switchboard: (+44-171) 418 8400 Fax: (+44-171) 418 8447 E_Mail: [email protected]http://www.eudra.org/emea.html EMEA 2000 Reproduction and/or distribution of this document is authorised for non commercial purposes only provided the EMEA is acknowledged EMEA/CVMP/473/98-FINAL COMMITTEE FOR VETERINARY MEDICINAL PRODUCTS NOTE FOR GUIDANCE FOR THE DETERMINATION OF WITHDRAWAL PERIODS FOR MILK RELEASED FOR CONSULTATION BY CVMP DECEMBER 1998 TRANSMISSION TO INTERESTED PARTIES DECEMBER 1998 COMMENTS REQUESTED BY 1 JULY 1999 REVISION AGREED BY SWP-V 18 FEBRUARY 2000 ADOPTION BY CVMP 8 MARCH 2000 DATE OF ENTERING INTO EXISTANCE 8 SEPTEMBER 2000
Transcript
The European Agency for the Evaluation of Medicinal ProductsEvaluation of Medicines for Veterinary Use
Public 7 Westferry Circus, Canary Wharf, London E14 4HB, UKSwitchboard: (+44-171) 418 8400 Fax: (+44-171) 418 8447
Reproduction and/or distribution of this document is authorised for non commercial purposes only provided the EMEA is acknowledged
EMEA/CVMP/473/98-FINAL
COMMITTEE FOR VETERINARY MEDICINAL PRODUCTS
NOTE FOR GUIDANCE FOR THE DETERMINATION
OF WITHDRAWAL PERIODS FOR MILK
RELEASED FOR CONSULTATION BY CVMP DECEMBER 1998
TRANSMISSION TO INTERESTED PARTIES DECEMBER 1998
COMMENTS REQUESTED BY 1 JULY 1999
REVISION AGREED BY SWP-V 18 FEBRUARY 2000
ADOPTION BY CVMP 8 MARCH 2000
DATE OF ENTERING INTO EXISTANCE 8 SEPTEMBER 2000
EMEA/CVMP/473/98-FINAL EMEA 2000 2/26
CONTENTS
1. INTRODUCTION
2. HARMONISED METHOD FOR THE DETERMINATION OFWITHDRAWAL PERIODS FOR MILK IN THE EUROPEAN UNION2.1 Definitions and basic principles
2.1.1 Definition of "withdrawal period for milk"2.1.2 Milking interval in the experiment, and unit in which the withdrawal period
for milk should be expressed2.1.3 Sampling protocol2.1.4 Tolerance vs prediction limits2.1.5 95 % vs 99 % tolerance limits2.1.6 Parametric vs non-parametric tolerance limits2.1.7 Selection of animals in experiments2.1.8 Time of last administration2.1.9 Shortest possible withdrawal period2.1.10 Withdrawal periods for intramammary products
2.2 Full description of the Time-To-Safe-Concentration (TTSC) method
ANNEX I: COMPARISON OF SEVERAL APPROACHES FOR ESTABLISHINGMILK WITHDRAWAL PERIODS
I.1 IntroductionI.2 SCLR method: Safe concentrations, based on linear regression, and allowing for
measurements below the limit of quantification (LOQ)I.3 SCPM method: Safe concentrations, based on data per time point, allowing for
data below the limit of quantificationI.4 TTSC method: Based on times-to-safe-concentrationI.5 Discussion of results
I.5.1 Safe concentration from linear regression (SCLR) approachI.5.1.1 LinearityI.5.1.2 Data below the limit of quantification
I.5.2 Safe concentration per milking (SCPM) approachI.5.3 Time-to-safe-concentration (TTSC) approach
ANNEX II: EXAMPLE OF THE TTSC APPROACH
ANNEX III: REFERENCES
EMEA/CVMP/473/98-FINAL EMEA 2000 3/26
1. INTRODUCTION
For the establishment of withdrawal periods for milk currently different methods are available andused by Member States. A harmonised method has now been developed for decentralised applicationsfor marketing authorisations, as well as for centralised procedures, in order to facilitate thatharmonised milk withdrawal periods can be fixed in EU Member States.
In general, it is acknowledged that paragraphs 1 to 7 of the Committee for Veterinary MedicinalProducts (CVMP) Note for Guidance Approach towards Harmonisation of Withdrawal Periods(EMEA/CVMP/036/95-FINAL) [1] are also applicable in the case of milk withdrawal periods.However, because the character of milk depletion data and the statistical aspects of calculations withthese data differ from those of meat residue data, a separate methodological approach was necessary.
A harmonised method should fulfil the following criteria:
• It should provide safe withdrawal periods, derived from the depletion data in a scientificallyjustified way.
• It should be applicable for most, if not all, realistic data sets, which meet certain reasonable andfeasible minimal criteria.
• It should enable Member States to establish equal withdrawal periods if depletion data areidentical.
• Its use and application should be transparent
• The information necessary to apply the method should be made generally available.
The harmonised method for the determination of withdrawal periods for milk is the Time To SafeConcentration (TTSC) method. With the TTSC method (fully described in 2.2) tolerance limits on thenumber of milkings per animal - necessary for the residue concentration in the milk of most animals toreach the safe concentration (i.e. the Maximum Residue Limit or MRL) - are calculated. The describedmethod is a modified version of a previously published method [2]. The harmonised method assumes alog-normal distribution (of individual times to safe concentration), it corrects by monotonic regressionfor increasing concentrations found during the depletion phase, and in a second monotonic regressionstep it smoothes the relation between MRL and resulting withdrawal period. In accordance with theposition already taken with respect to the calculation of withdrawal periods for meat [1], it isrecommended to calculate the withdrawal period as the 95/95 tolerance limit, i.e. the upper 95%confidence limit of the 95th percentile of the population.
In a preliminary comparative study the method was found to be applicable in the largest number ofrealistic cases and resulted in withdrawal periods comparable to (or slightly longer than) thoseresulting from other tested methods (i.e. in cases where those methods were applicable). As the TTSCmethod is also applicable if many concentrations are below the limit of quantification, if depletion isnon-linear and if variability is heterogeneous, it may be expected that it will be applicable for mostdata sets. Preliminary test results showed that the assumption of log-normality and inclusion ofmonotonic regression in case of increasing concentrations during depletion gave satisfactory resultswith most of the tested data sets.
The harmonised method laid down in this guideline is applicable to new products. It is recognised thatsome data sets may not lend themselves to statistical analysis and, in accordance with the positionalready taken with respect to the calculation of withdrawal periods for meat [1], in those cases astatistical approach other than the harmonised method may be acceptable, but only on the conditionthat the applicant provides data which adequately show that the proposed alternative is moreappropriate than the harmonised method. On these occasions it can be considered appropriate toextend the calculated withdrawal period with an additional safety factor.
EMEA/CVMP/473/98-FINAL EMEA 2000 4/26
2. HARMONISED METHOD FOR THE DETERMINATION OF WITHDRAWAL PERIODS FOR MILK IN THE EUROPEAN UNION
2.1 Definitions and basic principles2.1.1 Definition of "withdrawal period for milk"
The definition given in Council Directive 81/851/EEC [3] shall apply: "The withdrawal period isdefined as the interval between the last administration of a veterinary medicinal product to animalsunder normal conditions of use and the production of foodstuff from such animals to ensure that suchfoodstuffs do not contain residues in quantities in excess of the maximum residue limits laid down"(Maximum residue limits established according to Council Regulation (EEC) No 2377/90 [4]). Forexample, a milk withdrawal period of 108 hours means that all the milk up to and including the lastmilking before 108 hours after treatment must be discarded. Depending on the time of treatment in a12-hours milking cycle the last milk to be discarded may be from the milking at any time point at orafter 96 hours after treatment but earlier than 108 hours after treatment. In this example milk from thefirst milking at or after 108 hours is considered safe. Similarly, a milk withdrawal period of 12 hoursmeans that all milkings within a 12 hour period from the last treatment must be discarded and onlymilk taken at or after 12 hours is considered safe.
2.1.2 Milking interval in the experiment, and unit in which the withdrawal period for milkshould be expressed
The withdrawal period for milk is initially calculated in milkings and rounded up to the first higherfull number of milkings. Since the predominant milking scheme is twice a day, experiments for thedetermination of withdrawal periods for milk should be carried out with animals milked twice a day.For reasons of consistency, between milking intervals of 12 hours are to be preferred. However,because a different milking frequency can be used in practice, the final unit of the milk withdrawalperiod should be real time. For this reason, the final withdrawal period is rounded up to multiples of12 hours or whole days and expressed in hours or days, respectively. If there are indications that thisprocedure does not provide appropriate withdrawal periods for animals milked according to othermilking schemes, data from residue experiments with animals milked according to such other schemesmight be of interest.
2.1.3 Sampling protocol
Withdrawal periods in the European Union, for all milk producing species, are established forindividual animals and not for tank milk because milk from individual or few animals is used forconsumption and for small-scale production of dairy products on farm level. Furthermore, too manyassumptions are needed to calculate withdrawal periods for tank milk: the number of animals and thefraction of treated animals is variable and therefore assumptions of fixed numbers of animals introducerisks of underestimating withdrawal periods.
It is recommended that, for each time point, one pooled sample, taken according to the current IDFStandard 50 [5], from all quarters is taken from each animal.
2.1.4 Tolerance vs. prediction limits
A tolerance limit gives 100q % confidence that at least 100p % of the individuals in a population isbelow that limit. At the prediction limit we expect that 100p % of the individuals in a population isbelow that limit. Consequently 95 % tolerance limits give more protection against incorrect resultsthan 95 % prediction limits. It has been claimed that 99 % prediction limits would give similar resultsas 95 % tolerance limits [6], but this result has no general validity, and Chester et al. [2] noted thatwith the TTSC approach the 99 % prediction limit consistently did not maintain its designedcharacteristics. It has also been shown that prediction limits behave very strangely with severe
EMEA/CVMP/473/98-FINAL EMEA 2000 5/26
extrapolation due to the skewness of the underlying coverage distribution [7]. Based on these findingsit is concluded that tolerance limits are preferable to prediction limits.
2.1.5 95 % vs 99 % tolerance limits
The EMEA/CVMP approach [1] for tissue has adopted 95 % tolerance limits (with 95 % confidencelevel). The choice between 95 % and 99 % tolerance limits should first of all be made by theresponsible authorities based on risk management decisions. Nevertheless, the following statisticaltruth should be borne in mind: the higher the chosen percentile, the more statistical units (animals) willbe needed in experiments to establish waiting time with sufficient accuracy. In general, samples froma population allow better inference for statistics concerning the central part of the distribution (e.g.median, quartiles, 95 % percentiles) than for statistics in the tails of the distribution (e.g. 99 %percentiles).
2.1.6 Parametric vs. non-parametric tolerance limits
Ideally an approach for establishing withdrawal periods should make as few as possible statisticalassumptions. In the approaches described in Annex I of this guideline the form of the statisticaldistribution is assumed to be known: log-normal for concentrations in the SCLR (Safe Concentration-Linear Regression) and SCPM (Safe Concentration Per Milking) approaches, and log-normal, normalor Weibull in the respective variations of the TTSC approach. Especially in the TTSC case there is nounderlying theory which predicts the type of distribution: the choice made is empirical (over manydata sets; data sets are too small too allow a separate choice for each data set). This prompts thequestion whether it would not be preferable to apply non-parametric (also called distribution-free)methods. Of course, not to use a distributional assumption when actually it is true, will lead to loss ofpower, and therefore longer withdrawal periods.
Non-parametric tolerance limits are based on order statistics, which means that the tolerance limit isjust one of the original observations in the sample (e.g. the highest, or the next-highest observation).Non-parametric tolerance limits are not exact, because a choice has to be made from a finite set ofvalues. Conservative non-parametric 100p % tolerance limits provide a confidence level of at least100q %. This can only be achieved for a certain minimal sample size, which can be calculated as n ≥ln(1-q) / ln(p) (see e.g. [9], p. 93). Therefore, with confidence level q=0.95, we will need at least 59observations (animals) for a 95 % non-parametric tolerance limit, and no less than 299 observations(animals) for a 99 % non-parametric tolerance limit. It is clear that the number of animals that can beincluded in depletion experiments in practice will be too small to use non-parametric methods, andtherefore one has to rely on the distributional assumptions of parametric methods.
2.1.7 Selection of animals in experiments
From a statistical perspective, a sample size n=19 is the very minimum to allow empirical estimates ofa 95 % percentile. A smaller sample size (i.e. number of animals) amounts to the use of extrapolationin the coverage. A sample size larger than 19 is advisable to give the desired confidence level (95 %)at least some empirical basis (n=59 would be necessary to allow a completely non-parametricapproach, see 2.1.6).
With respect to stratification, it has been suggested to include both high yielding cattle at an earlystage of lactation, and low yielding cattle at a late stage of lactation in a residue depletion study. Thisshould guarantee that at least some of the between animal variability is included in the study.However, this is only a partial solution to the problem of how to take inter animal variability intoaccount since, for instance, differences in races or food regimes may be important as stratifyingfactors, too. Therefore it seems best not to prescribe stratification, but only to require a representativesample from the relevant population of animals. Selection of animals should be made with attentionfor at least those factors, which are known to be important, such as milk yield. In a representativesample the inter animal variability will be an honest estimate of the inter animal variability in the
EMEA/CVMP/473/98-FINAL EMEA 2000 6/26
population. The inter animal variability in the study now is artificial; therefore the 95 % percentile,which is central in the statistical approach, now refers to an artificial population of animals. Inprinciple, this can be corrected, if the true proportion of high/low yielding animals in the completepopulation of cows would be known.
Therefore, a sufficient number of animals (minimum number: n = 19) should be sampled. It isimportant that also a representative sample of animals should be taken from the relevant targetpopulation (i.e. the distribution of milk yields should be realistic, the animals should be kept undernormal zootechnical conditions).
2.1.8 Time of last administration
A withdrawal period is actually a discrete variable. The milk from two subsequent milkings may beunsafe and safe, respectively, and it is not sensible to define safety at intermediate time points. It isrecommended that, in depletion studies, the last administration of the compound shall be 12 hours (onemilking period) before milking 1. If this condition is not met, the data from milking 1 should bediscarded, because there is no suitable model or data for within milking cycle kinetics. In general, milkcollected in a 12 hours milking scheme, but less than 12 hours after treatment will be a mixture fromthe periods before and after treatment, and may therefore have a lower concentration than milkcollected 12 hours after treatment. Consequently, the lowest possible withdrawal period for generaluse is the time of the first milking at or after one full milking period.
2.1.9 Shortest possible withdrawal period
In some cases all milk residue concentrations may be below or at the MRL from the first milking aftertreatment on. In this case the harmonised TTSC method cannot be used (because there is no variabilityin times to safe concentration). If a sufficiently large proportion of the concentrations is between theLOQ and MRL, the data might still be processed statistically, e.g. by calculation of the tolerance limitfor the first milking (see annex 1: SCPM method). If a withdrawal period of 1 milking results from anexperiment with an interval of 12 hours between the treatment and the first milking, the withdrawalperiod should thus be 12 hours. If most or all residue concentrations are below the LOQ, nomeaningful calculation of a 95/95 tolerance limit is possible (unless n≥59, see 2.1.6), and, providedthat the LOQ is sufficiently below or equal to the MRL, it is acceptable to establish a withdrawalperiod of 12 hours.
Note that a withdrawal period of 12 hours means that no milk at all has to be discarded if a singletreatment is given just after a milking and 12 hours before the next milking. However, in a settingwhere usual milking is more frequent (e.g. 3 times per day, or at the animal’s choice by a milk robot),milking during the first 12 hours should be avoided or the milk discarded.
The only way to obtain withdrawal periods shorter than the standard milking interval (12 hours) is toconduct residue experiments with a shorter interval between 0th milking/last treatment and firstmilking.
2.1.10 Withdrawal periods for intramammary products
In experiments for the establishment of withdrawal periods for products intended for intramammarytreatment at drying off, all quarters should be treated, i.e. normally four quarters in bovine. Although,in practice, it is unlikely that all quarters will be treated with a product for intramammary treatmentduring lactation at the same time, this should however be done in a residue study to represent a worstcase situation.
For products intended for intramammary treatment at drying off, the principles laid down in this notefor guidance are applicable. Statistical methods should be applied on the residue concentrations foundin the milk after birth . However, the variation in the length of the dry period may cause a largevariability between animals. Therefore, the experiment should be designed in such a way that a
EMEA/CVMP/473/98-FINAL EMEA 2000 7/26
sufficient number of animals give birth in a limited time interval. For instance, if an applicant wishesto establish a withdrawal period for cows calving 30 days after treatment, data are needed from at least19 cows calving between e.g. 20 and 30 days after treatment. However, if the applicant wishes toestablish a withdrawal period for animals calving after the more common dry period of 60 days, dataare needed from at least 19 cows calving before 60 days after administration, e.g. between 40 and 60days after treatment.
The applicant should try to keep the differences between dry periods between animals within theexperiment as small as possible, in order to keep the variability as small as possible. This can , forinstance, be done by drying-off and infusing animals with the formulation when they are at thetargeted number of days from the expected date of giving birth, provided that appropriateconsideration is given to animal welfare issues.
Since the differences in residue concentrations between animals which differ little in length of dryperiod are often in the same order of magnitude as the relatively large differences found alreadybetween animals with equal dry periods, differences between animals with slightly differing length ofdry period may not add too much to the large inter-individual differences which are unavoidableanyway. This pragmatic approach may be reconsidered after a sufficient number of genuine data setshave been evaluated.
2.2 Full description of the Time-To-Safe-Concentration (TTSC) method
The Time-To-Safe-Concentration (TTSC) method calculates a tolerance limit on the number ofmilkings per animal. This tolerance limit is the time necessary for the residue concentration in the milkof most animals to reach the safe concentration (i.e. the Maximum Residue Limit or MRL). Themethod assumes a log-normal distribution (of individual times to safe concentration), it corrects bymonotonic regression for increasing concentrations found during the depletion phase, and in a secondmonotonic regression step it smoothes the relation between MRL and resulting withdrawal period. Thewithdrawal period is calculated as the 95/95 tolerance limit, i.e. the upper 95% confidence limit of the95th percentile of the population of individual times to safe concentration. This section gives a fullstepwise description of the calculations of the method.
For the purpose of statistical analysis, true milk withdrawal period is interpreted here as the timeperiod from the time of last administration to the time point at and where after 95 % of the populationof interest has residue levels not higher than the maximum residue limit (MRL). The population ofinterest is taken to be all individual animals, which could potentially be treated with the medicinalproduct.
In general the true milk withdrawal period is unknown. It has therefore to be estimated from empiricaldata from representative treated animals. The estimated milk withdrawal period (WP) is chosen suchthat there is at least 95 % confidence (under the model assumptions) that the true withdrawal period isnot higher than the estimated withdrawal period. Such estimators are known as tolerance limits. Atheoretical comparison with other type of estimators (prediction limits, expected percentiles) has beenmade for the tissue case, and is available on request [7].
The described approach is a modification and extension of the method described in [2]. In its simplestform one takes, for each animal, the first time point where the measured concentration is at or belowMRL, and stays below MRL at later times. This time point is labelled the time-to-safe-concentration(TTSC). With replicate measurements on each milk sample geometric mean concentrations are used inthis step. The resulting set of TTSC points is then used to calculate a tolerance limit. A critical issuewith this method is the choice of distributional assumption for the TTSC points. Chester et al. [2]assume a normal distribution. In the harmonised method described here TTSC points are assumed toarise from a log-normal distribution, which has been shown to be a better fit for a number of real datasets from industrial practice (see Annex I.5.3.1).
The method contains a pre-processing step in which monotonic regression is applied to the logconcentration data versus time. This least squares procedure replaces the data values of each animal byfitted values under the only condition that these fitted values should be non-increasing with time. This
EMEA/CVMP/473/98-FINAL EMEA 2000 8/26
step incorporates the prior knowledge that during the depletion period residue concentrations aredecreasing. This pre-processing step removes the influence of variability due to incidental increases inmeasured values during the depletion phase.
The method also contains a post-processing step in which monotonic regression is applied topreliminary estimates of withdrawal period as a function of MRL considered as a variable. Using oneand the same data set, it is reasonable to expect a longer (or equal) withdrawal period when the MRLwould be lowered (and vice versa). However, due to statistical fluctuations, this is not guaranteed withthe TTSC method as described so far. Therefore an additional monotonic regression is applied toobtain such a relation.
The TTSC method consists of the steps described below. An example, using the calculations describedin this chapter, can be found in annex II. A computer program, assisting in the calculations laid downin this guideline, is available from EMEA upon request.
Step 1. Notation and censoring indicator
Data should be available for a representative sample of n animals, with n≥19. Suppose there are datafrom J milkings per animal, and K replicated measurements on each milk sample (in practice, K willoften equal 1). Let cijk denote the k'th measured concentration in a milk sample from animal i andmilking j.
Some of the concentrations may be given as '<LIM', where LIM is just the lower limit for reporting anumerical value. In practice, the limit of quantification (LOQ) is often used. Also in this paper 'theLOQ' is used to denote the reporting limit, but we assume no statistical properties of the LOQ. MRLdenotes the maximum residue limit for the marker residue.
In order to distinguish measured real values from results reported as ‘below LOQ’ a censoringindicator variable z is constructed as follows:
zijk = 0 if cijk ≥ LOQ
zijk = 1 if cijk < LOQ
Measured concentrations cijk < LOQ are temporarily replaced by LOQ (this is for the datapreprocessing in steps 2 and 3 only). Note that values equal to LOQ may have zijk=0 or zijk=1 at thispoint.
Step 2. Logarithmic transformation of concentrations and means of replicate measurements
Natural logarithms of the concentrations are taken:
yijk = ln(cijk)
If there are K>1 replicate measurements on any milk sample, y is averaged over the last index:
yij = ΣKk=1 yijk / K
EMEA/CVMP/473/98-FINAL EMEA 2000 9/26
The geometric mean concentration of milk sample ij is
cij = eyij
The censoring indicator for sample ij is
zij = mink (zijk)
i.e. the measurement on milk sample ij is considered to be below the LOQ only if all measurements onthat sample are below the LOQ. If any measurement on this sample is uncensored, the conservative(high) concentration estimate cij is used in the following as a real measurement
Step 3.. Monotonic regression concentration vs. time
For each animal i separately, a set of non-increasing log-concentration values is obtained bymonotonic regression. Monotonic regression does not change the data unless they are in the wrongorder: during the depletion phase we expect concentrations decreasing with time, therefore onlyconcentrations at time periods showing an increase with time will be changed. Basically, log-concentration values in the wrong order (a high value following a low value) are replaced with theiraverage. When more than two values are out of order, new values can be found from an easy iterativealgorithm. Start with weights wj=1 for all time points j. Then, for any adjacent pair (j,j+1) withincreasing concentration values (yij<yi,j+1), replace the pair by one value, the weighted average
(wjyij+wkyi,j+1)/(wj+wj+1)
and set the new weight equal to wj+wj+1. Repeat this procedure until the resulting averages per animaldo not show increases in concentration over time. The new averages then replace the values yij in thefollowing steps. Average values are valid for each of the underlying time points. For more informationsee e.g. [10].
The censoring indicator zij is set to 0 if a value yij=LOQ is replaced by a higher value in the monotonicregression. This will happen when censored observations are followed by values above the LOQ.
Step 4. Set values for graphical display of data below the limit of quantification
For samples with zij=1, the concentrations cij are set to 21 of the LOQ, and the log-concentrations yij to
ln ( 21 LOQ). This is done for graphical purposes only, so that censored observations are shown in
plots as points below the LOQ line. This step has no influence on the estimation of withdrawal periodin steps 5-10.
EMEA/CVMP/473/98-FINAL EMEA 2000 10/26
Step 5. Calculate times to safe concentration
For each animal i identify the first time point tj (in milkings) with cij≤MRL and cik≤MRL for all k>j.This time point is labelled the time-to-safe-concentration for animal i, and is denoted TTSCi.
Note: if the last concentration in the data set is still above MRL, TTSCi cannot be calculated. In thatcase the TTSC method is not applicable to the data set.
Step 6. Change to logarithmic scale
Calculate for each animal i the natural logarithm of the time to safe concentration:
xi = ln(TTSCi)
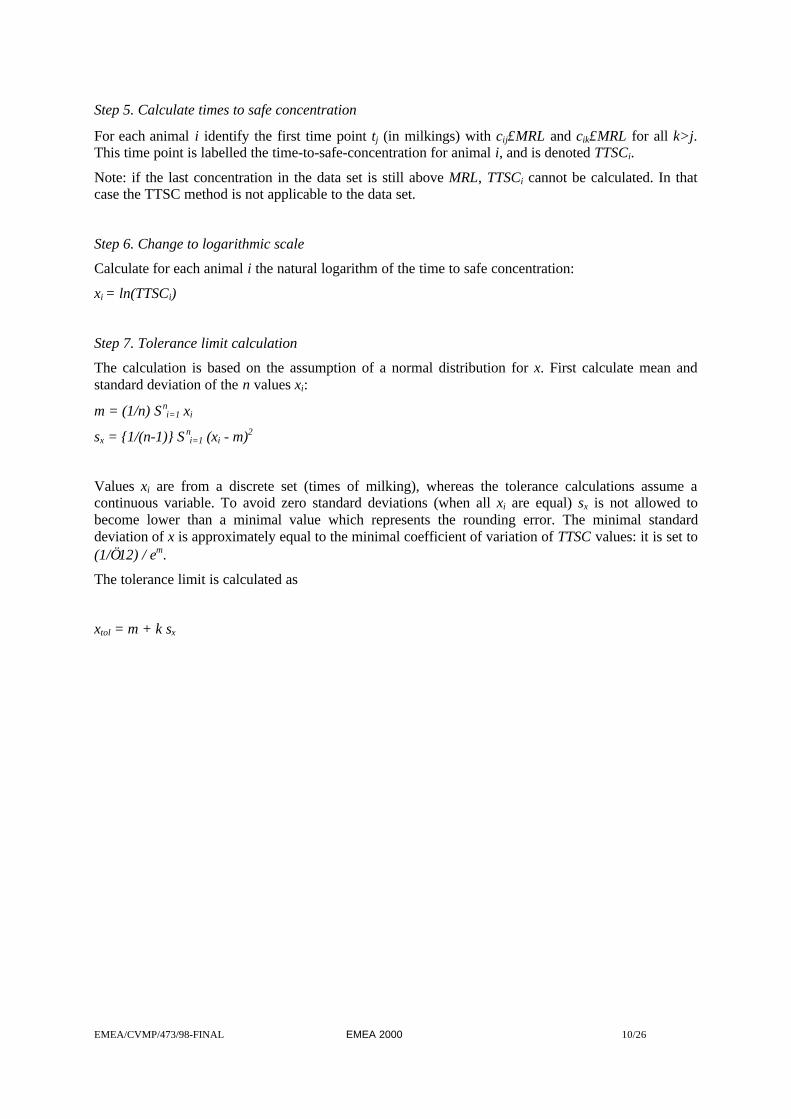
Step 7. Tolerance limit calculation
The calculation is based on the assumption of a normal distribution for x. First calculate mean andstandard deviation of the n values xi:
m = (1/n) Σni=1 xi
sx = {1/(n-1)} Σni=1 (xi - m)2
Values xi are from a discrete set (times of milking), whereas the tolerance calculations assume acontinuous variable. To avoid zero standard deviations (when all xi are equal) sx is not allowed tobecome lower than a minimal value which represents the rounding error. The minimal standarddeviation of x is approximately equal to the minimal coefficient of variation of TTSC values: it is set to(1/√12) / em.
The tolerance limit is calculated as
xtol = m + k sx
EMEA/CVMP/473/98-FINAL EMEA 2000 11/26
where the tolerance limit factor k for a 95/95 tolerance limit and a specific value of n can be found inTable 11.
Table 1. One-sided tolerance limit factors k
for standard 95/95 tolerance limit calculations (p=0.95;1-α=0.95). Data from [13], and calculated
The tolerance limit is converted to an un-rounded withdrawal period (UWP) at the ordinary time scale(in milkings):
UWP = extol
1 More generally k can be calculated as k = t'n-1(1-α;δ) /√n, where t'n-1(1-α;δ) is the 100(1-α) percentile of thenon-central t distribution with n-1 degrees of freedom and non-centrality parameter δ = zp√n. In the latterexpression zp is the 100pth percentile in the standard normal distribution (e.g. z0.95=1.645). A standard referencefor the non-central t distribution is [11]. Standard algorithms are available for calculating cumulativeprobabilities in the non-central t distribution, for example algorithm AS5 in the Applied Statistics collectionavailable in STATLIB on the Internet, and described in [12]. Percentiles of the non-central t distribution can becalculated by applying a simple search algorithm to the algorithm of AS5, e.g. consisting of a fixed-step searchplus a bisection search. Approximative formulas to calculate tolerance limits exist, see e.g. CVMP Note forguidance on withdrawal periods in tissues [1] on tissue withdrawal periods.
EMEA/CVMP/473/98-FINAL EMEA 2000 12/26
Step 9. Monotonic regression on UWP vs. MRL relation
Calculations of step 5-8 are repeated for a range of MRL values. In principle, all MRL values in therange of the data are investigated. In practice, it is sufficient to calculate UWP for the real MRL, andfor MRL values equal to all concentration values in the data set (with the exception of MRL values thatare too low to allow all animals to arrive at a safe concentration at the last time point).
A monotonic regression is applied to the resulting set of (MRL,UWP) pairs. If the UWP values arearranged according to increasing MRL values using an index j, then the fitted values from monotonicregression (MUWPj) are calculated by iterated weighted averaging of pairs where UWP increases withMRL. Start with MUWPj=UWPj and weights wj=1, for all j. Then, for any adjacent pair (j,j+1) withMUWPj<MUWPj+1, replace the pair by one value, the weighted average
(wjMUWPj+wj+1MUWPj+1)/(wj+wj+1)
and set the new weight equal to wj+wj+1. Repeat this procedure until the resulting averages satisfy theimposed negative relation between MRL and MUWP. The resulting weighted averages are valid for allunderlying MRL values.
Step 10. Calculate withdrawal period
Finally, the MUWP value corresponding to the real MRL is rounded upward to an integer number ofmilkings. This should be converted to the withdrawal period in real time.
WP = (∆t) int (MUWP+1)
where ∆t is the interval in hours between milkings in the experiments (e.g. 12 hours).
See Annex II for an example of the application of this procedure.
EMEA/CVMP/473/98-FINAL EMEA 2000 13/26
ANNEX I: COMPARISON OF SEVERAL APPROACHES FOR ESTABLISHING MILK
WITHDRAWAL PERIODS
I.1 Introduction
The point of departure was to examine the linear regression method developed by the US Food andDrug Administration (FDA) for its suitability to be used in the EU. However, as this method hadcertain characteristics which made it difficult to be applied in the European situation (in the Europeansituation e.g. withdrawal periods are established for individual animals, the data sets are often notsuited for linear regression, and usually no data are available on intra-individual variability), andbecause recent developments in statistical science should be taken into account, a modification of theFDA method and alternatives for this method were investigated. The FEDESA ad hoc Working Partyon Harmonisation of Withdrawal Periods provided useful additional information with regard tosuitable alternatives and data sets to test the different methods.
The methods were applied to eleven real data sets (not shown here due to confidentiality), and theresults were evaluated to select the most appropriate method. The results were compared with eachother and with results achieved by applying two so-called "simple" methods as used at present indifferent Member States (i.e., first milking with all concentrations below MRL, and the first milkingwith all concentrations below MRL plus a "safety span". A detailed description of these methods liesbeyond the scope of this Note for Guidance).
I.2 SCLR method: Safe concentrations, based on linear regression, and allowing formeasurements below the limit of quantification (LOQ)
This is a modification of the FDA method [8,14]. In principle the method fits a regression line to thelog concentration data of each cow. The fitted lines are used to estimate the distribution of logconcentrations at each time point. Estimates are made of between-animal variance and of measurementerror variability, and these are then used to calculate a log concentration tolerance limit at each timepoint. The estimated withdrawal period is the first time point where the tolerance limit is at or belowthe MRL. Referral is made to the FDA guideline for computational details.
The method used here deviates from the FDA method on the following points:
• All animals used in the withdrawal time calculation are assumed to have been treated (FDAassumes that if the product is used to treat mastitis, no more than one-third of the milk comesfrom treated animals).
• No requirement for the number of animals (FDA requires at least 20 animals).
• No requirement for the number of replicate analyses per milk samples (FDA requires triplicateassays). When no replicate measurements were available an external estimate of assay variancewas used.
• Regression lines are calculated by maximising the combined normal likelihood of values at orabove the LOQ and measurements reported as 'below the LOQ' (FDA excludes the lattermeasurements as well as other data from time points with less than three remaining values). Thelikelihood to be optimised has the form
where yi is the log concentration of animal/time combination i, yLOQ is the natural logarithm ofthe LOQ, A is the set of values {i; yi≥yLOQ} and B is the set of censored values {i; yi<yLOQ}. ß0
and ß1 are the regression line slope and intercept, and σ is the residual standard error. Φ denotesthe cumulative standard normal distribution.
EMEA/CVMP/473/98-FINAL EMEA 2000 14/26
• No checks on log-linearity (FDA prescribes lack-of-fit F tests per animal to select points to beused for subsequent calculations).
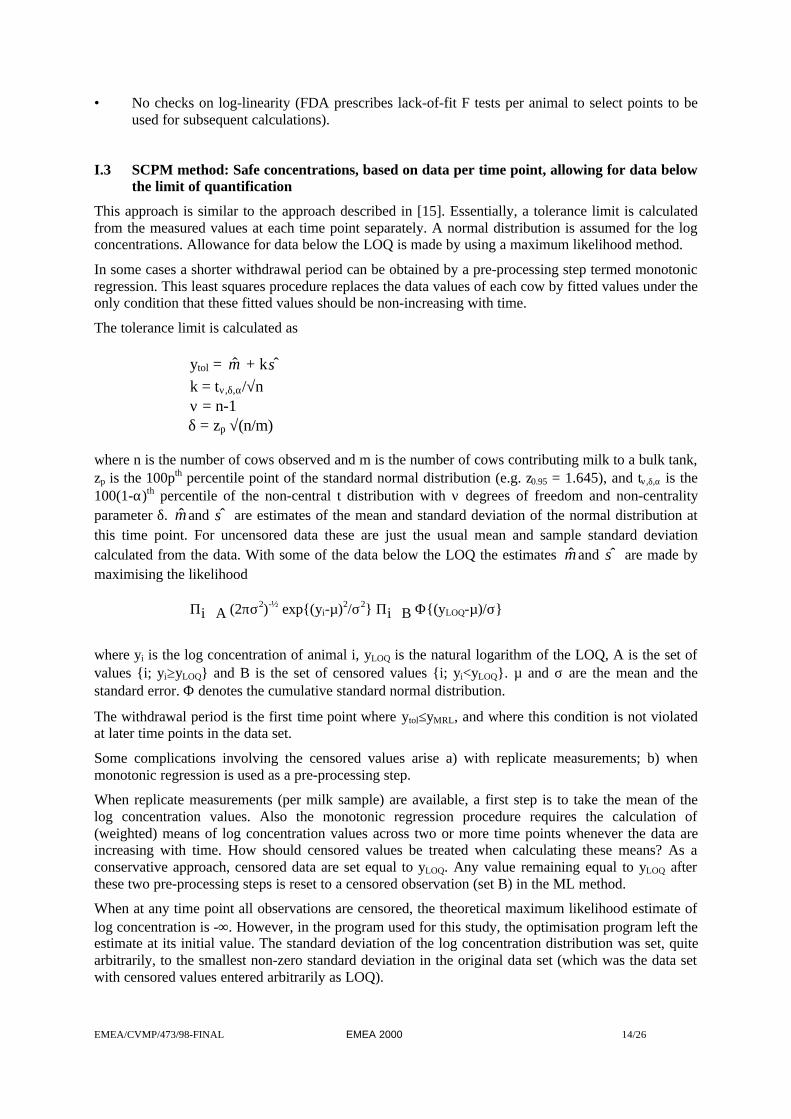
I.3 SCPM method: Safe concentrations, based on data per time point, allowing for data belowthe limit of quantification
This approach is similar to the approach described in [15]. Essentially, a tolerance limit is calculatedfrom the measured values at each time point separately. A normal distribution is assumed for the logconcentrations. Allowance for data below the LOQ is made by using a maximum likelihood method.
In some cases a shorter withdrawal period can be obtained by a pre-processing step termed monotonicregression. This least squares procedure replaces the data values of each cow by fitted values under theonly condition that these fitted values should be non-increasing with time.
The tolerance limit is calculated as
ytol = µ̂ + kσ̂k = tν,δ,α/√nν = n-1δ = zp √(n/m)
where n is the number of cows observed and m is the number of cows contributing milk to a bulk tank,zp is the 100pth percentile point of the standard normal distribution (e.g. z0.95 = 1.645), and tν,δ,α is the100(1-α)th percentile of the non-central t distribution with ν degrees of freedom and non-centralityparameter δ. µ̂ and σ̂ are estimates of the mean and standard deviation of the normal distribution atthis time point. For uncensored data these are just the usual mean and sample standard deviationcalculated from the data. With some of the data below the LOQ the estimates µ̂ and σ̂ are made bymaximising the likelihood
Πi∈A (2πσ2)-½ exp{(yi-µ)2/σ2} Πi∈B Φ{(yLOQ-µ)/σ}
where yi is the log concentration of animal i, yLOQ is the natural logarithm of the LOQ, A is the set ofvalues {i; yi≥yLOQ} and B is the set of censored values {i; yi<yLOQ}. µ and σ are the mean and thestandard error. Φ denotes the cumulative standard normal distribution.
The withdrawal period is the first time point where ytol≤yMRL, and where this condition is not violatedat later time points in the data set.
Some complications involving the censored values arise a) with replicate measurements; b) whenmonotonic regression is used as a pre-processing step.
When replicate measurements (per milk sample) are available, a first step is to take the mean of thelog concentration values. Also the monotonic regression procedure requires the calculation of(weighted) means of log concentration values across two or more time points whenever the data areincreasing with time. How should censored values be treated when calculating these means? As aconservative approach, censored data are set equal to yLOQ. Any value remaining equal to yLOQ afterthese two pre-processing steps is reset to a censored observation (set B) in the ML method.
When at any time point all observations are censored, the theoretical maximum likelihood estimate oflog concentration is -∞. However, in the program used for this study, the optimisation program left theestimate at its initial value. The standard deviation of the log concentration distribution was set, quitearbitrarily, to the smallest non-zero standard deviation in the original data set (which was the data setwith censored values entered arbitrarily as LOQ).
EMEA/CVMP/473/98-FINAL EMEA 2000 15/26
I.4 TTSC method: Based on times-to-safe-concentration
This is the approach described as the harmonised approach in the main document of this Note forGuidance (chapter 2.2).
I.5 Discussion of results
I.5.1 Safe concentration from linear regression (SCLR) approach
I.5.1.1 LinearityThe main characteristic of the SCLR approach is the assumption of a linear relation between logconcentration and time. If this assumption is sufficiently close to the truth then linear regression givesthe most accurate estimates of log concentration at any time point or of the time to reach a safeconcentration for each cow.
However, the assumption of linearity may fail for the following reasons:
1. There may be need for two (or more) pharmacokinetic compartments in an appropriate model,implying that concentration should be modelled as a sum of exponentials. Although such a modelcould be fitted in principle, in practice the data are often too scarce to allow a proper choicebetween one- or more-component models, or even to fit a more-component model.The practical alternative advocated by the FDA [8] is to use only points in the final linear phase ofthe depletion curves. Lack-of-fit F tests may be used to decide which points to exclude. For thesetests an estimate of 'pure error' variance is needed, either from replicated assays [8] or as externalinformation to be supplied by the applicant.
2. Binding of the substance to e.g. plasma proteins may be relatively higher at low concentrations.This may cause upward deviations from the final log concentration depletion line.
3. Circadian (or other) biorhythms may cause cyclic deviations from the values predicted by the lineardepletion model.
Deleting points to achieve linearity may be sensible in case 1, but does not seem to provide a solutionin cases 2 and 3.Of course, in practice deviations from linearity may be small enough to ignore them.
I.5.1.2 Data below the limit of quantification
There are two problems with the SCLR approach when there are data below the LOQ (known instatistics as censored data):
1. Fitting the regression lines.
Simple approaches are replacement of censored data with 0, 21 LOQ, or LOQ, or deletion of time
points with data <LOQ. The latter approach is advocated in the FDA method. Such methods haveno theoretical basis, and have been found to perform poorly in many studies (see e.g. [16] andreferences therein).
Maximum likelihood estimation (MLE) is a general statistical technique, which can also be usedfor estimating regression functions in the presence of censored data (see e.g. [17,18]). Theapplication of MLE requires the optimisation of a non-linear function, which is easily performed bystandard statistical programs. According to [16] MLE methods are commonly used inenvironmental disciplines such as air quality studies and geochemistry.
Users of MLE methods should be warned that the theory behind MLE is based on large samples.Therefore data sets should not be too small: for small sample sizes (n=5, 10, 15) estimates mayhave large bias and poor precision [16]. The ML estimate of the residual variance (needed in thetolerance limit calculations) will be badly biased when the number of uncensored observations issmall [17].
EMEA/CVMP/473/98-FINAL EMEA 2000 16/26
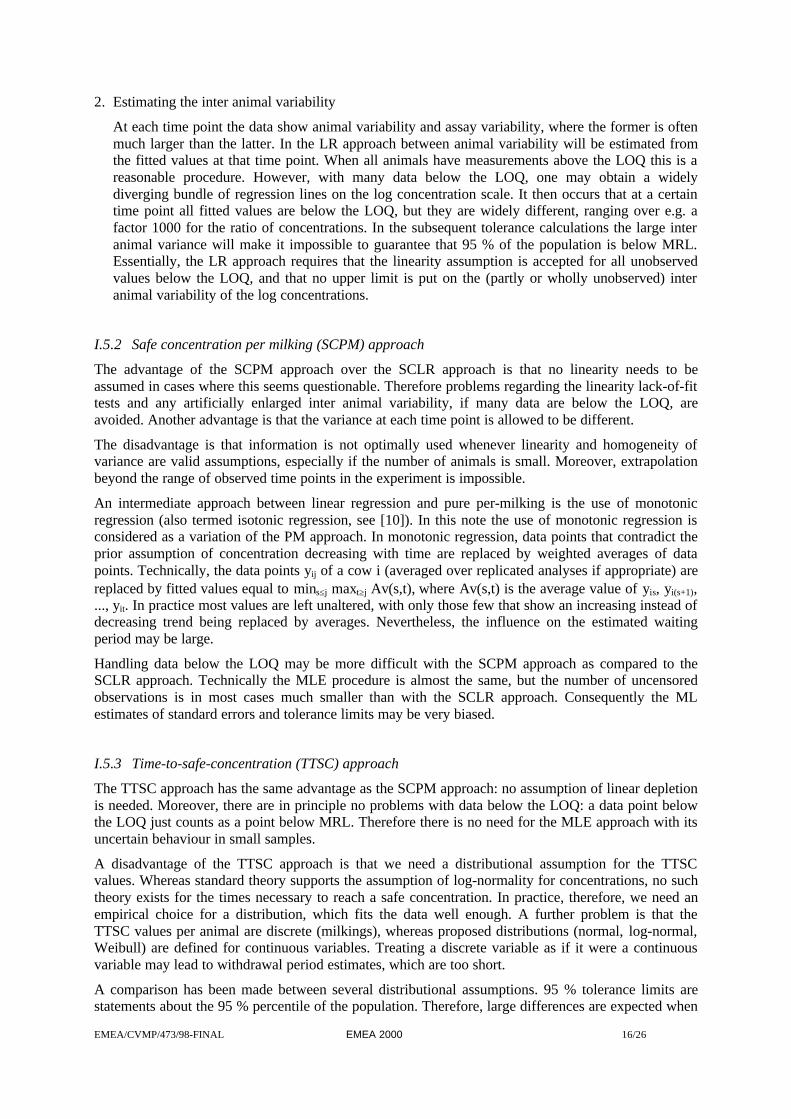
2. Estimating the inter animal variability
At each time point the data show animal variability and assay variability, where the former is oftenmuch larger than the latter. In the LR approach between animal variability will be estimated fromthe fitted values at that time point. When all animals have measurements above the LOQ this is areasonable procedure. However, with many data below the LOQ, one may obtain a widelydiverging bundle of regression lines on the log concentration scale. It then occurs that at a certaintime point all fitted values are below the LOQ, but they are widely different, ranging over e.g. afactor 1000 for the ratio of concentrations. In the subsequent tolerance calculations the large interanimal variance will make it impossible to guarantee that 95 % of the population is below MRL.Essentially, the LR approach requires that the linearity assumption is accepted for all unobservedvalues below the LOQ, and that no upper limit is put on the (partly or wholly unobserved) interanimal variability of the log concentrations.
I.5.2 Safe concentration per milking (SCPM) approach
The advantage of the SCPM approach over the SCLR approach is that no linearity needs to beassumed in cases where this seems questionable. Therefore problems regarding the linearity lack-of-fittests and any artificially enlarged inter animal variability, if many data are below the LOQ, areavoided. Another advantage is that the variance at each time point is allowed to be different.
The disadvantage is that information is not optimally used whenever linearity and homogeneity ofvariance are valid assumptions, especially if the number of animals is small. Moreover, extrapolationbeyond the range of observed time points in the experiment is impossible.
An intermediate approach between linear regression and pure per-milking is the use of monotonicregression (also termed isotonic regression, see [10]). In this note the use of monotonic regression isconsidered as a variation of the PM approach. In monotonic regression, data points that contradict theprior assumption of concentration decreasing with time are replaced by weighted averages of datapoints. Technically, the data points yij of a cow i (averaged over replicated analyses if appropriate) arereplaced by fitted values equal to mins≤j maxt≥j Av(s,t), where Av(s,t) is the average value of yis, yi(s+1),..., yit. In practice most values are left unaltered, with only those few that show an increasing instead ofdecreasing trend being replaced by averages. Nevertheless, the influence on the estimated waitingperiod may be large.
Handling data below the LOQ may be more difficult with the SCPM approach as compared to theSCLR approach. Technically the MLE procedure is almost the same, but the number of uncensoredobservations is in most cases much smaller than with the SCLR approach. Consequently the MLestimates of standard errors and tolerance limits may be very biased.
I.5.3 Time-to-safe-concentration (TTSC) approach
The TTSC approach has the same advantage as the SCPM approach: no assumption of linear depletionis needed. Moreover, there are in principle no problems with data below the LOQ: a data point belowthe LOQ just counts as a point below MRL. Therefore there is no need for the MLE approach with itsuncertain behaviour in small samples.
A disadvantage of the TTSC approach is that we need a distributional assumption for the TTSCvalues. Whereas standard theory supports the assumption of log-normality for concentrations, no suchtheory exists for the times necessary to reach a safe concentration. In practice, therefore, we need anempirical choice for a distribution, which fits the data well enough. A further problem is that theTTSC values per animal are discrete (milkings), whereas proposed distributions (normal, log-normal,Weibull) are defined for continuous variables. Treating a discrete variable as if it were a continuousvariable may lead to withdrawal period estimates, which are too short.
A comparison has been made between several distributional assumptions. 95 % tolerance limits arestatements about the 95 % percentile of the population. Therefore, large differences are expected when
EMEA/CVMP/473/98-FINAL EMEA 2000 17/26
distributions with the same mean and variance, but different skewness are fitted to some data. Basedon the linear regression model it is expected that TTSC values will show a right-skewed distribution,and this is indeed almost always true. Normal-theory tolerance limits may therefore be expected to betoo low.
Chester et al. (2) propose to use tolerance limit calculations based on a normal distribution anyway.They investigated the performance in the case of normal and non-normal distributions using MonteCarlo simulations from continuous g-and-h distributions [19]. They simulated TTSC values with 95 %percentiles of 5.50, 5.75, 6.00 and 6.25 (milkings), and concluded that the 95 % tolerance limitprovided at least 95 % confidence for all but the most skewed distributions (g=0.6, h=0.3), when thetarget 95 % percentile was 6.25. It may be concluded that in these simulations, where withdrawalperiod was considered as a continuous variable, the downward bias from using normal-theorycalculations was compensated in most cases by the upward bias from using TTSC values roundedupward to whole milkings. It is unclear whether this would also be the case with simulations from adiscrete distribution, or in cases where the withdrawal period is a larger multiple of 12 hours milkingperiods (so that rounding effects are relatively small).
Figure 1. Standardised third moment, ? 3, vs. coefficient of variation, ? , for log logistic, log-normal,gamma and Weibull distributions. Exponential distribution is at point (1,2). Reproducedfrom [20].
For several standard distributions (log-normal, log-logistic, gamma, Weibull) the skewness is afunction of the coefficient of variation only (see Figure 1 reproduced from [20]). In general the
EMEA/CVMP/473/98-FINAL EMEA 2000 18/26
skewness, expressed as the standardised third moment γ3=µ3/s3, increases with the coefficient ofvariation γ=σ/µ. A high value of γ3 implies a relatively long right tail. At a certain coefficient ofvariation the tail of the log-logistic distribution is longer than that of a log-normal distribution, whichin turn is longer than the tail of a gamma distribution. It is noteworthy that the Weibull distribution isactually skewed to the left instead of to the right for coefficients of variation less than approximately30 %. A practical advantage of the log-normal distribution is that calculations remain just as simple asin the case of a normal distribution: one simply works with ln(TTSC) instead of TTSC values.
In an empirical evaluation on real data sets the distributional assumption made a difference for theestablished withdrawal period in most of the data sets. The pattern always was: increasing withdrawalperiods in the order Weibull, normal, log-normal. This is in accordance with theory. Figure 2 showsthe position of 11 real data sets in the plot of standardised third moment against coefficient ofvariation, together with points for data sets of size n=25 simulated from Weibull or log-normaldistributions. The normal distribution (simulations not shown) gives points around a horizontal linewith standardised third moment 0 (symmetric distribution).
Figure 2. Skewness against variability for data sets (stars) and simulations from log-normal(crosses and upper regression line) and Weibull (circles and lower regression line)distributions.
It can be seen that most data sets are more like simulations from a log-normal distribution than from aWeibull distribution. The most deviating data sets are 1, 3 and 9. Data set 1 is a set with just n=6 cows.Data sets 9 and 3 are cases with a short withdrawal period and therefore a large distortion fromrounding to integer values.
EMEA/CVMP/473/98-FINAL EMEA 2000 19/26
ANNEX II: EXAMPLE OF THE TTSC APPROACH
Figure 3 and Table 2 show data for n = 25 animals and 8 milkings (in a 12-hours milking scheme, withthe last treatment 12 hours before the first milking). These artificial data were generated by simulationbased on a real data set. In the simulation normal error was added to linear regression estimates of thelog concentration values in a real data set.
Monotonic regression pre-processing was applied to the example data (see Table 3). Consider forexample the data and graph for cow 1, where the log concentrations of milkings 2 and 3 were averaged( ln(0.402) is the average of ln(0.341) and ln(0.473) ), as well as the log concentrations of milkings 4,5 and 6.
The MRL in this example is 0.1. At the last milking, all cows have a (pre-processed) value not higherthan MRL, therefore the TTSC method can be applied. TTSC values per cow are now calculated, andsummarised in Table 4.
The mean m and standard deviation s of the ln(TTSC) values are 1.556 and 0.2779, respectively. Witha tolerance limit factor k = 2.292 (see Table 1) this leads to a 95/95 tolerance limit of1.556+2.292∗0.2779 = 2.193 on the logarithmic scale, corresponding to e2.193 = 8.962 on the milkinginterval scale.
If the TTSC method would be applied without the last monotonic regression step, the tolerance limit8.962 would be rounded upward to obtain a withdrawal period of 9 milking intervals, or 9×12=108hours.
In the last monotonic regression step of the TTSC method the calculations above are repeated withMRL values chosen over the range of the data. In practice MRL values are chosen equal to allconcentration values where at least one of the TTSC values changes. The resulting set of(MRL,UWP)-pairs is shown in Table 5 and Figure 4, together with fitted UWP values after applyingmonotonic regression. At the true MRL 0.1 the fitted UWP is slightly lower, 8.886 instead of 8.962. Inthis example the resulting withdrawal period of 9 milking intervals is unaltered.
The stabilising effect of the last monotonic regression step can be illustrated by noting the effect onwithdrawal period of changes in MRL. For a real MRL of 0.15 the withdrawal period would remain 9(instead of 8) milking intervals, for a real MRL of 0.20 it would still be 9 (instead of 10) milkingintervals.
Thus, the withdrawal period is fixed at 9×12=108 hours. Milk from milkings at or after 108 hours aftertreatment is considered safe. With a regular 12-hours milking scheme the first safe milk is milk fromthe 9th milking if treatment in practice is given 12 hours before the first milking, and milk from the 10th
milking if treatment is given less than 12 hours before the first milking.
EMEA/CVMP/473/98-FINAL EMEA 2000 20/26
Figure 3. Example data (simulated). Log concentration vs. time (milking). Horizontal lines markMRL=0.1 and LOQ=0.02. Data <LOQ are shown at LOQ.
EMEA/CVMP/473/98-FINAL EMEA 2000 21/26
Table 2. Example data set. 25 animal (rows) and 8 time points(columns). MRL=0.1 and LOQ=0.02. Data below LOQwere entered as 0.01.
Table 5. Un-rounded withdrawal period (UWP) and monotonic fit (MUWP) at varying MRL values. UWP andMUWP values are valid from the tabulated MRL up to the next tabulated MRL value, e.g. MRL=0.20gives UWP=9.044 and MUWP=8.035.
Figure 4. Effect of final monotonic regression to obtain monotonically increasing withdrawal periodsfor decreasing MRLs. Vertical line segments are monotonic fits MUWP replacing calculatedUWP values. Horizontal line indicates the true MRL=0.1 for this example, and intersects theMUWP curve at 8.886, which upon rounding gives a withdrawal period (WP) of 9 milkings.
EMEA/CVMP/473/98-FINAL EMEA 2000 25/26
ANNEX III: REFERENCES
[1] Committee for Veterinary Medicinal Products (1996). Note for Guidance: Approach towardsharmonisation of withdrawal periods. EMEA/CVMP/036/95/FINAL.
[2] Chester, T., Deluyker, H., Aerts, R., Koopman, P. and Davot, J.L. (1996). Furtherconsiderations in setting milk withholding times for antimicrobials. In: Haagsma, N. andRuiter, A (Eds). Residues of veterinary drugs in food. Proceedings of the Euroresidue IIIConference, Veldhoven, 6-8 May 1996, pp 326-330.
[3] Council Directive 81/851/EEC. Official Journal of the European Community No L 317 of 6November 1981.
[4] Council Regulation (EEC) No 2377/90 of 26 June 1990. Official Journal of the EuropeanCommunity No L 224/1 of 18, August 1990.
[5] International Dairy Federation (1985). International IDF Standard 50B: Milk and Milkproducts. Methods of sampling.
[6] Deluyker, H., Chester, S.T., Aerts, R., Van Leemput, L. & Lohuis, J. (1995). Considerations insetting milk withdrawal times for antimicrobials. FEDESA, Rue Defacqz 1, 1050 Brussels,Belgium.
[7] Van der Voet, H. (1991). Some estimators for withdrawal period under the assumption ofnormality. Note HVO-91-13.Wageningen UR Centre for Biometry, P.O. Box 16, 6700 AAWageningen, The Netherlands.
[8] FDA (1994). General principles for evaluating the safety of compounds used in food-producing animals, revised July 1994, U.S. Department of Health and Human Services, PublicHealth Service, Food and Drug Administration, Center for Veterinary Medicine. VI. Guidelinefor establishing a withdrawal period.
[9] Gibbons, R.D. (1994). Statistical methods for groundwater monitoring. Wiley, New York.
[10] Bartholomew, D.J. (1982). Isotonic inference. In: Kotz, S. & Johnson, N.L. (eds.),Encyclopedia of Statistical Sciences, Wiley, New York, pp. 260-265.
[11] Owen, D.B. (1968). A survey of properties and applications of the noncentral t-distribution.Technometrics, 10: 445-478.
[12] Griffiths, P. & Hill, I.D. (eds.) (1985). Applied Statistics algorithms. Ellis Horwood,Chichester.
[14] Silverberg, A.R. (1988). A methodology for establishing a withdrawal period for residues inmilk. Proceedings of the Biopharmaceutical Section, American Statistical Association: 243-248.
[15] Lentz, E.L. and Chung, J. (1995). Determination of sulfadimethoxine withdrawal time frommilk. Part II. statistical assessment. Journal of AOAC International, 78: 371-374.
[16] Helsel, D.R. (1990). Less than obvious: Statistical treatment of data below the detection limit.Environ. Sci. Technol. 24: 1766-1774.
[17] Aitkin, M. (1981). A note on the regression analysis of censored data. Technometrics 23: 161-163.
[18] Wolynetz, M.S. (1979). Algorithm AS 139: Maximum likelihood estimation in a linear modelfrom confined and censored normal data. Applied Statistics 28: 195-206.
EMEA/CVMP/473/98-FINAL EMEA 2000 26/26
[19] Hoaglin, D.C. (1982). g-and-h-distributions. In: Kotz, S. & Johnson, N.L. (eds.), Encyclopediaof Statistical Sciences, Wiley, New York, pp. 298-301.
[20] Cox, D.R. & Oakes, D. (1984). Analysis of survival data. Chapman & Hall, London, pp. 24-28.