1 Guidelines for On Site/ Remote Access -output Background Since January 2004, the ‘Statistics Netherlands Act' is in effect. In addition to this legal obligation it is evident that Statistics Netherlands needs to be seen as completely reliable by the outside world. This is also in the interest of Statistics Netherlands. The responses to surveys depend greatly on the knowledge that individual data will be safe. Who would hand over personal information to an institution that is not extremely careful with the way these data are handled? It is therefore vital that data is well protected. Physical and legal protection is achieved by the secure environments of the On Site / Remote Access (OS/RA) facilities, project agreements and confidentiality statements. In addition, statistical confidentiality measures need to ensure that individual data are never revealed, i.e. that no recognition of a unit will occur and that details of that unit will not be published. The guidelines below are designed to prevent such disclosure. Objective The purpose of these guidelines is to clarify what type of information is allowed to be exported as an OS-/RA- output. This provides guidance to the OS-/RA-researchers and to output inspectors. The growing use of microdata services at Statistics Netherlands and the ongoing professionalisation of the Centre for Policy Related Statistics, make clear guidelines increasingly necessary in order to ensure a good service level of microdata services. Statistics Netherlands Act (translated and abridged) Section 37 The data collected by CBS are solely intended for use in statistical purposes and are not provided to any persons other than those charged with carrying out the duties of the CBS. The data are then published only in a way that no identifiable information about an individual person, household, company or institution can be derived. Section 41 Contrary to the provisions of Section 37 the director general may, on request, provide or grant access to a set of data to a department, organisation or institution as referred to in the second subsection for the purposes of statistical or academic research where appropriate measures have been taken to prevent identification of individual persons, households, companies or institutions from those data. Section 42 The director general shall only grant a request as referred to in Section 41 if the director general considers that the applicant has taken adequate measures to prevent the set of data being used for purposes other than statistical or academic research. (see appendix 3 for the full text)
Transcript
1
Guidelines for On Site/ Remote Access -output
Background Since January 2004, the ‘Statistics Netherlands Act' is in effect.
In addition to this legal obligation it is evident that Statistics Netherlands needs to be seen as completely reliable by the outside world. This is also in the interest of Statistics Netherlands. The responses to surveys depend greatly on the knowledge that individual data will be safe. Who would hand over personal information to an institution that is not extremely careful with the way these data are handled?
It is therefore vital that data is well protected. Physical and legal protection is achieved by the secure environments of the On Site / Remote Access (OS/RA) facilities, project agreements and confidentiality statements. In addition, statistical confidentiality measures need to ensure that individual data are never revealed, i.e. that no recognition of a unit will occur and that details of that unit will not be published. The guidelines below are designed to prevent such disclosure.
Objective The purpose of these guidelines is to clarify what type of information is allowed to be exported as an OS-/RA- output. This provides guidance to the OS-/RA-researchers and to output inspectors.
The growing use of microdata services at Statistics Netherlands and the ongoing professionalisation of the Centre for Policy Related Statistics, make clear guidelines increasingly necessary in order to ensure a good service level of microdata services.
Statistics Netherlands Act (translated and abridged)
Section 37
The data collected by CBS are solely intended for use in statistical purposes and are not provided to any persons other than those charged with carrying out the duties of the CBS.
The data are then published only in a way that no identifiable information about an individual person, household, company or institution can be derived.
Section 41
Contrary to the provisions of Section 37 the director general may, on request, provide or grant access to a set of data to a department, organisation or institution as referred to in the second subsection for the purposes of statistical or academic research where appropriate measures have been taken to prevent identification of individual persons, households, companies or institutions from those data.
Section 42
The director general shall only grant a request as referred to in Section 41 if the director general considers that the applicant has taken adequate measures to prevent the set of data being used for purposes other than statistical or academic research.
(see appendix 3 for the full text)
2
Some preliminary comments:
• Prevention of disclosure entails the shared responsibility of Statistics Netherlands and the OS-/RA-researcher whom has been granted permission to work with1. This is also stated in the confidentiality statement.
• The output inspectors evaluate each output separately on disclosure. If, in combination with previously released output (regardless of project or institution), a new output might lead to disclosure, it is the responsibility of the OS-/RA-researcher to take precautionary measures.
• The guidelines apply to datasets on individuals, households, companies and institutions, unless otherwise stated.
• For a project, a researcher can only access those files necessary to answer the research questions. It goes without saying that the results of analyses offered as output have to be related to the research questions underlying the project.
• Attention! When making use of CBS microdata it’s not allowed to do quality checks with this information. This means that is isn’t allowed to enrich (adept or improve) microdata from outside the CBS with the help of CBS microdata.
In the following sections three elements of the guidelines are discussed. The following section will discuss the rules-of-thumb for confidentiality to prevent disclosure. Next, we will address the explanation and readability of the output. This helps provide the output inspectors with sufficient background in order to asses whether the output may be released or not. Finally, we will list several technical guidelines.
1. Rules-of-thumb for confidentiality These confidentiality rules apply as rules-of-thumb. If the OS-/RA researcher sticks to these rules the odds are that the output can be released.
If an OS / RA researcher offers an output which violates the rules-of-thumb, then the researcher in question will need to explain why the output entails no disclosure risks. In both cases, the output inspector always has the final decision.
The limits for the rules-of-thumb have been set quite safe, because this almost exludes some frequently observed confidentiality risks. If the limits had been set more liberal, the OS/RA researcher would have had to include a lot more background information with each output to make checking possible.
We use the following rules-of-thumb:
General rules:
0. No microdata: It is prohibited to offer microdata as output. This also means that:
• The (SPSS) command LIST cases may not be used in the output.
• No individual linking variables, such as RIN, RINADRES, BEID, BRIN, can be included in the output.
1. Minimum number of observations: All tabular and similar output should have at least 10 units (unweighted) underlying any cell or data point presented.
Comments:
• When a table refers to information on the level of individual persons as well as companies/institutions/households, this applies to both the minimum number of persons and the number of companies/ institutions/households.
• If the tables contain percentages or weighted numbers, the unweighted numbers have to be included in order to be able to check this output.
1 Microdata: data on the level of surveys or registrations.
3
• Maximum and minimum values are not released as they usually refer to one unit.
Additional rules for models:
2. Models: all modelled output should have at least 10 degrees of freedom and at least 10 units have been used to produce the model. Degrees of freedom = (number of observations) -/- (number of parameters) -/- (other restrictions of the model).
• This is particularly important for regression models, higher order moments (variance, covariance, kurtosis, Skewness), summary and test statistics, estimates (R2 and variations thereof), estimated variance, information criteria (eg AIC, BIC) and individual and group testing and statistics (eg t, F, chi-square, Wald, Hausman)
Residuals and graphs / plots of residuals are not permitted and will not be released.
Additional rules for frequency tables2:
3. Group disclosure: In all tabular frequency tables and similar output no cell can contain more than 90 % of the total number of units in its row or column to prevent group disclosure. Group disclosure is the situation where some variables in a table (usually spanning variables) define a group of units and other variables in the table divulge information that is valid for each member of the group. Even though no individual unit can be recognized, confidentiality is breached because the information is valid for each member of the group and the group as such is recognizable.
Additional rules for magnitude tables3:
4. Dominance: In all magnitude tables and similar quantitative data, the largest contributor to a cell should not contribute more than 50% of the total amount in the cell4.
In Appendix 1 these rules of thumb are explained more clearly for each type of output. Some examples are also included in this appendix.
2. Rules for readability Attention! These rules must always be met.
The OS-/RA-researcher should ensure that the delivered output in combination with the standard form outputcheck, is clear and understandable for the output inspectors.
The output is checked by two statistical researchers. This will ensure an independent verification of output, with the same criteria for all OS-/RA-researchers. Although the inspectors are experienced, they are generally infamiliar with the content of the OS-/RA-projects. Because of the diversity of topics the inspectors do not know all the in’s and out’s of all the data sets.
This means that it is very important that the OS-/RA-researchers gives a clear explanation of the analysis and the presented variables. A researcher can therefore influence the speed and outcome of the output check.
2 Frequency table: table in which all observations are where you can read how often (frequency) a given observation occurs.
3 Magnitude table: table showing the total quantity of observations such as payroll, sales, property tax value etc 4 The percentage mentioned is stricter than Statistics Netherlands applies itself because there is a disclosure risk at the mention of such a percentage (possibility of back calculations of revealing values).
4
We use the following guidelines:
1. Output files should be accompanied by a fully and correctly filled-in Standard form outputcheck.This form can be found in the “shared workspace” (Disk H) of the user(s) and must be included with each output that is presented for review. The filled-in form should clearly state the following:
• the purpose of the analysis;
• the sourcefiles used;
• how the analysis file was compiled (for example, by linking different files or by selecting subpopulations);
• population on which the output is based;
• the kind of output. For example: counts, crosstabs, or statistic analysis;
• the relationship between tables in an output file (if applicable)
• the relationship with previously submitted output. (if applicable)
As an example, a completed filled outputform can be found in appendix 3.
2. Variables in the output should be documented. What we mean is that there should be a clear definition of the meaning of the variable and individual values in the case of discrete variables. In SPSS this is possible by adding variable and value labels. Another possibility is to create a separate document containing this information. This document must be included with each output and can always be supplemented with new variables.
3. Each part of the output must be preceded by a line of text which describes the population or selection for that component. So for each table, model analysis, and so on. It is not sufficient to refer to the previous program code, as these are often not directly understandable.
4. In case of deviating from the minimum number of observations, to check on group disclosure or dominance it is necessary to supply the underlying tables that are used. In that case, you have to present them in a separate zip file called "NOTOUTPUT_Backgroundinformation.zip". In this document must be clearly described which part of the background information is linked to which part of the output. For example, use identical numbers for the tables used in the output as in de the background document. Obviously this zip file will not be released.
3. Technical Guidelines Attention! These rules must always be met.
1. Size of output: In order to maximise the time necessary to check an output, outputs can not be too large. As guideline, an output inspector should be able to inspect an output within an hour. The tariffs for output checks are also based on this. When an output is too large, the cost and the time for checking will be proportionately increased. We keep the following guidelines:
• A maximum of 10 files for an output.
• Our basic principle is that we check up to 3 000 values. For example, no more than 30 tables with an average of 10 by 10 or at most 50 models.
• Because the output is sent by email, the maximum size of an output has been set to 5 MB in zipped version (most often, mail servers can’t handle larger ones).
• Obviously necessary background information from the document "NOT OUTPUT Background information.zip" won’t count against in the size of output.
• Don’t offers zip files in a zip file.
2. Format:
• Please transfer all output, other than SPSS, in the following formats: xls, doc, txt or csv.
• Files in microdata formats (like sav, sas or mdb) are not allowed.
5
• Graphs are not allowed as output. These are often difficult to check on disclosure. The underlying data may be presented as output, and when released, the researcher can make the graphs in his own environment. Exceptions are graphs of models like survival curves. These graphs have to be presented as plain figures in formats like bmp, jpg or gif.
3. Visibility: It is not allowed to hide output in the output files. So it’s not allowed to:
• fold-in items in SPSS spo files.
• hiding rows or columns or sheets in Excel.
• Offer pivot tables for inspection.
4. Other:
• Don’t offer the same output in different formats.
• The name of the output may not contain more than 100 positions, as this could cause problems with exporting the output from the secure OS / RA area to the regular network of CBS.
6
Appendix 1: More details on the guidelines including some examples
This appendix discusses in more detail the guidelines for output that are described in the document “Guidelines for On Site/ Remote Access -output”. For clarification, an example is included for each guideline.
The document mentioned above includes the following guidelines:
General rules:
0. No microdata: It is not allowed to offer microdata as output
1. Minimum number of observations: All tabular and similar output should have at least 10 units (unweighted) underlying any cell or data point.
Additional rules for models:
2. Models: all modelled output should have at least 10 degrees of freedom and at least 10 units have been used to produce the model. Degrees of freedom = (number of observations) -/- (number of parameters) -/- (other restrictions of the model). In addition to that, residuals and graphs/plots of residuals will not be released.
Additional rules for frequency tables5:
3. Group disclosure: In all tabular and similar output no cell can contain more than 90 % of the total number of units in its row or column to prevent group disclosure.
Additional rules for magnitude tables6:
4. Dominance: In alle magnitude tables and similar quantitative data, the largest contributor to a cell should not contribute more than 50 % to the total amount in the cell7.
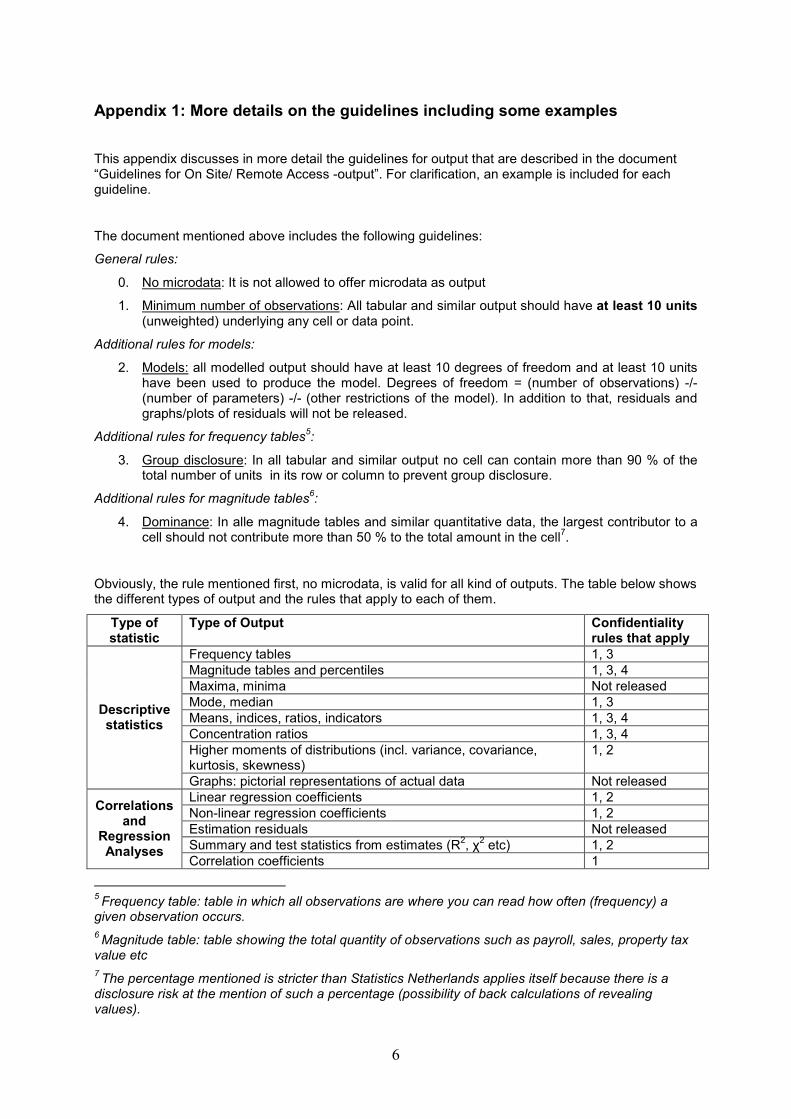
Obviously, the rule mentioned first, no microdata, is valid for all kind of outputs. The table below shows the different types of output and the rules that apply to each of them.
Type of statistic
Type of Output Confidentiality rules that apply
Frequency tables 1, 3 Magnitude tables and percentiles 1, 3, 4 Maxima, minima Not released Mode, median 1, 3 Means, indices, ratios, indicators 1, 3, 4 Concentration ratios 1, 3, 4 Higher moments of distributions (incl. variance, covariance, kurtosis, skewness)
1, 2
Descriptive statistics
Graphs: pictorial representations of actual data Not released Linear regression coefficients 1, 2 Non-linear regression coefficients 1, 2 Estimation residuals Not released Summary and test statistics from estimates (R2, χ2 etc) 1, 2
Correlations and
Regression Analyses
Correlation coefficients 1
5 Frequency table: table in which all observations are where you can read how often (frequency) a given observation occurs.
6 Magnitude table: table showing the total quantity of observations such as payroll, sales, property tax value etc
7 The percentage mentioned is stricter than Statistics Netherlands applies itself because there is a disclosure risk at the mention of such a percentage (possibility of back calculations of revealing values).
7
Examples
1. Minimum number of observations
Every cell in a frequency or crosstable should contain al least 10 observations. If a researcher wants to submit a table with lower numbers, he or she should explain why the output is safe in spite of the low numbers.
Example 1a shows a crosstable that is revealing with a lot of small numbers. When analysing this table, one learns that the one family in Zuiderwijk aan Zee with 28 children didn’t have any pets in 2011.
In this case, you could make the table safe by adding the last 2 categories of the amount of children together (1b) or to supress some cells (1c). When supressing cells, one should make sure that enough cells are supressed to prevent someone recalculating the supressed cells from other cells.
Example 1a
Table: Households to number of children and pets in Zuiderwijk aan Zee, 2011.
Selection: All households with 1 child or more.
Number of pets
0 1 2 or more Total
1-3 32 64 84 180
4-10 28 48 28 104
11-20 10 16 10 36
>20 1 0 0 1
Number of children
Total 71 128 122 321
Example 1b
Table: Households to number of children and pets in Zuiderwijk aan Zee, 2011.
Selection: All households with 1 child or more.
Number of pets
0 1 2 or more Total
1-3 32 64 84 180
4-10 28 48 28 104
>11 11 16 10 37
Number of children
Total 71 128 122 321
8
Example 1c
Table: Households to number of children and pets in Zuiderwijk aan Zee, 2011.
Selection: All households with 1 child or more.
This example shows how cells that contained revealing numbers have been suppressed. Because of this, no information on the family with more than 20 children will now be released.
Number of pets
0 1 2 or more Total
1-3 32 64 84 180
4-10 28 48 28 104
11-20 10 16 10 36
>20 x x x x
Number of children
Total x x x x
2. Models:
The following examples explain in more detail the guidelines for models. The model should have at least 10 degrees of freedom (df), in other words: the number of observations minus the number of variables should be equal to or larger than 10.
In the example below is made in SPSS. The df for “Residual” should be equal to or larger than 10 (watch out, not the df for “Model”). The total number of observations in this example is 16725, the model itself has 3 variables, leading to 16722 degrees of freedom.
The residuals can not be included in the output, for they present information on individual observations. They can be viewd as a graph when calculating the regression. This graph can be viewed within the On Site/Remote Access environment, but can not be included in the output.
Example 2a
Example 2a shows a regression analysis to indicate the effect of age and education on the natural logarithm of the hourly wage of women.
Selection: Female respondents of the EBB in 2008 and 2009
As an example we use a table on the use of drugs among adolescents in ‘Zuiderwijk aan Zee’.
Table 3: Residents of ‘Zuiderwijk aan Zee’ split to age and drug use.
Age of drug use None Only softdrugs Hard drugs(and softdrugs)
Total
< 15 years 78 12 13 103
15 – 17 years 2 367 12 381
18 – 21 years - 28 389 417
Total 80 407 414 901
The low frequency in the column ‘none’ for the age groups above 15 years is revealing. It shows that almost everyone in this group is using drugs. The father of a 19 year old boy in this village, can be almost sure his son is using drugs when viewing this table. This makes it very revealing.
4. Dominance:
As an example we will look at investments of companies split to region and activity.
Table 4: Investments of companies (mln euro) to region and activity.
Selection: All companies in the Prodcom statistics from the period 1993-2007
Region 1 Region 2 Region 3 Total
Activity 1 78 12 9 99
Activity 2 4 367 12 383
Activity 3 - 28 389 417
Total 82 407 410 899
10
Note: When necessary for the purpose of the investigation it’s possible tot export tables with number of observations less than 10. Of course the reason fore this must be given, as also the arguments why this output won’t lead to the risk of disclosure.
In this example, background tables as below are also necessary to check the dominance rule. This background information has to be offered in a separate zip file named "NON OUTPUT Backgroundinformation.zip" (See also rules for readability).
Table 4a: Number of contributors in each cell
This table refers to table 4 in the output of 31-3-2011, file xxx.log
Total number of contributors in each cell
Region 1 Region 2 Region 3 Total
Activity 1 14 10 12 36
Activity 2 13 15 11 39
Activity 3 0 21 23 44
Total 27 46 46 119
Table 4b: Size of the largest contributer (mln euro)
This table refers to table 4 in the output from 31-3-2011, file xxx.log
Region 1 Region 2 Region 3 Total
Activity 1 34 4 2
Activity 2 1 167 5
Activity 3 - 10 234
Total
Table 4c: Contribution of largest contributor in %
This table refers to table 4 in the output from 31-3-2011, file xxx.log
Region 1 Region 2 Region 3 Total
Activity 1 44% 33% 22%
Activity 2 25% 46% 42%
Activity 3 - 36% 60%
Total
Table 4a shows that the output complies with Rule 1: All output should have at least 10 units (unweighted) underlying any cell or data point.
Table 4c shows that cell (Activity 3, Region 3) doesn’t meet the dominance rule. Together, all companies in this cell invest 389 mln. The largest contributor (234 mln) is good for 60% of this cell total. This is larger than 50 % and therefore violates the rule.
11
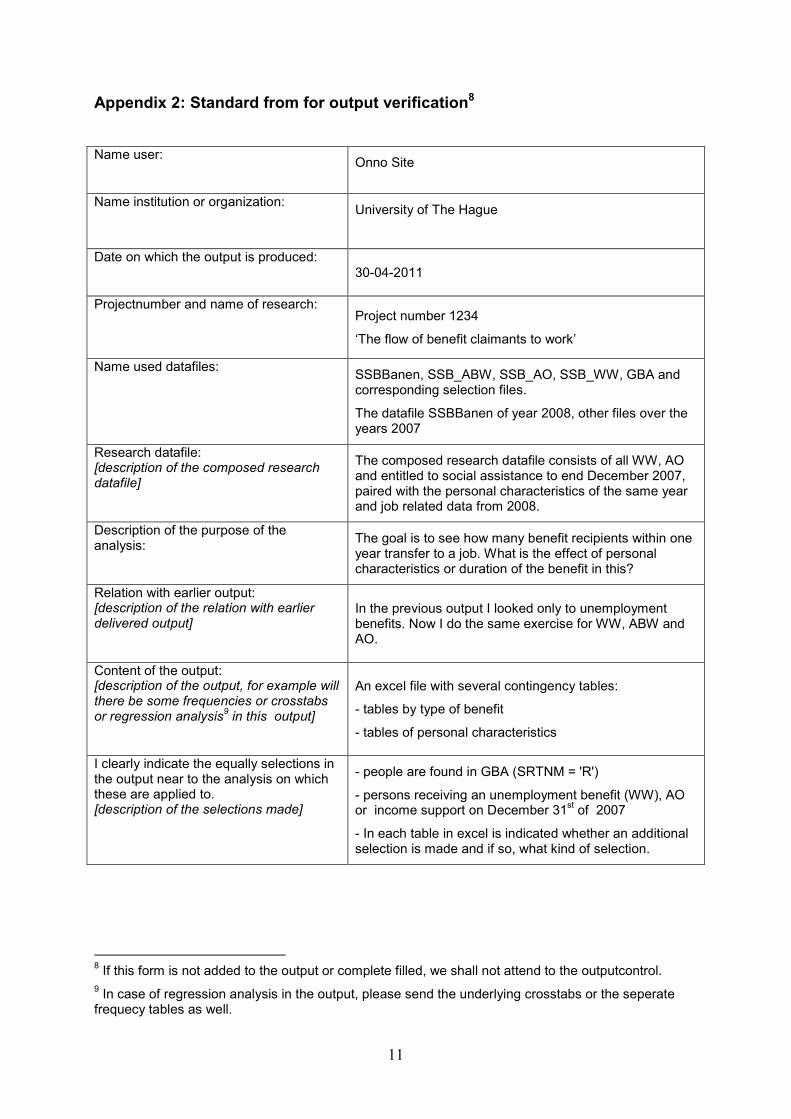
Appendix 2: Standard from for output verification8
Name user: Onno Site
Name institution or organization: University of The Hague
Date on which the output is produced: 30-04-2011
Projectnumber and name of research: Project number 1234
‘The flow of benefit claimants to work’
Name used datafiles: SSBBanen, SSB_ABW, SSB_AO, SSB_WW, GBA and corresponding selection files.
The datafile SSBBanen of year 2008, other files over the years 2007
Research datafile: [description of the composed research datafile]
The composed research datafile consists of all WW, AO and entitled to social assistance to end December 2007, paired with the personal characteristics of the same year and job related data from 2008.
Description of the purpose of the analysis: The goal is to see how many benefit recipients within one
year transfer to a job. What is the effect of personal characteristics or duration of the benefit in this?
Relation with earlier output: [description of the relation with earlier delivered output]
In the previous output I looked only to unemployment benefits. Now I do the same exercise for WW, ABW and AO.
Content of the output: [description of the output, for example will there be some frequencies or crosstabs or regression analysis9 in this output]
An excel file with several contingency tables:
- tables by type of benefit
- tables of personal characteristics
I clearly indicate the equally selections in the output near to the analysis on which these are applied to. [description of the selections made]
- people are found in GBA (SRTNM = 'R')
- persons receiving an unemployment benefit (WW), AO or income support on December 31st of 2007
- In each table in excel is indicated whether an additional selection is made and if so, what kind of selection.
8 If this form is not added to the output or complete filled, we shall not attend to the outputcontrol. 9 In case of regression analysis in the output, please send the underlying crosstabs or the seperate frequecy tables as well.
12
Appendix 3: Statistics Netherlands Act
Section 37
1. The data received by the director general in connection with the performance of his duties to implement this act shall be used solely for statistical purposes.
2. The data referred to in the first subsection shall not be provided to any persons other than those charged with carrying out the duties of the CBS.
3. The data referred to in the first subsection shall only be published in such way that no recognisable data can be derived from them about an individual person, household, company or institution, unless, in the case of data relating to a company or institution, there are good reasons to assume that the company or institution
Section 41
1. Contrary to the provisions of Section 37 the director general may, on request, provide or grant access to a set of data to a department, organisation or institution as referred to in the second subsection for the purposes of statistical or academic research where appropriate measures have been taken to prevent identification of individual persons, households, companies or institutions from those data.
2. A set of data as referred to in the first subsection may be provided to or made accessible to:
a. university, within the meaning of the Higher Education and Research Act;
b. an organisation or institution for academic research established by law;
c. planning offices established by or by virtue of the law;
d. the Community statistical agency and national statistical agencies of the member states of the European Union;
e. research departments of ministries and other departments, organizations and institutions, in so far as the CCS has given its consent.
Section 42
The director general shall only grant a request as referred to in Section 41 if the director general considers that the applicant has taken adequate measures to prevent the set of data being used for purposes other than statistical or academic research.
Section 42a
1. Contrary to the provisions of Section 37 the director general may, on request, provide data for the purposes of academic research in the field of health care, that the CBS has collected for statistical research on the grounds of Section 12a of the Burials and Cremation Act from persons who were involved in a scientific study.
2. The director general shall only agree to a request as referred to in the first subsection if the person concerned has expressly consented to such provision or, if the person concerned has not expressly given permission for the data to be provided, in so far as the person requesting the data adequately demonstrates that:
a. requesting consent during the life of the person concerned was not reasonably possible or could not reasonably be demanded;
b. it has not been shown that during his life the person concerned objected to the processing of his personal data for the purpose of academic research;
c. the research serves a general interest;
d. the research cannot be carried out without the relevant data;
13
e. the research meets any further requirements that can reasonably be imposed on it.
3. The director general may attach further conditions to the provision of data as referred to in the first subsection.
5. Our Minister shall adopt further rules, in consultation with Our Minister of Health, Welfare and Sport, after hearing the CCS and the Data Protection Board, with respect to the power referred to in the first subsection.


![[MS-RDPEA]: Remote Desktop Protocol: Audio Output Virtual ......2 / 65 [MS-RDPEA] — v20140502 Remote Desktop Protocol: Audio Output Virtual Channel Extension Copyright © 2014 Microsoft](https://static.documents.pub/doc/80x56/6140d5e783382e045471b3ed/ms-rdpea-remote-desktop-protocol-audio-output-virtual-2-65-ms-rdpea.jpg)


