Guiding CLASSY Toward More Responsive Summaries John M. Conroy Judith D. Schlesinger IDA/Center for Computing Sciences {conroy, judith}@super.org Peter A. Rankel Dianne P. O’Leary University of Maryland {rankel@math, oleary@cs}.umd.edu Abstract We discuss changes and improvements in CLASSY for TAC 2010 along with a set of evaluation metrics. Results for both summarization and AESOP evaluation are given. 1 Introduction The CLASSY (Clustering, Linguistics, and Statistics for Summarization Yield) team par- ticipated in both the summarization and summarization evaluation (AESOP) tasks. We had two submissions in the update summarization task. In our ongoing effort to improve CLASSY, several significant enhancements were made this year. These were mo- tivated either by the requirement to create more focused, “guided”, summaries than in previous years or by general system improvement suitable for any summarization task. Improvements included query term selection, sentence splitting and quotation mark han- dling, and using Nouveau-ROUGE to train and evaluate new ideas for update summaries. Additionally, we expanded our training data set by identifying additional clusters to use. These were modeled from the three NIST sample topic descriptions found. For AESOP, we had four submissions. Our approach used a combination of features which included ROUGE scores, Nouveau-ROUGE scores for update summaries, and 7 newly defined linguistic features. 2 Guided Summarization with CLASSY 2010 CLASSY 2010 retains a similar structure to previous versions: 1. Data preparation. 2. Query term selection from the topic descriptions. 1
Transcript
Guiding CLASSY Toward More Responsive Summaries
John M. Conroy Judith D. SchlesingerIDA/Center for Computing Sciences{conroy, judith}@super.org
Peter A. Rankel Dianne P. O’LearyUniversity of Maryland
{rankel@math, oleary@cs}.umd.edu
Abstract
We discuss changes and improvements in CLASSY for TAC 2010 along with a set ofevaluation metrics. Results for both summarization and AESOP evaluation are given.
1 Introduction
The CLASSY (Clustering, Linguistics, and Statistics for Summarization Yield) team par-ticipated in both the summarization and summarization evaluation (AESOP) tasks.
We had two submissions in the update summarization task. In our ongoing effort toimprove CLASSY, several significant enhancements were made this year. These were mo-tivated either by the requirement to create more focused, “guided”, summaries than inprevious years or by general system improvement suitable for any summarization task.Improvements included query term selection, sentence splitting and quotation mark han-dling, and using Nouveau-ROUGE to train and evaluate new ideas for update summaries.Additionally, we expanded our training data set by identifying additional clusters to use.These were modeled from the three NIST sample topic descriptions found.
For AESOP, we had four submissions. Our approach used a combination of featureswhich included ROUGE scores, Nouveau-ROUGE scores for update summaries, and 7newly defined linguistic features.
2 Guided Summarization with CLASSY 2010
CLASSY 2010 retains a similar structure to previous versions:
1. Data preparation.
2. Query term selection from the topic descriptions.
1
3. Signature term computation for each of the document sets.
4. Sentence scoring using the approximate oracle.
5. (For update summaries) Projection of term-sentence matrices against the base sum-mary to reduce duplication of content.
6. Redundancy removal and sentence selection.
Two major changes were made for TAC 2010: focused query term generation and animproved algorithm for update summaries. Both of these changes were performed withtraining data developed from TAC 2008-2009.
2.1 Data Preparation
The task of data preparation encompasses all handling of the data prior to performingsentence scoring. This year, creation of training data is also included.
Training Data Creation
The three category-identified document sets supplied by NIST in ’sampletopics.txt’ wereinsufficient for training. To rectify this, we analyzed each of the document sets fromthe TAC 2008 and TAC 2009 data and selected those that had characteristics of guidedsummarization as specified in this year’s problem description. Each was assigned a categoryto appear identical to the NIST supplied samples. Thirty document sets were identified,yielding a total training set of 33 document sets.
This richer set of training data was essential for testing and training CLASSY for thisyear’s evaluation.
Sentence Splitting and Quotation Marks
The sentence splitter we introduced last year has been renamed FASST-E (very Fast, veryAccurate Sentence Splitter for Text–English). This splitter is routinely performing at errorrates of 0.01% and lower (better) and 1000+ sentences per second. Since last year, most ofthe remaining known errors have been corrected and we now have a very stable platform.
An ongoing problem that we have finally resolved is the problem of matching quotationmarks. While non-trivial when the data is correct, errors in the data make this verydifficult to resolve. These errors include missing opening or closing quotes, missing ormisplaced spaces preceding and/or following the quotation mark, mismatched quotationmarks (single/double, for example), and mis-used quotation marks (” mid-word where ’should appear, ‘ as a closing quotation mark, etc.).
FASST-E tries to identify where a quotation mark belongs when it occurs, with poorspacing, at the start or end of a sentence. Our tokenizer then resolves as many quotation
2
mark matches as possible. Some errors are impossible for us to identify and correct sincewe do not parse the data, but we are generally quite successful.
More accurate sentence breaks and better quotation mark matching have contributedto improved linguistic quality.
2.2 Guided Query Generation
Query term selection has a significant impact on sentence scoring. In order to generateas good a set of query terms as possible, we created a data structure based on the cate-gories and aspects as specified in the Guided Summarization guidelines. The data structurecontains an entry for each category and, within each of those, each aspect. We used a com-bination of Google searching, dictionaries and thesauruses, and our own world knowledge,to populate each of the aspects for each category.
As in prior evaluations, CLASSY began with the words in the topic title as our queryterms. These were then expanded with category terms and aspect terms where appropriate.For example, if a category had two terms, such as “accidents” and “natural disasters”, andif we knew from the title words that “accident” was the correct category label, we did notadd “natural disaster”. However, if we could not identify which was correct from the titlewords, we added both to our list of query terms. The aspects were handled similarly.
For our two submissions to TAC, we defined a “basic set” of query terms which usedonly the title words and category terms. Our “level 2” submission included the basicset along with synonyms or “types” of the category terms, where type is a list of kindsof events for the category. For example, “natural disaster” would include “earthquake”,“hurricane”, “mudslide”, etc. We have yet to identify a satisfactory mechanism for utilizingquery terms based on the remaining aspects to select sentences with information reflectingthese aspects. This is part of our future efforts.
Section 4.1 shows that our submission using the level 2 query terms did not performbetter than the submission using the basic set. We are hypothesizing that any gain fromthe richer set of query terms was negated by adding too many terms. We are currentlytrying to understand this outcome.
2.3 Improved Sentence Scoring and Update Summaries
Several changes were also made to CLASSY’s scoring algorithm to improve base and updatesummaries:
1. A bias in the first sentence scores was observed by comparing the “approximate oraclescores” to the oracle scores based on a unigram score of the human summaries in thetraining data. The expected value of this bias was added to the first sentence scores.
2. Term-Sentence matrix projection for update summary scoring was modified to ap-proximate `1 norm.
3
3. Parameter tuning was based on training via ROUGE-2 and Nouveau-ROUGE-2 [2]
(a) It was determined that more weight should be given to query and signatureterms than to relevance feedback.
(b) The fraction of dimension to keep for LSI in redundancy removal pre-conditioningwas determined.
(c) A parameter was added to the update scoring to parallel the Nouveau-ROUGEmodel of scoring.
All of the above changes were optimized based on the TAC 2008–2009 document setsthat were described in the previous section. The changes resulted in a moderate improve-ment in base summaries and a statistically significant improvement in update summaries.
3 CLASSY Evaluation Metrics: ROSE and Nouveau-ROUGE
The CLASSY team developed several approaches for evaluating summaries. The basicapproach was to extend ROSE (ROUGE Optimal Summarization Evaluation) [1] to includelinguistic features. Furthermore, in addition to using robust regression, non-negative leastsquares and a canonical correlation method were employed. For update summaries, theROUGE content features were used to compute a novelty score as proposed in [2]. We nowgive an overview of the three feature combining methods used for TAC 2010.
3.1 Three Feature-Combining Methods
Each of the three methods produced a set of linear coefficients used to combine the features.Two of these approaches, robust regression and non-negative least squares, predict a manualevaluation score such as pyramid or overall responsiveness. The third predicts a weightedaverage of the manual scores. All three methods are trained by using the average values ofthe features and human evaluation scores for a given summarizer, human or machine.
These models are given a set of numeric features and the corresponding overall respon-siveness or pyramid scores. We let aij , for i = 1, ...,m and j = 1, .., n, be the value of thejth feature for the summarizer i, and let bi be the manual content evaluation metric (e.g.,pyramid scoring or overall responsiveness). We then seek an n-long vector x such that
x = argmax ρ(n∑
j=1
aijxj , bi), (1)
where ρ denotes the Pearson correlation between two values.To be robust to outliers, we used a robust least squares algorithm (Matlab’s robustfit())
to minimize ||Ax − b||, where the norm ||.|| appropriately weights outliers. A second ap-proach is to use a non-negative least squares method, which restricts the solution vector x
4
to be non-negative. Here we used Matlab’s lsqrnonneg(), with the sign of the features setso each would have a positive correlation with b.
The third approach is canonical correlation (CCA) and it takes as input the matrix A,of features and a matrix B of two or more manual scores. It then finds a linear combinationof the columns of A and a linear combination of the columns of B that have maximumcorrelation. For our TAC submissions, the columns of B were overall responsiveness,pyramid score, and linguistic quality, and
(x, y) = argmax ρ(
n∑j=1
aijxj ,
k∑j=1
bijyj), (2)
where ρ denotes the Pearson correlation between two values.Given x, based on training data and one of the above methods, a score for a summary
is predicted by computing the given features for the summary and then applying thelinear model x. The resulting score predicts a manual evaluation metric (or, in the caseof canonical correlation, a weighted average of multiple human evaluation metrics) as afunction of the observed features.
3.2 Content and Linguistic Features
We created several linguistic features for input to our summary score predictor. Most ofthese features are calculated from an abstract’s term-sentence matrix, whose (i, j)-entry isthe number of times term i occurs in sentence j. The matrix has one row for each non-stopword with a unique stem. Sometimes there are sentences that contain only stop words,resulting in a column of all zeros in the term-sentence matrix. The first step in this processis to remove the all-zero columns.
• term overlap: The first feature is called term overlap and is computed from theterm-overlap matrix. The term-overlap matrix X is simply (A > 0)′ ∗ (A > 0), whereA is the term-sentence matrix and A > 0 denotes a logical matrix of zeros and ones.The (i, j)-entries in this matrix are the number of terms in common in sentence i andsentence j. We define the term-overlap score as the sum of the super-diagonal of thismatrix, or the sum of the (i, i + 1)-entries. The score is then the logarithm of thesum of the number of terms overlapping in each pair of adjacent sentences plus 1.
• normalized term overlap: The second linguistic feature is also the sum of theentries along the super-diagonal, but this time the term-overlap matrix has beensymmetrically normalized first. The symmetric normalization of a matrix X is ob-tained in the following way. First, let d =
√diag(X). Then, replace all zeros in the
d vector with ones. Next, replace each entry of d with its reciprocal. Finally, thesymmetric normalization of X is diag(d) ∗X ∗ diag(d).
5
• Redundancy Score 1: The third and fourth linguistic features measure the ab-stract’s redundancy. Let σ1, . . . , σn denote the singular values of the term-overlapmatrix X, where σi ≥ σi+1. Redundancy score 1 is then defined as
∑ni=2 σi
2.
• Redundancy Score 2: Similar to the previous one, this score is calculated as:∑ni=3 σi
2.
• Number of sentences: We use − log2(number of sentences).
• Term Entropy: The final two linguistic features deal with entropy. Term entropyis the sample entropy of the vector of counts of term occurrences. This is calculatedfrom the original term-sentence matrix (with zero columns removed) by dividing thecolumn sums by the sum of all the matrix entries. Call this vector p. Then the termentropy is −
∑i pi log2 pi.
• Sentence Entropy: Sentence entropy is calculated the same way, using row sumsinstead of column sums. It is the sample entropy of the vector of sentence lengths.
3.3 Feature Selection and Training
In order to determine which of our seven linguistic features and seven Rouge-type featuresshould be included in the model, we made use of the TAC 2008 and TAC 2009 data. Foreach of the 214−1 possible subsets of features, we trained a model on the TAC 2008 data andcalculated predictions for the TAC 2009 data. We then chose the subset of features whosepredictions had the highest correlation with the true 2009 data. We then recalculated thefeature coefficients by training on the 2009 data. All of this model training was done atthe level of system averages.
4 Results
A synopsis of CLASSY summarization submission results and AESOP results follows.
4.1 TAC 2009: Update Summaries
Two submissions were made to the update task – one based on the “basic set” (system16) and another based on the “level 2” set of query terms (system 13). Other than usingdifferent query terms the submissions were identical.
The improvements to CLASSY yielded very good performance. NIST ranks systemsby mean performance over the data sets, generating somewhat different results from thosereported here. Using median performance, to be consistent with the Kruskal-Wallis test(see below), our submissions ranked #1 and #8 for overall responsiveness for the basictask and #1 and #2 for update summaries. In pyramid scoring, our rankings were #3 and#7 for basic and #1 and #2 for update summaries. Figures 1 and 2 give the rankings for
6
the systems using median performance with confidence intervals provided by a Kruskal-Wallis test, a non-parametric analysis of variance (ANOVA). Note that a Tukey honestlysignificantly different test grouped both of our update pyramid scores in the same groupas some human summarizers. Likewise, our responsiveness scores in set A base summariesare within the same group as human C.
4.2 TAC 2010: AESOP Submissions
For the AESOP task, the CLASSY team had four submissions. Two were based on therobust linear regression models, (which, in training, best predicted both responsiveness andpyramid scoring), one used non-negative least squares (NNLS) to predict responsiveness,and one used canonical correlation (CCA). Recall, our models can use up to 7 ROUGEfeatures and 7 linguistic features. Models for the update summaries may, in addition, in-clude up to 7 Nouveau-ROUGE features. Tables 1 and 2 give the labels and characteristicsof the submissions including the approximate weights of each feature as determined by thetraining process.
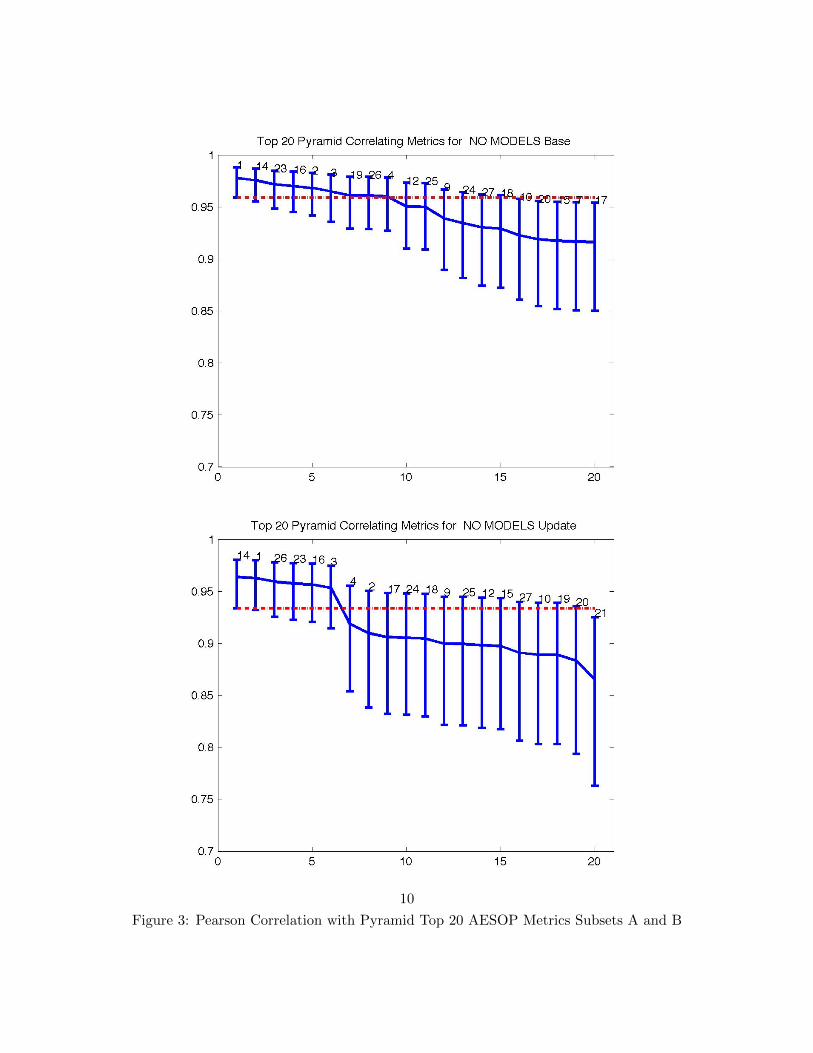
We did quite well in the “nomodels” subtask, where we were asked to score just themachine summaries. We are 14 (NNLS responsiveness), 23 (CCA), 19 (robust regression,responsiveness), and 26 (robust regression, pyramid). Systems 1, 2, and 3 are baselineROUGE-2, SU4, and BE respectively. Figures 3 and 4 show the sorted Pearson correlationfor pyramid and responsiveness for both the base and the update summaries.
7
Figure 1: Tukey Honestly Significant Different Test: Overall Responsiveness for Subsets Aand B 8
Figure 2: Tukey Honestly Significant Different Test: Pyramid Scoring for Subsets A andB 9
Figure 3: Pearson Correlation with Pyramid Top 20 AESOP Metrics Subsets A and B
10
Figure 4: Pearson Correlation with Responsiveness Top 20 AESOP Metrics Subsets A andB
11
Table 2: Features Used in the “No Models” Task
NNLS (14) CCA (23) Robust Reg.(19,26)Feature A B A B A B A B
The methods we employed in TAC 2010 were quite effective in producing top scoring sum-maries in overall responsiveness. The new task gave rise to a “focus” in query generationfor CLASSY. In the future we intend to exploit more of the structure information in thequery to further increase our coverage.
In AESOP, our metrics were best in predicting overall responsiveness. ROUGE-2 isstill champion for pyramid scoring prediction. The linguistic scores we developed, whileelementary, provide good insight into the type of errors that are plaguing machine generatedsummaries.
Acknowledgements
The authors thank Jeff Kubina for his insights and contributions to test data preparationand the guided query data structure used for our submissions.
References
[1] John M. Conroy and Hoa Trang Dang. Mind the Gap: Dangers of Divorcing Evaluations ofSummary Content from Linguistic Quality. In Proceedings of the 22nd International Conferenceon Computational Linguistics (Coling 2008), pages 145–152, Manchester, UK, August 2008.
[2] John M. Conroy, Judith D. Schlesinger, and Dianne P. O’Leary. Nouveau rouge: A noveltymetric for update summarization. To Appear in Computational Linguistics, 2011.