74
The Potential of Specialty Chemicals Industry in Gujarat Theme: January 2013, Ahmedabad “Knowledge cum Strategy Paper” Conclave-2013 Gujarat

The Potential of Specialty Chemicals Industry in Gujarat
Theme:
January 2013, Ahmedabad
“Knowledge cum Strategy Paper”
Conclave-2013
Gujarat

Message
Naina Lal KidwaiPresident, FICCI &Country Head-HSBC India &Director- HSBC Asia Pacific
The Chemical industry is critical for the economic development of any country, providing
products and enabling technical solutions in virtually all sectors of the economy. Specialty
Chemicals are the fastest growing segment in the chemical industry. These are high value,
low volume chemicals known for their end-use applications and/or have performance
enhancing properties. There is immense potential for increasing consumption within the
country as also for India to become a reliable supplier of such quality chemicals to the world.
Compared to United States, Europe and even China, there is comparatively very low usage
of such chemicals in India. Increasing judicious usage of such chemicals will not only help in
the growth of this important segment of the chemical industry but also facilitate overall
economic growth.
Gujarat is the hub of the Indian Chemical industry, contributing to over 50% of its production.
I am delighted that Federation of Indian Chambers of Commerce & Industry jointly with the
Government of Gujarat and CHEMEXCIL is organising a Conclave on Specialty Chemicals,
with a focus on Gujarat. The purpose of this Conclave is to discuss the issues and potential of
the sector and determine the way forward. I am confident that the Conclave will achieve
these objectives and wish it every success
(Sd/-)
Naina Lal Kidwai

TATA Strategic team has been privileged to work closely with some of the best global names in speciality chemical industry on various strategic business issues; this gives us the added advantage writing this report. This report attempts to provide an overview of the speciality chemicals industry, its growth prospects and its close linkage to Gujarat State and challenges it faces today. We also recommend strategic imperatives for manufacturers and end users.
Indian speciality chemicals market size is approximately USD 23 Bn, and it has seen strong growth at 14% per annum. While the growth rate is strong, still the consumption levels of speciality chemicals and additives are very low in India as compared to other peer countries. This implies that there is tremendous scope for consumption levels to rise in coming decades. We are of the opinion that Indian speciality chemical industry is at an inflection point and will be a major contributor to the country's growth in coming decade.
However, the success of this sector will depend on how well it manages its key challenges, some of which include dependence upon imports for intermediates, high fragmentation, small capacities and limited focus on technology up-gradation.
Gujarat has been the leading state in terms of attracting investment for chemicals industry and today known as the 'Petro Capital' of India. It contributes significantly to the country's petrochemicals production (62 %), chemicals production (51 %) and pharmaceuticals production (35 %). Its business friendly policies have made it the first choice for investors. In 2011 alone it signed more than 80 MoU's with an aggregate proposed investment of Rs. 55,000 Crores.
We are grateful to FICCI for giving us this opportunity to partner with them in the preparation of this Knowledge Paper.
It was an exciting and enriching experience for TATA Strategic (Chemicals) team to put this report together in a short time and we sincerely hope this sets the motivation for companies to formulate strategies to address key challenges and help in creating a dynamic and vibrant speciality chemicals industry in Gujarat.
Charu KapoorEngagement Manager - ChemicalsTata Strategic Management Group
Manish PanchalPractice Head - Chemical & EnergyTata Strategic Management Group
P S SinghHead- Chemicals
Foreword
Conclave-2013
Gujarat

I. Executive summary . . . . . . . . . . . . . . . . . . . . . . . . . . . . . . . . . . . . . . . . . . . . . . . . . 01
II. Introduction . . . . . . . . . . . . . . . . . . . . . . . . . . . . . . . . . . . . . . . . . . . . . . . . . . . . . 02
III. India scenario . . . . . . . . . . . . . . . . . . . . . . . . . . . . . . . . . . . . . . . . . . . . . . . . . . . . . 04
1. Market size . . . . . . . . . . . . . . . . . . . . . . . . . . . . . . . . . . . . . . . . . . . . . . . . . . . . 04
2. Growth drivers. . . . . . . . . . . . . . . . . . . . . . . . . . . . . . . . . . . . . . . . . . . . . . . . . . 05
3. Growth projections . . . . . . . . . . . . . . . . . . . . . . . . . . . . . . . . . . . . . . . . . . . . . . 07
4. Opportunities . . . . . . . . . . . . . . . . . . . . . . . . . . . . . . . . . . . . . . . . . . . . . . . . . . 08
5. Export - Import scenario . . . . . . . . . . . . . . . . . . . . . . . . . . . . . . . . . . . . . . . . . . 08
6. PCPIR policy. . . . . . . . . . . . . . . . . . . . . . . . . . . . . . . . . . . . . . . . . . . . . . . . . . . . . 11
IV. Gujarat state advantage. . . . . . . . . . . . . . . . . . . . . . . . . . . . . . . . . . . . . . . . . . . . . . 15
1. Specialty chemicals in Gujarat . . . . . . . . . . . . . . . . . . . . . . . . . . . . . . . . . . . . . . 21
V. Industry reports . . . . . . . . . . . . . . . . . . . . . . . . . . . . . . . . . . . . . . . . . . . . . . . . . . . . 22
1. Agrochemicals . . . . . . . . . . . . . . . . . . . . . . . . . . . . . . . . . . . . . . . . . . . . . . . . . . 22
2. Fine chemicals . . . . . . . . . . . . . . . . . . . . . . . . . . . . . . . . . . . . . . . . . . . . . . . . . . 26
3. Paints, Coatings & Construction chemicals . . . . . . . . . . . . . . . . . . . . . . . . . . . 29
4. Colorants . . . . . . . . . . . . . . . . . . . . . . . . . . . . . . . . . . . . . . . . . . . . . . . . . . . . . 36
5. Personal care chemicals . . . . . . . . . . . . . . . . . . . . . . . . . . . . . . . . . . . . . . . . . . 42
VI. Innovation and Sustainability . . . . . . . . . . . . . . . . . . . . . . . . . . . . . . . . . . . . . . . . . 48
1. Green chemistry . . . . . . . . . . . . . . . . . . . . . . . . . . . . . . . . . . . . . . . . . . . . . . . . 49
2. Climate change . . . . . . . . . . . . . . . . . . . . . . . . . . . . . . . . . . . . . . . . . . . . . . . . . 49
VII. Challenges & Issues: Possible strategies . . . . . . . . . . . . . . . . . . . . . . . . . . . . . . . . . 51
VIII. References . . . . . . . . . . . . . . . . . . . . . . . . . . . . . . . . . . . . . . . . . . . . . . . . . . . . . 54
IX. About Tata Strategic . . . . . . . . . . . . . . . . . . . . . . . . . . . . . . . . . . . . . . . . . . . . . . . . 55
X. About FICCI . . . . . . . . . . . . . . . . . . . . . . . . . . . . . . . . . . . . . . . . . . . . . . . . . . . . . 56
XI. Profile of key specialty chemical manufacturers . . . . . . . . . . . . . . . . . . . . . . . . . . 57
Table of Contents

01
I.Executive summaryThis FICCI report as part of the Gujarat specialty chemicals conclave, prepared by Tata
Strategic Management Group, provides an analysis of key industry segments in India within
specialty chemicals. The report highlights the current market size, project future market
size and growth, map demand-supply scenario and outline the demand drivers. It also
provides insights on key market, technology and regulatory trends and concludes with a
brief outlook on the levers for delivering growth through capitalizing on opportunities and
addressing imminent challenges. The report provides an overview of the business
environment in the state of Gujarat, with special emphasis on specialty chemicals. It
describes salient features and key developments in the investing climate and industrial
policy of the state.
Over the past two decades, Gujarat has become one of the most preferred locations for
industrial investment in India. Gujarat has achieved an annual growth rate of over 10% p.a.
over the past five years and is one of the most industrialized states of India. It accounts for
16% of the nation's industrial production and 22% of its exports. Gujarat possesses several
advantages which have enabled it to chart a path of rapid growth and industrialization such
as sound infrastructure facilities, availability of skilled and semi-skilled manpower, excellent
domestic and international connectivity and rich natural resources. The key differentiating
factor has been Gujarat's investor-friendly policy towards industrial development. These
have resulted in Gujarat evolving as the hub of India's chemical and petrochemical industry -
with the state accounting for more than half of India's total chemical industry and ~63% of
total national petrochemical production. The chemical industry is today the largest and
fastest growing component of Gujarat's manufacturing sector.
Specialty chemical industry is a knowledge driven industry and it has been growing rapidly at
1.2-1.3x of GDP growth rate (~12%) over the last five years. It currently stands at ~$21.5 billion.
Domestic demand of specialty chemicals is expected to follow an accelerated growth path.
This demand is mostly driven by the strong growth outlook for end use industries. This along
with increased adoption of specialty chemicals and newer applications can propel the
growth further.
Indian specialty chemical manufacturers have strong presence in export market also. APIs
and colorants (including dyes and pigments) are the key products exported. India exports
specialty chemicals to nearby Asia-Pacific countries which don't have competitive scale of
production. India also exports to developed countries of Europe and USA where it leverages
its low cost of production and quality talent pool. Ability of companies to comply with global
regulations and India's manufacturing competitiveness has helped the export market to
grow significantly.
Conclave-2013
Gujarat
Figure III 1: Past growth of specialty chemicals in India, $ Bn. . . . . . . . . . . . . . . . . . . . . . . . . . . . 04
Figure III 2: XIIth plan targeted growth for specialty chemicals in India, $ billion . . . . . . . . . . . . 05
Figure III 3: Growth projections of specialty chemicals market size, $ Bn . . . . . . . . . . . . . . . . . . 07
Figure III 4: Key export destinations for specialty chemicals . . . . . . . . . . . . . . . . . . . . . . . . . . . . 09
Figure III 5: Projected global market size of specialty chemicals, $ Bn . . . . . . . . . . . . . . . . . . . . . 10
Figure V 1: Average crop protection consumption (Kg/ Ha). . . . . . . . . . . . . . . . . . . . . . . . . . . . . 22
Figure V 2: Market distribution of agrochemicals by product category . . . . . . . . . . . . . . . . . . . 24
Figure V 3: Future growth potential of agrochemicals, $ Bn . . . . . . . . . . . . . . . . . . . . . . . . . . . . 25
Figure V 4: Indian Pharmaceutical Segment, FY10. . . . . . . . . . . . . . . . . . . . . . . . . . . . . . . . . . . . . 27
Figure V 5: Market size of API (including exports), $ billion . . . . . . . . . . . . . . . . . . . . . . . . . . . . . 28
Figure V 6: Segments of Indian Paint industry . . . . . . . . . . . . . . . . . . . . . . . . . . . . . . . . . . . . . . . 30
Figure V 7: Segments- Decorative paints. . . . . . . . . . . . . . . . . . . . . . . . . . . . . . . . . . . . . . . . . . . . 30
Figure V 8: Segments - Industrial paints . . . . . . . . . . . . . . . . . . . . . . . . . . . . . . . . . . . . . . . . . . . . . 31
Figure V 9: Segments-Construction Chemicals . . . . . . . . . . . . . . . . . . . . . . . . . . . . . . . . . . . . . . . 32
Figure V 10: Key manufacturing locations for paints . . . . . . . . . . . . . . . . . . . . . . . . . . . . . . . . . . . 33
Figure V 11: Classification of colorants . . . . . . . . . . . . . . . . . . . . . . . . . . . . . . . . . . . . . . . . . . . . . . 36
Figure V 12: Classification of dyes . . . . . . . . . . . . . . . . . . . . . . . . . . . . . . . . . . . . . . . . . . . . . . . . . . 36
Figure V 13: Pigments demand, India. . . . . . . . . . . . . . . . . . . . . . . . . . . . . . . . . . . . . . . . . . . . . . . . 37
Figure V 14: Production of major dyes, India. . . . . . . . . . . . . . . . . . . . . . . . . . . . . . . . . . . . . . . . . . 38
Figure V 15: Pigment production, India . . . . . . . . . . . . . . . . . . . . . . . . . . . . . . . . . . . . . . . . . . . . . . 39
Figure V 16: India colorants market breakup . . . . . . . . . . . . . . . . . . . . . . . . . . . . . . . . . . . . . . . . . 40
Figure V 17: India colorants export ($ bn) . . . . . . . . . . . . . . . . . . . . . . . . . . . . . . . . . . . . . . . . . . . . 40
Figure V 18: Industry trends for colorants. . . . . . . . . . . . . . . . . . . . . . . . . . . . . . . . . . . . . . . . . . . . 40
Figure V 19: Segmentation- Personal care ingredients industry. . . . . . . . . . . . . . . . . . . . . . . . . . . 42
Figure V 20: Personal care Inactive ingredients Market . . . . . . . . . . . . . . . . . . . . . . . . . . . . . . . . . 43
Figure V 21: Market share of Inactive ingredients by application . . . . . . . . . . . . . . . . . . . . . . . . . 44
Figure V 22: Personal care Active ingredients market . . . . . . . . . . . . . . . . . . . . . . . . . . . . . . . . . . 44
Figure V 23: Market share of Active ingredients by application. . . . . . . . . . . . . . . . . . . . . . . . . . . 45
Figure VI 1: Sustainability map . . . . . . . . . . . . . . . . . . . . . . . . . . . . . . . . . . . . . . . . . . . . . . . . . . . . 48
Figure VI 2: Interacting factors pushing for innovation and sustainability initiatives . . . . . . . . . 49
List of Figures & Tables

03
II. IntroductionSpecialty chemicals are defined as a "group of relatively high value, low volume chemicals
known for their end use applications and/ or performance enhancing properties." In
contrast to base or commodity chemicals, specialty chemicals are recognized for 'what they
do' and not 'what they are'. Specialty chemicals provide the required 'solution' to meet the
customer application needs. It is a highly knowledge driven industry with raw materials cost
(measured as percentage of net sales) much lower than for commodity chemicals. The
critical success factors for the industry include understanding of customer needs and
product/ application development to meet the same at a favourable price-performance
ratio.
Conclave-2013
Gujarat
02
The key specialty segments in India are agrochemicals, paints coating and construction
chemicals, colorants, Active Pharmaceutical Ingredients (APIs), personal care chemicals
and flavors & fragrances. The critical success factors for most of the specialty chemical
segments include understanding of customer needs and product/ application development
to meet the same at a favorable price-performance ratio.
Going ahead innovation and sustainability initiatives are expected to be major factors for
competitiveness. Development of processes/ products which eliminate or reduce the use of
hazardous substances could become the key priority of producers. Consumers would be
expected to pay premium for green chemistry and environmental preservation initiatives
and appreciate this globally. Moreover stringent regulatory norms could further push the
need for innovation.
Currently the domestic specialty chemical producers also face challenges related to
feedstock availability, higher operational costs, outdated technology/ process, limited
investment in R&D & a negative perception amongst end consumers. Apart from depending
on regulatory interventions, Indian players should come together and proactively work
towards collaborative investment to avert global competition.
05
Figure III 2: XIIth plan targeted growth for specialty
chemicals in India, $ billion
2. Growth drivers
The expected growth rate of specialty chemicals in India is broadly much higher than global
standards. This is because the specialty chemical usage is at a nascent stage in India, with
increasing applications and increased adoption in existing applications to follow. Also the
export potential of specialty chemicals is a strong driver in increasing cost effectiveness of
manufacturers and making the product cheaper for consumption in India. Broadly the
growth is driven by the following three factors:
a. Higher end use demand
With increasing GDP, the Indian middle-class is expected to grow from 31 million households
in 2008 to 148 million households by 2030, with quadrupled consumption. Furthermore,
India's urban population is expected to increase by 275 million people by 2030. This will
result in consumption-led double-digit growth in key end markets over the next decade and
an increased need for better products and services.
Specialty chemical industry growth typically follows the growth of these key end markets.
For example, an increasingly urbanized India (cities are likely to comprise 40% of the
population by 2030) will double the requirement for clean municipal water by 2020, and
therefore significantly increase municipalities' usage of water treatment chemicals to treat/
recycle waste water. Similarly, increased infrastructure spending by the government (The
XIIth Plan recommends USD 1 trillion investment in development of roads, ports, power and
telecom) accompanied by growth in the real-estate industry, could result in over 15 % p.a.
growth in the construction chemicals and coatings segment.
FY12 FY17
23.3
45.0
~14%
Conclave-2013
Gujarat
04
III. India scenario1. Market size
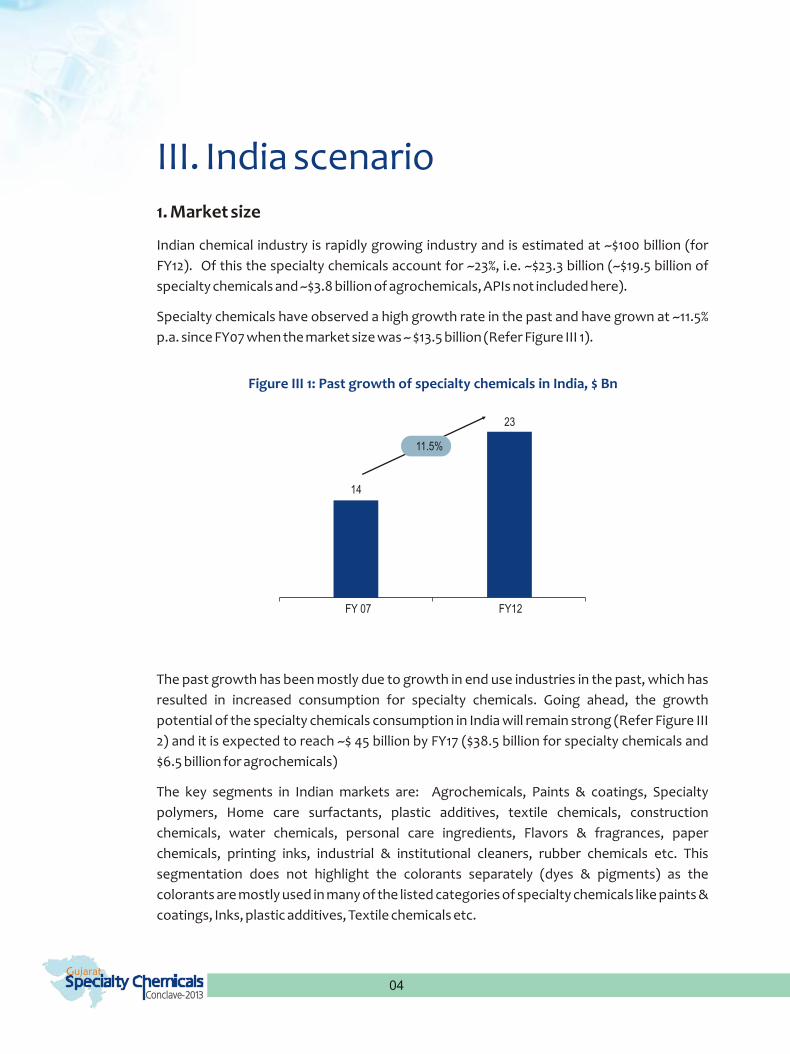
Indian chemical industry is rapidly growing industry and is estimated at ~$100 billion (for
FY12). Of this the specialty chemicals account for ~23%, i.e. ~$23.3 billion (~$19.5 billion of
specialty chemicals and ~$3.8 billion of agrochemicals, APIs not included here).
Specialty chemicals have observed a high growth rate in the past and have grown at ~11.5%
p.a. since FY07 when the market size was ~ $13.5 billion (Refer Figure III 1).
Figure III 1: Past growth of specialty chemicals in India, $ Bn
The past growth has been mostly due to growth in end use industries in the past, which has
resulted in increased consumption for specialty chemicals. Going ahead, the growth
potential of the specialty chemicals consumption in India will remain strong (Refer Figure III
2) and it is expected to reach ~$ 45 billion by FY17 ($38.5 billion for specialty chemicals and
$6.5 billion for agrochemicals)
The key segments in Indian markets are: Agrochemicals, Paints & coatings, Specialty
polymers, Home care surfactants, plastic additives, textile chemicals, construction
chemicals, water chemicals, personal care ingredients, Flavors & fragrances, paper
chemicals, printing inks, industrial & institutional cleaners, rubber chemicals etc. This
segmentation does not highlight the colorants separately (dyes & pigments) as the
colorants are mostly used in many of the listed categories of specialty chemicals like paints &
coatings, Inks, plastic additives, Textile chemicals etc.
FY 07 FY12
14
23
11.5%

05
Figure III 2: XIIth plan targeted growth for specialty
chemicals in India, $ billion
2. Growth drivers
The expected growth rate of specialty chemicals in India is broadly much higher than global
standards. This is because the specialty chemical usage is at a nascent stage in India, with
increasing applications and increased adoption in existing applications to follow. Also the
export potential of specialty chemicals is a strong driver in increasing cost effectiveness of
manufacturers and making the product cheaper for consumption in India. Broadly the
growth is driven by the following three factors:
a. Higher end use demand
With increasing GDP, the Indian middle-class is expected to grow from 31 million households
in 2008 to 148 million households by 2030, with quadrupled consumption. Furthermore,
India's urban population is expected to increase by 275 million people by 2030. This will
result in consumption-led double-digit growth in key end markets over the next decade and
an increased need for better products and services.
Specialty chemical industry growth typically follows the growth of these key end markets.
For example, an increasingly urbanized India (cities are likely to comprise 40% of the
population by 2030) will double the requirement for clean municipal water by 2020, and
therefore significantly increase municipalities' usage of water treatment chemicals to treat/
recycle waste water. Similarly, increased infrastructure spending by the government (The
XIIth Plan recommends USD 1 trillion investment in development of roads, ports, power and
telecom) accompanied by growth in the real-estate industry, could result in over 15 % p.a.
growth in the construction chemicals and coatings segment.
FY12 FY17
23.3
45.0
~14%
Conclave-2013
Gujarat
04
III. India scenario1. Market size
Indian chemical industry is rapidly growing industry and is estimated at ~$100 billion (for
FY12). Of this the specialty chemicals account for ~23%, i.e. ~$23.3 billion (~$19.5 billion of
specialty chemicals and ~$3.8 billion of agrochemicals, APIs not included here).
Specialty chemicals have observed a high growth rate in the past and have grown at ~11.5%
p.a. since FY07 when the market size was ~ $13.5 billion (Refer Figure III 1).
Figure III 1: Past growth of specialty chemicals in India, $ Bn
The past growth has been mostly due to growth in end use industries in the past, which has
resulted in increased consumption for specialty chemicals. Going ahead, the growth
potential of the specialty chemicals consumption in India will remain strong (Refer Figure III
2) and it is expected to reach ~$ 45 billion by FY17 ($38.5 billion for specialty chemicals and
$6.5 billion for agrochemicals)
The key segments in Indian markets are: Agrochemicals, Paints & coatings, Specialty
polymers, Home care surfactants, plastic additives, textile chemicals, construction
chemicals, water chemicals, personal care ingredients, Flavors & fragrances, paper
chemicals, printing inks, industrial & institutional cleaners, rubber chemicals etc. This
segmentation does not highlight the colorants separately (dyes & pigments) as the
colorants are mostly used in many of the listed categories of specialty chemicals like paints &
coatings, Inks, plastic additives, Textile chemicals etc.
FY 07 FY12
14
23
11.5%

07
d. Enabling infrastructure & manufacturing environment
i. National Manufacturing Policy which aims at enhancing share of manufacturing in
national GDP from 16% to 25 % by 2022.
ii. Focus on infrastructure development : Government of India's commitment to increase
spend in infrastructure to 10% of GDP in the 12th Five-Year Plan
iii. India is likely to develop into a manufacturing hub as the industry is shifting away from
developed economies with higher cost of production to developing economy. India acts
an ideal location based on its skill pool as well as low cost of manufacturing
iv. Creating of chemical clusters dedicated to specific segments of the chemical industry
will ensure that optimum safety, logistics and infrastructure is provided for making the
infrastructure & manufacturing environment truly world class at low cost.
3. Growth projections
The market size of specialty chemicals in India has the potential to reach $70- $90 billion by
FY21. The base case growth rate is expected to slightly lower than the XIIth five year plan
targets with an expected growth of ~13% p.a. And the optimistic case is likely to achieve a
growth of ~17% p.a. over the next decade. (Refer Figure III 3)
Figure III 3: Growth projections of specialty chemicals market size, $ Bn
23
70
81
95
X%
~13%
~15%
~17%
Size CAGR
FY12
Base Mostlikely
Highgrowth
FY21(E)
Scenario
Conclave-2013
Gujarat
06
b. Increased intensity of consumption
Compared to the developed world (the US, Europe) or China, the current penetration of
specialty chemicals within India's end markets is low. With an increased focus on improving
products, usage intensity of specialty chemicals within these end markets will rise in India
over the next decade.
For example, India's current expenditure on admixtures is only $1/ m3 of concrete,
compared to $2/ m3 in China and $4.5/ m3 in US. This is primarily due to the lack of awareness
of admixtures in the Indian construction industry which provides benefits, such as improve
the fluidity of concrete, provide a smoother, more even finish, and helps avoid cracks.
Concrete admixtures can also help reduce maintenance and repair costs, and therefore, the
total cost of ownership of construction projects in India. With increasing demand for higher
quality construction and increasing awareness of concrete admixture benefits the industry
could double the intensity of admixture consumption in India.
Similarly, the usage of pesticides in India is 0.58 kg/ ha compared to 2 kg/ ha in China. To meet
India's food requirements - spurred by increasing population, rising income, and limited
availability of arable land - the yield per hectare will need to be increased considerably (e.g.,
crop productivity in India is at 2 MT/ ha compared to China at 5 MT/ ha). This can be achieved
through multiple means (e.g., larger fields, better automation, improved irrigation
infrastructure), along with increased use of agrochemicals.
c. Improved consumption standards
Consumption standards are policies implemented by the government to promote the safe
use of products. These standards are necessary for both improving society's standard of
living and enhancing consumer safety. Most developed countries (e.g. the US, Germany)
have implemented stringent consumption standards across various end-use markets. As
the economy develops, India will need to regulate products more stringently, and
strengthen consumption standards, which in turn will promote increased usage of specialty
chemicals. For instance, the US and Germany are very strict on the usage of solvents in
paints and limit the volatile organic compound (VOC) content. India still uses enamel paints
with high VOC content. Mandating the usage of water-based paints (that contain 5-15%
petrochemicals) will help ensure health and safety of consumers, and encourage the
consumption of higher priced, water based paints (increasing the segment's value).

09
Figure III 4: Key export destinations for specialty chemicals
I. USA
ii. Germany
iii. UK
iv. Turkey
v. Brazil
vi. Italy
vii. China
viii. Korea
ix. Indonesia
x. Pakistan
xi. Thailand
xii. Bangladesh
xiii. Japan
Colorants (dyes and pigments) form the bulk of the export of specialty chemicals.
Agrochemicals export is also on the rise and major destinations for agrochemical exports
are US, UK, France, Netherlands, Spain, Belgium and Asia-pacific countries. API exports from
India are into both regulated and semi regulated markets spanning across the world.
Most of the export is either to the near-by Asia-pacific regions which have downstream
usage of these specialty chemicals but minimal domestic manufacturing or to the
developed countries in Europe and USA which import from India for their manufacturing
competitiveness.
Conclave-2013
Gujarat
08
The base case scenario growth is mostly driven by the expected growth in end use industries
and increasing penetration of specialty chemicals in them which results in almost ~2X GDP
growth rate. The enablers for a most likely growth or higher growth of ~17% p.a. are
accelerated trends of urbanization, infrastructure development, increasing economic
wealth, technology enhancement etc. which could lead to rise in demand for high
performance products/ processes. The extent of accelerated trend could result in varying
scenarios. A faster implementation of PCPIRs will also provide backward linkage in
production support to facilitate high growth case.
4. Opportunities
Specialty chemicals segment has immense growth potential driven by high growing end-use
industries. Technology & innovation will play vital role in growth of this sector where India
has natural advantage of large pool of technical man-power as well as scientists and
researchers.
Some of the upcoming developments that support the growth story for specialty chemicals
are:-
a. Setting up of PCPIRs
b. Up-gradation of technical university to manage talent scarcity
c. Setting up of TUF (Technology up-gradation fund)
d. Increased focus on establishing consumer standards, environment protection
certification etc.
However the execution of these initiatives is likely to define the rate of growth of specialty
chemicals market.
5. Export - Import scenario
a. Export: Key markets and key products
India exports significant proportion of its production of specialty chemicals and API. The key
markets for export of specialty chemicals are (Refer Figure III 4):-

11
c. India's competitive manufacturing
Increasing globalization has resulted in diminishing of geographic boundaries for business
and the trade has been increasingly on the rise. Globally, Asia- pacific countries have
gradually become the key suppliers for bulk of the chemical products. India's
manufacturing competitiveness makes it one the preferred suppliers for most countries.
The key factors contributing to India's manufacturing competitiveness are:-
a) Demographic dividend: India's percentage of working population has been on the rise
and is expected to grow up to ~67% by 2030 from current levels of ~63%. While the
percentage working population has started to dip for countries like China and Japan.
b) Availability of skilled labour force with low wage rates
c) Increased government focus on promoting manufacturing sector through Special
Economic Zones, Petroleum, Chemicals & Petrochemical Investment Regions (PCPIRs),
National manufacturing investment zones (NMIZs) by providing fiscal benefits
The new manufacturing policy of government validates its intent by establishing a target to
increase share of manufacturing in GDP from current 15% to 25% by 2022.
d. Potential for chemical hubs in India
Establishment of PCPIRs is of immense importance for chemical industry as the policy is
expected to attract major investments, both domestic and foreign for chemicals. Three
PCPIRs have already been notified (Dahej, Paradip and Vizag). In addition to this various
SEZs have presence of petrochemical complex (Mangalore and Dahej). These SEZs have a
commitment to be a net foreign exchange earner making their focus strong for accessing
export markets.
6. PCPIR policy
Petroleum, Chemicals and Petrochemicals Investment Region (PCPIR) is a specifically
delineated investment region with an area of around 250 square kilometers planned with
the establishment of manufacturing facilities for domestic and export led production in
petroleum, chemicals and petrochemicals, along with associated services and
infrastructure. It is a flagship scheme of Department of Chemicals and Petrochemicals
started in 2007.
PCPIR policy was expected to attract major investments, both domestic and foreign in the
petroleum, chemical & petrochemical sectors. The nodal agency for PCPIRs is the
Department of Chemicals & Petrochemicals (DoC&PC). The policy objective is to promote
investments and make India an important hub for both domestic and international markets
by leveraging India's low cost manufacturing capability.
Conclave-2013
Gujarat
10
Figure III 5: Projected global market size of specialty chemicals, $ Bn
Increasing global demand is most likely to result in increased production by low cost
manufacturing locations of Asia- pacific. At present India, exports to most of the Asia-pacific
countries and other developed countries of Europe and USA. Going ahead India's exports is
likely to increase further as many of the nearby countries don't have competitive capacities
while developed countries are likely to prefer India over China as sourcing destinations.
In comparison to China, India has balanced IPR regime with good talent pool. Indian legal
system is good and is expected to provide confidence to foreign investors. These along with
good labour laws, low R &D cost and also low cost of capital could push India as a more
preferred destination for setting up manufacturing units.
b. Future global scenario
Currently in FY11 the global market is ~$740 billion and going ahead it is expected to grow by
~5.4% p.a. to reach ~$970 billion by FY16 (Refer Figure III 5). Bulk of the global demand
growth is expected to be driven by Asia-pacific countries and Middle Eastern countries
which have currently lower levels of consumption.
FY11 FY12 FY13 FY14 FY15 FY16
744 785 827 871 918
9685.4%
Global specialty chemicals($ Bn)

13
Figure III 6: PCPIRs in India
In Dahej, the total investment already committed stands at Rs 128441 cr. Investment of
anchor tenant (ONGC-Opal) is Rs 8707 cr., as on May 2012. EIA Study & Environment
management plan has been assigned to NEERI. 6 laning of Bharuch to Dahej stretch is being
undertaken by Gujarat Govt. However the anchor tenant lies within the SEZ and hence has
to be mostly export focused.
Major issues in implementation
Till date Government of India has approved 5 PCPIRs in Gujarat, Andhra Pradesh, West
Bengal, Tamil Nadu and Orissa of which West Bengal has dropped the proposal. Difficulties
of land acquisition and creating infrastructure had been major hurdle in implementing these
projects. The issue of feedstock for downstream industry to the PCPIR's mother unit is also
a contentious issue. While the anchor units are yet to fully configure the projects, except
OPAL's Dahej unit, there is yet to be a firm downstream plan for bulk and specialty
chemicals. Allocation and pricing for supply to downstream unit from the mother anchor
unit are major issues in the absence of any viable business model in Indian context.
The largest potential risks to the success of PCPIRs have been the FDI availability and
feedstock security. Delays owing to global economic crisis and subsequent international
shortage of FDI have derailed the growth track. Despite increasing gas availability due to
new find and LNG; feedstock availability and security still remains a concern. Further delays
and issues in land acquisition and inadequately meeting environmental concerns can
disrupt the mega investment plans.
Conclave-2013
Gujarat
12
PCPIR constituents
A typical PCPIR would comprise of production units, public utilities, logistics, facilities for
environmental compliance, residential areas and administrative services. It would have a
processing area, where the manufacturing facilities, along with associated logistics and
other services, and required infrastructure will be located, and a non- processing area, to
include residential, commercial and other social and institutional infrastructure. The PCPIR
may also include one or more SEZs, Industrial Parks, Free Trade & Warehousing Zones,
Export Oriented Units, or Growth Centers, duly notified under the relevant Central or state
legislation or policy.
Each PCPIR would have a refinery/ petrochemical feedstock company as an anchor tenant.
The internal infrastructure within the PCPIR will be built and managed by a Developer, or a
group of Co-developers. The external linkages will be provided by Government of India and
the concerned state governments. The users, i.e. industrial units located in the PCPIR, of
external and internal infrastructure will pay for its use, except to the extent that the
government supports the service through budgetary resources.
Role of the government
Government of India will ensure the availability of external physical infrastructure linkages
to the PCPIR including Rail, Road (National Highways), Ports, Airports, and Telecom, in a
time bound manner. The infrastructure would be created/upgraded through Public Private
Partnerships to the extent possible. Central Government would provide necessary viability
gap funding through existing schemes as well as make requisite budgetary provisions for
creation of these linkages through the public sector.
The State Government's responsibility includes all physical infrastructure and utilities
linkages under its jurisdiction, identifying a nodal Department, for coordination of these
linkages, facilitating all clearances required from the State Government. This is becoming a
major challenge in implementing PCPIR in time bound manner.
PCPIRs in India
India has identified six PCPIRs, out of which four have been given final notification.
The Haldia PCPIR plan has been shelved as the new government of West Bengal is not
supporting it. However, unlike Haldia, there have been no opposition from any faction of the
society for the other four PCPIRs and their progress is expected to go on as planned. Vizag,
Paradip and Dahej are the PCPIRs with some development whereas Cuddalore PCPIR has
been approved recently in August 2012.

15
IV. Gujarat state advantageOver the years, Gujarat has become one of the most preferred locations for industrial
investment in India. Apart from having sound infrastructure facilities, skilled manpower,
excellent domestic and international connectivity and availability of raw materials, a key
differentiating factor for Gujarat is its focus on industrial development in the state. It has
evolved as an urbanised economy ensuring easy off-take of industrial output. The figure
below lists the map & key parameters of Gujarat.
Gujarat has achieved an annual growth rate of ~10 % p.a. over the past five years and
contributes ~17% to the industrial production of the country.
7.0%
7.2%
10.0%
17.0%
17.7%
26.6%
5.0%Population
Urban population
GDP at current price
No of factories
industrial output
Crude production
Exports
Conclave-2013
Gujarat
14
Conclusion & Recommendation
In conclusion, PCPIRs can deliver economies of scale to close the cost gap and make Indian
producers more competitive. PCPIRs can be the proverbial 'Philosopher's Stone', providing
world class infrastructure facilities at lower costs and also tremendous business potential
and growth to the petrochemical players. However certain steps should be taken in order
to achieve these. The likely steps could be (based on the discussions in the FICCI National
Chemical Committee meetings):
a. A consortium cracker approach may resolve the feedstock issue for downstream units from the mother cracker in the PCPIR. Government can play a facilitative role in bringing potential downstream investors through a workable business process
b. The anchor unit could announce the cracker and call bids for its products from potential downstream units on a long term supply contract. This would ensure assured supply of feedstock to downstream units
c. Pricing of products between upstream and downstream units need to be transparent and market driven
d. Feedstock to the mother unit like naphtha, propane, butane, LPG, reformate should be at zero level of import duty to make such arrangements economically viable
e. Reasonable duty spread between feedstock to the mother unit and output for the downstream would be necessary to make large investment required in the mother unit attractive.
f. Import duty on finished products from downstream unit should be at peak level to make the entire value chain economically viable.
g. Adequate tax and fiscal incentives may be devised for anchor unit / consortium cracker to make the unit economically viable.
h. All state level taxes and duties need to be rationalized

17
Gujarat houses production facilities for some of the largest global and Indian chemical and
petrochemicals manufacturers. Gujarat State Fertilizers & Chemicals Ltd. (GSFC), Gujarat
Alkalis & Chemicals Ltd. (GACL) and Gujarat Narmada Valley Fertilizers Company Ltd. (GNFC)
are the largest public sector units located in Gujarat. GSFC is the only producer of melamine
and largest producer of caprolactum in India. GACL is the market leader in caustic soda
whereas GNFC is one of the leading fertilizers company in the country. Apart from these 3
PSUs, a large number of domestic and multinational companies across various chemical
segments have presence in the state. Leading Indian and multinational private
organizations which have a footprint in Gujarat are Reliance, ONGC, Dow Chemicals,
Cheminova, Lanxess, India Oil (IOCL), Indian Petrochemical Corporation Limited (IPCL),
Nirma, Essar, BASF, Bayer, Rallis, Novartis, Cadila, Aarti Group and Deepak Nitrite. Gujarat
accounts for ~35% of India's pharmaceutical output with more than 3200 pharmaceutical
companies located in the state. More than 35% of large & medium units in the state are from
chemical industries and chemicals account for ~16% of employment in the state.
Investment climate in Gujarat
A key indicator of investor and industry confidence in Gujarat is the number and scale of
investments and business ventures committed to the state. About 7,936 memorandums of
understanding (MoUs) were signed for INR 20,83,000 crore ($ 450 billion) at Vibrant
Gujarat Summit 2011. Out of that more than 80 MoUs and announcements were signed in
the Vibrant Gujarat summit 2011 for projects to be executed and established in the chemical
and petrochemical sector. The cumulative proposed investment in the sector stood at more
than INR 56,000 crore ($11 billion). Most projects are for establishing industrial parks and
production plants for base chemicals, specialty chemicals and dyes and intermediaries.
90
80
70
60
50
40
30
20
10
0
60000
50000
40000
30000
20000
10000
02003 2005 2007 2009 2011
# of MoUs Investments
Source: Vibrant Gujarat, 2011Note: 1 In chemical & petrochemical sector
Proposed investments1 in Gujarat (Rs Cr)
Conclave-2013
Gujarat
16
In 2010-11, Gujarat contributed 24.6 per cent to India's total exports of goods. Exports
include products from sectors such as textiles, petroleum, chemicals, pharmaceuticals,
engineering, gems and jewellery, naphtha, petrol, clinker, cement, oil cakes, bauxite,
paraxylene, salt, soda ash, food grains, cement clinker, ethylene, Pet-cock etc. The total
cargo handled by the Kandla Port (Only Major port of Gujarat) was 82.5 million tonnes
during 2011-12. Gujarat is also the largest exporter of cotton (60 %) in the country.
The industrial infrastructure of Gujarat is very supportive for business development. The
state's manufacturing industry is supported by 0.34 million MSMEs. Currently, Gujarat has
83 product clusters (refer figure below). The Cluster Development Scheme has been
launched for furthering the growth of product clusters. Some of the successful clusters
include ceramics cluster at Morbi, brass-parts cluster at Jamnagar, fish processing cluster at
Veraval and power-looms cluster at Ahmedabad. Gujarat has 184 industrial estates
established by the Gujarat Industrial Development Corporation (GIDC) for specific sectors
such as chemicals, electronics, gems, apparels and granite. The State Government has taken
care to set up industrial estates on non-agricultural land after assessment of industrial
viability. Such availability of product cluster ensures opportunity across the value chain.
The chemical and petrochemical industry in Gujarat is the fastest growing sector in the
state's economy. Gujarat is the 'Petro Capital' of India, and contributes significantly to the
country's petrochemicals production (62 per cent), chemicals production (51 per cent) and
pharmaceuticals production (35 per cent).Gujarat has truly emerged as the hub of chemical
manufacturing in India. Around 6,600 chemical and petrochemicals products are produced
in the state.

19
DAHEJ PCPIR:
The PCPIR at Dahej, southern Gujarat is spread across a notified area is 453 sq km and it has
received formal approval from DoC&PC in March 2009.
Existing infrastructure
The Dahej PCPIR enjoys proximity to Gujarat Chemical Port Terminal Company Limited
(GCPTCL) and LNG port and access to Delhi - Mumbai Broad Gauge railway line at Bharuch. A
50-km of four-lane Dahej-Bharuch State Highway connects six lane Delhi-Mumbai National
Highway & Expressway.
Investments - Planned and realized
As of June 2011 ~80% of the planned investments in Dahej PCPIR have been realized and
accounting for $ 16 Bn out of a total committed investment of ~$ 20 Bn. Approximately 70%
of the land development is complete and an infrastructure investment of $ 1.7 Bn is
proposed. Also, Dahej PCPIR is notified under the rules for special investment zones with
several tax-related advantages extended to incoming investors.
Upcoming external infrastructure
External infrastructure is being developed to ensure excellent connectivity (sea, road, rail
and air) to Dahej PCPIR:
lPorts: 40 MnTPA Solid & Liquid Cargo and Container Port with investment of $300 Mn;
Container Feeder Terminal (10000 TEU) to Pipavav and Marine Shipbuilding Park by
GMB
lRoads: Ahmedabad-Baroda National Expressway to be extended to Mumbai (PCPIR
loop planned); six-laning of Dahej-Bharuch road; upgradation of 8 km of port linkage &
four-laning of 42 km of State Highways within PCPIR; construction of 25 km of coastal
roads
Conclave-2013
Gujarat
18
The sustained economic success and rapid industrial growth have been made possible by an
unambiguous pro-industry approach by the State. Several policy decisions, execution of key
projects and geographic and demographic factors have helped increase the ease of doing
business in Gujarat, specifically in the chemicals industry.
Infrastructure and strategic location
Gujarat is well connected by the Indian Railways network and has built one of the best road
networks in India. It's a power-sufficient state with a low cost of utilities and one of the
highest per capita power consumption levels. It has the highest number of airports and
second highest number of ports in India. It's the only state with an integrated state-wise gas
grid and has a very high tele-density. Also, the Sardar Sarovar Narmada project, once
completed, is expected create continuous water supply throughout the state. Gujarat is
favourably located midway between the highly industrialized Delhi-Mumbai corridor, giving
it ease of access to high-growth states in North and West. The state has the longest coastline
in the country (1,600 kms) and is well-connected to major trade routes to Europe, Middle-
East, East Asia and Australia though a large number of ports. 38% of the proposed Delhi
Mumbai Industrial Corridor will pass through Gujarat, thereby providing the opportunity for
chemical companies to base their production in Gujarat and serve the Indian market.
Raw material availability
Rich availability of natural resources and basic feedstocks facilitate production of a large
number of downstream chemical products. Availability of limestone, salt, petroleum and
natural gas make Gujarat a leading manufacturer of basic chemicals (e.g. caustic soda,
caustic potash), petrochemicals (e.g. polymers, PE/PP/PVC) and fertilizers (e.g. urea, bio-
fertilizers).
Availability of talent
Gujarat has always been well known for its entrepreneurial talent who have spread their
footprint nationally and across the globe. Additionally, over 45 government and private
management institutes provide a pool of business administration talent. Moreover, there
are ~40 engineering colleges teaching chemical engineering and ~50 polytechnic institutes
offering courses focussed towards the chemicals sector. Overall, Gujarat offers a world-
class pool for talent in entrepreneurship, business administration and engineering, which
could be easily tapped by the industry.
Impetus for growth: Integrated development and PCPIR
The presence of mega-estates in chemical manufacturing at several industrial clusters in the
state has helped growth and expansion of the industry by providing an appropriate business
ecosystem. Chemical clusters especially at Ankleshwar, Panola, Vapi, Vatva, Jhagadia,
Vilayat and Dahej facilitate rapid development and growth.

21
With the existence of conducive business environment, presence of leading companies,
availability of a strong talent pool, entrepreneurial culture and strong policy support by the
State Government, Gujarat is poised to retain and further build on its leadership position in
India's chemical industry going forward.
1. Specialty chemicals in Gujarat
For the growth of any specialty chemicals company two aspects of value chain are very
critical:
i) Need & presence of end consumers
ii) Availability of feedstock
Amongst all states of India, Gujarat is one of the fastest growing states in terms or
urbanization. Its urbanization has increased from 37% to 43% in last decade. As explained
earlier, Gujarat accounts for ~5% of total population whereas in terms of urban population its
share is ~7% (2% higher than share of overall population). The demands of these urban users
are more towards performance & high value added products. This makes Gujarat market a
ripe market for consuming specialty chemical products. One of the key segments of
specialty chemical is agrochemicals. Gujarat as a state faces food security challenge. And
hence the need to increase the yield is quite high. This makes it a good focus market for
agrochemicals. Another example for the site specific need of Gujarat is for water treatment
chemicals. Gujarat is an industrial state with the water availability already in scarce zone.
This has increased the significance of water conservation & hence increased the scope of
water treatment chemicals.
Being an industrial state the perception of chemical industry is not so bad in Gujarat. In
addition Gujarat govt. has planned effectively in recent past to ensure environmental safety
& communication of the same to its citizens. The presence of downstream industries is
huge, based on favorable investment policies of govt. in the past. Gujarat accounts for ~10%
of the total industries in India. The entrepreneurial spirit of Gujarat is well acclaimed & hence
a lot of small & medium enterprises could also be found here.
For feedstock availability, Gujarat alone accounts for more than 40% of the refining capacity
in India. And with RIL& OPaL crackers the availability of raw materials should not be a major
concern. However the challenge for the availability still remains, as the fragmented
structure of specialty chemical producers does not guarantee a regular off take for crackers.
This makes feedstock for specialty chemical a low priority in their product portfolio.
Apart from these another major hindrance for growth of specialty chemical is technology.
The level of R&D in Gujarat is limited (in comparison to India it is still better). However going
ahead with many foreign MNCs increasing their presence & govt. promoting industry
academia linkages, Gujarat is likely to overcome this hurdle also.
Conclave-2013
Gujarat
20
lAir: Greenfield airport for PCPIR ; airstrip at Ankleshwar
lRail: Broad gauge conversion of Bharuch-Dahej rail line (62 km); connection with Delhi-
Mumbai Dedicated Freight Corridor (DFC)
Support for micro, small and medium enterprises
Gujarat state government, since 2000, has adopted a policy of supporting SMEs. Some of
the features mentioned could be favorably capitalized by existing companies and new
entrants in the chemical industry:
l5% interest subsidy on loans for modernization programmes
lInterest subsidy on eligible parameters, e.g. sector, size, etc.
lVenture capital and patent monetization assistance
lTechnology acquisition fund
lSupport for vendor development
lSupport for auxiliary industries for value-addition
lCluster development in PPP mode
lRehabilitation of sick units
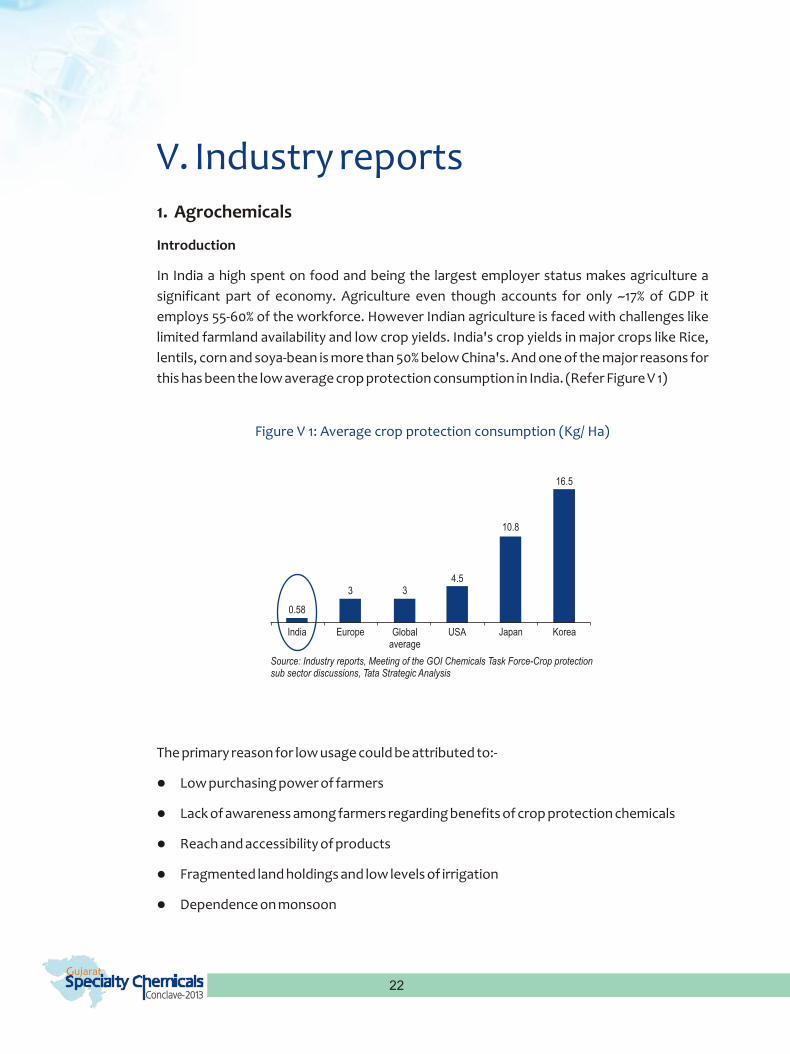
23
Agrochemicals are used to improve crop performance, yield or control pests, etc.
Agrochemicals are substances manufactured through chemical or biochemical processes
containing the active ingredient in a definite concentration along with other materials
which improve its performance and increase safety. For application, these are diluted with
water in recommended doses and applied on seeds, soil, irrigation water and crops to
prevent the damages from pests. There are broadly 5 categories of crop protection
products: Insecticides, fungicides, herbicides, bio pesticides and others (includes
nematocides, rodenticides etc.).
Market overview
Currently, the crop protection chemicals/ agrochemical accounts for ~3.5% of the total
chemicals market in India. The domestic crop protection market is estimated at ~$2 Bn,
whereas the exports market is estimated at ~$1.8Bn making its total market size of $3.8Bn.
The crop protection industry in India is generic in nature with ~80% of the molecules being
non-patented. Hence, strong distribution network and brand image act as competitive
factors. Crop protection chemicals are manufactured as technical grades and converted
into formulations for agricultural use. The crop protection industry consists of technical
grade manufacturers, formulators producing the end products, distributors and end use
customers. According to Pesticide Monitoring Unit, GOI, there were about 125 technical
grade manufacturers, including about 10 multinationals, more than 800 formulators and
over 145,000 distributors in India in 2007. Over 60 technical grade pesticides are being
manufactured indigenously.
End use
customers DistributorsFormulatorsTechnical grade
manufacturers
Technical grade manufacturers sell high purity chemicals in bulk (generally in drums of 200-
250 kgs.) to formulators. Formulators, in turn, prepare formulations by adding inert carriers,
solvents, surface active agents, deodorants etc. These formulations are packed for retail
sale and bought by the farmers.
Insecticides form the largest segment of the domestic crop protection chemicals market
accounting for 55% of the total market. It is mostly dependent on rice and cotton crops.
Herbicides are the largest growing segment and currently account for 20% of the total crop
protection chemicals market. Sales are seasonal, owing to the fact that weeds flourish in
damp, warm weather and die in cold spells. Rice and wheat crops consume the major share
of herbicides. Increasing cost of farm labour will drive sales of herbicides going forward.
Fungicides, accounting for 20% of the total crop protection market, are used for fruits and
Conclave-2013
Gujarat
22
V. Industry reports1. Agrochemicals
Introduction
In India a high spent on food and being the largest employer status makes agriculture a
significant part of economy. Agriculture even though accounts for only ~17% of GDP it
employs 55-60% of the workforce. However Indian agriculture is faced with challenges like
limited farmland availability and low crop yields. India's crop yields in major crops like Rice,
lentils, corn and soya-bean is more than 50% below China's. And one of the major reasons for
this has been the low average crop protection consumption in India. (Refer Figure V 1)
Figure V 1: Average crop protection consumption (Kg/ Ha)
The primary reason for low usage could be attributed to:-
lLow purchasing power of farmers
lLack of awareness among farmers regarding benefits of crop protection chemicals
lReach and accessibility of products
lFragmented land holdings and low levels of irrigation
lDependence on monsoon
India Europe Globalaverage
USA Japan Korea
0.58
3 34.5
10.8
16.5
Source: Industry reports, Meeting of the GOI Chemicals Task Force-Crop protectionsub sector discussions, Tata Strategic Analysis

25
Key growth drivers include:
1. Increasing demand for food grains: India has 16% of the world's population and less than
2% of the total landmass. Increasing population and high emphasis on achieving food
grain self-sufficiency is expected to drive growth.
2. Limited farmland availability: India has ~190 Mn hectares of gross cultivated area and the
scope for bringing new areas under cultivation is severely limited. Available arable land
per capita has been reducing globally and is expected to reduce further. The pressure is
therefore to increase yield per hectare which can be achieved through increased usage
of agrochemicals.
3. Low Productivity: India has low crop productivity as compared to other countries.
Average productivity in India stands at 2 MT/ha as compared to 6 MT/ha in USA and
world average of 3 MT/ha. At the same time, India's pesticide consumption is also low at
0.60 kg/ha as compared to the world average of 3 kg/ha.(Source: India stat, Industry
reports) Hence, increased usage of pesticides could help the farmers to improve crop
productivity. By educating farmers and conducting special training programs regarding
the need to use agrochemicals, Indian companies can hope to increase pesticide
consumption.
4. Growth of horticulture and floriculture: Buoyed by high growth experienced by Indian
floriculture industry, Government of India has launched a national horticulture mission
to increase production (Source: National Horticulture Mission) Growing horticulture
and floriculture industries will result in increasing demand for agrochemicals, especially
fungicides.
Figure V 3: Future growth potential of agrochemicals, $ Bn
FY12 FY17
3.8
6.5
~11.5%
Source: Industry reports, Research by Tata
Conclave-2013
Gujarat
24
vegetables and rice Farmers moving from cash crops to fruits and vegetables and
government support for exports are increasing the fungicides usage. Bio-pesticides include
all biological materials organisms, which can be used to control pests. Currently a small
segment, bio-pesticides market is expected to grow in the future owing to government
support and increasing awareness about use of non-toxic, environment friendly pesticides.
With increasing penetration of BT cotton, usage of insecticides has witnessed a decline in
the recent past. Its share in the total crop protection chemicals has reduced from 69% in
2004 to 55% in 2011. On the other hand, share of herbicides and fungicides has increased from
17% and 13% respectively in 2004 to 20% each in 2011 (Refer Figure V 2). This is due to increased
focus on fruits and vegetables and higher awareness levels among end users.
the major players in agrochemicals in India are Bayer, Rallis, United Phosphorus, Syngenta
etc.
Figure V 2: Market distribution of agrochemicals by product category
Future growth potential
Even though the Indian agricultural sector is highly dependent on monsoons, the market for
agrochemicals is expected to grow at a rapid growth rate of ~11.5% p.a. to reach $6.5 Bn by
FY17 (Refer Figure V 3).
Market districategory FY04
bution by product
Source: Industry reports, Tata Strategic analysis
Market districategory FY11
bution by product
Fungicides13%
Biopesticides &Others,
1%
Herbicides17%
Insecticides69%
Fungicides20%
Biopesticides &Others,
5%
Insecticides55%
Herbicides20%

27
The API exports and the consumption of API for domestic formulations together account
for a market size of almost $8.1 billion in FY10 with the API domestic consumption
accounting only for ~35% of the total production ($2.8 Bn). There has been growth in the
export of the API as the market is estimated to grow from ~60% of total production in 2008-
09 (Source: Indian Pharmaceutical Industry, 2009 & ICRA) to ~65% in 2009-10. This trend is
also evident from the rising number of deals by Indian players for supplying API in recent
years. List of some of the deals is given below (Refer Table V 1):-
Indian company MNC partner Deal type
Piramal healthcare AstraZeneca Several APIsAllergan two APIsPfizer some APIs
Divi's Labs Abbott Labs N.A.GSK two APIsMerck & Co. one API
Dishman Solvay four APIsAstraZeneca one APIGSK some APIs
Shasun Chemicals GSK one APIEli Lilly one API
Cadila Healthcare Nycomed one APIWyeth one API
Alembic Pfizer one API
Hikal Pfizer one APIApotex one API
Aurobindo Pharma Pfizer Several APIs
Matrix Labs Mylan Acquisition
RAKS Pharma Amneal Pharma Acquisition
Figure V 4: Indian Pharmaceutical Segment, FY10
API (exports) 24%
Formulations (domestic+
exports)76%
Source: Department of Pharmaceuticals Annual Report 2010-11 Research by Tata Strategic
The Pharmaceutical market FY10:~$21.8Bn
Conclave-2013
Gujarat
26
5. Growth of plasticulture: Enhancing agricultural productivity to meet growing demand
for food and achieving food security for the entire population is one of the key
objectives of the country. Plasticulture include soil fumigation film, irrigation drip
tape/tubing, nursery pots and silage bags, but the term is most often used to describe all
kinds of plastic plant/soil coverings. Such coverings range from plastic mulch film, row
coverings, high and low tunnels (polytunnels), to plastic greenhouses. The rise of this
segment will lead to increased innovation & development of different usage avenues
for specialty chemicals in agriculture.
2. Fine chemicals
Introduction
Fine chemicals or Active Pharmaceutical Ingredients (APIs) are integral components of both
the quality and the cost of pharmaceutical goods. Pharmaceutical are one of the key
necessities for public and this requires that API players must account for high quality,
sustainability and low prices. Driven by lower costs and high quality (requires skill set and
R&D also) the manufacturing of APIs have gradually moved to manufacturing competitive
countries of Asia-pacific like China and India. Mostly for generic drugs the cost
competitiveness becomes the key and as going ahead by 2014 almost $3Bn worth of drugs
are going off patent this increases the potential for API manufactures in India drastically.
Market overview
Indian players are also increasingly involved in providing API for regulated markets. Players
such as Piramal Healthcare, Divi's Labs, Dishman Pharma, Shasun and Aurobindo etc. supply
API for patented products to large and mid-sized pharmaceutical players in regulated
markets.
The total turnover of pharmaceutical segment in FY10 was ~$21.8 billion .Details of the
overall market size are given below (Refer Figure V 4). The market break up is such that the
of the total pharmaceutical segment API exports account for ~24% of the total turnover
resulting in a market size of ~$5.3 Billion. Rest $16.5 Billion is captured by formulations.

29
The global pharmaceutical industry is witnessing a strong generics push, as drugs totaling
annual revenues of around $150 billion will go off-patent during FY11 to FY15. Additionally,
declining revenue growth due to a fall in the prices of drugs and decreasing research and
development (R&D) productivity (despite an escalation in drug development costs) has
forced big pharmaceutical players to cut costs and outsource manufacturing of API to
cheaper destinations like India.
These developments have provided Indian API manufacturers an opportunity to increase
their penetration in the US and Europe generics market. API exports for off-patent drugs are
expected to grow at a CAGR of 17-19% over the next 5 years. Also driving exports will be the
decline in the profitability of global players due to severe competition in the space. The
emphasis on reducing healthcare costs by governments of regulated markets will give a
further fillip to generics and in-turn API export.
In terms of low cost, China is more preferable over India, however still global players prefer
India because of documentation issues (language of documents), quality concerns, and
India's advanced process chemistry skills. Also, India has the highest number of US FDA (US
Food and Drug Administration) approve facilities outside the US. In the case of some
players, forward integration into pre-formulations is also provided by Indian manufacturers.
India accounts for nearly 35 per cent of Drug Master Files of the total drug master filings
(DMFs) to the US FDA, the share of Indian players has risen sharply to about 35 per cent in
2010 from about 14 per cent in 2000. 271 DMFs in 2009 and 311 DMFs in 2010 were added. This
suggests that Indian players have been able to maintain the required quality standards to
export to regulated markets. (A DMF provides an indication about the bulk drug
manufacturing capabilities of players in terms of its quality standards at facilities,
processing, packaging, storage of drugs etc. to the global pharmaceutical company who is
outsourcing). Sizeable gap exists in the DMFs of India in comparison to competing countries
like China (12%) and Japan (5%).
Hence for API export which is one of the critical elements in value chain, India's
manufacturing competitiveness is most likely not threatened.
3. Paints, Coatings & Construction chemicals
Introduction
Paints & Coatings: India is one of the major participants in the global paints and coatings
industry. The industry can be broadly classified into 2 segments (Refer Figure V 6)
Conclave-2013
Gujarat
28
Over the past few years, Indian pharmaceutical players have been increasingly tapping
opportunities in global generics markets, especially the US and Europe. Medium-sized and
small players, meanwhile, have targeted the semi-regulated markets of Africa, Asia and
Latin America to enhance their distribution network. Also cost involved for approvals and
the hassles of regulated market has acted as impediments for medium and small players.
Buoyed by the above trends, For API manufacturers, a burgeoning generic market and cost-
reduction measures by global pharmaceutical companies present a huge opportunity in
regulated markets. India, which has lower manufacturing costs, well-developed process
chemistry skills and the largest number of drug master filings globally, is well-placed to tap
export opportunities in regulated markets. Accordingly, bulk drugs exports have grown
posted a robust CAGR of over 25% between FY06 and FY10, with exports to regulated
markets (having an estimated 52 per cent share) registering a CAGR of about 35 per cent in
the said period.
Typically large players are more profitable due to their wide base in regulated markets,
which fetch higher realizations. However, a significant exposure to international markets
also makes large players vulnerable to risks such as currency volatility, overall market
performance and outsourcing plans of key players in the target destinations etc.
Future growth potential
The overall market of API is expected to grow at ~16% p.a. in the next five years to reach ~$17
billion by FY16 from current levels of $8.1 Billion (Refer Figure V 5).
Figure V 5: Market size of API (including exports), $ billion
FY10 FY16
0.1
18.7
~1.5%
X% Size CAGR

31
Construction Chemicals: Construction Chemicals are the chemical compounds used in
construction activities. These compounds can be used in existing construction projects to
speed up the construction work or in new construction projects to impart durability and
strengthen the structures. Construction chemicals increase the cost of the project by 2-5%
but the benefits are multi-fold. Certain chemical products help in minimizing the quantities
of cement and water used in the construction. Based on end use applications, these
compounds can be broadly classified into five categories.
Figure V 8: Segments - Industrial paints
Others5%
Marine10%
Powder13%
Auto36%
Refinish12%
Protective24%
Industrial paints segment wise breakup
Conclave-2013
Gujarat
30
Decorative Paints: This segment primarily caters to the residential and commercial buildings
and accounts for 70% of the total paint industry. Enamels are the most widely used followed
by distempers and emulsions. Interior and exterior paints account for 75% and 25% of the
decorative paints respectively (Refer Figure V 7). On the basis of product composition,
decorative paints are of two kinds - water based and solvent based.
Industrial paints: This segment includes paints used in automobiles, auto ancillaries,
consumer durables, containers, etc. (Refer Figure V 8). This segment requires technological
expertise and therefore it is largely served by the organized sector. It accounts for 30% of the
overall market.
Figure V 6: Segments of Indian Paint industry
Figure V 7: Segments- Decorative paints
Indian Paint Industry
Decorative70%
Industrial30%
Industrialpaints are
solvent based
Decorative paintsmay be water based
or solvent based
Decorative paints segment breakup
Interior75%
Exterior25%

33
Market overview
The Indian paint industry is estimated at ~$ 5 Bn in FY11. Paint industry is highly consolidated
with 80% market captured by the organized sector. The major players in the paint industry
are Asian Paints, Kansai Nerolac, Berger Paints and ICI. Key manufacturing locations of these
players is given below (ReferFigure V 10).
Figure V 10: Key manufacturing locations for paints
In the decorative segment, Asian Paints is the market leader followed by Berger and Kansai
Nerolac. Kansai Nerolac is the leader in industrial paints followed by Berger and Asian PPG.
The Indian paint industry, valued at ~$ 5 Bn in FY11, has been growing at 1.5-2 times the GDP
growth with a CAGR of 13.5% over the last five years. Owing to the economic downturn, the
growth slowed down in the last 2 years. However, the growth is reported to have picked up
with the resurgence of the construction industry.
The Indian construction chemical industry is estimated at ~$ 0.6 Bn in FY11. It has shown a
strong growth rate of ~16% p.a., historically due to the construction boom in India and
growing awareness in the industry for better quality of construction. With the economic
slowdown, the growth slowed down in 2009, but has regained momentum thereafter.
The construction chemical market is highly competitive and with an increasing number of
global construction companies making a foray into manufacturing operations in India, the
Conclave-2013
Gujarat
32
These compounds impart chemical as well as physical properties in applications such as
cross-linking or phase change (from liquid to solid). They also increase the life of
construction work and impart additional protection from environmental hazards.
In 2011, concrete admixtures accounted for 35% of the total construction chemicals market,
while flooring and waterproofing chemicals had a share of 15% and 10% respectively (Refer
Figure V 9). Other segments include sealants, grouts and adhesives.
Figure V 9: Segments-Construction Chemicals
CONSTRUCTION CHEMICALS
CONCRETE ADMIXTURES
WATER PROOFINGCHEMICALS
FLOORINGCOMPOUNDS
REPAIR ANDREHABILITATION
MISCELLANEOUS
CEMENTITIOUSREPAIR MORTARS
SEALANTS
EPOXY BASEDRESIN MORTARS
PROTECTIVECOATINGS AND
RESINS
GROUTS
ADHESIVES
EPOXY COATINGS
POLYURETHANECOATINGS
LATEX BASED
POLYURETHANE,EPOXY
SHEETMEMBRANES
LIQUID APPLIEDSYSTEMS
PLASTICIZERS
SUPER-PLASTICIZERS
HYPER-PLASTICIZERS
ACCELERATORS, RETARDERS,
AIR ENTRAINMENTS, CORROSION INHIBITERS
Misc.31%
Admixtures35%
Flooring 15%
Water-prooing
15%
Repair & Rehabilitation
9%
Product Share (%of total value)
Source: Industry Reports, Secondary research

35
lUntapped rural market: There is a shift in rural demand from cement paints to better
quality paints.
lGrowing middle class with increasing disposable incomes
Construction Chemicals: The Indian construction chemicals market is expected to show
high growth rate of 15-20% p.a., in the future. Key growth drivers for the construction
chemicals market in India are as follows:
lGrowth in end-use market: Growth in construction activities due to increased
investments in infrastructure, backed by Government of India's commitment to
increase spend in infrastructure to 10% of GDP in the 12th Five-Year Plan
lIncreased penetration: Increasing awareness about quality construction materials such
as performance-enhancing products among consumers and builders, leading to
increased usage of newer products like ready-mix concrete (RMC) etc. Currently, the
use of RMC in construction is around 7% of domestic cement demand. This is expected to
rise to 20 to 25% over the next few years
lChanging regulatory environment: Current and prospective regulatory guidelines
incentivizing energy-efficient and green buildings will drive demand for suitable,
innovative protective coatings and safe chemicals
lIncreasing compliance with international manufacturing standards: Actions are being
taken to implement relevant consumer standards matching with international
standards. For example, ban on onsite mixing of concrete would reduce pollution levels
and generate demand for ready-mix concrete admixtures.
Many newly developed products give better performance and results. Hence, a shift in
demand towards products offering better performance, value-added products such as
silicon caulks, specialty cement additives, polymer-based grouts and mortars etc. is
expected.
Conclave-2013
Gujarat
34
industry is becoming more attractive and experiencing strong growth. The overall market is
fairly consolidated but there is considerable fragmentation of individual products and
application areas. The top 5 players account for ~50% of the market; the rest comprises of
small and unorganized players. FOSROC and SIKA India Pvt. Ltd. are the largest players in the
Indian construction chemicals industry. Other key players include BASF, Pidilite and
Structural Waterproofing Company (SWC) Pvt Ltd. There are many other regional and
smaller players as well. 300 companies are estimated to be operating in this segment.
Industry trends
There is a shift in market shares in favour of organized companies at the expense of
unorganized segment due to entry of organized players into low cost distempers and
enamels. While solvent-based enamels are still popular in India, a shift is being seen from
solvent- to water-based paints. Keeping the environment concerns in mind, companies are
coming up with new lead free and low Volatile Organic Compound (VOC) products. There is
also a perceptible shift towards usage of organic pigments in premium paints with heavy
metal pigments being phased out. Companies which adapt to these trends could grow
successfully in the paints market.
The construction chemicals market in India is still very under-developed when compared to
other countries, such as China, which is much larger at nearly ~$ 7.9 billion. Consumer
awareness is very low regarding new chemical techniques and construction aids. Margins
are lower because most contractors prefer low-cost chemicals to reduce the overall
construction cost. High value products have limited demand and are used only by premium
construction houses. In the past there has been a considerable change in the market share
of companies. Medium-sized and regional manufacturers have gained considerable share of
market.
Future growth potential
Paint Industry: With the market recovering from the economic downturn, the paint industry
is expected to grow at a CAGR of 14% in the next five years. In the decorative paints segment,
water based paints are expected to drive growth with a CAGR of 15%. The key growth drivers
of the paint industry are detailed below:
lLow per capita consumption: The per capita consumption of paints in India is very low at
1.25 Kg against 38 Kg in Singapore, 25.8 Kg in the U.S or 2.5 Kg in China.
lGrowth in automotive industry: Growth of automotive paint industry is directly linked to
the growth of passenger vehicles and commercial vehicles (expected CAGR >15%).
lRapid growth in residential and commercial real estate with regulation permitting 100%
FDI flow

37
There are 12 types of dyes, classified on the basis of the usage, however disperse, reactive
and direct dyes are the most commonly used in India. (Refer Figure V 12).
Pigments are broadly classified as organic and inorganic. The pigment market is estimated
at ~7 lakh tons p.a. with a market size of ~USD 970 Mn. Carbon black and TiO2 accounts for
the 90% of the total pigment demand (Refer Figure V 13).
Figure V 13: Pigments demand, India
There has been a notable transition in the global arena during the last 2-3 decades in the
manufacturing base of colorants, with a shift in production from Europe, USA and Japan to
Asia viz. China, India, Taiwan, Thailand and Indonesia etc. With decline in production in most
of the traditional centers, non-traditional centers like India and China are now preferred
sources for supply of colorants to the global market. India had a distinctive edge over other
centers however based on supportive Chinese government policies the threat from Chinese
manufacturers is increasing.
Preference for eco-friendly products has additionally cast responsibility on the industry to
be more selective and improve the product range with greater focus on R&D. This would
ensure quality and performance colorants to suit the market expectations.
Market overview
The world market for colorants comprising dyes, pigments and intermediates is presently
estimated at approximate value of $27 billion. During the last decade, the industry was
growing at an average growth of 2-3% per annum. Whereas other countries in the world
market contribute nearly 87.5% of the global share, India accounts for 12.5%. Size of the
Indian colorants industry is $3.4 billion in FY10 with exports accounting for ~68%.
Conclave-2013
Gujarat
36
4. Colorants
Introduction
Figure V 11: Classification of colorants
Colorants
Dyes
•
Soluble substances used to pass color to the substrate
•
Major end use industries are textiles and leather
Pigments
•
Insoluble substances and are in powdered or granular
form
•
Impart color by reflecting
only certain light rays
•
Major end use industries are paints and inks
Classification of colorants
Colorants have inherent element of value addition to a wide variety of products like textiles,
leather, paper, food products, cosmetics, plastics, paints, inks and high-tech applications
like optical data storage (CDs, DVDs), solar cells, medical diagnostics (CT Scan,
angiography), security inks, lasers, photo dynamics etc. The colorant industry comprises
two sub segments- dyes and pigments
(Refer Figure V 11).
Figure V 12: Classification of dyes
Dyes: Classification
Source: Industry reports
Reactive
Disperse
Direct
VAT
Others
Dyes

39
Total installed capacity for organic pigment is 80,000 tons p.a., which is way higher than the
demand from the Indian market (Refer Figure V 13). Large proportion of the organic
pigments produced is exported. There are also niche markets in India for special effect
pigments such as metallic and pearlescent. These pigments are usually imported into the
Indian market, with Sudarshan Chemicals being the only domestic manufacturer. Though
the volume for these pigments would be very small as compared to other pigment
segments, they usually command a premium for the design appeal that they provide to the
final product such as automotive coatings and packaging materials.
The industry has grown at ~10% p.a. between FY06 and FY10 with exports growth at 14.5%
p.a. The dyestuffs are exported to Europe, South East Asia and Taiwan to cater to the textile
industries in these countries.
Figure V 16: India colorants market breakup
There has been remarkable growth in the exports of colorants during the last 2 decades.
From a mere $0.03 billion in 1990, exports reached $2.3 billion in 2009-2010 (Refer Figure V
16), having surpassed the estimates envisaged in the ten year strategic action plans
submitted in 1991 and 2001. During the last decade, the industry achieved a growth of 14.5%
p.a. Exports are estimated to grow to $4.9 billion by 2017 (Refer Figure V 17).
Domestic Sales, 1.1
Exports, 2.3
Total ~ USD 3.4 BnSource: DMAI
Conclave-2013
Gujarat
38
The Indian dyestuff industry is highly fragmented and characterised by a large number of
players in the unorganized sector. Today, Indian dyestuffs industry comprises about 950
units (50 in large and organized sector and 900 units under Small & Medium Enterprises
(SME) Sector). These units are mainly present in the western states of Gujarat and
Maharashtra, with Gujarat accounting for almost 80% of capacity.
Within India, the major players in the pigments industry are Sudarshan Chemicals, Golchha
Pigments, Tata Pigments and Clariant India while in the dyestuff industry, companies such as
are Atul, Clariant India, Kiri dyes, and IDI are large players present in the organized sector.
The overall production capacity of dyestuffs is 200,000 tonnes per annum (Refer Figure V
14). With the ever increasing standards of quality and reliability, Indian dyestuffs industry
meets more than 95% of the domestic requirement, out of which textile industry consumes
nearly 60% and the remaining is shared by paper, leather & other consumer industries. As far
as pigments are concerned, the market size is 115,000 tonnes (Refer Figure V 15). The main
consumer industries are printing inks, paints, plastics, rubber, etc., accounting for 70% of the
end use.
Figure V 14: Production of major dyes, India Figure V 15: Pigment production, India
Production of major dyes, India (‘000 tonnes)
Others, 23
Basic, 2Direct, 8
Sulphur, 8
Acid, 30
Reactive, 90
Disperse, 41
Inorganic, 35
Organic, 80
Pigment production, India ('000 tonnes)
Total ~ 115,000 tonnes
Source: DMAI
Total ~ 200,000 tonnes
Source: DMAI
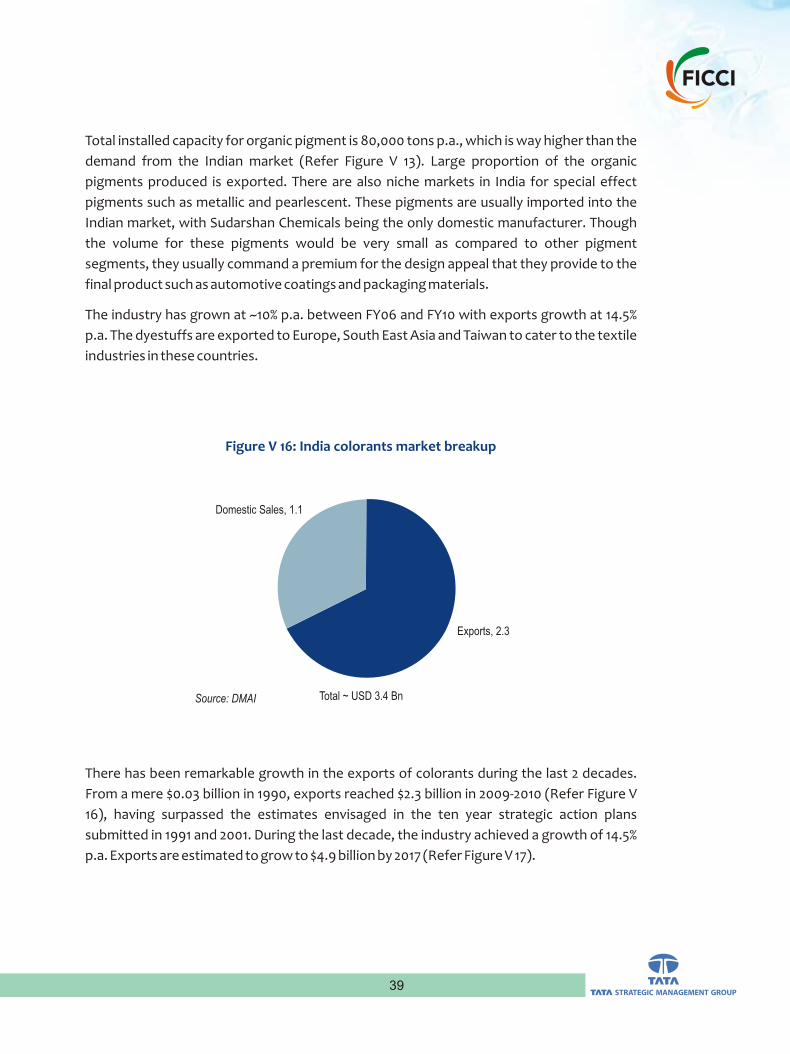
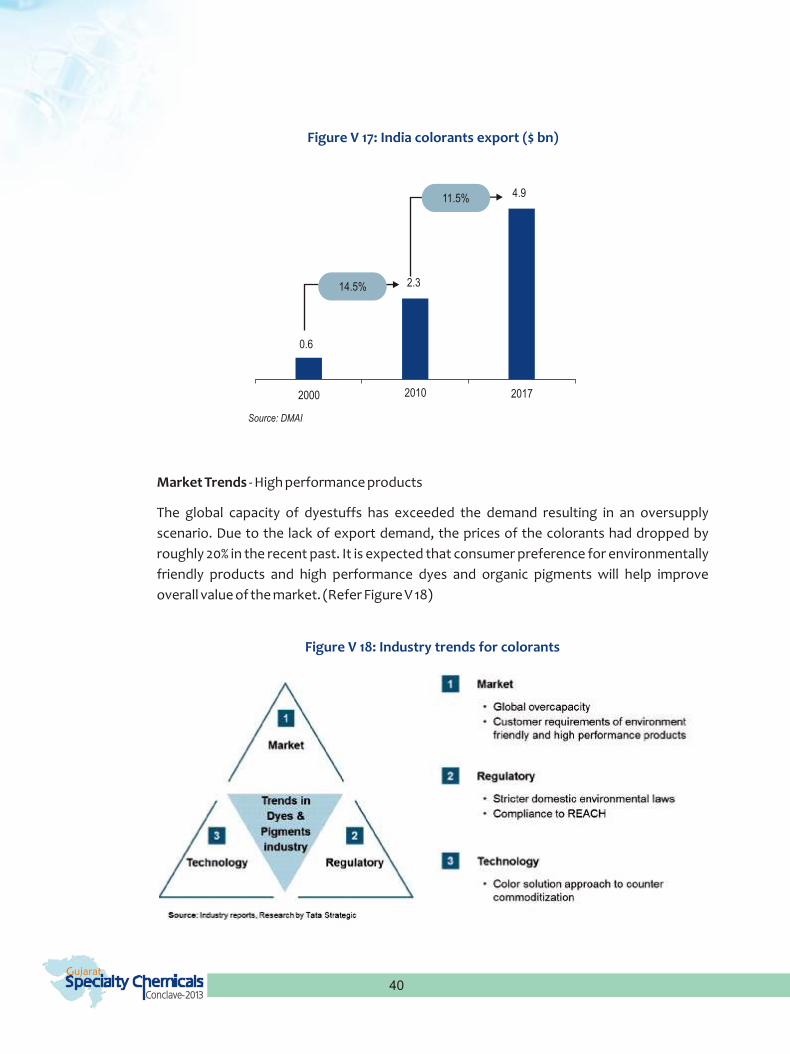
41
Regulatory Trends - Stricter environmental laws
Fiscal policies and excise concessions led to a high level of fragmentation in the Indian
dyestuffs market. However, a gradual reduction in the excise duty has resulted in a more
balanced pricing differential between the organized and unorganized sectors. The
organised sector, with a better product range, technology and marketing reach, was able to
increase its market share. Further, various regulations such as REACH and ban on certain dye
stuffs have impacted the exporters resulting in the closure of small establishments and
helping increase the share of the organized players.
Technological Trends - Commoditization
Since majority of dyestuffs are commodities there is not much product differentiation and
duplication of products is easy. To counter the same, global manufacturers are investing in
research and development to improve the specialty end of their portfolio.
There is also a trend towards providing colour solutions rather than just a colorant.
Collaborations with equipment manufacturers are being undertaken to provide integrated
solutions to customers.
The financial crisis in 2008 has resulted in a demand slump, worldwide over-capacity and
further margin pressures on the dyestuff industry. The Indian dyestuff industry is facing
challenges due to reduced export demand growth and decreasing profitability. Companies
with greater focus on innovation and Research & Development will benefit in the long run.
Adopting green chemistry practices and compliance could become the need of the hour.
Future growth potential
Globally, the demand for dyes and organic pigments is forecast to increase 9% per year to
~USD 16.2 Bn in 2013. This growth will have a direct bearing on the domestic production of
dyes and organic pigments since a large proportion of production is exported. Moreover,
after the REACH (Registration, Evaluation, Authorization and Restriction of Chemicals)
regulation, costs of handling effluents have increased. As a result a large number of
companies have begun to relocate their operations to the Asian markets, particularly India
and China.
Due to a greater use of polyester and cotton-based fabrics, there has been a shift towards
reactive dyes used in cotton-based fabrics and disperse dyes used in polyester. The demand
for reactive and disperse dyes is expected to grow fastest due to this continued demand.
The textile industry will remain the largest consumer of dyestuffs; however growth will be
driven by markets such as printing inks, paints and plastics. These segments are also
expected to increase the consumption of high performance pigments helping improve
profitability. At around 8% growth, the Indian colorants industry (including pigments, dyes
Conclave-2013
Gujarat
40
Market Trends - High performance products
The global capacity of dyestuffs has exceeded the demand resulting in an oversupply
scenario. Due to the lack of export demand, the prices of the colorants had dropped by
roughly 20% in the recent past. It is expected that consumer preference for environmentally
friendly products and high performance dyes and organic pigments will help improve
overall value of the market. (Refer Figure V 18)
Figure V 17: India colorants export ($ bn)
Figure V 18: Industry trends for colorants
14.5%
11.5% 4.9
2.3
0.6
2000 2010 2017
Source: DMAI

43
Inactive ingredients
Personal Care inactive ingredients refer to those ingredients that provide physical and
process able properties to a formulation as opposed to active properties. These include
ingredients such as surfactants, preservatives, colorants and polymer ingredients
Active ingredients
Personal Care active ingredients refer to those ingredients that add active property to a
product that result in benefits to the end user as opposed to the formulation. These include
ingredients such as Anti-ageing ingredients, exfoliators, conditioning agents and UV agents.
Market overview
Personal care ingredients market is valued at ~$450 million in FY11 with Active ingredients
accounting for ~40% of the total market. In 2011, the total Indian personal care inactive
ingredient market was valued at ~$270 million while active ingredients market was valued at
~$180 million.
The market for personal care ingredients in India is becoming increasingly sophisticated.
The constant entry of foreign manufacturers has raised the standards expected of suppliers
in this market. Market is characterized by strong presence of MNCs like Cognis, Dow
Corning, BASF, ISP, DSM, Merck etc. Domestic players like Vivimed Laboratories, SAMI Labs
and India Glycols are gaining prominence.
Premium Segments in India are showing good growth potential with increasing awareness
and evolving consumers who are ready to spend more on quality products.
Inactive personal care ingredients market has grown at a CAGR of 6.9% to reach ~$270
million in FY11 from ~$180 million in 2005 (Refer Figure V 20). Polymer ingredients and
surfactants are key cost drivers for cosmetics and hence a major focus of cosmetics
manufacturers' cost reduction. Most of the inactive ingredients are procured from
domestic suppliers with imports for only special ingredients. The market share of inactive
ingredients by application is also given below (Refer Figure V 21).
Figure V 20: Personal care Inactive ingredients Market
300
250
200
150
100
50
0
6.9%
2005 2006 2007 2008 2009 2010 2011
Inactive Ingredients Market ($ million)
Conclave-2013
Gujarat
42
and dye intermediates) is likely to reach ~USD 5.1 Bn by 2012-13 and is expected to capture 10-
12% of the global market.
The basic raw materials used for the manufacture of dyestuffs are benzene, toluene, xylene
and naphthalene (BTXN). The technology employed by the dyes sector has been well
received in the international market. Some of the units have established joint ventures
abroad using their indigenous technology. The per capita consumption of dyes in India is 50
gms as compared to 400 gms in Europe, 300 gms in Japan which shows that there is
tremendous potential for the Indian market to absorb additional production.
Considerable efforts have been put in by industry and academia on a continuous basis to
deliver colorants with green environment. The need for high performance products has
been to a great extent crystallized. There is also a noticeable trend in the world market with
regard to color solution approach to counter commoditization with the advent of
technological innovations. Innovations on plant based colorants are at advances stages too
and could become a strong game changer.
5. Personal care chemicals
Introduction
The market for personal care ingredients is broadly classified into commodity, fine chemical,
and specialty chemical ingredients. Specialty ingredients are further classified as active and
inactive ingredients based on their functionality in consumer products (Refer Figure V 19)
Figure V 19: Segmentation- Personal care ingredients industry

45
Industry trends (Refer Table V 2)
Market trends
High price sensitivity has limited use of high value personal care ingredients. Market is also
seeing advent of large corporations willing to take long term investment decisions in India.
Typically different sets of personal care products and hence the ingredients are used for low
and middle class segments as compared to the premium segments. There are many Indian
players coming up to provide local substitutes for active ingredients.
Regulatory trends
There are multiple and complex regulations under different bodies due to which there is a
lack in implementation of set guidelines and laws. Drugs and Cosmetics Act (1940) has laid
down the general guidelines about imports, manufacturing, sales and distribution of
personal care products in India. Bureau of Indian Standards has also framed standards
about personal care products as well as the ingredients, completely based on the European
Union's guidelines but these are also not enforced as regulations.
There is an also non-uniform licensing approval across states. Each state has its own FDA and
license is granted by state where the manufacturing unit is located. No separate sales
license is required and there are considerable variations in norms followed by each state.
This leads to inconsistent approach across authorities in interpretation of a particular issue.
Figure V 23: Market share of Active ingredients by application
Conclave-2013
Gujarat
44
Active personal care ingredients market has grown from $110 million in 2005 to reach ~$180
million in 2011 (Refer Figure V 22), registering a CAGR of ~8.2%. In India, UV ingredients and
conditioning agents have a mature market while Anti-aging agents and exfoliators are in
growth phase. Active ingredients are the ones providing the final property to the product.
There are not many manufacturers for the same in India and most of the active ingredients
are being imported. The market share of active ingredients by application is also given
below (Refer Figure V 23).
Figure V 21: Market share of Inactive ingredients by application
Figure V 22: Personal care Active ingredients market
200
175
150
125
100
75
50
25
02005 2006 2007 2008 2009 2010 2011
8.2%
Personal care Active ingredients Market ($ million)

47Conclave-2013
Gujarat
46
Future growth potential
With increasing competition from MNC's and the organized sector, the segment is expected
to see strategic alliances and acquisitions in future. The market is also expected to witness
increased product differentiation and value addition aided by increasing spend on R & D
even by the domestic suppliers. New ingredient formulations are supporting the market
penetration for higher value and premium ingredients.
Increasing demand for personal care products with evolving customers is the key in driving
the growth of personal care ingredients. Personal care products growth is being driven by
factors such as increasing focus on rural markets, increasing disposable income, widening
product portfolios and enhanced value realization by end consumers.
Personal care ingredients market is expected to register a growth of ~8% p.a. to reach a
value of ~$610 million by FY15. Active ingredients are expected to register a higher growth at
~9% p.a. as compared to the growth of inactive ingredients at ~7.4% p.a. This is mainly due to
the improving penetration of functional products as compared to traditional products.
Customers are demanding products for their exact skin type and needs and are willing to
pay premium for quality product.
Technology trends
The market is seeing increasing demand for natural ingredients as customers are becoming
more aware about the contents of the products they use. With certain products being
considered carcinogenic and already been banned in foreign countries, there is a shift in
Indian markets also though a complete ban has not yet been imposed by the government.
For example: The surfactant industry is facing increased pressure to go green due to rising
environmental concerns and the allergenic effects of synthetic surfactants, whereas
International and national manufacturers are reducing their dependence on synthetic
preservatives such as parabens, due to its carcinogenic activity.
Table V 2: List of applications, trends & implications for personal care ingredients
Application Key Trends Implications
Ina
cti
ve
Ing
redie
nts
Surfactants
·Increasing pressure to “go green”
·Focus on natural surfactants due to allergenic
effects of synthetic ones
·Demand for vegetable-derived surfactants
increasing
·Natural surfactants such as soap nut
shells are becoming popular
Colorants
·Special effect pigments – colour shifting
effects, heat-reflection etc.
·Customer demand for newer shades
·Need for joint product development with
formulators
·Intense colours and new metallic shades
being developed
Preservatives
·Reduction of dependence on synthetic
preservatives
·Concerns about carcinogenic properties
·Small, local players gaining prominence
·Movement towards bio-based products
Polymer ingredients ·Need for multi-functional polymers ·
Increased innovation focus
Acti
ve
ing
red
ien
ts
Anti-aging ·Preference for natural products increasing
·
Opportunity to use local knowledge of
herbs and Ayurveda to introduce new
products
Conditioning
·Increasing demand for moisturization
·Increasing competition in other related fields
like skin care etc.
·Increased use of hair care humectants
·Hair care emollient demand acts a s a
potential growth area

49
Currently India fares poorly in chemical research and innovation, accounting for only ~5% of
the global chemical research papers and only ~1% of the global chemical patents. The overall
investment in R&D research scenario in India is reverse to the scenarios in developed
countries. Most of the developed nations have 60-70% of total R&D and innovation
initiatives by industries whereas in India more than 50% research in chemicals is by
Government. The average R&D intensity in India chemical sector was ~2.5% (in FY09). Bulk
of this intensity is due to knowledge intensive specialty chemicals while the bulk chemicals
and fertilizers are at the lower spectrum. In terms of global comparison average R&D of
chemical sector is almost half to the developed countries.
1. Green chemistry
Green chemistry focuses on encouraging the development of products and processes that
eliminate or reduce the use of hazardous substances. However with evolving
understanding of the consumers about the downsides of existing processes Green
chemistry is no longer a proactive step. It is increasingly becoming a tool for
competitiveness. Consumers in many developed countries in Europe and USA are willing to
pay a premium for green chemistry. The adoption of green production and green products is
likely to determine the competitive positioning in near future.
2. Climate change
Climate change is one of the mega trends impacting the industries across the globe. The
attitude of community and governments towards adverse impact to climate is becoming
more stringent and hence new regulations are coming into effect. Reduction in CO2
Figure VI 2: Interacting factors pushing for innovation and sustainability initiatives
Conclave-2013
Gujarat
48
The figure above (Refer Figure VI 1) represents some of the considerations of a specialty
chemicals company for sustainability. A sustainable growth for specialty chemicals is most
likely to depend on the scope of innovation. Various companies are now focusing on
growth of demand and are leveraging innovation as the key to achieve it. Specialty
chemicals can play a major role in improving the quality of life by enabling the manufacture
of the goods and materials that we need whilst mitigating adverse environmental impact.
By developing new usages of specialty chemicals, new processes and sustainable routes to
produce, along with novel environmentally benign materials, we can achieve low carbon
processes that make high value products that are safe for humans and solve energy and
sustainability challenges.
The following chart (Refer Figure VI 2) depicts the three important interacting factors which
define the need for innovation and sustainability initiatives.
VI. Innovation and Sustainability
Figure VI 1: Sustainability map

51
VII. Challenges & Issues: Possible
strategiesSpecialty chemicals companies have a good growth opportunity ahead but their success will
hinge upon how well they address prevailing challenges. Some of the imminent needs /
challenges for the specialty chemical industry are -
Feedstock availability & dependence upon imports for intermediates:
India is a naphtha surplus country and exports most of its naphtha because of lack of
crackers. If this scenario continues to prevail then there will always be lack of basic building
blocks for specialty chemical industry with dependence upon imports for intermediates
becoming very high. Hence, domestic production will be restricted.
To address this, companies need to join hand and strongly push for healthy regulations and
policies which encourage setting up crackers in India. Government is trying to set up
consortium crackers and PCPIRs which is a positive step. However focus should be on
maximizing production of value added products in the country and not on naptha exports.
Even though consortium PCPIR's are planned, long gestation period, inadequate
infrastructure and policy hurdles have made their execution a challenging task. Government
needs to work with industry and provide answers to these issues.
Besides the above, upstream chemical producers need to work in tandem with downstream
speciality chemical companies to ensure adequate and consistent availability of feedstocks.
A collaborative effort in terms of long terms off-agreement between upstream and
downstream companies should be encouraged to create a win-win situation for both.
Highly fragmented industry:
Currently the specialty chemical industry is highly fragmented. Although, some companies
have created world class size, majority operate with limited / small capacities. Hence, the
sector as a whole has not been able to fully leverage economies of scale.
Going ahead, the players need to take a long term view and focus on developing large
capacities rather than incremental capacity. Investment should be towards building scale,
achieving economies of scale and ensuring that domestic demand is met over long term.
Besides the above, companies need to actively look at consolidation as that will help reduce
fragmentation and enhance competitiveness. Companies should focus on their "core
competence" and the businesses or segments which do not constitute "core" of business
should be divested.
Conclave-2013
Gujarat
50
emission is becoming very important for industries to sustain.
Local companies along with MNCs are taking steps to control it. Some of the steps to making
specialty chemicals production sustainable in this parameter are:-
i) Carbon capture and storage e.g.: use of supercritical CO2 for solvent, enhanced oil
recovery, ecofriendly Water Dispersible granules (WDG), Suspension Concentrates
(SC), Oil Dispersion (OD), Micro-emulsion (ME), and Emulsion oil in Water (EW) etc.
ii) Use of aqueous hydrogen peroxide for clean oxidations, use of better catalyst for better
conversion efficiencies etc.
iii) Energy conservation: use of renewables for power generation
iv) Introduce eco-friendly/ bio degradable/ bulk/ recyclable packaging
However just a focus on environment and society is not going to complete the pillar and
hence the economics aspect must also be covered for an innovation based sustainability
strategy. Some of the economic implications of innovations are:-
I) A low energy footprint results in saving power and energy, the cost of which is
substantial for production of specialty chemicals.
ii) Shift towards high value activities could result in higher premiums, brand development
etc. and may compensate for the cost of innovation. This along with a focus on
geographic expansion is likely to bring in more demand for high value products.
iii) Reduction in the cyclicality of the portfolio along with the efficient utilization of raw
materials could be another aspect where innovation may drastically impact the
economic gains
iv) Focus on building knowledge capital and talent pool is likely to bring in innovation that
could drive the competitive positioning of specialty chemical firms
v) With more tighter environmental norms expected to come, it becomes imperative to
develop the specialty chemical products in line with the future needs
Some of these sustainability and innovation initiatives are also needed to be taken up by the
industry together. Setting up of standards or benchmarking, awareness of customers and
producers, recognitions and awards etc. are important for innovation to become a part and
parcel of specialty chemical production.
Compliance with REACH and other stringent regulations imposed by EU and US markets
should encourage the Indian specialty chemical manufacturers to increase their focus on
innovation and sustainability. Indian government currently does not have any stringent
regulations or environmental mandates forcing Indian manufacturers however with
increasing globalization and awareness of consumers, investment in innovation could pay
rich dividends later.

53
Companies need to make their surrounding "green" and should conduct campaigns to
educate the young generation. Such information campaigns will not only educate people
about the "good aspects" of chemicals it will also be a good brand development
opportunity for companies.
While speciality chemical industry addresses growing need for materials required by
different sectors, the companies require complex manufacturing processes that often
involve handling of toxic and hazardous chemicals. As a result, importance of safety, health
and environmental (SHE) protection cannot be underestimated.
Companies need to ensure that meet all safety norms and follow norms as laid out by the
government from time to time. Compromising on SHE norms might appeal economically in
the short term but the long term repercussions are severe and lead to several irreversible
damages to environment and health of human beings working in such environment.
Conclave-2013
Gujarat
52
Limited focus in Technology up gradation and R&D:
Specialty chemicals industry is knowledge driven and progresses on innovation either by
creating breakthrough molecules or meeting the unmet needs of various industries. Indian
companies currently lack true R&D and spend less than a percent of their sales on such
efforts. They are also not upgrading to new processes / technologies at a brisk pace. Even
though we have a large pool of scientists and chemists, the speciality chemicals industry
falls way behind in development of new molecules/ products and filing of patents when
compared to USA, China etc. Many times, investment towards R&D takes a backseat with
respect to continuing day to day operations for Indian companies. Significant numbers of
companies continue to practice technologies which have either become cost in-efficient or
outdated.
This needs to be addressed if companies need to establish themselves as leading players in
their respective segments. A strong commitment from management / promoters is needed
in order to achieve this. Companies can leverage strong talent pool, take Government
support, and centres such as IIP and NCL in order to strengthen their R&D activities.
Moreover, the companies should build strong linkages to academia. This will give
companies access to domain experts and talent pool. In turn, academia can benefit by
getting access to vocational training for their students as well as funding for academia
projects.
Indian government has planned to set up a TUF (Technology Up gradation Fund) which
could be tapped by the Indian companies. Apart from TUF, the companies should focus
towards increasing collaboration & sharing of best practices. Companies should also
explore the option of Mergers, acquisitions & alliances to enhance their technology.
Going forward, focus on R&D and technology up gradation will be a key differentiator for
companies and will be vital to their business success.
Common man perception:
Even though speciality chemicals touch our lives every day be it in the form of toothpaste or
the cell phones we use or cars we drive, yet, the perception of people is that chemicals are
not good and harm human beings. This perception has been created because of safety lapse
incidents and waste management practices prevailing in our country. Such perception also
creates inhibitions in the mind of young generation and restricts them to get interested in
chemistry or chemical industry related career.
Specialty chemical companies need to highlight the advantage that chemistry brings to the
world. Without chemistry, there would be no water or oxygen, the essence of life.

55
IX. About Tata StrategicAbout Tata Strategic:
Tata Strategic Management Group is the largest Indian Owned Management Consulting
Firm. Set up in 1991, Tata Strategic has completed over 500 engagements with more than
100 Clients across countries and industry sectors, addressing the business concerns of the
top management. Today more than half the revenue of Tata Strategic Management Group
comes from working with companies outside the Tata Group. We enhance client value by
providing creative strategy advice, developing innovative solutions and partnering
effective implementation.
Our Offerings
Reports co-authored by Manish Panchal, Charu kapoor and Avinash Singh?
Conclave-2013
Gujarat
54
VIII. References1. Handbook on Indian Chemical Industry, IndiaChem2010, prepared by Tata Strategic &
Roland Berger
2. Knowledge Paper on Specialty, Fine Chemicals, Agrochemicals, Dyes & Pigments and
SME Sector in Gujarat State, IndiaChem Gujarat 2011
3. Specialty Chemical Seminar organized by CII, 2011
4. Specialty Chemicals report by Indian Specialty Chemical Manufacturers' Association
5. Indian Specialty Chemicals Market 2009, Frost & Sullivan
6. Crisil Research
7. www.projecstinfo.in
57
XI. Profile of key specialty
chemical manufacturersa. Agrochemicals
Bayer CropScience India
Company overview Bayer CropScience is one of the world's leading cropscience companies in the world with presence in 122 countries
Product segments/ Verticals Crop Protection
Environmental Science
Bioscience
Manufacturing locations Three manufacturing locations at Thane, Himmatnagar & Ankleshwar
Total production capacity of 5770 MT of active ingredients and formulation capacity of 10,025 KL & 3650 Mt for liquids & solids respectively
Key Mergers/ Acquisitions Merger with Aventis Cropscience Limited worldwide, 2002
Acquisition of Biotech company Athenix Corp., 2009
l
l
l
l
l
l
l
l
Brief profile: Bayer Cropscience
Rallis India
Company overview Rallis is one of the leading Indian agrochemical company
Product segments/ Verticals Agri business domestic: Five segments: Pesticides, seeds, fertilizers, household products & seed treatment chemicals
Institutional business: Formulations & technical bulk sales to leading companies like Bayer, Syngenta, UPL, etc
Contract services: Partnering with leading companies for contract manufacture of technical grades/ formulations & intermediates
Manufacturing locations Five manufacturing plants at Turbhe, Akola, Ankleshwar, Lote & Patancheru
Total installed capacity of pesticides is 16,720 MT for solids &12,500 MT for liquids
Key Mergers/ Acquisitions Majority stake in Bangalore based Metahelix Life, 2010
Co-marketing alliances with several companies such as DuPont, Syngenta, Bayer, FMC, Makhteshim Chemical works, Ghrada Chemicals, etc
l
l
l
l
l
l
l
l
Brief profile: Rallis
Conclave-2013
Gujarat
56
X. About FICCI
About FICCI
Established in 1927, FICCI is the largest and oldest apex business organisation in India. Its
history is closely interwoven with India's struggle for independence, its industrialization,
and its emergence as one of the most rapidly growing global economies. FICCI has
contributed to this historical process by encouraging debate, articulating the private
sector's views and influencing policy.
A non-government, not-for-profit organisation, FICCI is the voice of India's business and
industry.
FICCI draws its membership from the corporate sector, both private and public, including
SMEs and MNCs; FICCI enjoys an indirect membership of over 2,50,000 companies from
various regional chambers of commerce.
FICCI provides a platform for sector specific consensus building and networking and as the
first port of call for Indian industry and the international business community.
To be the thought leader for industry, its voice for policy change and its guardian for
effective implementation.
To carry forward our initiatives in support of rapid, inclusive and sustainable growth that
encompass health, education, livelihood, governance and skill development.
To enhance efficiency and global competitiveness of Indian industry and to expand business
opportunities both in domestic and foreign markets through a range of specialised services
and global linkages.
Our Vision
Our Mission
Industry’s Voice for Policy Change

59
Brief profile: Gharda Chemicals
Company overview Established in 1967
A major player in domestic and export market in India
Product segments/ Verticals Agrochemicals
Intermediates
Pigments
High performance polymers
Contract services
Manufacturing locations Dombivli, Ankleshwar, Lote, Jammu & Panoli
Key Mergers/ Acquisitions Set up Gujarat Insecticides Ltd. In joint venture with Gujarat Agro Industries Corporation Ltd. In 1980
In 1996, Gharda Chemicals purchased the entire holdings of Gujarat Agro Industries Corporation Ltd and Gujarat Insecticides Ltd. Became the subsidiary of Gharda Chemicals.
l
l
l
l
l
l
l
l
l
l
Gharda Chemicals Limited
Company overview It has a global footprint of over 100 countries
Aspires to be the first Indian company to discover, develop and launch its own NCE drug in the global market
It has more than 115 issued patents and 395 pending patent applications in several countries
Key brands Saridon, Lacto Calamine, i-pill, Supractiv, Triactiv, Polycrol, Workz
Manufacturing locations Mumbai, Medak (AP), Chennai, Pithampur (MP), Ahmedabad Raigad (MH), Thane (MH), Baddi (HP)
l
l
l
l
l
Brief profile: Piramal Healthcare
Piramal Healthcare Limitedwww.piramalhealthcare.com
b. Fine chemicals
Company overview Established in 1990 with first plant in 1995
Focus on research & development
Key segments Generics, Intermediates, Protected amino acids, Chiral synthesis, Carotenoids and Nutraceuticals
Manufacturing locations Vishakapatnam and Nalgonda (Andhra Pradesh)
l
l
l
l
Brief profile: Divis Laboratories
Divis Laboratories Limitedwww.divislabs.com
Conclave-2013
Gujarat
58
Company overview Established in 1969 and has its presence in all value-added agricultural inputs ranging from seeds to crop protection & post harvest activity
Has its own subsidiary offices worldwide
Global player with customer base in 86 countries
Product segments/ Verticals Agrochemicals
Specialty chemicals
Industrial chemicals
Manufacturing locations 21 manufacturing location across the globe with 9 in India
Production capacity of 98,264 MT of pesticides & 42,631 MT of pesticides intermediates
Key Mergers/ Acquisitions Product acquisitions from DuPont and Bayer
Company acquisitions of Metahelix Life, Evofarms, AG, Cequisa and ICONA
l
l
l
l
l
l
l
l
l
l
Brief profile: United phosphorus
United Phosphorous Limited
Company overview 84% subsidiary of Syngenta Global
Formed by merging agri-businesses of Novartis & Astra
Product segments/ Verticals Seeds
Crop protection chemicals
Manufacturing locations Manufacturing plant at Santa Monica, Goa
Key Mergers/ Acquisitions Co-marketing alliance with Rallis India
Crop protection technology exchange with DuPont, partnership on improving crop quality with Embrapa - the Brazilian Agricultural Research Corporation, R&D agreement with Dow AgroScience
Product license from Sumitomo
l
l
l
l
l
l
l
l
Brief profile: Syngenta
Syngenta India Limited

61
Brief profile: Kansai Nerolac
Kansai Nerolacwww.nerolac.comCompany overview It is the second largest coating company in India and the market
leader in automotive and powder coating
Nerolac paints is an established brand in decorative paints
Key products Automotive Coatings, Decorative Paints, Powder Coatings, High Performance Coatings, General Industrial Coatings
Manufacturing locations Ratnagiri (Maharashtra),
Kanpur (UP), Rewari (Haryana)
Hosur (Tamil Nadu)
l
l
l
l
l
l
Brief profile: Rhodia
Rhodia Specialty Chemicals India Ltd. www.rhodia.com
Company overview Formerly Albright & Wilson Chemicals India Ltd. (acquired in 2000 by Rhodia)
Key products Alkamuls OR 36, Igepal BC/4, Rhodafac
Manufacturing locations Roha, Maharashtra
l
l
l
Brief profile: BASF Coatings India Ltd.
BASF Coatings Indiawww.basf-india.com
Company overview Independent division of BASF India
Prominent in automotive coatings
Key product lines Electrodeposition coatings, primer surfacer, top coats, base coats, paint system for plastic components
Manufacturing locations Dadra & Nagar Haveli
l
l
l
l
Conclave-2013
Gujarat
60
Company overview Dishman provides a range of solutions at locations in Europe, China and India
Provide highly potent API services which are offered under the carbogen amcis business apart from contract research and manufacturing services (CRAMs)
Key brands Carbogen AMCIS business, specialty chemicals
Manufacturing locations Ahmedabad (Naroda and Bavla plant)
l
l
l
l
Brief profile: Dishman
Dishman Groupwww.dishmangroup.com
Company overview It has a global footprint in over 90 countries
One of the largest privately held pharmaceutical companies in India
Offers more than 50 APIs and has filed 33USDMFs
Key brands Envas, Aciloc, Symbiotik, Clax, Rabeloc etc.
Manufacturing locations API:- Ankaleshwar, Gujarat
l
l
l
l
l
Brief profile: Cadila Pharmaceuticals
Cadila Pharmaceuticals Limitedwww.cadilapharma.com
Brief profile: Asian Paints
c. Paints, Coatings & Construction chemicals
Company overview India's largest paint company and Asia's third largest paint company
Operates in 17 countries and has 24 paint manufacturing facilities in the world
Key products Ancillaries, Automotive coatings, Industrial paints and Decorative Paints
Manufacturing locations Raigad, Satara (Maharashtra),
Ankleshwar (Gujarat), Rohtak (Haryana)
Kanchipuram, Cuddalore (Tamil Nadu), Medka (AP)
l
l
l
l
l
l
Asian Paintswww.asianpaints.com

63
Brief profile: Pidilite
Pidilitewww.pidilite.com
Company overview Started operations in 1959, a pioneer in consumer and specialties chemicals in India
Key products Adhesives and sealants
Manufacturing locations Himachal Pradesh
Maharashtra
Gujarat
l
l
l
l
l
Brief profile: Sudarshan India
d. Colorants
Sudarshan Indiawww.sudarshan.com
Company overview Largest pigment and sole effect pigment manufacturer
Present in business for over 50 years
Key brands Colours: Sudaperm, Sudafast, Sudacolor
Effects: Sumica, Sumicos
Manufacturing locations Roha and Mahad (Mahasrashtra)
l
l
l
l
l
Brief profile: Golchha Pigments
Golchha Pigmentswww.golchhapigments.comCompany overview One of the largest manufacturers of synthetic iron oxide pigments
in India
Also into manufacturing high quality oxide flooring colours, Wall Putty, Tile Adhesive, Cement Paints, Cement Primer and Waterproofing Compound
Key brands Cement Paint: WONDERCEM & ECOCEM , WONDER WHITE, WONDERFIX
Water Proofing: WONDERSEAL, WONDER WALL PUTTY
Manufacturing locations Kalunga and Rourkela in Orissa and Bilaspur in Chattisgarh and a dedicated export office in Rourkela
l
l
l
l
l
Conclave-2013
Gujarat
62
Brief profile: Fosroc India
Fosroc Indiawww.fosroc.comCompany overview Wholly owned subsidiary of Fosroc International
Key products Admixtures, joint sealants, surface treatments
Manufacturing locations Bangalore
Ankleshwar
Rudrapur
l
l
l
l
l
Brief profile: SIKA India
SIKA Indiawww.sika.inCompany overview Convened India operations in 1987
Subsidiary of Switzerland-based parent company
Key products Waterproofing: Sikacim
Tiling: Sika Tilofix
Sealing: SikaBoom
Manufacturing locations Kalyani, West Bengal
Goa
Jaipur
Blending units in Mumbai and Chennai
l
l
l
l
l
l
l
l
l
Brief profile: BASF Construction
BASF Construction Chemicals Divisionwww.basf-cc.co.inCompany overview Wholly owned by the BASF group
Key products Concrete admixtures, joint sealants, flooring and waterproofing
Manufacturing locations Turbhe, Navi Mumbai
l
l
l

65
Brief profile: Sami Labs
Sami Labs Ltd.www.samilabs.comCompany overview Established 1991 in Bangalore
Sales footprint and strategic alliances in USA, Europe, Japan, Australia, Middle East, South Africa, China,
Key products Alpha lipolic acid
Cococin
Ellagic acid
Manufacturing locations Bangalore (4 plants)
Hyderabad
Utah, USA
l
l
l
l
l
l
l
l
Brief profile: India Glycols
India Glycolswww.indiaglycols.com
Company overview Established in 1983, A leading company that manufactures green technology based bulk, specialty and performance chemicals and natural gums, spirits, industrial gases, sugar and nutraceuticals
Key products PE Glycols, Fatty Acid/ alcohol Ethoxylates
Phytochemicals, Polysorbates, Glycol ethers
Performance Chemicals, Natural Gums
l
l
l
l
f. Others
Brief profile: S H Kelkar & Co.
Company overview Largest Indian flavours and fragrances manufacturer
In business for over nine decades
Key end-use customer segments Flavours: Dairy products, bakery, savouries, pharma
Fragrances: Personal care, hair care, fabric care
Manufacturing locations Patalganga, Maharashtra
l
l
l
l
l
S H Kelkarwww.kelkargroup.com
Conclave-2013
Gujarat
64
Brief profile: Atul Industries
Atul Industrieswww.atul.co.in Company overview Diversified company with presence in colours, aromatics,
agrochemicals, polymers and pharma intermediaries
Key brands Vat dyes: Novatic
Acid dyes: Tulacid
Direct dyes: Tuladir
Manufacturing locations Atul and Ankleshwar (Gujarat)
l
l
l
l
l
Brief profile: Clariant Chemicals India
Clariant Chemicals Indiawww.clariant.inCompany overview One of India's leading specialty chemicals companies
No. 1 player in Pigments, Textile Chemicals, Leather Chemicals and Biocides for Paints
Key brands Flame retardants: Exolit®, Polymer additives: Hostavin®
Emulsions: Mowilith® , Mowicoll®, Appretan®
Masterbatches : REMAFIN®, RENOL®
Manufacturing locations Kolshet (Thane), Roha (Raigad), Cuddalore, Kanchipuram
l
l
l
l
l
l
Brief profile: Vivimed Labs
e. Personal care ingredients
Vivimed Labswww.vivimedlabs.comCompany overview Sales footprint across 50 geographies with SBUs in USA, Europe
and a marketing office in China
Key product lines Oral care: Anti-bacterial, enamel protection
Skin care: Anti-ageing, skin lightening
Hair care: Jarocol, dyes, anti-dandruff, UV filters
Manufacturing locations Bonthapally, Bidar, Jeedimetla (Andhra Pradesh)
Haridwar, Kashipur (Uttarakhand)
l
l
l
l
l
l
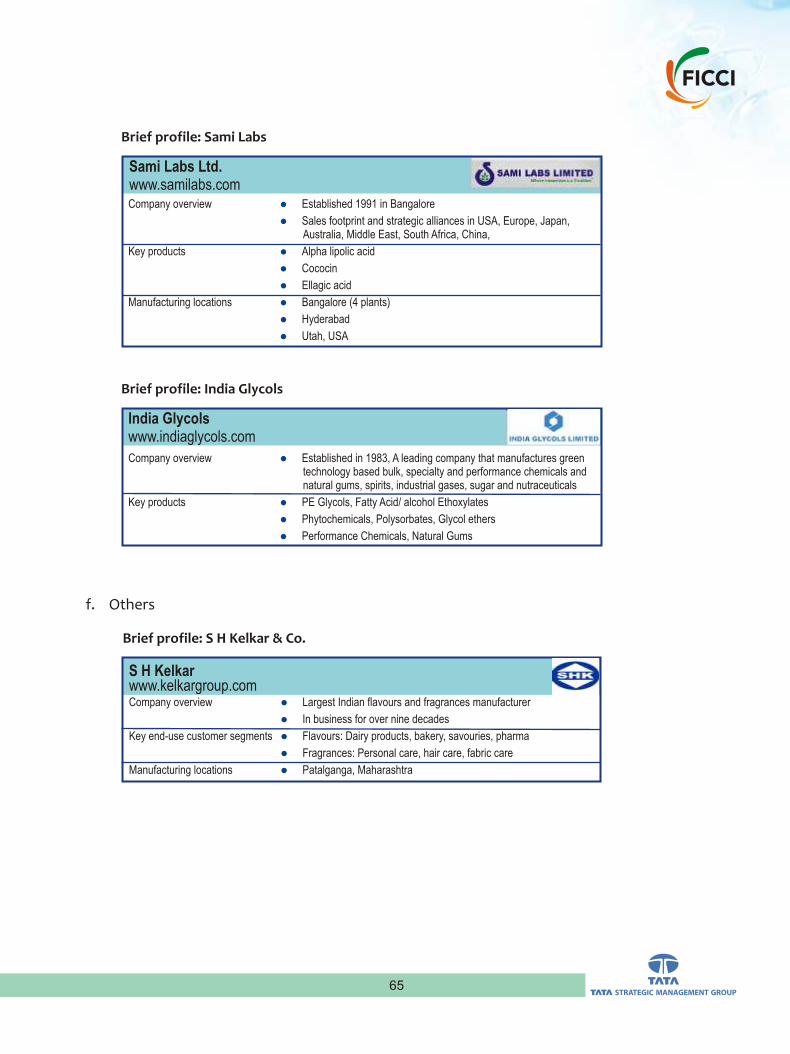

Conclave-2013
Gujarat
66
Brief profile: Sachee Aromatics
Company overview Started by Mr. Manoj Arora, a leading aroma chemical manufacturer for five decades
Key end-use customer segments Personal wash, personal care, fabric care, incense sticks, aerosols, candles, tobacco products
Manufacturing locations Delhi
Paris
l
l
l
l
Sachee Aromaticswww.sachee.com
Brief profile: Givaudan
Company overview One of the leading, MNC, manufacturer of flavour and fragrance for consumer products
Key end-use customer segments Beverages, Dairy, Health & wellness, Savoury, Personal care, Home care
Manufacturing locations Daman (flavour production)
Bangalore (fragrance production)
Mumbai (fragrance and flavour creation/application)
l
l
l
l
l
Givaudanwww.givaudan.com
Brief profile: International Flavors & Fragrances
Company overview A leading global creator of flavors and fragrances
Key end-use customer segments Beverages, Dairy, Savoury, Beauty care, Fabric care, Home care
Manufacturing locations Chittoor, Andhra Pradesh (flavour production)
Chennai (Fralour, fragrance, ingredients production)
l
l
l
l
International Flavors & Fragrances www.iff.com


