18
Gupta Tea Co. Amanda Miller Kent McKimmy Cole Hunstad Kevin Angell Chad Wellsted
| Date post: | 31-Dec-2015 |
| Category: |
Documents |
| Upload: | jessamine-french |
| View: | 22 times |
| Download: | 2 times |

Gupta Tea Co.Amanda MillerKent McKimmyCole HunstadKevin AngellChad Wellsted
Background Tea company based in
Dallas Texas First started growing
selling tea Moved into food retail with
increased competition Purchase grow and
produce most of products

Background Four plants located
throughout U.S.A Five Consolidated
Metropolitan Statistical Area (CMSA)
New York, St. Louis, Chicago, Miami, Los Angeles
Shipping warehouses in each CSMA for distribution
Background Four small plants with
fixed design layout Each plant has
capacity of 6000 units This years sales
demand of 20000 Four plants currently
only producing 5000 units
Background on Case Increase in health tea food competition Despite marketing efforts sales still
declining Underutilized/inefficient plants cause
increased tea prices Used Delphi method to consider next
move

Detail on case Market analyst showed decrease in
forecasted sales Projected sales in 2 years of 15000 Shut down one plant = 20000-5000=15000
keep prices competitive Takes 2 years to officially close plant CSMA’s have relative same decrease in
sales Which Plant to Close???

Sales Forecast Data
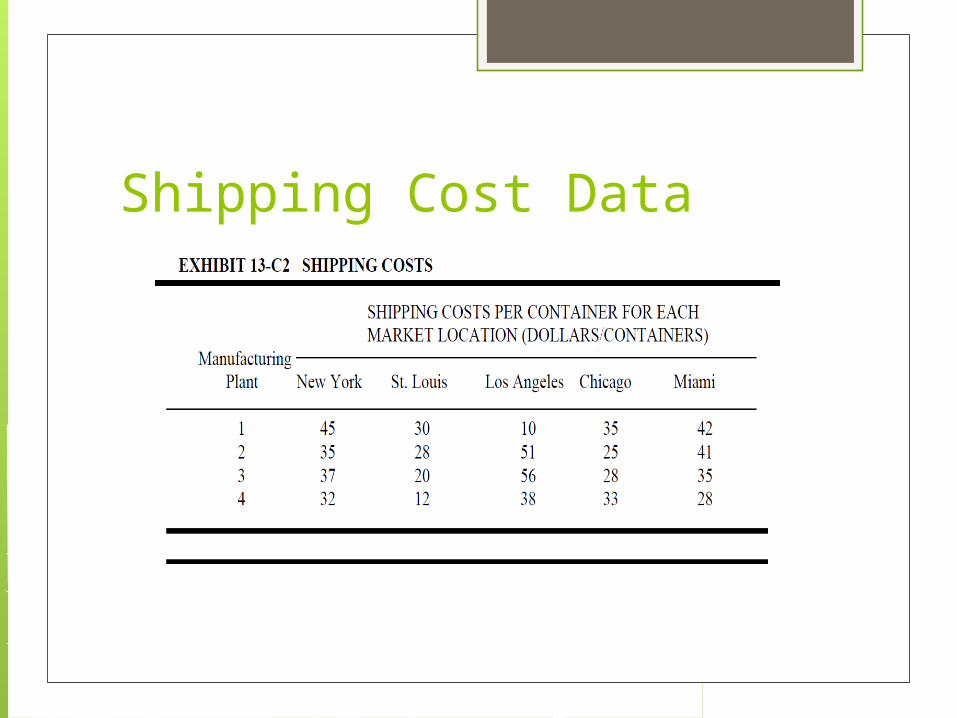
Shipping Cost Data

Total Shipping Costs & Averages
Plant
Average Shipping Costs($)
Plant 1 32.4
Plant 2 36
Plant 3 35.2
Plant 4 28.6
Average Shipping costs= Total shipping costs(NY)+(STL)+(LA)+(CH)+(Miami)/5
Total Shipping Costs for all demand = (45*3350)+(30*2650)+…. For each plant and CMSA
Plants New York St. Louis Los Angeles Chicago MiamiTotal Cost
Plant 1 150750 79500 19000 11725015750
0 524000
Plant 2 117250 74200 96900 8375015375
0 525850
Plant 3 123950 53000 106400 9380013125
0 508400
Plant 4 107200 31800 72200 11055010500
0 426750

Recommendation Using Average
Due to high ASC, shut down Plant 2 What if we didn’t use average?
PlantTotal Forecasted Trans. Costs($) Average forecasted Trans. Costs($)
Plant 1 524000 32.4
Plant 2 525850 36
Plant 3 508400 35.2
Plant 4 426750 28.6
Plant Average Shipping Costs($)
Plant 1 32.4
Plant 2 36
Plant 3 35.2
Plant 4 28.6
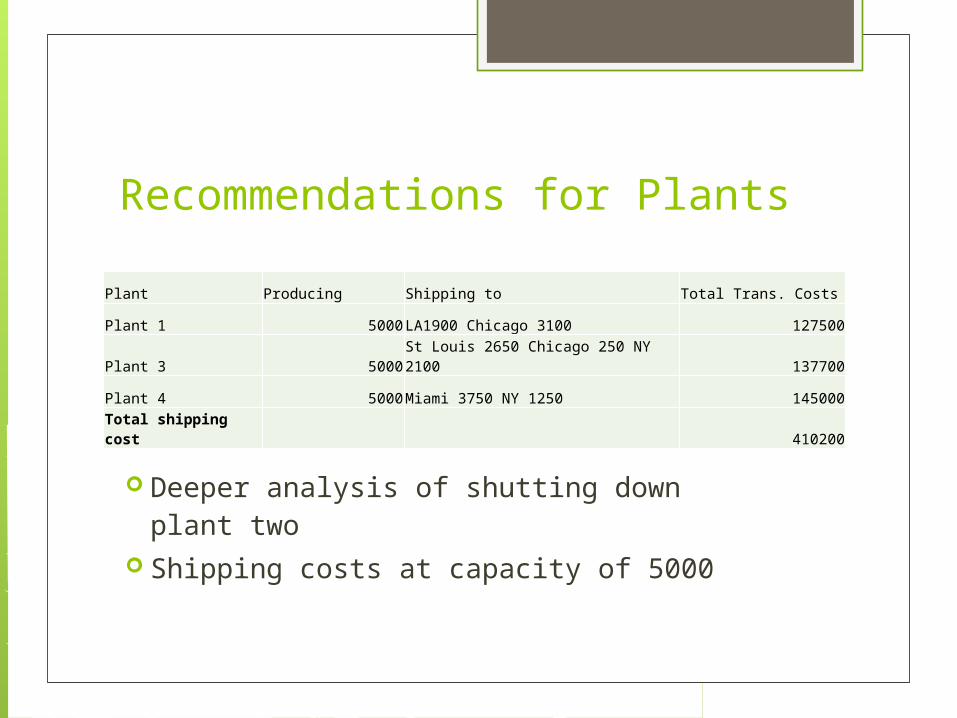
Recommendations for Plants
Deeper analysis of shutting down plant two
Shipping costs at capacity of 5000
Plant Producing Shipping to Total Trans. Costs
Plant 1 5000LA1900 Chicago 3100 127500
Plant 3 5000St Louis 2650 Chicago 250 NY 2100 137700
Plant 4 5000Miami 3750 NY 1250 145000
Total shipping cost 410200

Shut Down Plant 1?
Shutting down plant one yields highest shipping costs
Plant Producing Shipping to Total Trans. Costs
Plant 2 5000Chicago 3350 NY 1650 141500
Plant 3 5000St. Louis 2650 NY 1700 LA 650 152300
Plant 4 5000Miami 3750 LA 1250 152500
Total shipping costs 446300

Shut Down Plant 3?
Shutting down plant three yields $393400 of shipping costs
Lower than shutting down plant one
Plant Producing Shipping to Total Trans. Costs
Plant 1 5000LA 1900 Miami 1900 NY 1700 154300
Plant 2 5000Chicago 3350 1650 NY 141500
Plant 4 5000St. Louis 2650 Miami 2350 97600
Total shipping costs 393400

Shut Down Plant 4?
Higher than shutting down plant three Lower than shutting down plant one Shut down plant three not plant two
Plant Producing Shipping to Total Trans. Costs
Plant 1 5000LA 1900 Miami 1400 NY 1700 154300
Plant 2 5000Chicago 3350 NY 1650 141500
Plant 3 5000St. Louis 2650 Miami 2350 135250
Total shipping costs 431050

What else should be considered? Relationship between
management and employees Business climate Labor and production quality Location of suppliers

New Consolidated Metropolitan Statistical Area
Shipping costs to new area
Total Population Cost of living index Average wage/income
tax Warehouse prices Climate Demographics

Impact of New CMSA If new Demand over
18000 open new plant
Reallocate supply from plants
Recalculate deeper analysis of shipping costs

Questions? Quiz! What plant should be shut down? Which plant had the lowest average
transportation costs? What was a piece of data we could have
used?


![Guangzhou Runming Tea Co., Ltd DIY ... tea pc.pdf · Guangzhou Runming Tea Co., Ltd [ ACHIEVE YOUR WELLNESS JOURNEY BY STARTING DRINKING DETOX TEA ] ADD: Floor 5-6, No. 23, Dongsheng](https://static.documents.pub/doc/80x56/5f01b3d97e708231d400a1d7/guangzhou-runming-tea-co-ltd-diy-tea-pcpdf-guangzhou-runming-tea-co-ltd.jpg)


