+ All Categories
Home > Documents > Gut bacterial fermentation of food by-products

Gut bacterial fermentation of food by-products

Date post: 22-Mar-2022
Category:
Upload: others
View: 3 times
Download: 0 times
Share this document with a friend
264
Gut bacterial fermentation of food by-products Citation for published version (APA): Bussolo de Souza, C. (2019). Gut bacterial fermentation of food by-products. Gildeprint Drukkerijen. https://doi.org/10.26481/dis.20190213cb Document status and date: Published: 01/01/2019 DOI: 10.26481/dis.20190213cb Document Version: Publisher's PDF, also known as Version of record Please check the document version of this publication: • A submitted manuscript is the version of the article upon submission and before peer-review. There can be important differences between the submitted version and the official published version of record. People interested in the research are advised to contact the author for the final version of the publication, or visit the DOI to the publisher's website. • The final author version and the galley proof are versions of the publication after peer review. • The final published version features the final layout of the paper including the volume, issue and page numbers. Link to publication General rights Copyright and moral rights for the publications made accessible in the public portal are retained by the authors and/or other copyright owners and it is a condition of accessing publications that users recognise and abide by the legal requirements associated with these rights. • Users may download and print one copy of any publication from the public portal for the purpose of private study or research. • You may not further distribute the material or use it for any profit-making activity or commercial gain • You may freely distribute the URL identifying the publication in the public portal. If the publication is distributed under the terms of Article 25fa of the Dutch Copyright Act, indicated by the “Taverne” license above, please follow below link for the End User Agreement: www.umlib.nl/taverne-license Take down policy If you believe that this document breaches copyright please contact us at: [email protected] providing details and we will investigate your claim. Download date: 22 Mar. 2022
Transcript

Gut bacterial fermentation of food by-products

Citation for published version (APA):

Bussolo de Souza, C. (2019). Gut bacterial fermentation of food by-products. Gildeprint Drukkerijen.https://doi.org/10.26481/dis.20190213cb

Document status and date:Published: 01/01/2019

DOI:10.26481/dis.20190213cb

Document Version:Publisher's PDF, also known as Version of record

Please check the document version of this publication:

• A submitted manuscript is the version of the article upon submission and before peer-review. There canbe important differences between the submitted version and the official published version of record.People interested in the research are advised to contact the author for the final version of the publication,or visit the DOI to the publisher's website.• The final author version and the galley proof are versions of the publication after peer review.• The final published version features the final layout of the paper including the volume, issue and pagenumbers.Link to publication

General rightsCopyright and moral rights for the publications made accessible in the public portal are retained by the authors and/or other copyrightowners and it is a condition of accessing publications that users recognise and abide by the legal requirements associated with theserights.

• Users may download and print one copy of any publication from the public portal for the purpose of private study or research.• You may not further distribute the material or use it for any profit-making activity or commercial gain• You may freely distribute the URL identifying the publication in the public portal.

If the publication is distributed under the terms of Article 25fa of the Dutch Copyright Act, indicated by the “Taverne” license above,please follow below link for the End User Agreement:

www.umlib.nl/taverne-license

Take down policyIf you believe that this document breaches copyright please contact us at:

[email protected]

providing details and we will investigate your claim.

Download date: 22 Mar. 2022

Gut bacterial fermentation of food by-products

Carlota Bussolo de Souza

The research described in this PhD thesis was part of the program entitled

“Science without borders” launched in 2011 by the Brazilian government – CNPq

(National Council for Scientific and Technological Development), grant number

246027/2012-6. Legal representative in Brazil: Prof. Dr. Susana Saad (USP).

Cover-design: Carlota Bussolo de Souza and GildePrint Layout: Carlota Bussolo de Souza Painting: Zélia Bussolo Printed by: GildePrint, Enschede, the Netherlands ISBN: 978-94-6323-496-2

Thesis Maastricht University All rights reserved. No part of this thesis may be reproduced, distributed, stored in a retrieval system, or transmitted in any form or by any means without prior permission of the author.

Gut bacterial fermentation of food by-products

DISSERTATION

to obtain the degree of Doctor at

Maastricht University on the authority of the Rector Magnificus

Prof. Dr. Rianne M. Letschert

in accordance with the decision of the Board of Deans,

to be defended in public

on Wednesday 13th of February 2019 at 10.00 hours

by

Carlota Bussolo de Souza

Supervisors:

Prof. Koen Venema

Prof. Lubbert Dijkhuizen, University of Groningen

Co-supervisor:

Prof. Dr. Daisy Jonkers

Assessment Committee:

Prof. Dr. P.H.M. Savelkoul, Chairman

Prof. Dr. E.E. Blaak

Prof. Dr. S.G. Sayago-Ayerdi, Mexico

Prof. Dr. K. Verbeke, KU Leuven

Content

Chapter 1 General introduction 7 Chapter 2 Characterization and in

vitro digestibility of by-products from Brazilian food industry: Cassava bagasse, orange bagasse and passion fruit peel

37

Chapter 3 Prebiotic effects of cassava bagasse in TNO’s in vitro model of the colon in lean versus obese microbiota

61

Chapter 4 Lean and obese microbiota: differences in in vitro fermentation of by-products from Brazilian food industry

89

Chapter 5 Degradation of fibres from fruit by-products allows selective modulation of the gut bacteria in an in vitro model of the proximal colon

127

Chapter 6 The gut microbiota from lean and obese subjects contribute differently to the fermentation of arabinogalactan and inulin

161

Chapter 7 Potential of pectins to beneficially modulate the gut microbiota depends on their structural properties

191

Chapter 8 General discussion 221 Summary Samenvatting

239 243

Valorization 249 Acknowledgments 257 About the author 261

Chapter 1 General introduction

Partly published as:

Bussolo de Souza, C., Venema, K. (2017). Microbiota intestinal em indivíduos

eutróficos e obesos. In Microbioma, disbiose, probióticos e bacterioterapia. (pp.

164-177). São Paulo, SP: Manole (in Portuguese).

Chapter 1_________________________________________________________________________

8

Background – reasons for this research The gut microbiota has been shown to be important in health and disease. The

main focus of the research described in this thesis was to investigate the

potential prebiotic effects on the gut microbiota of food by-products from the

Brazilian processing industry, with the aim to create a more healthy gut

microbiota, e.g. in obesity. To accomplish this, waste-streams of cassava, orange

and passion fruit were initially chosen for investigation. Differences in

fermentation were assessed when using a microbiota originating from lean or

obese individuals. During the research, in addition to the Brazilian food by-

products the fermentable fibres arabinogalactan and inulin were used. The

effects of different types of pectins extracted from diverse food by-products were

also evaluated. The approach used was in vitro fermentation in the validated

TIM-2 model. Gut microbiota compositional changes, metabolite production and

characterization of the intermediate degradation products in the chyme were

evaluated upon addition of the different substrates. The knowledge gained in this

research provides the basis for further research aiming at the valorisation of

these by-products and the results showed that the by-products could be used as

an alternative tool to improve intestinal health and consequently offer an

additional approach to tackle obesity. The background and aims are further

highlighted in the following paragraph, which is the introductory chapter to the

thesis.

Human gastrointestinal tract and gut microbiota – the basics The human gastrointestinal tract is a 7-10 metres long hollow tube that begins

at the mouth and ends at the anus. It is composed of specific parts: mouth,

oesophagus, stomach, small intestine, large intestine, rectum and anus (1,2). The

small intestine is 2.8-8.5 meters long and it is divided into 3 distinct parts:

duodenum (20-30 cm long), jejunum (upper two-fifths of the small intestine) and

ileum (lower three-fifths of the small intestine) (2). The large intestine is around

1.5 meters long and includes the cecum, proximal colon, transverse colon, distal

colon, rectum and anus (1). The absorptive surface of the intestine is amplified

by specific structures (folds in the intestinal wall, villi and microvilli), making a

total area of around 200 m2 (2). Together with assistant organs – salivary glands,

liver, gallbladder and pancreas – the process of digestion and absorption of

nutrients is accomplished.

For a long time the large intestine was viewed as a storage place for undigested

food components (3). Nevertheless, nowadays it is called the “forgotten organ”

(4) thanks to the metabolic potential of the complex assemblage of different

microorganisms that reside there – the gut microbiota. This metabolic potential

____________________________________________________________ General introduction

9

is considered equal to that of the liver (3). The gut microbiota is a complex

community composed of bacteria, archaea and eukarya, living in our

gastrointestinal tract (mostly in the colon) in a mutual beneficial relationship

(5,6). It is estimated that this community encompasses 1010 to 1011 bacterial cells

per gram of faecal material, and the microbiome (genes from microbiota) to have

around 9.9 million genes – ~100 times more than the human genome (6,7). It

corresponds to around 50% of the wet weight of faecal biomass in humans,

which accounts for about 0.5-1.5 kilograms of bacteria in our gut (8). Bacteria

dominate this ecosystem, and data from the Human Microbiome Project and

MetaHit revealed that around 93% of the bacterial residents in our gut belong to

the dominant phyla of Firmicutes, Bacteroidetes, Proteobacteria and

Actinobacteria (5,9).

The colonic microbiota ferments endogenous host-derived substrates such as

mucus, pancreatic enzymes, and exfoliated epithelial cells, as well as dietary

components that escape digestion in the upper gastrointestinal tract (10).

Complex carbohydrates (resistant starch, non-starch polysaccharides) and

proteins are the principal dietary products that reach the colon and serve as food

for the gut microbiota (9). Two main types of colonic microbial fermentation can

be distinguished: saccharolytic fermentation of carbohydrates and proteolytic

fermentation of proteins (10,11).

Most microorganisms prefer to ferment carbohydrates over proteins.

Consequently, saccharolytic fermentation occurs predominantly in the proximal

colon, while fermentation of proteins mainly takes place in the distal colon where

fermentable carbohydrates are depleted and the bacteria switch to proteolytic

fermentation (9,12). Fermentation of proteins may lead to what are considered

toxic metabolites, such as hydrogen sulfide, ammonia, branched chain fatty acids

(BCFA) and phenolic and indolic compounds (10,11). As mentioned,

fermentation of proteins becomes quantitatively more important distally, and

the majority of colorectal cancers occur in the distal side of the colon. There, the

concentration of proteolytic metabolites is higher, and contact of the intestinal

epithelium with luminal contents is increased because of the more solid nature

of luminal contents and also due to the slower transit through this segment of

the bowel (3).

Nevertheless, bacterial fermentation also produces beneficial compounds, and

this for instance occurs when the microbiota ferments carbohydrates. The end

products of carbohydrate fermentation are the beneficial metabolites short

chain fatty acids (SCFA), mainly acetate, propionate and butyrate, as well as

lactate (9). SCFA are crucial for intestinal health, being used as energy substrate

by colonocytes for instance, and have other important functions, among others

Chapter 1_________________________________________________________________________

10

anti-inflammatory activity, increasing the intestinal barrier, and playing a

beneficial role in satiety and oxidative stress (13). Moreover, during

carbohydrate fermentation, proteins are incorporated into microbial biomass,

preventing their fermentation (11).

Consequently, the importance of the human large intestinal microbiota for

nutrition, health and disease is becoming increasingly realized, and more studies

are being performed with the aim to elucidate the mechanisms behind this

complex interplay between the host and the gut microbiota.

Dietary fibres – the main fuel of gut microbiota The composition and activity of the gut microbiota can be influenced by several

external factors, with diet as one of the most important (14). In addition, among

all nutrients present in our diet, fibres deserve a special attention when talking

about intestinal health and gut microbiota. This is because the human

gastrointestinal tract has a limited number of enzymes capable of digesting the

vast range of different carbohydrates present in our diet (15). In contrast, the gut

microbiome encodes biochemical pathways not evolved in humans (9).

Therefore, the indigestible carbohydrates (i.e., dietary fibres) that reach the

colon serve as energy source to the gut microbiota, which possesses most of the

required enzymes to utilize those (15).

Currently, dietary fibre is defined as carbohydrate polymers with a degree of

polymerization (DP) of three or more, which are neither digested nor absorbed

in the human intestine (16), including:

• non-starch polysaccharides (NSP) from plants (e.g. fruits and tubers)

whether intrinsic or extracted, chemically, physically and/or

enzymatically modified or synthetic (DP ≥10);

• resistant (non-digestible) oligosaccharides (DP 3-9);

• resistant starch (RS) (DP≥10).

Among the dietary fibres that seem to be effective in the context of gut health,

prebiotics are now well described in the literature, and these can be used as a

tool to modulate the gut microbiota. A prebiotic is defined as “a substrate that is

selectively utilized by host microorganisms conferring a health benefit” (17). The

genera Bifidobacterium and Lactobacillus are usually used as biomarkers for

intestinal health and the prebiotic concept (18). The reason lies in the fact that

these two genera do not contain any known pathogens and they use

carbohydrates as preferred energy source, producing acetate and lactate as

metabolites, which through cross-feeding can be converted in the other short-

chain fatty acids (SCFA), e.g. butyrate which is known for its positive effects on

the host (18). Other genera, such as Bacteroides, besides using carbohydrates for

____________________________________________________________ General introduction

11

fermentation, also utilize proteins and amino acids as substrates for their energy

metabolism. The metabolites from proteolytic fermentation are known by their

harmful effects on the gut and are linked with colon cancer (19).

It is important to keep in mind that dietary fibre is a heterogeneous group of

compounds with diverse chemical structures, and therefore different fibres will

behave differently in our gastrointestinal tract (absorb more or less water,

increase faecal bulking, etc.), they will be metabolized in different ways and be

fermented (or not) by different bacterial groups. Consequently, the effects on

host metabolism will be distinct for each type of fibre. Therefore, it is

fundamental to characterize different fibres in order to predict their possible

health effects, as well as to correlate their intake with the microbiota

composition (increase/decrease in certain bacterial groups), type and amount of

metabolites produced, fate of fermentation/degradation, and so on. Figure 1

demonstrates the classification of carbohydrates according to their chemical and

physiological characteristics.

Figure 1: Carbohydrate classification according to their chemical and physiological

characteristics. Adapted from (20).

Carbohydrates can be chemically classified according to their molecular size

(degree of polymerization – DP) into three different groups (Figure 1):

• sugars (DP 1-2) that encompasses monosaccharides and disaccharides

(e.g. glucose and sucrose);

• oligosaccharides (DP 3-9) that include maltodextrins and non-digestible

oligosaccharides such as fructooligosaccharides (FOS);

• polysaccharides (DP ≥10) which can be divided into starch and NSP (e.g.

pectin and cellulose) (21).

Chapter 1_________________________________________________________________________

12

Moreover, carbohydrates can also be classified according to their digestibility in

the small intestine – digestible and non-digestible (fibres) carbohydrates (Figure

1).

Since the focus of the thesis is on dietary fibres, a selection of the more relevant

carbohydrates in this context is described below.

Resistant starch

Resistant starch is a polysaccharide composed of starch that consists of glucose

monomers linked by α-(1,4) or α-(1,6) linkages (22). It has been defined as “the

sum of starch and products of starch degradation that are not absorbed in the small

intestine of healthy individuals” (23). According to the determinant factor of

resistance, RS is classified into four different types:

• RS type 1: physically inaccessible;

• RS type 2: present in granular form;

• RS type 3: retrograded;

• RS type 4: chemically modified (22).

A study comparing the effects of two types of RS (RS2 and RS4) on microbial

composition revealed distinct compositional alterations and high individual

differences in the dietary responsiveness (24). Despite the individual

differences, RS4 increased the proportions of Bifidobacterium adolescentis and

Parabacteroides distasonis, and RS2 stimulated the growth of Ruminococcus

bromii and Eubacterium rectale (24). Another study using RS3 also demonstrated

an increase in R. bromii, among others (25). Therefore, it is important to highlight

that the difference in the type of RS should be taken into account, since it has

been demonstrated that these differences produce diverse effects on health and

gut microbiota.

Cellulose

Cellulose is a linear chain of glucose units connected by β-(1,4) linkages. It is the

most common fibre, constituting 10 to 30% of the NSP in foods (21).

Though the effects of cellulose on the gut microbiota remains mostly unexplored,

some studies are showing the presence of microorganisms in the human

intestine capable of fermenting this compound. First studies demonstrated that

cellulose degrading bacteria were present only in methane-excreting volunteers

(26). However, a study performed in 2010 (27) showed that all participants had

cellulose degrading bacteria, but the community differed largely depending on

the methane status of volunteers. Methane-excreting subjects had Firmicutes

(e.g. Ruminococcus sp.) as dominant cellulose-degrading bacteria, while in non-

methane-excreting volunteers Bacteroidetes (e.g. Bacteroides cellulolysiticus)

____________________________________________________________ General introduction

13

was the predominant phylum of cellulose degrading bacteria (27). The authors

proposed that a cross-feeding between hydrogen producing bacteria and

methanogens occurs. However, since Bacteroides did not produce hydrogen

upon cellulose fermentation, other species may contribute to hydrogen

production in the gut (27).

Hemicellulose

Different from cellulose, hemicelluloses are a heterogeneous group of polymers

composed of different sugars which occur often as highly branched chains (21).

Besides glucose, it also contains xylose, arabinose, galactose, mannose,

rhamnose, glucuronic and/or galacturonic acids (28).

Arabinogalactan is a type of hemicellulose (NSP) and is present in cell walls of

plant cells (29). It is densely branched and composed basically of D-galactose and

L-arabinose, as well as variable amounts of uronic acids (30). It is part of the

human diet, being present in seeds, leaves, roots and fruits, such as carrot, radish,

pear, maize, wheat and tomato (29).

Inulin

Inulin-type fructans are water soluble fructose (β-(2-1) fructosyl-fructose

linkage) based polysaccharides (degree of polymerization DP>10) that in plants

act as carbohydrates reserve usually stored in bulbs, tubers and tuberous roots,

such as wheat, onion, bananas, garlic and chicory (31–33).

Pectins

Pectin is considered one of the most complex family of polysaccharides in nature

because it can be composed of up to 17 different monosaccharides linked by ~20

different linkages (34).

The basic structure of pectin consists of homogalacturonan (HG),

rhamnogalacturonan (RG) I and II, arabinan, galactan, arabinogalactan and

xylogalacaturonan (XGA), represented in Figure 2 (35).

HG is a polymer which contains α-(1,4) linked galacturonic acid residues (GalA),

that in turn may be esterified with methanol or are acetylated (34). Pectins can

be classified according to their degree of methylation (DM). High

methylesterified (HM) pectins have DM > 50%, whereas low methylesterified

(LM) have DM < 50% (36). Animal studies demonstrated that HM pectins were

fermented slower than LM pectins (37,38). This can be a very important

characteristic, since normally most of the carbohydrates are fermented in the

proximal colon, and therefore the distal colon is depleted of this nutrient, leading

to the fermentation of proteins, with consequent negative effects to the host,

such as colon cancer (39).

Chapter 1_________________________________________________________________________

14

The RG I backbone is composed of alternating galacturonic acid and rhamnose,

where depending of the plant source, rhamnose residues could be substituted

with arabinan, galactan and/or arabinogalactan side chains (34).

RG II is considered as a structure within HG, which contains different side chains

(34). XGA can be present as a substitute of HG.

Figure 2: Schematic representation of the basic structure of pectin. Adapted from (40,41).

An important health effect of pectin relates to the ability to decrease cholesterol

levels. The viscous gel formed by pectin binds cholesterol and bile acids and

consequently promotes their excretion, reducing reabsorption (42).

Bacterial species able to use pectin for their growth include Faecalibacterium

prauznitzii, Eubacterium eligens and Lachnospira pectinoschiza (43).

Food industry by-products - treasures that go to the waste bin Processing of raw food products generates residues (waste- or by-products) that

are generally underused or even discarded in the environment, being a source of

pollution. The discarding of by-products can be viewed as wasting food, since

most of them are suitable for human consumption and are full of

(micro)nutrients, such as fibres, vitamins, minerals and antioxidants.

Additionally, this also represents a waste of resources used in the production

process, like water, land and labour (44).

____________________________________________________________ General introduction

15

Paradoxically, wasted food walks hand in hand with the existence of nutritional

deficiencies. Many nutrients that are consumed below the recommended

amounts are discarded in great amounts. A good illustration for this refers to

fibres. A study conducted in the United States demonstrated that the amount of

food wasted in a period of 1 year would be enough to fill the gap between the

actual and the recommended amount of fibre intake for 206.6 million women

(45). Thus, it is recognized that the global food system is not sustainable. At the

same time that we have a third of all food produced lost or wasted, billions of

people are malnourished or undernourished, whereas other are overweight and

obese (46).

For Meybeck and collaborators, diet can be both the result and the driver for

sustainable food systems (46). Therefore, consumers have an important role in

guiding the necessary changes towards a more sustainable food system. For that,

it is necessary to make them aware of the magnitude of the impact that their food

choices can have, and their power to force the food industry into a more

responsible and sustainable way of production. This includes the adequate

destination of by-products and their optimal use, like including them into the

human diet.

Cassava bagasse

Cassava (Manihot esculenta Crantz) is a crop native to Brazil and it is considered

the world’s sixth most important tuber, being a source of food and dietary

calories for more than 700 million people especially in Latin America, Asia and

Africa (47). It has special importance to low income families in the tropical area

because this crop is quite tolerant to drought and productive in poor soils (48).

In 2009 the consumption of cassava per capita in Brazil was 42.2kg/year (49).

Cassava can be consumed in natura (after cooking), nevertheless, as it spoils

“Sustainable diets are protective and respectful of

biodiversity and ecosystems, culturally acceptable,

accessible, economically fair and affordable;

nutritionally adequate, safe and healthy; while

optimising natural and human resources”(46)

Chapter 1_________________________________________________________________________

16

easily, the production of cassava flour or cassava starch (tapioca starch) is a

manner to conserve it longer (50). However, during cassava flour or starch

processing, a solid residue is generated, called bagasse, which contains the fibre

material from the root and the remaining starch not extracted during the

manufacturing (51).

To produce one ton of starch around 928.6 kg of humid cassava bagasse is

generated, and in Brazil, per year, more than 2 million tons of this humid bagasse

is generated (51).

Unfortunately at present, at least in Brazil, there is no process used at industrial

scale that utilizes cassava bagasse due the high moisture level (often higher than

80%) that impairs transportation because of the large volume, but mainly

because the material is highly perishable (52). Therefore, since cassava bagasse

does not present a great value in the market, the main limitation of the

commercialization and use of this residue is the drying process, considered too

expensive and currently not worth to be performed (52).

This residue is thus an industrial waste and it is generally used for animal feeding

or even discarded in the environment, thereby considered an ecological hazard

(47). Additionally, the discarding of cassava bagasse can be seen as a waste of

revenue for the food industry, but especially for small producers, particularly

nowadays where the advent of biotechnological approaches is permitting the

research for newer applications aiming at value creation and value addition (47).

Orange bagasse

Brazil is the world’s largest producer of oranges and is responsible for 50% of

the total production of orange juice worldwide (53). For every five glasses of

orange juice consumed around the world, three are from the Brazilian industry

(53). In 2015, Brazil produced more than 16 million tons of oranges (54), of

which around 70% was destined for juice production (53,55). Therefore, the

generation of residues (bagasse) is significant, since 50% of the total fruit is

composed of peel, albedo, membranes and seeds (53).

Orange bagasse can be used for animal feeding (low-value product), but it is also

a common practice to discard it into the environment without any type of care,

thus being a source of pollution (56). Additionally, some of the peel is used for

pectin production (high-value product), but the market demand for pectin is low

compared to the total amount of pectin that could be produced from the

worldwide supply of citrus by-product (57).

Hence, there is a demand for new approaches to make use of the large amount of

residues generated during juice extraction. This could bring benefits for the food

industry, environment and consumers. Here, the strategy is to search for health

____________________________________________________________ General introduction

17

benefits (especially regarding intestinal health) that the consumption of orange

waste could bring, when incorporated into a human diet.

Passion fruit peel

Passion fruit is a tropical plant native to Brazil, which is the global largest

producer. In 2015, almost 700 thousand tons were produced, of which 40% is

used by the food industry to produce juice (54).

Around 40-60% of the total fruit mass of passion fruit corresponds to residue

(peel and seeds) and is currently discarded (58).

In Brazil, clinical research is focused on the role of passion fruit peel in

decreasing blood sugar in diabetics patients, with some controversial results

(59,60). However, there is a lack of knowledge regarding its potential prebiotic

effect and the relationship with obesity, which is the focus of this thesis.

The ever-increasing problem of obesity According to the World Health Organization (WHO), obesity has more than

doubled since 1980 and in 2014, more than 1.9 billion adults were overweight

(body mass index [BMI] > 25 kg/m2), of which 600 million were obese (BMI > 30

kg/m2) (61). It is considered a major health issue since obesity has a positive

association with risk of mortality and besides that, it usually results in serious

complications such as type 2 diabetes, cardiovascular disease and diverse types

of cancer (61).

Although apparently simple, healthy diet and exercise are not fully effective in

tackling obesity, as can be proven by its increased incidence (61). The issue is

that the implementation of these two elements impose major changes in people’s

lifestyle and for most of individuals, these changes are not easy to maintain on

the long-term. Furthermore, obesity is a multifactorial disease that results from

a complex interplay between several factors such as genetics, life style, dietary

habits, and obesogenic environment (62). Therefore, it is likely that a

combination of other approaches to revert obesity is necessary.

Interestingly, the gut microbiota has been suggested as an environmental factor

that, together with the above mentioned items, can contribute to the onset of

obesity (Figure 3) (63).

It is known that lean and obese people have a different microbiota composition

(64). However, currently the great debate is whether this difference is the cause

or consequence of obesity.

Chapter 1_________________________________________________________________________

18

Figure 3: Diverse factors that contribute to obesity, such as genetics, bad eating habits,

life style, obesogenic environment and, as described recently by the literature, gut

microbiota.

Microbiota composition in lean and obese individuals – no

consensus after more than a decade of studies Perhaps the most important pioneering studies about the relationship between

the gut microbiota and obesity are from the Gordon group, from Washington

University in St. Louis. A set of elegant studies demonstrated that the gut

microbiota had an influence on the host energy metabolism – at least in rodents

(63–65), and more importantly, raised several questions that still drive research

in this field.

A comparison between germ free mice (GF) and conventionally raised animals

(CONV-R) demonstrated that CONV-R mice had 42% more total body fat, despite

a lower daily consumption of the standard diet (63). Next, conventionalization of

GF mice with microbiota from CONV-R animals caused an increase of 57% in

total body fat. The authors proposed two mechanisms for the gut microbiota

promoting weight gain. First, gut microbiota has the necessary enzymes to

process indigestible polysaccharides and therefore provide the host with extra

energy via their breakdown.

____________________________________________________________ General introduction

19

The extra energy can come from the released monosaccharides that can be

absorbed by intestinal tissue or via the production of SCFA (through

fermentation of these monosaccharides) that will also be absorbed by intestinal

tissue. These two elements will increase hepatic lipogenesis and consequently

increase triglycerides storage in adipocytes (Figure 4) (63).

Figure 4: Gut microbiota and their relationship with energy balance. Adapted from

Backhed 2004 (63).

The second mechanism relies on the suppression of Fiaf (Fasting-induced

adipose factor, also known as Angiopoietin-like protein 4) by the gut microbiota.

Fiaf is an inhibitor of LPL (Lipoprotein Lipase) and it is produced by several

tissues, including intestinal tissue. Its suppression allows the increase in LPL

activity. In turn, an increased LPL activity leads to an increased cellular uptake

of free fatty acids and increase in triglycerides storage in adipocytes (63). The

authors concluded that ancient humans that were subjected to fluctuating

Chapter 1_________________________________________________________________________

20

availability of food benefited from the extra energy provided by the gut

microbiota. However, the current situation in which most Western populations

are living, with easy access to high density caloric food, is providing detrimental

effects. In the authors opinion, depending on lifestyle conditions, differences in

gut microbiota composition could be either protective or predispose individuals

to develop obesity (63).

A second set of studies revealed that the microbiota from obese mice had 50%

reduction in Bacteroidetes and increased proportion of Firmicutes when

compared with lean mice. The authors generated two hypotheses: the increased

ratio of Firmicutes/Bacteroidetes in obese mice may help promote adiposity, or

this could be an adaptive response from the host to limit energy uptake/storage,

since Bacteroidetes has a vast variety of species known by its capacity to degrade

polysaccharides (65), which would contribute to energy that becomes available

to the host, through the monosaccharides directly, but more likely through the

SCFA produced from these by the microbes.

They compared whether the difference in the ratio of Firmicutes/Bacteroidetes

in lean and obese mice would have an effect on the metabolic potential of the gut

microbiota regarding energy harvesting (66). Through metagenomics analyses

it was verified that the obese microbiome was enriched with genes encoding

several different enzymes involved in the initial breakdown of indigestible

polysaccharides, when compared with lean animals (66). Additionally, to test if

the microbiota from obese animals could transfer the capacity to harvest more

energy from indigestible carbohydrates, microbiota transplantation

experiments were performed (66). Interestingly, mice that received a microbiota

from obese animals showed an increase in body fat (66).

These set of studies by the Gordon group intrigued the academic community,

especially regarding whether such findings could be translated/replicated into

humans.

This however was not always the case. A study performed with 98 human

subjects encompassing lean, overweight and obese individuals in fact presented

the opposite result regarding the ratio of Firmicutes/Bacteroidetes (67).

Interestingly, the ratio changed in favour of the Bacteroidetes phylum in

overweight and obese individuals. Concentrations of faecal SCFA were also

analysed, and obese individuals had higher concentration of these metabolites in

their faeces when compared with lean volunteers. According to the authors, the

amount of SCFA produced could be more important in the relationship of gut

microbiota and obesity than the ratio of Firmicutes to Bacteroidetes. However,

they neglected the fact that a higher excretion of SCFA does not necessarily mean

____________________________________________________________ General introduction

21

a higher SCFA production. If production is the same, but uptake is lower,

excretion will be higher. In this case, energy extraction would be reduced.

A recent study with young human individuals found that the ratio Firmicutes to

Bacteroidetes was positively associated with BMI, and plasma levels of SCFA was

associated with body fat partitioning and hepatic lipogenesis. When using an in

vitro assay to test the fermentation ability of gut microbiota from the lean and

obese groups, researchers found that the obese microbiota had an increased

capability to ferment the same amount of fructose as the lean microbiota (68),

although it should be realized that this is not a substrate that would normally be

present in the colon.

The above-mentioned studies are just a few examples to indicate that there still

is a paradox regarding the relationship of certain groups of bacteria with obesity.

Currently the evidence on the link between the Bacteroidetes to Firmicutes ratio

and weight is clearly conflicting and different subgroups within phyla may

behave differently in relation to obesity (69), indicating the necessity to further

investigate this field.

New studies are focusing on specific bacterial species and/or groups of bacteria

and their relationship with obesity. Currently, Akkermansia muciniphila, a mucin

degrading species from the Verrucomicrobia phylum, is calling attention. It is

being suggested as a biomarker for intestinal health, since its abundance is

inversely correlated with various intestinal disorders, such as inflammatory

bowel disease (IBD) (70).

A study with pregnant women (n=50) showed that A. muciniphila and

Bifidobacterium numbers were higher in women with normal weight gain

compared with women that had an excessive weight gain during this period (71).

Another study with overweight and obese individuals (n=49) showed that the

abundance of A. muciniphila was associated with a healthier metabolic status in

this population (72). Interestingly, after a caloric restriction diet, individuals that

had higher A. muciniphila at the baseline demonstrated a better improvement in

insulin sensitivity markers, body composition and blood lipids (72).

However, research performed with 345 Chinese type 2 diabetic (T2D) patients

and nondiabetic controls revealed that A. muciniphila was enriched in T2D

patients stool samples (73), showing some discrepancy regarding the

relationship between A. muciniphila and health status. Nevertheless, this

discrepancy could be due to differences in study design, ethnicity, and age,

among others.

With the attempt to find the physiological and mechanistic role of this bacterium

during obesity and metabolic disorders, Everard et al. (2013) performed a study

Chapter 1_________________________________________________________________________

22

with obese and diabetic mice. First, they found that obese and diabetic mice

presented lower abundance of A. muciniphila. Second, when treating these

animals with a prebiotic (oligofructose), the abundance of A. muciniphila was re-

established. Finally, administration of A. muciniphila to mice reversed high fat

diet metabolic disorders, such as metabolic endotoxemia (74). The authors

proposed as possible mechanism the improvement of the mucus layer by A.

muciniphila (74), which would decrease intestinal permeability and its

deleterious consequences. Importantly, it has been suggested that microbes

colonizing the mucus layer can protect the host against intestinal pathogens (70).

To test the hypothesis that variation in the gut microbiota (at genus and species

level) could predict which adult individuals would be at increased risk to develop

obesity-related metabolic disorders, Le Chatelier and collaborators (2013)

assessed the number of gut bacterial genes from 292 obese and non-obese

individuals (75). A bimodal distribution of bacterial genes was found, and

individuals could be separated into two groups: “low gene counts” (LGC) and

“high gene counts” (HGC) (75). This difference in gene counts was an indication

that these two groups would have different microbial communities in their gut.

Thus, a deeper analysis was performed and the researchers found that HGC

individuals had a higher prevalence of anti-inflammatory species, like

Faecalibacterium prausnitzii, as well as the genera Akkermansia and

Bifidobacterium, whereas LGC individuals harboured more potentially pro-

inflammatory bacteria, such as Bacteroides and Ruminococcus gnavus, normally

associated with IBD (75). Genomic analysis revealed a greater genetic potential

for production of metabolites with presumptive deleterious effects on the host,

such as pro-carcinogens, in LGC individuals (75). In contrast, the HGC group

displayed a vast genetic potential for production of organic acids, such as

butyrate and propionate (75). Importantly, the LGC group was composed of a

significantly higher proportion of obese participants with metabolic

disturbances that could put them at increased risk for T2D and cardiovascular

disorders (75). Additionally, it was verified that the gut microbiota composition

from lean and obese people differed less when compared with LCG and HGC (75),

demonstrating that there is still a long way to go regarding a consensus about

gut microbiota and obesity. However, this difference in gene count could explain

why some obese individuals are considered “healthy obese”, while others are

more prone to a worse prognostic regarding their obesity and its deleterious

consequences.

Following this rational, Sommer et al. analysed the gut microbiota from brown

bears, which have two life cycles during the year, one characterized by an intense

eating and weight gain (summer) and other characterized by hypometabolic

____________________________________________________________ General introduction

23

fasting (winter) (76). The important issue is that despite a great fat accumulation

during summer, they remain metabolically healthy, and researchers believe that

brown bears could constitute an important model for healthy obesity (76). When

comparing gut microbiota from summer and winter, the authors found that

microbiota from summer had higher microbial taxa and was more diverse,

probably due to a diverse diet during this period. Summer microbiota was

dominated by Proteobacteria, Firmicutes and Actinobacteria phyla, while in

winter the microbiota was increased by Bacteroidetes while Firmicutes and

Actinobacteria were less abundant (76). Serum levels of cholesterol,

triglycerides and free cholesterol were higher during the winter, suggesting that

during the hibernation period, lipids are used as a survival strategy (76). Next,

researchers colonized GF mice with bear microbiota from summer and winter,

in order to test whether the seasonal differences in bear microbiota could affect

host physiology. Interestingly, some features could be transmitted to mice, such

as higher weight and fat gain in mice receiving microbiota from summer period.

However, there was no difference regarding glucose metabolism between mice

from the two groups (76), suggesting the role of the gut microbiota in healthy

obesity.

Short chain fatty acids (SCFA) and their relationship with

obesity Fermentation is the process through which anaerobic bacteria and yeasts

degrade dietary compounds in the absence of oxygen in order to obtain energy

for growth and the maintenance of cellular function (77).

In the colon, carbohydrates are fermented to SCFA, mainly acetate, propionate

and butyrate (78). The Bacteroidetes phylum contains species that produce

mainly acetate and propionate, while species that belong to Firmicutes are

responsible for the production of mostly butyrate (79). Butyrate is the major fuel

for colonocytes, supplying 60-70% of energy needs (13). Around 90% of

propionate is used by the liver as precursor of hepatic gluconeogenesis and

therefore converted into glucose (79). Acetate is mainly found in peripheral

circulation and consequently can act in different tissues (79).

SCFA can contribute to about 5-15% of the total caloric requirements of humans

(80). Knowing that even the consumption of 1% more than the daily energy

needs can lead to weight gain on the long-term, the amount of energy released

by the gut microbiota can have important consequences for body weight (81).

However, at the same time that the fermentation of carbohydrates by the gut

microbiota provides extra energy to the host, these same SCFA are ligands of free

Chapter 1_________________________________________________________________________

24

fatty acid receptor (FFAR) 2 and 3 (formerly called G-protein coupled receptors

(GPCR) 43 and 41, respectively). FFAR 2 and 3 are responsible for triggering the

release of satiety hormones GLP-1 and PYY by L-cells (Figure 4) (82). Another in

vitro study demonstrated that butyrate increased the expression as well as

release of PYY in epithelial cells (12). PYY inhibits gastric emptying and food

intake, whereas GLP-1 also stimulates insulin secretion (83,84). Increasing

transit time of ingested food through the gastrointestinal tract prolongs the

stimulation of mechanic/chemical receptors responsible for signalling satiety

after food intake (79).

In vitro studies have verified that acetate and propionate inhibited intracellular

lipolysis, and thus could have an effect on reducing fat accumulation (13). On the

other hand, incubation of murine and porcine pre-adipocytes with acetate,

propionate and butyrate stimulated their differentiation, indicating pro-

adipogenic properties of SCFA (13). Additionally, acetate production after

lactulose ingestion by overweight subjects resulted in short-term decrease in

free fatty acid level and glycerol turnover related to a decrease of lipolysis, which

is believed to help in preventing insulin resistance (12).

These findings suggest an important role of microbial metabolites in energy

metabolism, food intake, satiety and satiation. However, more studies are

necessary in order to reveal the mechanisms behind how the gut microbiota and

SCFA influence obesity and establish the final picture of this complex

relationship.

In vitro models of the gastrointestinal tract, the tool for

mechanistic insight Although in vivo studies with humans are the ultimate method to evaluate the

effects of dietary compounds on human health, they are costly, highly invasive

and restrictive due to ethical reasons. As an alternative, in vitro models that

accurately simulate the gastrointestinal (GI) tract emerge as an essential tool

especially to test novel foods, with several advantages that go from the reduction

in use of animals in experiments, until the possibility of sampling different

segments of the GI tract and closely monitoring the fate of degradation and

fermentation of dietary fibres, for instance.

Here the two in vitro models of the GI tract used in this thesis are described: TIM-

1 that simulates the upper GI tract (stomach, duodenum, jejunum and ileum) and

TIM-2, which simulates the proximal colon.

____________________________________________________________ General introduction

25

TIM-1 system

TIM-1 is a multi-compartmental, computer-controlled, dynamic in vitro model

that simulates the stomach and small intestine. It consists of four compartments

that simulate the stomach, duodenum, jejunum and ileum, which are connected

by computer controlled valves (Figure 5) (85).

Figure 5: Schematic diagram of the stomach and small intestine model (TIM-1). A =

stomach compartment; B = pyloric sphincter; C = duodenum compartment; D = jejunum

compartment; E = ileum compartment; F = ileal efflux.

The temperature is kept at body temperature (37 oC for humans). The secretion

of fluids and enzymes in each compartment is set up to mimic the physiological

conditions of healthy humans. In this thesis these parameters for adults were

used, but also parameters for babies and elderly are available. Peristaltic

movements are mimicked through the contraction of the flexible walls, which is

also responsible for controlling gastric emptying and food transit (85).

Chapter 1_________________________________________________________________________

26

The contents of the jejunum and ileum compartments are dialyzed continuously

using hollow fibre semi-permeable membranes, resembling the absorption of

the digested products such as sugar, oligosaccharides, amino acids and small

peptides by intestinal cells (85).

TIM-1 is an important tool that enables the characterization of test products

regarding for instance their digestibility. Here, this system was essentially used

to evaluate the digestibility (starch and protein fractions) of the by-products of

Brazilian food-industry used in this thesis, and to assess the fate of absorption of

the digestible components.

TIM-2 system

Intestinal models have also risen as an attractive alternative to study the

metabolic and ecological behaviour of the gut microbiota (86).

TIM-2 (TNO intestinal model of the large intestine) (Figure 6) is a state-of-the-

art computer-controlled, dynamic system that simulates several features of the

human large intestine.

Figure 6: TIM-2 system. A= peristaltic compartments with a dialysis membrane inside;

B= pH sensor, C= NaOH secretion; D= dialysate system; E= level sensor; F= gaseous N2

inlet; G= sampling port; H= gas outlet; I= feeding syringe with test compound; J=

temperature sensor. Adapted from (87).

The temperature is kept at 37 oC; the pH is constantly checked using a pH sensor

and maintained at 5.8 through secretion of sodium hydroxide; constant flushing

of gaseous nitrogen creates an anaerobic environment; water and fermentation

products are removed through a dialysis system; and the simulation of peristaltic

movements is responsible for mixing and transport of intestinal contents (86).

A A

B C

D D

E

F

G

H

I

J

____________________________________________________________ General introduction

27

Water and fermentation products are constantly removed through the dialysis

system. Thus, physiological concentrations of small molecules, such as

electrolytes and microbial metabolites, are maintained and product inhibition of

enzyme activities and inhibition of growth of microorganisms as a result of

accumulation of microbial metabolites is prevented. It was previously

demonstrated that TIM-2 allows for the growth of a highly active and dense

microbiota, comparable to that found in the human proximal colon (88).

However, it is important to be aware of the limitations of in vitro models. The

lack of host cells that limits the microbe-host interaction is an example. However,

taking the limitations into account, this system is a useful tool to study for

instance, indigestible/undigested components and their effect on microbial

metabolism and ecology in the lumen of the large intestine (86) and can be used

to study hypotheses with respect to the role of the microbiota in obesity, energy

extraction and the fate of polysaccharide fermentation (89).

TIM-2 was the main tool used in this thesis, with the objective to verify the

potential prebiotic effect of the different by-products tested. In addition, it was

also used to assess possible differences in fermentability (microbiota

composition and production of microbial metabolites) when using a microbiota

from lean or obese individuals.

Chapter 1_________________________________________________________________________

28

Aims and outline of the thesis As previously described, the discard of by-products generated by the food

industry, containing valuable ingredients such as fibre and antioxidants, is a

serious problem that urges for a solution. At the same time, obesity has emerged

as a disease that globally affects millions of people, characterized by among

others, an imbalanced diet and dysbiosis as important factors that contribute to

the maintenance of this problem. In this context, the use of prebiotics as an

additional tool to tackle obesity is a promising field, especially because the use

of prebiotics is a non-invasive and non-expensive approach.

The aim of this thesis was to assess the potential prebiotic effect(s) of a number

of (Brazilian) food by-products using an in vitro model of the proximal colon,

either with microbiota from healthy individuals in some chapters, and lean or

obese individuals in other chapters.

The first original scientific chapter (Chapter 2), describes the chemical

characterization of eight different food by-products (three cassava bagasses, two

orange bagasses and three passion fruit peels) and their alcohol insoluble solids

(AIS) fraction, which can be seen to represent the indigestible fractions. In the

same chapter, digestibility of all three cassava bagasses, and one sample of

orange bagasse and passion fruit peel were evaluated in an in vitro model that

simulates the upper gastrointestinal tract (TIM-1).

Chapter 3 describes the first set of experiments performed to test in vitro (in

TIM-2) the potential prebiotic effect of one sample of cassava bagasse when

using microbiota originated from lean or obese individuals. The fermentation

profile – microbiota composition and production of SCFA, BCFA, lactate and

ammonia were compared between the so called “lean and obese microbiota”.

In Chapter 4 we included all food by-products characterized in Chapter 2, and

continued with the evaluation of the potential prebiotic effects of them, using the

same in vitro approach as in Chapter 3 – TIM-2. The in vitro model was inoculated

with a faecal slurry from lean or obese individuals and results of microbiota

composition, SCFA, BCFA and organic acids were compared between these two

groups.

After the evaluation of the effects that each by-product had in the microbial

dynamics, the isolated indigestible fibres – AIS fractions of orange bagasses and

passion fruit peels were used in in vitro fermentation experiments using

____________________________________________________________ General introduction

29

microbiota from healthy individuals (Chapter 5). This study also describes the

fate of these fibres during fermentation, which was performed through the

analyses of intermediate degradation products. The objective of such analyses

was to investigate the kinetics of bacterial utilization of the different

monosaccharides present in these polysaccharides.

In Chapter 6 we proceeded with the evaluation of the differences on the

fermentation profiles using microbiota derived from lean and obese volunteers.

Two fibres were used – inulin and arabinogalactan, and compositional changes

and metabolite production were assessed.

Chapter 7 focuses on the structure-function relationship of various pectins by

studying their potential to modulate the gut microbiota. The dynamics of

microbiota composition and activity was assessed during fermentation of nine

structurally diverse pectins extracted from different food by-products, and a

pectic derivative rhamnogalacturonan I. This study was performed in TIM-2 that

was inoculated with a microbiota from healthy individuals.

A general discussion about the results presented in this thesis is provided in

Chapter 8. Main findings and new insights obtained are discussed.

The thesis finishes with a summary and a validation section.

Chapter 1_________________________________________________________________________

30

References

1. Insel P, Ross D, McMahon K. Discovering nutrition. Jones & Bartlett Publishers; 2013.

2. Geissler C, Powers H. Human nutrition. Oxford University Press; 2017. 3. de Graaf AA, Venema K. Gaining insight into microbial physiology in the

large intestine: a special role for stable isotopes. Adv Microb Physiol. England; 2008;53:73–168.

4. O’Hara AM, Shanahan F. The gut flora as a forgotten organ. EMBO Rep. European Molecular Biology Organization; 2006;7(7):688–93.

5. Thursby E, Juge N. Introduction to the human gut microbiota. Biochem J. England; 2017 May;474(11):1823–36.

6. Rowland I, Gibson G, Heinken A, Scott K, Swann J, Thiele I, et al. Gut microbiota functions: metabolism of nutrients and other food components. Eur J Nutr. Germany; 2017 Apr.

7. Cani PD, Delzenne NM. The role of the gut microbiota in energy metabolism and metabolic disease. Curr Pharm Des. 2009;15(13):1546–58.

8. Aguirre M, Venema K. The art of targeting gut microbiota for tackling human obesity. Genes Nutr. Berlin/Heidelberg: Springer Berlin Heidelberg; 2015 Jul 20;10(4):20.

9. Kovatcheva-Datchary P, Zoetendal EG, Venema K, de Vos WM, Smidt H. Tools for the tract: understanding the functionality of the gastrointestinal tract. Therap Adv Gastroenterol. England; 2009 Jul;2(4):9–22.

10. Hamer HM, De Preter V, Windey K, Verbeke K. Functional analysis of colonic bacterial metabolism: relevant to health? Am J Physiol Gastrointest Liver Physiol. 2012;302(1):G1-9.

11. Rose DJ, Venema K, Keshavarzian A, Hamaker BR. Starch-entrapped microspheres show a beneficial fermentation profile and decrease in potentially harmful bacteria during in vitro fermentation in faecal microbiota obtained from patients with inflammatory bowel disease. Br J Nutr. 2010;103(10):1514–24.

12. Hamer HM, Jonkers D, Venema K, Vanhoutvin S, Troost FJ, Brummer R-J. Review article: the role of butyrate on colonic function. Aliment Pharmacol Ther. England; 2008 Jan;27(2):104–19.

13. Canfora EE, Jocken JW, Blaak EE. Short-chain fatty acids in control of body weight and insulin sensitivity. Nat Rev Endocrinol. Nature Publishing Group; 2015;11(10):577–91.

14. Scott KP, Gratz SW, Sheridan PO, Flint HJ, Duncan SH. The influence of diet on the gut microbiota. Pharmacol Res. Elsevier Ltd; 2013;69(1):52–60.

15. Martens EC, Kelly AG, Tauzin AS, Brumer H. The devil lies in the details: How variations in polysaccharide fine-structure impact the physiology and evolution of gut microbes. J Mol Biol. Elsevier B.V.; 2014;426(23):3851–65.

16. Stephen AM, Champ MM-J, Cloran SJ, Fleith M, van Lieshout L, Mejborn H, et al. Dietary fibre in Europe: current state of knowledge on definitions,

____________________________________________________________ General introduction

31

sources, recommendations, intakes and relationships to health. Nutr Res Rev. Cambridge University Press; 2017 Jul 5;1–42.

17. Gibson GR, Hutkins R, Sanders ME, Prescott SL, Reimer RA, Salminen SJ, et al. Expert consensus document: The International Scientific Association for Probiotics and Prebiotics (ISAPP) consensus statement on the definition and scope of prebiotics. Nat Rev Gastroenterol Hepatol. England; 2017 Aug;14(8):491–502.

18. Macfarlane S, Macfarlane GT, Cummings JH. Review article: Prebiotics in the gastrointestinal tract. Aliment Pharmacol Ther. 2006;24(5):701–14.

19. Macfarlane GT, Macfarlane S. Bacteria, colonic fermentation, and gastrointestinal health. J AOAC Int. United States; 2012;95(1):50–60.

20. Jonathan MC. Monitoring the degradation of individual dietary fibres in pig models. Doctoral dissertation. Wageningen University; 2013. 184 p.

21. Cummings JH, Stephen AM. Carbohydrate terminology and classification. Eur J Clin Nutr. 2007;61 Suppl 1:S5–18.

22. Sajilata MG, Singhal RS, Kulkarni PR. Resistant starch–a review. Compr Rev food Sci food Saf. Wiley Online Library; 2006;5(1):1–17.

23. Resistant Starch. Proceedings for the 2nd plenary meeting of EURESTA: European FLAIR Concerted Action No. 11 on physiological implications of the consumption of resistant starch in man. Crete, 29 May-2 June 1991. In: European journal of clinical nutrition. England; 1992. p. S1-148.

24. Martinez I, Kim J, Duffy PR, Schlegel VL, Walter J. Resistant starches types 2 and 4 have differential effects on the composition of the fecal microbiota in human subjects. PLoS One. United States; 2010 Nov;5(11):e15046.

25. Salonen A, Lahti L, Salojarvi J, Holtrop G, Korpela K, Duncan SH, et al. Impact of diet and individual variation on intestinal microbiota composition and fermentation products in obese men. ISME J. England; 2014 Nov;8(11):2218–30.

26. Robert C, Bernalier-Donadille A. The cellulolytic microflora of the human colon: evidence of microcrystalline cellulose-degrading bacteria in methane-excreting subjects. FEMS Microbiol Ecol. England; 2003 Oct;46(1):81–9.

27. Chassard C, Delmas E, Robert C, Bernalier-Donadille A. The cellulose-degrading microbial community of the human gut varies according to the presence or absence of methanogens. FEMS Microbiol Ecol. England; 2010 Oct;74(1):205–13.

28. Gray J. Dietary fibre. ILSI Europe Concise Monograph Series. 2006. 1-44 p. 29. Dion C, Chappuis E, Ripoll C. Does larch arabinogalactan enhance immune

function? A review of mechanistic and clinical trials. Nutr Metab (Lond). England; 2016;13:28.

30. Moschini R, Gini F, Cappiello M, Balestri F, Falcone G, Boldrini E, et al. Interaction of arabinogalactan with mucins. Int J Biol Macromol. 2014;67:446–51.

31. Apolinário AC, de Lima Damasceno BPG, de Macêdo Beltrão NE, Pessoa A, Converti A, da Silva JA. Inulin-type fructans: A review on different aspects

Chapter 1_________________________________________________________________________

32

of biochemical and pharmaceutical technology. Carbohydr Polym. 2014;101:368–78.

32. Fu Y-P, Li L-X, Zhang B-Z, Paulsen BS, Yin Z-Q, Huang C, et al. Characterization and prebiotic activity in vitro of inulin-type fructan from Codonopsis pilosula roots. Carbohydr Polym. 2018;193:212–20.

33. Carlson JL, Erickson JM, Hess JM, Gould TJ, Slavin JL. Prebiotic dietary fiber and gut health: comparing the in vitro fermentations of beta-glucan, inulin and xylooligosaccharide. Nutrients. Switzerland; 2017 Dec;9(12).

34. Voragen AGJ, Coenen G-J, Verhoef RP, Schols HA. Pectin, a versatile polysaccharide present in plant cell walls. Struct Chem. Springer; 2009;20(2):263.

35. Ramasamy US. The role of soluble and insoluble fibers during fermentation of Chicory root pulp. Wageningen University; 2014.

36. Remoroza C. Enzymatic fingerprinting and modification of acetylated pectins. Doctoral dissertation. Wageningen University; 2014.

37. Tian L, Scholte J, Borewicz K, van den Bogert B, Smidt H, Scheurink AJW, et al. Effects of pectin supplementation on the fermentation patterns of different structural carbohydrates in rats. Mol Nutr Food Res. Germany; 2016 Oct;60(10):2256–66.

38. Dongowski G, Lorenz A, Proll J. The degree of methylation influences the degradation of pectin in the intestinal tract of rats and in vitro. J Nutr. United States; 2002 Jul;132(7):1935–44.

39. den Besten G, van Eunen K, Groen AK, Venema K, Reijngoud DJ, Bakker BM. The role of short-chain fatty acids in the interplay between diet, gut microbiota, and host energy metabolism. J Lipid Res. 2013;54(9):2325–40.

40. Pedrolli DB, Monteiro AC, Gomes E, Carmona EC. Pectin and pectinases: production, characterization and industrial application of microbial pectinolytic enzymes. Open Biotechnol J. 2009;9–18.

41. Rösch C. In vitro fermentation and immunomodulating characteristics of dietary fibres. Wageningen University; 2016.

42. Naqash F, Masoodi FA, Rather SA, Wani SM, Gani A. Emerging concepts in the nutraceutical and functional properties of pectin—A Review. Carbohydr Polym. 2017;168(Supplement C):227–39.

43. Flint HJ, Scott KP, Duncan SH, Louis P, Forano E. Microbial degradation of complex carbohydrates in the gut. Vol. 3, Gut Microbes. 2012. p. 289–306.

44. Food and Agriculture Organization of the United Nations. Global food losses and food waste: Extent, causes and prevention. Rome; 2011.

45. Spiker ML, Hiza HAB, Siddiqi SM, Neff RA. Wasted food, wasted nutrients: nutrient loss from wasted food in the united states and comparison to gaps in dietary intake. J Acad Nutr Diet. United States; 2017 Jul;117(7):1031–1040.e22.

46. Meybeck A, Gitz V. Sustainable diets within sustainable food systems. Proc Nutr Soc. England; 2017 Feb;76(1):1–11.

47. Pandey A, Soccol CR, Nigam P, Soccol VT, Vandenberghe LPS, Mohan R.

____________________________________________________________ General introduction

33

Biotechnological potential of agro-industrial residues. II: cassava bagasse. Bioresour Technol. 2000;74(1):81–7.

48. Food and Agriculture Organization of the United Nations. Cassava. 2017. 49. IBGE. Antropometria e estado nutricional de crianças, adolescentes e

adultos no Brasil [Internet]. Vol. 2012. 2009. Available from: http://www.ibge.gov.br/home/presidencia/noticias/noticia_visualiza.php?id_noticia=1699&id_pagina=1/

50. Cardoso EMR, Hühn S, Junior J de DN. Processo industrial para beneficiamento da macaxeira. Novos Cad NAEA. Pará; 1999;2(2):177–84.

51. Fiorda FA, Soares Júnior MS, da Silva FA, Fontinelle Souto LR, Eiras Grossmann MV. Farinha de bagaço de mandioca: Aproveitamento de subproduto e comparação com fécula de mandioca. Pesqui Agropecu Trop. 2013;43(4):408–16.

52. Jasko AC, Andrade J de, Padilha L, Pauli RB de, Quast LB, Schnitzler E, et al. Caracterização físico-química de bagaço de mandioca in natura e após tratamento hidrolítico. Rev Bras Tecnol Agroindustrial. Ponta Grossa; 2011;5:427–41.

53. Neves MF, Trombin VG, Milan P, Lopes FF, Cressoni F, Kalaki R. O retrato da citricultura brasileira. Ribeirão Preto: CitrusBR. 2010.

54. IBGE. Produção agrícola municipal. Vol. 42. Rio de Janeiro; 2015. 55. Citrus BR. Estimativa de safras. 2016. [cited 2017 Jun 30]. Available from:

http://www.citrusbr.com/safras/ 56. Angel Siles Lopez J, Li Q, Thompson IP. Biorefinery of waste orange peel.

Crit Rev Biotechnol. England; 2010 Mar;30(1):63–9. 57. Manderson K, Pinart M, Tuohy KM, Grace WE, Hotchkiss AT, Widmer W,

et al. In vitro determination of prebiotic properties of oligosaccharides derived from an orange juice manufacturing by-product stream. Appl Environ Microbiol. 2005;71(12):8383–9.

58. Oliveira LF de, Nascimento MRF, Borges SV, Ribeiro PC do N, Ruback VR. Aproveitamento alternativo da casca do maracujá-amarelo (Passiflora edulis F. Flavicarpa) para produção de doce em calda. Ciência e Tecnol Aliment. 2002;22:259–62.

59. de Queiroz M do SR, Janebro DI, da Cunha MAL, Medeiros J dos S, Sabaa-Srur AUO, Diniz M de FFM, et al. Effect of the yellow passion fruit peel flour (Passiflora edulis f. flavicarpa deg.) in insulin sensitivity in type 2 diabetes mellitus patients. Nutr J. England; 2012 Oct;11:89.

60. de Araujo MFM, Veras VS, de Freitas RWJF, de Paula M do L, de Araujo TM, Uchoa LRA, et al. The effect of flour from the rind of the yellow passion fruit on glycemic control of people with diabetes mellitus type 2: a randomized clinical trial. J Diabetes Metab Disord. England; 2017;16:18.

61. WHO | Obesity and overweight. World Health Organization; [cited 2016 Dec 5].

62. van Vliet-Ostaptchouk J V, Snieder H, Lagou V. Gene-Lifestyle Interactions in Obesity. Vol. 1, Current nutrition reports. United States; 2012. p. 184–96.

Chapter 1_________________________________________________________________________

34

63. Backhed F, Ding H, Wang T, Hooper L V, Koh GY, Nagy A, et al. The gut microbiota as an environmental factor that regulates fat storage. Proc Natl Acad Sci U S A. United States; 2004 Nov;101(44):15718–23.

64. Ley RE, Turnbaugh PJ, Klein S, Gordon JI. Microbial ecology: human gut microbes associated with obesity. Nature. England; 2006 Dec;444(7122):1022–3.

65. Ley RE, Backhed F, Turnbaugh P, Lozupone CA, Knight RD, Gordon JI. Obesity alters gut microbial ecology. Proc Natl Acad Sci U S A. 2005;102(31):11070–5.

66. Turnbaugh PJ, Ley RE, Mahowald M a, Magrini V, Mardis ER, Gordon JI. An obesity-associated gut microbiome with increased capacity for energy harvest. Nature. 2006;444(7122):1027–31.

67. Schwiertz A, Taras D, Schafer K, Beijer S, Bos NA, Donus C, et al. Microbiota and SCFA in lean and overweight healthy subjects. Obes (Silver Spring). Nature Publishing Group; 2010;18(1):190–5.

68. Goffredo M, Mass K, Parks EJ, Wagner DA, McClure EA, Graf J, et al. Role of gut microbiota and short chain fatty acids in modulating energy harvest and fat partitioning in youth. J Clin Endocrinol Metab. 2016;101(November):jc.2016-1797.

69. Lyra A, Lahtinen S, Tiihonen K, Ouwehand AC. Intestinal microbiota and overweight. Benef Microbes. Netherlands; 2010 Nov;1(4):407–21.

70. Belzer C, de Vos WM. Microbes inside--from diversity to function: the case of Akkermansia. ISME J. England; 2012 Aug;6(8):1449–58.

71. Santacruz A, Collado MC, Garcia-Valdes L, Segura MT, Martin-Lagos JA, Anjos T, et al. Gut microbiota composition is associated with body weight, weight gain and biochemical parameters in pregnant women. Br J Nutr. England; 2010 Jul;104(1):83–92.

72. Dao MC, Everard A, Aron-Wisnewsky J, Sokolovska N, Prifti E, Verger EO, et al. Akkermansia muciniphila and improved metabolic health during a dietary intervention in obesity: relationship with gut microbiome richness and ecology. Gut. 2016;65(3):426–36.

73. Qin J, Li Y, Cai Z, Li S, Zhu J, Zhang F, et al. A metagenome-wide association study of gut microbiota in type 2 diabetes. Nature. England; 2012 Oct;490(7418):55–60.

74. Everard A, Belzer C, Geurts L, Ouwerkerk JP, Druart C, Bindels LB, et al. Cross-talk between Akkermansia muciniphila and intestinal epithelium controls diet-induced obesity. Proc Natl Acad Sci U S A. 2013;110(22):9066–71.

75. Le Chatelier E, Nielsen T, Qin J, Prifti E, Hildebrand F, Falony G, et al. Richness of human gut microbiome correlates with metabolic markers. Nature. 2013;500(7464):541–6.

76. Sommer F, Stahlman M, Ilkayeva O, Arnemo JM, Kindberg J, Josefsson J, et al. The gut microbiota modulates energy metabolism in the hibernating brown bear Ursus arctos. Cell Rep. United States; 2016 Feb;14(7):1655–61.

____________________________________________________________ General introduction

35

77. Cummings JH, Englyst HN. Fermentation in the human large intestine and the available substrates. Am J Clin Nutr. 1987;45(5 SUPPL.):1243–55.

78. Roberfroid M, Gibson GR, Hoyles L, McCartney AL, Rastall R, Rowland I, et al. Prebiotic effects: metabolic and health benefits. Br J Nutr. England; 2010 Aug;104 Suppl:S1-63.

79. Chambers ES, Morrison DJ, Frost G. Control of appetite and energy intake by SCFA: what are the potential underlying mechanisms? Proc Nutr Soc. England; 2015 Aug;74(3):328–36.

80. McNeil NI. The contribution of the large intestine to energy supplies in man. Am J Clin Nutr. United States; 1984 Feb;39(2):338–42.

81. Cani PD, Delzenne NM, Amar J, Burcelin R. Role of gut microflora in the development of obesity and insulin resistance following high-fat diet feeding. Pathol Biol (Paris). France; 2008 Jul;56(5):305–9.

82. Nohr MK, Pedersen MH, Gille A, Egerod KL, Engelstoft MS, Husted AS, et al. GPR41/FFAR3 and GPR43/FFAR2 as cosensors for short-chain fatty acids in enteroendocrine cells vs FFAR3 in enteric neurons and FFAR2 in enteric leukocytes. Endocrinology. United States; 2013 Oct;154(10):3552–64.

83. Samuel BS, Shaito A, Motoike T, Rey FE, Backhed F, Manchester JK, et al. Effects of the gut microbiota on host adiposity are modulated by the short-chain fatty-acid binding G protein-coupled receptor, Gpr41. Proc Natl Acad Sci U S A. United States; 2008 Oct;105(43):16767–72.

84. Tolhurst G, Heffron H, Lam YS, Parker HE, Habib AM, Diakogiannaki E, et al. Short-chain fatty acids stimulate glucagon-like peptide-1 secretion via the G-protein-coupled receptor FFAR2. Diabetes. United States; 2012 Feb;61(2):364–71.

85. Minekus M, Marteau P, Havenaar R. Multicompartmental dynamic computer-controlled model simulating the stomach and small intestine. Altern to Lab Anim ATLA. 1995.

86. Minekus M, Smeets-Peeters M, Bernalier A, Marol-Bonnin S, Havenaar R, Marteau P, et al. A computer-controlled system to simulate conditions of the large intestine with peristaltic mixing, water absorption and absorption of fermentation products. Appl Microbiol Biotechnol. 1999;53(1):108–14.

87. Aguirre M, Jonkers DMAE, Troost FJ, Roeselers G, Venema K. In vitro characterization of the impact of different substrates on metabolite production, energy extraction and composition of gut microbiota from lean and obese subjects. PLoS One. United States; 2014;9(11):e113864.

88. Kovatcheva-Datchary P, Egert M, Maathuis A, Rajilić-Stojanović M, De Graaf AA, Smidt H, et al. Linking phylogenetic identities of bacteria to starch fermentation in an in vitro model of the large intestine by RNA-based stable isotope probing. Environ Microbiol. 2009;11(4):914–26.

89. Venema K. Role of gut microbiota in the control of energy and carbohydrate metabolism. Curr Opin Clin Nutr Metab Care. 2010;13(4):432–8.

Chapter 1_________________________________________________________________________

36

Chapter 2 Characterization and in vitro digestibility

of by-products from Brazilian food industry: cassava bagasse, orange bagasse

and passion fruit peel

Published as:

de Souza CB, Jonathan M, Saad SMI, Schols HA, Venema K. Characterization

and in vitro digestibility of by-products from Brazilian food industry: cassava

bagasse, orange bagasse and passion fruit peel. Bioactive Carbohydrates and

Dietary Fibre. 2018. Oct.(16)90-99.

https://doi.org/10.1016/j.bcdf.2018.08.001

Chapter 2_________________________________________________________________________

38

Abstract The present study characterized selected by-products from Brazilian food

industry and their in vitro digestibility. These by-products (cassava and orange

bagasses, and passion fruit peels) are potentially rich sources of dietary fibres,

but currently they are mostly disposed. Their chemical analyses revealed

differences in composition for the same by-product type from different

suppliers. Cassava bagasses were mainly composed of starch, with high

variability among tested by-products (45% to 77.5% starch (w/w)). In vitro

experiments using a model of the upper gastrointestinal tract (TIM-1) indicated

that cassava bagasses had ~ 12% of resistant starch. The main constituents in

orange bagasses were free glucose and highly methyl esterified pectin (~23.5%

of total pectin). Seventy-seven % of digestible glucose present in the orange

bagasse were absorbed within 3 hours during in vitro digestion. Passion fruit

peels were a good source of fibres, especially pectin (~19%) and (hemi)cellulose

(~16%). The in vitro experiments indicated that passion fruit peel had slower

absorption of glucose than the other by-products, with 80% of digestible glucose

absorbed within 5 hours. In conclusion, the tested by-products are good sources

of diverse types of fibres and have a great potential to be incorporated into

different food products, thus decreasing food waste and contributing to a

sustainable food system.

________________________ Characterization and digestibility of food by-products

39

Introduction Brazil is the largest producer of orange juice, passion fruit juice and the second

largest producer of cassava worldwide (1). A consequence of the technical and

economical achievement of the processing industry is that a large amount of

underused by-products is formed, which includes peels, seeds, and bagasses.

Cassava bagasse is a by-product from the production of cassava starch and

cassava flour (Manihot esculenta Crantz) and contains fibre material as well as

the residual starch not completely extracted during processing (2). In Brazil, for

every ton of cassava used for starch production, around 928 kg of moist bagasse

is generated (2). The orange juice industry produces as by-product orange

bagasse that corresponds to around 50% of the total fruit mass (3). In case of

passion fruit, around 40-60% of the total fruit mass ends up as residue and by-

product consisting of peels and seeds (4).

These by-products can be used for animal feed (low-valued product), but mostly

they are simply disposed in the environment without any type of treatment and

thus are an environmental hazard (5). Some of the citrus peel is used for pectin

production (high-valued product), but the market demand for pectin is low

compared to the amount of pectin that could be produced from the worldwide

supply of citrus by-product (6). This challenges the food industry to identify

ways for a better utilization of these materials aiming for the strengthening of

sustainable food use (7). The use of food by-products contributes to a sustainable

food system, decreasing the impact that their disposal would have on the

environment. Additionally, their utilization is aligned to a responsible use of

natural resources that were employed for plants cultivation, such as soil and

water, as well as the human labour that was applied (7).

Different by-products, such as chicory root pulp and apple pulp, are rich in fibre,

including pectin (8). Currently, dietary fibre is defined as carbohydrate polymers

with a degree of polymerization (DP) of three or more, which are neither

digested nor absorbed in the human intestine (9). In general, consumption of

dietary fibre is associated with intestinal health, reduced cardiovascular disease

risks and lower body weights (10). Currently the general consumption of fibre

by different populations nonetheless is lower than the recommended amount

(10). In Brazil, a survey performed between 2008-2009 revealed that people

consumed on average 12.5 g of fibre/day, much lower than the 30 g/day

recommendation (10).

The high fibre content of by-products such as bagasses and peels makes them a

potential dietary fibre food source. The need to increase fibre consumption and

the increased concerns about sustainability, are strong stimuli to try to

Chapter 2_________________________________________________________________________

40

incorporate by-products from the food agro-industry into the human diet, e.g. in

the form of (new) functional food (components).

Dietary fibre is a term that reflects a heterogeneous group of compounds that

differ in their chemical structure and physico-chemical properties (11). Different

fibre types may have variable physiological functions or health benefits (12). It

is therefore crucial to structurally characterize these by-products before

analyzing their potential health benefits (e.g. prebiotic effect). The International

Scientific Association for Probiotics and Prebiotics has recently released a new

definition for prebiotics: “a substrate that is selectively utilized by host

microorganisms conferring a health benefit” (13). Bifidobacterium and

Lactobacillus genera are used as biomarkers for intestinal health, since these two

genera do not contain any known pathogens and they ferment carbohydrates as

preferred carbon- and energy source, producing metabolites known to have

positive effects on the host (14). The molecular structure of a prebiotic fibre also

determines its physiological effects as well as which microbial species will be

able to use it as growth substrate in the intestine (15). We have already

demonstrated the potential prebiotic effects of cassava bagasse using an in vitro

model that simulates the large intestine (TIM-2) (16). However, it has remained

unknown which component was responsible for the observed bifidogenic effects,

and whether different batches or origin (and consequently processing) show the

same results.

Pectins may be an important component of food by-products. Information about

the level of methyl esterification of these by-products is essential for future food

application studies, for instance as functional foods aiming for improvement of

intestinal health. Animal studies demonstrated that highly methyl esterified

(HM) pectins were fermented slower than lowly methyl esterified (LM) pectins

(17,18). This is a very important characteristic, since normally most of the

carbohydrates are fermented in the proximal colon. Their early depletion may

result in fermentation of proteins in the distal colon, with potentially negative

effects to the host, such as colon cancer (19). Analysis of the in vitro digestibility

of these by-products will indicate to what extent they can reach the colon, to be

further fermented by the colonic bacteria.

The aim of the present study was to characterize the composition of selected by-

products from the Brazilian food industry. Their digestibility was investigated in

an in vitro model of the upper gastrointestinal tract (TIM-1). Isolation of fibre

(alcohol insoluble solids; AIS) from by-products was performed and these

samples were also characterized.

________________________ Characterization and digestibility of food by-products

41

Materials and methods

Test products

Three different cassava bagasses were tested; two of these were from the same

supplier but obtained as different batches (Grazimara, Biguaçu, Brazil) – referred

to as CB1 and CB2, and the third one was from a different company (Lorenz,

Indaial, Brazil – referred to as CB3). The bagasse was dried by the suppliers in an

oven at 250-300 oC for 20 min. It was milled using ball-milling (MM2000, Retsch,

Haan, Germany).

Two different orange bagasses were tested, both in the form of powder – from

Chá&Cia (Jacareí, Brazil) – denoted as OB1, and from a store with bulk sale in the

city centre of Florianópolis (Brazil), referred to as OB2. Three different passion

fruit peels were tested, all in the form of powder – from Chá&Cia, referred to as

PFP1, Phytomare (Governador Celso Ramos, Brazil – PFP2), and the last one from

the same store as OB2 (Florianópolis, Brazil), denoted as PFP3. According to the

manufacturers, only the peels were used to prepare the powder, whereas the

seeds had been disposed.

Monosaccharide compositions

Monosaccharide compositions were determined for test products after acid

hydrolysis of all carbohydrates, followed by derivatizing the sugars released into

alditol acetates as previously described (20). Briefly, after a pre-hydrolysis step

using 72% (w/w) sulphuric acid at 30 oC for 1 hour, samples were hydrolyzed

with 1 M sulphuric acid (H2SO4) at 100 oC for 3 h. Afterwards the

monosaccharides released were reduced, acetylated and analyzed with gas

chromatography (GC) equipped with a flame ionization detector (FID). Inositol

was used as internal standard (21). The total uronic acid content was determined

with the automated meta-hydroxydiphenyl assay (22). Galacturonic acid (12.5-

100 μg/mL) was used for calibration.

Pectin levels were calculated from uronic acids (UA), rhamnose (Rha), arabinose

(Ara) and galactose (Gal) (w/w %). Non-starch polysaccharides (NSP) glucose

was calculated from the difference between total glucose and starch.

Rhamnogalacturonan (RG) backbone was calculated using the levels of Rha (mol

%), assuming the RG backbone consists of Rha and UA with a ratio of 1:1 (20).

The total RG content was calculated as RG backbone plus arabinose and

galactose. The homogalacturonan (HG) content was quantified by total UA

content minus UA content present in RG backbone (20).

Chapter 2_________________________________________________________________________

42

Quantification of glucose, fructose and sucrose

High performance anion exchange chromatography (HPAEC) was performed on

a ICS5000 system (Dionex Corporation, Sunnyvale, USA) as previously described

(20). The flow rate was constant at 0.3 mL/min. The elution started with 2 min

isocratic elution of 0.1 M sodium hydroxide (NaOH), followed by a 45-min

gradient to 400 mM sodium acetate in 0.1 M NaOH. The column was

subsequently cleaned for 5 min in 1 M sodium acetate in 0.1 M NaOH, and re-

equilibrated under starting conditions for 15 min, before the next sample

injection. Test products were suspended in Millipore water (2 mg/mL) and

centrifuged (10000 xg, 5 min) before analysis. One part OB supernatant was

diluted with four parts of water before analysis. The other samples were diluted

with the same volume of water. Glucose, fructose and sucrose at 10, 20 and 30

µg/mL were used as quantification standards. Chromeleon software version 7

(Dionex) was used for detection and analysis.

Characterization of pectins according to the degree of acetyl- and

methyl esterification

For the quantification of the degree of acetyl- (DA) and methyl (DM)

esterification of the uronic acid in the pectins, test products (± 3 mg) were

saponified in 1 mL of NaOH (0.25 M) for 3 h at room temperature. The amount

of methanol released was quantified using a colorimetric method as previously

described (23) determined with a spectrophotometer at 420 nm (Tecan Infinity

F500, Männedorf, Switzerland). The amount of acetic acid released during

saponification was quantified using the acetic acid assay kit from Megazyme

(Bray, Ireland).

Test products were analyzed in triplicate and the average acetic acid or methanol

concentration was calculated. The degrees of acetylation and methylation were

calculated as moles of acetic acid or methanol per 100 mol of uronic acid. It is

important to mention that apart from DM, some non-pectic cell wall

polysaccharides can also contain acetyl groups (20).

Total starch

Total starch content was analyzed according to the AOAC method (996.11) for

samples that may contain D-glucose and/or maltodextrins, using the total starch

assay kit from Megazyme.

________________________ Characterization and digestibility of food by-products

43

Resistant starch

Resistant starch (RS) was analyzed only in test products with a considerable

amount of starch: CB1, CB2, CB3 and PFP3. It was measured in quadruplicate

using the resistant starch assay kit (Megazyme).

Alcohol insoluble solids (AIS)

For all three cassava bagasses (CB1, CB2 and CB3) removal of starch and protein

was performed prior to AIS isolation. Test products (10 g) were suspended in

100 mL of 0.2 M sodium acetate buffer, heated to 85 oC and incubated with 75 μL

thermostable ɑ-amylase (0.548 U/g, from Bacillus licheniformis, Sigma-Aldrich,

Schnelldorf, Germany) for 35 min. After cooling down to 40 oC, additional ɑ-

amylase (75 μL) and 125 μL of amyloglucosidase (11.6 U/g, from Rhizopus,

Sigma-Aldrich) were added to the suspensions to hydrolyze any residual starch.

The suspensions were incubated at 40 oC for 3 h while stirring. Next, they were

centrifuged (8000 xg, 15 min, 20 oC). The supernatants were collected and 75 mL

of 0.05 M sodium acetate buffer at pH 5.2, 75 μL of ɑ-amylase and 125 μL of

amyloglucosidase were added to the pellets and incubated overnight at 30 oC

while shaking (supernatants were collected). Samples were centrifuged once

more (8000 xg, 15 min, 20 oC) and 75 mL of 0.05 M sodium acetate buffer at pH

5.2 and 125 μL of amyloglucosidase were added to the pellets. Thereafter

samples were incubated at 40 oC for 1 h while stirring. At this point, the

supernatants collected were mixed again with the pellets, pH was adjusted to ~

6.0 and 125 μL of protease (Subtilisin A from B. licheniformis (Megazyme)) was

added.

Samples were incubated at 50 oC for 1 h while stirring. Ethanol was added to 70%

(v/v) and the process continued as described below.

Samples of orange bagasses (OB1 and OB2) and passion fruit peels (PFP1 and

PFP2) were directly used for AIS isolation (without prior removal of starch and

protein). Test products were suspended in 80% (v/v) aqueous ethanol and

incubated at 4 oC for 1 h while stirring. The suspensions were centrifuged (8000

xg, 20 oC, 15 min) and the supernatants were discarded. The pellets was washed

with 80% (v/v) ethanol and centrifuged and this step was repeated until the

extracts had no detectable carbohydrates, checked with the phenol sulfuric acid

colour assay (24). The final residues were suspended in water, freeze dried and

denoted as alcohol insoluble solids (AIS).

Total protein

Total protein was estimated from the total nitrogen analyzed using the “Dumas”

method on a Flash EA 1112 N analyser (Thermo Fisher Scientific, Waltham, MA,

Chapter 2_________________________________________________________________________

44

USA) (25). D-Methionine (Acros Organics, NJ, USA) was used for calibration and

cellulose (Fluka, Buchs, Switzerland) served as a blank. Protein content was

calculated as nitrogen content x 6.25.

In vitro digestibility

The by-products CB1, CB2, CB3, OB2 and PFP3 were selected for in vitro

digestion studies, using the TNO intestinal tract model (TIM-1) (Supplemental

Figure 1). TIM-1 is a dynamic in vitro model that simulates the stomach and small

intestine. It consists of four compartments that simulate the stomach, duodenum,

jejunum and ileum respectively, which are connected by computer controlled

valves (26). The temperature was kept at 37 oC (body temperature). The

secretion of fluids and enzymes in each compartment was set to mimic the

physiological conditions of healthy human adults. Peristaltic movements are

mimicked through the contraction of the flexible walls, which are also

responsible for controlling gastric emptying and food transit (26).

The contents of the jejunum and ileum compartments were dialyzed

continuously using hollow fibre semi-permeable membranes (Sureflux 07L,

Nipro Europe, Zaventem, Belgium – cut-off 5-10 kDa), resembling the absorption

of the digested products such as monosaccharides, oligosaccharides, amino acids

and small peptides by intestinal cells (26).

Set up of the TIM-1 experiments

All digestive fluids were freshly prepared prior to the performance of each TIM-

1 experiment as previously described (27).

The amount of CB2, CB3, OB2 and PFP3 was set at 7.5 grams, and for CB1, 15

grams, reflecting their different capacity to bind (large amounts of) water. Water

binding would increase their volume and viscosity, which could surpass the

capacity of the system. To avoid this inconvenience, the quantities were adjusted

as indicated.

Samples were tested without a meal matrix, but their transit through the system

was mimicked as if they were part of a meal.

Tested by-products were mixed with water and gradually added to the

salivary/gastric juice at room temperature and the pH was set at 5.2 with

hydrochloric acid (HCl) or NaOH. The total volume added to the stomach was ~

300 ml (referred to as meal).

Simulated gastrointestinal conditions

Artificial oral fluid with α-amylase (A6380-1G, Sigma-Aldrich, St. Louis, USA),

gastric juice with gastric lipase (F-AP 15, Amano, Nagoya, Japan) and pepsin

________________________ Characterization and digestibility of food by-products

45

(Sigma-Aldrich, St. Louis, USA) were gradually added into the gastric

compartment (28). Pancreatin (Pancrex-Vet, Pfizer, Karlsruhe, Germany) was

prepared by centrifugation after stirring 17.5 g powder in 250 ml water.

Pancreatin, bile solution (0.8%, porcine bile - Sigma-Aldrich, St. Louis, USA) and

electrolytes were gradually added to the duodenal compartment during the

experimental run (28). The composition and secretion of fluids simulated the

physiological levels at fed state. Details have been published before (28).

Digestion and absorption was simulated during a 6 h experimental run, after

which approximately 95% of the meal passed through the upper gastrointestinal

tract (27).

Sampling

Samples from the gastric intake (meal) were taken just before its addition to the

stomach compartment.

Ileal efflux (indigestible portion) was kept on ice to stop the digestive activity.

During the experiments, samples from the ileal efflux were taken every hour.

Dialysate samples from the jejunum and ileum compartments (absorbed

portions) were also collected every hour. After 6 h, indigestible material

(residues remaining in the stomach, duodenum, jejunum and ileum) was taken,

in order to make a mass-balance. For all sampling times, pH and total volume

were measured and recorded. Samples were stored at -18 oC until analyses.

Analyses

Meal, ileal efflux and dialysate samples (jejunum and ileum compartments) were

analyzed for total nitrogen using the Kjeldahl method, and glucose using the acid

hydrolysis method on a Cobas Mira plus autoanalyser (Roche) by Bio-aNAlytiX

(Mook, the Netherlands).

Results and discussion

Cassava bagasses

Total sugar composition of CB1 and CB2 was very similar, mainly consisting of

glucose – 77.7-79.3% (w/w) (Table 1). This glucose originated largely from

starch because the analysis of CB1 and CB2 revealed the presence of 77.4% and

70.5% starch, respectively. They had low amounts of small sugars (glucose,

fructose and sucrose), 1.42 and 1.25% (w/w) in total for CB1 and CB2,

respectively (Table 1). The amount of resistant starch (RS) was negligible (<1%).

Glucose levels from non-starch polysaccharides (NSP - cellulose and

hemicellulose) were different for these batches of cassava bagasse. CB1 had 0.3%

of NSP glucose, while CB2 had a higher amount, 8.8% of NSP glucose (Table 1).

Chapter 2_________________________________________________________________________

46

Tab

le 1

: Ch

emic

al c

om

po

siti

on

of

cass

ava

bag

asse

s, o

ran

ge b

agas

ses

and

pas

sio

n f

ruit

pee

ls.

Rha

: rha

mno

se, F

uc: f

ucos

e, A

ra: a

rabi

nose

, Xyl

: xyl

ose,

Man

: man

nose

, Gal

: Gal

acto

se, G

lc: g

luco

se, U

A: u

roni

c ac

ids;

NG

: neg

ligib

le (

<1.0

%);

NA

: not

ana

lyse

d; N

E: n

ot e

stim

ated

;

Pect

in: s

um o

f UA

, Rha

, Ara

and

Gal

; DM

: deg

ree

of m

ethy

lati

on (

mol

es o

f met

hano

l per

100

mol

es o

f gal

actu

roni

c ac

id r

esid

ues)

; DA

: deg

ree

of a

cety

lati

on (

mol

es o

f ace

tic

acid

per

100

mol

es o

f gal

actu

roni

c ac

id r

esid

ues)

.

*Sm

all s

ugar

s: g

luco

se (

as fr

ee m

onom

ers)

, fru

ctos

e an

d su

cros

e

________________________ Characterization and digestibility of food by-products

47

CB3 showed a different composition. This bagasse had lower amounts of glucose,

part of which from starch (45% (w/w)), but also derived from cellulose and

hemicellulose (15.9% of NSP glucose). RS was also negligible, as were small

sugars (<1%).

The amounts of carbohydrates and starch found in CB1 and CB2 were higher

than in CB3 and compared to values reported in other studies, which vary from

around 40 to 64% for carbohydrates (29) and 47% for starch (30). These

differences could be due to the manufacturing process of peeling cassava and

producing cassava flour. CB1 and CB2 were generated by a small family

company, where the farmers were responsible for planting, harvesting and

peeling the cassava, and afterwards producing the flour. On the other hand, CB3

originated from a large-scale industrial processing of cassava. Therefore, the

industrial process was more efficient in peeling and removing the starch from

the bagasse than the artisanal process, explaining the lower amount of starch and

the higher amount of NSP in CB3. The handmade processing that CB1 and CB2

went through can also explain the differences in starch and NSP glucose amounts

found in these two batches, since the artisanal process of peeling cassava is more

prone to variation.

CB3 had a higher amount of pectin (16.7% (w/w)) compared with CB1 and CB2.

CB1 and CB2 had the lowest DM for all tested compounds – 0 and 14%,

respectively (Table 1), probably due to low NSP and UA levels, which may impair

the accurate DM analysis. DM of CB3 was 24% and DA 34%.

Analysis of protein in the CB samples demonstrated low amounts of this

macronutrient, varying from 0.6 to 1.1% (Table 1), in accordance with findings

in the literature, where protein levels range from 0.32 to 1.9% (29).

Carbohydrate and protein contents determined accounted for ~ 83% for CB1,

CB2 and CB3 of the total mass. Remaining moisture, ash and lipids represent the

residual percentages (29).

AIS obtained after starch and protein removal was composed of 57.1, 57.8 and

61.6% (w/w) carbohydrates for CB1, CB2 and CB3, respectively (Table 2). The

enzymatic treatment of starch removal was not completely efficient, since small

amounts of starch were still present in CB1 and CB2 (3.0 and 3.4%, respectively).

The same occurred for protein, where AIS of cassava bagasses had even higher

amounts of protein compared to CB prior to AIS isolation (Table 2). Proteins can

be from enzymes added during the sample treatment. AIS characterization

revealed that CB1, CB2 and CB3 were composed for 27-28% of pectins which

were lowly methylesterified (<30%) (Table 2).

Chapter 2_________________________________________________________________________

48

Tab

le 2

: Ch

emic

al c

om

po

siti

on

of

Alc

oh

ol I

nso

lub

le S

oli

ds

(AIS

) fr

acti

on

s fr

om

cas

sav

a b

agas

ses,

ora

nge

bag

asse

s an

d

pas

sio

n f

ruit

pee

ls.

Rha

: rha

mno

se, A

ra: a

rabi

nose

, Xyl

: xyl

ose,

Man

: man

nose

, Gal

: Gal

acto

se, G

lc: g

luco

se, U

A: u

roni

c ac

ids;

NA

: not

ana

lyse

d, N

E: n

ot e

stim

ated

; DM

: deg

ree

of

met

hyla

tion

(mol

es o

f met

hano

l per

100

mol

es o

f gal

actu

roni

c ac

id r

esid

ues)

; DA

: deg

ree

of a

cety

latio

n (m

oles

of a

ceti

c ac

id p

er 1

00 m

oles

of g

alac

turo

nic

acid

resi

dues

); P

ectin

: sum

of U

A, R

ha, A

ra a

nd G

al.

________________________ Characterization and digestibility of food by-products

49

For all three cassava bagasses, pectin in the AIS fractions were predominantly

present as homogalacturonan (HG) segments, concluded from the ratio UA:Rha

(data not shown) 24:1 (CB1 and CB2) and 22:1 (CB3). The successful isolation of

fibre (AIS) from all three tested cassava bagasses indicated that this may

represent an alternative procedure for their further utilization. AIS

characterization revealed a significant higher concentration of pectin and

(hemi)cellulose (Table 2) when compared to their raw by-products (Table 1).

In vitro digestibility experiments of cassava bagasses demonstrated that around

87% of the glucose present was digestible (Figure 1.1-1.3-D). It should be noted

that the analysis used for glucose measurement from TIM-1 samples

encompasses free glucose and starch-derived glucose only. Previously we

hypothesized that a large part of the remaining starch present in all cassava

bagasses was resistant starch type 1 (16) – physically inaccessible starch (31).

This was not confirmed here: the digestibility experiments showed that on

average 12% of glucose from the three tested cassava bagasses were not

digestible. Although the chemical analysis of cassava bagasses for RS showed

negligible amounts (Table 1), it is important to highlight that the in vitro

digestibility experiment mimics the time of food to transit through the upper

gastrointestinal tract, and the definition of RS is “the starch that is not absorbed

in the small intestine of humans” (31). The indigestible portion by definition thus

represents RS. Despite CB3 had higher amounts of NSP glucose and pectin (which

could decrease transit time of the digest and glucose absorption (32,33)), all

three cassava bagasses showed a similar glucose digestibility rate, with a peak of

absorption occurring during the second hour of digestion in the jejunum

segment, as can be seen in Figure 1.1-1.3-A. Cumulative absorption of glucose

from the three cassavas showed that after 3 h mostly if not all digestible glucose

had been absorbed (Figure 1.1-C). Protein absorption of the three cassava

bagasses tested occurred fast, mostly during the first 2 h (Figure 1.1-1.3-B), likely

due to their low protein content (0.64-1.07%) (Table 1).

A study comparing 15 samples of cassava flour from different regions in Brazil

showed that the amount of starch varied between 81.9-92.1 g/100 g, and fibre

varied between 0.5-2.7 g/100 g (34). CB1 had similar composition as cassava

flour. Nevertheless, CB2 had lower amounts of starch and higher quantities of

fibres than cassava flour. These by-products thus may be suitable as a substitute

for food products that are normally prepared with cassava flour, such as cakes,

cookies, breads and typical Brazilian dishes like “farofa”, although systematic

analyses of sensorial features and consumer acceptance are required.

Chapter 2_________________________________________________________________________

50

1.2

1.1

1.3

________________________ Characterization and digestibility of food by-products

51

Figure 1.1-1.5: A: Rate of glucose absorption (%) on TIM-1 during 6 h experimental run.

B: Rate of protein absorption (%) on TIM-1 during 6 h experimental run. C: Cumulative

absorption (%) of glucose and protein during 6 h experimental run. D: Final percentage

(%) of digested and indigested glucose and protein after 6 h experimental run on TIM-1.

1.1-CB1; 1.2-CB2; 1.3-CB3.

Importantly, cassava and its derived products (cassava flour and tapioca starch)

constitute an important source of energy, especially for the population from

various remote regions in Brazil because this crop is resistant to poor nutrient

and dry soil (2). Discarding such by-products therefore is a waste of energy and

fibre source for humans.

CB3 is richer in pectin, cellulose and hemicellulose than the other two cassava

bagasses tested. Pectin is known for its effects on satiety and decreasing

cholesterol and glucose absorption (33) and its fermentation by gut microbiota.

Cellulose and hemicellulose are mainly known for their benefits in increasing

volume and frequency of defecations (32), thereby contributing to alleviating

constipation. This by-product could be incorporated into different food products,

such as fibre supplement in whole-grain breads and cookies.

Orange bagasses

Samples of orange bagasse from the two different suppliers tested showed a very

similar composition (Table 1). The total amount of carbohydrates accounted for

50.6-51.8% (w/w). Considerable percentages of small sugars (like glucose,

fructose and sucrose) were present - 22.8 and 33.4 % (w/w) for OB1 and OB2,

respectively (Table 1), indicating the presence of some residual juice in these by-

products. The high amounts of fructose and sucrose present in these samples did

not allow an accurate estimation of the amount of NSP glucose (cellulose and

hemicellulose) because fructose is not stable during acid hydrolysis (35) and

may partially be converted into glucose and mannose.

OB1 and OB2 showed small differences in protein levels: 4.7% and 6.4%,

respectively (Table 1). Similarly, Lopes et al., (36) reported an amount of 6.5%

of protein in orange bagasse. These two by-products contained only minor

amounts of starch, resistant starch analysis therefore was not performed.

Carbohydrate and protein contents accounted for ~ 57% of the total mass for

OB1 and OB2. The remaining material was not identified and may be composed

of moisture, ash, lipids, lignin, and part of the fructose that was degraded during

acid hydrolysis, and organic acids, as reported elsewhere (36,37).

Characterization of the AIS fraction from orange bagasses showed that OB1 and

OB2 were composed for 33.6% and 30.8% of pectin, respectively (Table 2).

These pectins were highly methylesterified (93% and 92%, respectively). The

Chapter 2_________________________________________________________________________

52

ratio of Ara:Gal 19:13 for OB1 and 17:11 for OB2 indicates that the RG regions

are slightly dominated by arabinose. They had relatively high amounts of

arabinose (OB1 9.3% and OB2 7.4% (w/w)), possibly originating from the

arabinan side chains of pectin (Table 2). The Rha:UA ratios of 3:22 (OB1) and

3:28 (OB2) indicate that these AIS fractions were rich in HG.

In vitro experiments revealed that for OB2, 86.3% of glucose present in the form

of small sugars and starch was digestible (Figure 1.4-D), with ~ 77% absorbed

within 3 h (Figure 1.4-C). It thus appears reasonable to conclude that most of the

digestible glucose from OB2 originated from free molecules of glucose and

sucrose, since the amount of starch was quite low (Table 1). Digestion and

absorption of protein from OB2 occurred mainly in the first 2 h of the

experiments, in the jejunum compartment (Figure 1.4-C).

Figure 1.4: OB2

Characterization and in vitro digestibility of orange bagasses revealed that they

could be used as a fibre supplement. Pectins are known for their capacity to

decrease lipids and glucose absorption in the small intestine, thereby lowering

blood lipids and attenuating blood glucose response (10).

Passion fruit peels

Data obtained from sugar composition analysis of the three tested passion fruit

peels shows that PFP1 and PFP2 have a similar composition (Table 1). PFP1,

PFP2 and PFP3 had in total 49.5, 48.7 and 62.8% (w/w) of carbohydrates. The

amounts of small sugars in PFP1 and PFP3 were lower than 1% (w/w), and 1.2%

for PFP2 (Table 1). PFP1 and PFP2 had higher amounts of pectin (~ 20%) and

NSP glucose (~ 16%) than PFP3 (11.0% of pectin and 7.3% of NSP glucose)

________________________ Characterization and digestibility of food by-products

53

(Table 1). Previous analysis of yellow passion fruit peel revealed an amount of

16.4% pectin in samples without any type of treatment (only washed and dried

peels), and 13.5% of pectin in samples that passed through an additional

treatment step (soaking in water for 12 h) (38). Different ways of processing

passion fruit by-products thus influence their chemical properties and may

explain the differences found, although the exact method of PFP processing for

our samples is not known.

The PFP1 and PFP2 AIS fractions were composed of 63 and 66.8% carbohydrates

(Table 2). From these, 19.8% and 23.4% were represented by pectins (PFP1 and

PFP2, respectively), which were lowly methylesterified (PFP1 28% and PFP2

29%). Coelho et al. (2017) reported that non-treated passion fruit peels were

lowly methylesterified. Lowly methylesterified pectins can be used in food

products with the aim of increasing their viscosity without the need to add sugar,

as is the case of highly methylesterified pectins (38). The Rha:UA ratios of PFP1

(1:21) and PFP2 (1:25) indicate that pectin was composed predominately of HG.

For PFP1, RG regions were composed almost equally of arabinose and galactose

(Ara:Gal – 3:4). The ratio of Ara+Gal/Rha indicates that PFP2 had similar

arabinose/galactose side chains as PFP1 (7 and 8 for PFP1 and PFP2,

respectively).

The amount of starch present in PFP3 (38.9%) was much higher than in the other

two samples analyzed (<3%; Table 1). This was an unexpected high amount of

starch. PFP3 most likely is not a pure passion fruit peel product, and may be

contaminated with other fruit by-products/starch. For this reason, AIS isolation

and characterization was not performed for PFP3.

Passion fruit peel carried the highest percentage of protein compared with the

other by-products analyzed here. The amounts for PFP1, PFP2 and PFP3 were

8.5, 8.4 and 7.2%, respectively. Cazarin et al (2014) found a lower value in their

analysis, 3.94%, whereas Coelho and collaborators (38) reported a value of 3.8%

in their samples without treatment, and 2.5% in samples that passed through a

treatment (soaking in water for 12 h).

In vitro experiments with PFP3 indicated that 83% of the glucose was digestible.

As already explained, this by-product batch showed an unusual amount of starch,

which was considered by us as a “contamination” with another by-

product/starch. Thus, here the amount of digestible glucose can be either from

free molecules of glucose or sucrose (although they were present in very low

amounts, 0.63% (w/w) in total), as well as from the “unusual” starch present.

Cumulative absorption of glucose from PFP3 showed a slightly slower

absorption when compared to the other by-products tested - with 80% of the

digestible glucose being absorbed within 5 h (Figure 1.5-C). Our in vitro

Chapter 2_________________________________________________________________________

54

experiments showed that protein from PFP3 was mostly indigestible (95.4%)

(Figure 1.5-D). It is likely that the indigestible protein originated from the

digestive juices that had been added to the system (such as pancreatin and bile).

Figure 1.5: PFP3

Characterization of passion fruit peels demonstrated that they are a good source

of fibres, being an alternative for fibre supplement that could be used either

directly by consumers in different food preparations or by the food industry with

the objective to use a natural and sustainable ingredient. However, it is

important to be aware of the origin of these by-products, since here we showed

that one of the samples was contaminated with a significant amount of starch.

Conclusions The detailed analyses performed indicated that different samples of the same

type of by-product varied in some aspects, such as pectin levels and composition,

and starch amounts. These differences in composition are likely to be due to

diversity in the origin and state of development of the plant at harvesting, that in

turn may give a distinct chemical and nutritional composition (40), as well as

related to the manufacturing process of the products.

Characterization of cassava bagasses revealed that most of their remaining

starch was digestible. In this case, cassava bagasse can be used as a source of

energy and may be applicable as a substitute to cassava flour, thus reducing the

amount of waste material. This could have a positive impact mainly for small

farmers/producers, which would increase their income or improve their

nutritional status. Fibre isolation (AIS) might be an alternative procedure for

________________________ Characterization and digestibility of food by-products

55

further utilization of cassava bagasse as a food product/ingredient source of

fibre. AIS characterization showed a significant higher concentration of pectin

and (hemi)cellulose than the raw by-product.

Orange bagasse analyses demonstrated that both samples were very similar in

their chemical structure. They were rich in small sugars and pectin. Pectin

characterization showed that HG was predominant in their structure, and they

were highly methylesterified.

Characterization of passion fruit peels showed that they are good sources of

fibres, especially pectin and (hemi)cellulose.

Regarding pectins, our results suggest that pectins from cassava bagasse, orange

bagasse and passion fruit peel are diverse not only in their amount, but also in

their chemical structure. Here we have demonstrated that the degree of

methylation and acetylation vary according to the by-product, as well as the

proportion of HG and RG in their structure.

To conclude, we have studied the chemical characteristics and digestibility of

selected by-products from the Brazilian food industry, showing that they provide

interesting materials for incorporation into different food products, decreasing

food waste and contributing to a sustainable food system. These fibre fractions

(AIS), either isolated or within the original by-products, are most likely

fermented by the gut microbiota, which is the topic of future experiments.

Conflict of interest The authors declare that there are no conflicts of interest.

Acknowledgements We acknowledge Christiane Rösch from Wageningen University for her

analytical support with the sugar composition experiments and analysis, Mark

Jelier from Triskelion for his analytical support in handling TIM-1. We also thank

the Brazilian companies Chá&Cia, Lorenz, Phytomare and Grazimara that kindly

provided by-product samples for these experiments. We kindly acknowledge

Geraldo Bussolo and Zélia Maria Bussolo for collecting and sending samples of

orange bagasse and passion fruit peel from Brazil (Florianópolis). We thank Prof.

Lubbert Dijkhuizen from Groningen University for critically reviewing our

manuscript.

Financial support Carlota Bussolo de Souza received a scholarship from CNPq (National Council for

Scientific and Technological Development) – Brazil – under the Program “Science

Chapter 2_________________________________________________________________________

56

without Borders” (grant number 246027/2012-6). Maastricht University –

campus Venlo financed the experiments and analyses.

________________________ Characterization and digestibility of food by-products

57

References 1. Ministério da Agricultura. Citrus [Internet]. Vol. 2014. 2014 [cited 2016

Jan 20]. Available from: http://www.agricultura.gov.br/vegetal/culturas/citrus

2. Fiorda FA, Soares Júnior MS, da Silva FA, Fontinelle Souto LR, Eiras Grossmann MV. Farinha de bagaço de mandioca: Aproveitamento de subproduto e comparação com fécula de mandioca. Pesqui Agropecu Trop. 2013;43(4):408–16.

3. Romero-Lopez MR, Osorio-Diaz P, Bello-Perez LA, Tovar J, Bernardino-Nicanor A. Fiber concentrate from orange (Citrus sinensis L.) bagase: characterization and application as bakery product ingredient. Int J Mol Sci. 2011;12(4):2174–86.

4. de Oliveira LF, Nascimento MRF, Borges SV, Ribeiro, do Nascimento PC, Ruback VR. Aproveitamento alternativo da casca do maracujá-amarelo. Ciência e Tecnol Aliment. 2002;22(3):259–62.

5. Helkar P, Sahoo A, Patil N. Review: food industry by-products used as a functional food ingredients. Int J Waste Resour. 2016;6(3):1–6.

6. Manderson K, Pinart M, Tuohy KM, Grace WE, Hotchkiss AT, Widmer W, et al. In vitro determination of prebiotic properties of oligosaccharides derived from an orange juice manufacturing by-product stream. Appl Environ Microbiol. 2005;71(12):8383–9.

7. Meybeck A, Gitz V. Sustainable diets within sustainable food systems. Proc Nutr Soc. 2017 Feb;76(1):1–11.

8. Ramasamy US. The role of soluble and insoluble fibers during fermentation of Chicory root pulp. Doctoral dissertation. Wageningen University; 2014.

9. Stephen AM, Champ MM-J, Cloran SJ, Fleith M, van Lieshout L, Mejborn H, et al. Dietary fibre in Europe: current state of knowledge on definitions, sources, recommendations, intakes and relationships to health. Nutr Res Rev. 2017 Jul 5;1–42.

10. Latulippe ME, Meheust A, Augustin L, Benton D, Bercik P, Birkett A, et al. ILSI Brazil International Workshop on Functional Foods: a narrative review of the scientific evidence in the area of carbohydrates, microbiome, and health. Food Nutr Res. 2013;57(10):7.

11. Jonathan MC. Monitoring the degradation of individual dietary fibres in pig models. Doctoral dissertation. Wageningen University; 2013.

12. Jones JM. CODEX-aligned dietary fiber definitions help to bridge the “fiber gap.” Nutr J. 2014;13(34):1475–2891.

13. Gibson GR, Hutkins R, Sanders ME, Prescott SL, Reimer RA, Salminen SJ, et al. Expert consensus document: The International Scientific Association for Probiotics and Prebiotics (ISAPP) consensus statement on the definition and scope of prebiotics. Nat Rev Gastroenterol Hepatol. 2017 Aug;14(8):491–502.

14. Macfarlane S, Macfarlane GT, Cummings JH. Review article: Prebiotics in the gastrointestinal tract. Aliment Pharmacol Ther. 2006;24(5):701–14.

Chapter 2_________________________________________________________________________

58

15. Martinez RC, Bedani R, Saad SM. Scientific evidence for health effects attributed to the consumption of probiotics and prebiotics: an update for current perspectives and future challenges. Br J Nutr. 2015;114(12):1993–2015.

16. Bussolo de Souza C, Roeselers G, Troost F, Jonkers D, Koenen ME, Venema K. Prebiotic effects of cassava bagasse in TNO’s in vitro model of the colon in lean versus obese microbiota. J Funct Foods. 2014;11(C):210–20.

17. Tian L, Scholte J, Borewicz K, van den Bogert B, Smidt H, Scheurink AJW, et al. Effects of pectin supplementation on the fermentation patterns of different structural carbohydrates in rats. Mol Nutr Food Res. 2016 Oct;60(10):2256–66.

18. Dongowski G, Lorenz A, Proll J. The degree of methylation influences the degradation of pectin in the intestinal tract of rats and in vitro. J Nutr. 2002 Jul;132(7):1935–44.

19. den Besten G, van Eunen K, Groen AK, Venema K, Reijngoud DJ, Bakker BM. The role of short-chain fatty acids in the interplay between diet, gut microbiota, and host energy metabolism. J Lipid Res. 2013;54(9):2325–40.

20. Ramasamy US, Gruppen H, Schols HA. Structural and water-holding characteristics of untreated and ensiled chicory root pulp. J Agric Food Chem. 2013 Jun;61(25):6077–85.

21. Englyst HN, Cummings JH. Simplified method for the measurement of total non-starch polysaccharides by gas-liquid chromatography of constituent sugars as alditol acetates. Analyst [Internet]. 1984;109(7):937–42.

22. Thibault JF. Automated-method for the determination of pectic substances. Leb Technol. 1979;12(5):247–51.

23. Guillotin SE, Van Loey A, Boulenguer P, Schols HA, Voragen AGJ. Rapid HPLC method to screen pectins for heterogeneity in methyl-esterification and amidation. Food Hydrocoll. 2007;21(1):85–91.

24. Dubois M, Gilles KA, Hamilton JK, Rebers Pa, Smith F. Colorimetric method for determination of sugars and related substances. Anal Chem. 1956;28(3):350–6.

25. Pustjens AM, De Vries S, Gerrits WJ, Kabel MA, Schols HA, Gruppen H. Residual carbohydrates from in vitro digested processed rapeseed (Brassica napus) meal. J Agric Food Chem. 2012/07/18. 2012;60(34):8257–63.

26. Minekus M, Marteau P, Havenaar R. Multicompartmental dynamic computer-controlled model simulating the stomach and small intestine. Altern to Lab Anim ATLA. 1995;23:197–209.

27. Schnorr SL, Crittenden AN, Venema K, Marlowe FW, Henry AG. Assessing digestibility of Hadza tubers using a dynamic in-vitro model. Am J Phys Anthropol. 2015 Nov;158(3):371–85.

28. Havenaar R, de Jong A, Koenen ME, van Bilsen J, Janssen AM, Labij E, et al. Digestibility of transglutaminase cross-linked caseinate versus native caseinate in an in vitro multicompartmental model simulating young child

________________________ Characterization and digestibility of food by-products

59

and adult gastrointestinal conditions. J Agric Food Chem. 2013;61(31):7636–44.

29. Jasko AC, Andrade J de, Padilha L, Pauli RB de, Quast LB, Schnitzler E, et al. Caracterização físico-química de bagaço de mandioca in natura e após tratamento hidrolítico. Rev Bras Tecnol Agroindustrial. 2011;5:427–41.

30. Raupp DS, Moreira SS, Banzatto DA, V.C.Sgarbieri. Composição e propriedades fisiológico - nutritivas de uma farinha rica em fibra insolúvel obtida do resíduo fibroso de fecularia de mandioca. Ciência e Tecnol Aliment. 1999;19(2):205–10.

31. Fässler C, Arrigoni E, Venema K, Brouns F, Amadò R. In vitro fermentability of differently digested resistant starch preparations. Mol Nutr Food Res. 2006;50(12):1220–8.

32. Cherbut C, Salvador V, Barry J-L, Doulay F, Delort-Laval J. Dietary fibre effects on intestinal transit in man: involvement of their physicochemical and fermentative properties. Food Hydrocoll. 1991;5(1):15–22.

33. Gray J. Dietary fiber: Definition, analysis, physiology & health. ILSI Europe Concise Monograph Series; 2006. 1-44 p.

34. Dias LT, Leonel M. Caracterização físico-química de farinhas de mandioca de diferentes localidades do Brasil. Ciência e Agrotecnologia. 2006;30(4):692–700.

35. Nguyen SK, Sophonputtanaphoca S, Kim E, Penner MH. Hydrolytic methods for the quantification of fructose equivalents in herbaceous biomass. Appl Biochem Biotechnol. 2009 Aug;158(2):352–61.

36. Lopes JAS, Li Q, Thompson IP. Biorefinery of waste orange peel. Crit Rev Biotechnol. 2010 Mar;30(1):63–9.

37. Macagnan FT, dos Santos LR, Roberto BS, de Moura FA, Bizzani M, da Silva LP. Biological properties of apple pomace, orange bagasse and passion fruit peel as alternative sources of dietary fibre. Bioact Carbohydrates Diet Fibre. 2015;6(1):1–6.

38. Coelho EM, de Azevedo LC, Viana AC, Ramos IG, Gomes RG, Lima MDS, et al. Physico-chemical properties, rheology and degree of esterification of passion fruit (Passiflora edulis f. flavicarpa) peel flour. J Sci Food Agric. 2018 Jan;98(1):166–73.

39. Cazarin CBB, Silva JK da, Colomeu TC, Zollner R de L, Maróstica Junior MR. Capacidade antioxidante e composição química da casca de maracujá (Passiflora edulis). Ciência Rural. 2014;44:1699–704.

40. Skrovankova S, Sumczynski D, Mlcek J, Jurikova T, Sochor J. Bioactive compounds and antioxidant activity in different types of berries. Int J Mol Sci. 2015 Oct;16(10):24673–706.

Chapter 2_________________________________________________________________________

60

Supplemental material

Supplemental Figure 1: TNO intestinal model (TIM-1). Schematic figure of the stomach

and small intestine model (TIM-1). A = stomach compartment; B = pyloric sphincter; C =

duodenum compartment; D = jejunum compartment; E = ileum compartment; F1=

digestive fluids (saliva with electrolytes and amylase, gastric juice with pepsin lipase and

gastric acid); F2 = digestive fluids (pancreatic juice with bicarbonate and digestive

enzymes (proteases, lipase, amylase), and bile; G = jejunum dialysate; H = ileum dialysate

I = ileal efflux. Adapted from Schnorr et al. (28).

Chapter 3 Prebiotic effects of cassava bagasse in

TNO’s in vitro model of the colon in lean versus obese microbiota

Published as:

Bussolo de Souza C, Roeselers G, Troost F, Jonkers D, Koenen ME, Venema K.

Prebiotic effects of cassava bagasse in TNO’s in vitro model of the colon in lean

versus obese microbiota. Journal of Functional Foods. 2014;11(C):210-20.

https://doi.org/10.1016/j.jff.2014.09.019

Chapter 3_________________________________________________________________________

62

Abstract Obesity is currently a worldwide epidemic that has serious consequences for

human health. It has been suggested that gut microbiota influences body

weight, e.g., by producing short-chain fatty acids (SCFA) which are substrates

for the host and induce the release of satiety hormones (e.g., PYY). To test the

potential prebiotic effect of cassava bagasse (a by-product from cassava flour

and starch production) in vitro fermentation experiments were performed

using faecal microbiota originating from lean and obese subjects in a validated

model of the colon (TIM-2). The microbiota composition and production of

microbial metabolites were analysed. Fermentation of cassava bagasse induced

different effects in microbiotas originating from lean and obese individuals. It

was found to modulate the microbiota composition, since it stimulated the

growth of the genera Bifidobacterium and Roseburia in the microbiota

originating from lean individuals, and Bifidobacterium, Dorea, Blautia and

Coprococcus in the microbiota from obese individuals. Additionally, in the

microbiota from lean individuals, fermentation of cassava bagasse generated

57% of acetate, whilst in the microbiota from obese individuals the production

of acetate was 73%. Production of the branched-chain fatty acids iso-butyrate

and iso-valerate was higher by the microbiota from lean people (1.5 mmol and

2.9 mmol, respectively) than by the microbiota from obese subjects (0.52 mmol

and 1.3 mmol, respectively) upon cassava bagasse fermentation. Overall, the

production of SCFA from cassava was similar to that for inulin (positive

control), and seemed to drive the obese microbiota composition closer to that

of lean individuals. Although supplementary in vivo studies with cassava

bagasse are needed, this study shows for the first time the prebiotic potential of

cassava bagasse.

____________________________ Lean vs obese: prebiotic effects of cassava bagasse

63

Introduction “Globesity” is the term used to describe the global epidemic of overweight and

obesity (1), including occurrence in inhabitants from developing nations like

Brazil. Currently, more than 1 billion adults are overweight, of which one-third

is clinically obese (2).

In addition to the already known factors that can contribute to obesity, such as

genetics and unsuitable dietary habits, new evidence is showing that the gut

microbiota can also affect the nutritional metabolism of the host (3). Several

studies indicate the role of the gut microbiota in obesity-linked diseases (4,5),

although the mechanisms involved are not yet entirely clear.

Short-chain fatty acids (SCFA), mainly acetate, propionate and butyrate, are the

major metabolites produced by the microbiota in the large intestine and these

deliver additional energy to the host, contributing to about 5-15% of the total

caloric requirements of humans (6). Since even a small daily excess of energy

ingestion – as low as 1% of the recommended daily intake can contribute to

increased corporal weight in the long term, all mechanisms modifying food-

derived energy availability are important for the balance of body weight (7).

This means that the colonic microbiota has a very important role in energy

supply.

Besides the extra energy provided by SCFA, it has been hypothesized that these

can also influence upper gut motility, satiety and, through this, obesity.

Endocrine L-cells present in the colonic mucosa secrete peptides such as

peptide YY (PYY), which is involved in appetite regulation (8). PYY release is

stimulated directly by nutrients and in response to lipids in distal ileum and

colon (9). An in vitro study showed that butyrate increased the expression and

release of PYY in epithelial cells (8). Hence, there is some evidence that the

effect of fermentable dietary fibre on satiety and body weight could be

mediated through the increased colonic production of SCFA (10).

Another mechanism that links obesity and gut microbiota involves the higher

amounts of plasma lipopolysaccharide (LPS), called metabolic endotoxemia

(11), common in obese and type II diabetic people. LPS is involved in the

release of several cytokines that are key factors in activating insulin resistance,

and is also considered a factor for the triggering of obesity (11).

Current recommendations for the management of obesity and diabetes propose

an increase in consumption of dietary fibre, which may contribute to the

control of several metabolic disorders. Dietary fibre is defined as carbohydrate

polymers with a degree of polymerization (DP) of three or more, which are

neither digested nor absorbed in the human intestine (12). Among the dietary

fibres, prebiotics can be used as a tool to modulate the gut microbiota. A

Chapter 3_________________________________________________________________________

64

prebiotic is defined as “a selectively fermented ingredient that allows specific

changes, both in the composition and/or activity in the gastrointestinal

microbiota that confers benefits upon host well-being and health” (13).

Cassava (Manihot esculenta Crantz) is a tuber, and an original species from

Brazil, where the consumption per capita is around 50 kg/year (14). It can be

consumed as natural tuber, nevertheless, as it spoils easily, the production of

flour or starch is a manner to conserve it. During the flour or starch processing,

a solid residue - called bagasse - is produced, which contains the fibre material

from the root and the remaining starch that was not extracted during the

manufacturing (15).

To make one ton of starch, around 930 kg of cassava bagasse is generated and

in Brazil, per year, around 97.000 tons of bagasse are produced (16). This

residue is considered an industrial waste and it is generally used in animal feed

or even disposed of in the environment and thus considered an ecological

hazard (17). Since currently it does not have a great value in the market, the

main limitation of the commercialization and use of this residue is the drying

process, which is considered much too expensive (15).

Cassava bagasse is a good source of fibre and some investigations have

demonstrated the beneficial aspects of cassava bagasse intake both in rat and

human studies (18,19). These benefits are due to the high insoluble fibre

content (~86% of the total fibre content) and its associated physiological

effects, such as the increase in volume and frequency of defecations – and

therefore relief of constipation - and the possibility to be incorporated into food

products specially designed for celiac disease patients. However, little is known

about the possible prebiotic property of this by-product. A study comparing the

fermentability of diverse root crops and legumes using human faecal inoculum

revealed that in vitro batch fermentation of the isolated fibre of cassava showed

an increased amount of SCFA (20), placing cassava bagasse in a promising

position that deserves to be further investigated.

The aim of the present study was to investigate the potential prebiotic effect of

cassava bagasse. This was performed assessing the stimulation of growth

and/or activity of beneficial colonic bacteria using TNO’s dynamic in vitro

model of the large intestine (TIM-2) in response to the administration of

7.5g/day cassava bagasse over a period of 3 days. The microbiota composition,

levels and type of microbial metabolites as well as the levels of LPS were

analysed before and after the fermentation experiments. All analyses compared

faecal homogenates from lean with those from obese subjects. As a preliminary

study, the influence of cassava bagasse on the release of the satiety hormone

____________________________ Lean vs obese: prebiotic effects of cassava bagasse

65

PYY was determined after incubating TIM-2 samples with porcine intestinal

tissue disks.

Materials and methods

Study design

Faecal material was collected from lean (body mass index – BMI - 18.5-25

kg/m2, mean 23.6 ± 1.4 kg/m2, age range 23-31 years, two females (F) and two

male (M)), and obese (BMI >30 kg/m2, mean 33.5 ± 2.6 kg/m2, age range 23-61

years, 3 F and 1 M) volunteers recruited from TNO and Maastricht University

Medical Centre, respectively.

The exclusion criteria for both groups included the use of antibiotics or any

other medical treatment influencing gut transit or intestinal microbiota during

the preceding three months, severe chronic disease, gastrointestinal disease,

severe food allergy and intake of probiotics and prebiotics.

In vitro experiments were performed in duplicate with mixed faecal material

from either obese or lean individuals in the presence of a) dried and milled

cassava bagasse (Grazimara, Biguaçu, Brazil), b) chicory inulin as the “gold

standard prebiotic” with purity ≥ 90% and degree of polymerization > 10

(Orafti, Amsterdam, the Netherlands), and c) the Simulated Ileum Effluent

Medium (SIEM) simulating the material reaching the colon (further on referred

to as “standard”) - described in detail below.

Faeces collection and standardization

Faecal samples were collected from each subject. Volunteers were instructed to

put the samples in a gastight bag and to place it immediately into a plastic jar

containing an anaerocult strip (AnaeroGenTM, Cambridge, UK) to create

anaerobic conditions during transport to the anaerobic cabinet and/or freezer

(-80 oC). This transport never lasted longer than 3 hours.

The standardized lean or obese microbiota used to inoculate the TIM-2 system

was prepared in an anaerobic cabinet (Sheldon Lab – Bactron IV, Cornelius,

USA) where the faecal samples (separate for lean and obese individuals) were

mixed for standardization (21) and yielded a total of 500 grams of faecal

material. Then, 450 mL of 10 × concentrated dialysis liquid, 2490 mL of demi-

water and 560 g of glycerol was added.

The faecal material was aliquoted, snap-frozen in liquid nitrogen and stored at -

80 oC.

This method was validated previously and showed that standardized stool

samples are similar in composition and activity to fresh faecal samples (21).

Chapter 3_________________________________________________________________________

66

Besides that, since every person has a different microbiota composition, by

pooling faeces from different people it was possible to: i) have sufficient

amounts of faecal slurry for all experiments and therefore be able to compare

the results from the different runs without being cautious about the use of

different microbiota (21), and ii) to create a standardized microbiota that

encompasses species from different individuals and therefore can be

considered to represent a larger population.

TIM-2

TIM-2 (Supplemental Figure 1) simulates the conditions in the lumen of the

human proximal colon and all parameters are computer-controlled (22). The

model has been described extensively in recent publications (23,24). In short, it

simulates body temperature, pH in the lumen, composition and rate of

secretion, absorption of water and microbial metabolites through a semi

permeable membrane inside the model, mixing and transport of the intestinal

contents through the simulation of peristaltic movements, and the presence of a

complex, high density, metabolically active, anaerobic microbiota of human

origin (25).

Experimental setup

To start the experiment, TIM-2 was inoculated with 70 mL of the standardized

microbiota (described above) plus 50 mL of dialysis liquid (described below)

yielding a total of 120 mL (total volume of the system). The microbiota adapted

to the model conditions with the standard medium (SIEM) for 16 hours (Figure

1) and after that, a period of 4 hours of starvation allowed the bacteria to

ferment all available carbohydrates in the system.

Figure 1: Experimental set-up with timeline for TIM-2 experiments

____________________________ Lean vs obese: prebiotic effects of cassava bagasse

67

Next, samples were collected at time zero (t0) after which the test compound

was added. From this point onwards, a 3-day experimental period started,

where the microbiota received the standard feeding (that yields 7.5g/day of

carbohydrates) or standard feeding without carbohydrate, in which the test

compounds were mixed in (7.5g/day of cassava bagasse or inulin), added

through the feeding syringe (Supplemental Figure 1g; 2.5 mL/hour). Samples of

the lumen and dialysate were collected at time 0h, 24h, 48h and 72h (Figure 1).

SIEM and dialysate

The standard feeding, Simulated Ileal Effluent Medium (SIEM), simulates the

material reaching the colon and was slightly modified for experiments in TIM-2

compared to the medium which was described by Gibson et al. (26), mainly

concerning a lower amount of water. SIEM contained the following components

(g/L): 9.0 pectin, 9.0 xylan, 9.0 arabinogalactan, 9.0 amylopectin, 43.7 casein,

74.6 starch, 31.5 Tween 80, 43.7 bactopepton, 0.7 ox-bile, 4.7 K2HPO4.3H2O, 8.4

NaCl, 0.009 FeSO4.7H2O, 0.7 MgSO4.7H2O, 0.8 CaCl2.2H2O, 0.05 bile, 0.02 haemin

and 0.3 cysteine∙HCl, plus 1.5 mL of a vitamin mixture containing (per liter): 1

mg menadione, 2 mg D-biotin, 0.5 mg vitamin B12, 10 mg pantothenate, 5 mg

nicotinamide, 5 mg p-aminobenzoic acid and 4 mg thiamine. The pH was

adjusted to 5.8. Dialysis liquid contained (per liter): 2.5 g K2HPO4.3H2O, 4.5 g

NaCl, 0.005 g FeSO4.7H2O, 0.5 g MgSO4.7H2O, 0.45 g CaCl2.2H2O, 0.05 g bile and

0.4 g cysteine∙HCl, plus 1 mL of the vitamin mixture. All medium components

were purchased at Tritium Microbiology (Eindhoven, the Netherlands). SIEM

only contains indigestible carbohydrates and hence did not require pre-

digestion. SIEM was administered at 60 mL/day (corresponding to ~7.5 g

carbohydrate/day).

Cassava bagasse

Cassava bagasse was generated during flour production as described earlier

(27). The bagasse was dried by the supplier (Grazimara, Biguaçu, Brazil) in an

industrial pan at 250-300 o C for 20 minutes.

Carbohydrate and protein composition were analyzed at the Food Chemistry

Department of Wageningen University. Samples were analysed in duplicate and

data are represented as average (± range). Samples contained 0.25% of

nitrogen (N) and 1.7% of protein. The assay used for protein and nitrogen

analyses was the “Dumas” method (28).

Sugar composition was measured by derivatizing the sugars into alditol

acetates (28). Briefly, after a pre-hydrolysis step using 72% w/w sulphuric acid

at 30 oC for 1 hour, samples were hydrolyzed with 1 M sulphuric acid at 100 oC

Chapter 3_________________________________________________________________________

68

for 3 hours in a heating block. Afterwards the sugars were reduced with NaBH4.

Acetylation was performed and samples were analysed with gas

chromatography (GC) and a flame ionization detector (FID) using inositol as

internal standard.

The total uronic acid content was determined with the automated meta-

hydroxydiphenyl assay. Galacturonic acid was used for calibration.

Results are given in w/w % (percentage by weight) and mol % (molar

percentage).

The nature of the fibre (soluble and insoluble portions) as prepared for the

fermentation experiments was analysed (n=4) and on average cassava bagasse

was composed for 86% of insoluble fibre.

Microbiota composition

To determine, among others, whether cassava bagasse would have a prebiotic

effect, the composition of the microbiota was evaluated using pyrosequencing

of the small subunit ribosomal RNA (16S rRNA) genes present.

DNA was isolated from 200 mg of “faecal” material at the start and at the end of

the TIM-2 experiments (t0h and t72h), using a commercial DNA isolation kit

(Agowa, Berlin, Germany) following the instructions of the manufacturer.

Generation of PCR amplicon library was performed by amplification of the 16S

rRNA gene V5-V7 hypervariable region. Amplification was performed using the

forward primer 785F (5’GGATTAGATACCCBRGTAGTC-3’) and reverse primer

1175R (‘5- ACGTCRTCCCCDCCTTCCTC-3). The primers were fitted with the 454

Life Sciences Adapter A (forward primer) and B (reverse primer). The forward

primer also included a unique titanium decemnucleotide sample identification

key (barcode). The amplification mix contained 2 units of Pfu Ultra II Fusion HS

DNA polymerase (Stratagene, La Jolla, CA, USA) and 1x Pfu Ultra II reaction

buffer (Stratagene), 200 µM dNTP PurePeak DNA polymerase Mix (Pierce

Nucleic Acid Technologies, Milwaukee, WI, USA), and 0.2 µM of each primer.

After an initial denaturation (94 °C; 2 min), 30 PCR cycles were performed

(denaturation (94 °C; 30 sec), annealing (50 °C; 40 sec), extension (72 °C; 80

sec)). Samples with DNA recovery of equal or less than 10 pg/µL of DNA were

cycled 35 times using the same protocol. Amplicons were size checked and

quantified by gel electrophoresis and Quant-iT Picogreen dsDNA Assay

(Invitrogen, Carlsbad, CA - USA) on the Tecan Infinite M200 (Tecan Group Ltd,

Männedorf, Switzerland). Amplicons of the individual samples were equimolar

pooled and purified from agarose gel by means of QIAquick Gel Extraction Kit

Protocol (Qiagen, Hilden, Germany).

____________________________ Lean vs obese: prebiotic effects of cassava bagasse

69

The library was sequenced unidirectionally in the reverse direction (B-adaptor)

in one run in the 454 GS-FLX-Titanium Sequencer (Life Sciences [Roche],

Branford, CT 06405 USA) by Keygene (Wageningen, the Netherlands).

Sequence processing

FASTA-formatted sequences and corresponding quality scores were extracted

from the .sff data file generated by the GS-FLX-Titatium sequencer using the GS

Amplicon software package (Roche, Branford, CT). Sequencing data were

processed using modules implemented in the Mothur v. 1.20.0 software

platform module (29). Due to the unique barcodes, sequences were binned by

sample of origin. For further downstream analyses, barcodes and primer

sequences were trimmed, and low quality reads (containing ambiguous base

calls (N) in the sequence, > 1 error in the primer, and ≥ 1 error in the barcode,

more than 8 homopolymers anywhere in the sequence, and the occurrence of a

50 nucleotide window with a window average below 35, or a length >500 bp or

<200 bp and sequences that were too short or too long (automated function))

were removed from the analyses. The data set was simplified by using the

“unique.seqs” command to generate a non-redundant (unique) set of

sequences. Unique sequences were aligned using the “align.seqs” command and

an adaptation of the Bacterial SILVA SEED database as a template (available at:

http://www.mothur.org/wiki/Alignment_database). Alignment was performed

using the RDP template in order to ensure that comparable regions of the 16S

rRNA gene across all reads were analysed. Sequences that started before the

2.5-percentile or ended after the 97.5-percentile in the alignment were filtered.

Sequences were denoised using the “pre.cluster” command. This command

applies a pseudo-single linkage algorithm with the goal of removing sequences

that are likely due to pyrosequencing errors (30).

A total of 149.220 potentially chimeric sequences were detected and removed

using the “chimera.uchime” command (31). High quality aligned sequences

were classified by using the RDP-II naïve Bayesian Classifier database. Aligned

sequences clustered into Operational Taxonomic Units (OTUs) using OTU’s

defined by 97% similarity, were calculated by the average linkage clustering

command method. For each sample rarefaction curves were plotted and

community diversity parameters (Shannon diversity index, Chao1 and

Simpson’s) calculated. Unweighted and weighted Unifrac dendrograms/trees

were generated using the Unifrac module implemented in the Mothur software

manual and FastTree2 (29) to plot the distance matrices in trees.

Identification at the species level was performed essentially as described before

(32).

Chapter 3_________________________________________________________________________

70

SCFA, branched-chain fatty acids (BCFA), lactate and ammonia

Lumen and spent dialysis liquid from TIM-2 were analysed for microbial

metabolites essentially as described before (24). Concentrations were

calculated based on a calibration curve that was measured together with each

series of samples.

Calculations

Cumulative amounts of SCFA, BCFA, lactate and ammonia were calculated

considering the measurements in spent dialysis liquid and luminal content and

the volume of each sample.

Energy production

Energy production in the form of SCFA was calculated using the following

values for acetate, propionate, butyrate and lactate respectively: 874, 1536,

2192, and 1364 kJ mol-1 (33).

LPS

Lumen samples from TIM-2 (0h and 72h) were analysed for LPS as follows.

Samples were centrifuged for 10 minutes at 10.000 rpm at room temperature.

The supernatant – 100 µL – was diluted eight-fold with endotoxin-free

phosphate buffered saline (PBS – Gibco by Life Technologies, UK) and passed

through a disposable 0.20 μm sterile, pyrogen-free filter (Minisart, Sartorius

Stedim Biotech, Germany). Samples were heated at 100 oC for 30 minutes and

centrifuged for 2 minutes at 10.000 rpm at room temperature (34) . Afterwards

they were further diluted 1000-fold using PBS.

The assay was performed using a Limulus Amebocyte Lysate (LAL) kit (Thermo

Scientific, Rockfort, IL, USA) in a 96-well microplate (Sarstedt Inc., Newton,

USA) according to the instruction of the manufacturer. The absorbance was

read at 405 nm using a microplate reader (Biotek Synergy HT, Vermont,

USA)(34).

Statistical analysis

Data are represented as average (± range). Since the system yields highly

reproducible results, the experiments were performed in duplicate. Due to this

it was not possible to perform statistical analyses.

____________________________ Lean vs obese: prebiotic effects of cassava bagasse

71

Results

Microbiota composition

All the baseline (time zero) samples clustered together (Figure 2), showing that

all fermentations started with the same microbiota composition, although those

of the lean microbiota clustered separately from those of the obese microbiota

(Supplemental Figure 2).

Figure 2: Percentage of each phylum at time 0h and 72h with standard, inulin and

cassava in lean (A) and obese (B) microbiotas.

Lean microbiota

Firmicutes increased 16% and 13% for standard and inulin, respectively, and

decreased 4.6% for cassava (Figure 2A). The final abundance was 92%, 89%

and 67% for standard, inulin and cassava, respectively.

After 72 hours the phylum Bacteroidetes had decreased in all groups. It

decreased by 15%, 16% and 9.5% in standard, inulin and cassava, respectively.

The final abundance was 5.3% for standard, 6.1% for inulin and 16% in

cassava.

Actinobacteria (including the genus Bifidobacterium) decreased 0.70% in

standard, resulting in a final abundance of 0.04%. Inulin caused a subtle

increase (0.74%), while cassava showed the highest increase of Actinobacteria

(14%), with a final abundance of 15%.

Chapter 3_________________________________________________________________________

72

Obese microbiota

The obese microbiota (Figure 2B) showed a higher percentage of Firmicutes at

time zero when compared with the lean microbiota. However, it decreased in

all groups – by 71%, 6.1% and 29% to a final abundance of 22%, 87% and 62%

for standard, inulin and cassava.

Bacteroidetes showed a major increase in abundance under standard condition.

The initial percentage was 3.6% while at the end of the fermentation period

this increased to 34%. A similar tendency was seen for cassava, where the

initial amount of Bacteroidetes was 4.8% before and 28% after the

fermentation period. The abundance of this phylum on inulin did not change

much over the fermentation period.

Actinobacteria showed a higher increase in the obese microbiota when fed with

inulin compared with standard and cassava. The initial abundance of this

phylum was 0.74% and it increased with 6.2 %. Cassava also showed a slight

increase in this phylum, where the initial proportion was 0.43% and the final

was 2.6%. In the standard, Actinobacteria did not differ after 72 hours of

experiment. There were very few changes in the other phyla.

SCFA and lactate

Figure 3 shows the average of total cumulative production of the beneficial

microbial metabolites acetate, propionate, butyrate and lactate during the TIM-

2 experiments by the lean microbiota (A) and obese microbiota (B).

Figure 3: Average cumulative SCFA and lactate production (mmol) by the lean (A) and

obese (B) microbiotas after 72 hours (n = 2 ± range).

In lean microbiota, acetate production was comparable for the three substrates.

Standard showed higher amounts of butyrate, and propionate production was

lower than that of other SCFA. Lactate production was higher in the standard,

followed by cassava and inulin.

In obese microbiota, acetate production was also comparable for the three

substrates, but with higher values than observed for the lean microbiota.

Fermentation of cassava showed higher production of propionate and the

____________________________ Lean vs obese: prebiotic effects of cassava bagasse

73

lowest production of butyrate. Lactate production in obese microbiota was

higher for inulin and cassava when compared with lean microbiota.

Supplemental Figure 3 shows the kinetics of the cumulative average production

of SCFA on the cassava substrate during the entire test period for both

microbiotas.

Production of energy

In lean microbiota, standard showed the highest production of energy in kJ in

the form of SCFA and lactate – 176 kJ. Fermentation of inulin by the lean

microbiota produced less energy compared to the obese microbiota (153 kJ

versus 180 kJ). Lean and obese microbiota extracted similar amounts of energy

from cassava (148 kJ versus 151 kJ), which was overall lower than for the other

substrates.

BCFA and ammonia

Table 1 shows the cumulative production (mmol) of BCFA – iso-butyrate and

iso-valerate – and ammonia at t72 by lean and obese microbiota.

Table 1: Cumulative production of BCFA (iso-butyrate and iso-valerate – mmol) and

ammonia (mmol) by lean and obese microbiotas after 3 days of addition of the test

compounds at 7.5 g/day (n = 2).

Lean Obese

i-butyrate i-valerate ammonia i-butyrate i-valerate ammonia

Standard 1.3±0.04 2.6±0.05 65.2±3.08 0.13±0.18 0.53±0.31 41.8±2.07

Inulin 1.0±0.04 2.1±0.01 51.2±1.27 0.13±0.13 0.42±0.33 39.1±0.20

Cassava 1.5±0.09 2.9±0.22 60.5±9.23 0.52±0.33 1.3±0.49 55.8±4.9

In the lean microbiota, the production of BCFA was slightly higher after

fermentation with cassava. With regards to ammonia production, microbiota

fed with standard produced the highest amount.

In the obese microbiota, fermentation of cassava resulted in the highest

production either of i-butyrate, i-valerate and ammonia when compared with

the standard and inulin.

LPS

Figure 4 shows that in the lean microbiota, after a fermentation period of 72

hours, the luminal LPS concentration on all substrates had increased in similar

amounts.

Chapter 3_________________________________________________________________________

74

Figure 4: LPS concentration (endotoxin units (EU)) in the TIM-2 lumen samples at time

0h and 72h of fermentation with different substrates with lean (A) and obese (B)

microbiotas.

In obese microbiota the initial amount of LPS on cassava was lower compared

with the other substrates, however, it presented the highest increase.

Discussion

Cassava bagasse composition

As can be observed in Table 2, cassava bagasse is predominantly composed of

glucose, probably due the fact that the manufacturing process is not able to

extract all the starch present. Resistant starch is indigestible in the small

intestine, and it enters the large intestine. It has been proposed that resistant

starch has properties similar to dietary fibre and thus could also affect satiety

and have a beneficial role in weight regulation (35). Initial experiments to

determine the digestibility of the starch have been carried out and the results

show that the starch in cassava bagasse is partly digestible. Therefore, to reach

the colon delivery strategies (such as encapsulation, etc.) may have to be

devised.

Table 2: Sugar composition of cassava bagasse

Arabinose Xylose Mannose Galactose Glucose Uronic acid

mol % 0.5 0.5 0 1 96 2

w/w % * 0.4 0.4 0.2 0.7 85 2

* w/w does not sum up to 100% due to the presence of moisture.

Microbiota composition

The microbiota composition in the beginning of the TIM-2 experiments (Figure

2) is in accordance with the finding of Gordon and colleagues (36), with an

increased abundance of the phylum Bacteroidetes and decreased abundance of

Firmicutes in lean microbiota when compared with obese microbiota. It has

been hypothesized that an increased ratio of Firmicutes to Bacteroidetes may

____________________________ Lean vs obese: prebiotic effects of cassava bagasse

75

have a significant contribution to the pathophysiology of obesity through the

promotion of adiposity or could even represent a host-mediated adaptive

response to limit energy uptake/storage through, for instance, reducing the

capacity to ferment polysaccharides (36). On the one hand is not logical to link

this ratio with obesity because it is known that Bacteroidetes, especially

members of the genus Bacteroides, have a great capacity to metabolize an

enormous variety of glycans from plants and animals (37) and therefore could

provide more energy in the form of SCFA and also monosaccharides that can be

absorbed by the human gut. On the other hand, it has been proposed that SCFA

have satiety-enhancing properties (38) and therefore it could be hypothesized

that the higher the amounts of SCFA produced, the more satiety effects would

occur (and thus the leaner one could become). Additionally, research showed

an increase in Bacteroidetes in overweight and obese individuals (39), which is

the opposite of the results published by Gordon and colleagues. Moreover,

these phyla are composed of several dozens of species, and the role in obesity

of the species that represent these phyla in the gut eco-system has not been

examined in these early studies.

Cassava had some unique effects regarding the abundance of some species. In

lean microbiota abundance of Ruminococcus obeum and Bacteroides uniformis

increased, and Eubacterium rectale and Prevotella copri decreased upon

cassava bagasse feeding.

Inulin also had some unique effects, which in lean microbiota included the

increase of Catenibacterium mitsuokai and decrease of Eubacterium rectale and

Ruminococcus bromii. In obese microbiota it increased the abundance of

Eubacterium hadrum, Lactococcus garvieae and Eubacterium biforme.

In lean microbiota, both inulin and cassava stimulated the increase in

abundance of the genus Bifidobacterium. However, while inulin increased the

relative proportion by a factor of 169-fold compared to the standard

(Supplemental Figure 4), cassava showed a greater response with an overall

1738-fold increase. Interestingly, different effects were observed in obese

microbiota. After 72 hours of fermentation with inulin and cassava, inulin

showed a stronger effect on Bifidobacterium than cassava, with an 80-fold

increase relative to the standard. Cassava, although also stimulating the

increase of this genus by 42-fold, had a clearly less strong effect when

compared with lean microbiota. Obese samples become rather similar to lean

samples after 72 hours (Supplemental Figure 2), indicating the microbiota

becomes healthier.

The Bifidobacterium and Lactobacillus genera are used to characterize the

prebiotic effect of substrates, reflecting their health-promoting properties such

Chapter 3_________________________________________________________________________

76

as inhibition of opportunistic pathogens (40). Cassava showed a greater

increase in the genus Bifidobacterium in the microbiota obtained from lean

individuals than the well-known bifidogenic prebiotic inulin. Cassava also

induced the relative contribution of bifidobacteria in microbiota obtained from

obese individuals, but to a lesser extent when compared with lean individuals.

Specifically, either in lean or obese microbiota at t72h, Bifidobacterium dentium

was the most dominant Bifidobacterium present. B. adolescentis, B. breve and B.

pseudocatenulatum increased in lean and obese microbiota. The effects of inulin

and cassava on the genus Lactobacillus did not differ from the standard, either

in lean or obese microbiota.

The genus Roseburia is related to butyrate production and is thus thought to

play a key role in colonic health (5). In comparison with the standard, cassava

was able to increase the relative proportion of Roseburia 7-fold after 72 hours

of fermentation in lean microbiota (Supplemental Figure 4), especially

Roseburia faecis. Interestingly, inulin decreased the amount of Roseburia in lean

microbiota 7-fold. There were no changes in this genus in microbiota obtained

from obese individuals after 72 hours of fermentation.

Cassava bagasse had the ability to increase the amount of Bacteroides in lean

microbiota compared to the standard, whereas the amount in obese microbiota

was not influenced compared to the standard. Known propionate producers

belong to the genus Bacteroides (39) and besides that, large polysaccharides,

such as resistant starch, are more readily broken down by Bacteroides, while

bifidobacteria prefer to ferment shorter-chain oligosaccharides (24).

Interestingly, bifidobacteria and Bacteroides were higher in lean microbiota

after feeding cassava, indicating that cross-feeding between these two genera

may have occurred (24). Bifidobacteria have been shown to be stimulated upon

starch feeding before (23).

The genera Dorea and Coprococcus were stimulated 44 and 14-fold,

respectively, by cassava (Supplemental Figure 4). Unfortunately, these genera

have only recently been described as being part of the microbiota, and their

importance to host physiology is not yet known. Dorea has been found to be

stimulated by inulin (41). In our study, this is only observed in the faecal

material of obese individuals. In the faecal material from lean subjects, Dorea

actually decreased upon inulin feeding. There were very few changes in the

other phyla. As expected the Verrucomicrobia, containing Akkermansia

(Akkermansia muciniphila is inversely correlated with weight gain (10)),

decreased, as there was no mucin added to TIM-2, which is the major substrate

of the genus.

____________________________ Lean vs obese: prebiotic effects of cassava bagasse

77

SCFA and lactate

It is clear that acetate production by the obese microbiota, for all substrates,

was much higher than production of the other two SCFA (Figure 3 and S4).

Acetate stimulates lipid synthesis, but at the same time propionate may

counteract de novo lipogenesis from acetate (42). Therefore, it can be

speculated that the ratio of SCFA produced by the obese microbiota is in a sense

not “protective” against excess lipid production, since acetate concentrations

are higher than those of propionate. Indeed SCFA have different metabolic

effects in the host and therefore changing the proportional abundance of these

metabolites may result in significant changes in responses of host cells (43).

It is noteworthy that lactate production by the obese microbiota fed with inulin

was higher than on all the other substrates, as well as compared with lean

microbiota. Lactate is an intermediate metabolite in intestinal fermentation and

it only accumulates when there is a fast fermentation of the substrate (24).

Besides that, it is the major end-product of bifidobacterial metabolism, which

can explain the amount of lactate production in obese microbiota fed with

inulin since it primarily stimulated the increase of abundance of this genus.

However, cassava bagasse in lean microbiota increased the abundance of

bifidobacteria even more, but was not followed by an increase in either acetate

or lactate. Here, lactate may have been converted into the other SCFA.

BCFA and ammonia

The amounts of BCFA produced during cassava fermentation by the lean

microbiota were higher when comparing with the standard and inulin. These

concentrations were higher when compared with the obese microbiota. We

hypothesize that the difference in microbiota composition between lean and

obese may affect the production of these different metabolites. Further studies

are required to test this hypothesis and find out exactly which bacterial species

are related with protein fermentation that in turn yields BCFA and ammonia as

metabolites.

LPS

Given that obesity is considered to be a low grade inflammatory disease and

that a previous study demonstrated that obese subjects have higher

concentrations of plasma LPS (11) than lean subjects, it was hypothesized that

the luminal concentration of LPS in TIM-2 could also be higher for the

microbiota from obese subjects compared with the microbiota from lean

subjects. Our first results shown here are not in agreement with this. Further

experiments are required to confirm differences in luminal LPS concentration.

Chapter 3_________________________________________________________________________

78

PYY

In an ex vivo experiment, porcine intestinal tissue disks were incubated with

TIM-2 luminal samples and preliminary results indicated a higher release of

PYY induced by the obese microbiota metabolites (not shown). Since PYY

induces satiety, this was unexpected. However, it may also point to the

beneficial effects of dietary interventions with inulin and/or cassava on PYY

expression. It remains to be seen which (combination of) metabolites in the

obese samples are responsible for the higher release of PYY from colonic tissue.

Production of energy

It was expected that the results of this study would show a higher amount of

SCFA produced by the obese microbiota when compared with the lean

microbiota, since SCFA provide extra energy to the host. However, the present

study did not show this. Inulin was the only substrate that after fermentation

by the obese microbiota showed a higher amount of energy extraction when

compared with the lean microbiota. It should be noted that equal amounts of

carbohydrates were provided to these microbiotas, which is likely to be

different in vivo, where obese individuals tend to overeat and hence more

carbohydrates may reach the colon.

This unexpected result may reflect the satiety-enhancing properties of SCFA,

since the expression of proglucagon, the precursor of glucagon-like peptide 1

(GLP-1), can be up-regulated by SCFA (44). Besides this, it has been reported

that butyrate can increase energy expenditure and fatty acid oxidation in rats

(45). Thus, one can argue that higher amounts of SCFA are responsible to keep

the lean individuals lean due to the satiety effects of the gut microbiota

metabolites. The results clearly show that SCFA production depends on the

substrate provided and on the origin of the microbiota. Accordingly, this study

shows that microbiota fermentation of substrates resulting in production of

SCFA (and therefore the production of extra energy to the host) is not the only

factor that affects body weight. These other factors remain to be investigated. It

is definitely not only a question of extra calories yielded, but the intricate role

that each SCFA has on host metabolism.

____________________________ Lean vs obese: prebiotic effects of cassava bagasse

79

Conclusions Health professionals know the difficulties that people experience in changing

eating habits and life style necessary for weight management. Therefore, there

is an urgent need for alternative solutions that can assist people in their daily

battle with overweight and obesity and by this improve the quality of life of a

relatively large portion of the world population.

Here we showed for the first time the potential prebiotic properties of cassava

bagasse, an industrial residue that currently does not have commercial value. It

induced different effects in microbiotas originating from lean and obese

individuals, and modified the obese microbiota composition closer to that of

lean individuals. It is thought that particularly the cassava bagasse starch

fraction was responsible for the increase in growth of beneficial bacteria,

including the bifidogenic effect. It thus shows great promise in becoming a

functional food in the future, although further experiments are required to

elucidate the mechanisms involved in more detail. According EFSA

recommendations it also is necessary to show these prebiotic effects of cassava

bagasse in supplementary in vivo studies. The methodology used here shows

great promise as a rapid screening tool for evaluation of prebiotic activity of

indigestible substrates.

Acknowledgments We acknowledge Christiane Rosch and Henk Schols from Wageningen

University for the sugar and protein analysis. Wendy Borst from TNO for

technical support with TIM-2, Tom Gorissen and Hans Kooijman from TNO for

helping with SCFA analysis. Marcus de Goffau from University of Groningen for

the bacterial species analysis. The Brazilian company (Alimentos Grazimara

Ltda.) for sending samples of cassava bagasse, and volunteers that donated

faeces and made this study possible.

Financial support Carlota Bussolo de Souza received a scholarship from CNPq (The National

Council for Scientific and Technological Development) – Brazil – under the

Program “Science without Borders” (246027/2012-6). TNO financed the

experiments and analyses.

Conflict of Interest The authors declare that there is no conflict of interest.

Part of the results was presented at the European Network for Gastrointestinal

Health Research (ENGIRH) 2013, 18th -20th August – Valencia, Spain, at the 15th

Chapter 3_________________________________________________________________________

80

Gut Day Symposium (2013), 7th November – Groningen, the Netherlands and at

the 13th European Training Course on Carbohydrates (2014), 13th -17th April –

Wageningen, the Netherlands.

____________________________ Lean vs obese: prebiotic effects of cassava bagasse

81

References 1. Elli M, Colombo O, Tagliabue A. A common core microbiota between

obese individuals and their lean relatives? Evaluation of the predisposition to obesity on the basis of the fecal microflora profile. Med Hypotheses. 2010;75(4):350–2.

2. WHO. Obesity and Overweight - Fact sheet n. 311. 2017. 3. Fleissner CK, Huebel N, Abd El-Bary MM, Loh G, Klaus S, Blaut M.

Absence of intestinal microbiota does not protect mice from diet-induced obesity. Br J Nutr. 2010;104(6):919–29.

4. Backhed F, Ding H, Wang T, Hooper L V, Koh GY, Nagy A, et al. The gut microbiota as an environmental factor that regulates fat storage. Proc Natl Acad Sci U S A. United States; 2004 Nov;101(44):15718–23.

5. Venema K. Role of gut microbiota in the control of energy and carbohydrate metabolism. Curr Opin Clin Nutr Metab Care. 2010;13(4):432–8.

6. Blaut M, Klaus S. Intestinal microbiota and obesity. Handbood Exp Pharmacol. 2012;209:251–73.

7. Cani PD, Delzenne NM, Amar J, Burcelin R. Role of gut microflora in the development of obesity and insulin resistance following high-fat diet feeding. Pathol Biol (Paris). France; 2008 Jul;56(5):305–9.

8. Hamer HM, Jonkers D, Venema K, Vanhoutvin S, Troost FJ, Brummer R-J. Review article: the role of butyrate on colonic function. Aliment Pharmacol Ther. England; 2008 Jan;27(2):104–19.

9. Voortman T, Hendriks HFJ, Witkamp RF, Wortelboer HM. Effects of long- and short-chain fatty acids on the release of gastrointestinal hormones using an ex vivo porcine intestinal tissue model. J Agric Food Chem. 2012;60(36):9035–42.

10. Delzenne NM, Neyrinck AM, Cani PD. Gut microbiota and metabolic disorders: How prebiotic can work? Br J Nutr. 2013;109(2).

11. Cani PD, Amar J, Iglesias MA, Poggi M, Knauf C, Bastelica D, et al. Metabolic endotoxemia initiates obesity and insulin resistance. Diabetes. United States; 2007 Jul;56(7):1761–72.

12. Stephen AM, Champ MM-J, Cloran SJ, Fleith M, van Lieshout L, Mejborn H, et al. Dietary fibre in Europe: current state of knowledge on definitions, sources, recommendations, intakes and relationships to health. Nutr Res Rev. Cambridge University Press; 2017 Jul 5;1–42.

13. Gibson GR, Roberfroid MB. Dietary modulation of the human colonic microbiota: introducing the concept of prebiotics. J Nutr. 1995;125(6):1401–12.

14. Cardoso EMR, Hühn S, Junior J de DN. Processo industrial para beneficiamento da macaxeira. Novos Cad NAEA. Pará; 1999;2(2):177–84.

15. Rodrigues JPM, Caliari M, Asquieri ER. Caracterização e análise sensorial de biscoitos de polvilho elaborados com diferentes níveis de farelo de mandioca. Ciência Rural. 2011;41(12):2196–202.

16. Leonel M, Cereda MP, Roau X. Aproveitamento do resíduo da produção

Chapter 3_________________________________________________________________________

82

de etanol a partir de farelo de mandioca, como fonte de fibras dietéticas. Ciência e Tecnol Aliment. 1999;19(2):241–5.

17. Ferreira GDG, Oliveira RL, Cardoso E da C, Magalhães ALR, Brito EL. Valor nutritivo de co-produtos da mandioca. Rev Bras Saúde e Produção Anim. 2007;8(4):364–74.

18. Costa LA da, Bramorski A, Silva MC, Teixeira E, Amboni R. Desenvolvimento de alimento em barra a base de resíduo da fabricação de farinha de mandioca. Aliment e Nutr. 2005 Mar 1;16(4):389–96.

19. Osundahunsi OF, Williams AO, Oluwalana IB. Prebiotic effects of cassava fibre as an ingredient in cracker-like products. Food Funct. 2012;3(2):159–63.

20. Mallillin AC, Trinidad TP, Raterta R, Dagbay K, Loyola AS. Dietary fibre and fermentability characteristics of root crops and legumes. Br J Nutr. 2008;100(3):485–8.

21. Venema K, Nuenen M van, Smeets-Peeters M, Minekus M, Havenaar R. TNO’s in vitro large intestinal model: an excellent screening tool for functional food and pharmaceutical research. Ernährung Nutr. 2000;24(12):559–64.

22. Minekus M, Smeets-Peeters M, Bernalier A, Marol-Bonnin S, Havenaar R, Marteau P, et al. A computer-controlled system to simulate conditions of the large intestine with peristaltic mixing, water absorption and absorption of fermentation products. Appl Microbiol Biotechnol. 1999;53(1):108–14.

23. Kovatcheva-Datchary P, Egert M, Maathuis A, Rajilic-Stojanovic M, de Graaf AA, Smidt H, et al. Linking phylogenetic identities of bacteria to starch fermentation in an in vitro model of the large intestine by RNA-based stable isotope probing. Environ Microbiol.2009;11(4):914–26.

24. Maathuis A, Hoffman A, Evans A, Sanders L, Venema K. The effect of the undigested fraction of maize products on the activity and composition of the microbiota determined in a dynamic in vitro model of the human proximal large intestine. J Am Coll Nutr. 2009;28(6):657–66.

25. Reimer RA, Maathuis AJ, Venema K, Lyon MR, Gahler RJ, Wood S. Effect of the novel polysaccharide PolyGlycopleX(R) on short-chain fatty acid production in a computer-controlled in vitro model of the human large intestine. Nutrients. 2014;6(3):1115–27.

26. Gibson GR, Cummings JH, Macfarlane GT. Use of a three-stage continuous culture system to study the effect of mucin on dissimilatory sulfate reduction and methanogenesis by mixed populations of human gut bacteria. Appl Environ Microbiol. 1988;54(11):2750–5.

27. Pandey A, Soccol CR, Nigam P, Soccol VT, Vandenberghe LPS, Mohan R. Biotechnological potential of agro-industrial residues. II: cassava bagasse. Bioresour Technol. 2000;74(1):81–7.

28. Pustjens AM, De Vries S, Gerrits WJ, Kabel MA, Schols HA, Gruppen H. Residual carbohydrates from in vitro digested processed rapeseed (Brassica napus) meal. J Agric Food Chem. 2012;60(34):8257–63.

____________________________ Lean vs obese: prebiotic effects of cassava bagasse

83

29. Schloss PD, Westcott SL, Ryabin T, Hall JR, Hartmann M, Hollister EB, et al. Introducing mothur: open-source, platform-independent, community-supported software for describing and comparing microbial communities. Appl Environ Microbiol. 2009;75(23):7537–41.

30. Huse SM, Welch DM, Morrison HG, Sogin ML. Ironing out the wrinkles in the rare biosphere through improved OTU clustering. Environ Microbiol. 2010;12(7):1889–98.

31. Edgar RC, Haas BJ, Clemente JC, Quince C, Knight R. UCHIME improves sensitivity and speed of chimera detection. Bioinformatics. 2011;27(16):2194–200.

32. de Goffau MC, Luopajarvi K, Knip M, Ilonen J, Ruohtula T, Harkonen T, et al. Fecal microbiota composition differs between children with beta-cell autoimmunity and those without. Diabetes. 2013;62(4):1238–44.

33. van der Kamp JW, Jones J, McCleary B, Topping D. Dietary fibre: New frontiers for food and health. Wageningen Academic Publishers; 2010. 592 p.

34. Gozho GN, Krause DO, Plaizier JC. Rumen lipopolysaccharide and inflammation during grain adaptation and subacute ruminal acidosis in steers. J Dairy Sci. 2006;89(11):4404–13.

35. Topping DL, Clifton PM. Short-chain fatty acids and human colonic function: roles of resistant starch and nonstarch polysaccharides. Physiol Rev.2001;81(3):1031–64.

36. Ley RE, Backhed F, Turnbaugh P, Lozupone CA, Knight RD, Gordon JI. Obesity alters gut microbial ecology. Proc Natl Acad Sci U S A. 2005;102(31):11070–5.

37. Martens EC, Lowe EC, Chiang H, Pudlo NA, Wu M, McNulty NP, et al. Recognition and degradation of plant cell wall polysaccharides by two human gut symbionts. PLoS Biol. 2011;9(12):e1001221.

38. Darzi J, Frost GS, Robertson MD. Do SCFA have a role in appetite regulation? Proc Nutr Soc. 2011;70(1):119–28.

39. Schwiertz A, Taras D, Schafer K, Beijer S, Bos NA, Donus C, et al. Microbiota and SCFA in lean and overweight healthy subjects. Obes (Silver Spring). 2010;18(1):190–5.

40. Rycroft CE, Jones MR, Gibson GR, Rastall RA. A comparative in vitro evaluation of the fermentation properties of prebiotic oligosaccharides. J Appl Microbioly. 2001;91(5):878–87.

41. Kovatcheva-Datchary P, Egert M, Maathuis A, Graaf AA de, Smidt H, Vos WM de, et al. Analyzing the functionality of the human intestinal microbiota by stable isotope probing . Vol. PhD thesis, The Netherlands: University of Wageningen. [Wageningen]; 2010.

42. Delzenne NM, Cani PD. Interaction between obesity and the gut microbiota: relevance in nutrition. Annu Rev Nutr. 2011;31:15–31.

43. Yadav H, Lee JH, Lloyd J, Walter P, Rane SG. Beneficial metabolic effects of a probiotic via butyrate-induced GLP-1 hormone secretion. J Biol Chem. 2013;288(35):25088–97.

Chapter 3_________________________________________________________________________

84

44. Parnell JA, Reimer RA. Prebiotic fibres dose-dependently increase satiety hormones and alter Bacteroidetes and Firmicutes in lean and obese JCR:LA-cp rats. Br J Nutr. 2012;107(4):601–13.

45. Gao Z, Yin J, Zhang J, Ward RE, Martin RJ, Lefevre M, et al. Butyrate improves insulin sensitivity and increases energy expenditure in mice. Diabetes. 2009;58(7):1509–17.

____________________________ Lean vs obese: prebiotic effects of cassava bagasse

85

Supplementary material

Supplemental Figure 1: TNO’s in vitro model of the proximal large intestine (TIM-2).

a: mixing units; b: pH electrode; c: alkali circuit; d: dialysis circuit (d1: dialysis liquid in;

d2: spent dialysis liquid); e: level sensor; f: nitrogen gas inlet; g: food syringe, h:

temperature sensor. The total volume of the system is circa 120 mL (22).

Chapter 3_________________________________________________________________________

86

Supplemental Figure 2: (A) Weighted UniFrac tree of 16S rRNA pyrosequences

spanning the V5-V7 hypervariable regions derived from the different TIM-2 samples

(obese (O) & lean (L), cassava [red], inulin [blue] and standard [black], time zero (t0)

and time 72h (t72h). No1-No3: replicate samples. Scale bars indicate distance between

the samples in UniFrac units. (B) The relative abundance of bacterial phyla observed in

these data sets is represented in a heatmap.

Supplemental Figure 3: Kinetics of average production of SCFA and lactate.

Cumulative average production (± range) of SCFA and lactate (mmol) over time during

the 3-day experimental period upon feeding cassava at 7.5g/day in lean (A) and obese

microbiotas (B).

____________________________ Lean vs obese: prebiotic effects of cassava bagasse

87

>100

>10-100

>2-10

<2-10

<10-100

* Lactobacillus is shown here to emphasize that it did not change with

any treatment

Supplemental Figure 4: Heatmap. Changes in microbiota composition in

the lean and obese samples over the 72 hour period. Data are expressed

as fold increased (green) or decrease (red) compared to standard.

Intensity of the colour signifies degree of increase or decrease.

Genera Cassava lean Inulin lean Cassava obese Inulin obese

Bifidobacterium

Parabacteroides

Prevotella

Bacteroides

Enterococcus

Lactobacillus

Clostridium sensu stricto

Anaerostipes

Blautia

Clostridium XlVa

Coprococcus

Dorea

Lachnospiracea incertae sedis

Roseburia

Clostridium XI

Acetivibrio

Clostridium IV

Faecalibacterium

Subdoligranulum

Dialister

Catenibacterium

Erysipelotrichaceae incertae sedis

Chapter 3_________________________________________________________________________

88

Chapter 4 Lean and obese microbiota: differences in in vitro fermentation of by-products from

Brazilian food industry

Bussolo de Souza, C., Saad, S., Venema, K.

Chapter 4_________________________________________________________________________

90

Abstract Currently the consumption of dietary fibres is lower than recommended,

leading to health problems, like obesity. Gut microbiota is being suggested as

factor that contributes to obesity and it can be modulated through diet,

especially dietary fibres. Its modulation in favour of the host might be a way to

revert the scenario of obesity. Food by-products contain many important

nutrients, including fibres. These by-products are mostly underused and their

inappropriate disposal in the environment contributes to pollution. The aim of

the present study was to investigate the potential prebiotic effects of food by-

products (cassava bagasse, orange bagasse and passion fruit peel) using an in

vitro model that simulates the proximal colon, and to assess possible

differences in fermentation when using a microbiota from lean or obese people.

Fermentation of the by-products was compared to a standard medium

(control) and the prebiotic inulin. The results revealed that the effects of the by-

products on the dynamics of the gut microbiota differed according to the type

of microbiota – lean or obese, as well as the type of by-product used. Principal

Coordinate Analysis (PCoA) of the microbiota showed evidence of a clear

separate clustering of lean and obese microbiotas before the addition of test

compounds, which disappeared at t72 h, and instead, distinct clusters due to

primary composition of the substrates (starch, fructan and pectin) were

present. This is evidence that the test compounds drove the obese microbiota

to a healthier profile, more similar to that of the lean microbiota. Cassava

bagasses enriched the beneficial genus Bifidobacterium. The production of total

SCFA by cassava bagasses by the obese microbiota was higher than control and

inulin (e.g. cassava bagasse 2 (CB2) generated 150.9 mmol, while this was 100

mmol and 108.9 mmol, for control and inulin respectively). Orange bagasses

stimulated the growth of the genera Collinsella and Catenibacterium. Passion

fruit peels were poorly fermented, generating smaller amounts of SCFA (e.g.

passion fruit 2 (PFP2) resulted in the production of on average 77.8 mmol,

either in lean or obese microbiotas) than control (139.8 mmol in the lean and

100 mmol in the obese microbiotas) and inulin (137.2 mmol in the lean and

108.9 mmol in the obese microbiotas). They also generated more BCFA (e.g.

PFP1 resulted in the production of 5.2 mmol, while on inulin 0.2 mmol was

produced in the lean microbiota). Passion fruit peels fermentation resulted in a

microbiota with the highest diversity and evenness, a positive trait regarding

host health. In conclusion, the use of food by-products could be an important

step to tackle obesity and decrease the waste of valuable food material and

consequently environmental pollution. They are inexpensive and a non-

invasive way to be used as a dietary intervention to improve health.

_________________________________ Food by-products fermentation: lean vs obese

91

Introduction The problem of overweight and obesity (body mass index (BMI) 25-29.9 kg/m2

and ≥ 30kg/m2, respectively) is reaching an incredible dimension worldwide,

affecting half a billion adults (1). A BMI above the normal range increases the

risk for several diseases, such as cardiovascular disease and different types of

cancer (1). The gut microbiota is emerging as a possible tool to be used in this

battle against obesity. Since it was discovered as an environmental factor that

contributes to obesity about two decades ago (2), the gut microbiota is being

subject of several investigations that try to reveal this complex mechanism

between host, gut microbiota and obesity (3–5). In this context, host diet has a

direct influence on microbiota composition (6), and is considered an important

way to modulate the gut microbiota. Indigestible products that reach the colon

are the main substrate for the gut microbiota, and among them, dietary fibres

constitute an important source of energy for these microorganisms (7).

Nowadays, however, the food industry is producing more and more ultra-

processed foods by which several components from the raw material are

removed and discarded, generating by-products (such as fruit and vegetable

peels). These by-products are mostly underused and their inappropriate

disposal in the environment contributes to pollution (8). Additionally, food

industry loses part of the raw material that might have important nutritional

value, such as fibre (9). At the same time, the consumption of ultra-processed

foods that lack important nutrients, like fibres, but instead are filled with high

energy ingredients (simple sugars/fats), is contributing to the increased

incidence of diseases related with bad eating habits, especially obesity (10,11).

Fortunately, this problem is raising a debate about the use of by-products, as

for instance fibre source, and the issue is gaining more importance and

attention (8). A proper utilization of these by-products, such as to incorporate

them back into food products, for example as functional foods, could represent

one step to decrease their wastage and increase fiber intake. This

interconnected scenario of lack of fibre consumption, modulation of the gut

microbiota through ingestion of fibres and the use of fibre-rich by-products

from the food industry seems durable with regards to a favourable human

health and environmentally friendly reuse of wasted food. However, before

incorporating these by-products into food, it is necessary to characterized them

and to study their possible health effects. We have previously characterized the

by-products used here from the Brazilian food industry – cassava bagasse,

orange bagasse and passion fruit peel – regarding their chemical composition

and digestibility (12). Interestingly, results showed differences in composition

Chapter 4_________________________________________________________________________

92

of the same by-product from different suppliers, which can have an influence

on the health effects when consuming these fibres.

The aim of the present study was to investigate the potential prebiotic effects of

these food by-products using an in vitro model that closely simulates the

proximal colon (TNO intestinal model (TIM-2)) and assess possible differences

in fermentation when using a microbiota from lean or obese people.

Material and methods

Test compounds

In total, 8 test compounds (plus 2 controls) were tested for the fermentation

experiments. Three different cassava bagasses were tested, CB1and CB2 were

from the same supplier but different batches (Grazimara, Biguaçu, Brazil), CB3

was from Lorenz (Indaial, Brazil). Two samples of orange bagasses were tested,

both in the form of powder – OB1 from Chá&Cia (Jacareí, Brazil), OB2 from a

store with bulk sale in the city centre of Florianópolis. Three passion fruit peels

were tested, all in the form of powder – PFP1 from Chá&Cia, PFP2 from

Phytomare (Governador Celso Ramos, Brazil) and PFP3 from the same store as

OB2 (Florianópolis). According to the manufacturers, only the peels were used,

seeds were disposed. Inulin from chicory root was provided by its

manufacturer (Orafti, Amsterdam, the Netherlands) and it was used as positive

control (purity ≥ 90%, degree of polymerization >10). Simulated ileal effluent

medium (SIEM) was used as control and is described in the following section.

More detailed information about the test compounds was described elsewhere

(12), but is summarized in Table 1.

_________________________________ Food by-products fermentation: lean vs obese

93

Tab

le 1

: Ch

emic

al c

om

po

siti

on

of

cass

av

a b

agas

ses,

ora

nge

bag

asse

s an

d p

assi

on

fru

it p

eels

Rh

a: r

ham

no

se, F

uc:

fu

cose

, Ara

: ara

bin

ose

, Xy

l: x

ylo

se, M

an: m

ann

ose

, Gal

: gal

acto

se, G

lc: g

luco

se, U

A: u

ron

ic a

cid

s; N

E: n

ot

esti

mat

ed; P

ecti

n: s

um

of

UA

, Rh

a,

Ara

an

d G

al; D

M: d

egre

e o

f m

eth

yla

tio

n (

mo

les

of

met

han

ol p

er 1

00

mo

les

of

gala

ctu

ron

ic a

cid

res

idu

es);

DA

: deg

ree

of

acet

yla

tio

n (

mo

les

of

acet

ic a

cid

per

10

0

mo

les

of

gala

ctu

ron

ic a

cid

res

idu

es).

*

Smal

l su

gars

: glu

cose

(as

fre

e m

on

om

ers)

, fru

cto

se a

nd

su

cro

se.

Chapter 4_________________________________________________________________________

94

In vitro fermentation

Dynamic in vitro model of the colon (TIM-2)

TIM-2 is a validated, dynamic in vitro model that closely mimics the proximal

colon, extensively described by Minekus et al. (13) (Figure 1). Briefly, this

computer-controlled system simulates several features from the human large

intestine, such as temperature (kept at 37 °C), pH (kept at 5.8 - constantly

checked using a pH sensor and corrected with secretion of sodium hydroxide

(NaOH)), anaerobic environment (by constant flushing with gaseous nitrogen).

Figure 1: Schematic representation of the TIM-2 system. A) peristaltic compartments with a dialysis membrane inside, B) pH sensor, C) NaOH secretion, D) dialysate system (D1=dialysate in, D2=dialysate out), E) level sensor, F), gaseous N2 inlet, G) gas outlet, H) sampling port, I) feeding syringe with test compound, J) temperature sensor. Adapted from (14).

Water and fermentation products are removed through a dialysis system. This

prevents accumulation of microbial metabolites which would otherwise lead to

inhibition or even death of the microbiota. Mixing and transport of intestinal

contents is achieved through the simulation of peristaltic movements. It was

previously demonstrated that TIM-2 allows for the growth of a highly active

and dense microbiota, comparable to that found in the human proximal colon

(15).

Origin of the microbiotas

The microbiotas used for the TIM-2 experiments consisted of active pooled

faecal material from i) 8 healthy lean volunteers (body mass index (BMI)=20 ±

1.48 kg/m2, male: n=4, female: n=4, age range 25-42 years) and referred to as

_________________________________ Food by-products fermentation: lean vs obese

95

“lean microbiota”, or ii) 7 obese but otherwise healthy volunteers (BMI=32

±1.17 kg/m2, male: n=3, female: n=4, age range 29-68 years) denoted as “obese

microbiota”. Lean volunteers were recruited from TNO (Zeist, the Netherlands)

and obese volunteers from Maastricht University Medical Centre (Maastricht,

the Netherlands). Volunteers received oral and written explanation about the

study and how to proceed with faeces collection. Prior to their participation,

each person provided an informed consent. The exclusion criteria for both

groups included the use of antibiotics, probiotics, prebiotics and laxatives in the

3 months preceding donation. Faecal samples were self-collected: volunteers

were instructed to defecate in a bag and immediately place it into a gastight

plastic jar containing anaerobic packs (AnaeroGenTM, Oxoid, Cambridge, UK). An

aliquot of each individual donation was collected as previously described (16)

and used for analyses of microbiota composition and metabolites (SCFA and

BCFA). Faeces were mixed in an anaerobic cabinet as described by Aguirre et al.

(17). The faecal material was subsequently aliquoted, snap-frozen in liquid

nitrogen and stored at -80 °C. It was previously shown that the standardization

of the microbiota (pooling) does result in a representative microbiota in terms

of composition and activity (18), and is similar to fresh faecal sample (19).

Simulated ileal effluent medium (SIEM) and dialysate

SIEM was used as standard feeding and simulates the material reaching the

colon. It is basically composed of indigestible carbohydrates (pectin, xylan,

arabinogalactan, amylopectin and starch), protein, vitamins, Tween 80 and bile

(17). The pH was adjusted to 5.8 to simulate the pH from the proximal colon.

Dialysate contained (per litre): 2.5 g K2HPO4.3H2O, 4.5 g NaCl, 0.005 g

FeSO4.7H2O, 0.5 g MgSO4.7H2O, 0.45 g CaCl2.2H2O, 0.05 g bile and 0.4 g

cysteine∙HCl, plus 1 mL of the vitamin mixture; pH 5.8 (17). All medium

components were acquired at Tritium Microbiology (Eindhoven, the

Netherlands).

Experimental protocol and study design

Before the addition of the standardized microbiota to the system, TIM-2 was

flushed with gaseous nitrogen for 3 hours to create a complete anaerobic

environment. Afterwards, the system was inoculated with approximately 30 mL

of the standardized microbiota and 90 mL of dialysate (described above). The

microbiota was fed with SIEM (2.5mL/hour) and adapted to the system for 16

hours. After the adaptation period, the feeding system was stopped and a 2

hours starvation period allowed the microbiota to ferment all remaining

carbohydrates present in the model. Subsequently, samples were collected at

Chapter 4_________________________________________________________________________

96

time zero (t0 h) after which the test compounds were added. From this point

onwards, a 3-day experimental period started, and the microbiota received the

standard feeding (SIEM, referred to from now on as control), or this medium

but without the carbohydrate source, which was substituted with the test

compounds - inulin, cassava bagasse, orange bagasse or passion fruit peel. SIEM

contained 7.5 g/day of carbohydrates and the same amount of test compounds

was added. Samples of lumen and spent dialysate (dialysate out) were taken at

time 0 hour (t0 h), time 24 hours (t24 h), time 48 hours (t48 h) and time 72

hours (t72 h). Four TIM-2 units were run in parallel. The experimental set up

can be viewed in Figure 2.

Figure 2: Study design with timeline for TIM-2 experiments.

Analyses

SCFA, BCFA and organic acids quantification in lumen and dialysate out

samples

Lumen and dialysate out samples from TIM-2 were analysed by Brightlabs

(Venlo, the Netherlands) to quantify SCFA (acetate, propionate and butyrate),

BCFA (iso-butyrate and iso-valerate), as well as organic acids (valerate,

caproate, lactate, succinate and formate). Samples were centrifuged at 14.000

rpm for 10 minutes, and the clear supernatant was filtered through a 0.45 µm

PFTE filter and diluted with mobile phase (lumen 1:5 and dialysate out 1:2). Ion

exclusion chromatography (IEC) was applied in a 883 Ion Chromatograph (IC;

Metrohm, Switzerland), using a Transgenomic IC Sep ICE-ION-300 column (30

cm length, 7.8 mm diameter and 7 µm particles) and a MetroSep RP2 Guard.

The mobile phase consisted of 1.5 mM aqueous sulphuric acid. A column flow of

0.4 ml/min was used. The temperature of the column was 65 °C. The organic

acids were detected using suppressed conductivity detection. Ten microliters

were loaded on the column by an autosampler 730 (Metrohm). Molecules were

_________________________________ Food by-products fermentation: lean vs obese

97

eluted according to their pKa. To show cumulative production upon addition of

substrates, the amount of metabolites was artificially put to zero at t0 h.

Energy extraction

Energy extraction in the form of SCFA was calculated using the following values

for acetate, propionate, butyrate and lactate, respectively: 209, 367, 524 and

326 kcal/mol.

Microbiota composition

Genomic DNA isolation from TIM-2 samples (lumen, t0 h and t72 h) was

performed using standard molecular biology kits from ZYMO (ZYMO Research,

CO., CA, USA) by Baseclear (Leiden, the Netherlands). PCR amplification of the

16S rRNA gene (V3-V4 region), barcoding and library preparation were also

performed by Baseclear. Short paired-end sequence reads were generated

using the Illumina MiSeq system and converted into FASTQ files using the

BCL2FASTQ pipeline version 1.8.3. Quality trimming was applied based on

Phred quality scores.

Statistics

Experiments were performed in duplicate (n=2) per test compound and per

microbiota (lean or obese), except for control (n=3 with lean microbiota and

n=4 with obese microbiota) and inulin (n=3).

Microbial analyses were performed with Quantitative Insight Into Microbial

Ecology (QIIME) software package (version 1.9.0) (20). The sequences were

classified using Greengenes (version 13.8) as a reference 16S rRNA gene

database. R (version 3.1.3) was used in RStudio for statistical analyses (21).

Differences in multiple categories were tested with Kruskal-Wallis, with p-

values p<0.05 set to be significantly different. Dunn post hoc test was utilized to

find differences between groups. Spearman correlation was calculated between

the relative abundance of OTUs and continuous variables. Multiple comparisons

were corrected using the false discovery rate (FDR), and q-values (adjusted p-

values) were considered significantly different at <0.05. Changes in microbial

composition were assessed through the difference of their initial relative

abundance and final abundance (t72 h – t0 h), and compared to control. Linear

discriminant analysis effect size (LEfSe) (22) was used to find biomarkers

between groups using relative abundances from the OTU tables generated in

QIIME.

Chapter 4_________________________________________________________________________

98

Results and discussion

Characteristics of test compounds

The chemical compositions of the eight test compounds used in TIM-2

fermentations are shown in Table 1, but they have been reported previously in

detail elsewhere (12).

Briefly, regarding cassava bagasses, the two samples from the same origin but

different batches were similar between each other (CB1 and CB2) but different

from the third test compound that was supplied by another company (CB3).

The differences are many, including the percentage of each monosaccharide,

the total percentage of starch, in which CB3 presented a lower amount than

CB1 and CB2 (77.4% in CB1, 70.5% in CB2 and 45% in CB3), as well as the

amount of pectin and non-starch polysaccharides (NSP), present in higher

amount in CB3 (Table 1). Degree of methylation (DM) and acetylation (DA)

were also higher for CB3. The orange bagasses tested were similar in their

chemical composition (Table 1), even though they were supplied by different

companies. Small variations were found regarding the amount of pectin present

(26.2% in OB1 and 21.1% in OB2), small sugars (22.8% in OB1 and 33.4% in

OB2), protein and DM. Two passion fruit peels were similar between each other

(PFP1 and PFP2) but differed from the third sample (PFP3). The main

differences were related to the amount of glucose and starch (higher for PFP3),

pectin, NSP and DM (lower for PFP3) (Table 1).

Effects of by-products on bacterial metabolic activity

Studies are suggesting that many of the effects of the gut microbiota on host

metabolic processes, especially on energy homeostasis, can be attributed to

bacterial fermentation end-products – SCFA, BCFA and organic acids (23). The

Bacteroidetes phylum contains species that produce mainly acetate and

propionate, while species that belong to Firmicutes are responsible for the

production of mostly butyrate.

Total SCFA

The amount of SCFA produced by the lean and obese microbiota was dependent

on the by-product tested, and demonstrated that not always the obese

microbiota generated more SCFA than the lean microbiota (Figure 3 and

Supplemental Figure 1). The same was the case for energy extraction in the

form of SCFA that was also dependent of the test compound, and not always

related to the type of microbiota used for fermentation, as expected

(Supplemental Figure 2). For 5 out of 10 substrates the obese microbiota was

_________________________________ Food by-products fermentation: lean vs obese

99

able to produce more total SCFA than the lean, although when comparing the

total amount of SCFA produced by the lean and obese microbiotas (from all test

compounds), the differences were not significant (p>0.05). Similar results are

described in the literature. In vitro fermentation of diverse types of fibres

showed that production of SCFA and consequently energy extraction was

dependent of the test compound used, not the type of inoculum (lean or obese)

(24), which is in accordance with our results.

Figure 3: Cumulative production of SCFA (acetate, propionate and butyrate) by the lean (A) and obese (B) microbiotas at t72 h with different test compounds.

The role of SCFA in obesity – either protective or causative, remains to be

elucidated. However, it is worth noting that when detrimental aspects are

related to SCFA, this is generally present when there is a dysbiosis - related to a

certain disease or inappropriate life style. In turn, these aspects affect normal

microbiota functioning – compositionally and metabolically speaking (25).

Under “normal” conditions (health state), it has to be acknowledged that SCFA

are essential in maintaining the equilibrium in host health through regulation

and participation in several metabolic pathways.

Chapter 4_________________________________________________________________________

100

Production of total SCFA by fermentation of cassava bagasses yielded

comparable amounts than control and inulin, demonstrating that the

microbiota was able to use this substrate as energy source. Although CB3 had a

distinct chemical composition compared to CB1 and CB2, in the lean microbiota

the fermentation profiles were similar. In the obese microbiota, nonetheless,

CB3 fermentation generated lower amounts of butyrate than CB1 and CB2.

Fermentation of orange bagasses by the obese microbiota produced more total

SCFA than control and inulin, showing the potential of this by-product to be

used as substrate by the gut microbiota. In the lean microbiota, fermentation of

OB2 was very effective in producing butyrate, as well as acetate.

PFP1 and PFP2 were the substrates that compared to control and inulin, had

the poorest fermentation, yielding smaller amounts of SCFA. PFP3, which

contained higher amounts of starch, yielded comparable amounts of total SCFA

than control and inulin.

Acetate

Apart from the two controls, SIEM and inulin, fermentation of OB1 in the lean

microbiota had the highest cumulative production of acetate (84.3 mmol)

(Figure 3 and Supplemental Figure 1). A similar cumulative production of

acetate was found upon CB1 and CB2 fermentation in the obese microbiota

(83.4 mmol and 81.2 mmol, respectively). From t0 h to t24 h, either in lean or

obese microbiota, all test compounds increased the proportion of acetate

(Supplemental Figure 3). After t24 h, however, an inverse effect occurred, and

the proportion of acetate decreased over time. On average, cumulative

production of acetate by the lean and obese microbiotas was similar. The role of

acetate in obesity is not completely understood, and studies in mice and

humans are inconsistent. Acetate is absorbed by intestinal cells and it is mainly

found in peripheral circulation, thus capable of reaching a plethora of tissues

(26). An investigation performed with obese individuals who consumed

vinegar for 12 weeks resulted in lower body weight, BMI and visceral fat than

the control group (27). Similar results were found in a recent study with mice

where the goal was to evaluate the effects of synthetic acetic acid vinegar and

Nipa vinegar on high-fat diet-induced obese mice (28). Results showed that

both vinegars were effective in reducing food intake and body weight (28).

Another study that demonstrates the positive effect of acetate related to obesity

was performed with overweight and obese men which received infusions of

acetate in the distal and proximal colon (29). It was found that distal infusions

of acetate, but not proximal, increased fasting fat oxidation and fasting peptide

YY (PYY), when compared to the placebo group (29). In a study by Perry et al

_________________________________ Food by-products fermentation: lean vs obese

101

(30), nevertheless, increased acetate production by an altered microbiota was

found to rise ghrelin secretion, causing hyperphagia and obesity in rats fed with

high fat diet.

Propionate

In the lean microbiota, CB3 and OB1 were the substrates that had the highest

cumulative production of propionate (18.1 mmol and 17.7 mmol, respectively)

(Figure 3 and Supplemental Figure 1). Apart from control and inulin the

fermentation of which caused an increase in the proportion of propionate over

time, all other test compounds had a stable proportion of propionate after t24 h

(Supplemental Figure 3). In the obese microbiota CB3 and OB1 were also

responsible for a higher cumulative production of propionate (24.8 mmol).

PFP3, however, showed an even higher amount of propionate – 27.5 mmol

(Figure 3 and Supplemental Figure 3). Looking at the ratio of each SCFA,

although the proportion of propionate was higher in the obese microbiota

compared to the lean microbiota, it remained constant over time (Supplemental

Figure 3). Propionate is produced by colonic microbiota fermentation of poly-

and oligosaccharides, long chain fatty acids, protein, peptides and glycoprotein

(31,32). It is metabolized in the liver, used as substrate for gluconeogenesis,

and therefore converted into glucose (26). Increased gluconeogenesis via

propionate was suggested to decrease food intake. It was proposed that

increased hepatic production and storage of glucose would be sensed by the

central nervous system (CNS), which in turn would regulate eating behaviour

(26). A study with mice revealed that propionate was already converted to

glucose in the intestine, through intestinal gluconeogenesis (IGN), decreasing

body weight and adiposity (33). The mechanism proposed is that IGN promoted

the release of glucose in the portal vein, resulting in decreased hepatic glucose

production and increased satiety and energy expenditure via the CNS (23,33).

Another mechanism by which propionate was found to improve satiety is via

the activation of free fatty acid receptors (FFAR). Propionate was found to be a

ligand of FFAR3 and FFAR2 (34). FFAR triggers the release of the satiety

hormones glucagon-like peptide-1 (GLP-1) and PYY by L-cells (34). PYY inhibits

gastric emptying and food intake, whereas GLP-1 stimulates insulin secretion

(35,36). Increasing transit time of ingested food through the gastrointestinal

tract prolongs the stimulation of mechanic/chemical receptors responsible for

signalling satiety after food intake (26).

Chapter 4_________________________________________________________________________

102

Butyrate

Fermentation of OB2 by the lean microbiota produced the highest cumulative

amount of butyrate (44.9 mmol), slightly higher amounts than our positive

control - inulin (43.4 mmol) (Figure 3 and Supplemental Figure 1). CB1,

however, presented the highest proportion of butyrate at t72 h (38.4%)

(Supplemental Figure 3). An in vitro study with acerola by-product

demonstrated the beneficial effects in bacterial metabolism when adding this

compound in combination with the probiotic Bifidobacterium longum BB-46

(37). During the treatment period, a significant increase in the production of

SCFA, especially butyrate was observed. Acerola by-product was rich in fibre

(~56%), presented high content of phenolic compounds and antioxidant

activity (37). Unfortunately, the type of fibres was not analysed in this research,

making it difficult to compare between studies. A synergetic effect of the

different components (fibres and polyphenols) present in acerola by-product

might be responsible for the positive outcome encountered. This synergetic

effect may also occur with orange bagasses, since analysis also demonstrated

that this by-product is rich in bioactive compounds, such as polyphenols (38).

In the obese microbiota, CB2 was the substrate that generated highest

cumulative amounts of butyrate at t72 h, followed by PFP3 and OB2 (Figure 3

and Supplemental Figure 1). Fermentation of CB2 by the obese microbiota also

had the highest proportion of butyrate at t72 h (36.9%). Citrus pectin has been

found to stimulate the production of butyrate in an in vitro model inoculated

with microbiota from obese individuals (39), which corroborates with the

results from our study. Butyrate is by far the most well studied SCFA, and many

investigations have shown its beneficial aspects either at the intestinal level,

such as anticarcinogenic agent and its role in ion absorption, as well as at the

extraintestinal level, like improving hypercholesterolemia and acting as

ammonia scavenger (40). Butyrate constitutes the main source of energy for

colonocytes, supplying circa 60-70% of the required energy (23), and thus is

rapidly used by the epithelium (41). It has, therefore, a fundamental function in

maintaining colonic mucosal health. With regard to obesity, butyrate has an

important role in keeping the integrity of the intestinal barrier by acting on the

mucosal layer and tight junctions. Studies with cell lines demonstrated that

butyrate was responsible for stimulating the production of mucin MUC2

(42,43). Similar results, nonetheless, could not be replicated in a human study.

A clinical trial with healthy individuals and ulcerative colitis patients showed

that intervention with butyrate did not modulate the expression of MUC2 in

both healthy and ulcerative colitis volunteers (44). More human studies are

necessary to confirm the effects of butyrate in the production of intestinal

_________________________________ Food by-products fermentation: lean vs obese

103

mucin. Other studies with cell lines showed that butyrate enhanced intestinal

barrier by regulating the assembly and stimulating the synthesis of tight

junctions (45,46). The importance of intestinal barrier regarding obesity is

because an enhanced protection against translocation of LPS and pathogens, for

instance, will avoid the activation of pro-inflammatory signalling cascade,

which induce metabolic diseases characterized by low-grade inflammation

(such as in obesity), as well as insulin resistance (described in more detail in

the following section).

Branched-chain fatty acids and organic acids

BCFA production was much lower than SCFA. In the lean microbiota, PFP1

fermentation produced the highest amount of iso-butyrate (1.92 mmol), whilst

in the obese microbiota PFP3 fermentation was responsible for the highest

amount of iso-valerate (3.35 mmol). Overall, passion fruit peels were the

substrates that led to the highest cumulative amounts of BCFA, both in

experiments with the lean and obese microbiotas (Table 2).

Table 2: Cumulative production of BCFA (iso-butyrate and iso-valerate) by the lean and obese microbiotas after 72 h fermentation with the different test compounds.

i-butyrate i-valerate Total

Lean Obese Lean Obese Lean Obese

Control 0.2±0.2 0.5±0.8 0.4±0.1 1.3±1.2 0.6±0.3 1.9±2.0

Inulin 0.1±0.0 0.0±0.0 0.2±0.1 0.0±0.0 0.2±0.1 0.0±0.0

CB1 0.7±0.1 0.7±0.3 2.1±0.2 1.5±0.4 2.7±0.1 2.2±0.7

CB2 0.6±0.2 0.3±0.0 1.3±0.2 0.7±0.0 1.9±0.5 1.0±0.1

CB3 1.7±0.1 0.5±0.4 1.5±0.1 0.8±0.3 3.2±0.0 1.3±0.7

OB1 1.2±0.0 0.2±0.1 2.2±0.3 1.2±0.3 3.4±0.3 1.4±0.5

OB2 0.9±0.1 0.2±0.2 2.1±0.0 0.2±0.0 2.9±0.1 0.4±0.2

PFP1 1.9±0.2 1.8±0.3 3.3±0.3 3.0±0.2 5.2±0.5 4.8±0.5

PFP2 1.4±0.3 0.6±0.1 2.3±0.4 1.6±0.0 3.8±0.7 2.2±0.1

PFP3 1.7±0.1 1.7±0.7 2.9±0.4 3.4±1.0 4.6±0.5 5.1±1.8

The passion fruit peels contained higher amounts of proteins, which may

explain the production of BCFA, as these are the end-products of bacterial

fermentation of proteins and peptides (47). They generated negligible amounts

of lactate and succinate (Table 3), indicating that these by-products were not

fermented at a high speed. Lactate and succinate are intermediate metabolites

and their accumulation is a sign of fast fermentation (48). The effects of passion

fruit peel flour on metabolic parameters, such as insulin sensitivity, body

weight and gut hormones, were tested in rats fed a high fat diet (49). Results

Chapter 4_________________________________________________________________________

104

showed that rats that received supplementation of passion fruit peel flour in

addition to high fat diet presented an increase in glucagon like-peptide 1 (GLP-

1) release, decreased adiposity and improved insulin sensitivity – amongst

others (49). Bacterial community and production of SCFA were not measured

in this study, nevertheless these effects are thought to be mediated by the

release of SCFA from bacterial fermentation of pectin present in passion fruit

peel flour.

Inulin was the substrate that yielded more organics acids, especially lactate and

succinate (Table 3).

Table 3: Cumulative production of organic acids (succinate, lactate, formate and caproate) by the lean and obese microbiotas after 72 h fermentation with the different test compounds.

The role of these organic acids in health and disease is almost not known, but

based on the concentrations observed, they should be studied. Elevated levels

of plasma succinate was found to be associated with obesity and impaired

glucose metabolism in Caucasian Spanish subjects (50). Interestingly, this was

accompanied by the increased abundance of succinate-producing

Prevotellaceae and Veillonellaceae and lower relative abundance of succinate-

consuming Odoribacteraceae and Clostridaceae in obese subjects (50). The

authors suggested that as a consequence of obesity, increased gut permeability

and dysbiosis favoured higher amounts of succinate to reach plasma circulation

in obese individuals.

Changes in microbiota composition

The results found in our study revealed that the effects of the by-products on

the dynamics of the production of gut microbial metabolites differed according

to the type of microbiota – lean or obese, as well as the type of by-product used.

It was suspected that this was also the case for microbiota composition.

_________________________________ Food by-products fermentation: lean vs obese

105

Therefore, the composition of samples at t0 h and t72 h were analysed by

sequencing the V3-V4 region of the 16S rRNA gene.

Principal Coordinate Analysis (PCoA) showed a clear clustering of lean and

obese microbiotas before the addition of test compounds (t0 h), in both

weighted and unweighted UniFrac analyses (Figure 4A and 4B). At t72 h, this

clustering disappeared, and instead, distinct clusters by primary composition of

the substrates (starch, fructan or pectin), and no longer distinction between

lean and obese microbiota, was present (Figure 4C and 4D for weighted and

unweighted UniFrac). This is evidence that the test compounds drove the obese

microbiota to a healthier profile, that is more similar to that of the lean

microbiota. The Shannon index showed that fermentation of PFP3, OB1 and

PFP1 stimulated the growth of more bacterial species (abundance and

evenness) (Supplemental Figure 4).

Figure 4: Principal Coordinate Analysis (PCoA) plots of the microbiota after 72 hours fermentation period in TIM-2. Samples are plotted on the first three Principal Coordinates (PC1, PC2 and PC3). A and B: Weighted and Unweighted (respectively) UniFrac showing 2 different clusters among lean and obese samples at t0h, which disappeared after 72 hours fermentation period. C and D: Weighted and Unweighted (respectively) UniFrac showing that at t72 h, samples were clustered according to their primary substrate (fructan, pectin or starch).

The effects that fermentation of each test compound had on the microbial

composition were assessed also through the difference of their initial relative

Chapter 4_________________________________________________________________________

106

abundance and final abundance (t72 h – t0 h), and compared to their respective

control (lean or obese). This will be discussed below for selected genera for

which effects were observed.

Bifidobacterium

In our study, for the lean microbiota, all tested compounds (except inulin)

caused a decrease of this genus when compared to the control (Figure 5A).

Fig

ure

5:

Hea

tmap

of

per

cen

tage

of

chan

ges

of

bac

teri

al t

axa

at t

72

h, c

om

par

ed t

o c

on

tro

l in

th

e le

an (

A)

and

ob

ese

(B)

mic

rob

iota

s. G

reen

co

lou

rs r

epre

sen

t an

in

crea

se i

n a

bu

nd

ance

, w

her

eas

red

co

lou

rs

rep

rese

nt

a d

ecre

ase

_________________________________ Food by-products fermentation: lean vs obese

107

LEfSe analysis showed that Bifidobacterium is a discriminating feature for

fructan (Figure 6). In the obese microbiota, CB1 and CB2 were the only

substrates (apart from inulin) that were capable of stimulating the growth of

this genus (Figure 5B). Even though Bifidobacterium ferments mostly mono-

and oligosaccharides, some species are capable of degrading complex

carbohydrates like starch (51), producing mainly acetate and lactate (52).

Figure 6: LEfSe with the different test compounds showing which bacterial groups were

significantly different among samples.

Our results, therefore, corroborate the literature, because CB1 and CB2 were

mainly composed of starch and in the obese microbiota, they induced the

production of acetate and lactate.

Spearman correlation analyses indicated a positive association between

bifidobacteria and the presence of glucose (rho=0.68; q-value=0.00021).

Bifidobacterium could also be increased due to cross-feeding with butyrate

producing bacteria that release smaller carbohydrates resulting from their

utilization of complex polysaccharides (53), which may explain the positive

association found between bifidobacteria and butyrate (rho=0.53; q-

value=0.007). Interestingly, in our previous study with cassava bagasse,

although fermentation of cassava bagasse by the obese microbiota produced an

increase in the abundance of Bifidobacterium, a stronger bifidogenic effect was

observed by fermentation of the lean microbiota (54). Despite some differences

between the two studies, still cassava bagasses (CB1 and CB2) were shown

here to exert a beneficial effect on the obese microbiota regarding the

Chapter 4_________________________________________________________________________

108

stimulation of the genus Bifidobacterium. The genus Bifidobacterium is known

by its positive correlation with health status of host and several studies have

shown that the genus Bifidobacterium is decreased in several different disease

states (55,56). Our results suggest that cassava bagasses (CB1 and CB2) could

be used by the obese population with the objective to increase the abundance

of bifidobacteria and consequently, improve health status (not tested here). A

study with 98 subjects (lean, overweight and obese individuals) revealed a

significant lower faecal concentration of the genus Bifidobacterium in the obese

individuals, compared to the other two groups (57). Research performed with

purified pectic oligosaccharides (POS) isolated from orange peels revealed that,

where orange bagasses reduced the abundance of Bifidobacterium or did not

present any influence on Lactobacillus, POS had a positive effect on the growth

of these two genera (58). Treatment of orange peels which resulted in purified

oligosaccharides clearly influenced the final outcome. Although purification of

oligosaccharides represents another way to use food by-products with the goal

to transform it into a functional food, our objective was to test the raw by-

product in order to decrease food wastage and use it without any extra

processing.

Bacteroides

The genus Bacteroides was stimulated upon fermentation of passion fruit peels,

either when the lean or obese microbiota was used. The effects were more

prominent for the obese microbiota (Figure 5B), which at the end of the

experiment led to higher abundances of Bacteroides than in the lean microbiota

(Figure 7). A positive association between Bacteroides and the presence of

xylose (rho=0.79; q-value=7.09*10-06) and the presence of fucose (rho=0.63; q-

value=0.003) was found. Xylose and fucose are sugars present in non-starch

polysaccharides (NSP) such as hemicellulose and pectin. However, there was no

significant association between Bacteroides and pectin. Other studies

demonstrated that Bacteroides was enriched with pectin availability (24,59). It

is worth to highlight, however, that pectins are complex plant hetero-

polysaccharides, with major structural differences between various sources.

Other characteristics of pectins, like composition of neutral sugars and

distribution of homogalacturonan and rhamnogalacturonan fractions might

have an effect on the enrichment of diverse bacterial groups. Another in vitro

study by us showed that Bacteroides in general was enriched with pectin

feeding, but specific species (B. uniformis, B. plebeius and B. ovatus)

demonstrated an inconsistent modulation among all different pectins tested

(Chapter 7). This might be hypothesized to be due to the highly competitive

_________________________________ Food by-products fermentation: lean vs obese

109

environment, or even specific structural preferences by bacterial groups. This

may explain why Bacteroides were only enriched with passion fruit peels and

not orange bagasses, although the latter contained higher amounts of pectin

(Table 1). It appears that other characteristics of pectins are crucial for it to be

utilized by Bacteroides. We also found that Bacteroides was positively

associated with degree of acetylation (DA) (rho=0.71; q-value=0.0003), and

orange bagasses had low DA (Table 1). (26). Corroborating with the literature,

a positive association between Bacteroides and propionate was found (q-

value=0.03; rho=0.51), whereas a negative association with butyrate was

detected (q-value=3.84*10-05; rho=-0.68).

Faecalibacterium

The genus Faecalibacterium only increased in abundance upon PFP2

fermentation in the lean microbiota, with a final abundance of 4%. In the obese

microbiota CB1, OB2, PFP1 and PFP2 fermentation caused a small increase in

Faecalibacterium (~1.5%) and the final abundances were 2.9%, 3%, 3.7% and

3.3 %, respectively (Figure 7B). Its only known species, F. prausnitizii is an anti-

inflammatory commensal bacterium. Many studies showed inverse correlations

between inflammatory bowel disease (IBD) and F. prausnitzii (60,61). Although

the exact protective mechanisms are not completely understood, it is believed

that the anti-inflammatory property of F. prausnitzii is amongst others due to

butyrate production, since this species is one of the most abundant butyrate

producers in the gut (60). Butyrate has been shown to improve gut

permeability through the modulation of expression of tight junction proteins

(23). As previously mentioned, obesity is characterized by low grade

inflammation that might be caused by the translocation of bacterial LPS due to

leaky gut (4).

Catenibacterium

The growth of the genus Catenibacterium was stimulated only when the obese

microbiota was fed with orange bagasses (Figure 5B). This genus produces

mainly acetate and lactate (62). A study comparing the effects of dietary habits

from Indian and Chinese individuals on microbiota composition suggested that

Catenibacterium, amongst others, might have the potential to be used as a

microbial biomarker (63). This genus was enriched in faecal samples from

Indian individuals, whose vegetarian diet was based on whole grains and plants

(63).

Chapter 4_________________________________________________________________________

110

_________________________________ Food by-products fermentation: lean vs obese

111

Figure 7: Microbiota composition after fermentation period with the different test compounds (% of bacterial abundance), in lean (A) and obese (B) microbiotas.

B

Chapter 4_________________________________________________________________________

112

Collinsella

In the lean microbiota, Collinsella was stimulated by CB1, orange bagasses and

passion fruit peels (Figure 5A). A robust increase in abundance of Collinsella

upon fermentation of OB2 was found (increase of 40.5%) with a final

abundance of 41% (Figure 7A). A similar effect of orange bagasses on Collinsella

abundance was observed with the obese microbiota. OB1 enriched the

abundance of this genus by 26%, and at the end of the fermentation, Collinsella

accounted for 28% of the total abundance (Figure 7B). A positive correlation

between Collinsella and small sugars was detected (rho=0.52; q-value=0.03),

explaining the increase in this genus by orange bagasses, rich in small sugars

(Table 1). Passion fruit peels stimulated the increase in abundance of Collinsella

in the lean microbiota. A negative association between DA and Collinsella was

found (rho=-0.49; q-value=0.04), which might explain the high abundance of

Collinsella with addition of PFPs in the lean microbiota. This negative

association, nevertheless, could not explain why in the obese microbiota

Collinsella was only stimulated by PFP3. Some studies show a correlation

between Collinsella and lipid and glucose metabolism. E.g., a study performed

with overweight and obese pregnant women found a positive correlation

between Collinsella, triglycerides and VLDL cholesterol (64). Another study

with non-diabetic, prediabetic and type 2 diabetic patients found an increased

abundance of Collinsella in diabetic patients (65). A clinical trial with healthy

adults revealed a positive correlation between Collinsella and serum cholesterol

(66). The exact mechanism by which the gut microbiota affects host

lipid/glucose metabolism is not completely understood. A possible explanation

is through bacterial modification of bile acids. Collinsella has the ability to

deconjugate bile acids (51). Tran et al. (67) and others (56) proposed a

mechanism by which gut microbiota affects bile acid metabolism with

consequences for host weight. Under normal conditions, bile acids in human

faeces are dominated by secondary bile acids. The researchers proposed that a

normal gut microbiota is required for the production of colonic bile acids with

higher amounts of secondary bile acids (67). Secondary bile acids are ligands of

the cell membrane receptor G-protein-coupled bile acid receptor (TGR5), which

also triggers the release of the satiety hormones GLP-1 and PYY. These satiety

hormones are also recognized by their effects on gut barrier function (68). In

the case of dysbiosis, however, bacterial groups that have the enzyme bile salt

hydrolase (BSH) which is necessary for bile acid deconjugation, may be reduced

or absent (67). Therefore, the production of secondary bile acids is impaired,

and colonic bile acid profiles would be enriched with primary bile acids (67).

Thus, activation of TGR5 would not occur optimally, which could lead to a leaky

_________________________________ Food by-products fermentation: lean vs obese

113

gut (67), and in this manner contribute to metabolic endotoxemia. The released

proinflammatory mediators will phosphorylate insulin receptor substrate (IRS-

1) from the insulin receptor. As a result, this leads to the impairment of insulin

action and causes insulin resistance (69). The consequent insulin resistance

will favour hyperinsulinemia and thus increase hepatic and adipose tissue lipid

storage (4). Although the above-mentioned studies correlated Collinsella with

negative aspects related to lipid/glucose metabolism, it remains unclear

whether the increased abundance is detrimental to the host or if this is a

consequence of dysbiosis caused by environmental factors such as bad eating

habits, or use of antibiotics, which increase the abundance of Collinsella in

order to ameliorate lipid metabolism. Because Collinsella has the ability to

deconjugate bile acids, its increase could represent a protective manner to

counteract the harmful effects of a high fat diet, for instance.

Ruminococcus

Fermentation of the three tested cassava bagasses enriched the abundance of

Ruminococcus in the lean microbiota, (Figure 5A). In the obese microbiota,

however, fermentation of CB1 and CB2 caused a large decrease in

Ruminococcus (~20%). CB3, instead, stimulated it by 7% (Figure 5A), and at

t72 h, the microbiota was composed by 30.2% of the genus Ruminococcus

(Figure 7). Some species of Ruminococcus were found to degrade resistant

starch (51). We have demonstrated in an in vitro model of the upper

gastrointestinal tract (TIM-1) that CB1, CB2 and CB3 were composed on

average of 12% of resistant starch (12). The genus Ruminococcus was inversely

associated with small sugars (rho=-0.49; q-value=0.02). Some species of

Ruminococcus have the ability to ferment recalcitrant fibres in the colon (70),

and therefore might have a preference for such substrates. Fermentation in

both microbiotas (lean and obese) caused a decrease in this group when orange

bagasses were used as substrate. OB1 contained 22.8% of small sugars, whilst

OB2 had 33.4% (Table 1), which may explain why Ruminococcus was not

stimulated by these substrates. An opposite effect was found in an in vitro study

performed with obese microbiota (39). The use of lemon pectin as substrate

actually enriched the abundance of Ruminococcaceae family. The substrate used

in our study was the whole material remaining after the manufacturing of

orange juice (the whole bagasse), not only composed of pectin, but also for

instance of small sugars (Table 1), which likely affected the bacterial dynamics,

explaining the discrepancy between studies. As for cassava bagasse,

fermentation of passion fruit peels caused opposite effects on Ruminococcus

abundance in lean and obese microbiotas. Compared to control, lean microbiota

Chapter 4_________________________________________________________________________

114

fermentation resulted in an increase in Ruminococcus abundance when all three

passion fruit peels were tested (Figure 5A). The opposite effect occurred when

the obese microbiota was used. Passion fruit peel fermentation caused a high

decrease (between 15% and 50%) in the abundance of this genus.

Ruminococcus has been inversely correlated with pro-inflammatory markers,

such as interleukin-6 (IL-6) and C-reactive protein (CRP) (71). A human cross-

over study with 28 healthy participants which consumed three different whole

grain test meals for 17 weeks showed a negative correlation between the

genus Ruminococcus and CRP (72). Obesity is a metabolic disease characterized

by a low-grade inflammation, which contributes to an increased risk to develop

insulin resistance and type 2 diabetes (4). A prebiotic which can enrich the

abundance of anti-inflammatory species that can contribute to counteracting

the negative effects of obesity is highly warranted. It is very intriguing to

observe that cassava bagasses and passion fruit peels were only effective in

increasing the abundance of Ruminococcus in lean microbiota. Apart from CB3,

all other compounds decreased Ruminococcus abundance at t72 h (Figure 5). It

remains unclear what caused such differences.

Lachnospiraceae

Cassava bagasses fermentation in the lean microbiota caused a unique effect on

the genus Lachnobacterium (Figure 7A). They caused a small increase in this

genus, and the final abundance was 2.4%, 3.1% and 1.5% in CB1, CB2 and CB3,

respectively. None of the other substrates modulated this family, not in the lean

nor in the obese microbiota. Spearman correlation showed a positive

association between Lachnobacterium and the presence of glucose in the

substrate (rho=0.78; q-value=6.2*10-06) and a negative correlation with pectin

(rho=-0.55; q-value=0.01). The family Lachnospiraceae was found to be

inhibited by citrus pectin in an in vitro study that used microbiota from obese

individuals (39). Young mice which received subtherapeutic antibiotic therapy

showed substantial changes in microbiome, that resulted in increased adiposity

(73). The Lachnospiraceae family appeared in high proportions in the

antibiotic-treated group (73). Lachnobacterium bovis, the unique species from

the genus Lachnobacterium, isolated from rumen and faeces of cattle, was found

to ferment primarily glucose (74). The role of Lachnobacterium in the human

gut remains to be elucidated. A study with IBD patients found that the relative

abundance of Lachnobacterium was reduced in patients with ulcerative colitis

(75).

_________________________________ Food by-products fermentation: lean vs obese

115

Blautia

It is worth noting that both in the lean and obese microbiota, fermentation of

passion fruit peels caused a reduction in the abundance of Blautia (Figure 5). At

the end of the fermentation, abundance of Blautia in PFP1, PFP2 and PFP3 was

0.4%, 0.6% and 0.6% in the lean microbiota, respectively. In the obese

microbiota the final abundance was higher than in the lean microbiota – 2.3%,

1.2% and 1%, respectively (Figure 7B). Blautia uses hydrogen and carbon

dioxide to form acetate (51). Studies are showing contradictory results of

Blautia on obesity. For instance, a research with obese and non-obese

individuals found a positive association between obesity and Blautia

hydrogenotorophica, but also a positive association between Blautia wexlerae

and the non-obese group (76). Our analysis was performed at the genus level,

and therefore it was not possible to distinguish species and relate it with the

lean or obese microbiota.

Conclusion Our results showed that fermentation of different types of food by-products

were metabolized differently by the lean and obese microbiotas. Regarding

microbiota composition, a clear separated cluster at the beginning of the

experiments between lean and obese microbiota was found, and at the end of

the fermentation period, the clustering within lean and obese samples

disappeared, and instead presence of primary substrate in the tested substrates

(pectin, starch and fructan) drove a new clustering. This new clustering showed

the potential of food by-product in driving the obese microbiota into a healthier

profile, similar to lean.

Cassava bagasse

Cassava bagasses were the only substrates (apart from inulin) that enriched the

beneficial genus Bifidobacterium. The production of total SCFA by cassava

bagasses by the obese microbiota was higher than control and inulin. SCFA are

related to the release of satiety hormones, and therefore this by-product might

represent a tool to tackle obesity.

Orange bagasse

Orange bagasses stimulated the growth of the genera Collinsella and

Catenibacterium. Collinsella is thought to be involved in lipid metabolism. It

remains to be elucidated whether this is beneficial or detrimental to host

health. Generation of SCFA was similar to control and inulin, indicating the

utilization of this by-products by the gut microbiota.

Chapter 4_________________________________________________________________________

116

Passion fruit peel

Passion fruit peels were the substrates that yielded smaller amounts of total

SCFA and intermediate organic acids (lactate and succinate), and produced

more BCFA, which together does not represent the best scenario in bacterial

fermentation and host health. However, passion fruit peels fermentation

resulted in a microbiota with the highest diversity and evenness, a positive trait

regarding host health. Fermentation of passion fruit peels, which had higher

protein content, stimulated the enrichment of Bacteroides, which may explain

higher amounts of BCFA production. Additionally, Ruminococcus were

increased only in the lean microbiota fed with passion fruit peels. Ruminococcus

species are known to use recalcitrant fibres for energy extraction, and a

possible explanation is that the obese microbiota was not used to this type of

substrate and therefore did not have: i) the necessary species to efficiently

degrade complex fibres and/or ii) the machinery to break down the substrate

and make complete use of it.

The results found in this study show that food by-products have the potential to

be used as a tool to manipulate not only the microbiota from obese individuals,

but also from e.g. healthy individuals. The use of food by-products may

represent a way to give a better destination to these by-products, such as to

incorporate them back into food products as functional ingredients. The results

of the present mechanistic study show promise that these by-products could be

an important step forward to tackle obesity and at the same time decrease the

waste of valuable food material and consequently environmental pollution.

Moreover, they are inexpensive and a non-invasive way to be used as a dietary

intervention to improve health. Further experiments, either in vitro or in vivo

are suggested to confirm our findings and contribute to elucidate the

interactions between gut microbiota, obesity and utilization of complex

polysaccharides. For instance, combinations of the food by-products could be

tested to study their synergistic or antagonistic effect.

Conflict of interest The authors declare that there are no conflicts of interest.

Financial support Carlota Bussolo de Souza received a PhD grant from CNPq (National Council for

Scientific and Technological Development – Brazil) under the program “Science

without Borders” (grant number 246027/2012-6). The study was partly

funded by the Centre for Healthy Eating & Food Innovation (HEFI) of

_________________________________ Food by-products fermentation: lean vs obese

117

Maastricht University – campus Venlo. This research has been made possible

with the support of the Dutch Province of Limburg.

Acknowledgments We would like to acknowledge Freddy Troost and Bouke Salden from

Maastricht University for contacting and collecting faecal donation from obese

volunteers at Maastricht University Medical Center. Furthermore, we would

like to thank the companies that kindly sent samples for this research –

Alimentos Grazimara, Companhia Lorenz, Chá&Cia, Phytomare, and Orafti. We

thank Prof. Dr. Thiago Cardoso de Souza from Rio Grande do Norte Federal

University – Brazil - for his assistance with R. We kindly acknowledge Geraldo

Bussolo and Zélia Maria Bussolo for collecting samples of orange bagasse and

passion fruit peel (OB2 and PFP3) from Brazil. The participation of volunteers

that donated their faeces and made this study possible is greatly appreciated.

Chapter 4_________________________________________________________________________

118

References 1. World Health Organization. Obesity and overweight. World Health

Organization; 2016. 2. Turnbaugh PJ, Ley RE, Mahowald M a, Magrini V, Mardis ER, Gordon JI.

An obesity-associated gut microbiome with increased capacity for energy harvest. Nature. 2006;444(7122):1027–31.

3. Ley RE, Turnbaugh PJ, Klein S, Gordon JI. Microbial ecology: human gut microbes associated with obesity. Nature. England; 2006 Dec;444(7122):1022–3.

4. Cani PD, Amar J, Iglesias MA, Poggi M, Knauf C, Bastelica D, et al. Metabolic endotoxemia initiates obesity and insulin resistance. Diabetes. United States; 2007 Jul;56(7):1761–72.

5. Dao MC, Everard A, Aron-Wisnewsky J, Sokolovska N, Prifti E, Verger EO, et al. Akkermansia muciniphila and improved metabolic health during a dietary intervention in obesity: relationship with gut microbiome richness and ecology. Gut. 2016;65(3):426–36.

6. da Silva ST, dos Santos CA, Bressan J. Intestinal microbiota; relevance to obesity and modulation by prebiotics and probiotics. Nutr Hosp. Spain; 2013;28(4):1039–48.

7. Martinez RC, Bedani R, Saad SM. Scientific evidence for health effects attributed to the consumption of probiotics and prebiotics: an update for current perspectives and future challenges. Br J Nutr. 2015;114(12):1993–2015.

8. Pandey A, Soccol CR, Nigam P, Soccol VT, Vandenberghe LPS, Mohan R. Biotechnological potential of agro-industrial residues. II: cassava bagasse. Bioresour Technol. 2000;74(1):81–7.

9. Martínez R, Torres P, Meneses MA, Figueroa JG, Pérez-Álvarez JA, Viuda-Martos M. Chemical, technological and in vitro antioxidant properties of mango, guava, pineapple and passion fruit dietary fibre concentrate. Food Chem. 2012;135(3):1520–6.

10. Juul F, Hemmingsson E. Trends in consumption of ultra-processed foods and obesity in Sweden between 1960 and 2010. Public Health Nutr. England; 2015 Dec;18(17):3096–107.

11. Louzada ML da C, Baraldi LG, Steele EM, Martins APB, Canella DS, Moubarac J-C, et al. Consumption of ultra-processed foods and obesity in Brazilian adolescents and adults. Prev Med (Baltim). United States; 2015 Dec;81:9–15.

12. de Souza CB, Jonathan M, Saad SMI, Schols HA, Venema K. Characterization and in vitro digestibility of by-products from Brazilian food industry: cassava bagasse, orange bagasse and passion fruit peel. Bioact Carbohydrates Diet Fibre. 2018 Oct 1; 16:90-9.

13. Minekus M, Smeets-Peeters M, Bernalier A, Marol-Bonnin S, Havenaar R, Marteau P, et al. A computer-controlled system to simulate conditions of the large intestine with peristaltic mixing, water absorption and absorption of fermentation products. Appl Microbiol Biotechnol.

_________________________________ Food by-products fermentation: lean vs obese

119

1999;53(1):108–14. 14. Rehman A, Heinsen F-A, Koenen ME, Venema K, Knecht H, Hellmig S, et

al. Effects of probiotics and antibiotics on the intestinal homeostasis in a computer controlled model of the large intestine. BMC Microbiol. BioMed Central Ltd; 2012;12(1):47.

15. Kovatcheva-Datchary P, Egert M, Maathuis A, Rajilić-Stojanović M, De Graaf AA, Smidt H, et al. Linking phylogenetic identities of bacteria to starch fermentation in an in vitro model of the large intestine by RNA-based stable isotope probing. Environ Microbiol. 2009;11(4):914–26.

16. Aguirre M, De Souza CB, Venema K. The gut microbiota from lean and obese subjects contribute differently to the fermentation of arabinogalactan and inulin. PLoS One. 2016 Jul 1;11(7).

17. Aguirre M, Eck A, Koenen ME, Savelkoul PHM, Budding AE, Venema K. Evaluation of an optimal preparation of human standardized fecal inocula for in vitro fermentation studies. J Microbiol Methods. Netherlands; 2015 Oct;117:78–84.

18. Aguirre M, Ramiro-Garcia J, Koenen ME, Venema K. To pool or not to pool? Impact of the use of individual and pooled fecal samples for in vitro fermentation studies. J Microbiol Methods. 2014;107C:1–7.

19. Venema K, Nuenen M van, Smeets-Peeters M, Minekus M, Havenaar R. TNO’s in vitro large intestinal model: an excellent screening tool for functional food and pharmaceutical research. Ernährung Nutr. 2000;24(12):559–64.

20. Caporaso JG, Kuczynski J, Stombaugh J, Bittinger K, Bushman FD, Costello EK, et al. QIIME allows analysis of high-throughput community sequencing data. Vol. 7, Nature methods. United States; 2010. p. 335–6.

21. R Core Team. A language and environment for statistical computing. R Foundation for Statistical Computing. Viena, Austria; 2013.

22. Segata N, Izard J, Waldron L, Gevers D, Miropolsky L, Garrett WS, et al. Metagenomic biomarker discovery and explanation. Genome Biol. England; 2011 Jun;12(6):R60.

23. Canfora EE, Jocken JW, Blaak EE. Short-chain fatty acids in control of body weight and insulin sensitivity. Nat Rev Endocrinol. Nature Publishing Group; 2015;11(10):577–91.

24. Aguirre M, Jonkers DMAE, Troost FJ, Roeselers G, Venema K. In vitro characterization of the impact of different substrates on metabolite production, energy extraction and composition of gut microbiota from lean and obese subjects. PLoS One. United States; 2014;9(11):e113864.

25. Turnbaugh PJ, Ley RE, Mahowald MA, Magrini V, Mardis ER, Gordon JI. An obesity-associated gut microbiome with increased capacity for energy harvest. Nature. 2006;444(7122):1027–31.

26. Chambers ES, Morrison DJ, Frost G. Control of appetite and energy intake by SCFA: what are the potential underlying mechanisms? Proc Nutr Soc. England; 2015 Aug;74(3):328–36.

27. Kondo T, Kishi M, Fushimi T, Ugajin S, Kaga T. Vinegar intake reduces

Chapter 4_________________________________________________________________________

120

body weight, body fat mass, and serum triglyceride levels in obese Japanese subjects. Biosci Biotechnol Biochem. England; 2009 Aug;73(8):1837–43.

28. Beh BK, Mohamad NE, Yeap SK, Ky H, Boo SY, Chua JYH, et al. Anti-obesity and anti-inflammatory effects of synthetic acetic acid vinegar and Nipa vinegar on high-fat-diet-induced obese mice. Sci Rep. London: Nature Publishing Group UK; 2017 Jul 27;7:6664.

29. van der Beek CM, Canfora EE, Lenaerts K, Troost FJ, Damink SWMO, Holst JJ, et al. Distal, not proximal, colonic acetate infusions promote fat oxidation and improve metabolic markers in overweight/obese men. Clin Sci (Lond). England; 2016 Nov;130(22):2073–82.

30. Perry RJ, Peng L, Barry NA, Cline GW, Zhang D, Cardone RL, et al. Acetate mediates a microbiome-brain-β cell axis promoting metabolic syndrome. Nature. 2016 Jun 9;534(7606):213–7.

31. Al-Lahham S, Peppelenbosch MP, Roelofsen H, Vonk RJ, Venema K. Biological effects of propionic acid in humans; metabolism, potential applications and underlying mechanisms. Biochim Biophys Acta. 2010;1801(11):1175–83.

32. Macfarlane S, Macfarlane GT. Regulation of short-chain fatty acid production. Proc Nutr Soc. 2003;62:67–72.

33. De Vadder F, Kovatcheva-Datchary P, Goncalves D, Vinera J, Zitoun C, Duchampt A, et al. Microbiota-Generated Metabolites Promote Metabolic Benefits via Gut-Brain Neural Circuits. Cell. 2014 Jan 16;156(1–2):84–96.

34. Nohr MK, Pedersen MH, Gille A, Egerod KL, Engelstoft MS, Husted AS, et al. GPR41/FFAR3 and GPR43/FFAR2 as cosensors for short-chain fatty acids in enteroendocrine cells vs FFAR3 in enteric neurons and FFAR2 in enteric leukocytes. Endocrinology. United States; 2013 Oct;154(10):3552–64.

35. Samuel BS, Shaito A, Motoike T, Rey FE, Backhed F, Manchester JK, et al. Effects of the gut microbiota on host adiposity are modulated by the short-chain fatty-acid binding G protein-coupled receptor, Gpr41. Proc Natl Acad Sci U S A. United States; 2008 Oct;105(43):16767–72.

36. Tolhurst G, Heffron H, Lam YS, Parker HE, Habib AM, Diakogiannaki E, et al. Short-chain fatty acids stimulate glucagon-like peptide-1 secretion via the G-protein-coupled receptor FFAR2. Diabetes. United States; 2012 Feb;61(2):364–71.

37. Bianchi F, Lopes NP, Adorno MAT, Sakamoto IK, Genovese MI, Saad SMI, et al. Impact of combining acerola by-product with a probiotic strain on a gut microbiome model. Int J Food Sci Nutr. England; 2018 Aug;1–13.

38. Macagnan FT, dos Santos LR, Roberto BS, de Moura FA, Bizzani M, da Silva LP. Biological properties of apple pomace, orange bagasse and passion fruit peel as alternative sources of dietary fibre. Bioact Carbohydrates Diet Fibre. Elsevier; 2015;6(1):1–6.

39. Bianchi F, Larsen N, de Mello Tieghi T, Adorno MAT, Kot W, Saad SMI, et al. Modulation of gut microbiota from obese individuals by in vitro

_________________________________ Food by-products fermentation: lean vs obese

121

fermentation of citrus pectin in combination with Bifidobacterium longum BB-46. Appl Microbiol Biotechnol. Germany; 2018 Aug.

40. Canani RB, Costanzo M Di, Leone L, Pedata M, Meli R, Calignano A. Potential beneficial effects of butyrate in intestinal and extraintestinal diseases. Vol. 17, World journal of gastroenterology. United States; 2011. p. 1519–28.

41. Byrne CS, Chambers ES, Morrison DJ, Frost G. The role of short chain fatty acids in appetite regulation and energy homeostasis. Int J Obes (Lond). England; 2015 Sep;39(9):1331–8.

42. Hatayama H, Iwashita J, Kuwajima A, Abe T. The short chain fatty acid, butyrate, stimulates MUC2 mucin production in the human colon cancer cell line, LS174T. Biochem Biophys Res Commun. 2007;356(3):599–603.

43. Willemsen LEM, Koetsier MA, van Deventer SJH, van Tol EAF. Short chain fatty acids stimulate epithelial mucin 2 expression through differential effects on prostaglandin E(1) and E(2) production by intestinal myofibroblasts. Gut. England; 2003 Oct;52(10):1442–7.

44. Hamer HM, Jonkers DMAE, Renes IB, Vanhoutvin SALW, Kodde A, Troost FJ, et al. Butyrate enemas do not affect human colonic MUC2 and TFF3 expression. Eur J Gastroenterol Hepatol. England; 2010 Sep;22(9):1134–40.

45. Peng L, Li Z-R, Green RS, Holzman IR, Lin J. Butyrate Enhances the Intestinal Barrier by Facilitating Tight Junction Assembly via Activation of AMP-Activated Protein Kinase in Caco-2 Cell Monolayers. J Nutr. American Society for Nutrition; 2009 Sep 14;139(9):1619–25.

46. Yan H, Ajuwon KM. Butyrate modifies intestinal barrier function in IPEC-J2 cells through a selective upregulation of tight junction proteins and activation of the Akt signaling pathway. PLoS One. United States; 2017;12(6):e0179586.

47. Flint HJ, Duncan SH, Louis P. 2 - Gut microbial ecology BT - Designing Functional Foods. In: Woodhead Publishing Series in Food Science, Technology and Nutrition. Woodhead Publishing; 2009. p. 38–67.

48. Koenen ME, Cruz Rubio JM, Mueller M, Venema K. The effect of agave fructan products on the activity and composition of the microbiota determined in a dynamic in vitro model of the human proximal large intestine. J Funct Foods. 2016;22:201–10.

49. Lima GC, Vuolo MM, Batista ÂG, Dragano NR V, Solon C, Junior MRM. Passiflora edulis peel intake improves insulin sensitivity, increasing incretins and hypothalamic satietogenic neuropeptide in rats on a high-fat diet. Nutrition. 2016;32(7):863–70.

50. Serena C, Ceperuelo-Mallafre V, Keiran N, Queipo-Ortuno MI, Bernal R, Gomez-Huelgas R, et al. Elevated circulating levels of succinate in human obesity are linked to specific gut microbiota. ISME J. England; 2018 Jun;12(7):1642–57.

51. Rajilić-Stojanović M, de Vos WM. The first 1000 cultured species of the human gastrointestinal microbiota. FEMS Microbiol Rev.

Chapter 4_________________________________________________________________________

122

2014;38(5):996–1047. 52. De Graaf A, Venema K. Gaining Insight into Microbial Physiology in the

Large Intestine: A Special Role for Stable Isotopes. 2007;53:73–314. 53. Flint HJ, Scott KP, Duncan SH, Louis P, Forano E. Microbial degradation of

complex carbohydrates in the gut. Vol. 3, Gut Microbes. 2012. p. 289–306.

54. Bussolo de Souza C, Roeselers G, Troost F, Jonkers D, Koenen ME, Venema K. Prebiotic effects of cassava bagasse in TNO’s in vitro model of the colon in lean versus obese microbiota. J Funct Foods. Elsevier Ltd; 2014;11(C):210–20.

55. Ignacio A, Fernandes MR, Rodrigues VAA, Groppo FC, Cardoso AL, Avila-Campos MJ, et al. Correlation between body mass index and faecal microbiota from children. Clin Microbiol Infect. England; 2016 Mar;22(3):258.e1-8.

56. Duboc H, Rainteau D, Rajca S, Humbert L, Farabos D, Maubert M, et al. Increase in fecal primary bile acids and dysbiosis in patients with diarrhea-predominant irritable bowel syndrome. Neurogastroenterol Motil. England; 2012 Jun;24(6):513–20, e246-7.

57. Schwiertz A, Taras D, Schafer K, Beijer S, Bos NA, Donus C, et al. Microbiota and SCFA in lean and overweight healthy subjects. Obes (Silver Spring). Nature Publishing Group; 2010;18(1):190–5.

58. Gomez B, Gullon B, Remoroza C, Schols HA, Parajo JC, Alonso JL. Purification, characterization, and prebiotic properties of pectic oligosaccharides from orange peel wastes. J Agric Food Chem. 2014;62(40):9769–82.

59. Tian L, Scholte J, Borewicz K, van den Bogert B, Smidt H, Scheurink AJW, et al. Effects of pectin supplementation on the fermentation patterns of different structural carbohydrates in rats. Mol Nutr Food Res. Germany; 2016 Oct;60(10):2256–66.

60. Miquel S, Martín R, Rossi O, Bermúdez-Humarán LG, Chatel JM, Sokol H, et al. Faecalibacterium prausnitzii and human intestinal health. Curr Opin Microbiol. 2013;16(3):255–61.

61. Machiels K, Joossens M, Sabino J, De Preter V, Arijs I, Eeckhaut V, et al. A decrease of the butyrate-producing species Roseburia hominis and Faecalibacterium prausnitzii defines dysbiosis in patients with ulcerative colitis. Gut. England; 2014 Aug;63(8):1275–83.

62. Kageyama A, Benno Y. Catenibacterium mitsuokai gen. nov., sp. nov., a gram-positive anaerobic bacterium isolated from human faeces. Int J Syst Evol Microbiol. England; 2000 Jul;50 Pt 4:1595–9.

63. Jain A, Li XH, Chen WN. Similarities and differences in gut microbiome composition correlate with dietary patterns of Indian and Chinese adults. AMB Express. Germany; 2018 Jun;8(1):104.

64. Gomez-Arango LF, Barrett HL, McIntyre HD, Callaway LK, Morrison M, Dekker Nitert M. Connections between the gut microbiome and metabolic hormones in early pregnancy in overweight and obese

_________________________________ Food by-products fermentation: lean vs obese

123

women. Diabetes. United States; 2016 Aug;65(8):2214–23. 65. Lambeth SM, Carson T, Lowe J, Ramaraj T, Leff JW, Luo L, et al.

Composition, diversity and abundance of gut microbiome in prediabetes and type 2 diabetes. J diabetes Obes. United States; 2015 Dec;2(3):1–7.

66. Lahti L, Salonen A, Kekkonen RA, Salojarvi J, Jalanka-Tuovinen J, Palva A, et al. Associations between the human intestinal microbiota, Lactobacillus rhamnosus GG and serum lipids indicated by integrated analysis of high-throughput profiling data. PeerJ. United States; 2013;1:e32.

67. Tran CD, Grice DM, Wade B, Kerr CA, Bauer DC, Li D, et al. Gut permeability, its interaction with gut microflora and effects on metabolic health are mediated by the lymphatics system, liver and bile acid. Futur Microbiol. 2015;10:1339–53.

68. Cani PD, Everard A, Duparc T. Gut microbiota, enteroendocrine functions and metabolism. Curr Opin Pharmacol. Elsevier Ltd; 2013;13(6):935–40.

69. Cani PD, Possemiers S, Van de Wiele T, Guiot Y, Everard A, Rottier O, et al. Changes in gut microbiota control inflammation in obese mice through a mechanism involving GLP-2-driven improvement of gut permeability. Gut. 2009;58(8):1091–103.

70. Flint HJ, Duncan SH, Louis P. The impact of nutrition on intestinal bacterial communities. Curr Opin Microbiol. England; 2017 Aug;38:59–65.

71. van den Munckhof ICL, Kurilshikov A, Ter Horst R, Riksen NP, Joosten LAB, Zhernakova A, et al. Role of gut microbiota in chronic low-grade inflammation as potential driver for atherosclerotic cardiovascular disease: a systematic review of human studies. Obes Rev. England; 2018 Aug.

72. Martinez I, Lattimer JM, Hubach KL, Case JA, Yang J, Weber CG, et al. Gut microbiome composition is linked to whole grain-induced immunological improvements. ISME J. England; 2013 Feb;7(2):269–80.

73. Cho I, Yamanishi S, Cox L, Methe BA, Zavadil J, Li K, et al. Antibiotics in early life alter the murine colonic microbiome and adiposity. Nature. England; 2012 Aug;488(7413):621–6.

74. Whitford MF, Yanke LJ, Forster RJ, Teather RM. Lachnobacterium bovis gen. nov., sp. nov., a novel bacterium isolated from the rumen and faeces of cattle. Int J Syst Evol Microbiol. England; 2001 Nov;51(Pt 6):1977–81.

75. Yilmaz B, Spalinger MR, Biedermann L, Franc Y, Fournier N, Rossel J-B, et al. The presence of genetic risk variants within PTPN2 and PTPN22 is associated with intestinal microbiota alterations in Swiss IBD cohort patients. PLoS One. United States; 2018;13(7):e0199664.

76. Kasai C, Sugimoto K, Moritani I, Tanaka J, Oya Y, Inoue H, et al. Comparison of the gut microbiota composition between obese and non-obese individuals in a Japanese population, as analyzed by terminal restriction fragment length polymorphism and next-generation sequencing. BMC Gastroenterol. BioMed Central; 2015;15(1):100.

Chapter 4_________________________________________________________________________

124

Supplemental material

Supplemental Figure 1: Kinetics and total cumulative production of SCFA by the lean and obese microbiota during 72 hours fermentation in TIM-2 with different test compounds.

_________________________________ Food by-products fermentation: lean vs obese

125

Supplemental Figure 2: Total energy (kcal) production by the lean and obese microbiota after fermentation period with the different test compounds.

Supplemental Figure 3: Ratio of each SCFA over the experimental period with the different test compounds in the lean (A) and obese (B) microbiotas.

Chapter 4_________________________________________________________________________

126

Supplemental Figure 4: Shannon index at t72 h (lean and obese combined) with test

compounds. PFP3 had the highest diversity in bacterial population, whereas inulin

showed the least diverse composition.

Chapter 5 Degradation of fibres from fruit by-

products allows selective modulation of the gut microbiota in an in vitro model of

the proximal colon

Submitted:

Bussolo de Souza C., Jonathan M., Saad S.M.I., Schols H.A., Venema K.

Degradation of fibres from fruit by-products allows selective modulation of the

gut microbiota in an in vitro model of the proximal colon.

Chapter 5_________________________________________________________________________

128

Abstract The potential prebiotic effect of fibres from fruit by-products and their

degradation by a healthy adult human gut microbiota was tested in an in vitro

colon system (TIM-2). Alcohol insoluble solids of two batches of orange

bagasses and passion fruit peels were fed to TIM-2. Standard medium and

inulin were used as controls. Orange bagasses had similar chemical

composition but differed regarding fermentation profile. A-OB2 resulted in a

more diverse bacterial community than A-OB1 and resulted in the production

of more SCFA (118.3 mmol and 81.8 mmol, respectively), with increased

Ruminococcus and Lachnospira. Carbohydrate utilization was higher on A-OB2

probably due to higher ratio soluble to insoluble fibres. Passion fruit peels

presented similar chemical composition and fermentation profiling. Bacteroides

and Ruminococcus were the main genera stimulated, and their final abundance

on A-PFP1 were 6.9% and 8.5%, respectively, and on A-PFP2 were 9.6% and

16%, respectively. Negligible lactate and succinate production (≤ 0.05 mmol)

may represent slow fermentation, a protective feature against colon cancer.

This study provided evidence that fruit by-products have the potential to be

used for selective modulation of the gut microbiota.

_________________________________________________ Fruit by-products fermentation

129

Introduction Food industries around the globe are responsible for about 38% of the total

food waste produced, which includes food by-products (1). The term “food by-

product” generally refers to edible parts of food that are either discarded

during the processing (such as peels, seeds and bagasses), lost, degraded or

consumed by pests (1,2). Fruit and vegetables by-products are a source of a

variety of dietary fibres, which may be suitable for human consumption (3).

Dietary fibres are defined as carbohydrate polymers with a degree of

polymerization (DP) of three or more, which are neither digested nor absorbed

in the human upper intestine (4). One of the main positive health effects of

dietary fibres are related to colonic function, blood glucose- and blood

cholesterol reduction (4). Another fundamental function of dietary fibres is to

serve as the main energy source to the gut microbiota. In contrast to the host,

members of the gut microbiota possess the enzymes necessary to hydrolyse the

linkages present in dietary fibres (5). Feeding our gut microbiota with dietary

fibres is important because the fermentation of such substrates can (i)

stimulate and/or maintain the population of beneficial microbes (e.g.

Bifidobacterium), and (ii) stimulate the production of bacterial metabolites

(short chain fatty acids – SCFA) (6). Both features are beneficial to the host and

essential for the homeostasis of host metabolism (6). Accordingly, dietary fibre

has the potential to be used as a tool to manipulate the gut microbiota in order

to (re)stablish the equilibrium necessary to maintain host health (7). However,

the interplay between gut microbiota fermentation of different substrates and

host health is not completely understood. Specifically, the structural complexity

of dietary fibre and their influence on the dynamic changes of gut microbe

populations remains mostly unknown or underappreciated (7).

We have characterized the isolated fibre from different sources of fruit by-

products (orange bagasses and passion fruit peels) regarding monosaccharide

composition, degree of methyl- and acetyl-esterification, protein and pectin

content (8). Here, our main goal was to assess the potential prebiotic effect of

these fibres in a dynamic in vitro system mimicking the proximal colon (TIM-2),

through the analyses of bacterial composition and metabolism. Furthermore,

we monitored the fate of these fibres during fermentation (rate and extent of

polysaccharides break down by the gut microbiota) through the analyses of

intermediate products in order to investigate the bacterial utilization of the

different monosaccharides present in these polysaccharides.

Chapter 5_________________________________________________________________________

130

Materials and methods

Test compounds

In total, 4 test compounds (plus 2 controls) were used for the fermentation in

TIM-2. The test compounds were alcohol insoluble solids (AIS) isolated from

two samples of orange bagasses and two samples of passion fruit peels. The

orange bagasses were obtained from Chá&Cia (Jacareí, Brazil) – denoted as A-

OB1, and from a bulk sale store (Florianópolis, Brazil) – denoted as A-OB2. The

passion fruit peels were from Chá&Cia (Jacareí) – denoted as A-PFP1, and

Phytomare (Governador Celso Ramos, Brazil) – denoted as A-PFP2.

More detailed information about the extraction and characterization of the

compounds is presented elsewhere (8), and is summarized in Table 1.

Table 1: Constituent monosaccharide composition (weight/weight [w/w] %), total

carbohydrates (w/w%), pectin (%), protein (%), degree of methylation (DM) and

degree of acetylation (DA) of the alcohol insoluble solids (AIS) from orange bagasses

(OBs) and passion fruit peels (PFPs) (8).

Rha: rhamnose, Fuc: fucose, Ara: arabinose, Xyl: xylose, Man: mannose, Gal: Galactose, Glc:

glucose, UA: uronic acids; DM: degree of methylation (moles of methanol per 100 moles of

galacturonic acid residues); DA: degree of acetylation (moles of acetic acid per 100 moles of

galacturonic acid residues); Pectin: sum of UA, Rha, Ara and Gal.

Inulin from chicory root was provided by its manufacturer (Orafti, Amsterdam,

the Netherlands) and was used as positive control (purity ≥ 90%, degree of

polymerization >10). Simulated ileal effluent medium (SIEM) was used as

control and is described in one of the following sections.

Fermentation experiments

In vitro model of the proximal colon (TIM-2)

TIM-2 mimics the proximal colon and has been described before (9). Shortly,

this extensively used and validated dynamic in vitro model simulates the

conditions in the colon (temperature kept at 37 oC, pH 5.8, anaerobic

_________________________________________________ Fruit by-products fermentation

131

environment, removal of microbial metabolites simulating uptake by the body,

peristaltic movements) (Supplemental Figure 1 – Adapted from (10)).

Microbiota

The inoculum used for the TIM-2 experiments was a standardized microbiota

prepared from faecal material from 5 healthy individuals (3 female and 2 male),

age range 20-33 years and body mass index (BMI) 21.69 ± 0.80 kg/m2.

Participants provided a signed consent prior to donation. The exclusion criteria

included the use of prebiotics, probiotics, laxatives and antibiotics in the month

prior to donation.

Volunteers were provided with all necessary material for self-collection of their

faeces. They were instructed to defaecate in a bag (300 mm x 500 mm, 100 μm

thick, ZPH Verpakkingen, Zeist, the Netherlands) and immediately place it into

a gastight plastic jar containing anaerobic packs (AnaeroGenTM, Oxoid,

Cambridge, UK). Faeces were frozen (-80 oC) until standardization.

To standardize the microbiota, faeces were defrosted, mixed in an anaerobic

cabinet and prepared as described before (11). The faecal slurry was aliquoted,

snap-frozen in liquid nitrogen and stored at -80 oC. Standardization of

microbiota allows the use of the same microbiota for all experiments

(permitting comparison among the fermentations of different test compounds)

and it was previously demonstrated that it results in a representative

microbiota in terms of composition and activity (12).

Simulated ileal effluent medium (SIEM) and dialysis solution

SIEM simulates the material reaching the colon (Western diet) and it was used

as standard feeding, denoted as control (13). It contains indigestible

carbohydrates (pectin, xylan, arabinogalactan, amylopectin and starch),

protein, vitamins, and bile (13). Tween 80 was omitted because it previously

was found to hinder analysis of carbohydrate degradation products (14). The

pH was adjusted to 5.8 to simulate the pH from the proximal colon.

Dialysis solution contained (per litre): 2.5 g K2HPO4.3H2O, 4.5 g NaCl, 0.005 g

FeSO4.7H2O, 0.5 g MgSO4.7H2O, 0.45 g CaCl2.2H2O, 0.05 g bile and 0.4 g

cysteine∙HCl, plus 1 mL of the vitamin mixture; pH 5.8 (Aguirre et al., 2015). All

medium components were purchased at Tritium Microbiology (Eindhoven, the

Netherlands).

Experimental set up

In order to create a complete anaerobic environment, TIM-2 was flushed with

gaseous nitrogen for 3 hours prior to the addition of the standardized

microbiota. Then, approximately 30 mL of the standardized microbiota was

Chapter 5_________________________________________________________________________

132

added to 90 mL of dialysis solution (described above) to complete the volume

of the system (120 mL). The microbiota was allowed to adapt to the system for

16 hours while being fed with SIEM (2.5 mL/hour) (denoted as “adaptation

period”, Figure 1). Next, the feeding system was stopped for 2 hours (denoted

as “starvation period”), in which the microbiota fermented the remaining

carbohydrates from SIEM. Subsequently, samples were collected (referred to as

t0h) and the system was fed with SIEM preparation containing the test

compounds instead of the standard carbohydrates (7.5 g/day).

Figure 1: Schematic figure of the experimental set up of fermentation experiments in

TIM-2.

Samples from lumen and dialysate out were collected every ~24 hours (t0h,

t24h, t48h and t73h). After taking samples at t48h, the feeding system was

stopped for 1 hour. At t49h, samples were collected and a shot of 1g of test

compound diluted in dialysate (1:15) was added to the system. Samples were

subsequently collected at t49h15m, t49h30m, t50h, t51h, t53h, t55h and t73h

for profiling the degradation of the fibres (constituent monosaccharide

analysis). The feeding system was reconnected again after t55h. The

experimental scheme can be seen in Figure 1.

SCFA, BCFA and organic acids analyses

Samples from fermentation experiments in TIM-2 (lumen and dialysate - t0h,

t24h, t48h and t73h) were analyzed to quantify SCFA (acetate, propionate and

_________________________________________________ Fruit by-products fermentation

133

butyrate), BCFA (iso-butyrate and iso-valerate), as well as organic acids

(caproate, lactate, succinate and formate) by Brightlabs (Venlo, the

Netherlands).

Samples were centrifuged at 14.000 rpm for 10 minutes, and the supernatant

was filtered through a 0.45 µm PTFE filter and diluted with mobile phase

(lumen 1:5 and dialysate 1:2). The samples were analysed using ion exclusion

chromatography (IEC) on an 883 Ion Chromatograph (IC; Metrohm,

Switzerland), using a Transgenomic IC Sep ICE-ION-300 column (30 cm length,

7.8 mm diameter and 7 µm particles) and a MetroSep RP2 Guard. The mobile

phase consists of 1.5 mM aqueous sulphuric acid. A flowrate of 0.4 ml/min was

used. The temperature of the column was 65 °C. The organic acids were

detected using suppressed conductivity detection. Ten microliters were loaded

on the column by an autosampler 730 (Metrohm). Molecules were eluted

according to their pKa.

Microbiota composition

Lumen samples from TIM-2 (t0h and t73h) were subjected to DNA sequencing

for microbial composition analysis. In brief, genomic DNA isolation (ZYMO

Research Co., CA, USA), PCR amplification of the 16S rRNA gene (V3-V4 region),

barcoding and library preparation were performed by BaseClear (Leiden, the

Netherlands). Short paired-end sequence reads were generated using the

Illumina MiSeq system and converted into FASTQ files using the BCL2FASTQ

pipeline version 1.8.3. Quality trimming was applied based on Phred quality

scores.

Constituent monosaccharide composition of lumen samples

Lumen samples (t49h, t49h15m, t49h30m, t50h, t51h, t53h, t55h and t73h)

were heated at 100 oC for 5 minutes to inactivate bacteria and enzymes. The

samples were then freeze-dried (total digest).

Part of the freeze-dried samples was sequentially suspended in Millipore water

(10 mg/mL) and centrifuged (4 oC, 10 min, 4000 rpm) to extract the soluble

fraction. The insoluble part was freeze dried for analysis (insoluble digest).

Monosaccharide constituent composition was measured by derivatizing the

sugars into alditol acetates as previously described (15). The total uronic acid

content was determined with the automated meta-hydroxydiphenyl assay (16).

Galacturonic acid (12.5-100 μg/mL) was used for calibration. Pectin was

calculated as the total of uronic acids (UA), rhamnose (Rha), arabinose (Ara)

and galactose (Gal) (w/w %).

Chapter 5_________________________________________________________________________

134

Constituent monosaccharide present in the soluble fraction was calculated from

the difference in individual monosaccharide contents present in the total digest

and the insoluble digest.

Data analyses

The experiments were performed in duplicate (n=2) per test compound, except

for control (n=6), which was run along with the other test compound in each

week of experimenting, to show reproducibility throughout time.

QIIME software package (version 1.9.0) was used for microbial analyses (17).

The sequences were classified using Greengenes (version 13.8) as a reference

16S rRNA gene database.

Statistical analysis was performed with RStudio (3.1.3) (18). Kruskal-Wallis test

was used to test differences in multiple categories, with p-values p<0.05 set to

be significantly different. Dunn post hoc test was utilized to find differences

between groups. Spearman correlation was calculated between the relative

abundance of operational taxonomic units (OTUs) and continuous variables.

Multiple comparison was corrected using the false discovery rate (FDR), and q-

values (adjusted p-values) were considered significantly different at <0.05.

Microbial composition changes induced by test compounds were also assessed

through the difference of their initial relative abundance and final abundance

(t73h – t0h) and compared to control.

Linear discriminant analysis effect size (LEfSe) (19) was used to find

biomarkers between groups using relative abundances from the OTU tables

generated in QIIME. Phylogenetic Investigation of Communities by

Reconstruction of Unobserved States (PICRUSt) (20) was used to predict the

gene families contributing to the metagenomes of the samples identified using

16S rRNA sequencing. This data was visualized using statistical analysis of

taxonomic and functional profiles (STAMP) (21).

Results and discussion

Monosaccharide composition of AIS fractions

The constituent monosaccharide compositions of the four test compounds (AIS

fraction) used in TIM-2 fermentations are shown in Table 1, and have been

reported previously in detail elsewhere (8).

Briefly, the pectins as dominantly present in the AIS fractions of orange

bagasses were highly methyl-esterified, with a degree of methylation (DM) of

93 and 92 for A-OB1 and A-OB2, respectively. The main monosaccharide

present was glucose representing 20% of the total carbohydrate present for A-

_________________________________________________ Fruit by-products fermentation

135

OB1 and 16.7% for A-OB2. The two bagasses were very similar in their

composition, with the main differences in the protein content (5.4% and 8.3%)

and degree of acetylation (DA) (26% and 17% for A-OB1 and A-OB2,

respectively).

In contrast, pectins as present in the isolated AIS fibres from passion fruit peels

were low methyl-esterified (DM≤50). Additionally, the amount of pectin

present (20-23% w/w) was lower than their citrus counterpart. The two

samples of A-PFPs had glucose as the main monosaccharide (29-31% w/w),

followed by uronic acid (15-18% w/w) and xylose (8-11% w/w) (Table 1).

Microbial activity

Production of SCFA and organic acids

Host diet composition and food intake pattern are important determinants for

metabolites produced by the gut microbiota (22). SCFA constitute the major

bacterial end products formed from fermentation of indigestible foods (23).

They exert beneficial roles on the host, and thus, a food component that can

have a positive effect on the production of these metabolites is desirable.

Table 2: Average (± range) cumulative production of SCFA (acetate, propionate and butyrate), BCFA (iso-butyrate and iso-valerate) and other organic acids (succinate, lactate, formate and caproate) by the gut microbiota on the standard medium and inulin, and the substrates tested after 73 hours fermentation (mmol).

Control Inulin A-OB1 A-OB2 A-PFP1 A-PFP2

Acetate 65.5±7.7 53.6±0.8 53.4±3.8 63.8±2.1 42.0±12.2 52.9±2.6

Propionate 14.2±5.2 11.9±0.8 12.9±0.1 24.9±0.3 21.4±0.9 26.4±1.1

Butyrate 53.4±3.6 59.0±7.7 15.4±0.0 29.6±0.5 20.3±1.3 21.3±0.4

Total SCFA 133.2±10.7 124.6±7.6 81.8±3.6 118.3±1.3 83.7±14.4 100.7±3.3

Lactate 1.0±0.7 0.6±0.4 NG 0.7±0.7 NG NG

Succinate 18.4±2.4 26.5±3.9 2.9±0.5 6.6±4.4 NG NG

Formate 1.9±1.4 2.9±0.2 1.1±0.7 5.1±2.5 3.0±0.4 0.9±0.4

Caproate NG NG NG NG 0.1±0.1 NG

Total Org. Acids

21.3±2.4 30.0±4.1 4.0±1.1 12.4±6.2 3.1±0.8 0.9±0.4

Iso-butyrate 0.5±1.0 0.1±0.1 NG 0.6±0.4 1.1±0.1 1.2±0.0

Iso-valerate 0.8±0.7 0.2±0.1 NG 1.9±0.7 1.3±0.1 1.8±0.7

Total BCFA 1.3±1.4 0.3±0.1 NG 2.5±1.1 2.4±0.2 3.0±0.7

NG: below detection limit (≤0.05)

Chapter 5_________________________________________________________________________

136

Fermentation of A-OB1 resulted in the lowest total cumulative amount of SCFA

among all test compounds (81.8 mmol) (Table 2). On the other hand, A-OB2

fermentation showed a similar total amount of SCFA (118.3 mmol) as inulin

(124.6 mmol), our positive control. A-PFP1 fermentation produced in total 83.7

mmol of SCFA and A-PFP2 100.7 mmol.

Over time, A-OB1 fermentation mainly increased the proportion of propionate,

which increased in ratio from 9.7% (at t24h) to 15.8% after 73 hours

experimental period (Figure 2).

Figure 2: Average ratio of SCFA produced during fermentation of the different test

compounds. T0 represents the average ratio of SCFA from of all runs with test

compounds.

Compared to A-OB1, fermentation of A-OB2 resulted in a different profile

regarding the production of bacterial metabolites. Fermentation of A-OB2

increased the proportion of butyrate over time (19.4% at t24h and 25% at

t73h) (Figure 2). It did not show, however, a pronounced butyrogenic effect like

the positive control inulin, where the relative proportion of butyrate increased

from 34.1 % at t24h to 47.1 % at t73h). The importance of butyrate for host

health is diverse. Butyrate is the main fuel for colonocytes (23) and contributes

to the conservation of the mucus barrier through the up-regulation of mucin-

encoding gene expression, assisting therefore, in maintaining a healthy

0 10 20 30 40 50 60 70 80 90 100

t73ht48ht24h

t73ht48ht24h

t73ht48ht24h

t73ht48ht24h

t73ht48ht24h

t73ht48ht24h

t0h

A-P

FP

2A

-PF

P1

A-O

B2

A-O

B1

Inu

lin

Co

ntr

ol

t0

%

Acetate Propionate n-Butyrate

_________________________________________________ Fruit by-products fermentation

137

epithelial layer in the colon. It has anti-inflammatory effects and induces

apoptosis in in vitro cultured colon cancer cells (24), and thus, might have

anticarcinogenic effects.

Generation of butyrate upon fermentation of passion fruit peels was similar to

that of orange bagasses, but lower than the standard medium and inulin

controls (Table 2). A study performed with mice which had received standard

diet enriched with passion fruit peel for fifteen days revealed an increase in

faecal acetate and butyrate when compared to the control group which

received standard diet (25). The aforementioned study used dried passion fruit

peel, which contained not only the fibre component, but also polyphenols for

instance. In our study, the isolated fibre material from passion fruit peels (AIS)

without the phenolic compounds was used. Polyphenols are also known to

exert an effect on the gut microbiota (26), which might explain the differences

found regarding the effects on acetate and butyrate production.

Although A-OB1 stimulated the production of propionate over time, it did not

provide a low ratio between acetate to propionate as A-OB2 did (4.1 and 2.6 for

A-OB1 and A-OB2, respectively). Studies are indicating that low ratios of

acetate to propionate have hypolipidemic effects on the host (27–29). Acetate

stimulates the synthesis of lipids, while propionate counteracts de novo

lipogenesis from acetate (30), demonstrating the importance of the SCFA

product ratios. A-PFP1 and A-PFP2 resulted in similar ratios of acetate to

propionate (1.9 and 2.0, respectively), with higher percentages of propionate

than for A-OB.

Lactate and succinate are intermediate metabolites in intestinal microbiology

and are usually present in lower amounts because they are consumed by other

microbes through cross-feeding that convert them into SCFA, such as

propionate and butyrate (23,31). Their accumulation is an indication that the

substrate was fermented fast (31). Control and inulin were the substrates that

resulted in accumulation of mainly succinate, but also lactate (Table 2). In

contrast, passion fruit peels resulted mostly in negligible amounts of these

intermediate metabolites, probably because these substrates were consumed at

a slow pace. Slow fermentation has a positive effect, since a substrate that is

fermented slowly has more chances to reach the distal part of the colon, to be

fermented there. Most carbohydrates are usually fermented extensively in the

proximal colon (6). As a consequence, the microbiota in the distal colon ferment

proteins, producing toxic metabolites which have been shown to have direct

effects on colon cancer incidence (32,33). Fermentation of A-PFP1 resulted in

the highest amount of formate (3.0 mmol) whilst A-PFP2 generated the

smallest amount (0.9 mmol) among all test compounds (Table 2). Generation of

Chapter 5_________________________________________________________________________

138

caproate was negligible in all test compounds, apart from A-PFP1 that still

produced a small amount (0.1 mmol) after 73 hours fermentation. The role of

these metabolites in health and disease is unclear.

Taken together, analyses of bacterial activity revealed that regarding SCFA and

organic acids production, A-OB2 was the test component that showed the most

positive profile. The total cumulative amount of SCFA was similar to inulin, our

positive control. SCFA are essential to maintain a lower pH in the colon, which

is a selective mechanism to favour the growth of beneficial bacteria over

pathogens (34). Although the generation of butyrate was smaller than inulin

and control, still, A-OB2 produced higher amounts of butyrate compared to the

other test compounds. Additionally, the ratio of acetate to propionate was

lower than control, inulin and A-OB1, indicating that intervention with A-OB2

might be useful to promote the production of SCFA, and consequently,

contribute to lipids lowering in hyperlipidaemic individuals. It is important to

highlight that although passion fruit peels (A-PFP1 and A-PFP-2) resulted in

lower cumulative SCFA production, generation of negligible amounts of lactate

and succinate indicated that they were fermented at a slow pace, a positive

characteristic when considering health effects in the distal colon, e.g., against

colon cancer. In this sense, passion fruit peels could be used together with other

dietary fibres with the main objective to serve as source of energy for bacteria

residing in the distal colon, and consequently protecting this segment against

health problems that commonly affect the distal colon in Western society.

Production of BCFA

The total cumulative production of BCFA (iso-butyrate and iso-valerate) was

negligible upon A-OB1 administration (≤0.01 mmol), while it was 2.5 mmol on

A-OB2 (Table 2). Notably, A-PFP2 fermentation resulted in the highest amount

of BCFA generated (3.0 mmol), despite not being the test compound with the

highest amount of protein content (6.2%) (Table 1). This is likely reflecting the

types of amino acids that make up the proteins of A-PFP2 (not analysed here).

Studies have shown that once in the colon, fermentation of peptides and amino

acids produces not only SCFA, but also BCFA (23) and other potentially toxic

substances such as ammonia, which have negative health effects (35). A similar

study showed a higher production of BCFA by microbiota from lean individuals

upon apple fibre and sugar beet pectin administration (4.5 mmol and 4.1 mmol,

respectively), when compared to our results (36). On the other hand, when a

microbiota originating from obese individuals was used, a lower generation of

BCFA was found for the identical substrates (2.6 mmol on apple fibre and 1.4

mmol on sugar beet pectin). Another study performed in TIM-2 with a

_________________________________________________ Fruit by-products fermentation

139

microbiota originating from healthy individuals and using mango peel as a

substrate also showed a higher generation of BCFA (> 4.0 mmol) (37) than the

test compounds used in the current study. Importantly, the negative effects of

proteolytic fermentation might be suppressed through an adequate ingestion of

non-digestible fermentable carbohydrates, which are the preferred substrate

for microbial fermentation, leaving amino acids and peptides to be used for

microbial biomass formation instead of being used for energy production

(24,31). The differences in the formation of BCFA were therefore dependent of

the type of substrate used. Compared to other types of fibres (e.g. apple fibre,

sugar beet pectin and mango peel), fermentation of orange bagasses and

passion fruit peels resulted in similar or even lower amounts of BCFA. The

results found here reinforce the fact that microbial metabolism is highly

affected by the type of substrate that reaches the colon. The gut microbiota can

be manipulated by diverse types of fibres with the goal to achieve a healthier

profile and metabolism that in turn will bring benefits to the host.

Assessment of microbiota composition

Principal Coordinate Analysis (PCoA) and Linear discriminant analysis

effect size (LEfSe)

In order to identify which factors could be associated with shaping of bacterial

communities after 73 hours fermentation, Principal Coordinate Analysis (PCoA)

was performed. The unweighted PCoA plot (Figure 3-B) shows that samples

were clustered according to their substrate.

Figure 3: Principal Coordinate Analysis (PCoA) plots of the microbiota after 73 hours

fermentation in TIM-2 with Weighted (A) and Unweighted (B) UniFrac. Samples are

plotted on the first three Principal Coordinates (PC1, PC2 and PC3).

Chapter 5_________________________________________________________________________

140

Orange bagasses had a distinct separation along the Principal Coordinate 1

(PC1). PC1 explained 60.62% of variation between the samples in weighted

UniFrac and 27.74% in unweighted UniFrac (Figure 3-A and B). To visualize the

taxa driving the differences in the PCoA plot, a boxplot (and corresponding

heatmap) was generated in QIIME for the top 10 Operational Taxonomic Units

(OTUs), which showed that A-OB1 clustering was mainly influenced by the

genus Collinsella (Supplemental Figure 2). However, as indicated in

Supplemental Figure 2, it was not entirely unique to A-OB1 and could also not

be confirmed by LEfSe (Supplemental Figure 3), which showed that Prevotella

is a discriminating feature for this substrate. A-OB2 clustering had the genus

Ruminococcus as the main driver in the boxplot (and heatmap; Supplemental

Figure 2). So, despite similar monosaccharide composition, these two bagasses

stimulate different microbes, indicating some (structural) differences in the

polysaccharides present (see below). LEfSe (Supplemental Figure 3) and the

boxplot (Supplemental Figure 2) show another Ruminococcus OTU and

Catenibacterium as clear discriminants for inulin.

Different from the orange bagasses, the two batches of passion fruit peel had a

more similar effect, not only on the production of bacterial metabolites, as

described above, but also on the microbiota composition. This similarity can be

observed in Figure 3, where the PCoA plots showed that passion fruit peel

samples clustered together (although one duplicate of A-PFP1 looks like an

outlier). Similar to A-OB2, the same enriched OTU within the genus

Ruminococcus was the main driver for this clustering.

PICRUSt was used to predict the microbial pathways contributing to the

metagenomes of the samples identified based on 16S rRNA sequencing,

projection on the KEGG database, and data visualization using STAMP. Using

Welsh’s two-sided t-test with Bonferroni correction, pathways predicted for

each substrate were compared to the other food by-products (e.g., A-OB1

compared to A-OB2+the two A-PFPs, etc.). All significant predicted pathways

projected on the KEGG pathways are indicated in Supplemental Table 1. The

highest number of significantly different predicted pathways was seen for A-

PFP2 (25), followed by A-OB1 (19). A number of pathways clearly related to

microbial metabolism have been plotted as box-plots (Supplemental Figure 3B-

F). For A-OB1 the pathway ‘protein digestion and absorption’ was predicted to

be higher than in the other substrates (Supplemental Figure 3B). How this

relates to the negligible BCFA production is unclear. Perhaps the digested and

absorbed protein was exclusively incorporated in microbial biomass rather

than fermented. For A-PFP2 several pathways related to microbial activity were

higher than in the other samples. These included butyrate (butanoate;

_________________________________________________ Fruit by-products fermentation

141

Supplemental Figure 3C) and propionate (propanoate; Supplemental Figure

3E) metabolism, general metabolism (TCA cycle; Supplemental Figure 3F), but

also pyruvate metabolism, fatty acid metabolism, and energy metabolism;

Supplemental Table 1), and methane metabolism (Supplemental Figure 3D).

Cumulative propionate production was indeed highest on this substrate, but

this was not the case for butyrate (Table 2). Whether or not methane was

produced under these conditions was not tested. Multiple group comparison

using the Kruskal-Wallis test did not show discriminative pathways, but this is

likely due to the small dataset.

Changes in microbiota composition over time

A-OB2 fermentation in TIM-2 resulted in a more diverse microbiota

composition after 73 hours fermentation, when compared to A-OB1 and to all

other test compounds (Supplemental Figure 4). Shannon index (Supplemental

Figure 4A) and “observed OTUs” (Supplemental Figure 4B) revealed that A-OB2

was the substrate which stimulated the growth of more bacterial species

(either abundance or evenness), whereas A-OB1 and inulin presented the

lowest Shannon index and observed OTUs. Low microbial diversity is

commonly correlated with health problems (38,39). A study made with 292

obese and non-obese Danish individuals showed that according to the number

of microbial genes present in faecal samples, this population could be classified

as “low gene counts” (LGC; low diversity) and “high gene counts” (HGC; high

diversity) (40). HGC individuals had a higher prevalence of anti-inflammatory

species, like Faecalibacterium prausnitzii, as well as Akkermansia and

Bifidobacterium, whereas LGC individuals harboured more potentially pro-

inflammatory bacteria, such as Bacteroides and Ruminococcus gnavus,

commonly associated with IBD (40). Importantly, the LGC group was composed

of a significantly higher proportion of obese participants with metabolic

disturbances that could put them at increased risk for T2D and cardiovascular

disorders (40).

The effects that each test compound had on the microbiota composition, when

compared to the initial relative abundance (at t0h) and against control, is

displayed in Figure 4. Although the relative abundance of Bifidobacterium

decreased upon A-OB1 fermentation, it decreased less than the control, while

on A-OB2 it decreased more than the control. On average, the relative

abundance of the Bifidobacterium genus at the end of the experiment was

40.5% on A-OB1 and 6% on A-OB2 (Figure 5). Fermentation of both passion

fruit peels also decreased the relative abundance of Bifidobacterium when

compared to the control, with A-PFP2 decreasing more than A-PFP1 (Figure 4).

Chapter 5_________________________________________________________________________

142

At the end of the experiment, 20.7% of the genera on A-PFP1 belonged to

Bifidobacterium group, while on A-PFP2 this was 7.3% (Figure 5). Members of

the Bifidobacterium genus produce mainly acetate and lactate from mono- and

oligosaccharides (41). This group, therefore, commonly participates in cross-

feeding with other genera that are butyrate producers (such as members from

the families Lachnospiraceae and Ruminococcaceae) that release mono- and

oligosaccharides from complex carbohydrates degradations (42).

* These genera had a lower decrease when compared to the control, but did not increased over time.

Figure 4: Heatmap of percentage of changes of bacterial

taxa after 73 hours fermentation, compared to control.

Green colours represent an increase in abundance,

whereas red colours represent a decrease.

Bifidobacterium is used as biomarker for intestinal health because this genus

uses primarily carbohydrates as substrate for fermentation, as well as there are

no known pathogens in this group (43).

Both orange bagasses had a positive effect on the relative abundance of

Collinsella, increasing by 8.3% and 1.0% for A-OB1 and A-OB2, respectively.

Collinsella is able to ferment a vast range of carbohydrates and deconjugate bile

acids (41). The final relative abundance of this genus was 11.7% on A-OB1 and

_________________________________________________ Fruit by-products fermentation

143

4.5% on A-OB2 (Figure 5). A-PFP1 and A-PFP2 caused a diverse effect on the

abundance of Collinsella. While A-PFP1 induced a moderate increase (6.5%) in

this genus, A-PFP2 actually decreased by 1.9% the abundance of Collinsella. The

final abundance was 9.9% on A-PFP1 and 1.6% on A-PFP2.

Figure 5: Microbiota composition after 73 hours fermentation with the different test

compounds (% of bacterial abundance).

Chapter 5_________________________________________________________________________

144

A-OB1 and A-OB2 fermentation had different effects on abundance of the genus

Bacteroides, resulting in a small decrease (~5%), or increase (~2%),

respectively.

At the end of the experimental period, the relative abundance of Bacteroides on

A-OB2 was 7.4%, while on A-OB1 this was only 0.05% (Figure 5). Passion fruit

peels slightly stimulated (1% to 5%) the relative abundance of the genera

Bacteroides and Lachnospira. Growth with A-PFP1 and A-PFP2 at the end of the

73 hours fermentation period resulted in an average relative abundance of the

Bacteroides and Lachnospira genera of 6.9% and 9.6%, and 2.8% and 4.5%,

respectively. Spearman correlation between BCFA and OTUs revealed that

Bacteroides was positively correlated with iso-butyrate (rho=0.71, q-

value=0.03), indicating an association among the three test compounds that

generated higher amounts of this BCFA (A-OB2, A-PFP1 and A-PFP2), BCFA and

Bacteroides. Members of the Bacteroides genus, known as “generalists”, possess

a broad metabolic potential, being responsible for degrading either proteins or

complex glycans (41). They have a great repertoire of carbohydrate-active

enzymes (CAZymes) encoded by the polysaccharide utilization loci (PULs) (44).

This characteristic gives them the ability to use a plethora of polysaccharides

and therefore the advantage of fermenting different substrates that reach the

colon (45). An in vitro study in the same TIM-2 model revealed that Bacteroides

was enriched upon high protein feeding, with higher production of BCFA when

compared to a control and high carbohydrate feeding (46). As Bacteroides

species have an important role in peptide and amino acid metabolism, it is not

surprising that we found an association with the BCFA iso-butyrate. Iso-

butyrate production is the result of fermentation of the amino acid valine (47).

The relative abundance of Prevotella increased moderately after 73h

fermentation with A-OB1 (7.4%) but showed only a small increase when A-OB2

was administered (2.4%). Their final abundance was 8.6% and 3.6% for A-OB1

and A-OB2, respectively (Figure 5). Abundance of Prevotella on passion fruit

peels was negligible (<1%). Prevotella uses complex carbohydrates as substrate

for fermentation, such as pectin, resistant starch and xylan (41,48), which

might explain the higher abundance on A-OB1 that was composed of 33.6% of

pectin (Table 1). However, no association between Prevotella and xylose or

passion fruit peels, which were composed of substantial amounts of xylose,

were found (Table 1). A comparative study of intestinal microbiota from

European and rural African children revealed an enrichment of Prevotella in

African children while being completely absent in European children (48). The

diet from rural African children was rich in plant polysaccharides, such as

_________________________________________________ Fruit by-products fermentation

145

starch and fibres, and low in fat and animal protein, while the diet of European

children was high in animal protein, sugar, starch and fat, and low in fibre (48).

Faecal samples from rural African children were higher in SCFA and had higher

microbial richness and diversity, which have health-related effects (48).

Blautia decreased by 2.6% upon A-OB1 fermentation but was not affected its

relative abundance when A-OB2 was used as substrate. At t73h its final

abundance was 1.3% and 3.8% for A-OB1 and A-OB2, respectively (Figure 5).

Blautia relative abundance also decreased upon administration of passion fruit

peels (from 1% to 5%). Blautia is one of the most abundant groups present in

the human gastrointestinal tract and produces acetate from hydrogen and

carbon dioxide (41). Here Blautia was found in lower abundance than

commonly present in the human intestinal tract.

Lachnospira, Roseburia, Ruminococcus and Dialister genera were enriched only

upon fermentation of A-OB2, but not A-OB1. Spearman correlation indicated a

positive association between Ruminococcus and iso-butyrate (rho=0.69; q-

value=0.04), and between Ruminococcus and uronic acid (rho=0.87; q-

value=0.04). Fermentation of A-OB2, which increased moderately the relative

abundance of Ruminococcus, was also responsible for production of a higher

amount of iso-butyrate when compared to A-OB1. Relative abundance of

Ruminococcus after 73 hours fermentation was only 0.05% on A-OB1, but 7.4%

on A-OB2 (Figure 5). An unassigned genus within the family Ruminococcaceae

constituted an important member of the microbiota composition after both A-

OB1 (19.8%) and A-OB2 (22.1%) fermentations. A stronger effect of passion

fruit peels was observed on the genus Ruminococcus, which increased by 8.15%

and 15.65% under A-PFP1 and A-PFP2 administration, respectively. The same

unassigned genus of the Ruminococcaceae family was present in large

proportion after 73 hours fermentation of both passion fruit peels (~28%)

(Figure 5). Some species of Ruminococcus (e.g. R. bromii and R. champanellensis)

are well recognized by their ability to degrade recalcitrant fibres that reach the

colon as insoluble particles thanks to their specialized enzyme systems and

capacity to adhere to the substrate (49).

Our results corroborate other studies, where the modulation of microbial

composition and metabolism was dependent on the substrate.

Here we found that orange bagasse from different batches differentially

affected the fermentation pattern in an in vitro model of the proximal colon.

The main structural differences between A-OB1 and A-OB2 were the

Chapter 5_________________________________________________________________________

146

percentage of glucose, total carbohydrates, protein and pectin acetylation

levels. The small sample size may have hindered the detection of significant

correlation of such characteristics and certain bacterial groups. We conclude

that differences in the chemical composition of these two fibres material

affected the microbial composition and consequently the metabolites produced.

Even though the fermentation of A-OB2 resulted in higher amounts of BCFA

than A-OB1 - which is less desirable, the production of SCFA and lactate was

higher on A-OB2, indicating that this fibre was more prone to fermentation. It

remains to be clarified which chemical aspect was responsible for these

differences. Notably, besides the effects of chemical composition of fibres on the

modulation of the gut microbiota, their physical form is another dimension that

needs to be considered. For instance, different forms of resistant starch were

found to be utilized by distinct bacterial groups (7). Other features like fibre

matrix and particle size may represent important aspects to be taken into

consideration when assessing fibre modulation of the gut microbiota (7).

Bifidobacterium, Collinsella, Bacteroides, Prevotella, Blautia, Lachnospira and

Ruminococcus were the genera that showed higher differences on orange

bagasses after 73 hours fermentation. Although the final bacterial composition

after fermentation with A-OB1 presented higher abundance of the beneficial

microbes Bifidobacterium and Prevotella, A-OB2 stimulated the growth of

beneficial bacteria as well, such as Roseburia, and notably, showed a higher

compositional diversity and richness.

Isolated fibres from passion fruit peels presented a more similar chemical

composition, reflected in a similar fermentation pattern on both substrates

tested. After 73 hours fermentation, the microbial compositions on passion

fruit peels were similar, with main differences in the abundance of the genus

Bifidobacterium (20.7% - A-PFP1 and 7.3% - A-PFP2) and Collinsella (9.9% - A-

PFP1 and 1.6% - A-PFP2). A-PFP2, however, produced more SCFA (especially

acetate) and BCFA than A-PFP1. They both generated lower amounts of SCFA

than orange bagasses, control and inulin.

Degradation profiling

Constituent monosaccharide composition

Degradation profiling of a 1 gram shot of fibre of each individual test compound

was analysed throughout time through the measurement of the constituent

monosaccharide levels of the samples. With orange bagasses, the amount of

_________________________________________________ Fruit by-products fermentation

147

monosaccharides present at t50h was higher than at t49h15m and t49h30m

(not shown). These fibres were very viscous, and apparently the system needed

about 30 min to homogenise the shot. After 1 hour, the amount of

carbohydrates started to decrease, indicating bacterial degradation of fibres.

Passion fruit peels, however, presented lower viscosity which in turn facilitated

the homogenization by the system. The amount of carbohydrates present in the

system decreased immediately after the fibre shot, indicating their bacterial

utilization.

Utilization of pectic sugars (rhamnose, arabinose, galactose and uronic acid)

present in A-OB1 occurred similarly to A-OB2 (Figure 6A-B). Already after 1

hour of fibre shot it was possible to observe that pectic sugars present on side

chains (arabinose and galactose) decreased by 66% and 47.3%, respectively -

indicating fast bacterial degradation. After 6 hours from fibre shot, 70.7% of

uronic acid, 58.5% of galactose, 78.5% of arabinose and 63.9% of rhamnose

present in A-OB1 were used for bacterial fermentation (Figure 6A). Also in case

of A-OB2, uronic acid (84.6%), galactose (62.1%), arabinose (89.2%) and

rhamnose (50.2%) were used in large proportions after 6 hours of fibre shot

(Figure 6B).

Figure 6: Bacterial degradation of monosaccharides during the fermentation profiling

period (t49h-t55h) in TIM-2. A: A-OB1; B: A-OB2; C: A-PFP1; D: A-PFP2.

Chapter 5_________________________________________________________________________

148

Sugars arising from hemi(cellulose) such as xylose and glucose had a distinctive

pattern of bacterial utilization when comparing A-OB1 to A-OB2. On A-OB1,

utilization of glucose and xylose was low, since after 6 hours from fibre shot

only 23.3% and 26.3% was used, respectively. On the other hand, A-OB2

fermentation presented a high utilization of xylose and glucose. After 6 hours

from fibre shot, 84.6% of glucose and 85.9% of xylose disappeared from the

system, indicating bacterial utilization. This difference might be explained by

solubility. A-OB1 had a higher proportion of glucose and xylose present in the

insoluble fraction than A-OB2 (data not shown). Degradation of insoluble fibres

is challenging for gut microbes because it requires the adhesion of the bacteria

to the cell wall polysaccharides which have lower accessible surface area and

stronger hydrogen-bonding networks that holds the carbohydrates chain

together (50,51). Besides the difference found in solubility, A-OB2 had the

capability to stimulate the growth of the bacterial group Ruminococcus, which

was the main driver of clustering in PCoA (Figure 3). It was demonstrated that

species from the genus Ruminoccocus, present in the human gut bacterial

community, are able to degrade (hemi)cellulose (52).

Bacterial degradation of carbohydrates present in the two passion fruit peels

tested was quite similar (Figure 6C-D). Pectic sugars from A-PFP1 and A-PFP2

were used in large proportions 6 hours after the fibre shot. For instance, 88.9%

and 89.1% of uronic acid from A-PFP1 and A-PFP2, respectively, was used in a

period of 6 hours. Interestingly, glucose and xylose from hemi(cellulose) also

disappeared from the system in high proportion (88% and 92.5% on A-PFP1

and 85.1% and 87.1% on A-PFP2, respectively), indicating their utilization by

resident bacteria. Like for A-OB2, Ruminococcus was the main responsible

genus for the PCoA clustering of these samples (Figure 3) and increased after

73h fermentation period (Figure 4), and also here may explain the high

proportion of glucose and xylose degradation from passion fruit peels.

Conclusions This study revealed the potential prebiotic effect of fruit by-products in an in

vitro model of the proximal colon.

With regard to orange bagasses, although the chemical composition was similar

between the two tested samples, A-OB1and A-OB2 had a distinct fermentation

profiling. A-OB2 was more efficient in stimulating a more diverse microbial

community. The main genera stimulated by A-OB2 were Ruminococcus,

Lachnospira, Roseburia, Dialister and Bacteroides. In turn, higher diversity after

fermentation of A-OB2 was reflected in higher amounts of SCFA production

when compared to A-OB1. Fermentation of A-OB2 generated similar amounts

_________________________________________________ Fruit by-products fermentation

149

of total SCFA as inulin, our positive control. It also resulted in a smaller ratio of

acetate/propionate than A-OB1, which has been shown to have hypolipidemic

effects on the host. Additionally, analysis of degradation fate of carbohydrates

showed that A-OB2 possessed a higher proportion of soluble than insoluble

material, which might explain the differences found in fermentation profile

between the two orange bagasses. Of note, this difference was revealed only

with the analysis of degradation products during fermentation period.

Passion fruit peels fermentation resulted in smaller amounts of total SCFA

when compared to control and inulin. Their fermentation resulted in almost

negligible amounts of intermediate organic acids (lactate and succinate), which

may be a sign of slow fermentation pace, which can be beneficial for colon

health. Bacteroides, Lachnospira and Ruminococcus were the main bacterial

genera stimulated by passion fruit peels.

This study provided evidence that isolated fibres from food by-products can be

used as a tool for selective modulation of the gut microbiota. It also served to

clarify carbohydrate utilization by the resident bacteria. Further experiments,

either in vitro or in vivo, are needed to confirm our findings and to verify the

effects of these fruit by-products on host health.

Conflict of interest The authors declare that there are no conflicts of interest.

Acknowledgments We thank Prof. Dr. Thiago Cardoso de Souza from Rio Grande do Norte Federal

University – Brazil - for his assistance with R.

We also thank the companies Chá&Cia, Phytomare and Orafti that kindly

provided test compounds for the experiments. We kindly acknowledge Geraldo

Bussolo and Zélia Maria Bussolo for collecting and sending test compound

(orange bagasse) from Brazil.

The participation of volunteers that donated their faeces and made this study

possible is greatly appreciated.

We thank Prof. Lubbert Dijkhuizen from Groningen University for critically

reviewing our manuscript.

Financial support Carlota Bussolo de Souza received a PhD scholarship from CNPq (National

Council for Scientific and Technological Development) – Brazil – under the

Program “Science without Borders” (246027/2012-6).

Chapter 5_________________________________________________________________________

150

The study was funded by the Centre for Healthy Eating & Food Innovation

(HEFI) of Maastricht University – campus Venlo. This research has been made

possible with the support of the Dutch Province of Limburg.

_________________________________________________ Fruit by-products fermentation

151

References 1. Helkar P, Sahoo A, Patil N. Review: Food industry by-products used as a

functional food ingredients. Int J Waste Resour. 2016;6(3):1–6. 2. Parfitt J, Barthel M, Macnaughton S. Food waste within food supply

chains: quantification and potential for change to 2050. Philos Trans R Soc London B Biol Sci. 2010;365(1554):3065–81.

3. Martins ZE, Pinho O, Ferreira I. Food industry by-products used as functional ingredients of bakery products. Trends Food Sci Technol. 2017;67:106–28.

4. Stephen AM, Champ MM-J, Cloran SJ, Fleith M, van Lieshout L, Mejborn H, et al. Dietary fibre in Europe: current state of knowledge on definitions, sources, recommendations, intakes and relationships to health. Nutr Res Rev. 2017 Jul 5;1–42.

5. Kovatcheva-Datchary P, Zoetendal EG, Venema K, de Vos WM, Smidt H. Tools for the tract: understanding the functionality of the gastrointestinal tract. Therap Adv Gastroenterol. 2009 Jul;2(4):9–22.

6. den Besten G, van Eunen K, Groen AK, Venema K, Reijngoud DJ, Bakker BM. The role of short-chain fatty acids in the interplay between diet, gut microbiota, and host energy metabolism. J Lipid Res. 2013;54(9):2325–40.

7. Hamaker BR, Tuncil YE. A Perspective on the Complexity of Dietary Fiber Structures and Their Potential Effect on the Gut Microbiota. J Mol Biol. 2014 Nov 25;426(23):3838–50.

8. de Souza CB, Jonathan M, Saad SMI, Schols HA, Venema K. Characterization and in vitro digestibility of by-products from Brazilian food industry: cassava bagasse, orange bagasse and passion fruit peel. Bioact Carbohydrates Diet Fibre. 2018; (16):90-99.

9. Venema K, Nuenen M van, Smeets-Peeters M, Minekus M, Havenaar R. TNO’s in vitro large intestinal model: an excellent screening tool for functional food and pharmaceutical research. Ernährung Nutr. 2000;24(12):559–64.

10. Rehman A, Heinsen F-A, Koenen ME, Venema K, Knecht H, Hellmig S, et al. Effects of probiotics and antibiotics on the intestinal homeostasis in a computer controlled model of the large intestine. BMC Microbiol. 2012;12(1):47.

11. Aguirre M, Eck A, Koenen ME, Savelkoul PHM, Budding AE, Venema K. Evaluation of an optimal preparation of human standardized fecal inocula for in vitro fermentation studies. J Microbiol Methods. 2015 Oct;117:78–84.

12. Aguirre M, Ramiro-Garcia J, Koenen ME, Venema K. To pool or not to pool? Impact of the use of individual and pooled fecal samples for in vitro fermentation studies. J Microbiol Methods. 2014;107C:1–7.

13. Maathuis AJ, van den Heuvel EG, Schoterman MH, Venema K. Galacto-oligosaccharides have prebiotic activity in a dynamic in vitro colon model using a (13)C-labeling technique. J Nutr. 2012;142(7):1205–12.

Chapter 5_________________________________________________________________________

152

14. Ramasamy US, Venema K, Gruppen H, Schols HA. The fate of chicory root pulp polysaccharides during fermentation in the TNO in vitro model of the colon (TIM-2). Bioact Carbohydrates Diet Fibre. 2014;4(1):48–57.

15. Ramasamy US, Gruppen H, Schols HA. Structural and water-holding characteristics of untreated and ensiled chicory root pulp. J Agric Food Chem. 2013 Jun;61(25):6077–85.

16. Thibault JF. Automated-method for the determination of pectic substances. Leb Technol. 1979;12(5):247–51.

17. Caporaso JG, Kuczynski J, Stombaugh J, Bittinger K, Bushman FD, Costello EK, et al. QIIME allows analysis of high-throughput community sequencing data. Vol. 7, Nature methods. United States; 2010. p. 335–6.

18. R Core Team. A language and environment for statistical computing. R Foundation for Statistical Computing. 2013.

19. Segata N, Izard J, Waldron L, Gevers D, Miropolsky L, Garrett WS, et al. Metagenomic biomarker discovery and explanation. Genome Biol. 2011 Jun;12(6):R60.

20. Langille MGI, Zaneveld J, Caporaso JG, McDonald D, Knights D, Reyes JA, et al. Predictive functional profiling of microbial communities using 16S rRNA marker gene sequences. Nat Biotechnol. 2013 Sep;31(9):814–21.

21. Parks DH, Tyson GW, Hugenholtz P, Beiko RG. STAMP: statistical analysis of taxonomic and functional profiles. Bioinformatics. 2014 Nov;30(21):3123–4.

22. Russell WR, Hoyles L, Flint HJ, Dumas M-E. Colonic bacterial metabolites and human health. Curr Opin Microbiol. 2013 Jun;16(3):246–54.

23. Koh A, De Vadder F, Kovatcheva-Datchary P, Bäckhed F. From dietary fiber to host physiology: short-chain fatty acids as key bacterial metabolites. Cell. 2016 Jun 2;165(6):1332–45.

24. Flint HJ, Duncan SH, Louis P. 2 - Gut microbial ecology BT - Designing functional foods. In: Woodhead Publishing Series in Food Science, Technology and Nutrition. Woodhead Publishing; 2009. p. 38–67.

25. da Silva JK, Cazarin CBB, Bogusz Junior S, Augusto F, Maróstica Junior MR. Passion fruit (Passiflora edulis) peel increases colonic production of short-chain fatty acids in Wistar rats. LWT - Food Sci Technol. 2014;59(2, Part 2):1252–7.

26. Bolca S, Van de Wiele T, Possemiers S. Gut metabotypes govern health effects of dietary polyphenols. Curr Opin Biotechnol. 2013 Apr;24(2):220–5.

27. Delzenne NM, Williams CM. Prebiotics and lipid metabolism. Curr Opin Lipidol. 2002 Feb;13(1):61–7.

28. Demigne C, Morand C, Levrat MA, Besson C, Moundras C, Remesy C. Effect of propionate on fatty acid and cholesterol synthesis and on acetate metabolism in isolated rat hepatocytes. Br J Nutr. 1995 Aug;74(2):209–19.

29. Lopez HW, Levrat-Verny MA, Coudray C, Besson C, Krespine V, Messager A, et al. Class 2 resistant starches lower plasma and liver lipids and

_________________________________________________ Fruit by-products fermentation

153

improve mineral retention in rats. J Nutr. 2001 Apr;131(4):1283–9. 30. Delzenne NM, Cani PD. Interaction between obesity and the gut

microbiota: relevance in nutrition. Annu Rev Nutr. 2011;31:15–31. 31. Koenen ME, Cruz Rubio JM, Mueller M, Venema K. The effect of agave

fructan products on the activity and composition of the microbiota determined in a dynamic in vitro model of the human proximal large intestine. J Funct Foods. 2016;22:201–10.

32. Macfarlane GT, Macfarlane S. Bacteria, colonic fermentation, and gastrointestinal health. J AOAC Int. 2012;95(1):50–60.

33. Ou J, DeLany JP, Zhang M, Sharma S, O’Keefe SJD. Association between low colonic short-chain fatty acids and high bile acids in high colon cancer risk populations. Nutr Cancer. 2012;64(1):34–40.

34. Khodaei N, Fernandez B, Fliss I, Karboune S. Digestibility and prebiotic properties of potato rhamnogalacturonan I polysaccharide and its galactose-rich oligosaccharides/oligomers. Carbohydr Polym. 2016;136:1074–84.

35. Geypens B, Claus D, Evenepoel P, Hiele M, Maes B, Peeters M, et al. Influence of dietary protein supplements on the formation of bacterial metabolites in the colon. Gut. 1997 Jul;41(1):70–6.

36. Aguirre M, Jonkers DMAE, Troost FJ, Roeselers G, Venema K. In vitro characterization of the impact of different substrates on metabolite production, energy extraction and composition of gut microbiota from lean and obese subjects. PLoS One. 2014;9(11):e113864.

37. Sáyago-Ayerdi SG, Zamora-Gasga VM, Venema K. Prebiotic effect of predigested mango peel on gut microbiota assessed in a dynamic in vitro model of the human colon (TIM-2). Food Res Int. 2017;

38. Le Chatelier E, Nielsen T, Qin J, Prifti E, Hildebrand F, Falony G, et al. Richness of human gut microbiome correlates with metabolic markers. Nature. 2013;500(7464):541–6.

39. Cotillard A, Kennedy SP, Kong LC, Prifti E, Pons N, Le Chatelier E, et al. Dietary intervention impact on gut microbial gene richness. Nature. 2013;500(7464):585–8.

40. Le Chatelier E, Nielsen T, Qin J, Prifti E, Hildebrand F, Falony G, et al. Richness of human gut microbiome correlates with metabolic markers. Nature. 2013;500(7464):541–6.

41. Rajilić-Stojanović M, de Vos WM. The first 1000 cultured species of the human gastrointestinal microbiota. FEMS Microbiol Rev. 2014;38(5):996–1047.

42. Flint HJ, Scott KP, Duncan SH, Louis P, Forano E. Microbial degradation of complex carbohydrates in the gut. Vol. 3, Gut Microbes. 2012. p. 289–306.

43. Macfarlane S, Macfarlane GT, Cummings JH. Review article: Prebiotics in the gastrointestinal tract. Aliment Pharmacol Ther. 2006;24(5):701–14.

44. Martens EC, Koropatkin NM, Smith TJ, Gordon JI. Complex glycan catabolism by the human gut microbiota: the Bacteroidetes Sus-like

Chapter 5_________________________________________________________________________

154

paradigm. J Biol Chem. 2009 Sep;284(37):24673–7. 45. Martens EC, Kelly AG, Tauzin AS, Brumer H. The devil lies in the details:

How variations in polysaccharide fine-structure impact the physiology and evolution of gut microbes. J Mol Biol. 2014;426(23):3851–65.

46. Aguirre M, Eck A, Koenen ME, Savelkoul PHM, Budding AE, Venema K. Diet drives quick changes in the metabolic activity and composition of human gut microbiota in a validated in vitro gut model. Res Microbiol. 2016;167(2):114–25.

47. Vidal-Lletjos S, Beaumont M, Tome D, Benamouzig R, Blachier F, Lan A. dietary protein and amino acid supplementation in inflammatory bowel disease course: what impact on the colonic mucosa? Nutrients. 2017 Mar;9(3).

48. De Filippo C, Cavalieri D, Di Paola M, Ramazzotti M, Poullet JB, Massart S, et al. Impact of diet in shaping gut microbiota revealed by a comparative study in children from Europe and rural Africa. Proc Natl Acad Sci U S A. 2010 Aug;107(33):14691–6.

49. Flint HJ, Duncan SH, Louis P. The impact of nutrition on intestinal bacterial communities. Curr Opin Microbiol. 2017 Aug;38:59–65.

50. Cockburn DW, Koropatkin NM. Polysaccharide Degradation by the intestinal microbiota and its influence on human health and disease. J Mol Biol. 2016 Aug 14;428(16):3230–52.

51. Lynd LR, Weimer PJ, van Zyl WH, Pretorius IS. Microbial cellulose utilization: fundamentals and biotechnology. Microbiol Mol Biol Rev. 2002 Sep;66(3):506–77.

52. Chassard C, Delmas E, Robert C, Lawson PA, Bernalier-Donadille A. Ruminococcus champanellensis sp. nov., a cellulose-degrading bacterium from human gut microbiota. Int J Syst Evol Microbiol. 2012 Jan;62(Pt 1):138–43.

_________________________________________________ Fruit by-products fermentation

155

Supplemental material

Supplemental Figure 1: TIM-2 system. A) peristaltic compartments with a dialysis

membrane inside that removes microbial metabolites and supplies the system with

liquid dialysate, B) pH sensor, C) NaOH secretion for pH maintenance, D) dialysate

system (D1-dialysate in, D2-dialysate out), E) level sensor, F) gaseous N2 inlet to keep

the system anaerobic, G) gas outlet, H) sampling port, I) feeding syringe with test

compound, J) temperature sensor to maintain the system at body temperature (37 °C).

Adapted from (10).

Chapter 5_________________________________________________________________________

156

Supplemental Figure 2: Boxplot (A) and corresponding heatmap (B) for the top 10

OTUs driving the differences found in samples.

_________________________________________________ Fruit by-products fermentation

157

Supplemental Figure 3: A: LEfSe with the different test compounds showing which bacterial groups were significantly different among samples. A-PFP1 does not appear because it did not show a specific different microorganism from the other test compounds. B-F: Selected box-plots created with STAMP of PICRUSt-predicted KEGG pathways specific for A-OB1 (B: protein digestion and absorption), and A-PFP2 (C: butyrate metabolism, D: methane metabolism, E: propionate metabolism and F: TCA cycle).

Chapter 5_________________________________________________________________________

158

Supplemental Figure 4: A: Shannon index at t73h with test

compounds. Fermentation of A-OB2 resulted in the highest

diversity in bacterial population, whereas A-OB1 showed the least

diverse composition. B: Observed OTUs at time 73hs with test

compounds. A-OB2 had the highest number of observed OTUs.

_________________________________________________ Fruit by-products fermentation

159

Supplemental Table 1: Predicted KEGG pathways based on observed OTUs in the

different TIM-2 samples from fermentation experiments with AIS fractions of the

different food-by-products.

Predicted KEGG pathways mean rel. freq,

(%)

mean rel. freq, (%)

p-values p-values (Bonferroni corrected)

A-OB1 vs. the other three substrates (A-OB2, A-PFP1 and A-PFP2)

A-OB1 All other samples

African trypanosomiasis 0.024 0.009 2.59E-05 0.008

Cell cycle - Caulobacter 0.536 0.504 2.85E-05 0.009 Chagas disease (American trypanosomiasis) 0.022 0.008 3.52E-05 0.012

D-Alanine metabolism 0.121 0.106 7.17E-05 0.024

Function unknown 1.228 1.164 5.92E-06 0.002 Isoquinoline alkaloid biosynthesis 0.058 0.045 2.53E-06 8.29E-04 Nicotinate and nicotinamide metabolism 0.542 0.464 2.78E-05 0.009

Nucleotide excision repair 0.507 0.428 1.15E-05 0.004

One carbon pool by folate 0.667 0.637 7.30E-05 0.024

Peptidoglycan biosynthesis 0.931 0.859 2.83E-06 0.001

Prenyltransferases 0.351 0.308 2.43E-06 0.001 Protein digestion and absorption 0.030 0.013 1.02E-06 3.33E-04

Pyrimidine metabolism 2.050 1.870 3.17E-07 1.04E-04

Ribosome 2.799 2.454 2.42E-06 7.95E-04 Ribosome biogenesis in eukaryotes 0.077 0.057 2.39E-05 0.008

RNA polymerase 0.199 0.171 3.42E-05 0.011

Transcription factors 1.774 1.863 2.41E-05 0.008 Ubiquinone and other terpenoid-quinone biosynthesis 0.139 0.082 1.15E-07 3.77E-05

Ubiquitin system 0.023 0.009 4.21E-05 0.014 A-OB2 vs. the other three substrates (A-OB1, A-PFP1 and A-PFP2)

A-OB2 All other samples

Lysine biosynthesis 0.882 0.937 7.19E-06 0,002

Chapter 5_________________________________________________________________________

160

A-PFP1 vs. the other three substrates (A-OB1, A-OB2 and A-PFP2)

A-PFP1 All other samples

Biosynthesis and biodegradation of secondary metabolites 0.067 0.053 3.59E-05 0.012

Carotenoid biosynthesis 0.001 0.003 5.77E-05 0.019

Phenylpropanoid biosynthesis 0.148 0.203 9.55E-05 0.031 A-PFP2 vs. the other three substrates (A-OB1, A-OB2 and A-PFP1)

A-PFP2 All other samples

Butanoate metabolism 0.639 0.553 4.86E-05 0.016 Carbon fixation pathways in prokaryotes 0.988 0.829 9.21E-07 3.02E-04

Citrate cycle (TCA cycle) 0.554 0.434 2.97E-06 9.74E-04

Energy metabolism 0.938 0.792 5.41E-06 0.002

Ethylbenzene degradation 0.050 0.032 1.03E-05 0.003

Fatty acid biosynthesis 0.518 0.411 5.89E-06 0.002

Insulin signalling pathway 0.112 0.095 0.000148 0.048

Linoleic acid metabolism 0.083 0.059 5.89E-06 0.002

Lipid biosynthesis proteins 0.621 0.551 3.54E-06 1.16E-03

Methane metabolism 1.387 1.201 2.23E-05 0.007

Mismatch repair 0.854 0.804 1.14E-05 0.004

Pathways in cancer 0.054 0.040 1.59E-05 0.005

Phenylalanine metabolism 0.179 0.150 5.74E-06 0.002

Phenylpropanoid biosynthesis 0.148 0.203 8.58E-05 0.028

Primary bile acid biosynthesis 0.028 0.044 4.00E-07 0.000

Propanoate metabolism 0.537 0.460 5.40E-05 0.018

Protein export 0.629 0.594 7.54E-05 0.025 Proximal tubule bicarbonate reclamation 0.022 0.008 3.81E-07 1.25E-04

Pyruvate metabolism 1.122 0.992 1.63E-06 5.35E-04

Renal cell carcinoma 0.010 0.002 0.000104 0.034 RIG-I-like receptor signalling pathway 0.004 0.002 0.000101 0.033 Secondary bile acid biosynthesis 0.028 0.044 3.90E-07 1.28E-04

Starch and sucrose metabolism 1.106 1.263 1.95E-06 6.38E-04

Tetracycline biosynthesis 0.167 0.109 2.12E-05 0.007

Transcription machinery 1.099 0.939 2.54E-05 0.008

Chapter 6 The gut microbiota from lean and obese

subjects contribute differently to the fermentation of arabinogalactan and

inulin

Published as:

Aguirre M, De Souza CB, Venema K. The gut microbiota from lean and obese

subjects contribute differently to the fermentation of arabinogalactan and

inulin. PLoS One. 2016 Jul 1;11 (7).

10.1371/journal.pone.0159236

Chapter 6_________________________________________________________________________

162

Abstract An aberrant metabolic activity or a compositional alteration of the gut

microbiota has been proposed as a factor that makes us more prone to disease.

Therefore, we explored the effect of two dietary fibres (arabinogalactan and

inulin) on the microbiota from lean and obese subjects during 72 h in vitro

fermentation experiments using the validated TNO dynamic in vitro model of the

proximal colon: TIM-2. Metabolically, arabinogalactan fermentation showed a

higher production of propionate (45.2 mmol) when compared to n-butyrate

(19.1 mmol) in the obese microbiota fermentations. In general, lean microbiota

produced more n-butyrate from the fermentation of both substrates when

compared to the obese microbiota. Furthermore, the obese microbiota extracted

more energy from the fermentation of both fibres – 46.9 kcal by the obese

microbiota versus 44.6 kcal by the lean microbiota when using inulin, and 40.5

kcal by the obese microbiota versus 37.3 kcal by the lean microbiota when using

arabinogalactan as substrate. Compositionally, bacteria belonging to Gemmiger,

Dorea, Roseburia, Alistipes, Lactobacillus and Bifidobacterium genera were found

to be highly abundant or stimulated by the prebiotics in the lean microbiota

suggesting a potential role in leanness. Furthermore, a significant correlation

between known butyrogenic strains including B. adolescentis, an unclassified

Bifidobacterium and F. prausnitzii with this metabolite in the fermentation of

inulin in both microbiotas was found. Although supplementary in vivo studies are

needed, the current study provides more evidence for the consumption of

specific ingredients with the aim of modulating the gut microbiota in the context

of obesity.

_____________________ Lean vs obese: arabinogalactan and inulin fermentation

163

Introduction The discovery of the potential impact of the gut microbiota on human health and

disease has fuelled research on characterizing the role that this community plays

in the causality or prevention of many diseases elicited by dangerous lifestyles

such as sedentary and bad eating habits, among others (1,2).

Part of the efforts have been focused on identifying a balanced and thus, healthy

community (3). Though provocative, it is difficult to define a “most desirable”

composition for the human gut microbiota. Reports providing contradictory

findings, due to either i) a large inter-individual variation or ii) the application of

different analytic methods, are at the order of the day. However, another factor

that seems to play an important role in influencing health and disease, besides

the community composition, is the interaction of the microbial metabolites with

the host. The fermentation of dietary fibre by the gut microbiota leads primarily

to the production of short-chain fatty acids (SCFA; mainly acetate, propionate

and butyrate) and the gases hydrogen, methane and carbon dioxide (4).

Furthermore, branched-chain fatty acids (BCFA; mainly iso-butyrate and iso-

valerate often accompanied by phenol and ammonia production) are also

produced to a lesser extent but these mostly originate from protein fermentation

(5). A proposed mechanism by which fibre may protect us against obesity is

based on the beneficial effects that such metabolites have on host energy balance,

e.g. by mediating the secretion of gut hormones involved in the regulation of

energy metabolism and food intake (including leptin, peptide YY and glucagon-

like peptide-1) (6,7). Thus, it may be tempting to say that high intake of fibre

would be a way to reduce the risk of obesity (8,9). After all, it is estimated that

the production of SCFA by the microbiota accounts for 5 to 10% of total dietary

energy requirements in humans (10). However, recent research has questioned

such risk-reduction role. There is growing evidence indicating that the

production of SCFA differs between the microbiota originating from obese and

lean individuals (hereafter referred to as obese and lean microbiota). Such

difference lies in the fact that the obese microbiota may produce more SCFA

which could be translated into more energy extraction from diet (11,12). As a

consequence, more energy extracted from diet may be stored as fat, promoting

weight gain of the host. Such mechanisms place fibre fermentation by the gut

microbiota as a causative factor in obesity. Still, as previously remarked, there is

a lack of consistency, different studies show contrasting results by finding either

no correlation between fibre and weight gain/obesity, a reverse trend or effects

to be substrate dependent (12–14). Vast amounts of research are needed to

answer the chicken or the egg causality dilemma before any strategy can be

designed with the aim of manipulating the gut microbiota in the context of

Chapter 6_________________________________________________________________________

164

obesity. Currently, there are a limited number of in vitro fermentation

experiments mimicking the fermentation of different substrates by human obese

or lean microbiota. So far, these studies have provided evidence about the

metabolic adaptation of the microbiota in relation to different nutrient loads or

single testing of specific prebiotics, as well as the plasticity of the microbiota in

configuring the structure of the community in response to these kind of

interventions (13,15–19). Importantly, these studies have also endorsed in vitro

systems as tools facilitating the medium to high-throughput validation of

multiple hypotheses at lower costs with no ethical constraints when compared

to human or animal studies.

The purpose of the current study was to compare the profiles of fermentation of

arabinogalactan (AG) and the well-studied prebiotic inulin (IN) by obese or lean

microbiota. Both AG and IN are natural polysaccharides commonly found in

foods. They have been found to be fermented by human intestinal bacteria and

stimulate the production of SCFA and the growth of specific bacteria generally

believed to be beneficial to the host (20–23). AG is an interesting compound to

evaluate not only because its potential to improve gut barrier function (22) but

also because it has been observed that it may induce production of (both pro and

anti- inflammatory) cytokines (24,25), factors which both may play an important

role in inflammation. In the context of obesity, low grade inflammation has been

suggested to contribute to the development of insulin and leptin resistance (26).

In order to compare the two compounds, we performed 72h fermentation

experiments in the validated TNO dynamic in vitro model of the proximal colon

(TIM-2), which was inoculated with either obese or lean microbiota. The present

work brings evidence about how fermentable carbohydrates are differently used

by the microbiota from lean and obese subjects which contributes to the

understanding on how dietary compounds could be used as therapeutic tools in

obesity.

Materials and Methods

Gut microbiota The inocula used for the TIM-2 experiments consisted of an active, pooled faecal

microbiota prepared from: i) 8 healthy lean volunteers (male: n = 4, female: n =

4, average age = 31 years (range: 25–42), BMI = 20 ± 1.5 kg/m2); ii) 7 healthy

obese volunteers (male: n = 3, female: n = 4, average age = 51 years (range: 29–

68), BMI = 32 ± 1.2 kg/m2. We have previously shown that pooling does not result

in an aberrant microbiota composition or activity (27). The exclusion criteria for

lean and obese volunteers included the use of antibiotics during the preceding 3

_____________________ Lean vs obese: arabinogalactan and inulin fermentation

165

months, gastrointestinal disease, severe chronic disease or food allergy and

intake of probiotics and prebiotics.

Whole faecal samples were self-collected in a container kit that was maintained

under anaerobiosis by using anaerobic packs (AnaeroGenTM, Oxoid, Cambridge,

UK). A sample aliquot (100 mg) from each individual donation was collected in

an anaerobic cabinet (80% N2, 10% CO2, 10% H2), snap-frozen in liquid nitrogen

(-196 oC) and stored at -80 oC for measurement of metabolites (SCFA and BCFA).

Faeces were homogenized under anaerobic conditions as described by Aguirre

et al. (28). The resulting culture homogenate was aliquoted and snap-frozen in

liquid nitrogen. This microbiota was stored at -80 oC before inoculation in TIM-

2.

Gut fermentation experiments The TIM-2 system was flushed with N2 prior to the introduction of the inoculum

for 3 h and it was maintained under this condition at 37 °C for 96 h with the pH

kept at or above 5.8 by automatic titration with 2M NaOH. A 30 ml portion of

culture homogenate was used to inoculate the units for each experiment. The

microbiota was left to adapt (16 h) to the new environment after inoculation and

during this period the basal simulated ileal efflux medium (SIEM) was gradually

introduced into the system in a total volume of 40 ml. After the adaptation, the

culture was deprived from any medium for 2 h (starvation). A volume of 180 ml

of the different diets and control was administrated over the 72 h of the test

period at a rate of 2.5 ml/h.

In order to remove water and fermentation products from the lumen, a dialysate

system (described in detail by van Nuenen et al. (29)), consisting of a semi-

permeable hollow membrane, ran through the lumen. For all the experiments,

the speed of the dialysis fluid was set at 1.5 ml/ min.

After 24 and 48 h of fermentation 25 ml of lumen sample was removed from the

system to mimic the transit of material from the proximal and reaching the distal

colon (30). Luminal and dialysate samples were taken after t = 0, 24, 48 and 72

h. In all cases samples were snap-frozen in liquid nitrogen and stored (-80 °C)

until analysis.

Fermentation media During the adaptation period (16 h) all TIM-2 units were fed with SIEM as

described by Maathuis et al. (31). After the 2h starvation period, the units were

fed with preparations which were made containing approximately 7.5 g of AG or

IN instead of the standard carbohydrates in SIEM. The specific AG used in this

study was (+)-Arabinogalactan- from larch wood (Sigma-Aldrich, St Louis, USA)

Chapter 6_________________________________________________________________________

166

with a molecular weight ranging from 72–92 kDa and ≥ 84.8% purity. The IN

tested had an average degree of polymerization (DP) of 9; 84.9% > DP5 (Sensus,

Frutafit® IQ, Roosendaal, the Netherlands). Control experiments were performed

in parallel to the experiments testing either AG or IN. SIEM was used to feed the

microbiota in such controls.

Analysis of SCFA (acetate, propionate, and n-butyrate) and BCFA (iso-butyrate and iso-valerate) Samples were prepared and analyzed as described previously (13). Before

centrifuging, the faecal aliquots from the individuals were suspended in PBS (1:1;

w:w). Briefly, both suspended aliquots and TIM-2 luminal samples were

centrifuged (12.000 rpm at 4 °C for 10 min). To the clear supernatant a mixture

of formic acid (20%), methanol and 2-ethyl butyric acid (internal standard, 2

mg/ml in methanol) was added. A 3 μl sample with a split ratio of 75.0 was

injected on a GC-column (ZB-5HT inferno, ID 0.52 mm, film thickness 0.10 um;

Zebron; phenomenex, USA) in a Shimadzu GC-2014 gas chromatograph.

Standard curves were obtained by injecting calibrated quantities of a blend of

volatile fatty acids and amounts were calculated from the graph obtained

correlating peak height and time measured (all reagents from Sigma-Aldrich

with the exception of formic acid which was from Merck).

Energy extraction Energy extraction in the form of SCFA was calculated using the following values

of kJ mol-1 for acetate, propionate and n-butyrate respectively: 874, 1536 and

2192 (32,33).

Characterization of bacterial populations RNA was isolated from luminal samples using standard molecular biology kits

from ZYMO Research (Zymo Research Co., CA, USA) following manufacturer’s

instructions. Reverse-transcriptase amplification of the 16S rRNA gene (V3-V4),

barcoding and library preparation (1st step PCR and 2nd PCR) were performed

by BaseClear, Leiden, the Netherlands.

Short paired-end sequence reads were generated using the Illumina MiSeq

system and converted into FASTQ files using the BCL2FASTQ pipeline version

1.8.3. Quality trimming was applied based on Phred quality scores. Subsequently,

the Illumina paired reads were merged into single reads (so-called pseudoreads)

through sequence overlap (16S rRNA V3-V4 region of about 500bp). Chimeric

pseudoreads were removed and the remaining reads were aligned to a

combination of the GreenGenes and RDP 16S gene databases (34,35). Based on

_____________________ Lean vs obese: arabinogalactan and inulin fermentation

167

the alignment scores of the pseudoreads, the taxonomic classes were assigned

by associating each pseudoread to the best matching Operational Taxonomic

Unit (OTU). The taxonomic depth of the lineage was based on the identity

threshold of the rank; Species 99%, Genus 97%, Family 95%, Order 90%, Class

85%, Phylum 80%.

Data analysis The experiments were performed in series of two per tested substrate (n=2).

These replicates were conducted for each microbiota (i.e. lean or obese). To avoid

unnecessary repetition, this is not indicated further in the text or graphs in the

results section. Results are displayed as average of these duplicates. For

simplicity of reading, substrates in the following sections are tagged with the

letter L or O (e.g. substrate-L, substrate-O) in order to refer to the fermentation

experiments using the inoculum from lean (-L) or obese (-O) subjects.

Statistical analyses for determining the differences in metabolite production and

energy extraction in the faecal samples from each individual were performed

(SPSS for Windows, version 21, SPSS, Chicago, US). Comparison between the two

groups (lean and obese) was performed using t-test with significance p<0.05.

For the calculation of fold compositional changes, the ratio between a sampling

time point and t0 was calculated (i.e., t72/t0). Then the ratio for this value and

the control was then determined to obtain fold changes compared to control. A

value equal to 1 indicates no change; a value of >1 indicates an increase; and a

value of <1 indicates a decrease of the respective microbial genera.

A correlation analysis was performed in order to test if the metabolites measured

would positively or negatively correlate with the different bacterial groups fed

with either AG or IN. To these means, differentially abundant bacterial species

growing on the different tested substrates were calculated from a ratio based

from the specific growth of the species found on each substrate and the control.

Spearman correlations were calculated between the ratio of the species

identified as being differentially abundant and the measured amounts of

metabolites produced (SPSS for Windows, version 21, SPSS, Chicago, US).

Correlations were considered significant at the 0.01 level (2-tailed).

Ethics Statement Studies using faecal donations from healthy volunteers do not require medical

ethical committee approval in the Netherlands since they are considered as non-

invasive. However, volunteers who donated the inoculum were informed prior

to initiating the study and their participation was considered after providing a

signed informed consent. The group of obese donors were recruited at

Chapter 6_________________________________________________________________________

168

Maastricht University Medical Center (the Netherlands). These were patients

from the university medical center who voluntarily responded to a recruiting call

inviting to donate their faeces. The group of lean donors were recruited at TNO

(the Netherlands). These participants responded to an advertisement inviting

subjects to voluntarily collect their faeces. Bouke Salden and Carlota Bussolo de

Souza personally collected the faecal samples from the participants who

exclusively donated their faeces for the present study. Bouke Salden received the

faecal samples directly from the obese participants and none of the authors was

involved in the direct collection of these samples. Carlota Bussolo de Souza

received the faecal samples directly from the lean participants. The origins of the

both lean and obese faecal donations were blinded using a code whose identity

was known only by the responsible scientist (Carlota Bussolo de Souza, co-

author of the present study). Results in this manuscript are referred to an

individual sample or a pooled faecal inoculum and do not directly refer to a

particular person.

Results

Screening of metabolites and energy extraction in faeces from the volunteers The average amount of SCFA found in the faeces from lean and obese subjects

were not statistically different (259.6 ± 100.2 mmol/kg and 215.1 ± 66.9

mmol/kg, respectively). However, it was clear that there was a great inter-

individual difference regarding the amount of each SCFA in both groups (Table

S1). When comparing the presence of each SCFA and the amount of energy they

contained, no statistically significant differences were found.

BCFA were higher in the faeces from lean volunteers (p<0.05). On average, faeces

of lean subjects contained 7.88 ± 2.54 mmol/kg of iso-butyrate and 11.45 ± 3.64

mmol/kg of i-valerate, while obese subjects produced on average had 3.11 ± 1.98

mmol/kg of i-butyrate and 4.85 ± 2.92 mmol/kg of i-valerate. BCFA amounts also

presented a great inter-individual difference among subjects.

Fermentation experiments with lean and obese microbiota

Microbial activity Total SCFA production was higher in fermentations using the obese microbiota

when compared to the lean (Figure 1). Fermentation kinetics in terms of SCFA

production observed from both inocula differed in AG, IN and control

experiments. Fermentation of AG showed major differences in propionate and n-

_____________________ Lean vs obese: arabinogalactan and inulin fermentation

169

butyrate production compared to the other fermentations, with propionate even

higher than n-butyrate in the obese microbiota fermentations. In general, n-

butyrate production was higher in the lean fermentations for all substrates when

compared to obese, while propionate was observed to be higher in the

fermentations with the obese microbiota when compared to lean.

Figure 1: Cumulative production of SCFA (mmol) during the 72 h of fermentation of the

tested substrates.

Table 1 shows the cumulative production of BCFA after 72 h of fermentation of

AG, IN and control. Lean microbiota produced more BCFA from AG fermentation

and less from IN than control. For AG this was also observed in the obese

microbiota. The values from the obese fermentations were lower when

compared to lean for control and AG, but not for IN.

Table 1: Cumulative production of BCFA (mmol) after 72 h of fermentation of AG, IN and

control.

Lean Obese

i-butyrate i-valerate Total i-butyrate i-valerate Total

AG 1.62±0.66 2.32±0.08 3.94±0.75 0.55±0.36 1.59±0.38 2.13±0.74

IN 0.22±0.2 1.23±0.15 1.45±0.35 0.45±0.07 1.49±0.08 1.94±0.15

Control 0.74±0.14 1.99±0.4 2.73±0.27 0.44±0.28 1.22±0.06 1.66±0.22

Chapter 6_________________________________________________________________________

170

Energy extraction The microbiota from obese volunteers fermenting AG and IN extracted (slightly)

more energy when compared to the lean fermentations, in accordance with the

higher SCFA production. Controls remained quite similar with respect to energy

extraction (Figure 2).

Figure 2: Energy extraction (kJ) - Values for the individual SCFA and the sum (total)

obtained after 72h fermentation experiments of AG, IN and control using lean or obese

microbiota.

Compositional changes By calculating L/O ratios (at the genus level), it was found that the lean

microbiota had an increased relative abundance of Faecalibacterium (75 fold),

Dorea (30 fold), Roseburia (6 fold), Blautia (3 fold) when compared to the obese

microbiota (Table S2; for more information about the starting inocula refer to

Figure S1).

The fermentation of AG and IN resulted in the growth or decrease of specific

genera. Table 2 (AG) and Table 3 (IN) show the effects observed in the different

microbiotas per substrate tested, compared to the control.

_____________________ Lean vs obese: arabinogalactan and inulin fermentation

171

Table 2: Relative change of bacterial genera after 72h of fermentation experiments of

arabinogalactan in TIM-2 compared to control.

Genus Arabinogalactan

Lean Obese

Lactobacillus 0.49 2.56

Enterococcus 0.51 1.65

Unclassified 0.99 2.24

Escherichia 1.11 0.98

Unclassified Clostridiaceae 0.37 1.29

Unclassified Lactobacillaceae 0.25 3.70

Unclassified Enterococcaceae 0.55 1.39

Shigella 0.57 1.57

Faecalibacterium 0.35 1.53

Bacteroides 1.33 20.47

Eubacterium 0.54 2.95

Unclassified Enterobacteriaceae 2.78 1.18

Unclassified Eubacteriaceae 0.86 137.78

Weissella 74.12 0.00

Collinsella 1.63 0.01

Pseudomonas 0.88 1.34

Blautia 0.84 1.95

Turicibacter 0.21 1.58

Dorea 0.95 14.16

Unclassified Bacteroidaceae 1.19 13.97

Fusicatenibacter 0.03 16.98

Parabacteroides 0.31 10.11

Unclassified Peptostreptococcaceae 0.65 3.22

Chapter 6_________________________________________________________________________

172

Table 3: Relative change of bacterial genera after 72h of fermentation experiments of

inulin in TIM-2 compared to control.

Genus Inulin

Lean Obese Bifidobacterium 0.77 1.96 Lactobacillus 0.15 1.08 Unclassified 0.83 2.57 Unclassified Bifidobacteriaceae 1.09 1.83 Unclassified Lactobacillaceae 0.15 1.57 Faecalibacterium 0.97 2.70 Bacteroides 2.84 0.89 Collinsella 1.10 0.36 Unclassified Ruminococcaceae 0.98 3.27 Unclassified Coriobacteriaceae 9.06 0.69 Blautia 0.49 4.53 Unclassified Bacteroidaceae 2.62 0.88 Fusicatenibacter 0.21 27.99 Unclassified Lachnospiraceae 0.73 2.50

Arabinogalactan Genera that increased after the fermentation of AG by the obese microbiota but

decreased in the experiments with the lean microbiota are the well-studied:

Lactobacillus (3 vs 0.49 fold), Dorea (14 vs 0.95 fold), Fusinibacter (17 vs 0.03

fold), Parabacteroides (10 vs 0.31 fold), Faecalibacterium (2 vs 0.35 fold), and

Blautia (2 vs 0.84 fold). At the species level the growth of B. longum was

stimulated in the fermentation with the lean microbiota while it decreased in the

obese (2 vs 0.21 fold, respectively; Table S3) this effect was opposite for L.

mucosae (0.50 vs 2 fold, respectively). When compared to the control, B. caccae

and B. thetaiotaomicron notably increased in the lean microbiota (44 and 7 fold,

respectively) whilst the growth of L. gasseri (12 fold) was stimulated in the

fermentations with the obese microbiota.

Inulin

After the fermentation of IN by the obese microbiota an increase in

Bifidobacterium (2 vs 0.8 fold), Faecalibacterium (3 vs 0.97 fold), Blautia (5 vs

0.5 fold) and Fusicatenibacter (28 vs 0.2 fold) was observed with respect to the

lean microbiota. The fermentation of IN promoted the growth of B. adolescentis

and unclassified Bifidobacterium in the obese microbiota when compared to lean

(5 vs 0.66 fold; 2 vs 0.76 fold, respectively; Table S3). Enterococcus faecalis was

increased in the fermentations with the lean microbiota when compared to

control (6 fold).

_____________________ Lean vs obese: arabinogalactan and inulin fermentation

173

Modulatory effect of the substrates on activity and composition of the microbiota Species in general were found to be divided in two groups: species that were

positively correlated with n-butyrate (found in O-inulin and L-inulin

experiments) and species that were negatively correlated to acetate, propionate

and BCFA production (found in L-Inulin and L-arabino). More specifically,

correlation analysis performed showed a significant correlation of B.

adolescentis, unclassified Bifidobacterium, F. prausnitzii, an unclassified

Faecalibacterium and an unclassified Eubacterium with n-butyrate production;

acetate, propionate and BCFA production were also significantly correlated with

F. prausnitzii and unclassified Faecalibacterium but with an unclassified

Bacteroides as well (Figure 3).

Figure 3: Correlation of metabolites and a subset of marker bacterial species

Rows correspond to bacterial species; columns correspond to measured metabolites.

Red and green denote positive and negative correlation, respectively. The intensity of the

colours represents the degree of association between taxa abundances and metabolites

as measured by Spearman's correlations.

** indicate associations significant at the 0.01 level (2-tailed).

Chapter 6_________________________________________________________________________

174

Discussion The addition of fibre to food products has been proposed to reduce the caloric

density and glycaemic impact of meals (36). Therefore, there is growing interest

in the use of functional fibres in the form of food ingredients, additives or

supplements in order to fortify the Western diet without compromising the

palatability of the food, especially in long-term weight management programs

(36,37).

Other properties of dietary fibre have been well documented and it has been

observed that it exerts a wide array of biochemical, neurohormonal and

microbiological effects in the human body (36). Here the gut microbiota, as a

metabolic organ, has been found to be influenced by fibre consumption.

The amount and type of dietary fibres consumed have a direct impact on the

microbial fermentation capacity (38). In this respect, studies have found that the

gut microbiota from obese subjects could be more efficient in extracting energy

from diet than lean subjects (11,39,40). However, findings are controversial and

it has been proposed that fermentation of fibres, and consequently their health

effects, may be substrate dependent. Substrate dependency could be explained

by the fact that dietary fibre reflects a heterogeneous group of compounds that

differ in their chemical structure and physico-chemical properties, therefore

reflecting on different physiological functions or health benefits (41,42).

In this study, AG and IN were provided to the microbiota from lean or obese

subjects and 72 h fermentation experiments were performed. The aim was to

compare the differences in the fermentation profiles of these two fibres with

respect to microbiota composition, but particularly with respect to production

of the microbial metabolites SCFA, which are an energy source for the host.

Determination of fibre fermentation in humans and rats is a common approach

to characterize the capacity of the gut microbiota to ferment a specific substrate.

However, these studies are expensive, time consuming and in the case of rats the

metabolic products yielded from the fermentation of several types of fibre have

been found to be significantly lower when compared to humans (43–45).

Moreover, studies in humans are limited because of the limited sampling

capacity (non-invasively only faeces can be collected), while most of the SCFA

produced are taken up during transit of the chyme through the colon (estimated

at 95% of produced SCFA) (46). Here, we used the TIM-2 system as an alternative

tool to animal and human studies. In vitro systems simulating the large intestine

have been validated and found to accurately predict the fermentation of fibres in

human subjects by presenting the same magnitude of the differences in SCFA

production (43). In the current study pooling of faecal samples was performed

to create a standardized microbiota, which was subsequently frozen and stored.

_____________________ Lean vs obese: arabinogalactan and inulin fermentation

175

Both pooling (27) and the impact of freezing (28) have been validated before.

However, besides the lack of host interactions in such in vitro systems, another

limitation is the characteristic variability of the microbiota used to inoculate the

models, which was derived from a group of donors.

Involving different participants in a study like the present one constitutes one of

the factors that influence the sometimes contradictory results in gut microbiota

research. Still, the participants recruited for this study were considered

according to their diet, consumption of prebiotics, probiotics and medication as

specified in the M&M section. We considered including the microbiota from only

those volunteers who fitted the best for the requirements from the two groups

that we studied (i.e. lean and obese).

Importantly, BMI index was prioritized given that the main goal of this

investigation was exploring the differences between lean and obese microbiota

fermenting AG and IN. We want to emphasize that the BMI index among subjects

was very similar. This was reflected by the low standard deviation value

observed in both groups (M&M). By setting the inclusion requirements

mentioned above we believe that the outcome of our studies is the result of a lean

or obese microbiome phenotype. Still, we acknowledge that the age difference

from our group of volunteers might have contributed to differences in the

microbiota.

The current study provides more evidence for the consumption of specific

ingredients with the aim of modulating the gut microbiota in the context of

obesity.

Impact of the substrates on metabolic activity When compared against each other and against the control, both fibres

presented different fermentation kinetics (in terms of SCFA production) (Figure

1). The difference between the production of propionate and n-butyrate in AG

experiments using both microbiotas (Figure S2) is interesting in the light of the

discussion of the impact of microbial metabolites in obesity. The increase in

propionate production in the experiments with the obese microbiota suggests

that via this metabolite AG could be protective against inflammation and

promote satiety in obese subjects.

Despite that most studies about the anti-inflammatory role of SCFA have been

focused on the effects of n-butyrate and acetate (47,48), there is evidence

pointing to propionate as a metabolite with a strong role against inflammation

(49). On the one hand, propionate acts as a ligand of G-protein-couple receptors

(GPCR) 41 and 43 (50). These receptors when activated, induce an increase of

GLP-1 (which slows down gastric emptying and promotes satiety) and PYY

Chapter 6_________________________________________________________________________

176

(which up-regulates food digestion and absorption). Besides this, it has also been

shown that when they are absent (at least for GPCR43 in knockout mice) there is

an exacerbated inflammation in inflammatory-disease models (51). Moreover,

propionate has been found to decrease fatty acid levels in plasma (47). As there

is also evidence indicating that high plasma levels of fatty acids cause

inflammation and consequently insulin resistance, the postulation of propionate

as a molecule with anti-obesity properties is reinforced.

On the other hand, propionate has also been linked to autism (52) and hence, an

increase in this metabolite may not be desirable, although the mechanism is not

entirely clear.

In this study, IN was found to increase the production of n-butyrate in the

fermentations with the lean microbiota (Figure S2) when compared to the obese.

The butyrogenic effect of IN has been previously observed in vivo and in vitro

(17,18,53–57). n-Butyrate has been postulated as a molecule with health

benefits for the human host since it has been found to be an important source of

energy for colonocytes, with a potential protective role against colon cancer. In

addition, it has been inversely correlated with inflammatory bowel diseases such

as Crohn’s disease (58–61). To our knowledge only two studies have tested in

vitro the fermentation of IN in both microbiotas (lean and obese). Both Sarbini

et al (17) and Bussolo de Souza et al (18) found that the obese fermentation of

IN produced higher concentrations of n-butyrate when compared to the lean

fermentation. The inocula composition in these experiments is not the same

(Table S2) and that may have contributed to our results. Nevertheless, we have

observed that there are some compositional similarities in both inocula despite

being prepared in different years (Table S2).

The fermentation of AG showed decreased BCFA concentrations in the

fermentations with the obese microbiota when compared the lean. This supports

the work from Vince and colleagues (62) and Robinson & Slavin (20) who

observed a significant decreased in products from proteolytic fermentation

(specifically ammonia) by intestinal bacteria after the supplementation of AG.

However, our study brings evidence, for the first time, about this beneficial effect

of AG in obese subjects.

Though production of BCFA was not lower in the obese microbiota fermenting

IN when compared to lean, at least, when it is compared to control, the

fermentation of IN with the lean microbiota is lower, giving also a good indication

of the prebiotic effect of IN in ameliorating proteolytic fermentation. This effect

has been previously observed in vitro as well as in vivo (29,63,64).

_____________________ Lean vs obese: arabinogalactan and inulin fermentation

177

Energy extraction The hypothesis that the gut microbiota in obese individuals facilitates the

additional extraction of calories from diet has been previously reviewed

(38,65,66). In this study we were not able to confirm that the energy yield (in

terms of SCFA produced) was higher in the faeces from the obese donors in

comparison with the lean donors (Table S1). However, the absorption of SCFA

has been described as a very efficient process since only 5–10% is excreted in

the faeces (67). Furthermore, in a study performed by Jumpertz and colleagues

(68) overfeeding in lean subjects was associated with a greater decrease in stool

energy loss showing a relation between loss of energy in faeces and energy load.

Therefore, based on our results we could hypothesize that obese individuals may

have higher capacity of absorbing SCFA in their gut and, therefore, may have

lower amounts of these metabolites in their faeces compared with lean subjects.

However, we found a substrate dependent effect on the metabolic activity and

consequently energy extraction when fermentations of both AG and IN were

performed. These findings confirm our previous observations where a higher

amount of energy extracted from the fermentation of IN was also found after

fermentation by obese microbiota when compared to lean (18). Although the

difference is small, over a prolonged period this may add up to several kilos of

body weight, since, as previously mentioned, an elevated production of SCFA

contributes to a higher energy input to the host. But at the same time these

metabolites have also been found to present satiety-enhancing properties via the

activation of GPCRs. Thus, it could be that the enhancement of the production of

these metabolites could be protective against obesity in this population, despite

their energy content. Still, more research is needed in this area.

Compositional changes When the inocula prepared from both lean and obese subjects (previous study;

2012) is compared to the inocula from the present study (2014), we observed

some compositional differences in the shared bacterial groups. This shows that

not all inocula are the same. However, there are some similarities in some

increased groups observed from the L/O ratios (Table S2) making it possible to

distinguish certain bacteria belonging for example to Gemmiger, Dorea,

Roseburia, Alistipes genera which both times were highly abundant in the lean

microbiota and deserve being more investigated about their potential role in

leanness.

After fermenting AG by the different microbiota, the growth of some groups of

bacteria was highly stimulated in one microbiota whilst they decreased in the

other. Between the groups that were benefited from the fermentation of AG in

Chapter 6_________________________________________________________________________

178

the obese microbiota we found Faecalibacterium, Dorea and Blautia. Judging

from the ratios calculated in order to compare both inocula (L/O 2014; Table S2),

it seems that the community from obese donors tended to re-structure towards

the microbiota from lean donors after the fermentation of AG (Table 2).

This effect was also previously observed by Bussolo de Souza et al (18) and

Condezo-Hoyos et al (19) when testing the prebiotic effects of cassava bagasse

and different apple cultivars on the composition from lean and obese microbiota.

Lactobacillus was observed to increase in the obese microbiota fermenting AG

(Table 2). Furthermore, we also described an increase of the species L. mucosae

and L. gasseri in the obese microbiota after fermenting AG. Our results are in

agreement with Robinson & Slavin (20) who showed that a diet supplemented

with AG increased the concentration of Lactobacillus in the faeces from healthy

participants. In addition, a study conducted by Santacruz et al (69) showed a

parallel reduction of body mass index (BMI) and increase of Lactobacillus spp.

amounts in obese adolescents suggesting a potential role of this genera in obesity

and body weight control. Based on these findings we suggest that our study

brings more evidence about how a prebiotic such as AG can beneficially influence

the composition of the microbiota from obese subjects in weight management.

The lean microbiota fermenting AG presented an increase in B. thetaiotaomicron.

The growth of this species on AG has also been found by others (70). B.

thetaiotaomicron colonization has been observed to elicit gene expression

involved with the fortification of the intestinal barrier function and the

maintenance of mucosal integrity which may suggest to be especially beneficial

in obese subjects (71).

The obese microbiota composition on IN shifted the simulated gut environment

into a healthier milieu with increases of beneficial bacteria belonging to the

Faecalibacterium, Blautia, Fusicatenibacterium and Bifidobacterium genera. The

bifidogenic effect of IN was demonstrated to be more pronounced in the obese

microbiota when compared to lean (Table 3). Interestingly, IN was shown to

selectively stimulate the growth of B. adolescentis (Table S4). This is in agreement

with the upregulation of B. adolescentis by IN also found by Ramirez-Farias et al

(23) and B. animalis by Venema and Maathuis (72). In fact, the latter authors

hypothesized that within the Bifidobacterium genus, the diversity was

diminished by inulin. This was also observed to some degree in our experiments

(Table S4).

The difference in the bifidogenic effect of IN in the obese microbiota, especially

in the case of B. adolescentis growth, can be explained by i) a long-known inverse

relation between initial amounts present and the observed increase (73). As

observed e.g. by Korpela et al (74) and other authors, the lower the abundance

_____________________ Lean vs obese: arabinogalactan and inulin fermentation

179

of Bifidobacterium spp. at the starting point of an intervention, the more the

increase observed after the administration of an specific prebiotic, and vice versa

(74–76); or ii) the high specificity of IN for stimulating the growth of certain

bifidobacterial species as observed by Venema & Maathuis (72). A high

abundance of bifidobacteria could be protective in obesity since it is speculated

that this bacteria may decrease pro-inflammatory cytokines and decrease

endotoxaemia which can improve glucose-induced insulin and glucose tolerance

(17,77).

Conclusion First line strategies to combat obesity include exercise and/or a balanced dietary

regime. Though apparently simple, such changes in people’s life are difficult to

maintain and in most of the cases, patients struggle to follow these

recommendations. Due to the complexity of this condition, it is vital to identify

weight loss methods by which subjects can successfully achieve long-term

results. In this respect, using fibres is a potential tool to supplement diet in

weight management due to their satiety aspects, as well as in modulating the gut

microbiota. Here in this study we have identified the potential of arabinogalactan

and inulin in stimulating a gut community more related to a lean profile.

Metabolically, arabinogalactan fermentation showed a higher production of

propionate when compared to n-butyrate in the obese microbiota fermentations.

In general, lean microbiota produced more n-butyrate from the fermentation of

both substrates when compared to the obese microbiota. This would be

interesting to investigate in light of the potential activation of different GPCRs by

these SCFA. However, these effects should be more studied in humans focusing

especially on the role of these fibres in satiety.

Acknowledgments The authors thank Freddy J. Troost and Bouke Salden for facilitating the

recruitment of the donors, and declare that there is no conflict of interest.

Author contributions Conceived and designed the experiments: MA, KV. Performed the experiments:

MA. Analysed the data: MA, CBS, KV. Contributed reagents/materials/analysis

tools: MA, CBS, KV. Wrote the paper: MA, CBS, KV.

Chapter 6_________________________________________________________________________

180

References

1. Yang J, Keshavarzian A, Rose DJ. Impact of dietary fiber fermentation from

cereal grains on metabolite production by the fecal microbiota from

normal weight and obese individuals. J Med Food. 2013 Sep;16(9):862–7.

2. Elli M, Colombo O, Tagliabue A. A common core microbiota between obese

individuals and their lean relatives? Evaluation of the predisposition to

obesity on the basis of the fecal microflora profile. Med Hypotheses.

2010;75(4):350–2.

3. Lozupone CA, Stombaugh JI, Gordon JI, Jansson JK, Knight R. Diversity,

stability and resilience of the human gut microbiota. Nature. 2012

Sep;489(7415):220–30.

4. Topping DL, Clifton PM. Short-chain fatty acids and human colonic

function: roles of resistant starch and nonstarch polysaccharides. Physiol

Rev. 2001;81(3):1031–64.

5. Russell WR, Gratz SW, Duncan SH, Holtrop G, Ince J, Scobbie L, et al. High-

protein, reduced-carbohydrate weight-loss diets promote metabolite

profiles likely to be detrimental to colonic health. Am J Clin Nutr. 2011

May;93(5):1062–72.

6. Freeland KR, Wolever TMS. Acute effects of intravenous and rectal acetate

on glucagon-like peptide-1, peptide YY, ghrelin, adiponectin and tumour

necrosis factor-alpha. Br J Nutr. 2010 Feb;103(3):460–6.

7. Tarini J, Wolever TMS. The fermentable fibre inulin increases

postprandial serum short-chain fatty acids and reduces free-fatty acids

and ghrelin in healthy subjects. Appl Physiol Nutr Metab = Physiol Appl

Nutr Metab. 2010 Feb;35(1):9–16.

8. Anderson JW, Baird P, Davis RHJ, Ferreri S, Knudtson M, Koraym A, et al.

Health benefits of dietary fiber. Nutr Rev. 2009 Apr;67(4):188–205.

9. Liu S, Willett WC, Manson JE, Hu FB, Rosner B, Colditz G. Relation between

changes in intakes of dietary fiber and grain products and changes in

weight and development of obesity among middle-aged women. Am J Clin

Nutr. 2003 Nov;78(5):920–7.

10. Royall D, Wolever TM, Jeejeebhoy KN. Clinical significance of colonic

fermentation. Am J Gastroenterol. 1990 Oct;85(10):1307–12.

11. Turnbaugh PJ, Ley RE, Mahowald MA, Magrini V, Mardis ER, Gordon JI. An

obesity-associated gut microbiome with increased capacity for energy

harvest. Nature. 2006;444(7122):1027–31.

12. Schwiertz A, Taras D, Schafer K, Beijer S, Bos NA, Donus C, et al. Microbiota

and SCFA in lean and overweight healthy subjects. Obes (Silver Spring).

2010;18(1):190–5.

_____________________ Lean vs obese: arabinogalactan and inulin fermentation

181

13. Aguirre M, Jonkers DMAE, Troost FJ, Roeselers G, Venema K. In vitro

characterization of the impact of different substrates on metabolite

production, energy extraction and composition of gut microbiota from

lean and obese subjects. PLoS One. 2014;9(11):e113864.

14. Turnbaugh PJ, Hamady M, Yatsunenko T, Cantarel BL, Duncan A, Ley RE,

et al. A core gut microbiome in obese and lean twins. Nature. 2009

Jan;457(7228):480–4.

15. Payne AN, Chassard C, Zimmermann M, Muller P, Stinca S, Lacroix C. The

metabolic activity of gut microbiota in obese children is increased

compared with normal-weight children and exhibits more exhaustive

substrate utilization. Nutr Diabetes. 2011 Jul;1:e12.

16. Sarbini SR, Kolida S, Deaville ER, Gibson GR, Rastall RA. Potential of novel

dextran oligosaccharides as prebiotics for obesity management through

in vitro experimentation. Br J Nutr. 2014 Oct;112(8):1303–14.

17. Sarbini SR, Kolida S, Gibson GR, Rastall RA. In vitro fermentation of

commercial alpha-gluco-oligosaccharide by faecal microbiota from lean

and obese human subjects. Br J Nutr. 2013 Jun;109(11):1980–9.

18. Bussolo de Souza C, Roeselers G, Troost F, Jonkers D, Koenen ME, Venema

K. Prebiotic effects of cassava bagasse in TNO’s in vitro model of the colon

in lean versus obese microbiota. J Funct Foods. 2014;11(C):210–20.

19. Condezo-Hoyos L, Mohanty IP, Noratto GD. Assessing non-digestible

compounds in apple cultivars and their potential as modulators of obese

faecal microbiota in vitro. Food Chem. 2014 Oct;161:208–15.

20. Robinson RR, Feirtag J, Slavin JL. Effects of dietary arabinogalactan on

gastrointestinal and blood parameters in healthy human subjects. J Am

Coll Nutr. 2001 Aug;20(4):279–85.

21. Crociani F, Alessandrini A, Mucci MM, Biavati B. Degradation of complex

carbohydrates by Bifidobacterium spp. Int J Food Microbiol. 1994

Dec;24(1–2):199–210.

22. Daguet D, Pinheiro I, Verhelst A, Possemiers S, Marzorati M.

Arabinogalactan and fructooligosaccharides improve the gut barrier

function in distinct areas of the colon in the Simulator of the Human

Intestinal Microbial Ecosystem. J Funct Foods. 2016;20(Supplement

C):369–79.

23. Ramirez-Farias C, Slezak K, Fuller Z, Duncan A, Holtrop G, Louis P. Effect

of inulin on the human gut microbiota: stimulation of Bifidobacterium

adolescentis and Faecalibacterium prausnitzii. Br J Nutr. 2009

Feb;101(4):541–50.

24. Kim LS, Waters RF, Burkholder PM. Immunological activity of larch

Chapter 6_________________________________________________________________________

182

arabinogalactan and Echinacea: a preliminary, randomized, double-blind,

placebo-controlled trial. Altern Med Rev. 2002 Apr;7(2):138–49.

25. Hauer J, Anderer FA. Mechanism of stimulation of human natural killer

cytotoxicity by arabinogalactan from Larix occidentalis. Cancer Immunol

Immunother. 1993;36(4):237–44.

26. Hotamisligil GS. Inflammation and metabolic disorders. Nature. 2006

Dec;444(7121):860–7.

27. Aguirre M, Ramiro-Garcia J, Koenen ME, Venema K. To pool or not to pool?

Impact of the use of individual and pooled fecal samples for in vitro

fermentation studies. J Microbiol Methods. 2014;107:1–7.

28. Aguirre M, Eck A, Koenen ME, Savelkoul PHM, Budding AE, Venema K.

Evaluation of an optimal preparation of human standardized fecal inocula

for in vitro fermentation studies. J Microbiol Methods. 2015 Oct;117:78–

84.

29. van Nuenen MHMC, Diederick Meyer P, Venema K. The effect of various

inulins and Clostridium difficile on the metabolic activity of the human

colonic microbiota in vitro. Microb Ecol Health Dis. 2003;15(2–3):137–44.

30. De Graaf AA, Maathuis A, de Waard P, Deutz NE, Dijkema C, de Vos WM, et

al. Profiling human gut bacterial metabolism and its kinetics using [U-

13C]glucose and NMR. NMR Biomed. 2009/07/14. 2010;23(1):2–12.

31. Maathuis A, Hoffman A, Evans A, Sanders L, Venema K. The effect of the

undigested fraction of maize products on the activity and composition of

the microbiota determined in a dynamic in vitro model of the human

proximal large intestine. J Am Coll Nutr. 2009;28(6):657–66.

32. van der Kamp JW, Jones J, McCleary B, Topping D. Dietary fibre: New

frontiers for food and health. Wageningen Academic Publishers; 2010.

592 p.

33. Marino P, Sutin K. The ICU Book: Wolters Kluwer Health. Philadelphia,

USA; 2012.

34. DeSantis TZ, Hugenholtz P, Larsen N, Rojas M, Brodie EL, Keller K, et al.

Greengenes, a chimera-checked 16S rRNA gene database and workbench

compatible with ARB. Appl Environ Microbiol. 2006 Jul;72(7):5069–72.

35. Cole JR, Wang Q, Fish JA, Chai B, McGarrell DM, Sun Y, et al. Ribosomal

Database Project: data and tools for high throughput rRNA analysis.

Nucleic Acids Res. 2014 Jan;42(Database issue):D633-42.

36. Lyon MR, Kacinik V. Is there a place for dietary fiber supplements in

weight management? Curr Obes Rep. 2012 Jun;1(2):59–67.

37. Spill MK, Birch LL, Roe LS, Rolls BJ. Hiding vegetables to reduce energy

density: an effective strategy to increase children’s vegetable intake and

_____________________ Lean vs obese: arabinogalactan and inulin fermentation

183

reduce energy intake. Am J Clin Nutr. 2011;94(3):735–41.

38. Aguirre M, Venema K. Does the gut microbiota contribute to obesity?

going beyond the gut feeling. Microorganisms. 2015 Apr;3(2):213–35.

39. Backhed F, Ding H, Wang T, Hooper L V, Koh GY, Nagy A, et al. The gut

microbiota as an environmental factor that regulates fat storage. Proc Natl

Acad Sci U S A. 2004 Nov;101(44):15718–23.

40. Turnbaugh PJ, Backhed F, Fulton L, Gordon JI. Diet-induced obesity is

linked to marked but reversible alterations in the mouse distal gut

microbiome. Cell Host Microbe. 2008;3(4):213–23.

41. Wanders AJ, Jonathan MC, van den Borne JJGC, Mars M, Schols HA, Feskens

EJM, et al. The effects of bulking, viscous and gel-forming dietary fibres on

satiation. Br J Nutr. 2013 Apr;109(7):1330–7.

42. Cummings JH, Edmond LM, Magee EA. Dietary carbohydrates and health:

do we still need the fibre concept? Clin Nutr Suppl. 2004;1(2):5–17.

43. Wisker E, Daniel M, Rave G, Feldheim W. Fermentation of non-starch

polysaccharides in mixed diets and single fibre sources: comparative

studies in human subjects and in vitro. Br J Nutr. 1998 Sep;80(3):253–61.

44. Bach Knudsen KE, Wisker E, Daniel M, Feldheim W, Eggum BO.

Digestibility of energy, protein, fat and non-starch polysaccharides in

mixed diets: comparative studies between man and the rat. Br J Nutr.

1994 Apr;71(4):471–87.

45. Wisker E, Bach Knudsen KE, Daniel M, Eggum BO, Feldheim W. Energy

values of non-starch polysaccharides: comparative studies in humans and

rats. J Nutr. 1997 Jan;127(1):108–16.

46. Cummings JH, Beatty ER, Kingman SM, Bingham SA, Englyst HN. Digestion

and physiological properties of resistant starch in the human large bowel.

Br J Nutr. 1996 May;75(5):733–47.

47. Al-Lahham S, Peppelenbosch MP, Roelofsen H, Vonk RJ, Venema K.

Biological effects of propionic acid in humans; metabolism, potential

applications and underlying mechanisms. Biochim Biophys Acta.

2010;1801(11):1175–83.

48. Roelofsen H, Priebe MG, Vonk RJ. The interaction of short-chain fatty acids

with adipose tissue: relevance for prevention of type 2 diabetes. Benef

Microbes. 2010 Nov;1(4):433–7.

49. Al-Lahham S, Roelofsen H, Rezaee F, Weening D, Hoek A, Vonk R, et al.

Propionic acid affects immune status and metabolism in adipose tissue

from overweight subjects. Eur J Clin Invest. 2012;42(4):357–64.

50. Brown AJ, Goldsworthy SM, Barnes AA, Eilert MM, Tcheang L, Daniels D,

et al. The Orphan G protein-coupled receptors GPR41 and GPR43 are

Chapter 6_________________________________________________________________________

184

activated by propionate and other short chain carboxylic acids. J Biol

Chem. 2003 Mar;278(13):11312–9.

51. Maslowski KM, Vieira AT, Ng A, Kranich J, Sierro F, Yu D, et al. Regulation

of inflammatory responses by gut microbiota and chemoattractant

receptor GPR43. Nature. 2009 Oct;461(7268):1282–6.

52. MacFabe DF, Cain NE, Boon F, Ossenkopp K-P, Cain DP. Effects of the

enteric bacterial metabolic product propionic acid on object-directed

behavior, social behavior, cognition, and neuroinflammation in

adolescent rats: Relevance to autism spectrum disorder. Behav Brain Res.

2011 Feb;217(1):47–54.

53. van de Wiele T, Boon N, Possemiers S, Jacobs H, Verstraete W. Inulin-type

fructans of longer degree of polymerization exert more pronounced in

vitro prebiotic effects. J Appl Microbiol. 2007 Feb;102(2):452–60.

54. Grootaert C, Van den Abbeele P, Marzorati M, Broekaert WF, Courtin CM,

Delcour JA, et al. Comparison of prebiotic effects of arabinoxylan

oligosaccharides and inulin in a simulator of the human intestinal

microbial ecosystem. FEMS Microbiol Ecol. 2009 Aug;69(2):231–42.

55. Hughes SA, Shewry PR, Li L, Gibson GR, Sanz ML, Rastall RA. In vitro

fermentation by human fecal microflora of wheat arabinoxylans. J Agric

Food Chem. 2007 May;55(11):4589–95.

56. Sakaguchi E, Sakoda C, Toramaru Y. Caecal fermentation and energy

accumulation in the rat fed on indigestible oligosaccharides. Br J Nutr.

1998 Nov;80(5):469–76.

57. Juskiewicz J, Zdunczyk Z, Frejnagel S. Caecal parameters of rats fed diets

supplemented with inulin in exchange for sucrose. Arch Anim Nutr. 2007

Jun;61(3):201–10.

58. Sokol H, Pigneur B, Watterlot L, Lakhdari O, Bermudez-Humaran LG,

Gratadoux J-J, et al. Faecalibacterium prausnitzii is an anti-inflammatory

commensal bacterium identified by gut microbiota analysis of Crohn

disease patients. Proc Natl Acad Sci U S A. 2008 Oct;105(43):16731–6.

59. Velazquez OC, Lederer HM, Rombeau JL. Butyrate and the colonocyte.

Production, absorption, metabolism, and therapeutic implications. Adv

Exp Med Biol. 1997;427:123–34.

60. Willing B, Halfvarson J, Dicksved J, Rosenquist M, Järnerot G, Engstrand L,

et al. Twin studies reveal specific imbalances in the mucosa‐associated

microbiota of patients with ileal Crohn’s disease. Inflamm Bowel Dis.

2009;15(5):653–60.

61. Basson MD, Turowski GA, Rashid Z, Hong F, Madri JA. Regulation of human

colonic cell line proliferation and phenotype by sodium butyrate. Dig Dis

_____________________ Lean vs obese: arabinogalactan and inulin fermentation

185

Sci. 1996 Oct;41(10):1989–93.

62. Vince AJ, McNeil NI, Wager JD, Wrong OM. The effect of lactulose, pectin,

arabinogalactan and cellulose on the production of organic acids and

metabolism of ammonia by intestinal bacteria in a faecal incubation

system. Br J Nutr. 1990 Jan;63(1):17–26.

63. De Preter V, Falony G, Windey K, Hamer HM, De Vuyst L, Verbeke K. The

prebiotic, oligofructose-enriched inulin modulates the faecal metabolite

profile: an in vitro analysis. Mol Nutr Food Res. 2010 Dec;54(12):1791–

801.

64. De Preter V, Vanhoutte T, Huys G, Swings J, De Vuyst L, Rutgeerts P, et al.

Effects of Lactobacillus casei Shirota, Bifidobacterium breve, and

oligofructose-enriched inulin on colonic nitrogen-protein metabolism in

healthy humans. Am J Physiol Gastrointest Liver Physiol. 2007

Jan;292(1):G358-68.

65. DiBaise JK, Zhang H, Crowell MD, Krajmalnik-Brown R, Decker GA,

Rittmann BE. Gut microbiota and its possible relationship with obesity.

Mayo Clin Proc. 2008;83(4):460–9.

66. Tilg H. Obesity, metabolic syndrome, and microbiota: multiple

interactions. J Clin Gastroenterol. 2010 Sep;44 Suppl 1:S16-8.

67. De Graaf A, Venema K. Gaining insight into microbial physiology in the

large intestine: a special role for stable isotopes. 2007;53:73–314.

68. Jumpertz R, Le DS, Turnbaugh PJ, Trinidad C, Bogardus C, Gordon JI, et al.

Energy-balance studies reveal associations between gut microbes, caloric

load, and nutrient absorption in humans. Am J Clin Nutr. 2011;94(1):58–

65.

69. Santacruz A, Marcos A, Warnberg J, Marti A, Martin-Matillas M, Campoy C,

et al. Interplay between weight loss and gut microbiota composition in

overweight adolescents. Obesity (Silver Spring). 2009 Oct;17(10):1906–

15.

70. Macfarlane GT, Macfarlane S, Gibson GR. Co-culture of Bifidobacterium

adolescentis and Bacteroides thetaiotaomicron in arabinogalactan-limited

chemostats: effects of dilution rate and pH. Anaerobe. 1995 Oct;1(5):275–

81.

71. Zocco MA, Ainora ME, Gasbarrini G, Gasbarrini A. Bacteroides

thetaiotaomicron in the gut: molecular aspects of their interaction. Dig

Liver Dis. 2007 Aug;39(8):707–12.

72. Venema K, Maathuis AJH. A PCR-based method for identification of

bifidobacteria from the human alimentary tract at the species level. FEMS

Microbiol Lett. 2003 Jul;224(1):143–9.

Chapter 6_________________________________________________________________________

186

73. Roberfroid MB. Prebiotics: preferential substrates for specific germs? Am

J Clin Nutr. 2001 Feb;73(2 Suppl):406S–409S.

74. Korpela K, Flint HJ, Johnstone AM, Lappi J, Poutanen K, Dewulf E, et al. Gut

microbiota signatures predict host and microbiota responses to dietary

interventions in obese individuals. PLoS One. 2014;9(6):e90702.

75. Davis LMG, Martinez I, Walter J, Hutkins R. A dose dependent impact of

prebiotic galactooligosaccharides on the intestinal microbiota of healthy

adults. Int J Food Microbiol. 2010 Dec;144(2):285–92.

76. Kolida S, Meyer D, Gibson GR. A double-blind placebo-controlled study to

establish the bifidogenic dose of inulin in healthy humans. Eur J Clin Nutr.

2007 Oct;61(10):1189–95.

77. Cani PD, Neyrinck AM, Fava F, Knauf C, Burcelin RG, Tuohy KM, et al.

Selective increases of bifidobacteria in gut microflora improve high-fat-

diet-induced diabetes in mice through a mechanism associated with

endotoxaemia. Diabetologia. 2007;50(11):2374–83.

_____________________ Lean vs obese: arabinogalactan and inulin fermentation

187

Supplemental material Table S1: Metabolites and energy extraction (in terms of SCFA) measured in the faeces

from the volunteers.

Table S2: Ratio L/O. Relative ratio of bacterial genera different between lean and obese

at t0 in TIM-2 in the current study and in a study by Bussolo et al. (18) in 2012.

acetate propionate n-butyrate Total i-butyrate i-valerate Total acetate propionate n-butyrate Total

L-1  233.3 74.9  49.5  377.7  11.4 16.3  27.7  204.2 115.1 108.4 427.6

L-2  219.7 58.1  64.8  342.6  7.89  10.0  17.9 192.0 89.1 139.7 423.4

L-3  232.3 44.6  36.4  313.3  8.00  11.1  19.1 203.3 68.6 79.9 351.5

L-4  83.6 34.1  26.5  144.2  4.57  6.91  11.5 73.2 52.3 58.2 183.7

L-5  85.9 15.9  18.7  120.6  3.84  6.05  9.89 75.3 24.5 41.1 140.6

L-6  89.5  33.0 37.8  160.2  8.30  12.7  21.0 78.2 50.6 82.8 211.7

L-7  168.3  66.2 58.7  293.2  9.60  14.2  23.8 147.3 101.7 128.9 377.4

L-8  205.8  69.3 69.6  344.8  9.42  14.3  23.7 179.9 106.7 152.7 438.9

O-1  138.6  43.1 35.1   219.9  4.17 6.11  10.3  121. 66.1 77.0 264.4

O-2  176.8  92.1  54.2  323.0  0.00  1.62  1.62 154.4 141.4 118.8 414.6

O-3  112.2  32.8  34.3  179.3  2.4  2.87  5.27 98.3 50.2 75.3 223.8

O-4  83.0  22.7  20.4  126.1  2.78  4.17  6.96 72.8 34.9 44.8 152.3

O-5  157.2  37.8  39.3  234.3  5.63  9.31  14.9 137.7 58.2 86.2 281.6

O-6  180.9  44.4  40.6  265.9  5.07  7.64  12.7 158.2 68.2 89.1 315.5

O-7  109.5  30.0  20.4  159.9  1.73  2.19  3.92 95.8 46.0 44.8 186.6

SCFA (mmol/kg) BCFA (mmol/kg)Volunteer

Energy extraction (KJ/kg)

Genera 2014 2012

Bifidobacterium 2.33 1.05

Lactobacillus 0.78 0.07

Enterococcus 0.85 0.31

Lactococcus 53.63 0.24

Shigella 0.21 0.34

Streptococcus 20.01 0.35

Faecalibacterium 74.82 680.58

Bacteroides 2.81 3.99

Weissella 2.09 0.99

Collinsella 0.76 6.60

Gemmiger 23.77 11.87

Blautia 2.93 58.96

Roseburia 5.64 205.17

Dorea 30.39 17.83

Coprobacillus 1.12 7.92

unclassified Erysipelotrichaceae 0.16 14.14

Parabacteroides 0.55 19.13

Anaerostipes 1.30 131.47

Alistipes 3.91 59.01

Chapter 6_________________________________________________________________________

188

Table S3: Relative change of bacterial species after 72h of fermentation experiments of

arabinogalactan and inulin in TIM-2 using microbiota from lean and obese individuals.

Table S4: Bifidobacterium species abundance from the fermentation of inulin.

Species Abundance (% from total reads)

L-Inulin-t0 L-Inulin-t72

Bifidobacterium adolescentis 5.3 3.6

Bifidobacterium animalis 0.3 0

Bifidobacterium pseudocatenulatum 0.2 0

Species Abundance (% from total reads)

O-Inulin-t0 O-Inulin-t72

Bifidobacterium adolescentis 0.4 24.8

Bifidobacterium longum 4.6 0.2

Bifidobacterium pseudocatenulatum 0.2 1

Bifidobacterium bifidum 0 0.1

Species L-Arabino O-Arabino L-Inulin O-Inulin

Clostridium butyricum 0.40 0.24 0.19 0.30

Bifidobacterium adolescentis 0.01 0.66 4.68

unclassified Clostridium 0.41 0.80 0.28 0.62

unclassified Bifidobacterium 0.17 0.07 0.76 1.90

Lactobacillus mucosae 0.50 2.06 1.08

unclassified Lactobacillus 0.58 3.14 0.71

Unclassified 1.03 2.29 0.89 2.02

Bifidobacterium longum 2.00 0.21 0.15 0.04

Enterococcus faecium 0.50 1.48 0.90 0.58

unclassified Enterococcus 0.58 2.08 1.11 0.73

Faecalibacterium prausnitzii 0.40 1.20

unclassified Bacteroides 1.12 3.91 0.59

unclassified Faecalibacterium 0.33 0.84

Bacteroides vulgatus 0.07

Bacteroides caccae 44.35

unclassified Eubacterium 0.51 6.39

unclassified Lactococcus 0.00

Bacteroides thetaiotaomicron 6.80

Bifidobacterium pseudocatenulatum 0.03 0.19

Lactobacillus gasseri 11.16

Enterococcus faecalis 5.78

Lactococcus lactis 0.94

Enterococcus gallinarum 0.81

_____________________ Lean vs obese: arabinogalactan and inulin fermentation

189

In both cases (L and O-fermentations) B. adolescentis dominated the bifidobacterial

species after 72 h. In lean microbiota a complete domination was observed while in the

obese microbiota it was about 25 fold higher (whereas at the start it was only ~8%).

Previous testing of the in vitro effects of IN fermentation in both microbiotas (lean and

obese) found that the obese fermentation of IN produced higher concentrations of n-

butyrate when compared to the lean fermentation [16, 18]. The difference with our study

could be explained by the different stimulation of certain butyrogenic strains, which in

this particular case found more favourable to growth in the lean microbiota as observed

in Tables S3 and S4.

Figure S1: Abundance (%) of the major genera in the microbiota from lean and

obese subjects.

At genus level, it was observed that differences among the inocula were driven by the

abundances within the same groups of bacteria (Figure S1). The major genera in the lean

microbiota were Bifidobacterium, Clostridium, Lactobacillus and Enterococcus (23, 34, 14

and 13%, respectively) and in the obese microbiota were Clostridium, Lactobacillus,

Enterococcus, Bifidobacterium (46, 17, 15 and 10%). Analysis of the species found in the

inoculum (t0) suggests that the lean microbiota had a more diverse population of

Bifidobacterium that included B. adolescentis, B. longum and an unclassified group (7, 4

and 8%, respectively) whilst the obese microbiota mainly contained B. longum and an

unclassified group (6 and 3%, respectively). Both microbiotas shared a high abundance

of C. butyricum (lean: 23%; obese: 30%).

Chapter 6_________________________________________________________________________

190

Figure S2: SCFA ratios (%) from the different diets at t72.

Chapter 7 Potential of pectins to beneficially

modulate the gut microbiota depends on their structural properties

Submitted:

Larsen N., Bussolo de Souza C., Cahú T. B., Krych L., Wiese M., Kot W.,

Hansen K. M., Blennow A., Venema K., Jespersen L. Potential of pectins

to beneficially modulate the gut microbiota depends on their structural

properties.

Chapter 7_________________________________________________________________________

192

Abstract Pectins are plant cell-wall polysaccharides which can be utilized by commensal

bacteria in the gut, exhibiting beneficial properties for the host. Knowledge of the

impact of pectins on intestinal bacterial communities is insufficient and limited

to a few types of pectins. This study characterized the relationship between the

structural properties of pectins and their potential to modify composition and

activity of the gut microbiota in a beneficial way. For this purpose, we performed

in vitro fermentation of structurally diverse pectins from citrus fruits and sugar

beet (nine in total) and a pectic derivative, rhamnogalacturonan I (RGI), using a

TIM-2 colon model. The composition of the microbiota throughout TIM-2

fermentations was assessed by 16S rRNA gene amplicon sequencing. Both

general and pectin-specific changes were observed in relative abundances of

numerous bacterial taxa in a time-dependent way. Bacterial populations

associated with human health, such as Faecalibacterium prausnitzii, Coprococcus,

Ruminococcus, Dorea, Blautia, Oscillospira, Sutterella, Bifidobacterium,

Christensenellaceae, Prevotella copri, and Bacteroides spp. were either increased

or decreased depending on the substrate, suggesting that these bacteria can be

controlled using structurally different pectins. The main structural features

linked to the pectin-mediated shifts included degree of esterification,

composition of neutral sugars, distribution of homogalacturonan and

rhamnogalacturonan fractions, degree of branching and the presence of amide

groups. Cumulative production of total short chain fatty acids and propionate

was largest in fermentation of sugar beet pectin (162.6 mmol and 43.3 mmol,

respectively) and RGI (159.4 mmol and 47.6 mmol, respectively). This study

provides evidence that the human gut microbiota can be modulated by pectins

and identifies specific features linked to microbial alterations. This knowledge

can be used to define preferred dietary pectins, targeting beneficial bacteria and

favoring more balanced microbiota profiles in the gut.

____________________________________________________________ Pectins fermentation

193

Introduction Pectins are part of a daily diet consumed in the form of fruits and vegetables.

Besides, they are authorized as food additives and used as emulsifiers, gelling or

stabilizing agents in yoghurts, jams and other food products (1). Pectins are

commercially produced from peel and pulp of fruits and vegetables, mainly citrus

fruits, sugar beet and apples. Structural differences of pectins are defined by

their source and production methods. The backbone of pectin molecules is

composed of homogalacturonan, or 1,4-linked α-D-galacturonic acid,

occasionally substituted by rhamnose. The major side chain unit is

rhamnogalacturonan I (RGI) (“hairy” region), consisting of α-(1,4)-

galacturonosyl and α-(1,2)-rhamnosyl chains with attached neutral sugars

(galactan, arabinan or arabinogalactans) (2). The polygalacturonic acid in the

backbone can be partially esterified with methyl groups. According to the degree

of esterification (DE), pectins are conventionally referred to as high methoxyl

(HM) pectins (DE > 50%) and low methoxyl (LM) pectins (DE < 50%).

Commercial LM pectins can also be amidated in order to achieve better gelling

control (3).

Pectins are indigestible by human enzymes, however, they can be easily

degraded by commensal bacteria in the gut with concomitant production of short

chain fatty acids (SCFA) and other metabolites (4). Besides SCFA production, the

beneficial effects of pectins include reduction of ammonia (5), delayed gastric

emptying and improved glucose metabolism (6). Furthermore, pectins can

induce gut immunity, improve intestinal integrity and mucosal proliferation, and

favor adhesion of probiotic Lactobacillus strains to epithelial cells (4,7,8). The

ability of pectins and pectic oligosaccharides (POS) to support the growth of

specific bacterial populations has been described in several studies; however,

there is some inconsistency in the results. Pectins and POS were found to

stimulate beneficial bacteria, including, bifidobacteria, lactobacilli,

Faecalibacterium, Roseburia and Eubacterium rectale (5,9–11), whereas other in

vitro studies reported unchanged or even decreased levels of bifidobacteria and

Roseburia (12–14). Other bacterial taxa commonly increased in pectin

fermentations, include Bacteroides, Prevotella, E. rectale/C. coccoides group and

Clostridium spp. (12–17). Species within the genera Bacteroides and Prevotella

are considered to be the primary pectin-degraders, as they possess

carbohydrate-active enzymes (CAZymes) encoded by the polysaccharide

utilization loci (PULs) (18). The CAZymes comprise lyases, methylesterases and

acetylesterases, facilitating the breakdown of pectins (19). Variations in

microbiota composition, enzyme capabilities and fermentation substrates, can

Chapter 7_________________________________________________________________________

194

explain inconsistencies between the studies in the effects of pectins and POS on

microbial communities.

Functional properties of pectins in the gut are influenced by their structural

features, e.g., distribution of free and methylated carboxyl groups within the

polygalacturonic acid, molecular size and sugar composition (8,13,20). Vogt et

al. (21) demonstrated that immune activation of T84 cells and protection of

intestinal barrier function upon exposure to lemon pectins was related to the

degree of esterification (DE). Fermentations with human feces and mixed

cultures showed that pectins with lower DE and lower oligomeric size were

preferentially metabolized and stimulated the growth of bifidobacteria (22–24).

In a recent study, Tian and coworkers reported differences between LM and HM

pectins on the levels of fecal Prevotella and Lactobacillus in piglets (25). Different

abundances of Bifidobacterium, Bacteroides/Prevotella and Clostridium

coccoides/Eubacterium rectale group were found in fermentations of structurally

different pectins from lemon and sugar beet (10).

In previous studies we observed that structural factors, such as DE, net charge,

degree of branching and molecular weight, were related to the ability of pectins

to improve survival of probiotic strains under simulated gastro-intestinal

conditions (8). Up to now, the impact on the gut microbiota has been studied for

just a few types of pectins, and the significance of their structural properties for

microbiota shaping remains unclear. To clarify these issues, we performed

fermentations of structurally diverse pectins from citrus fruits and sugar beet

using the TIM-2 colon model and characterized their potential to modify the gut

bacterial populations in a beneficial way in relation to their structural features.

Materials and methods

Pectins

Pectins for this study (nine in total) were produced by CP Kelco (Denmark) from

orange (P1 and P8), lemon (P2, P3, P6 and P9), lime (P5 and P7) and sugar beet

(P4) using different extraction methods (harsh, mild and differentially extracted)

as shown in Table 1. Rhamnogalacturonan I (P10) was purified from lime.

Additionally, pectins P5 and P6 were chemically and enzymatically de-esterified,

respectively, and pectins P7 and P8 were amidated according to the standard

procedure at CP Kelco.

____________________________________________________________ Pectins fermentation

195

Table 1: Pectins used in this study

Pectin ID

Production methods Source

P1 Harsh extracted Orange

P2 Mild extracted Lemon

P3 Differentially extracted Lemon

P4 Harsh extracted Sugar beet

P5 Harsh extracted chemically de-esterified Lime

P6 Mild extracted enzymatically de-esterified Lemon

P7 Harsh extracted amidated Lime

P8 Harsh extracted amidated Orange

P9 Harsh extracted Lemon

P10 Rhamnogalacturonan I Lime

High Performance Anion Exchange Chromatography (HPAEC)

Monosaccharide composition of pectins was determined by high performance

anion exchange chromatography (HPAEC) equipped with a PA20 column and

Pulsed Amperometric Detection (PAD, Dionex, CA, USA) as described previously

(8). Monosaccharides, galacturonic acid (GalA), arabinose (Ara), rhamnose

(Rha), galactose (Gal), glucose (Glc), and xylose (Xyl) were quantified from two

independent HPAEC-PAD analyses. Degree of branching (DBr) of the rhamnosyl

residues with neutral sugar side chains was calculated by the equation DBr(%)

= 100% × Rha(%)/[(Ara(%) + Gal(%)]. The molar content of homogalacturonan

(HG) and rhamnogalacturonan (RG) was estimated using equations: HG(%) =

GalA(%) – Rha(%); RG(%) = 2Rha(%) + Ara(%) + Gal(%) (26). Differences in the

composition of monosaccharides between the pectins were tested by one-way

ANOVA, with a Tukey’s post-hoc test (Supplementary Table S1).

TIM-2 fermentations and sample collection

In vitro fermentations were performed using the TIM-2 proximal colon model

(TNO Innovation for Life, the Netherlands), validated and used as a predictive

model for clinical trials (14). The TIM-2 model provides fully anaerobic

conditions, peristaltic movements and removal of metabolites during

fermentation. The microbiota inoculum consisted of active, pooled fecal samples

from 8 healthy adults (male: n = 4, female: n = 4; age of 25 – 42 years). Fecal

samples were maintained under anaerobiosis by using anaerobic packs

(AnaeroGen™, Oxoid, Cambridge, UK). The fecal microbiota was homogenized

under anaerobic conditions, snap-frozen in liquid nitrogen and stored at -80 °C

Chapter 7_________________________________________________________________________

196

before inoculation in TIM-2. The TIM-2 colon model was operated as follows. All

units of the system were flushed with nitrogen prior to inoculation and

throughout the experiments. Fermentations were performed at 37°C with the pH

kept at 5.8 (or slightly above) by automatic titration with 2M NaOH. A 30 ml

portion of microbiota homogenate was used to inoculate the units for each

experiment. Following inoculation, the microbiota was incubated for 16 h for

adaptation to the new environment. During this period the basal simulated ileal

efflux medium (SIEM), composed of complex carbohydrates, protein, ox-bile,

Tween 80, vitamins and minerals (27), was gradually introduced into the system

in a total volume of 40 ml; afterwards, the culture was deprived from any

medium for 2 h (starvation period). The units were then fed with SIEM

containing 7.5 g pectin per day as the only carbohydrate source. The doses of

pectin in TIM-2 fermentations were based on the amount of carbohydrates

present in SIEM, and corresponded to approximately 250 g citrus fruit

(grapefruit, lemon, orange) with the typical content of pectins of 2.3 – 4.5% (28).

Lumen and dialysate samples were taken at the start of fermentation (0 h) and

after 24, 48, 56 and 72 h fermentation for analyses of microbiota, SCFA and

branched chain fatty acids (BCFA). Samples were snap-frozen in liquid nitrogen

and stored (-80 °C) until analysis. Fermentation of each substrate was performed

in two independent TIM-2 experiments.

DNA purification

Microbiota samples from TIM-2 experiments were centrifuged (10.000 × g, 10

min) and the fecal water discarded. The total bacterial DNA was isolated from

the pellet using the PowerLyzer@PowerSoil DNA Isolation Kit (Qiagen Nordic,

Denmark) according to manufacturer’s protocol with few modifications.

Modifications included resuspension of fecal slurries in the Bead Solution,

transfer to the PowerLyser® Glass bead tubes and heating the tubes at 65 °C for

10 min before the bead beating step. The homogenization was performed at

speed setting of 6.5 m/sec for 3 cycles, 30 sec each with 30 sec intervals

(FastPrep®-24, MP Biomedicals, Solon OH, USA). The concentration and purity

of DNA was determined using the NanoDrop™ 2000 Spectrophotometer

(Thermofisher Scientific, Denmark). The DNA concentration was typically in the

range of 20 - 100 ng/µl and A260/A280 ratios of 1.8 – 2.1.

16S rRNA gene amplicon sequencing and data processing

The DNA library for amplicon sequencing was prepared according to Williams et

al. (29). In brief, the V3 region (∼190 bp) of the 16S rRNA gene was PCR amplified

using AccuPrime SuperMix II (Life Technologies, CA, USA) and primers NXt_388F

____________________________________________________________ Pectins fermentation

197

and NXt_518R compatible with Nextera Index Kit (Illumina). Amplification steps

included initial denaturation at 95 °C for 2 min, 33 cycles of denaturation at 95

°C for 15 s, annealing of primer at 55 °C for 15 s and elongation at 68 °C for 30 s.

The second PCR (PCR II) was performed using Phusion High-Fidelity PCR Master

Mix (ThermoFisher Scientific, USA, MA) and primers P5 and P7 (Nextera Index

Kit) to incorporate adapters and tags in the PCR product. The PCR II setup

included 13 cycles of denaturation at 98°C for 10 s, annealing of primer at 55 °C

for 20 s and elongation at 72 °C for 20 s, followed by an extension at 72 °C for 5

min. Amplifications were performed in a Veriti® 96-well thermal cycler (Applied

Biosystems, USA). The amplified fragments with adapters and tags were purified

using AMPure XP beats (Beckman Coulter Genomic, CA, USA). Tag-encoded 16S

rRNA gene sequencing was performed using Illumina NextSeq platform using the

2x150 cycles MID V2 kit (Illumina, CA, USA). The raw dataset, containing pair-

ended reads with corresponding quality scores, were merged and trimmed,

using fastq_mergepairs and fastq_filter scripts implemented in the UPARSE

pipeline, as reported previously (29).

Analysis of sequencing data and statistic

Quantitative Insight Into Microbial Ecology (QIIME) software package (version

1.8.0) was used for subsequent analysis steps (30). The sequences were

classified using Greengenes database (version 13.8) as a reference 16S rRNA

gene database (31). Alpha-diversity was evaluated by the number of observed

species and Chao 1 computed for each OTU table rarefied to 10.000 sequences

per sample (lowest number of sequences produced per sample). Good’s coverage

was estimated to assess the depth of sequencing. Differences in alpha-diversity

between times were tested using Student’s t-test, employing the non-parametric

(Monte Carlo) method (999 permutations). Differences in Chao 1 indices

between the pectins after 24, 48 and 72 h fermentation were assessed by a one-

way analysis of variance (ANOVA) with LSD post-hoc test. Community

differences (beta-diversity) were revealed by weighted and unweighted UniFrac

distance matrices computed from the rarefied OTU tables and evaluated by

analysis of similarities (ANOSIM). Principal Coordinate Analysis (PCoA) plots

were generated with Jackknifed Beta Diversity workflow using 10 subsampled

OTU tables. Group differences in microbial community structure were assessed

by hierarchical clustering of OTUs at species level, applying UPGMA (unweighted

pair group method using arithmetic averages) algorithm. Differences between

the pectins were assessed in the pooled data set (48, 56 and 72 h from two

independent experiments) compared to time 0 h (baseline) by the

nonparametric Wilcoxon Rank Sum test combined with Bonferroni multiplicity

Chapter 7_________________________________________________________________________

198

correction, using 0.05 as significance level. Correlation between the relative

abundances of OTUs and the structural characteristics of pectins

(rhamnogalacturonan RGI was not included) was evaluated with the Spearman

rank correlation test implemented in the otu_category_significance.py script

(QIIME 1.8.0). Statistical significance was evaluated from the conservative false

discovery rate (FDR) corrected p-values for multiple comparisons (FDR-

adjusted, p < 0.05).

Analysis of short chain and branched chain fatty acids

Analyses of SCFA and BCFA were performed in the lumen and dialysate of TIM-2

samples by Brightlabs (Venlo, the Netherlands). Samples were centrifuged

(10.000 × g, 20 min) and the supernatants were diluted with 1.5 mM sulfuric acid.

The samples (10µl) were injected onto an 883 Basic IC plus ion-chromatography

system with suppressed conductivity detection used in positive mode (Metrohm,

Herisa, Switzerland). The acids were separated by isocratic elution on ICsep

ION300 Ion exclusion column (300 mm x 7.8 mm, 7 µm particle size) and

Metrosep RP2 Guard column (Transgenomic, New Haven, CT, USA) using 1.5 mM

sulfuric acid as a mobile phase. Samples were eluted at a flow rate of 0.4 ml/min

with a pressure of 5.5 MPa at 65 oC. Acetic, propionic, butyric, iso-butyric and iso-

valeric acids were used as calibration standards (Sigma Chemical, St. Louis, MO).

Statistical differences between the pectins in SCFA and BCFA production over

time were assessed by one-way ANOVA, with Tukey’s post-hoc test. Differences

between the HM pectins (P1, P2, P3 and P4) and LM pectins (P5, P6, P7, P8 and

P9) were evaluated by the two-sided Wilcoxon Rank Sum test. Correlation

between the relative abundances of OTUs and cumulative production of fatty

acids was assessed with the Spearman rank correlation test (QIIME 1.8.0) and

statistical significance was evaluated from the FDR corrected p-values. In all tests

differences were assumed to be statistically significant at p-values < 0.05.

Results

Composition and structural properties of pectins

In total nine pectins (P1 – P9) and rhamnogalacturonan I (P10), were used as

substrates for microbiota fermentation in the TIM-2 colon model (Table 1). The

composition and physicochemical properties of the pectins have been described

previously (8). The structural parameters referred to in this study, including

monosaccharide composition, DE and DBr, are presented in Supplementary

Table S1. Pectins P1, P2, P3 and P4 were HM pectins with highest DE of 70.0 and

74.7 % in P2 and P3, respectively; others were LM pectins with DE between 11.4

____________________________________________________________ Pectins fermentation

199

– 35.6 %, lowest in P5. The major neutral sugars in pectin molecules were

galactose (Gal, 9.1 – 30.7 %), arabinose (Ara, 0.8 – 16.7 %), rhamnose (Rha, 1.7 –

3.7 %) and glucose (Glc, 0.7 – 8.7 %), while xylose (Xyl) was found in lesser

amounts (< 1 %). Content of galacturonic acid (GalA) and homogalacturonan

(HG) was largest in pectins P2, P3, P6 and P9 from lemon (GalA of 70.7 – 83.0 %

and HG of 69.6 – 81.2 %) and lowest in sugar beet pectin (P4) (46.9 % of GalA

and 43.9 % of HG). Additionally, sugar beet pectin was characterized by

relatively higher fractions of RG (50.7 %) and neutral sugars (Gal, Ara and Rha).

Rhamnogalacturonan I (P10) differed from pectins by low percentage of GalA

(11.0 %) and galactose (7.9 %), and high fraction of arabinose (69.9 %),

rhamnose (6.6 %) and xylose (1.8 %). Estimated degree of branching (DBr) of

rhamnosyl residues with neutral sugars side chains varied between 7.4 % (P3)

and 19.2 % (P6).

Alpha-diversity of microbiota

Alpha-diversity of microbiota was affected by the fermentation time and

substrates, as presented by Chao 1 indices (Figures 1A,B) and observed species

number (Supplementary Figures S1 and S2). The Chao 1 values were

significantly increased from 723 ± 22 at baseline to 746 ± 30 after 24 h followed

by gradual decrease to 640 ± 27 after 72 h fermentation (Figure 1A).

Figure 1: Analysis of alpha-diversity over fermentation time and between the pectins presented by Chao1 index. (A) Chao1 at baseline (0 h) and after 24, 48 and 72 h fermentation computed for combined samples (n = 20 for each time point). Asterisks denote the values significantly different from time 0 h (non-parametric Student’s t-test, *p < 0.05, ** p < 0.01). (B) Chao1 after 24 h (brown columns), 48 h (green columns) and 72 h (purple columns) fermentation of pectins P1 – P10 and SIEM, presented by means and standard deviation (bars) from two biological repeats. Superscripts (a, b, c, and d) show significant differences between the substrates at time-points 24 and 48 h (one-way ANOVA, LSD post-hoc t test, p < 0.05). Chao1 indices at 72 h were not significantly different (letters not shown).

Chapter 7_________________________________________________________________________

200

Highest diversity was observed for pectins P7 and P8 (Chao 1 of 724 ± 30 and

765 ± 12 after 48 h, respectively) and lowest for P6 and P9 fermentations (Chao

1 of 653 ± 36 and 651 ± 22 after 48 h, respectively) (Figure 1B). Differences in

alpha-diversity after 72 h fermentation were insignificant. Though the

rarefaction curves did not completely reach a plateau (Supplementary Figure

S2), the coverage estimates (Good’s coverage) were over 98.2 % across the

samples (data not shown), suggesting that sampling depth of 10.000 reads was

sufficient to capture the majority of OTUs.

Group diversity over fermentation time

Analysis of group diversity (beta-diversity) across the sampling times (Figures

2A,B) and the pectins (Figures 3A,B) is presented by the PCoA plots using

unweighted and weighted UniFrac distance matrices.

Unweighted UniFrac matrix is based on the presence/absence of bacterial

species, accounting for both abundant and rare lineages; while the weighted

matrix relies also on the absolute proportions, and it is most sensitive to detect

the changes in dominant taxa. Major shifts in microbial diversity occurred after

24 h fermentation, as seen from both weighted and unweighted PCoA and

confirmed by ANOSIM (p = 0.001) (Figure 2A,B). Differences in group diversity

between the time-points 48, 56 and 72 h were insignificant, especially for

weighted UniFrac (R = 0.002, p = 0.774; Figure 2B), indicating similarity in

microbial communities. Though a pattern of pectin clustering was similar for

both types of analyses (Figure 3A,B), variation between the groups could be best

explained by the weighted PCoA (PC1 66 % and PC2 27 %), suggesting the impact

of abundant bacterial taxa for group differentiation. Pectins P4 and P10 (group

1) were distinctly separated from other substrates along the PC1 (weighted

PCoA, Figure 3B); other clusters combined pectins P1, P2 and P3 (group 2),

pectins P7 and P8 (group 3) and pectins P6 and P9 (group 4, unweighted PCoA,

Figure 3A).

____________________________________________________________ Pectins fermentation

201

Figure 2. Principal Coordinate Analysis (PCoA) plots, showing group diversity over time, 0 – 72 h (middle plots), 0 - 24 h (plots to the left), and 48 - 72 h (plots to the right), assessed by unweighted (A) and weighted (B) UniFrac distance matrices. Samples are colored according to the time-points: blue dots - 0 h, red dots - 24 h, green dots - 48 h, yellow dots - 56 h, and pink dots - 72 h. Samples were collected from two independent fermentations of each substrate (P1 – P10). Group differences were tested by ANOSIM as shown by R-values and p-values. The samples are plotted on the first two principal coordinates PC1 and PC2. The ellipse center indicates group means for each time-point.

● ● ●●

●●

● ●

●●

●●

●●

● ●

●●

●●

●●●●

● ●●●

●●●

●● ●

●●

●●●

● ● ●

●●

● ●●

●●

●●

● ●●

●●

●● ●

●●

●●

●●

● ●

●●●

●●

●●

● ●

PC

1 (1

8%)

PC2 (8%)

PC

1 (1

3%)

PC2 (8%)

R=0

.018

p=0.

081

●●

●●

●●

●●

●● ●

●●

●●

●●

●●

PC

1 (1

5%)

PC2 (7%)

R=0

.579

p=0.

001

0 -

24h

48 -

72h

● ●

●●

● ●

●●

●●

●●

●●

●●

●●

●●

●●

●●

● ●

●●

●●

● ●

●●●●

●●

●●

●● ●

●●

● ●

●●

●●

●●

● ●

● ●

●●

●●

●●

●●

●●

●●

●●

●●

● ●

PC

1 (6

2%)

PC2 (26%)

PC

1 (6

6%)

PC2 (27%)

R=

0.00

2

p=0.

774

●● ● ●●

●●

● ●

●●

●●

● ●

●● ●

●●

● ●

●●●

PC

1 (4

8%)

PC2 (41%)

R=

0.47

7

p=0.

001

48 -

72h

0 -

24h

B

A

Chapter 7_________________________________________________________________________

202

Figure 3: Principal Coordinate Analysis (PCoA), showing group diversity between the pectins, as determined by unweighted (A) and weighted (B) UniFrac distance matrices. PCoA plots were constructed for the samples collected after 48, 56 and 72 h fermentation from two independent experiments (n = 6 for each pectin). The ellipse center indicates group means (P1 – P10). The samples are plotted on the first two principal coordinates PC1 and PC2.

Changes in relative abundances of bacterial species during

fermentation

In total 1218 species-level bacterial OTUs were assigned to more than 150

bacterial taxa. Figure 4 shows the relative abundances of species-level OTUs at

baseline (0 h) and after 48, 56 and 72 h fermentation (cut-off 0.01 %) and the

hierarchical clustering of pectins. Regarding high similarity between the samples

collected after 48 h (Figure 2A,B), statistical differences between the pectins

were evaluated in the pooled dataset (combined 48, 56 and 72 h samples).

●●

●●●

●●

●●●

●●●

●●●

●●●

P1

P10

P2

P3

P4

P5

P6

P7 P8

P9

●●

●●● ●

●●

●●

●●

● ●

●●●

●●

●●

●●

●●

●● ●●● ●

●●

●●●

P1

P10

P2 P3

P4

P5

P6 P7 P8

P9

PC1 (13%)

PC

2 (

8%

)

PC1 (66%)

PC

2 (

27%

)

A B

____________________________________________________________ Pectins fermentation

203

Chapter 7_________________________________________________________________________

204

Figure 4: Heatmap showing distribution of bacterial taxa across the pectins at start (0 h) and after 48 - 72 h fermentation, based on hierarchical clustering (UPGMA). Each row presents relative abundances of OTUs assigned at species level (cut-off 0.01%). Color scale indicates relative abundance in percentage. A color panel above the heatmap shows clustering of pectins labelled by different colors. Arrows and pectins (in brackets) to the right of the heatmap indicate significant increases or decreases in bacterial populations (marked by asterisks). Differences were analyzed for combined samples (48, 56 and 72 h, n = 6 for each pectin) in two independent experiments (a and b), using the Wilcoxon Rank Sum test and Bonferroni multiplicity correction (p < 0.05). Taxa denoted as “Other” indicates ambiguity in the assignment meaning that more than one taxon could be assigned to this cluster at given taxonomic level. Taxa in square brackets indicate a proposed taxonomy.

Four bacterial taxa, i.e., family Lachnospiraceae (19.3 %), family

Ruminococcaceae (16.5 %) and genus Ruminococcus (10.4 %) within phylum

Firmicutes, and species Prevotella copri (18.3 %) within phylum Bacteroidetes

were prevalent at the start of the fermentation (64.5 % in total). Twenty-six

other bacterial populations, belonging to phyla Firmicutes and Bacteroidetes,

were found in moderate abundance (0.1 – 10 %); amongst which Blautia, Dorea,

Coprococcus, Ruminococcus, Faecalibacterium prausnitzii, Bacteroides and

Prevotella were most abundant. Less abundant phyla at baseline were

Actinobacteria (0.41 %), presented mainly by Bifidobacterium and Collinsella,

phylum Proteobacteria (0.09 %), presented by Desulfovibrio spp., Sutterella and

Enterobacteriaceae, and phylum Tenericutes (0.02 %), comprising Anaeroplasma

and order RF39. Fermentation of pectins was accompanied by both general and

pectin-specific shifts in bacterial abundances. Bacterial populations reduced by

all substrates, though to a different extent, included Ruminococcus spp., genera

Blautia, Roseburia, Catenibacterium, Bifidobacterium, Paraprevotella, and

unassigned Lachnospiraceae and Erysipelotrichaceae. Concurrently, proportions

of Lachnospira, Oscillospira, Clostridium, Butyrivibrio, Prevotella, Bacteroides

spp., unclassified family Ruminococcaceae and order Bacteroidales, were

increased. Additionally, the rare taxa within Mogibacterium (phylum Firmicutes),

unassigned family Enterobacteriaceae (phylum Proteobacteria) and order RF39

(phylum Tenericutes) were highly stimulated in all fermentations. Pectin-specific

bacterial shifts which could partially explain grouping of P4 and P10 (Figure 3B),

included enrichment in Prevotella copri, Bacteroides plebeius, versus lower

proportions of unassigned Ruminococcaceae. Fermentations of P5, P6 and P9

(grouped in Figure 3A and Figure 4) differed by high levels of Lachnospira,

Butyrivibrio and Coprococcus (unassigned). Clustering of P7 and P8 (Figures 3A,B

and Figure 4) seemed to be caused by reduction of F. prausnitzii, along with

highly increased abundances of unclassified Clostridiales, Coprococcus and

Proteobacteria (Disulfovibrio D168, Citrobacter, Klebsiella, and Enterobacter).

____________________________________________________________ Pectins fermentation

205

Correlation between bacterial abundances and the structural

properties of pectins

Figure 5 shows correlations between the relative abundances of species-level

OTUs and characteristics of pectins (content of monosaccharides, galacturonic

acid, rhamnogalacturonan fraction, degree of esterification and degree of

branching). The levels of Oscillospira, Blautia, Dorea, Ruminococcus, Coprococcus,

R. torques, Lachnospiraceae and Clostridiales within phylum Firmicutes, and

Paraprevotella, B. uniformis, B. ovatus, P. distasonis and Prevotella within phylum

Bacteroidetes, correlated significantly (r = 0.35 – 0.71, p < 0.05) or showed a

tendency to increase with higher fractions of simple sugars (galactose,

rhamnose, xylose and glucose) and lower content of galacturonic acid and DE

values. Species F. prausnitzii and family Ruminococcaceae showed inverse

correlation with the sugar residues, GalA and DE (r = -0.42 – -0.72, p < 0.01),

compared to bacterial taxa above. Abundance of P. copri correlated positively

with arabinose (r = 0.61, p < 0.001) and DE (r = 0.77, p < 0.001) and negatively

with degree of branching (r = -0.49, p < 0.01). Additionally, genera Coprococcus

and Lachnospira correlated positively with DBr (r = 0.48 – 0.68, p < 0.01) and

negatively (r = -0.48 – -0.82, p < 0.01) with DE and arabinose.

Figure 5. Correlation between the relative abundances of bacterial taxa and the structural characteristics of pectins (P1 – P9), including content of galactose (Gal), rhamnose (Rha), xylose (Xyl), glucose (Glc), arabinose (Ara), and galacturonic acid (GalA), fraction of rhamnogalacturonan (RG), degree of branching (DBr) and degree of esterification (DE).

Chapter 7_________________________________________________________________________

206

Correlation analysis was performed with combined samples (48, 56 and 72 h fermentation), obtained for each pectin in two independent fermentations. Significant correlation is indicated by the Spearman rank correlation coefficient (FDR-adjusted, p < 0.05).

Production of short chain and branched chain fatty acids

The cumulative production of SCFA (acetate, propionate and n-butyrate) after 72

h fermentation is shown in Table 2. The amounts of total SCFA and acetate were

not different between the pectins, comprising 131 – 162 mmol and 81 – 95 mmol,

respectively. Cumulative production of propionate was largest for sugar beet

pectin (P4) (43.3 mmol) and RGI (P10) (47.6 mmol), and differed significantly

from the citrus pectins P2, P5, P6, P7 and P9 (24.2 – 30.1 mmol). Generally, the

HM pectins (P1, P2, P3 and P4) generated significantly higher (p < 0.05) amounts

of propionate and total SCFA compared to LM pectins (P5, P6, P7, P8 and P9).

Production of butyrate was lowest in RGI (P10) fermentations (19.3 mmol) and

statistically different from pectins P1, P2, P3 and P9 (27.9 - 32.9 mmol). The

lowest acetate to propionate ratios (2.0 – 2.4) were determined for P4, P1 and

P10 and highest (3.2 – 3.6) for P5 and P6 fermentations.

Table 2: Cumulative production of acetate, propionate, n-butyrate and total short chain fatty acids (SCFA) after 72 h fermentation of pectins in TIM-2 colon model1 (mmol)

Pectin

ID

Acetate

Propionate n-butyrate Total SCFA Ratio

Acetate/Propionate

P1 86.6 ± 1.6a 36.1 ± 2.3bc 32.9 ± 2.9b 155.6 ± 6.7a 2.4 ± 0.1def

P2 85.0 ± 0.6a 30.1 ± 5.4cd 28.8 ± 2.9bc 143.8 ± 1.9a 2.9 ± 0.5abcd

P3 86.8 ± 3.2a 32.7 ± 1.5bcd 27.9 ± 1.5bc 147.5 ± 3.2a 2.7 ± 0.1cdef

P4 95.3 ± 0.2a 43.3 ± 0.2ab 24.0 ± 1.5cd 162.6 ± 1.5a 2.2 ± 0.1efg

P5 82.7 ± 2.7a 24.3 ± 1.5d 23.9 ± 0.5cd 131.0 ± 3.7a 3.4 ± 0.1ab

P6 87.4 ± 5.6a 24.2 ± 0.6d 26.7 ± 0.9bcd 138.3 ± 3.6a 3.6 ± 0.3a

P7 93.4 ± 11.4a 30.0 ± 1.9cd 24.1 ± 2.2cd 147.5 ± 11.2a 3.1 ± 0.2abcd

P8 92.3 ± 10.1a 32.6 ± 3.4bcd 21.9 ± 3.5cd 146.7 ± 17.0a 2.8 ± 0.1bcde

P9 80.8 ± 2.4a 25.4 ± 2.1cd 28.2 ± 1.3bc 134.3 ± 5.7a 3.2 ± 0.2abc

P10 92.5 ± 2.3a 47.6 ± 8.0a 19.3 ± 1.1d 159.4 ± 11.4a 2.0 ± 0.3fg

SIEM 58.8 ± 3.0b 34.6 ± 3.1bcd 47.9 ± 5.8a 141.4 ± 11.8a 1.7 ± 0.1g

HM/LM2 88.4/87.3ns 35.6/27.3** 28.4/25.0ns 152.4/139.6* 2.55/3.23** 1Mean values (± SD) in lumen and dialysate (combined) from two independent TIM-2

experiments. Total SCFA is a sum of acetic, propionic and butyric acids. Different

superscripts within a column (a, b, c, d, e, f and g) indicate significant differences between

the substrates (one-way ANOVA with Tukey’s post-hoc test, p < 0.05). Pectins are

denoted by codes described in Table 1. SIEM was a basal simulated ileal efflux medium

used for the control TIM-2 experiments. 2 Amounts of SCFA (means) produced by HM pectins (P1, P2, P3 and P4) versus LM

pectins (P5, P6, P7, P8 and P9). Significant differences between the HM and LM pectins

were determined by the two-sided Wilcoxon rank sum test (*p < 0.05; **p < 0.01; ns –

insignificant).

____________________________________________________________ Pectins fermentation

207

Production of i-butyrate, i-valerate and total BCFA were slightly lower in RGI

fermentations, though not significantly different from other treatments

(Supplementary Table S2). The amount of propionate throughout fermentation

(24 – 72 h) correlated positively with P. copri, R. torques and unclassified

Clostridiales, and, negatively, with genera Coprococcus, Butyrivibrio and

Lachnospira (Table 3). Production of butyrate was reduced with increasing

abundances of B. ovatus and Bacteroides after 48 h fermentation. Correlation

between other bacterial taxa and SCFA was insignificant.

Table 3: Correlation between the relative abundances of bacterial taxa and cumulative production of the short chain fatty acids (SCFA) propionate and butyrate after 24, 48 and 72 h fermentation of pectins in TIM-2 colon model

SCFA Bacterial taxa Correlation coefficient, r 1

24 h 48 h 72 h

Propionate s_Prevotella copri 0.80*** 0.81*** 0.73***

g_[Ruminococcus];Other 0.48 ns 0.71** 0.61*

s_[Ruminococcus] torques 0.62* 0.64* 0.67*

o_Clostridiales;Other 0.39 ns 0.61* 0.62*

f_Ruminococcaceae;Other -0.66* -0.69** -0.51

g_Coprococcus;Other -0.73** -0.32 ns -0.72**

g_Butyrivibrio -0.64* -0.73** -0.61*

g_Lachnospira -0.70** -0.80*** -0.77***

Butyrate s_Bacteroides ovatus -0.53 ns -0.79** -0.66*

g_Bacteroides -0.57 ns -0.64* -0.40 ns

1 Spearman rank correlation coefficient (r); asterisks denote significant correlation (FDR-adjusted, *p < 0.05; **p < 0.01; and ***p < 0.001); ns – insignificant.

Discussion

Changes in bacterial abundances was related to species-specific

utilization of pectins

In this study we conducted TIM-2 fermentations with diverse pectins to

investigate the relationship between the structural properties of pectins and the

changes in microbiota composition. We expected that enrichment or reduction

of bacterial populations during fermentations would depend on their ability to

degrade pectins, and/or utilize POS and other metabolites (cross-feeding

interactions). Observed increases in abundances of pectin-degrading bacteria

within the order Bacteroidales, genera Prevotella, Oscillospira, Clostridium, F.

prausnitzii and family Enterobacteriaceae was likely due to pectin utilization

Chapter 7_________________________________________________________________________

208

favouring their growth (22,32–34). Interestingly, shifts in related species of

Bacteroides ovatus, B. plebeius and B. uniformis depended on the substrate, which

can likely be explained by the species-specific activity of pectin-degrading

enzymes and the hierarchical preference of substrate utilization. Accordingly,

Tuncil and coworkers demonstrated that human gut symbionts B.

thetaiotamicron and B. ovatus, grown together on pectic oligosaccharides, had

inverse growth profile, concurrent with a different expression pattern of glycan

utilization genes (35). Preferential utilization of metabolites from pectin

degradation can be expected in this study, regarding the highly competitive

environment in TIM-2. High increases in the genera Butyrivibrio and

Lachnospira, previously shown incapable to break down pectins (36,37), might

be linked to metabolic cross-feeding interactions between the members of the

faecal microbiota.

Health-promoting bacterial populations were selectively modified

by pectins

Various pectin-mediated shifts in this study can be considered as beneficial,

regarding the current knowledge of microbial dysbiosis, related to obesity and

IBD. Thus, it was previously shown that obesity-related bias in the gut

microbiota included higher levels of Blautia, Eubacterium, Roseburia, Dorea and

Ruminococcus, along with reduction of F. prausnitzii, Oscillospira,

Christensenellaceae, Prevotella, Bacteroides and genera within Proteobacteria

(34,38–42). Besides, R. torques and R. gnavus, decreased in this study, were found

in higher numbers in IBD patients (43). Notably, shifts in F. prausnitzii,

Coprococcus, B. ovatus, B. plebeius, P. copri and Sutterella were strongly

dependent on the type of pectin, suggesting that these species can be modulated

by usage of specific pectins. Among them, F. prausnitzii, is commonly referred to

as a marker for intestinal health, exhibiting anti-inflammatory effects in the gut

(44). This study indicated that stimulation of F. prausnitzii could be achieved by

fermentation of HM pectins (P1 - P3) rather than LM pectins (P7 and P8). In their

turn, LM citrus pectins (P5 – P9) were efficient to decrease proportions of P.

copri, a microbe associated with induced insulin resistance in mice and

rheumatoid arthritis in humans (45,46). However, in other studies, P. copri was

referred to as a beneficial microbe, as it was enriched in the colon of healthy

subjects, who exhibited improved glucose metabolism following consumption of

barley-based bread (47). LM citrus pectins (P5 – P9) were found to increase the

levels of Coprococcus (mostly P7), which is linked to reduced severity of IBS and

autism in humans (48,49). An increase in B. plebeius, selectively stimulated by

____________________________________________________________ Pectins fermentation

209

SBP (P4) and RGI (P10) in this study, is known to be related to remission pattern

of microbiota in Crohn's disease patients (50).

Production of propionate, butyrate and total SCFA differed between

the pectins

The overall production of propionate was highest in RGI (P10) fermentations

and in fermentations of HM pectins (especially SBP [P4]) and correlated

positively with the relative abundances of P. copri, Ruminococcus spp, and

unidentified Clostridiales, suggesting that these species were able to generate

propionate from pectin. Supporting our results, Gulfi and coworkers reported

that HM pectins had a tendency to produce larger amounts of propionic acid in

batch fecal fermentations, compared to LM pectins (51). Additionally, the ability

of Prevotella and Ruminococcus to produce propionate was recently confirmed

by genomic analysis of colonic anaerobes combined with growth experiments

(52,53). Production of propionate by Ruminococcus is known to be enhanced in

the presence of rhamnose and fucose (53), which are the common structural

units of pectin molecules. Consequently, increased production of propionate in

SBP (P4) and RGI (P10) fermentations might be related to the relatively higher

content of rhamnose and other neutral sugars. Interestingly, the acetate to

propionate ratios were found to be reduced in RGI (P10) and the HM pectin

group, lowest for SBP (P4) and harsh extracted pectin from orange (P1). Lower

acetate/propionate ratios have been associated with an anti-cholesterolemic

effect and reduction of cardiovascular disease risk, and are generally considered

as beneficial (54). The lowest amount of butyrate was detected in RGI (P10)

fermentations, which might be explained by depletion of F. prausnitzii, a

predominant butyrate producer in the gut (55). The negative correlation

between butyrate and the numbers of Bacteroides spp. was probably related to

their inability to produce butyrate (55). Production of SCFA in fermentations of

citrus pectins (P1 – P3 and P5 – P9) was not statistically different, despite the

differences in microbiota composition. This effect was presumably caused by the

functional redundancy of microbial populations and the metabolic cross-feeding

interactions (17).

Changes in microbiota were related to the structural features of

pectins.

Shifts in bacterial abundances in TIM-2 fermentations were related to the

structural features of pectins. We identified at least five factors essential for

microbiota shaping: (i) degree of esterification of polygalacturonic acid, (ii)

composition of neutral sugars, (iii) distribution of HG and RG fractions, (iv)

Chapter 7_________________________________________________________________________

210

degree of branching and (v) modification of pectic backbone, e.g., by amidation.

Degree of esterification is probably the most important parameter, as seen from

the beta-diversity analysis and the correlation of bacterial taxa with DE. So far,

only few studies indicated a link between the DE in pectins and microbiota

composition. In agreement with our results, enrichment in Prevotella spp. was

found in colonic microbiota of pigs fed with LM pectins, while genus Bacteroides

was increased in fecal batch fermentations of LM pectin contrary to HM pectin

(23,25). Results of the correlation analysis (Figure 5) pointed out the possibility

of differential stimulation of bacterial populations using pectins with different

sugar content, especially rhamnose and galactose. Thus, correlation of F.

prausnitzii with the major sugars (negative) and GalA/DE (positive) suggested,

that HM pectins with high fraction of HG over RG would be preferable for growth

of this beneficial microbe. Interestingly, arabinose differed from other sugars,

correlating positively with P. copri and negatively with Coprococcus and

Lachnospira. Both Lachnospira spp. and P. copri possess α-arabinofuranosidase

activity (56), having the potential to degrade arabinan side chains in pectin

molecules. Thus, this inverse correlation is most probably linked to the

differences between bacterial species in activity of arabinanolytic enzymes and

the metabolic hierarchy as discussed above. Unexpectedly, we observed

similarity in microbiota profiling between the structurally different substrates,

sugar beet pectin (P4) and RGI (P10). This similarity might be associated with

HG/RG distribution, as both SBP and RGI were distinguished by the low HG

(GalA) and high RG content compared to other pectins. Similarity between

pectins P7 and P8 is most probably attributed to amidation of the C-6 uronate

groups in addition to the equally low DE values. It is well-known that structural

features of pectins affect their rheological behavior and functional properties,

e.g., gelling capacity, viscosity, molecular conformation and solubility (2). We

suppose that these properties might also have an impact on substrate-bacterial

interactions and pectin utilization in microbiota fermentations. Furthermore,

carboxyl groups in the polygalacturonic chains can be involved in electrostatic

interactions and, together with amide groups, in hydrogen bonding. In a previous

study, we observed that the surface charge (or zeta-potential) of the LM pectins,

was lower than that of HM pectins, due to the higher fraction of non-esterified

carboxyl groups (8). Lower zeta-potential in LM pectins indicated stronger

electrostatic repulsion upon interactions with bacterial cell wall groups

(hydroxyl, carboxyl, etc.) negatively charged at neutral pH (57). High degree of

branching and RG fraction can either provide steric hindrance or contribute to

hydrophobic interactions with non-polar groups in bacterial cell walls.

Involvement in the different types of interactions could explain the opposite

____________________________________________________________ Pectins fermentation

211

correlation found for DE (and galacturonic acid) compared to DBr and neutral

sugars with bacterial taxa in this study. Differences in the distribution of

structural groups would govern molecular conformation in pectins and, thus,

exposure of carbohydrate chains to enzymatic cleavage and interactions with

bacterial cell surface molecules. It may, consequently, result in different rates of

substrate utilization and metabolite profiles, and drive pectin-specific

differences in microbiota shaping.

In conclusion, this study provided evidence that modulation of the gut

microbiota by pectins depended on their structural features. We identified

specific bacterial taxa which abundances were differentially affected by pectins

and proposed the main factors, linked to the differences in microbiota

composition. Understanding of the interplay between the gut commensals and

the structural properties of pectins is essential to predict physiological effects of

ingested pectins and to provide ideas for development of pectin-containing

dietary fibres, targeting beneficial bacteria to facilitate more balanced

microbiota profiles. It can be also relevant to verify our findings in relation to

other microbiotas, e.g., from diseased subjects. Additionally, further comparative

in vitro and in vivo studies with structurally diverse pectins and their derivatives

are needed to achieve detailed knowledge of structure-function relationship of

pectins in the gut.

Availability of data and material The metadata have been deposited in the European Nucleotide Archive (ENA)

database [accession number: PRJEB25646].

Conflict of interest The authors declare no conflict of interest.

Funding The research was funded by the Danish Council for Strategic Research (DSR,

project BioSyn, no. 3050-00005B) within the frame of the project “Strategic

Research Collaboration in Food Science in the State of São Paulo, Brazil and

Denmark” and supported by the Brazilian National Council for Scientific and

Technological Development (CNPq-Brazil), the Program “Science without

Borders”. From the CNPq-Brazil Carlota Bussolo de Souza received a scholarship

246027/2012-6, and Thiago Cahu - scholarship 233521/2014-3. This research

has additionally been supported by the Dutch Province of Limburg.

Chapter 7_________________________________________________________________________

212

Acknowledgments The authors thank technician Wendy Borst (Maastricht University, Venlo) for

assistance in the TIM-2 experiments.

Author contributions

LJ, NL, KV and AB conceived, planned and coordinated the study; KV, CBS

performed fermentations, sample collection and SCFA analysis; NL conducted

microbiota analysis and wrote manuscript; LK and WK performed sequencing

and bioinformatics; KMH and TBC participated in production and

characterization of pectins; MW advised in statistical analysis. All authors read

and approved the final manuscript.

____________________________________________________________ Pectins fermentation

213

References 1. Regulation (EC) No 1333/2008 of the European Parliament and of the

Council of 16 December 2008 on food additives. Off J Eur Union. 2008;L 354:16–33.

2. Sila DN, Van Buggenhout S, Duvetter T, Van Loey A, Hendrickx M. Pectins in processed fruits and vegetables: Part II-Structure function relationships. Compr Rev Food Sci Food Saf. 2009;8(2):105–17.

3. Chan SY, Choo WS, Young DJ, Loh XJ. Pectin as a rheology modifier: Origin, structure, commercial production and rheology. Carbohydr Polym. 2017;161:118–39.

4. Fukunaga T, Sasaki M, Araki Y, Okamoto T, Yasuoka T, Tsujikawa T, et al. Effects of the soluble fibre pectin on intestinal cell proliferation, fecal short chain fatty acid production and microbial population. Digestion. 2003;67:42–9.

5. Shinohara K, Ohashi Y, Kawasumi K, Terada A, Fujisawa T. Effect of apple intake on fecal microbiota and metabolites in humans. Anaerobe. 2010;16:510–5.

6. Schwartz SE, Levine RA, Weinstock RS, Petokas S, Mills CA, Thomas FD. Sustained pectin ingestion: Effect on gastric emptying and glucose tolerance in non-insulin-dependent diabetic patients. Am J Clin Nutr. 1988;48:1413–7.

7. Parkar SG, Redgate EL, Wibisono R, Luo X, Koh ETH, Schröder R. Gut health benefits of kiwifruit pectins: Comparison with commercial functional polysaccharides. J Funct Foods. 2010;2:210–8.

8. Larsen N, Cahú TB, Marta S, Saad I, Blennow A, Jespersen L. The effect of pectins on survival of probiotic Lactobacillus spp. in gastrointestinal juices is related to their structure and physical properties. Food Microbiol. 2018;74:11–20.

9. Sulek K, Vigsnaes LK, Schmidt LR, Holck J, Frandsen HL, Smedsgaard J, et al. A combined metabolomic and phylogenetic study reveals putatively prebiotic effects of high molecular weight arabino-oligosaccharides when assessed by invitro fermentation in bacterial communities derived from humans. Anaerobe. 2014;28:68–77.

10. Gómez B, Gullón B, Yáñez R, Schols H, Alonso JL. Prebiotic potential of pectins and pectic oligosaccharides derived from lemon peel wastes and sugar beet pulp: A comparative evaluation. J Funct Foods. 2016;20:108–21.

11. Manderson K, Pinart M, Tuohy KM, Grace WE, Hotchkiss AT, Widmer W, et al. In vitro determination of prebiotic properties of oligosaccharides derived from an orange juice manufacturing by-product stream. Appl Environ Microbiol. 2005;71(12):8383–9.

12. Leijdekkers AGM, Aguirre M, Venema K, Bosch G, Gruppen H, Schols HA. In vitro fermentability of sugar beet pulp derived oligosaccharides using human and pig fecal inocula. J Agric Food Chem. 2014;62(5):1079–87.

13. Onumpai C, Kolida S, Bonnin E, Rastall RA. Microbial utilization and

Chapter 7_________________________________________________________________________

214

selectivity of pectin fractions with various structures. Appl Environ Microbiol. 2011;77(16):5747–54.

14. Aguirre M, Jonkers DMAE, Troost FJ, Roeselers G, Venema K. In vitro characterization of the impact of different substrates on metabolite production, energy extraction and composition of gut microbiota from lean and obese subjects. PLoS One. 2014;9(11):e113864.

15. Chen J, Liang RH, Liu W, Li T, Liu CM, Wu SS, et al. Pectic-oligosaccharides prepared by dynamic high-pressure microfluidization and their in vitro fermentation properties. Carbohydr Polym. 2013;91(1):175–82.

16. Gómez B, Gullón B, Remoroza C, Schols HA, Parajó JC, Alonso JL. Purification, characterization, and prebiotic properties of pectic oligosaccharides from orange peel wastes. J Agric Food Chem. 2014;62:9769–82.

17. Reichardt N, Vollmer M, Holtrop G, Farquharson FM, Wefers D, Bunzel M, et al. Specific substrate-driven changes in human faecal microbiota composition contrast with functional redundancy in short-chain fatty acid production. ISME J. 2018 Feb;12(2):610–22.

18. Martens EC, Lowe EC, Chiang H, Pudlo NA, Wu M, McNulty NP, et al. Recognition and degradation of plant cell wall polysaccharides by two human gut symbionts. PLoS Biol. 2011;9(12):e1001221.

19. Grondin JM, Tamura K, Déjean G, Abbott DW, Brumer H. Polysaccharide utilization loci: Fueling microbial communities. J Bacteriol. 2017;199(15):e00860-16.

20. Wicker L, Kim Y, Kim MJ, Thirkield B, Lin Z, Jung J. Pectin as a bioactive polysaccharide - Extracting tailored function from less. Food Hydrocoll. 2014;42(P2):251–9.

21. Vogt LM, Sahasrabudhe NM, Ramasamy U, Meyer D, Pullens G, Faas MM, et al. The impact of lemon pectin characteristics on TLR activation and T84 intestinal epithelial cell barrier function. J Funct Foods. 2016;22:398–407.

22. Olano-Martin E, Gibson GR, Rastall RA. Comparison of the in vitro bifidogenic properties of pectins and pectic-oligosaccharides. J Appl Microbiol. 2002;93(3):505–11.

23. Dongowski G, Lorenz A, Proll J. The degree of methylation influences the degradation of pectin in the intestinal tract of rats and in vitro. J Nutr. 2002 Jul;132(7):1935–44.

24. Li P, Xia J, Nie Z, Shan Y. Pectic oligosaccharides hydrolyzed from orange peel by fungal multi-enzyme complexes and their prebiotic and antibacterial potentials. LWT - Food Sci Technol. 2016;69:203–6.

25. Tian L, Bruggeman G, van den Berg M, Borewicz K, Scheurink AJW, Bruininx E, et al. Effects of pectin on fermentation characteristics, carbohydrate utilization, and microbial community composition in the gastrointestinal tract of weaning pigs. Mol Nutr Food Res. 2017;61(1):1600186.

26. Yapo B, Koffi K. Extraction and characterization of highly gelling low

____________________________________________________________ Pectins fermentation

215

methoxy pectin from cashew apple pomace. Foods. 2013;3:1–12. 27. Venema K. The TNO In Vitro Model of the Colon ( TIM-2 ). In: Verhoeckx

K, Cotter P L-EI, editor. The Impact of Food Bioactives on Health: in vitro and ex vivo models. Cham (CH): 2015. p. 293–304.

28. Thakur BR, Singh RK, Handa AK. Chemistry and Uses of Pectin - A Review. Crit Rev Food Sci Nutr. 1997;37(1):47–73.

29. Williams AR, Hansen TVA, Krych L, Ahmad HF Bin, Nielsen DS, Skovgaard K, et al. Dietary cinnamaldehyde enhances acquisition of specific antibodies following helminth infection in pigs. Vet Immunol Immunopathol. 2017;189:43–52.

30. Caporaso JG, Kuczynski J, Stombaugh J, Bittinger K, Bushman FD, Costello EK, et al. QIIME allows analysis of high-throughput community sequencing data. Vol. 7, Nature methods. United States; 2010. p. 335–6.

31. Mcdonald D, Price MN, Goodrich J, Nawrocki EP, Desantis TZ, Probst A, et al. An improved Greengenes taxonomy with explicit ranks for ecological and evolutionary analyses of bacteria and archaea. ISME J. 2012;6(3):610–8.

32. Abbott DW, Boraston AB. Structural biology of pectin degradation by Enterobacteriaceae. Microbiol Mol Biol Rev. 2008;72(2):301–16.

33. Lopez-Siles M, Khan TM, Duncan SH, Harmsen HJM, Garcia-Gil LJ, Flint HJ. Cultured representatives of two major phylogroups of human colonic Faecalibacterium prausnitzii can utilize pectin, uronic acids, and host-derived substrates for growth. Appl Environ Microbiol. 2012;78(2):420–8.

34. Tims S, Derom C, Jonkers DM, Vlietinck R, Saris WH, Kleerebezem M, et al. Microbiota conservation and BMI signatures in adult monozygotic twins. ISME J. 2013;7:707–17.

35. Tuncil YE, Nakatsu CH, Kazem AE, Arioglu-Tuncil S, Reuhs B, Martens EC, et al. Delayed utilization of some fast-fermenting soluble dietary fibers by human gut microbiota when presented in a mixture. J Funct Foods [Internet]. 2017 May;32:347–57.

36. Flint HJ, Scott KP, Duncan SH, Louis P, Forano E. Microbial degradation of complex carbohydrates in the gut. Vol. 3, Gut Microbes. 2012. p. 289–306.

37. van Laere KMJ, Hartemink R, Bosveld M, Schols HA, Voragen AGJ. Fermentation of plant cell wall derived polysaccharides and their corresponding oligosaccharides by intestinal bacteria. J Agric Food Chem. 2000;48:1644–52.

38. Goodrich JK, Waters JL, Poole AC, Sutter JL, Koren O, Blekhman R, et al. Human genetics shape the gut microbiome. Cell Novemb. 2014;159(4):789–99.

39. Nadal I, Santacruz A, Marcos A, Warnberg J, Garagorri M, Moreno L, et al. Shifts in clostridia, bacteroides and immunoglobulin- coating fecal bacteria associated with weight loss in obese adolescents. Int J Obes. 2009;33(10):758–67.

40. Verdam FJ, Fuentes S, De Jonge C, Zoetendal EG, Erbil R, Greve JW, et al.

Chapter 7_________________________________________________________________________

216

Human intestinal microbiota composition is associated with local and systemic inflammation in obesity. Obesity. 2013;21:E607–15.

41. Furet JP, Kong LC, Tap J, Poitou C, Basdevant A, Bouillot JL, et al. Differential adaptation of human gut microbiota to bariatric surgery-induced weight loss: Links with metabolic and low-grade inflammation markers. Diabetes. 2010;59:3049–57.

42. Kasai C, Sugimoto K, Moritani I, Tanaka J, Oya Y, Inoue H, et al. Comparison of the gut microbiota composition between obese and non-obese individuals in a Japanese population, as analyzed by terminal restriction fragment length polymorphism and next-generation sequencing. BMC Gastroenterol. 2015;15(1):100.

43. Png CW, Lindén SK, Gilshenan KS, Zoetendal EG, McSweeney CS, Sly LI, et al. Mucolytic bacteria with increased prevalence in IBD mucosa augment in vitro utilization of mucin by other bacteria. Am J Gastroenterol. 2010;105:2420–8.

44. Walters WA, Xu Z, Knight R. Meta-analyses of human gut microbes associated with obesity and IBD. FEBS Lett. 2014 Nov;588(22):4223–33.

45. Pedersen HK, Gudmundsdottir V, Nielsen HB, Hyotylainen T, Nielsen T, Jensen BAH, et al. Human gut microbes impact host serum metabolome and insulin sensitivity. Nature. 2016;535:376–81.

46. Pianta A, Arvikar S, Strle K, Drouin EE, Wang Q, Costello CE, et al. Evidence of the immune relevance of prevotella copri, a gut microbe, in patients with rheumatoid arthritis. Arthritis Rheumatol. 2017;69(5):964–75.

47. Kovatcheva-Datchary P, Nilsson A, Akrami R, Lee YS, De Vadder F, Arora T, et al. Dietary fiber-induced improvement in glucose metabolism is associated with increased abundance of Prevotella. Cell Metab [Internet]. 2015 Dec 1;22(6):971–82.

48. Tap J, Derrien M, Törnblom H, Brazeilles R, Cools-portier S, Doré J, et al. Identification of an intestinal microbiota signature associated with severity of Irritable Bowel Syndrome. Gastroenterology. 2017;152(1):111–23.

49. Kang D, Park JG, Ilhan ZE, Wallstrom G, Labaer J, Adams JB, et al. Reduced incidence of Prevotella and other fermenters in intestinal microflora of autistic children. 2013;8(7):e68322.

50. Mondot S, Lepage P, Seksik P, Allez M, Tréton X, Bouhnik Y, et al. Structural robustness of the gut mucosal microbiota is associated with Crohn’s disease remission after surgery. Gut. 2016;65:954–62.

51. Gulfi M, Arrigoni E, Amadò R. Influence of structure on in vitro fermentability of commercial pectins and partially hydrolysed pectin preparations. Carbohydr Polym. 2005;59:247–55.

52. Chen T, Long W, Zhang C, Liu S, Zhao L, Hamaker BR. Fiber-utilizing capacity varies in Prevotella- versus Bacteroides-dominated gut microbiota. Sci Rep. 2017;7:2594.

53. Reichardt N, Duncan SH, Young P, Belenguer A, Leitch CM, Scott KP, et al. Phylogenetic distribution of three pathways for propionate production

____________________________________________________________ Pectins fermentation

217

within the human gut microbiota. ISME J. 2014;8(10):1323–35. 54. den Besten G, van Eunen K, Groen AK, Venema K, Reijngoud D-J, Bakker

BM. The role of short-chain fatty acids in the interplay between diet, gut microbiota, and host energy metabolism. J Lipid Res. 2013;54:2325–40.

55. Louis P, Flint HJ. Formation of propionate and butyrate by the human colonic microbiota. Environ Microbiol. 2017;19(1):29–41.

56. Dodd D, Mackie RI, Cann IKO. Xylan degradation, a metabolic property shared by rumen and human colonic Bacteroidetes. Mol Microbiol. 2011;79(2):292–304.

57. Jiang W, Saxena A, Song B, Ward BB, Beveridge TJ, Myneni SCB. Elucidation of functional groups on gram-positive and gram-negative bacterial surfaces using Infrared spectroscopy. Langmuir. 2004;20:11433–42.

Chapter 7_________________________________________________________________________

218

Supplemental material

Supplementary Table S1: Structural properties of pectins used in this study (%) 1 ID DE GalA Gal Ara Rha Glc Xyl HG RG DBr

P1 58.8 66.18 ± 1.94 bc

18.73 ± 0.73 abc

2.81 ± 0.41 d

2.64 ± 0.19 bcd

8.73 ± 0.48 a

0.63 ± 0.03 bc

63.54 ± 1.60 bc

26.82 ± 1.92 c

14.9 ± 0.3ab

P2 70.0 73.10 ± 2.24 ab

14.78 ± 0.56 bc

7.10 ± 0.21 bcd

1.79 ± 0.12 cd

1.98 ± 0.11 bc

0.25 ± 0.01 d

71.30 ± 0.49 b

25.47 ± 1.88 c

10.8 ± 0.2 b

P3 74.7 70.67 ± 1.70 b

10.42 ± 0.39 c

15.18 ± 0.20 bc

1.50 ± 0.19 d

1.14 ± 0.20 c

0.29 ± 0.01 d

69.17 ± 0.17 b

28.60 ± 1.48 c

7.4 ± 1.0 b

P4 59.3 46.91 ± 3.96 d

27.95 ± 1.78 ab

16.67 ± 1.42 b

3.05 ± 0.12 abc

3.66 ± 0.19 bc

0.51 ± 0.02 bc

43.86 ± 2.29 d

50.72 ± 2.69 b

7.9 ± 1.0 b

P5 11.4 59.88 ±

0.59 c 26.83 ± 0.67 ab

2.80 ± 0.09 d

3.72 ± 0.47 ab

4.55 ± 0.16 b

0.76 ± 0.08 b

56.16 ± 1.02 c

37.07 ± 2.57 bc

15.6 ± 1.6 ab

P6 31.8 82.03 ± 7.10 a

9.07 ± 0.93 c

4.25 ± 0.29 cd

1.77 ± 0.13 cd

0.70 ± 0.29 c

0.21 ± 0.01d

81.25 ± 3.56 a

16.87 ± 1.20 d

19.2 ± 2.8 a

P7 28.8 67.30 ± 1.88 bc

22.03 ± 0.45 abc

3.14 ± 0.17 cd

2.86 ± 0.24 bcd

2.71 ± 0.18 bc

0.39 ± 0.02 cd

64.45 ± 1.14 bc

30.87 ± 0.32 c

15.1± 2.5 ab

P8 29.5 52.91 ± 0.25 cd

30.67 ± 2.60 a

2.80 ± 0.14 d

2.41 ± 0.34 bcd

8.48 ± 0.70 a

0.80 ± 0.07 b

50.50 ± 0.18 cd

38.29 ± 2.57 bc

8.3 ± 0.1 b

P9 35.6 72.95 ± 2.22 ab

21.22 ± 0.37 abc

0.82 ± 0.22 d

1.72 ± 0.15 cd

1.52 ± 0.31c

0.49 ± 0.02 bcd

71.24 ± 0.57 b

25.47 ± 1.79 c

10.4 ± 1.8 b

P10 nd 11.02 ± 1.10 e

7.92 ± 4.44 c

69.92 ± 4.98 a

6.62 ± 0.98 a

1.67 ± 0.58 bc

1.78 ± 0.09 a

4.41 ± 2.72 e

91.08 ± 2.50 a

8.5 ± 1.2 b

1 DE: degree of esterification; Monosaccharides: Galacturonic acid (GalA), arabinose (Ara), rhamnose (Rha), galactose (Gal), glucose (Glc) and xylose (Xyl) were quantified by high performance anion exchange chromatography equipped with a PA20 column (HPAEC-PAD) and presented by mean values ± SD from two repeats. Calculated values: homogalacturonan, HG% = GalA% – Rha%, rhamnogalacturonan, RG% = 2Rha% + Ara% + Gal%, and degree of branching DBr% = 100 % × Rha%/(Ara% + Gal%). The structural characteristics of pectins have been reported previously (Larsen et al., 2018). Statistical analysis was performed in this study, except for DBr. Superscripts (a, b, c, d, and e) within a column show significant differences (p < 0.05) between the pectins, determined by one-way ANOVA, Tukey's post-hoc test. nd: not determined.

Supplementary Table S2: Cumulative production of branched chain fatty acids (BCFA) iso-butyrate and iso-valerate after 72 h fermentation of pectins and SIEM in TIM-2 colon model 1

Pectins ID

iso-butyrate, mmol

iso-valerate, mmol

Total BCFA, mmol

P1 5.1 ± 0.8 17.9 ± 3.1 23.1 ± 3.9 P2 4.0 ± 0.6 15.4 ± 0.8 19.4 ± 0.2 P3 5.0 ± 0.9 14.7 ± 0.5 19.6 ± 1.4 P4 5.1 ± 0.7 13.1 ± 0.6 18.2 ± 1.3 P5 5.0 ± 0.1 14.4 ± 0.6 19.4 ± 0.7 P6 4.7 ± 0.8 14.2 ± 0.4 18.9 ± 1.2 P7 4.8 ± 0.3 15.9 ± 0.8 20.7 ± 1.2 P8 4.8 ± 0.5 15.4 ± 2.3 20.2 ± 2.8 P9 4.0 ± 0.3 13.8 ± 1.9 17.8 ± 2.2 P10 2.9 ± 0.9 9.4 ± 1.4 12.3 ± 1.9 SIEM 3.0 ± 0.5 18.2 ± 4.4 21.3 ± 4.8

1 Mean values (± SD) in lumen and dialysate samples (combined) from two independent

TIM-2 experiments. Total BCFA is a sum of iso-butyrate and iso-valerate. Pectin codes

____________________________________________________________ Pectins fermentation

219

are explained in Table 1. The amount of BCFA at the start of fermentations has been set

to zero. SIEM is the basal simulated ileal efflux medium used in control experiments.

Figure S1: Boxplots show changes in the number of observed species in TIM-2 fermentations of pectins (combined samples) over time: baseline (0 h) and after 24, 48 and 72 h (center line, median; box limits, first and third quartiles; whiskers, 1.5 × interquartile range). Asterisks denote significant differences compared to baseline (non-parametric Student’s t-test employing Monte Carlo method, *p < 0.05, ** p < 0.01).

Chapter 7_________________________________________________________________________

220

A

B

Figure S2: Rarefaction curves showing the number of observed species after 48 h (A) and 72 h (B) fermentation of pectin (P1 – P9) and RGI (P10) by fecal microbiota in TIM-2 colon model. Microbiota composition was analyzed using NextSeq Illumina DNA amplicon sequencing (V3 region of 16S rRNA gene). Rarefaction curves were generated from the rarefied OTU tables (10.000 reads per sample) as shown by the mean values (±SD) from two independent TIM-2 experiments.

0

100

200

300

400

500

600

700

0 2000 4000 6000 8000 10000

Nu

mb

er o

f O

bse

rved

Sp

ecie

s

Number of reads

48 h P1

P2

P3

P4

P5

P6

P7

P8

P9

P10

SIEM

0

100

200

300

400

500

600

0 2000 4000 6000 8000 10000

Nu

mb

er o

f O

bse

rved

Sp

ecie

s

Number of reads

72 h P1

P2

P3

P4

P5

P6

P7

P8

P9

P10

SIEM

Chapter 8 General discussion

Chapter 8_________________________________________________________________________

222

Motivation and aim of the research The research described in this PhD thesis was part of the program entitled

“Science without borders” launched in 2011 by the Brazilian government. The

objective of this program was to promote the consolidation, expansion,

innovation and competitiveness of Brazilian science and technology through

exchange and international mobility of Brazilian students and researchers to

the best universities around the globe. Through international collaboration, the

program granted scientific projects in areas considered essential for the

development and growth of Brazil. The research carried out and presented in

this thesis fitted in the area of “biology, biomedical sciences and health” from

the program. Of note, the international collaborations should enable Brazilian

researchers to receive knowledge from the top universities to be applied

thereafter in Brazil. In turn, this can be translated into self-sufficiency and

economic growth, with the main and final goal of promoting a positive impact

on the quality of life of the Brazilian population.

Modern society faces a number of challenges that are life-threatening if not

taken care of. These range from global warming, with devastating effects on the

climate and sea level, to undernutrition in parts of the world and overnutrition

associated with a range of health issues in other parts of the world. Moreover,

with the growing world population, it becomes increasingly difficult to feed all

of those mouths, certainly in a sustainable manner. There is increased pressure

on use of land, which must be used for both agriculture and building.

Essentially this means that agriculture should be performed as efficient as

possible, to allow maximum yield, at the same time keeping food quality and

food safety in mind. Currently, it is estimated that 30% of food production is

wasted somewhere along the food chain. This could be due to e.g. i) loss of

biomass in food-processing, where waste is thrown away, ii) disposal of food

products that have passed the expiration date, iii) food spoilage, or iv) not

consuming all the food that is prepared by consumers at home. If this could

largely be prevented, at least for the near future part of the problem of food

availability for the growing world population could be solved.

Paradoxically, currently a large part of the world deals with overconsumption,

with associated so-called “Western diseases”, such as obesity, hypertension,

type II diabetes (T2D) and cardiovascular disease (CVD). Taking obesity as an

example, overconsumption together with a sedentary life-style in modern

society leads to a dysbalance in energy expenditure, causing weight gain. Apart

from food intake and energy expenditure however, the gut microbiota has also

been shown to play an important role in obesity (1). The trillions of microbes

_______________________________________________________________ General discussion

223

that live inside our gut interact with us (the host) at numerous levels, including

the immune system, metabolism and even the brain (2). It goes beyond the

scope of this discussion to review the knowledge on the role of the microbiota

in obesity. For this I refer to Chapter 1 of this thesis.

The primary aim of this thesis was to address some of the challenges modern

society faces by studying the use of food processing waste in the context of

modulating the gut microbiota in obesity, such that this would provide a health

benefit. In this manner, deaths associated with obesity (and T2D, CVD) would

be reduced. At the same time, this is done in a sustainable manner of food use,

accompanied by efficient use of resources used to prepare the food, such as

land, water, and labour.

The main focus of the present research was to investigate the potential

prebiotic effects of by-products (waste) from the Brazilian food processing

industry of cassava, orange and passion fruit. Differences in fermentation were

assessed when using a microbiota originating from lean or obese individuals,

and in addition to the Brazilian food by-products the fibres arabinogalactan and

inulin were used. The effects of different types of pectins extracted from other

diverse food by-products were also evaluated. The approach used was in vitro

fermentation in the validated TIM-2 model. Raw by-products and their alcohol

insoluble solid (AIS) fractions (representing the dietary fibre part) were

characterized and used for in vitro fermentation. Gut microbiota compositional

changes, metabolite production and characterization of the intermediate

degradation products in the chyme were evaluated upon addition of the

different substrates. The knowledge gained in this research gives the basis for

further research aiming at the valorisation of these by-products and the results

showed that the by-products could be used as an alternative tool to improve

intestinal health and consequently offer an additional approach to tackle

obesity.

Chapter 8_________________________________________________________________________

224

Potential prebiotic effects of food by-products - main findings The data presented in this thesis show that the tested food by-products –

cassava bagasses, orange bagasses and passion fruit peels – are promising

candidates to become prebiotics in the future (defined as “a substrate that is

selectively utilized by host microorganisms conferring a health benefit” (3)).

Although there is an urgent need to solve the problem of by-products

generation and their proper utilization, few researchers are focusing on testing

the potential prebiotic effects in fibre rich food by-products. In this thesis, we

have evaluated eight by-products from Brazilian food industry, and from four

samples of orange bagasses and passion fruit peels we also evaluated the

isolated fibres (AIS).

The in vitro experiments in TIM-2 showed that in general, the food by-products

were used by the gut microbiota, and their fermentation resulted in similar

amounts of total cumulative production of the beneficial metabolites – SCFA

(acetate, propionate and butyrate) as our standard medium (SIEM) and the

positive control (inulin), as shown in Figure 1 (Chapters 3-5).

Figure 1: Production of SCFA (acetate, propionate and butyrate) by the obese

microbiota after 72 hours fermentation period with different test compounds, control

and inulin (positive control) (Chapter 4).

The effects that each by-product had on gut microbiota composition differed

according to the type of by-product and the main findings are briefly discussed

in the following section.

Cassava bagasses (Chapters 2-4).

Fermentation of two samples of cassava bagasses in two sets of different

experiments were found to stimulate the increase in abundance of the

beneficial genus Bifidobacterium (Chapters 3 and 4).

_______________________________________________________________ General discussion

225

Few studies have investigated the effects of CB on the gut microbiota. A study

performed with the isolated fibre from cassava (not cassava bagasse) was used

in an in vitro experiment with human faecal inoculum, and though only SCFA

were measured, cassava was found to stimulate the production of butyrate (4).

An experiment in rats showed an increase in Lactobacillus counts and reduction

of Escherichia coli in animals that received cassava fibre-based diet (5).

Although our results were not similar to those found in the literature, still our

studies with CBs resulted in promising potential prebiotic effects,

demonstrating that CBs could be further explored in the context of intestinal

health.

Orange bagasses (Chapters 4 and 5).

The main findings about gut bacterial fermentation of orange bagasses were

that despite OB1 and OB2 having similar chemical composition (Chapter 2),

their fermentation profile differed regarding the production of SCFA and the

effects that they had on the composition of the microbiota (Chapter 4). At first,

our hypothesis was that even small differences in chemical composition may

had an divergent effect on the gut microbiota. However, in a different set of

experiments with the isolated fibre (AIS) from OBs (A-OB1 and A-OB2)

(Chapter 5), it was very interesting to observe that also the chemical

composition between the AIS fractions from the two tested OB was very

similar, and still, A-OB1and A-OB2 had a distinct fermentation profiles, even

more different than the results found with the untreated fibres (Chapter 4).

This difference can be explained by solubility. Importantly, this difference in

polysaccharide utilization was revealed only with the analysis of intermediate

degradation products during fermentation (Chapter 5), something that cannot

be investigated in a human clinical trial. Degradation of insoluble fibres is

challenging for gut microbes because it requires the adhesion of these bacteria

to the cell wall polysaccharides which have lower accessible surface area and

hydrogen-bonding networks that holds the carbohydrate chains together (6,7).

This difference in the proportion of soluble to insoluble carbohydrates between

A-OB1 and A-OB2 likely explains the differences found in the types of

microorganisms enriched by each by-product (Chapter 5).

Overall, OBs were found to positively affect the gut microbiota by stimulating

an increase of beneficial bacteria, such as Collinsella, Lachnospira, Prevotella

and Faecalibacterium (Chapters 4 and 5).

Chapter 8_________________________________________________________________________

226

Passion fruit peels (Chapters 4 and 5).

Passion fruit peels (PFPs) and their AIS fractions showed the poorest

fermentability, based on the smaller amounts of total SCFA.

PFPs also generated negligible amounts of lactate and succinate, indicating that

these by-products were not fermented at a high speed. Lactate and succinate

are intermediate metabolites in intestinal microbiology and are usually present

in lower amounts because they are consumed by other microbes through cross-

feeding that convert them into SCFA, such as propionate and butyrate (8,9).

Their accumulation is an indication that a substrate is fermented fast (8). Their

absence in the fermentation of PFPs reinforce the indication that PFPs were

fermented at a slow rate. This is a very interesting characteristic, because a

substrate that is fermented slowly has more chances to reach the distal part of

the colon to be fermented there. Most carbohydrates are used almost in their

entirety in the proximal colon (10). Proteins are consequently used by

microbes in the distal colon, producing toxic metabolites which have direct

effects on colon cancer incidence and most of the colon cancer occurs distally

(11,12).

PFP fermentation resulted in a microbiota with the highest diversity and

evenness, a positive trait regarding host health. Although currently it is still

difficult to establish what is considered a “healthy microbiota”, richness and

diversity are generally used as an indication of gut health due to their inverse

association with diverse types of diseases (13).

It is acknowledged that a limitation of our research is that the experiments

were accomplished in vitro, and therefore we lack the interaction between the

gut microbiota and the host. Of course, clinical trials are the golden standard in

studying the effects of food (components) on health. However, in clinical trials

it is very difficult to study the total production of microbial metabolites (unless

very expensive tracer studies with e.g. 13C-isotope labelled substrates are used),

let alone study the kinetics of production of these metabolites. Also, to measure

intermediate degradation product of fibre fermentation, one needs to use very

invasive methods with catheters to samples the proximal colon (where most

carbohydrate fermentation takes place). Therefore, we made use of the

validated, dynamic, computer-controlled in vitro model of the colon developed

by TNO (TIM-2; (14)), which has a number of benefits: a) it allows frequent

sampling in time, which allows to study both intermediate fermentation

products that are produced (which would be missed if faecal samples would be

analysed) and it allows for properly studying kinetics of production of

microbial metabolites, which is practically impossible in vivo; b) because the

_______________________________________________________________ General discussion

227

model accurately mimics physiological conditions, including removal of

microbial metabolites (which would otherwise accumulate and inhibit the

microbiota) mechanistic studies can be carried out, allowing for instance to

determine structure-function relationships (Chapter 7). Again, similar

experiments in vivo are virtually impossible to do. One could argue that animal

models could be used, but the microbiota of laboratory animals is very different

from that of humans and translation from animal models to humans is an issue,

on top of the ethical concerns.

Differences in gut bacterial fermentation of fibres when using

microbiota from lean or obese individuals The gut microbiota plays an important role in maintaining human health and it

has been suggested that it can affect the nutritional metabolism of the host with

consequences on energy storage, through several mechanisms.

However, the idea that gut bacteria can contribute to the maintenance of the

host body weight is characterized by numerous paradoxes. As an example, it

has already been shown that a diet rich in non-digestible fibres decreases body

weight, fat mass and the severity of diabetes (15–17). Nonetheless, at the same

time it is being argued that the same dietary fibres increase strains of bacteria

that are able to digest/ferment them and provide extra energy in the form of

SCFA (15), which are used as a fuel by several host tissues. However, the

proposed increase in energy extraction in the form of SCFA is not the only way

that the gut microbiota may affect body weight, but the gut microbiota is also

involved, for instance, in gut permeability, metabolic endotoxemia and bile

acids metabolism, which have a role in energy metabolism and consequently

obesity (18).

In general, we have found differences in fermentation of fibres when using

microbiota from lean or obese individuals. The differences were encountered

either on the level of microbiota composition or production of metabolites.

Interestingly, the production of energy in the form of SCFA was not always

higher when fermentation was performed using the obese microbiota, as

expected. Mostly, the production of energy was dependent of the type of fibre

being used, and not the type of microbiota.

Fermentation of two samples of CBs showed a bifidogenic effect especially in

the obese microbiota (Chapters 3 and 4). In the context of obesity, a prebiotic

which can stimulate the genus Bifidobacterium may have an important role to

ameliorate weight gain(ed). A clinical trial with overweight/obese children

Chapter 8_________________________________________________________________________

228

showed that compared to the placebo group, the consumption of prebiotic

(oligofructose-enriched inulin) increased Bifidobacterium and was

accompanied by a parallel decrease in body weight and percentage of body fat

(19). Another study which compared the gut microbiota from healthy and

obese children and adolescents showed that there was an increase in

Bifidobacterium during the process of weight reduction (20). Additionally,

Bifidobacterium was associated with improved gut mucosal barrier and lower

intestinal levels of lipopolysaccharide (LPS), and was found in lower abundance

in obese subjects (21). Regarding the production of SCFA, CBs stimulated

higher production of acetate by the obese microbiota when compared to the

lean microbiota. The role of acetate in obesity is not completely understood. On

the one hand, a clinical trial with overweight and obese men showed that

infusion of acetate in the distal colon increased fat oxidation and fasting PYY, a

positive effect to tackle obesity (22). On the other hand, increased acetate

production by an altered microbiota was found to rise ghrelin secretion,

causing hyperphagia and obesity in rats fed with high fat diet (23). How this

translates to humans (that do not perform hyperphagia) remains to be seen.

We suggest that administration of OBs drove the microbiota of obese

individuals towards a healthier profile (Chapters 4 and 5). Fermentation of

OB2 by the obese microbiota stimulated the increase in abundance of

Faecalibacterium. Faecalibacterium prausnitizii is an anti-inflammatory

commensal bacterium and studies showed an inverse correlation between

inflammatory bowel disease (IBD) and this species (24–26). Stimulation of F.

prausnitzii may be beneficial in the context of obesity, since this disease is

characterized by low-grade inflammation (27). Compared to control,

fermentation of OBs by the obese microbiota produced smaller amounts of

succinate. Elevated levels of plasma succinate were found to be associated with

obesity and impaired glucose metabolism (28).

PFP fermentations stimulated the enrichment Ruminococcus only in the lean

microbiota, not in the obese microbiota. Ruminococcus species are known to

use recalcitrant fibres for energy extraction, and a possible explanation is that

the obese microbiota was not used to have this type of substrate and therefore

does not have: i) the necessary species to degrade efficiently complex fibres

and/or ii) the machinery to break down the substrate and make complete use

of it (Chapter 4).

Compared to the lean microbiota, fermentation of arabinogalactan by the obese

microbiota enriched the abundance of Lactobacillus, Dorea, Faecalibacterium

_______________________________________________________________ General discussion

229

and Blautia, showing that this fibre had a positive effect on the obese

microbiota (Chapter 6). A study showed a parallel reduction of body mass

index (BMI) and increase of Lactobacillus spp. amounts in obese adolescents

suggesting a potential role of this genus in obesity and body weight control

(29).

Inulin fermentation by the obese microbiota showed an increase in the

beneficial genera Bifidobacterium, Lactobacillus, Faecalibacterium and Blautia,

when compared to the lean microbiota. A high abundance of bifidobacteria

could be protective in obesity since it is speculated that this genus may

decrease pro-inflammatory cytokines and decrease metabolic endotoxemia

(30,31).

It remains to be verified what the mechanisms are behind the differences found

in fermentation of diverse fibres when using lean or obese microbiotas. The

hypothesis or logical explanation is that the initial difference in microbiota

composition had an effect on the dynamics of fermentation, and that therefore

the microbiotas responded in a different manner to feeding of the different

fibres. The degree of the microbiota plasticity and their capacity to respond to

dietary interventions may be dependent on the baseline population (13). Still,

although in different ways, the tested fibres showed positive effects on the

microbiota from obese individuals in different studies, demonstrating that

these by-products could be a promising tool to assist in the treatment of

obesity. And this is very important, especially because currently, therapeutic

interventions available to prevent or even reverse the problem of obesity has a

limited impact (21), showing the urgent need for new approaches to tackle

obesity. However, it is important to keep in mind that obesity is a multifactorial

disease, and consequently, most probably a multifactorial approach is

necessary to counteract it. In this sense, the manipulation of the gut microbiota

into a healthier profile may be one factor, among others, to be used in this

battle, and may not represent a “miraculous” unique solution against obesity.

The relationship between fibre structure and gut microbiota

fermentation Fibres constitute a heterogeneous group of compounds, and consequently the

consumption of different types of fibres results into different health effects.

This heterogeneity may explain the discrepancy found in studies about the role

of fibres in human health, and the effects on the gut microbiota. Therefore, fibre

characterization is crucial regarding, for instance, the health effect that is

Chapter 8_________________________________________________________________________

230

desired upon consumption, eventually allowing a personalized nutrition

focused on a specific benefit.

To gain a deep understanding of the chemical and physiological characteristics

of the by-products selected, we employed a study of chemical characterization

and in vitro digestibility (Chapter 2). Although it is common sense that the

peels, bagasses and seeds are rich in fibres, our objective was to specify the

major type of fibre that each by-product was composed of, and the

monosaccharides that were present.

Characterization revealed chemical differences in the three samples of CBs. CB3

was richer in pectin, cellulose and hemicellulose than the other two cassava

bagasses tested, and caused a different effect on microbiota composition and

production of metabolites. As previously mentioned, CB1 and CB2, richer in

starch than CB3, had a positive effect on Bifidobacterium abundance, which was

not seem upon CB3 fermentation (Chapter 4). Bifidobacterium mostly ferments

mono- and oligosaccharides, but some species degrade complex carbohydrates

like starch (32), producing mainly acetate and lactate (33), which may explain

its increase upon the CBs that had higher amounts of starch in their

composition.

We have found that the genus Ruminococcus was inversely associated with

small sugars, and fermentation of OBs in both microbiotas (lean and obese)

caused a decrease in this genus. An opposite result was found in an in vitro

study performed with lemon pectin and microbiota from obese individuals

(34), which enriched the abundance of Ruminococcaceae family. The substrate

used in our study was the whole material originating from the manufacturing of

orange juice (the whole bagasse), composed not only of pectin, but also small

sugars for instance, which likely affected the bacterial dynamics, explaining the

discrepancy found. However, when we tested the isolated fibre of OBs (AIS), in

the PCoA analysis, A-OB2 clustering was mainly driven by Ruminococcus

(Chapter 5). Isolation of fibres via AIS removed the small sugars present in the

raw material, and may have stimulated the enrichment of Ruminococcus, since

only fibres (mainly pectin and hemi(cellulose)) were present. Some species of

Ruminococcus have the ability to ferment recalcitrant fibres in the colon (35),

and therefore may have a preference for such substrates. It was demonstrated

that species from the genus Ruminococcus, present in the human gut bacterial

community had the ability to degrade cellulose (36). Degradation of insoluble

fibres is challenging for gut microbes because it requires the adhesion of these

bacteria to the cell wall polysaccharides which have lower accessible surface

area and hydrogen-bonding networks that holds the carbohydrate chains

together (6,7).

_______________________________________________________________ General discussion

231

In Chapter 7 we investigated how the structure of nine structurally diverse

pectins and the pectic derivative rhamnogalacturonan I (RGI) influenced the

dynamics of composition and metabolic activity of the gut microbiota.

Despite differences in the structure of the various citrus pectins tested, the

levels of total SCFA produced were not significantly different. This may be due

to functional redundancy of microbiota and cross-feeding mechanisms of

microbial interactions (37).

Regarding the modulation of the microbiota composition, the major finding in

this study was that the changes of specific bacterial taxa were related to

structural features of pectins. The main factors that were associated with the

shifts in the microbiota composition were the degree of esterification and

content and composition of monosaccharides (Chapter 7).

Our results suggested that stimulation of Faecalibacterium prausnitzii can be

achieved via fermentation of high methoxylated pectins, rather than low

methoxylated pectins.

The data presented in this thesis contribute to elucidate some interactions

between the gut microbiota and the structural features of fibres. Due to the

inherent complexity of fibres, their structural characterization is crucial to

understand how fibre structures may favour individual microbial groups. And

in the future, this may be translated into how specific fibre structures or a mix

of fibres can be used to maintain a healthy gut microbiota or even how this may

be used to transform a dysbiotic gut bacterial population back to a healthy

microbiota (38).

Chapter 8_________________________________________________________________________

232

Future perspectives and concluding remarks Plant food processing generates by-products in enormous amounts. These by-

products can represent a problem, since their inappropriate disposal is a

source of pollution (39). At the same time, consumers are becoming more

aware not only about the relationship between diet and health (40), but also

regarding the ways of production of their foods: for instance, if the product was

manufactured in a sustainable manner. Thus, conscious consumers give

preference to natural ingredients produced in a sustainable way, with low or

minimal impact on the environment and that are respectful to the labour

involved. Bearing in mind such considerations, the use of food by-products

represents a very promising field to be explored. They contain valuable

compounds, which may be used as functional foods and even replace synthetic

additives, constituting a natural alternative source of a vast range of

ingredients/compounds (39).

Therefore, our studies were focused on the use of by-products, an innovative

approach especially with regard to their effects on the gut microbiota, as

demonstrated by few other scientific publications available with these by-

products – cassava bagasse, orange bagasse and passion fruit peel. These waste

products high in dietary fibres could be used with the main objective to serve as

source of energy for beneficial bacteria residing in the (distal) colon, and

through beneficial modulation of the gut microbiota protect the host against

health problems that commonly affect our Western society.

Currently, the majority of research on dietary fibres and their effects on gut

microbiota focuses on purified ingredients extracted from plants. This,

however, is being challenged in terms of human nutrition, because evidence

shows that it is the actual complexity of dietary fibres that has an effect on the

complexity of the gut microbiota (41). Our results showed that besides the

differences found in fermentation by microbiotas from lean and obese

individuals, fermentation of the raw by-products and their AIS fractions also

differently affected the metabolism and composition of the gut microbiota.

These differences could have been caused by many components still present in

the whole by-products, such as polyphenols (not measure here) or small sugars

for instance, in the composition of OBs. Therefore, the characterization of these

by-products was crucial in order to explain the results observed. A limitation of

our studies was the small number of replicates, which could have hindered

many correlations between specific components with microbes and/or

metabolites.

_______________________________________________________________ General discussion

233

Another crucial point in our research, which should be adopted by other

researchers, was the assessment of the degradation products generated during

fermentation. Without this specific analysis, we would not have been able to

understand the reasons why two chemically similar fibres (the two OBs)

resulted in different fermentation profiles regarding the amounts of SCFAs

produced, but more importantly, about the diverse types of microorganisms

that were enriched/inhibited on each OB. Although further experiments are

necessary to reinforce our hypothesis, the analysis of degradation products

during fermentation allowed us to see how differences in carbohydrate

solubility affected the dynamics of the gut microbiota, which was observed and

described by others (42,43).

The results found in our studies demonstrated the potential of the diverse food

by-products in modulating the gut microbiota from lean, obese and healthy

individuals. As shown in this thesis, validated, predictive, dynamic, and multi-

compartmental in vitro models offer an excellent alternative to clinical trials to

screen novel foods. Therefore, the next steps could be to test other food by-

products in vitro. Direct comparative studies with the raw food by-product and

their isolated fibres are suggested, including the analysis of degradation

products formed during fermentation.

For instance, further comparative studies are suggested both in vitro and in vivo

testing the effects on the gut microbiota of cassava bagasse from various

regions of Brazil, as well as CBs from artisanal and industrial processing. Our in

vitro study about the digestibility of CBs demonstrated that around 12% of the

starch present in the samples was resistant starch (RS). Therefore, we suggest

that future research with CBs evaluate the amount and type of RS present, since

studies have demonstrated that the effects of RS on the gut microbiota varies

according to the type of RS administered (44,45). Future studies including pre-

digested cassava bagasse are suggested to explore the effects on the bacterial

community and/or metabolism. Monitoring the degradation of carbohydrates

during fermentation would contribute to elucidation of the interactions

between gut microbiota and the utilization of complex polysaccharides.

Moreover, future studies aiming to assess bacterial utilization of sugars during

fermentation with separate soluble and insoluble fractions (e.g. of orange

bagasses) are suggested to evaluate the importance of solubility on gut

microbiota modulation, preferably in the distal colon.

In addition, in order to confirm our results and to contribute to the important

understanding of structure-function relationship of dietary fibres/prebiotics in

the gut, further comparative in vitro and in vivo studies with structurally

diverse carbohydrate polymers and their derivatives are suggested.

Chapter 8_________________________________________________________________________

234

This thesis raises the awareness of the importance of the research performed

with food by-products, and therefore paves the path for further research on the

incorporation of by-products into food products, or their use per se, perhaps as

a functional food. Their utilization would definitively have an impact on

decreasing food wastage (46), as well as bring health benefits for those who

consume it.

_______________________________________________________________ General discussion

235

References 1. Backhed F, Ding H, Wang T, Hooper L V, Koh GY, Nagy A, et al. The gut

microbiota as an environmental factor that regulates fat storage. Proc Natl Acad Sci U S A. 2004 Nov;101(44):15718–23.

2. Cani PD. Human gut microbiome: hopes, threats and promises. Gut; 2018;67:1716-1725.

3. Gibson GR, Hutkins R, Sanders ME, Prescott SL, Reimer RA, Salminen SJ, et al. Expert consensus document: The International Scientific Association for Probiotics and Prebiotics (ISAPP) consensus statement on the definition and scope of prebiotics. Nat Rev Gastroenterol Hepatol. 2017 Aug;14(8):491–502.

4. Mallillin AC, Trinidad TP, Raterta R, Dagbay K, Loyola AS. Dietary fibre and fermentability characteristics of root crops and legumes. Br J Nutr. 2008;100(3):485–8.

5. Osundahunsi OF, Williams AO, Oluwalana IB. Prebiotic effects of cassava fibre as an ingredient in cracker-like products. Food Funct. 2012;3(2):159–63.

6. Cockburn DW, Koropatkin NM. Polysaccharide Degradation by the Intestinal Microbiota and Its Influence on Human Health and Disease. J Mol Biol. 2016 Aug 14;428(16):3230–52.

7. Lynd LR, Weimer PJ, van Zyl WH, Pretorius IS. Microbial cellulose utilization: fundamentals and biotechnology. Microbiol Mol Biol Rev. 2002 Sep;66(3):506–77.

8. Koenen ME, Cruz Rubio JM, Mueller M, Venema K. The effect of agave fructan products on the activity and composition of the microbiota determined in a dynamic in vitro model of the human proximal large intestine. J Funct Foods. 2016;22:201–10.

9. Koh A, De Vadder F, Kovatcheva-Datchary P, Bäckhed F. From dietary fiber to host physiology: short-chain fatty acids as key bacterial metabolites. Cell. 2016 Jun 2;165(6):1332–45.

10. den Besten G, van Eunen K, Groen AK, Venema K, Reijngoud DJ, Bakker BM. The role of short-chain fatty acids in the interplay between diet, gut microbiota, and host energy metabolism. J Lipid Res. 2013;54(9):2325–40.

11. Macfarlane GT, Macfarlane S. Bacteria, colonic fermentation, and gastrointestinal health. J AOAC Int. 2012;95(1):50–60.

12. Ou J, DeLany JP, Zhang M, Sharma S, O’Keefe SJD. Association between low colonic short-chain fatty acids and high bile acids in high colon cancer risk populations. Nutr Cancer. 2012;64(1):34–40.

13. Gentile CL, Weir TL. The gut microbiota at the intersection of diet and human health. Science. 2018 Nov;362(6416):776–80.

14. Minekus M, Smeets-Peeters M, Bernalier A, Marol-Bonnin S, Havenaar R, Marteau P, et al. A computer-controlled system to simulate conditions of the large intestine with peristaltic mixing, water absorption and absorption of fermentation products. Appl Microbiol Biotechnol.

Chapter 8_________________________________________________________________________

236

1999;53(1):108–14. 15. Cani PD, Delzenne NM, Amar J, Burcelin R. Role of gut microflora in the

development of obesity and insulin resistance following high-fat diet feeding. Pathol Biol (Paris). 2008 Jul;56(5):305–9.

16. Fleissner CK, Huebel N, Abd El-Bary MM, Loh G, Klaus S, Blaut M. Absence of intestinal microbiota does not protect mice from diet-induced obesity. Br J Nutr. 2010;104(6):919–29.

17. Tuohy KM, Rouzaud GC, Bruck WM, Gibson GR. Modulation of the human gut microflora towards improved health using prebiotics--assessment of efficacy. Curr Pharm Des. 2005;11(1):75–90.

18. Cornejo-Pareja I, Munoz-Garach A, Clemente-Postigo M, Tinahones FJ. Importance of gut microbiota in obesity. Eur J Clin Nutr. 2018 Nov;

19. Nicolucci AC, Hume MP, Martinez I, Mayengbam S, Walter J, Reimer RA. Prebiotics reduce body fat and alter intestinal microbiota in children who are overweight or with obesity. Gastroenterology. 2017 Sep;153(3):711–22.

20. Hou Y-P, He Q-Q, Ouyang H-M, Peng H-S, Wang Q, Li J, et al. Human gut microbiota associated with obesity in chinese children and adolescents. Biomed Res Int. 2017;2017:7585989.

21. Lee P, Yacyshyn BR, Yacyshyn MB. Gut microbiota and obesity: An opportunity to alter obesity through faecal microbiota transplant (FMT). Diabetes, Obes Metab [Internet]. 2018 Oct 17;0(0).

22. van der Beek CM, Canfora EE, Lenaerts K, Troost FJ, Damink SWMO, Holst JJ, et al. Distal, not proximal, colonic acetate infusions promote fat oxidation and improve metabolic markers in overweight/obese men. Clin Sci (Lond). 2016 Nov;130(22):2073–82.

23. Perry RJ, Peng L, Barry NA, Cline GW, Zhang D, Cardone RL, et al. Acetate mediates a microbiome-brain-β cell axis promoting metabolic syndrome. Nature. 2016 Jun 9;534(7606):213–7.

24. Miquel S, Martín R, Rossi O, Bermúdez-Humarán LG, Chatel JM, Sokol H, et al. Faecalibacterium prausnitzii and human intestinal health. Curr Opin Microbiol. 2013;16(3):255–61.

25. Machiels K, Joossens M, Sabino J, De Preter V, Arijs I, Eeckhaut V, et al. A decrease of the butyrate-producing species Roseburia hominis and Faecalibacterium prausnitzii defines dysbiosis in patients with ulcerative colitis. Gut. 2014 Aug;63(8):1275–83.

26. Singh RK, Chang H-W, Yan D, Lee KM, Ucmak D, Wong K, et al. Influence of diet on the gut microbiome and implications for human health. J Transl Med [Internet]. 2017;15(1):73.

27. Cani PD, Amar J, Iglesias MA, Poggi M, Knauf C, Bastelica D, et al. Metabolic endotoxemia initiates obesity and insulin resistance. Diabetes. 2007 Jul;56(7):1761–72.

28. Serena C, Ceperuelo-Mallafre V, Keiran N, Queipo-Ortuno MI, Bernal R, Gomez-Huelgas R, et al. Elevated circulating levels of succinate in human obesity are linked to specific gut microbiota. ISME J. 2018

_______________________________________________________________ General discussion

237

Jun;12(7):1642–57. 29. Santacruz A, Marcos A, Warnberg J, Marti A, Martin-Matillas M, Campoy

C, et al. Interplay between weight loss and gut microbiota composition in overweight adolescents. Obesity (Silver Spring). 2009 Oct;17(10):1906–15.

30. Sarbini SR, Kolida S, Deaville ER, Gibson GR, Rastall RA. Potential of novel dextran oligosaccharides as prebiotics for obesity management through in vitro experimentation. Br J Nutr. 2014 Oct;112(8):1303–14.

31. Tilg H. Obesity, metabolic syndrome, and microbiota: multiple interactions. J Clin Gastroenterol. 2010 Sep;44 Suppl 1:S16-8.

32. Rajilić-Stojanović M, de Vos WM. The first 1000 cultured species of the human gastrointestinal microbiota. FEMS Microbiol Rev. 2014;38(5):996–1047.

33. De Graaf A, Venema K. Gaining Insight into Microbial Physiology in the Large Intestine: A Special Role for Stable Isotopes. 2007;53:73–314.

34. Bianchi F, Larsen N, de Mello Tieghi T, Adorno MAT, Kot W, Saad SMI, et al. Modulation of gut microbiota from obese individuals by in vitro fermentation of citrus pectin in combination with Bifidobacterium longum BB-46. Appl Microbiol Biotechnol. 2018 Aug;

35. Flint HJ, Duncan SH, Louis P. The impact of nutrition on intestinal bacterial communities. Curr Opin Microbiol. 2017 Aug;38:59–65.

36. Chassard C, Delmas E, Robert C, Lawson PA, Bernalier-Donadille A. Ruminococcus champanellensis sp. nov., a cellulose-degrading bacterium from human gut microbiota. Int J Syst Evol Microbiol. 2012 Jan;62(Pt 1):138–43.

37. Reichardt N, Vollmer M, Holtrop G, Farquharson FM, Wefers D, Bunzel M, et al. Specific substrate-driven changes in human faecal microbiota composition contrast with functional redundancy in short-chain fatty acid production. ISME J. 2018 Feb;12(2):610–22.

38. Hamaker BR, Tuncil YE. A perspective on the complexity of dietary fiber structures and their potential effect on the gut microbiota. J Mol Biol. 2014 Nov 25;426(23):3838–50.

39. Schieber A. Side streams of plant food processing as a source of valuable compounds: selected examples. Annu Rev Food Sci Technol. 2017 Feb;8:97–112.

40. Schieber A, Stintzing FC, Carle R. By-products of plant food processing as a source of functional compounds—recent developments. Trends Food Sci Technol. 2001;12(11):401–13.

41. Williams BA, Grant LJ, Gidley MJ, Mikkelsen D. Gut fermentation of dietary fibres: physico-chemistry of plant cell walls and implications for health. Int J Mol Sci. 2017 Oct;18(10).

42. Ramasamy US, Venema K, Schols HA, Gruppen H. Effect of soluble and insoluble fibers within the in vitro fermentation of chicory root pulp by human gut bacteria. J Agric Food Chem. 2014;62(28):6794–802.

43. Gong L, Cao W, Chi H, Wang J, Zhang H, Liu J, et al. Whole cereal grains

Chapter 8_________________________________________________________________________

238

and potential health effects: Involvement of the gut microbiota. Food Res Int. 2018;103:84–102.

44. Martinez I, Kim J, Duffy PR, Schlegel VL, Walter J. Resistant starches types 2 and 4 have differential effects on the composition of the fecal microbiota in human subjects. PLoS One. 2010 Nov;5(11):e15046.

45. Salonen A, Lahti L, Salojarvi J, Holtrop G, Korpela K, Duncan SH, et al. Impact of diet and individual variation on intestinal microbiota composition and fermentation products in obese men. ISME J. 2014 Nov;8(11):2218–30.

46. Sharma SK, Bansal S, Mangal M, Dixit AK, Gupta RK, Mangal AK. Utilization of Food Processing By-products as Dietary, Functional, and Novel Fiber: A Review. Crit Rev Food Sci Nutr. 2016 Jul 26;56(10):1647–61.

Summary

Summary _________________________________________________________________________

240

Summary The industrial processing of foods is responsible for generating enormous

amounts of by-products that are underused and/or discarded. If inappropriately

disposed off, they are a source of pollution. There is, therefore, an urgent need to

find a sustainable solution to deal with food by-products. In the case of plant by-

products, such as bagasses and peels, because of their fibre content, they may be

reintroduced into food products as functional ingredients – aiming to improve

intestinal health and energy metabolism via the gut microbiota.

In Chapter 1 an overview is provided about the generation of food by-products

and the paradox among food wastage, undernourishment and obesity. Brazil, as

the largest producer of orange and passion fruit juices, and an important

producer and consumer of cassava, generates considerable amounts of by-

products originating from these processing. Cassava bagasse, orange bagasse

and passion fruit peel are described.

The gut microbiota has emerged as an important environmental factor that can

affect host metabolism, which can be modulated via diet – especially dietary fibres. A brief description of gastrointestinal tract functioning, gut microbiota

and dietary fibres is given.

The problem of obesity and the influence of the gut microbiota on host

metabolism is also reviewed in Chapter 1. Additionally, the main approach used

in this research – the use of the TNO Intestinal Models (TIM- 1 and 2) is

described.

The aim of the present research was to assess the potential prebiotic effects of a

number of different (Brazilian) food by-products using an in vitro model of the

proximal colon, either with microbiota from healthy individuals or from lean or

obese individuals.

First, chemical characterization of eight food by-products (three cassava

bagasses [CBs], two orange bagasses [OBs] and three passion fruit peels [PFPs])

and their respective alcohol insoluble solids (AIS) fractions is shown in Chapter

2. Digestibility experiments using the in vitro model TIM-1 with all CBs, one OB

and one PFP are also described. Results revealed that for CBs, two samples (CB1

and CB2) were chemically more similar than CB3. CB3 had less starch and more

pectin and non-starch polysaccharides (NSP) than the other two samples of CBs.

Their AIS fractions were higher in pectin and (hemi)cellulose than the raw by-

product. In vitro digestibility experiments indicated that ~12% of the starch

present in CBs was resistant starch (RS).

Chemical analyses of OBs showed similarity between the two samples. High

methylated pectin and small sugars (likely from residual juice) were the main

components of OBs. AIS fractions of OBs were also composed of higher amounts

_________________________________________________________________________ Summary

241

of pectin than their respective raw by-products. Digestibility experiments

showed that 86.3% of glucose present as starch and small sugar was digestible.

Two of the PFP samples (PFP1 and PFP2) had a similar chemical composition,

with ~20% of pectin and ~16% of NSP (hemi)cellulose. PFP3, however, showed

an unusual high amount of starch (38%), and it is likely that this sample was

“contaminated” with starch or another by-product. Approximately 83% of this

starch was digestible. AIS fractions of PFPs had similar pectin amount as the raw

by-product.

Differences found in the chemical composition of by-products from different

batches, and their AIS fractions may result in divergent fermentation profiles

when fermented by the gut microbiota, and therefore such characterization is

crucial regarding the use of prebiotics, when aiming for host and intestinal

health.

Chapter 3 describes the first set of experiments performed to test in vitro (in

TIM-2) the potential prebiotic effect(s) of one sample of cassava bagasse (CB1)

when using a microbiota originating from lean or obese individuals (from now

on referred to as “lean and obese microbiota”). Overall, CB1 fermentation

showed a pronounced bifidogenic effect in both microbiotas but resulted into

otherwise different bacterial and metabolite profiles when using lean or obese

microbiotas. This first study with CB1 resulted in promising results, and

therefore a new set of experiments was performed with CB1 in order to see

whether such results could be replicated – especially the bifidogenic effect.

Additionally, the interplay between fermentation of different substrates by gut

microbiota and host health is not completely understood. Therefore, in Chapter

4 we tested all food by-products characterized in Chapter 2 – three CBs, two OBs

and three PFPs, regarding the potential prebiotic effects using the same in vitro

approach as in Chapter 3 – TIM-2. Also here, two sets of experiments – using

faecal slurry from lean or obese individuals were performed. This chapter

describes the effects that each food by-product had on the dynamics of bacterial

fermentation. The results from this study showed that not only the two types of

microbiota - lean and obese, metabolized the same by-products differently, but

also chemically similar substrates, such as the two OBs, resulted in divergent

effects on the microbiota composition and end-products generated. This study

showed that food by-products have the potential to be used as an alternative tool

to improve gut health and consequently host health in the context of obesity.

After experiments with the raw by-product, we wanted to assess whether the

isolated fibres from food by-products would exert similar effects on the gut

microbiota. Thus, AIS fractions of OBs (A-OB1 and A-OB2) and PFPs (A-PFP1 and

A-PFP2) were used in in vitro fermentation experiments using a microbiota from

healthy individuals, as described in Chapter 5. Through the analysis of

Summary _________________________________________________________________________

242

intermediate degradation products formed during fermentation we could

investigate the bacterial utilization of the different monosaccharides present in

these polysaccharides. This study confirmed the observation in Chapter 4, that,

although A-OBs were chemically similar, their fermentation profile was different.

Only through the analysis of intermediate products formed during fermentation

it was possible to observe differences regarding the proportion of soluble to

insoluble of each A-OB, and this difference may have influenced the dynamics of

the gut microbiota, explaining the discrepancies found between the two different

batches.

Chapter 6 focuses on the differences in fermentation of two fibres – inulin and

arabinogalactan, regarding their use by the microbiota from lean or obese

individuals. This research showed that metabolism profile was indeed different

when fermentation occurred in the lean or obese microbiotas. Importantly, these two fermentable fibres were found to modulate the obese microbiota towards a

healthier milieu, reinforcing the fact that the use of prebiotics may represent an

inexpensive and non-invasive way to tackle obesity.

The structural complexity of dietary fibre and their influence on the dynamics in

changes of the gut microbiota is still not completely known. Therefore, in

Chapter 7 how the structure of pectins influenced the dynamics of the gut

microbiota was investigated, regarding its potential to modulate composition

and/or metabolic activity. Experiments were performed using TIM-2, using

microbiota from healthy individuals, and nine structurally diverse pectins plus a

pectic derivative rhamnogalacturonan I (RGI). This study helped to elucidate that

the effects of pectins in the modulation of the gut microbiota was dependent on

their structural features, and emphasized results in earlier chapters, which

showed that substrates that are evaluated on their effect on the gut microbiota

(composition and activity) should be structurally characterized, to be able to

make structure-function relationships.

In Chapter 8, a general discussion of the results is provided, including some

ideas for future research.

Samenvatting

Samenvatting ____________________________________________________________________

244

Samenvatting Het industrieel processen van voedsel is verantwoordelijk voor enorme

hoeveelheden bijproducten die niet of nauwelijks in de voedingsbereiding

gebruikt worden, of zelfs weg gegooid worden. In het laatste geval kunnen ze in

sommige gevallen zelfs voor vervuiling van het milieu zorgen. Daarom is er

urgent behoefte aan een duurzame oplossing voor het verwerken van voedsel

bijproducten. In het geval van plantaardige bijproducten, zoals pulp en schillen,

vanwege de aanwezigheid van (voedings)vezels, kunnen deze als functionele

ingrediënten opnieuw geïntroduceerd worden in de voedingsketen – met als

doel om darmgezondheid en energie metabolisme via de darm microbiota

(vroeger darmflora genoemd) te verbeteren.

Hoofdstuk 1 geeft een overzicht over het genereren van voedsel bijproducten

en de paradox van voedsel verspilling, ondervoeding en obesitas. Brazilië, de

grootste producent van sinaasappel- en passievruchtensappen, en een

belangrijke producent en consument van cassave, genereert aanzienlijke

hoeveelheden bijproducten die afkomstig zijn van deze verwerking. Cassave-pulp, sinaasappel-pulp en passievruchtenschillen worden in dit hoofdstuk

beschreven.

De darm microbiota is recentelijk beschouwd als een belangrijke

(omgevings)factor die het gastheer metabolisme kan beïnvloeden, en dat kan

worden gemoduleerd via het dieet, met name door voedingsvezels. Een korte

beschrijving van het functioneren van het maag-darmkanaal, darm microbiota

en voedingsvezels wordt gegeven.

Het probleem van obesitas en de invloed van de darm microbiota op het gastheer

metabolisme wordt ook besproken in Hoofdstuk 1. Daarnaast wordt de

belangrijkste benadering die in dit onderzoek is gebruikt beschreven – het

gebruik van de valideerde in vitro modellen van het maag-darm kanaal van TNO

(TIM-1 en TIM-2).

Het doel van het huidige onderzoek was om de potentiële prebiotische effecten

van een aantal verschillende (Braziliaanse) voedsel bijproducten te beoordelen

met behulp van een in vitro model van de proximale colon (TIM-2), hetzij met

een microbiota van gezonde individuen, of van obese personen vergeleken met

personen met normaal gewicht. Dit staat beschreven in de andere hoofdstukken

en wordt hieronder kort samengevat.

Ten eerste wordt de chemische karakterisering van acht voedsel bijproducten

(drie monsters van cassave-pulpen [CB's], twee sinaasappel-pulpen [OB's] en

drie passievruchtenschillen [PFP's]) en hun respectievelijke in alcohol-

onoplosbare vaste stoffen (AIS)-fracties beschreven in Hoofdstuk 2.

Verteerbaarheids-experimenten met behulp van het in vitro model TIM-1 met

____________________________________________________________________ Samenvatting

245

alle CB's, één OB en één PFP worden ook beschreven. Uit de resultaten bleek dat

voor CB's twee monsters (CB1 en CB2) chemisch meer vergelijkbaar waren dan

CB3. CB3 had minder zetmeel en meer pectine en niet-zetmeel-polysacchariden

(NSP) dan de andere twee monsters van CB's. Hun in alcohol onoplosbare vaste

stoffen (AIS)-fracties waren hoger in pectine en (hemi) cellulose dan het ruwe

bijproduct. Deze in vitro verteerbaarheids-experimenten toonden aan dat ~12%

van het zetmeel dat aanwezig was in CB's resistent zetmeel (RS) was.

Chemische analyses van de OB's toonden gelijkenis tussen de twee monsters aan.

Hoog gemethyleerd pectine en kleine suikers (waarschijnlijk van resterend sap)

waren de belangrijkste componenten van OB's. AIS-fracties van OB's waren ook

samengesteld uit grotere hoeveelheden pectine dan hun respectieve ruwe

bijproducten. Verteerbaarheids-experimenten toonden aan dat 86,3% van de

aanwezige glucose als zetmeel en kleine suiker verteerbaar was.

Twee van de PFP-monsters (PFP1 en PFP2) hadden een vergelijkbare chemische samenstelling, met ~20% pectine en ~16% NSP (hemi (cellulose)). PFP3

vertoonde echter een ongewoon hoge hoeveelheid zetmeel (38%) en het is

waarschijnlijk dat dit monster "verontreinigd" was met zetmeel of een ander

bijproduct. Ongeveer 83% van dit zetmeel was verteerbaar. AIS-fracties van

PFP's hadden een vergelijkbare pectine-hoeveelheid als het ruwe bijproduct.

Verschillen in de chemische samenstelling van bijproducten uit verschillende

batches en hun AIS-fracties kunnen resulteren in afwijkende

fermentatieprofielen wanneer ze worden gefermenteerd door de darm

microbiota, en daarom is een dergelijke karakterisering van cruciaal belang met

betrekking tot het gebruik van prebiotica bij het streven naar de gezondheid van

de gastheer en de darm.

Hoofdstuk 3 beschrijft de eerste reeks experimenten die werden uitgevoerd om

in vitro (in TIM-2) het potentiële prebiotische effect (de effecten) van één

monster cassave-pulp (CB1) te testen bij gebruik van een microbiota afkomstig

van normaal-gewicht of obese personen (vanaf nu verwezen als "gewoon en

obese microbiota"). Over het geheel genomen vertoonde de CB1-fermentatie een

uitgesproken bifidogeen effect in beide microbiota’s maar resulteerde dit in

anderszins verschillende bacteriële en metaboliet-profielen bij het gebruik van

gewone of obese microbiota’s.

Deze eerste studie met CB1 resulteerde in veelbelovende resultaten en daarom

werd een nieuwe reeks experimenten uitgevoerd met CB1 om te zien of

dergelijke resultaten konden worden gerepliceerd - met name het bifidogene

effect. Bovendien is het samenspel tussen fermentatie van verschillende

substraten door de darm microbiota en gastheer-gezondheid niet volledig

begrepen. Daarom testten we in Hoofdstuk 4 alle voedsel bijproducten

gekarakteriseerd in Hoofdstuk 2 - drie CB's, twee OB's en drie PFP's, met

Samenvatting ____________________________________________________________________

246

betrekking tot de potentiële prebiotische effecten met dezelfde in vitro

benadering als in Hoofdstuk 3 - TIM-2. Ook hier werden twee reeksen

experimenten uitgevoerd - met behulp van fecale slurry van gewone of obese

personen. Dit hoofdstuk beschrijft de effecten die elk voedsel bijproduct had op

de dynamiek van bacteriële fermentatie. De resultaten van deze studie toonden

aan dat niet alleen de twee soorten microbiota - gewoon en obees - dezelfde

bijproducten verschillend metaboliseerden, maar ook dat chemisch

vergelijkbare substraten, zoals de twee OB's, resulteerden in uiteenlopende

effecten op de samenstelling van de microbiota en eind-producten gegenereerd.

Deze studie toonde aan dat voedsel bijproducten het potentieel hebben om te

worden gebruikt als een alternatief hulpmiddel om de darmgezondheid en

bijgevolg de gezondheid van de gastheer te verbeteren in de context van

obesitas.

Na experimenten met het ruwe bijproduct wilden we beoordelen of de

geïsoleerde vezels uit voedsel bijproducten vergelijkbare effecten zouden

hebben op de darm microbiota. Aldus werden AIS-fracties van OB's (A-OB1 en A-

OB2) en PFP's (A-PFP1 en A-PFP2) gebruikt in in vitro fermentatie-experimenten

met behulp van een microbiota van gezonde individuen, zoals beschreven in

Hoofdstuk 5. Door de analyse van tussentijdse degradatieproducten gevormd

tijdens fermentatie konden we het bacteriële verbruik van de verschillende

monosacchariden aanwezig in deze polysacchariden onderzoeken. Deze studie

bevestigde de observatie in Hoofdstuk 4 dat, hoewel A-OB's chemisch

vergelijkbaar waren, hun fermentatieprofiel anders was. Enkel en alleen door de

analyse van tussenproducten gevormd tijdens fermentatie was het mogelijk om

verschillen te observeren met betrekking tot de verhouding van oplosbaar tot

onoplosbaar vezel van elke A-OB, en dit verschil kan de dynamica van de darm

microbiota beïnvloed hebben, wat de verschillen gevonden tussen de twee

batches waarschijnlijk verklaard.

Hoofdstuk 6 richt zich op de verschillen in fermentatie van twee fermenteerbare

vezels - inuline en arabinogalactan, met betrekking tot het gebruik ervan door de

microbiota van gewone of obese personen. Dit onderzoek toonde aan dat het

metabolisme-profiel inderdaad anders was wanneer fermentatie plaatsvond in

de gewone of obese microbiota’s. Belangrijk is dat deze twee fermenteerbare

vezels de obese microbiota naar een gezonder milieu lieten moduleren, wat het

feit versterkt dat het gebruik van prebiotica een goedkope en niet-invasieve

manier kan zijn om obesitas aan te pakken.

De structurele complexiteit van voedingsvezels en hun invloed op de dynamiek

in veranderingen van de darm microbiota is nog steeds niet volledig bekend.

Daarom werd in Hoofdstuk 7 onderzocht hoe de structuur van pectines de

____________________________________________________________________ Samenvatting

247

dynamica van de darm microbiota beïnvloedde, met betrekking tot het

vermogen ervan om de samenstelling en/of metabolische activiteit te

moduleren. Experimenten werden uitgevoerd in TIM-2, met behulp van een

microbiota van gezonde individuen, en negen structureel verschillende pectines

plus het pectisch derivaat rhamnogalacturonan I (RGI). Deze studie hielp om te

verduidelijken dat de effecten van pectines in de modulatie van de darm

microbiota afhankelijk waren van hun structurele kenmerken en benadrukte de

resultaten in eerdere hoofdstukken, waaruit bleek dat substraten die worden

geëvalueerd op hun effect op de darm microbiota (samenstelling en/of activiteit)

qua structuur moet worden gekarakteriseerd, om structuur-functie relaties te

kunnen maken/achterhalen.

In Hoofdstuk 8 wordt een algemene bespreking van de resultaten gegeven,

inclusief enkele ideeën voor toekomstig onderzoek.

Samenvatting ____________________________________________________________________

248

Valorization

Valorization______________________________________________________________________

250

Societal relevance Food waste can occur at different levels in the food supply chain, such as during

harvesting, storage, processing, packaging and at the consumer’s home (1). The

term “food by-product” generally refers to edible parts of food that during the

processing were discarded, lost, degraded or consumed by pests (1). They are

the residual materials from food processing of vegetal (or animal) origin, such as

peels, seeds and bagasses (2).

Although food processing technology has brought several positive aspects

regarding for instance increasing shelf life of certain food products, the

production of ultra-processed foods is linked with several negative effects at

distinct levels:

- Food processing is responsible for about 39% of the total food waste

generated around the globe (3);

- Production of highly processed foods generates great amounts of

underused by-products that contribute to environmental pollution (4);

- Discarding of food by-products means misuse of natural resources like

water and soil (5);

- The consumption of ultra-processed foods has negative effects to human

health (6). The production of this type of foods includes the addition of

artificial preservatives, bulky agents, artificial flavouring and colourings

and the removal of important nutrients, such as fibres (7).

- Consumption of ultra-processed foods is contributing to a major global

health problem: obesity (7).

At the same time that food industries discard these food by-products, it was

estimated that in 2016, 815 million people suffered of undernutrition (8).

In general, fruit and vegetables by-products, such as peels and bagasses are

sources of (amongst others) different dietary fibres, which are suitable for

human consumption (9). Giving the circumstances mentioned above, their

disposal is unacceptable, and reflects the paradox of the current way of living in

our society. In summary, food processing generates huge amounts of food by-

products. Their disposal in the environment is a source of pollution and at the

same time, the wastage of food occurs hand in hand with starvation.

Paradoxically, the production of ultra-processed foods is leading to a

consumption of poor nutrient diets. Consumption of poor nutrient diets have

consequences for health, which includes malnourishment, such as obesity

(Figure 1), whereas the food-by products contain nutrients that are required for

health, such as fibres and anti-oxidants.

______________________________________________________________________ Valorization

251

Figure 1: Food products undergo processing, by which the removal of food components

generates by-products that are underused – discarded – causing environmental

pollution. At the same time, there are people around the world suffering of

starvation/undernutrition. The consumption of ultra-processed foods is detrimental to

human health, leading to different health problems, including obesity. This is an

unfortunate process filled with paradoxes.

There is a necessity to create solutions aiming at a conscious use/destination of

food by-products, and scientific research in this field is one way to achieve such

demand.

Thus, any attempt to tackle the problem of food by-product underuse is

extremely important because it can constitute a beneficial solution that affects

both societal health and the environment.

Our work focused on exploring the characteristics of selected Brazilian food by-

products and their potential health benefits by investigating their in vitro effects

on the gut microbiota. Food by-products are very diverse and thus have the

potential to be used in several food segments. We have focused on Brazilian by-

products generated from starch and flour production of cassava and juice

production of oranges and passion fruit, and their beneficial aspect regarding the

fibre content and modulation of the gut microbiota in lean and obese people.

The results showed here demonstrate the suitability of the tested by-products in

being used as food for humans, and their possible effects related to gut health.

Also, our results pave the path for further research on the incorporation of by-

products into food products, or their use per se, perhaps as a functional food.

Importantly, consumers are becoming more aware about the consequences their

food choices can have, not only regarding the individual aspect, such as health,

but also considering the collective or societal effects. Sticking to a sustainable

Valorization______________________________________________________________________

252

diet is perhaps the most crucial step that a responsible consumer can do in their

daily lives. This topic is discussed in the next section.

Sustainable diet and sustainable food system A sustainable development (of food use) guarantees that the needs of the current

generation are achieved without compromising the ability of future generations

to achieve their own needs (10). In this context, it is acknowledged that both a

healthy diet and a diet that leads to less food wastage reduce the negative impact

on the environment, leading to the notion of sustainable diets (11). The term

“sustainable diets” was defined by the Food and Agricultural Organization (FAO)

as “diets with low environmental impacts, which contribute to food and nutrition

security and to healthy life for present and future generations. Sustainable diets

are protective and respectful of biodiversity and ecosystems, culturally acceptable,

accessible, economically fair and affordable; nutritionally adequate, safe and

healthy; while optimising natural and human resources” (12).

The results presented in this thesis contribute to two aspects regarding

sustainability. The first relates to sustainable diets. Results shown here

demonstrate the potential health benefits that the consumption of food by-

products might bring, especially regarding gut health through the gut microbiota.

The by-products tested are natural, rich in fibres and the product of food

processing that would otherwise be discarded. Thus, as previously mentioned,

the consumption of a healthy diet including these by-products reduces the

detrimental impact on the environment. The composition of the diet chosen by

consumers has the capacity to drive the demand of specific food products, or

specific ways of manufacturing, which has a social, economic and environmental

effect (11). In this regard, consumers have the power to push food companies to

a sustainable manner of production. For that, information about sustainable

diets is crucial.

The second aspect is associated with a sustainable food system. The use of food

by-products contributes to a sustainable food system, decreasing the negative

“A sustainable food system is a food system that ensures food security and nutrition for all in such a

way that the economic, social and environmental bases to generate food security and nutrition of future

generations are not compromised” (11)

______________________________________________________________________ Valorization

253

impact that their disposal would have on the environment. Additionally,

utilization of the food product as a whole is a responsible use of natural resources

that were employed for plants cultivation, such as soil and water, as well as the

human labour that was applied (11).

Target group - overweight and obese individuals

Obesity is characterized by abnormal or excessive body fat accumulation that

might impair an individual’s health. In adults, overweight is equivalent to body

mass index (BMI) between 25-30 kg/m2, while obesity is defined by a BMI higher

than 30 kg/m2 (13). Increased BMI is a risk factor for several diseases associated

with obesity, such as diabetes, cardiovascular diseases and cancer (14).

Obesity has almost tripled since 1975 around the globe, and in 2016, almost 2

billion adults were overweight, while 650 million were obese (14). There are

many factors that contribute to the onset of overweight and obesity, such as bad

eating habits essentially due to increased intake of ultra-processed foods which

are dense in energy and poor in nutrients (empty calories), and physical

inactivity (13). However, it has been hypothesized that these factors cannot

solely explain the pandemic of obesity. It has been suggested that a disturbed gut

microbiota (dysbiosis) can have a role in obesity (15,16).

Modern life style is causing changes in the gut microbiota (Figure 2) and may

explain not only the pandemic of obesity, but also the increased incidence in

others diseases, such as asthma, inflammatory bowel disease, autism, food

allergies and many others (17).

Although the role of the gut microbiota on host metabolism and obesity is not

completely understood, a balanced diet, which includes the consumption of

fibres and/or prebiotics, can have a positive effect on the gut microbiota, and

consequently on health.

Our results have shown that the use of food by-products can lead to a healthier

profile of the gut microbiota, especially the microbiota originating from obese

individuals.

Valorization______________________________________________________________________

254

Figure 2: Modern life factors that are causing dysbiosis in the gut microbiota, with

consequences to health. It is known that all the points cited have a detrimental

consequence on the composition of the gut microbiota. And this starts very early in life,

for instance by the way of delivery (C-section) and the excessive use of antibiotics, the

use of infant formula to feed babies instead of breast feeding, excessive sanitation, and

bad eating habits with lack of fibre consumption as one of the main consequences (17).

These early impacts on the gut microbiota may lead to disease and disorder later in life,

e.g. obesity (18).

Even though more studies are necessary, the results shown here are promising

with regard to the use of a natural food-product that commonly are discarded, to

tackle overweight and obesity.

DysbiosisC-section

Formula feed

babies

Overuse antibiotics

Excessive sanitation

Bad eating habits

______________________________________________________________________ Valorization

255

References 1. Parfitt J, Barthel M, Macnaughton S. Food waste within food supply chains:

quantification and potential for change to 2050. Philos Trans R Soc London B Biol Sci. 2010;365(1554):3065–81.

2. Helkar P, Sahoo A, Patil N. Review: food industry by-products used as a functional food ingredients. Int J Waste Resour. 2016;6(3):1–6.

3. Mirabella N, Castellani V, Sala S. Current options for the valorization of food manufacturing waste: a review. J Clean Prod. 2014;65(Supplement C):28–41.

4. Sharma SK, Bansal S, Mangal M, Dixit AK, Gupta RK, Mangal AK. Utilization of food processing by-products as dietary, functional, and novel fiber: a review. Crit Rev Food Sci Nutr. 2016 Jul 26;56(10):1647–61.

5. Spiker ML, Hiza HAB, Siddiqi SM, Neff RA. Wasted food, wasted nutrients: nutrient loss from wasted food in the United States and comparison to gaps in dietary intake. J Acad Nutr Diet. 2017 Jul;117(7):1031–1040.e22.

6. Juul F, Hemmingsson E. Trends in consumption of ultra-processed foods and obesity in Sweden between 1960 and 2010. Public Health Nutr. 2015 Dec;18(17):3096–107.

7. Louzada ML da C, Baraldi LG, Steele EM, Martins APB, Canella DS, Moubarac J-C, et al. Consumption of ultra-processed foods and obesity in Brazilian adolescents and adults. Prev Med (Baltim). 2015 Dec;81:9–15.

8. FAO, IFAD, UNICEF, WFP, WHO. The state of food security and nutrition in the world 2017. Building resilience for peace and food security. Rome; 2017.

9. Martins ZE, Pinho O, Ferreira I. Food industry by-products used as functional ingredients of bakery products. Trends Food Sci Technol. 2017;67:106–28.

10. Berry EM, Dernini S, Burlingame B, Meybeck A, Conforti P. Food security and sustainability: can one exist without the other? Public Health Nutr. 2015 Sep;18(13):2293–302.

11. Meybeck A, Gitz V. Sustainable diets within sustainable food systems. Proc Nutr Soc. 2017 Feb;76(1):1–11.

12. Burlingame B, Dernini S. Sustainable Diets and Biodiversity: Directions and Solutions for Policy, Research and Action. In: Sustainable Diets and Biodiversity: Directions and Solutions for Policy, Research and Action International Scientific Symposium, Biodiversity and Sustainable Diets United Against Hunger, FAO Headquarters, Rome, Italy, 3-5 November 2010. Food and Agriculture Organization of the United Nations (FAO); 2012.

13. Meldrum DR, Morris MA, Gambone JC. Obesity pandemic: causes, consequences, and solutions-but do we have the will? Fertil Steril. 2017 Apr;107(4):833–9.

14. WHO. Obesity and Overweight - Fact sheet n. 311. 2017. 15. Cox LM, Yamanishi S, Sohn J, Alekseyenko A V., Leung JM, Cho I, et al.

Altering the intestinal microbiota during a critical developmental window
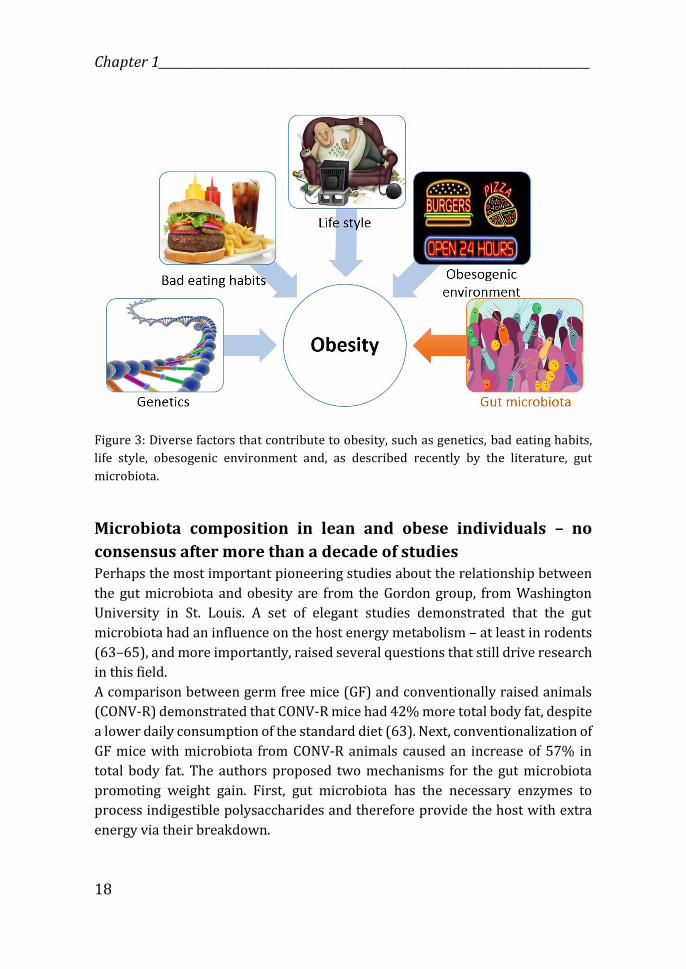
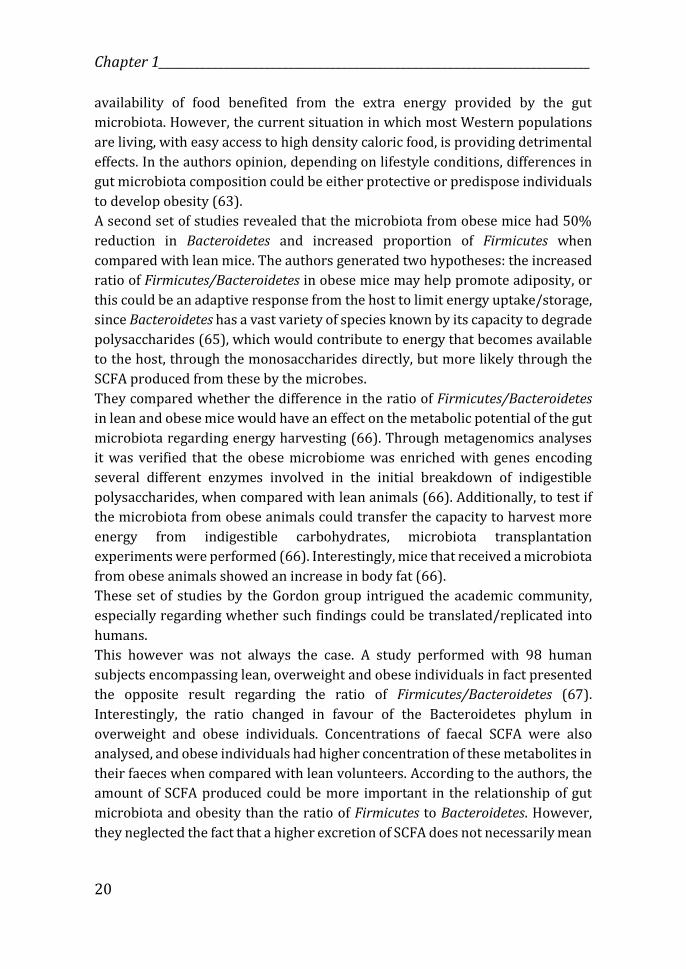
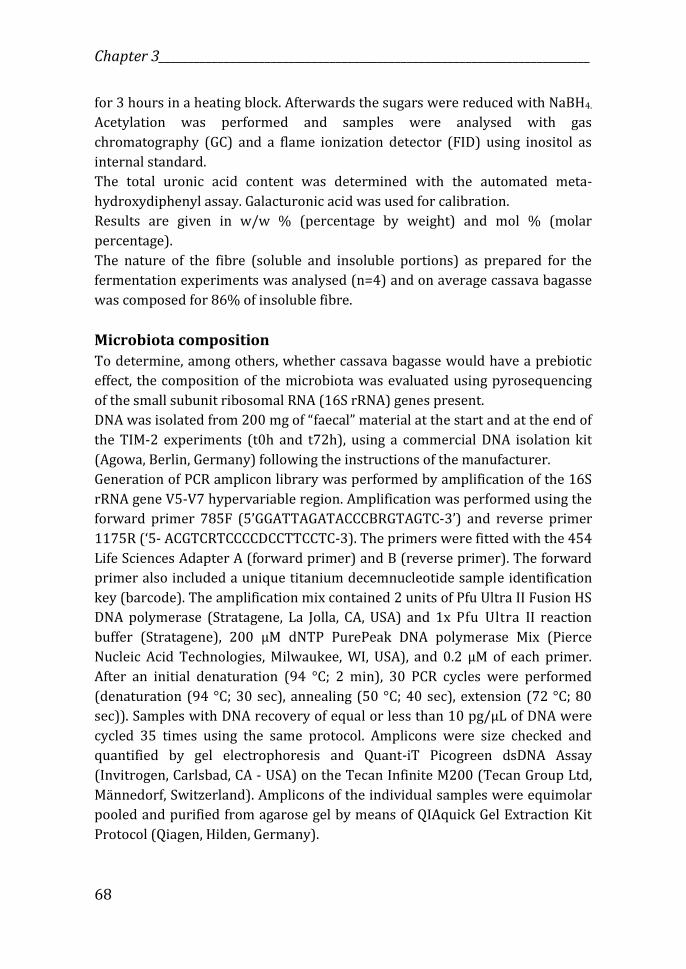
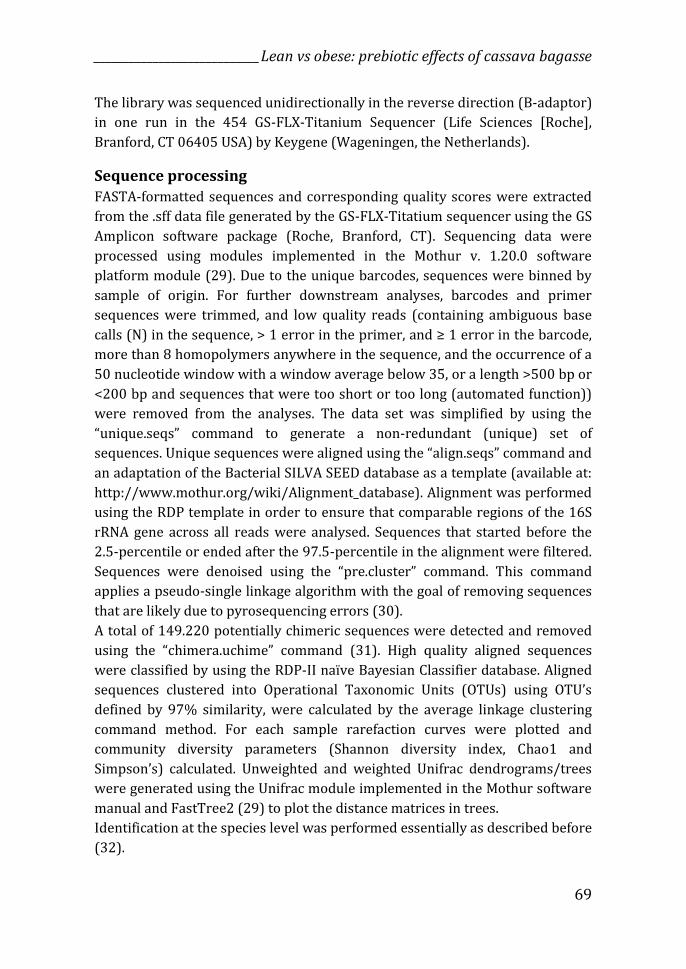
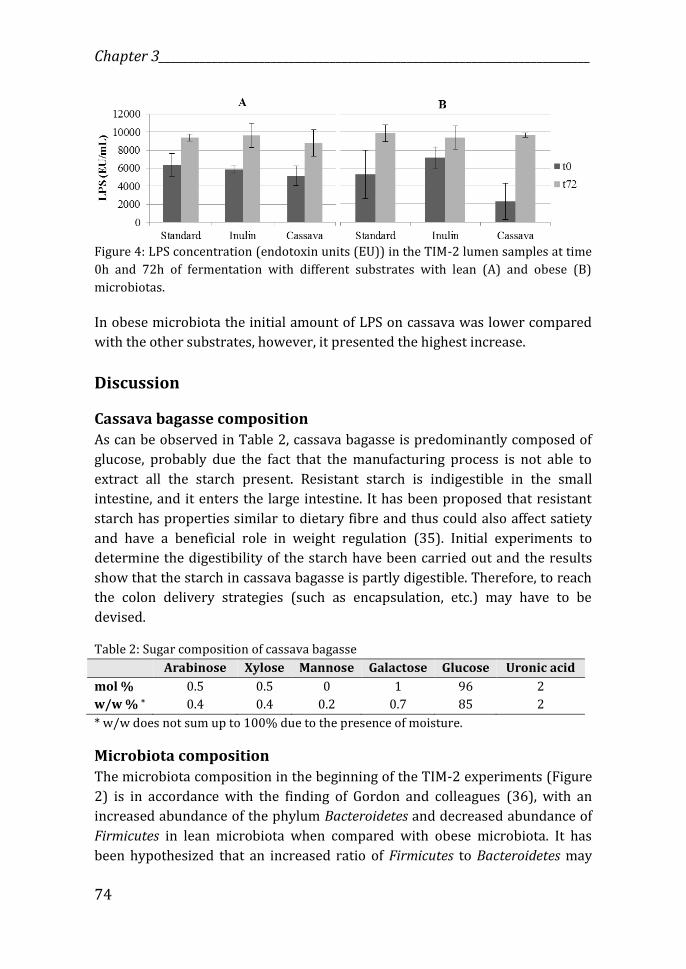
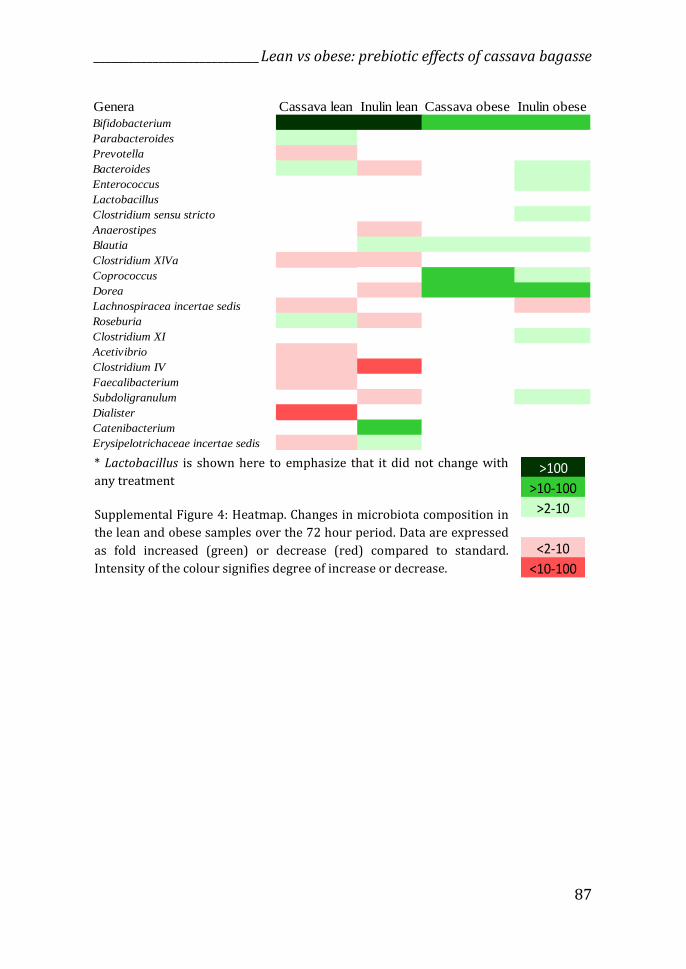
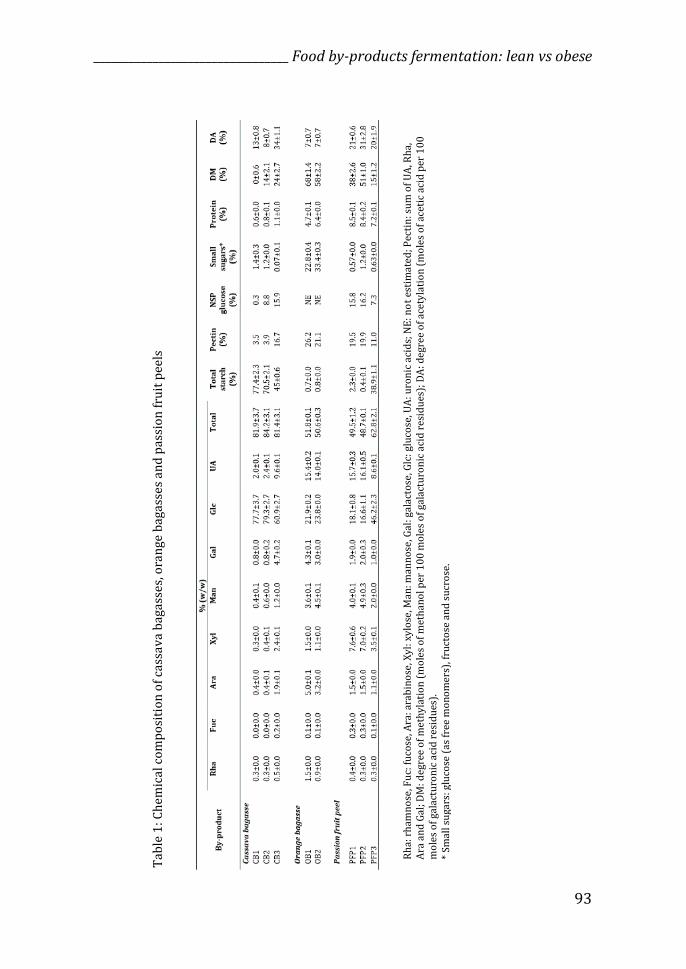
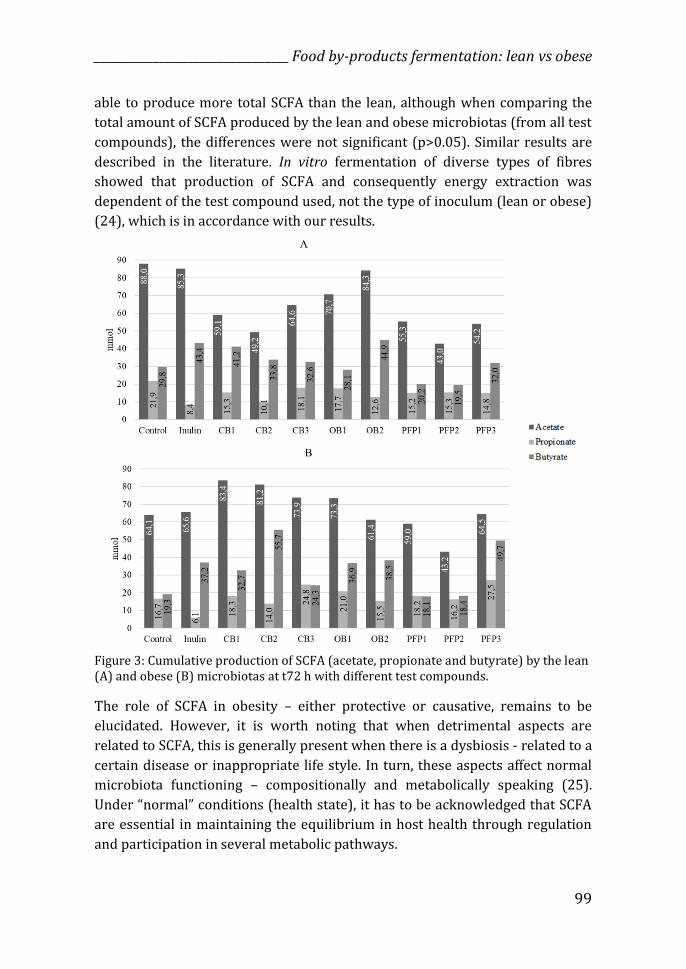
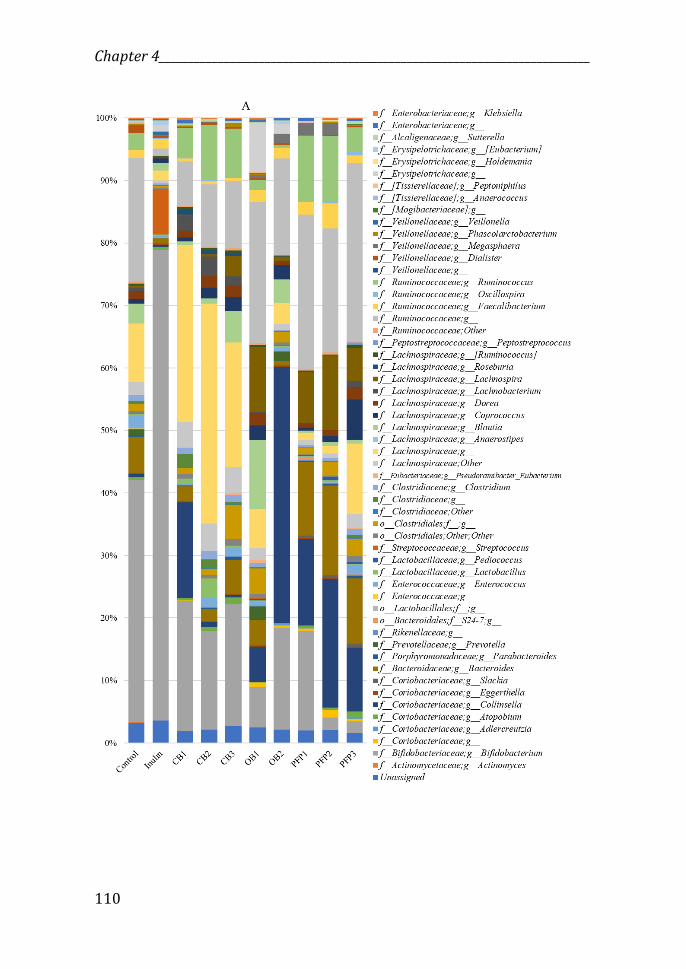
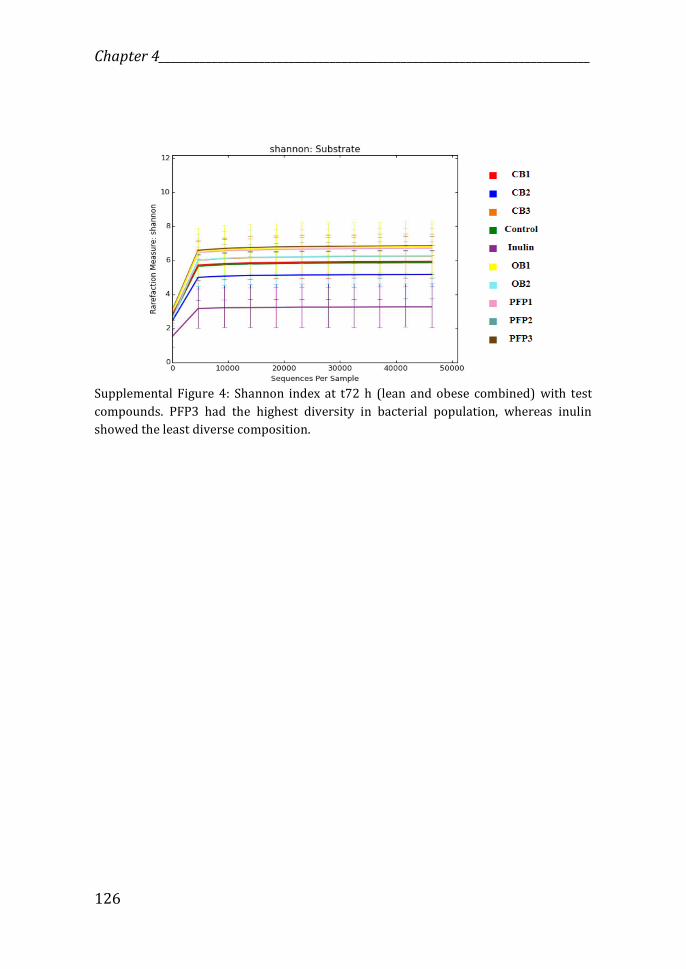
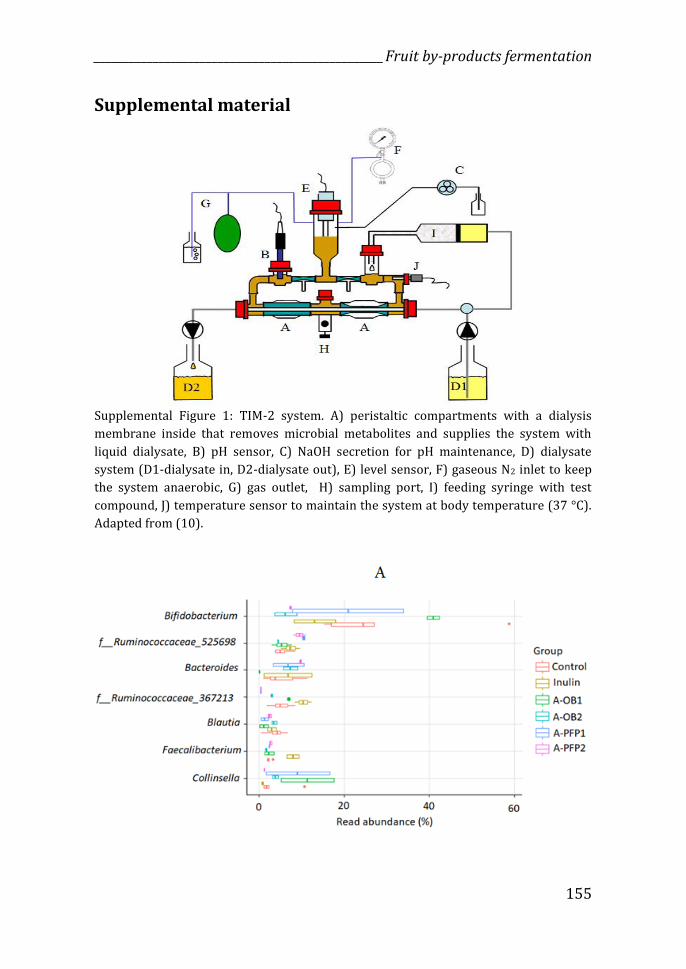
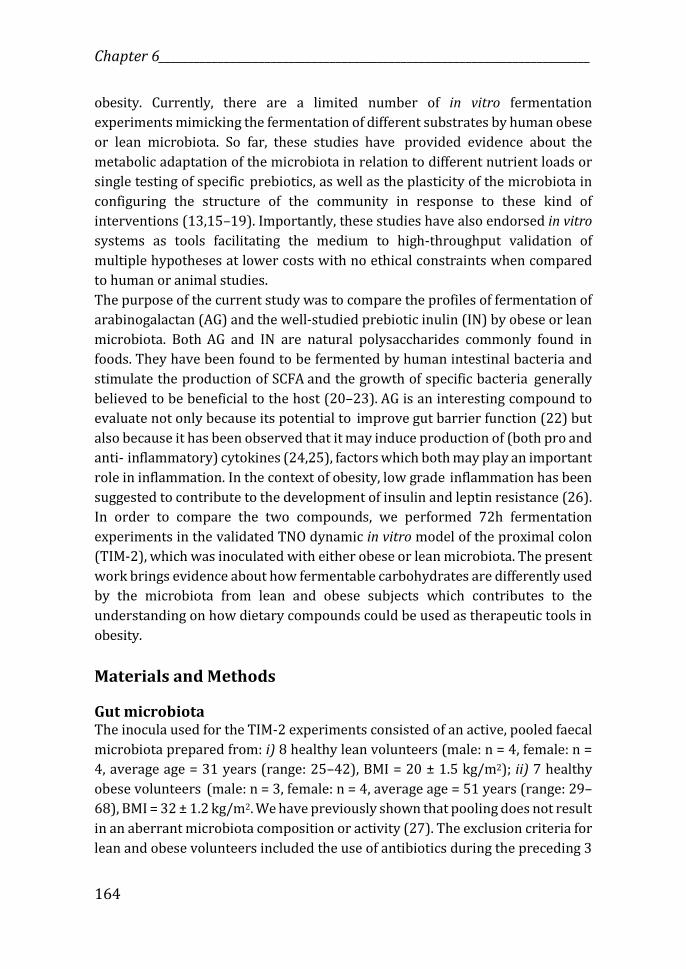
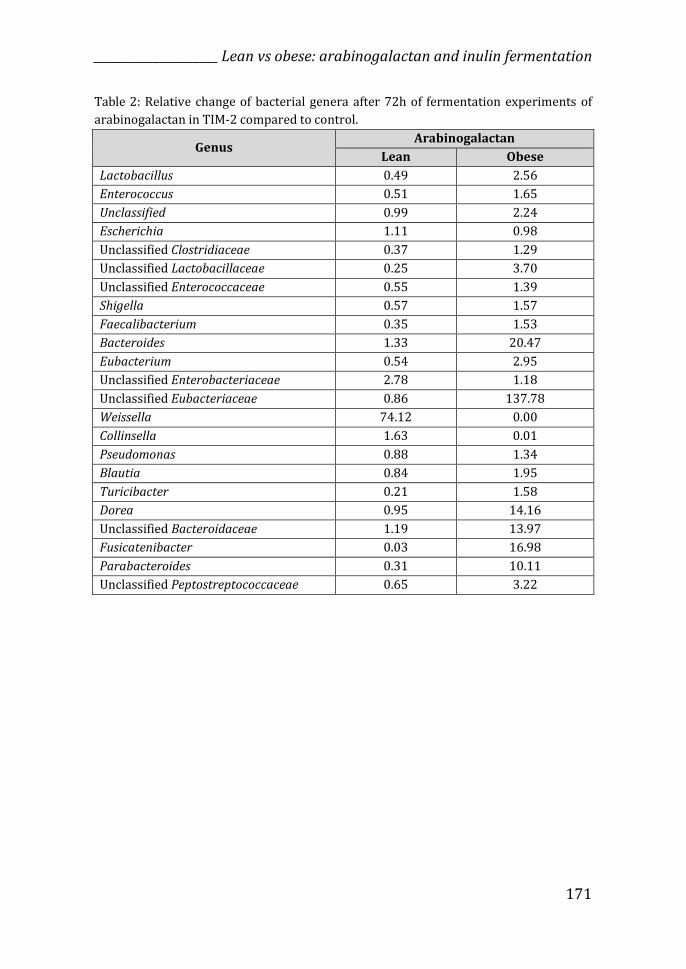
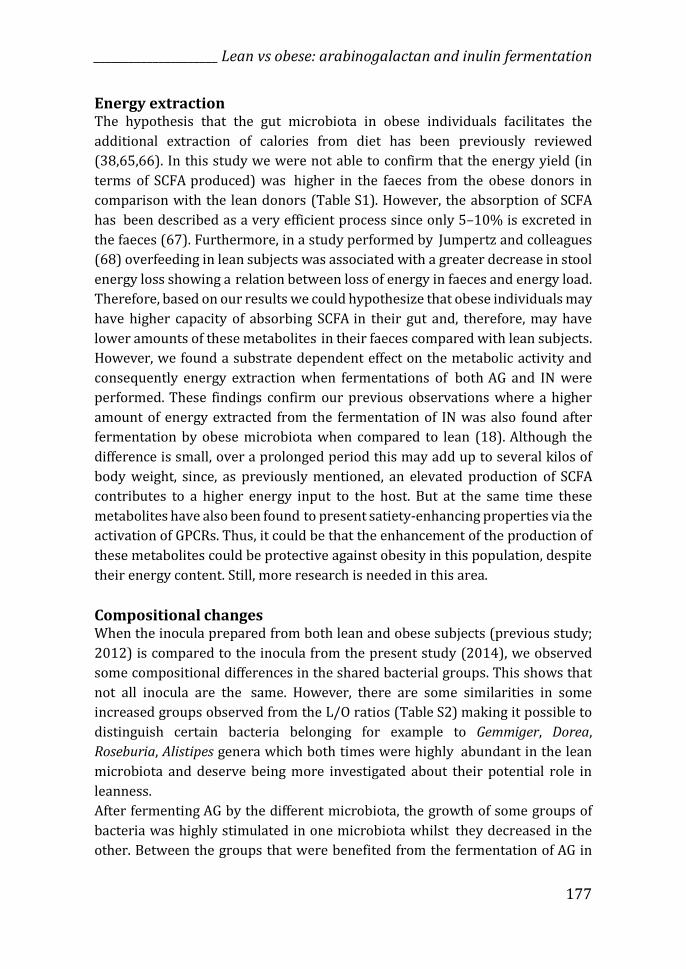
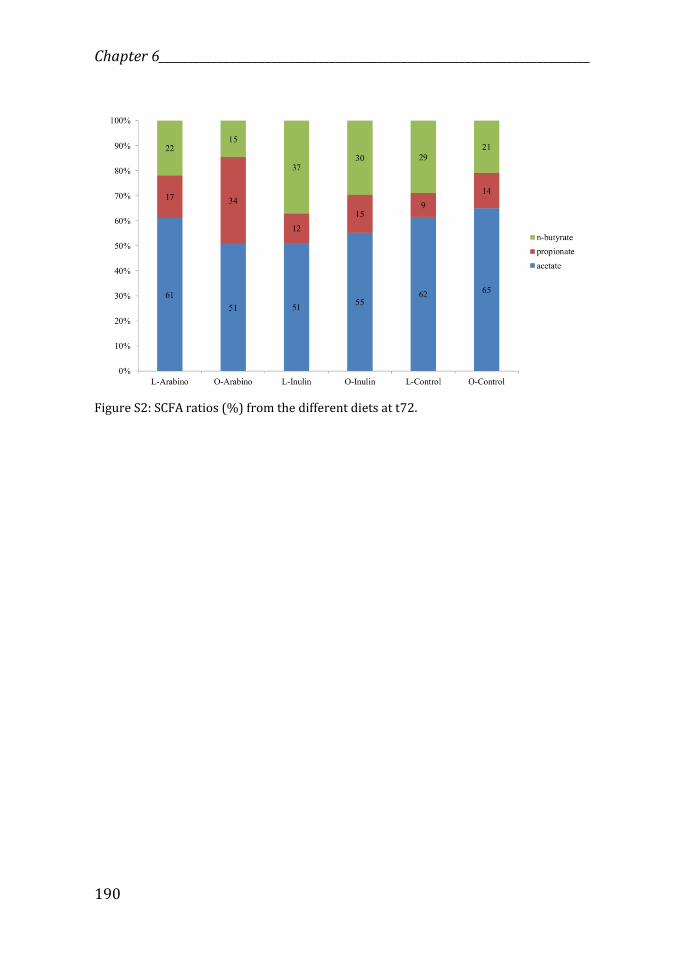
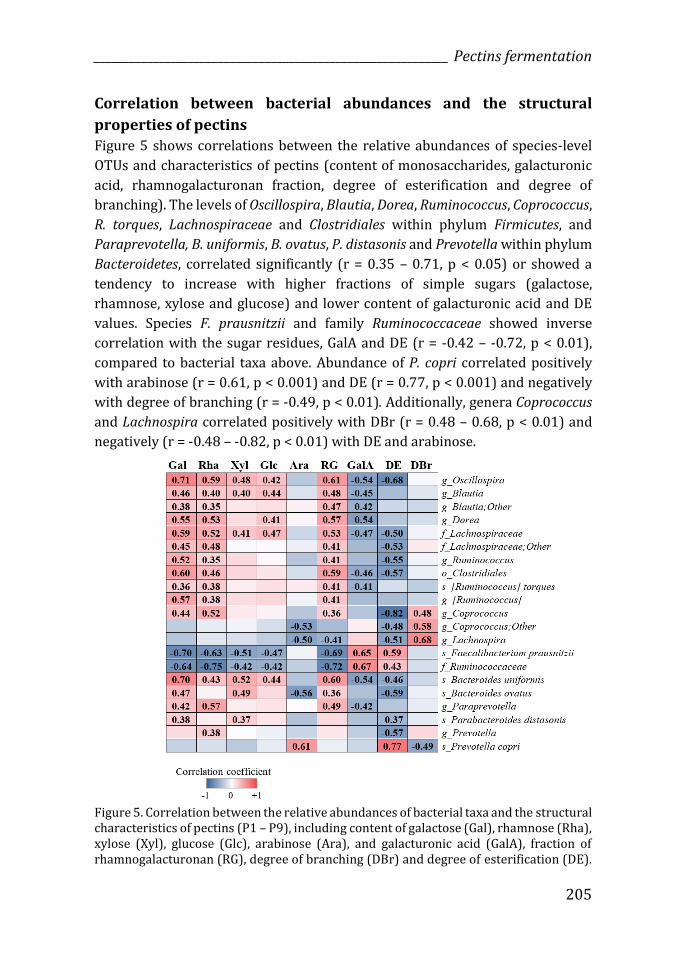
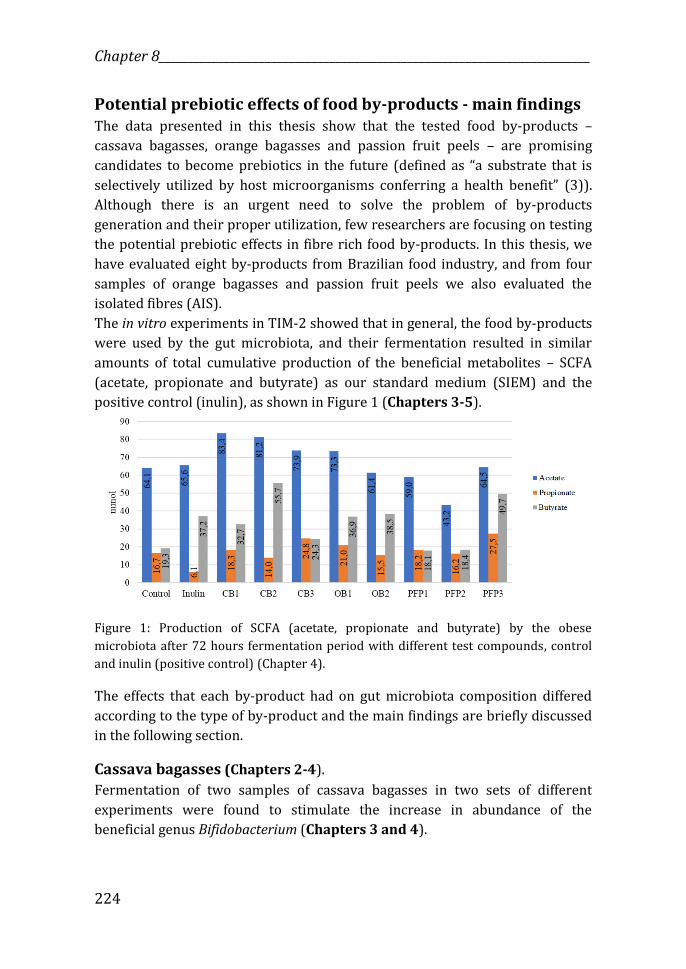
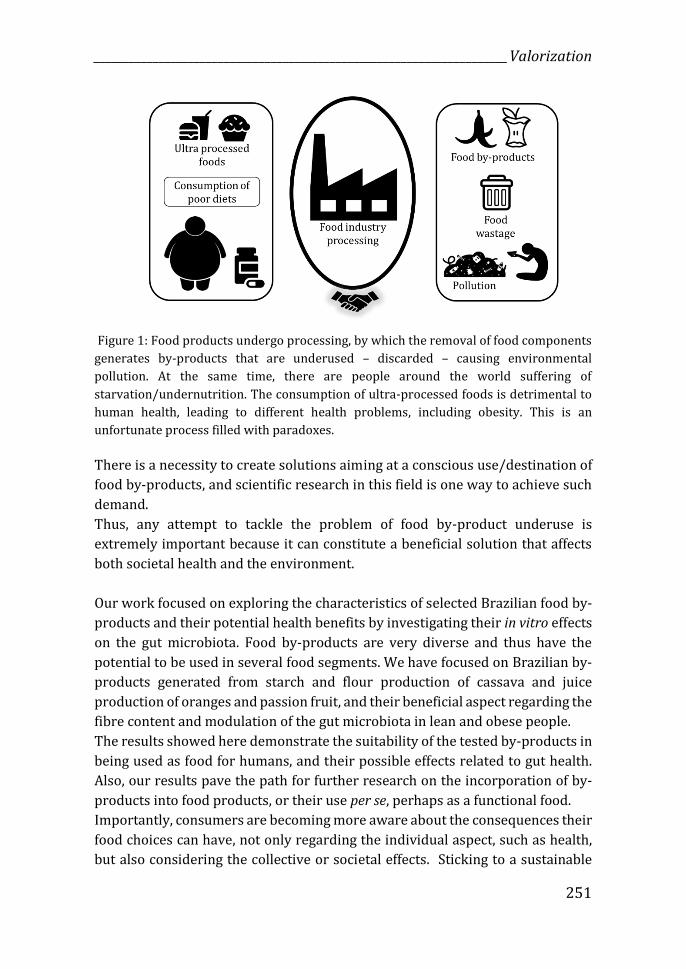
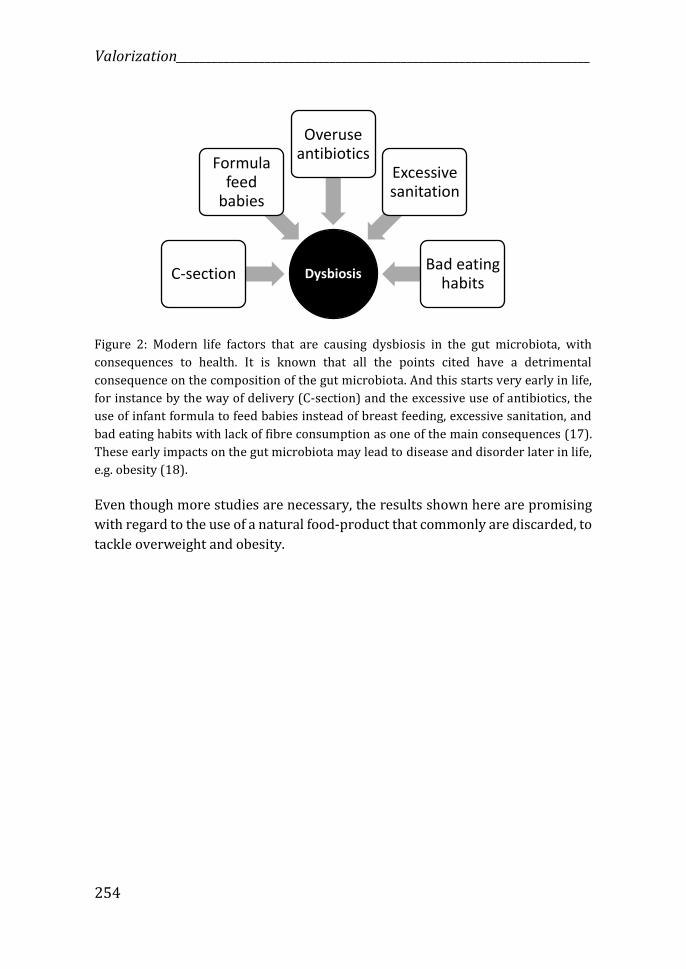
Valorization______________________________________________________________________

256

has lasting metabolic consequences. Cell. 2014 Aug 14;158(4):705–21. 16. Ley RE, Turnbaugh PJ, Klein S, Gordon JI. Microbial ecology: human gut

microbes associated with obesity. Nature. 2006 Dec;444(7122):1022–3. 17. Blaser MJ. The theory of disappearing microbiota and the epidemics of

chronic diseases. Nat Rev Immunol. 2017 Jul;17(8):461–3. 18. Stanislawski MA, Dabelea D, Wagner BD, Iszatt N, Dahl C, Sontag MK, et al.

Gut microbiota in the first 2 years of life and the association with body mass index at age 12 in a Norwegian birth cohort. MBio. 2018 Oct;9(5).

Acknowledgments

Acknowledgments _______________________________________________________________

258

During my PhD journey I had the luck to meet many people, that definitively

contributed to me being here today, writing this last chapter of my thesis. For

those, I would like to express my thankfulness.

First of all, Koen: words are not enough to express my gratitude. This PhD was a

“turbulent” one, and no matter what, you were always by my side. Thank you for

your support and guidance during these years, which contributed infinitively to

my professional development. But especially for always being so comprehensive,

for your kindness and optimistic way of looking to the challenges that appeared.

I was always amazed by the fact that you always had a solution for everything.

Thank you for “taking me with you” to Maastricht University. Without you I

would never have the chance to conclude this PhD.

I also would like to thank Prof. Dr. Lubbert Dijkhuizen, Prof. Dr. Susana Saad and

Prof. Dr. Daisy Jonkers for accepting being my (co-)promoters, and for your

important contributions to the improvement of many manuscripts/thesis.

Thanks to the committee: Prof. Paul Savelkoul, Prof. Ellen Blaak, Prof. Sonia

Sayago-Ayerdi and Prof. Kristin Verbeke, for taking time to evaluate my PhD

thesis.

Thanks also to Prof. Dr. Fred Brouns and Dr. Freddy Troost. Thanks for the

opportunity to study a master in the NL and all support during this period. Doing

a master at Maastricht University was essential to introduce me to the “academic

world”, and the internship at TNO led to my PhD project.

Further, I would like to express my gratitude to Prof. Dr. Henk Schols and Dr.

Melliana Jonathan, from Wageningen University. Thank you for opening the

doors of the Food Chemistry department, and for your dedication during the time

that I spent at WUR. Henk, thank you for providing all necessary tools to pursue

my research, and for treating me like as I was a student from you. Melliana, thank

you for teaching and guiding me in such kind and patient way. I have learned

very much from you. And thanks to all people from the Food Chemistry

department which helped me during this period.

I am also thankful to the former TIM team from TNO Zeist, which I had the chance

to work with during my master and at the beginning of my PhD: Marjorie, Annet,

Rob H., Mark, Wendy, Tom, Jan. Thank you for your support and for sharing your

knowledge.

_______________________________________________________________ Acknowledgments

259

I would like to give my special thanks to the new TIM team at Maastricht

University – Venlo. Rob vD, Cheng, Sanne and Jessica: you guys made my days

happier. Thanks to you, I always drove my way to Venlo with a smile on my face.

The atmosphere in the labs was delightful, and working with the smelly TIM-2

was always a pleasure with you guys around. It was great when we were all

together in one room. I already miss our lunches together, walks, hunting

beautiful mushrooms, and the easy talks. You will be always in my heart.

And thanks for all guests that spend some time there, and made my days lighter

and brighter. Diogo, Maria I and Maria II, Alessia, Angela, Carol, Lucia.

Dear Prof. Dr. Sonia, I am immensely grateful for your generosity in opening the

doors of your home in Venlo to me. I had such good time with you and I hope that

we can meet again in the future. Muchas gracias mi querida! Usted sabe que mi

casa es su casa!

Dina and Ilse, it was a great pleasure to be your roommate at TNO! Thank you

guys for your company and for showing me the best side of the Dutch culture! I

will always keep in my heart all good moments that we spent together: our super

cool Christmas trip to Germany, lunches, dinner at Dina’s place (Dina you are a

very talented cook!), fondue with liquid nitrogen, drink’s night, barbecue at the

park….I wish you all the best for your future! And you are always welcome to

come to Brazil and enjoy some caipirinha with me!! Dank je wel meisjes!

To my friends that showed me that distance could not affect our friendship: Lu,

Ana Paula, Cyntia, Anne and Begum. No matter for how long we stay far away, I

know that our friendship is forever ! Thanks for being part of my life!

Marisol, your friendship is a bless and to meet you was one of the best things that

happened to me in the NL. I have learned very much with you since the master,

and your strength to get what you desire inspires me. Thank you for being

supportive and helping me during the tough moments. I wish you a life filled with

love, happiness and success.

Thanks for my husband’s family – Wilson, Branca, Cesar, Fernanda and João

Pedro, that although far away, always supported me.

Acknowledgments _______________________________________________________________

260

And a warm and especial thank you to my family. To my parents (papi e mami –

Geraldo e Zélia) for all unconditional love, support and example of perseverance

and strength. Vocês são o meu maior exemplo de superação, honestidade e força.

Vocês são o meu porto seguro e eu me sinto abençoada por fazer parte da família

linda que juntos vocês construíram. Obrigada por me ensinarem a sonhar e a

enfrentar os meus medos. Gí e Hérnan, Júnior e Flávia, Matheus e Pedro, obrigada

pelo apoio, pela amizade, pelo amor e respeito. Eu admiro muito vocês e desejo

que sejamos sempre uma família unida pelo amor. Amo vocês!

I would like to say a very especial thank you for my beloved husband Thiago.

Your intelligence inspires me, and each day that I spend with you I admire you

more and more. You contributed immensely to me to become a better person.

Thank you for your love, support, encouragement and for deciphering R with me.

Muitos dos nosso sonhos já se tornaram realidade, e hoje fazem parte das minhas

melhores lembranças. Eu desejo que a nossa união se fortaleça a cada dia, e que

a gente nunca perca a capacidade de sonhar. E que juntos a gente continue a

trilhar o nosso caminho repleto de amor e felicidade! Te amo!

Thank you!!

Obrigada!!

Carlota

About the author

About the author ________________________________________________________________

262

Curriculum vitae Carlota Bussolo de Souza was born in

Florianópolis, Brazil, on the 10th June 1980.

She completed her secondary school at

“Colégio Energia” in 1999. Afterwards, she

studied Nutrition at the Federal University of

Santa Catarina (UFSC), Florianópolis, Brazil

from 2000 to 2004. During her bachelor

studies she became more interested in linking

nutrition to gastronomy, which motivated her

to pursue a second bachelor – Tourism

oriented to Gastronomy. This course was

performed at the University of Southern Santa

Catarina (UNISUL) from 2003 to 2006. After

completing her bachelor in Nutrition, she worked as a dietician in a restaurant in

Florianópolis for 1 year. In 2006, when she finished her bachelor in Tourism-

Gastronomy, she was selected to participate in the “For.TE Project” - Summer

School (Training for Tourism, Food and Wine) in Italy, a partnership program

between UNISUL and the “Istituto Giuseppe Maffioli”. When she returned from

Italy, she decided to start her own company and in 2007, together with her sister,

a business plan was developed and “Bussolo Atelier Gastronômico” was created.

This small food catering business was focused on supplying high quality pastry

delicacies to other companies (coffee shops and restaurants) and events. She

worked for 2 years on her own company, before moving to the Netherlands in

2009. In 2010, she was awarded with the “UM High Potential Scholarship” to

study the master “Health Food Innovation Management”, at Maastricht

University at campus Venlo. Her master thesis was entitled “Prebiotic effects of

cassava bagasse” and was performed in “The Netherlands Organization for

Applied Scientific Research” (TNO), supervised by Dr. Koen Venema and Dr.

Freddy Troost. In 2013 she was granted with a scholarship from the Brazilian

government, under the program “Science without borders”, to pursue a PhD in

the Netherlands. She performed her PhD at Maastricht University, under the

supervision of Prof. Dr. Koen Venema, Prof. Dr. Susana Saad and Prof. Dr. Lubbert

Dijkhuizen. The results of her research are described in this thesis.

_________________________________________________________________About the author

263

List of publications

Rossi, C. E., Bussolo C., Proença, R.P.C. ISO 14000 no Processo Produtivo de

Refeições: Implantação e Avaliação de um Sistema de Gestão Ambiental. Nutrição

em Pauta, v. 101, p. 21-25, 2010. – In Portuguese

Bussolo de Souza C., Roeselers G., Troost F., Jonkers D., Koenen M.E., Venema K.

Prebiotic effects of cassava bagasse in TNO’s in vitro model of the colon in lean

versus obese microbiota. Journal of Functional Foods. 2014;11(C):210–20.

Aguirre M., De Souza C.B., Venema K. The gut microbiota from lean and obese

subjects contribute differently to the fermentation of arabinogalactan and inulin.

PLoS One. 2016 Jul 1;11(7).

Bussolo de Souza C., Venema K. Microbiota intestinal em indivíduos eutróficos

e obesos. In: Faintuch J, editor. Microbioma, disbiose, probióticos e

bacteroterapia. 1st ed. São Paulo: Manole; 2017 (pp. 164-177). – In Portuguese

de Souza CB, Jonathan M, Saad SMI, Schols HA, Venema K. Characterization and

in vitro digestibility of by-products from Brazilian food industry: cassava

bagasse, orange bagasse and passion fruit peel. Bioact Carbohydrates Diet Fibre.

2018; (16):90-99.

Larsen N., Bussolo de Souza C., Cahú T. B., Krych L., Wiese M., Kot W., Hansen K.

M., Blennow A., Venema K., Jespersen L. Potential of pectins to beneficially

modulate the gut microbiota depends on their structural properties. Submitted

Bussolo de Souza C, Jonathan M., Saad S.M.I., Schols H.A., Venema K. Degradation

of fibres from fruit by-products allows selective modulation of gut bacteria in an

in vitro model of the proximal colon. Submitted

Bussolo de Souza, C., Saad, S. M. I., Venema, K. Lean and obese microbiota:

differences in in vitro fermentation of by-products from Brazilian food industry.

In preparation


Recommended